Embed Size (px)
Citation preview
Ameren Missouri
2019-24 MEEIA Energy
Efficiency Plan
PUBLIC
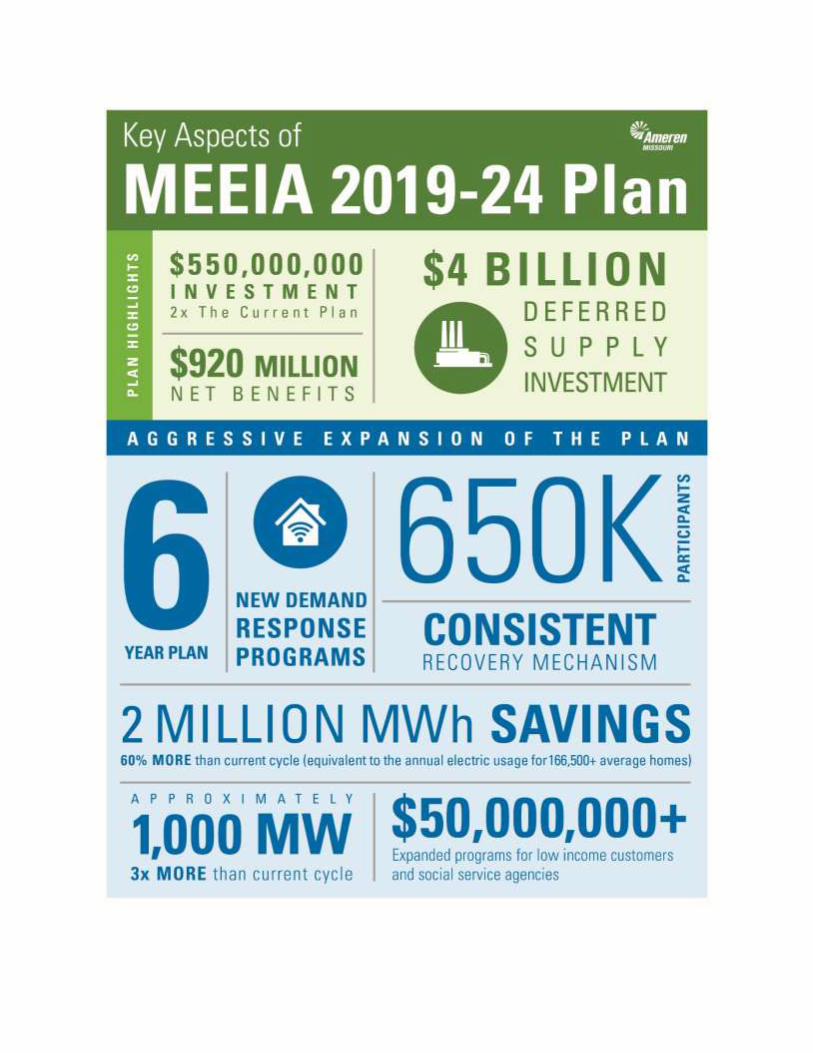
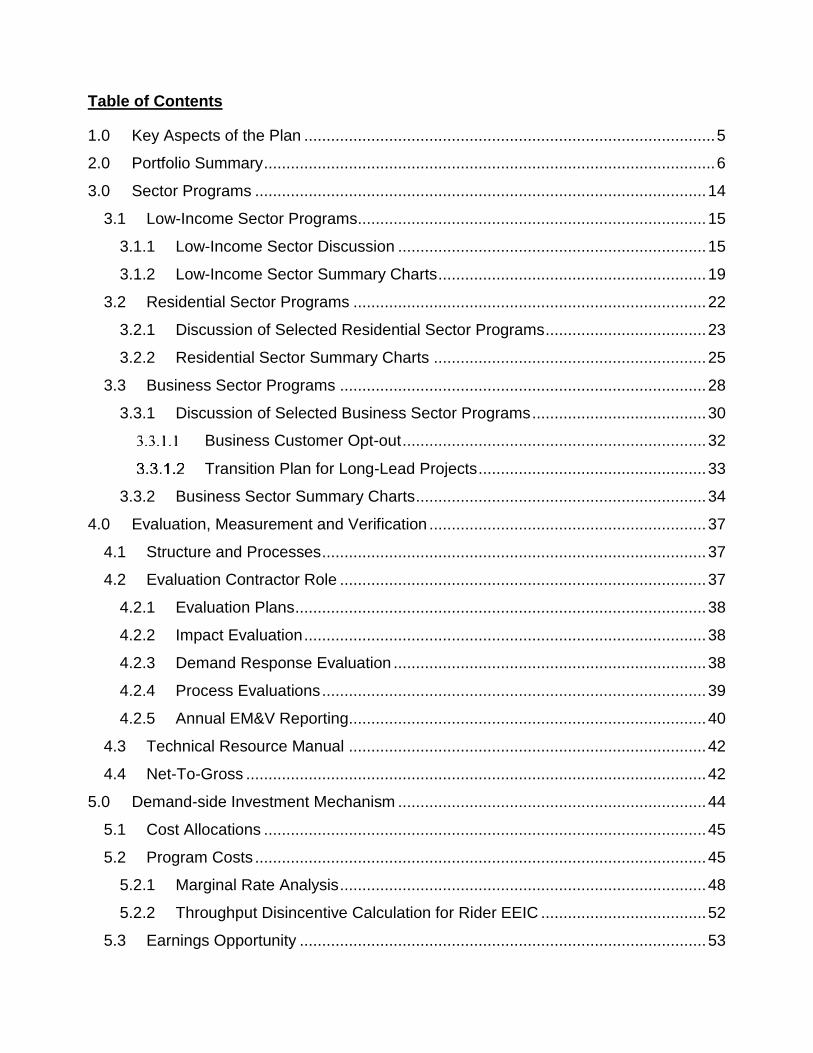
Table of Contents
1.0 Key Aspects of the Plan ............................................................................................ 5
2.0 Portfolio Summary ..................................................................................................... 6
3.0 Sector Programs ..................................................................................................... 14
3.1 Low-Income Sector Programs .............................................................................. 15
3.1.1 Low-Income Sector Discussion ..................................................................... 15
3.1.2 Low-Income Sector Summary Charts ............................................................ 19
3.2 Residential Sector Programs ............................................................................... 22
3.2.1 Discussion of Selected Residential Sector Programs .................................... 23
3.2.2 Residential Sector Summary Charts ............................................................. 25
3.3 Business Sector Programs .................................................................................. 28
3.3.1 Discussion of Selected Business Sector Programs ....................................... 30
Business Customer Opt-out .................................................................... 32
Transition Plan for Long-Lead Projects ................................................... 33
3.3.2 Business Sector Summary Charts ................................................................. 34
4.0 Evaluation, Measurement and Verification .............................................................. 37
4.1 Structure and Processes ...................................................................................... 37
4.2 Evaluation Contractor Role .................................................................................. 37
4.2.1 Evaluation Plans ............................................................................................ 38
4.2.2 Impact Evaluation .......................................................................................... 38
4.2.3 Demand Response Evaluation ...................................................................... 38
4.2.4 Process Evaluations ...................................................................................... 39
4.2.5 Annual EM&V Reporting................................................................................ 40
4.3 Technical Resource Manual ................................................................................ 42
4.4 Net-To-Gross ....................................................................................................... 42
5.0 Demand-side Investment Mechanism ..................................................................... 44
5.1 Cost Allocations ................................................................................................... 45
5.2 Program Costs ..................................................................................................... 45
5.2.1 Marginal Rate Analysis .................................................................................. 48
5.2.2 Throughput Disincentive Calculation for Rider EEIC ..................................... 52
5.3 Earnings Opportunity ........................................................................................... 53
5.3.1 Earnings Opportunity Payouts ....................................................................... 53
5.3.2 Forgone Earnings Analysis ............................................................................ 59
Forgone Renewable Generation Earnings Opportunity .......................... 60
Forgone Combined Cycle Earnings Opportunity ..................................... 61
Forgone Transmission and Distribution Earnings Opportunity ................ 64
5.3.3 Earnings Opportunity Benchmarking ............................................................. 64
5.4 Impact on Customers ........................................................................................... 65
5.5 Impact on the Company ....................................................................................... 68
5.5.1 Financial Impact ............................................................................................ 68
5.5.2 Business Risk Impact .................................................................................... 70
5.6 IRP Check-In Process .......................................................................................... 70
6.0 Appendices ............................................................................................................. 75
6.1 Appendix A – Portfolio and Programs Summary .................................................. 75
6.2 Appendix B – Programs Templates ..................................................................... 75
6.3 Appendix C – Avoided Costs ............................................................................... 75
6.4 Appendix D – Incentive Ranges ........................................................................... 75
6.5 Appendix E – Sample Evaluation Plans ............................................................... 75
6.6 Appendix F – Deemed Savings Table .................................................................. 75
6.7 Appendix G – TRM: Overview and User Guide ................................................... 75
6.8 Appendix H – TRM: Business Measures ............................................................. 75
6.9 Appendix I – TRM: Residential Measures ............................................................ 75
6.10 Appendix J – Exemplar Tariffs .......................................................................... 75
6.11 Appendix K – Customer DSIM Explanation ...................................................... 75
6.12 Appendix L – Customer Bill Examples .............................................................. 75
6.13 Appendix M – MEEIA 2019-24 Accounting ...................................................... 75
6.14 Appendix N – Earnings Opportunity Calculator ................................................ 75
Ameren Missouri MEEIA 2019-24 Plan
Page 5
1.0 Key Aspects of the Plan
Ameren Missouri's Missouri Energy Efficiency Investment Act ("MEEIA") 2019-24 plan
(the "Plan") is designed to implement the results of the Company's 2017 Integrated
Resource Planning ("IRP") analyses as well as build on the lessons learned from previous
MEEIA experience. The four key elements of the Plan are summarized below and are
discussed in more detail throughout this report.
1) 6-Year Term – The Company is seeking approval of a portfolio of demand-side
programs and a Demand-Side Investment Mechanism ("DSIM") to cover program
launch starting March 1, 2019, through December 31, 2024.1 The 6-year term is
important to enable the Company to achieve deeper energy savings made possible
by longer-term relationships with customers. In addition, with the next generation
capacity need further in the future than was expected when the Company's last
MEEIA filing was made, a longer implementation period as compared to the
Company's first two MEEIA program cycles allows the Company to more
effectively defer future long-term supply-side and delivery resource needs.
2) Aggressive Expansion of the Portfolio – The Plan reflects a significant increase in
the Company's commitment to demand-side resources. As compared to MEEIA
2016-18, MEEIA 2019-24 has 1.8 times the budget, 1.6 times the energy savings,
and 3 times the peak demand savings. The portfolio includes 15 new programs
(including education initiatives), a significant increase in spending and market
reach for low-income customers, specific education initiatives, and a variety of
products and channels in which customers can participate. This aggressive
expansion was already reflected in the Company's 2017 IRP (File No. EO-2018-
0038) based on the latest Market Potential Study, but indicative market pricing has
allowed the Company to reduce the program budgets by 40% as compared to the
costs assumed in the IRP.
3) New Demand Response Programs – The Plan includes two new demand response
programs: one for residential customers and one for business customers. The
residential program will use smart thermostats to reduce peak demand and will
enroll over 140,000 customers by the end of 2024. The residential demand
response program will use a program administrator while the business demand
response program will retain an aggregator. The aggregator will recruit and pay
incentives to business customers, but Ameren Missouri will bid the aggregated
amounts into the Midcontenent Independent System Operator, Inc. ("MISO")
market. The business demand response program represents an execution of the
discussions on this topic from the Commission's Distributed Energy Resources
Workshops (File No. EW-2017-0245).
1 Having an implementation period that covers 70 months will allow the Company to implement a 10-month program year in 2019, followed by five 12-month program years afterward, which will align program years with calendar years.
Ameren Missouri MEEIA 2019-24 Plan
Page 6
4) Continuation of DSIM – MEEIA 2016-18 reflected an evolution in the DSIM away
from Net Shared Benefits, and those changes were ultimately reflected in the
Commission's MEEIA rules. The Plan builds on that DSIM with few changes. The
MEEIA 2019-24 DSIM continues the Company's Energy Efficiency Investment
Charge Rider ("Rider EEIC"). Rider EEIC will continue to reflect the three
components - program costs, the throughput disincentive, and an earnings
opportunity - and will operate in similar fashion to how it operates for the MEEIA
2016-18 plan. The earnings opportunity performance metrics have been updated
to reflect new market conditions and the new portfolio make-up.
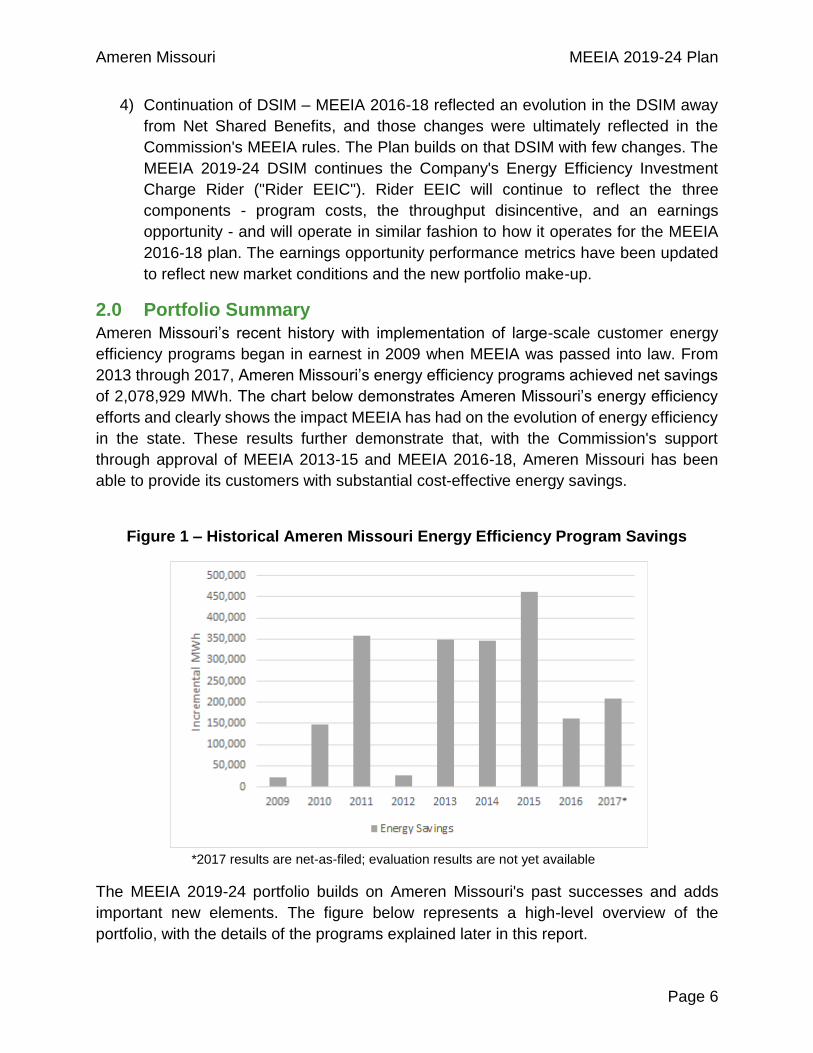
2.0 Portfolio Summary
Ameren Missouri’s recent history with implementation of large-scale customer energy
efficiency programs began in earnest in 2009 when MEEIA was passed into law. From
2013 through 2017, Ameren Missouri’s energy efficiency programs achieved net savings
of 2,078,929 MWh. The chart below demonstrates Ameren Missouri’s energy efficiency
efforts and clearly shows the impact MEEIA has had on the evolution of energy efficiency
in the state. These results further demonstrate that, with the Commission's support
through approval of MEEIA 2013-15 and MEEIA 2016-18, Ameren Missouri has been
able to provide its customers with substantial cost-effective energy savings.
Figure 1 – Historical Ameren Missouri Energy Efficiency Program Savings
*2017 results are net-as-filed; evaluation results are not yet available
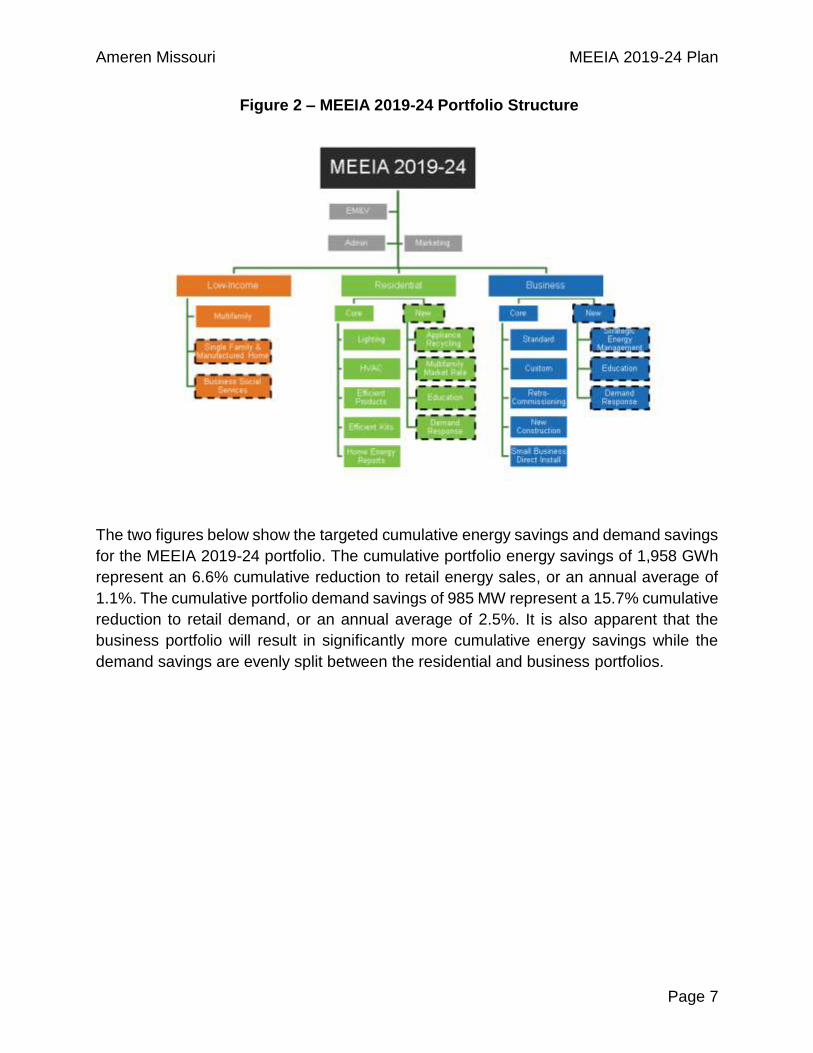
The MEEIA 2019-24 portfolio builds on Ameren Missouri's past successes and adds
important new elements. The figure below represents a high-level overview of the
portfolio, with the details of the programs explained later in this report.
Ameren Missouri MEEIA 2019-24 Plan
Page 7
Figure 2 – MEEIA 2019-24 Portfolio Structure
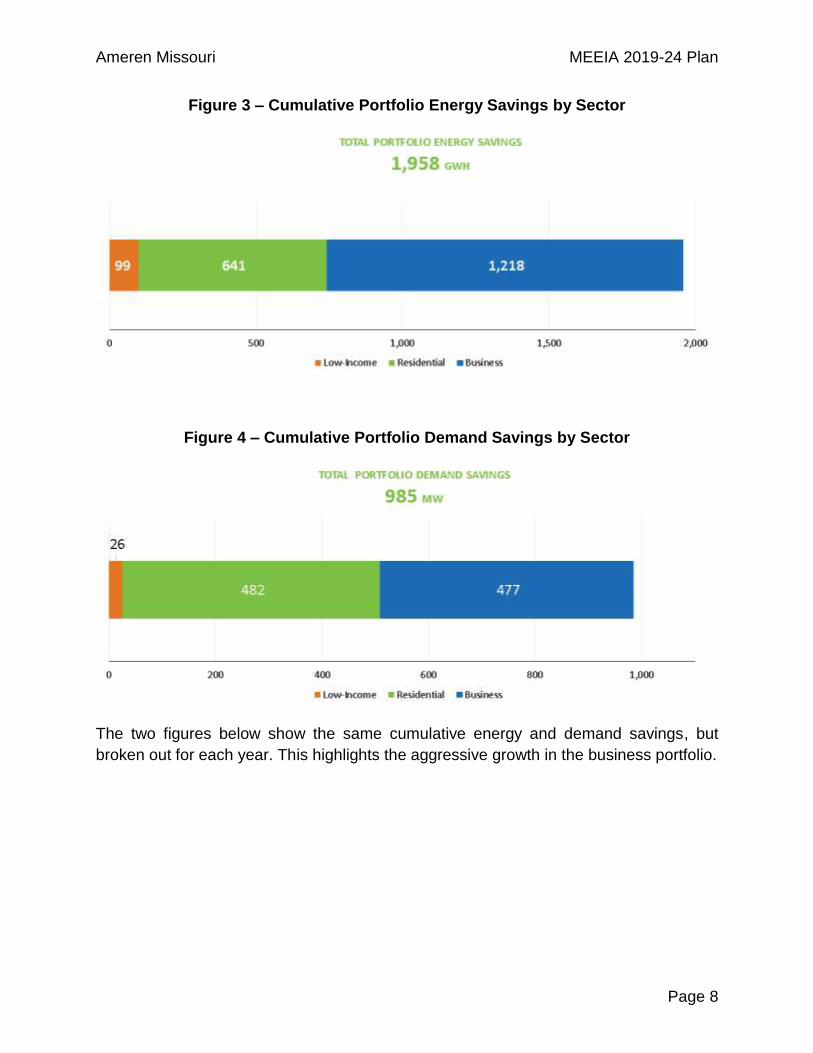
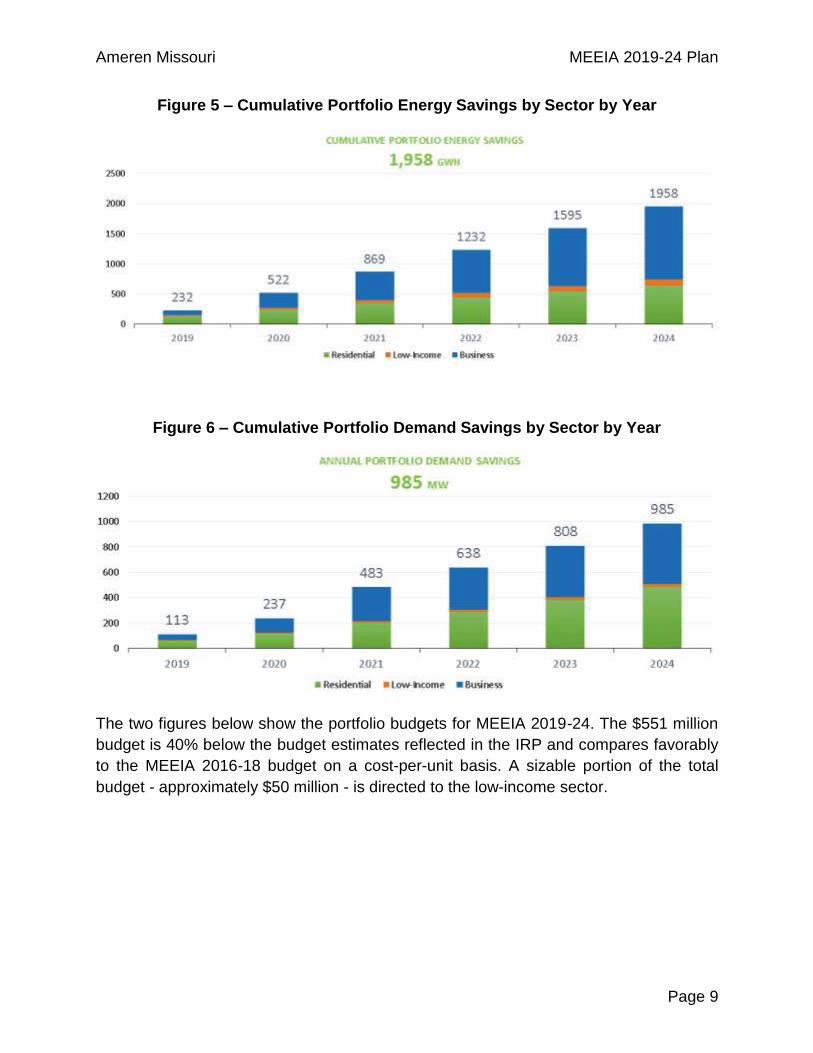
The two figures below show the targeted cumulative energy savings and demand savings
for the MEEIA 2019-24 portfolio. The cumulative portfolio energy savings of 1,958 GWh
represent an 6.6% cumulative reduction to retail energy sales, or an annual average of
1.1%. The cumulative portfolio demand savings of 985 MW represent a 15.7% cumulative
reduction to retail demand, or an annual average of 2.5%. It is also apparent that the
business portfolio will result in significantly more cumulative energy savings while the
demand savings are evenly split between the residential and business portfolios.
Ameren Missouri MEEIA 2019-24 Plan
Page 8
Figure 3 – Cumulative Portfolio Energy Savings by Sector
Figure 4 – Cumulative Portfolio Demand Savings by Sector
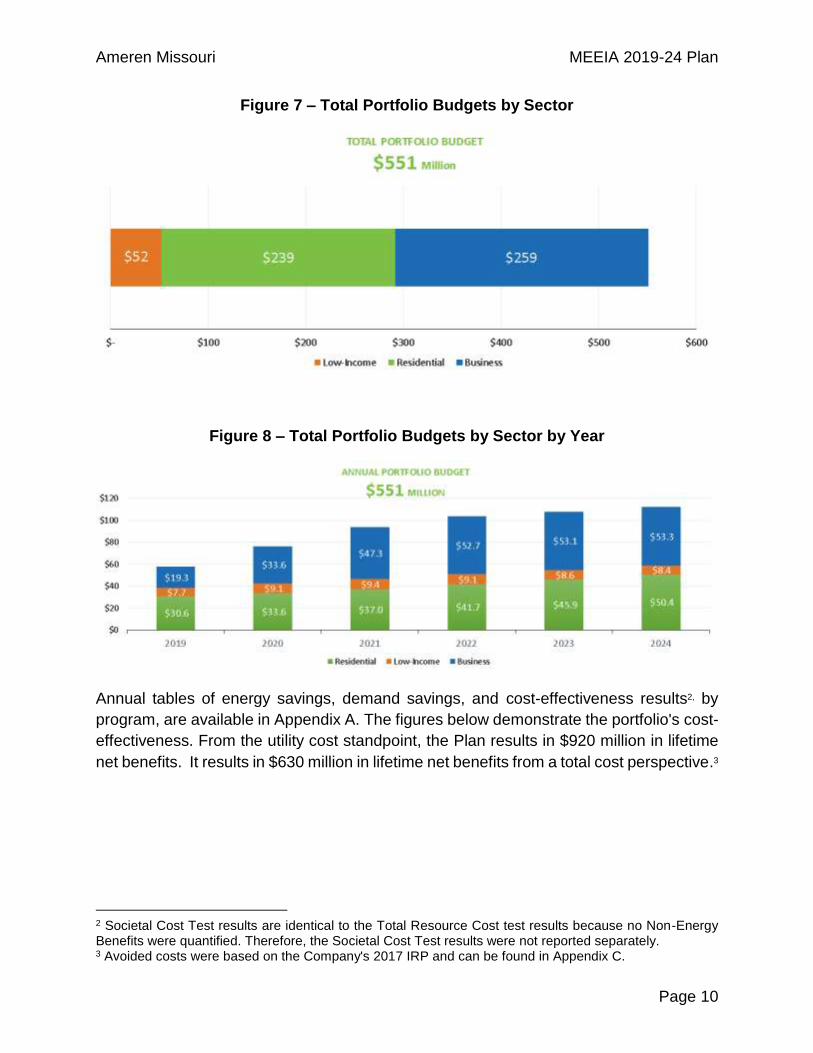
The two figures below show the same cumulative energy and demand savings, but
broken out for each year. This highlights the aggressive growth in the business portfolio.
Ameren Missouri MEEIA 2019-24 Plan
Page 9
Figure 5 – Cumulative Portfolio Energy Savings by Sector by Year
Figure 6 – Cumulative Portfolio Demand Savings by Sector by Year
The two figures below show the portfolio budgets for MEEIA 2019-24. The $551 million
budget is 40% below the budget estimates reflected in the IRP and compares favorably
to the MEEIA 2016-18 budget on a cost-per-unit basis. A sizable portion of the total
budget - approximately $50 million - is directed to the low-income sector.
Ameren Missouri MEEIA 2019-24 Plan
Page 10
Figure 7 – Total Portfolio Budgets by Sector
Figure 8 – Total Portfolio Budgets by Sector by Year
Annual tables of energy savings, demand savings, and cost-effectiveness results2, by
program, are available in Appendix A. The figures below demonstrate the portfolio's cost-
effectiveness. From the utility cost standpoint, the Plan results in $920 million in lifetime
net benefits. It results in $630 million in lifetime net benefits from a total cost perspective.3
2 Societal Cost Test results are identical to the Total Resource Cost test results because no Non-Energy Benefits were quantified. Therefore, the Societal Cost Test results were not reported separately. 3 Avoided costs were based on the Company's 2017 IRP and can be found in Appendix C.
Ameren Missouri MEEIA 2019-24 Plan
Page 11
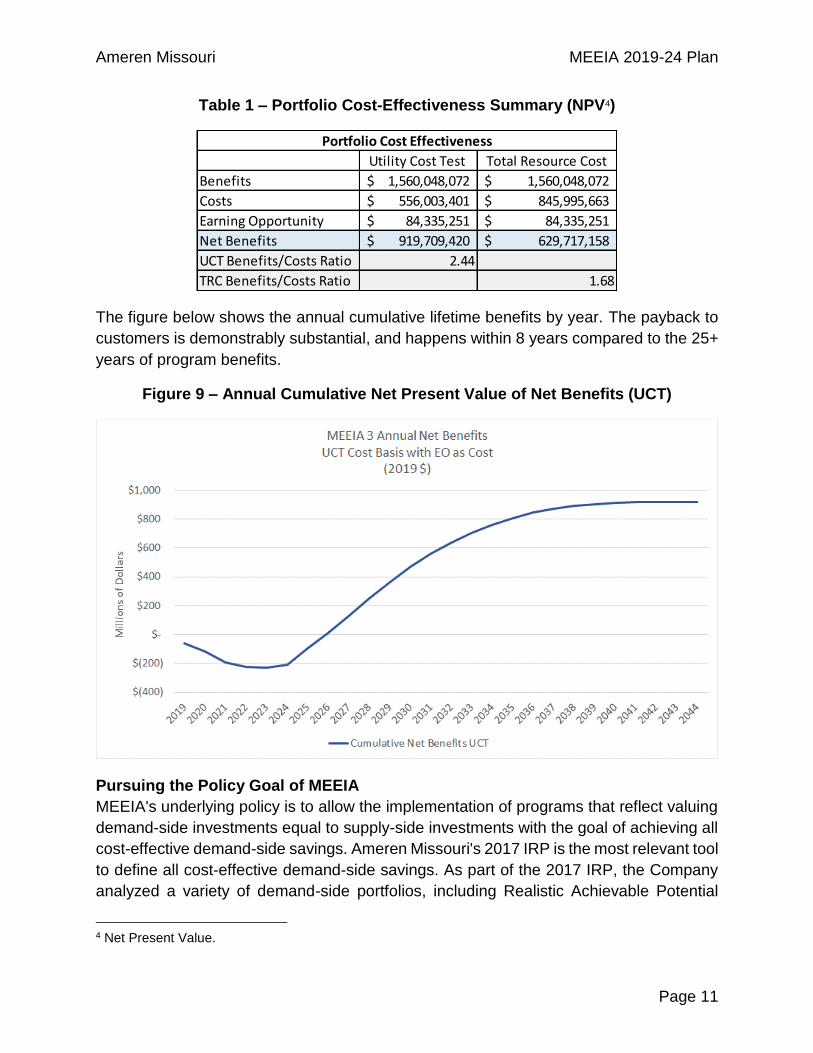
Table 1 – Portfolio Cost-Effectiveness Summary (NPV4)
The figure below shows the annual cumulative lifetime benefits by year. The payback to
customers is demonstrably substantial, and happens within 8 years compared to the 25+
years of program benefits.
Figure 9 – Annual Cumulative Net Present Value of Net Benefits (UCT)
Pursuing the Policy Goal of MEEIA
MEEIA's underlying policy is to allow the implementation of programs that reflect valuing
demand-side investments equal to supply-side investments with the goal of achieving all
cost-effective demand-side savings. Ameren Missouri's 2017 IRP is the most relevant tool
to define all cost-effective demand-side savings. As part of the 2017 IRP, the Company
analyzed a variety of demand-side portfolios, including Realistic Achievable Potential
4 Net Present Value.
Utility Cost Test Total Resource Cost
Benefits 1,560,048,072$ 1,560,048,072$
Costs 556,003,401$ 845,995,663$
Earning Opportunity 84,335,251$ 84,335,251$
Net Benefits 919,709,420$ 629,717,158$
UCT Benefits/Costs Ratio 2.44
TRC Benefits/Costs Ratio 1.68
Portfolio Cost Effectiveness
Ameren Missouri MEEIA 2019-24 Plan
Page 12
("RAP"), Maximum Achievable Potential ("MAP"),5 and a Mid-Case Portfolio, as well as
portfolios where energy efficiency and demand response were offered together and also
separated. In addition to analyzing a variety of demand-side portfolios, the Company's
2017 IRP analyzed those demand-side portfolios against competing supply-side
alternatives and weighed the various resource plans against its decision-making criteria.
The Company's Preferred Resource Plan calls for the adoption of the RAP, and the goals
in MEEIA 2019-24 are entirely consistent with the Preferred Resource Plan. The table
below demonstrates not only that the energy and demand savings goals are consistent
with the 2017 IRP, but that pricing from the market indicates the savings can be achieved
with 40% less cost than assumed in the IRP.
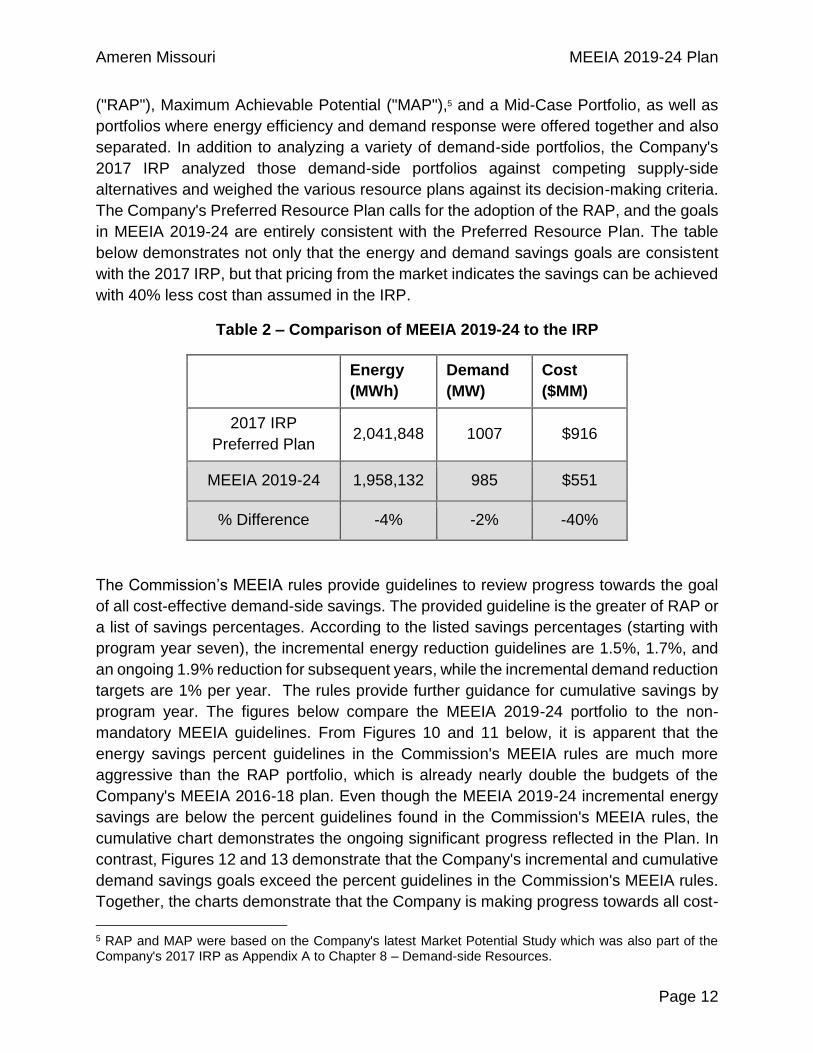
Table 2 – Comparison of MEEIA 2019-24 to the IRP
Energy
(MWh)
Demand
(MW)
Cost
($MM)
2017 IRP
Preferred Plan 2,041,848 1007 $916
MEEIA 2019-24 1,958,132 985 $551
% Difference -4% -2% -40%
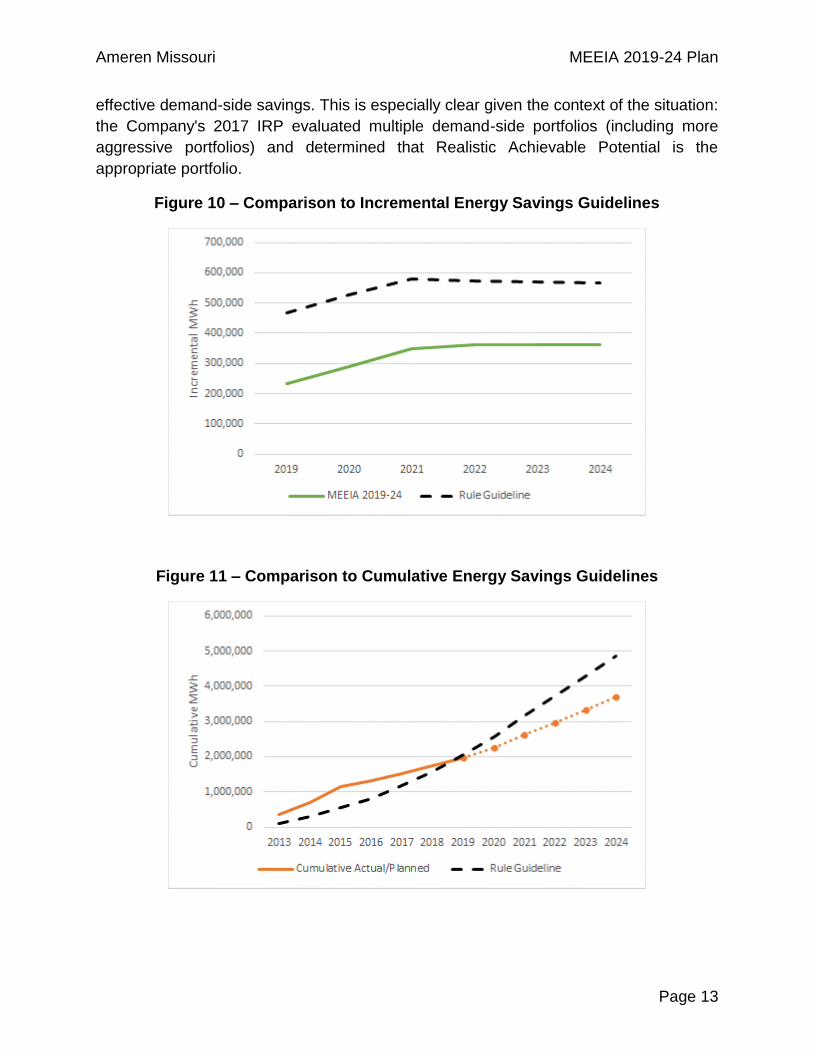
The Commission’s MEEIA rules provide guidelines to review progress towards the goal
of all cost-effective demand-side savings. The provided guideline is the greater of RAP or
a list of savings percentages. According to the listed savings percentages (starting with
program year seven), the incremental energy reduction guidelines are 1.5%, 1.7%, and
an ongoing 1.9% reduction for subsequent years, while the incremental demand reduction
targets are 1% per year. The rules provide further guidance for cumulative savings by
program year. The figures below compare the MEEIA 2019-24 portfolio to the non-
mandatory MEEIA guidelines. From Figures 10 and 11 below, it is apparent that the
energy savings percent guidelines in the Commission's MEEIA rules are much more
aggressive than the RAP portfolio, which is already nearly double the budgets of the
Company's MEEIA 2016-18 plan. Even though the MEEIA 2019-24 incremental energy
savings are below the percent guidelines found in the Commission's MEEIA rules, the
cumulative chart demonstrates the ongoing significant progress reflected in the Plan. In
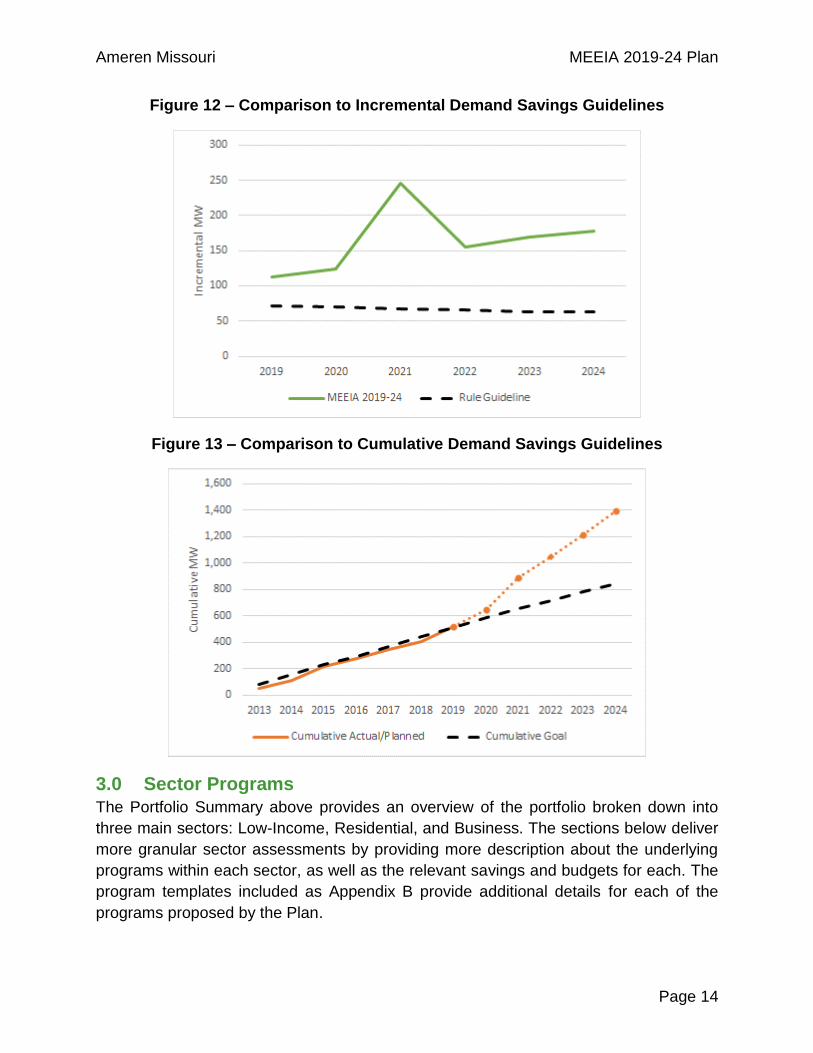
contrast, Figures 12 and 13 demonstrate that the Company's incremental and cumulative
demand savings goals exceed the percent guidelines in the Commission's MEEIA rules.
Together, the charts demonstrate that the Company is making progress towards all cost-
5 RAP and MAP were based on the Company's latest Market Potential Study which was also part of the Company's 2017 IRP as Appendix A to Chapter 8 – Demand-side Resources.
Ameren Missouri MEEIA 2019-24 Plan
Page 13
effective demand-side savings. This is especially clear given the context of the situation:
the Company's 2017 IRP evaluated multiple demand-side portfolios (including more
aggressive portfolios) and determined that Realistic Achievable Potential is the
appropriate portfolio.
Figure 10 – Comparison to Incremental Energy Savings Guidelines
Figure 11 – Comparison to Cumulative Energy Savings Guidelines
Ameren Missouri MEEIA 2019-24 Plan
Page 14
Figure 12 – Comparison to Incremental Demand Savings Guidelines
Figure 13 – Comparison to Cumulative Demand Savings Guidelines
3.0 Sector Programs
The Portfolio Summary above provides an overview of the portfolio broken down into
three main sectors: Low-Income, Residential, and Business. The sections below deliver
more granular sector assessments by providing more description about the underlying
programs within each sector, as well as the relevant savings and budgets for each. The
program templates included as Appendix B provide additional details for each of the
programs proposed by the Plan.
Ameren Missouri MEEIA 2019-24 Plan
Page 15
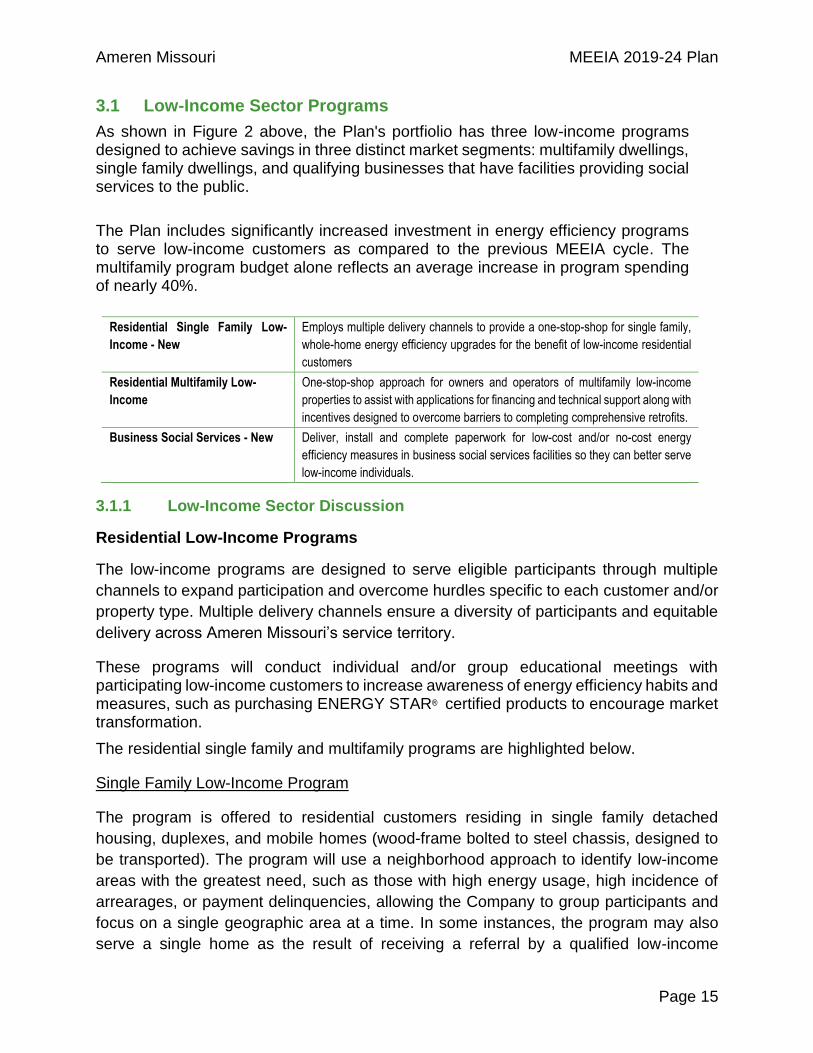
3.1 Low-Income Sector Programs
As shown in Figure 2 above, the Plan's portfiolio has three low-income programs designed to achieve savings in three distinct market segments: multifamily dwellings, single family dwellings, and qualifying businesses that have facilities providing social services to the public.
The Plan includes significantly increased investment in energy efficiency programs to serve low-income customers as compared to the previous MEEIA cycle. The multifamily program budget alone reflects an average increase in program spending of nearly 40%.
Residential Single Family Low-
Income - New
Employs multiple delivery channels to provide a one-stop-shop for single family,
whole-home energy efficiency upgrades for the benefit of low-income residential
customers
Residential Multifamily Low-
Income
One-stop-shop approach for owners and operators of multifamily low-income
properties to assist with applications for financing and technical support along with
incentives designed to overcome barriers to completing comprehensive retrofits.
Business Social Services - New Deliver, install and complete paperwork for low-cost and/or no-cost energy
efficiency measures in business social services facilities so they can better serve
low-income individuals.
3.1.1 Low-Income Sector Discussion
Residential Low-Income Programs
The low-income programs are designed to serve eligible participants through multiple
channels to expand participation and overcome hurdles specific to each customer and/or
property type. Multiple delivery channels ensure a diversity of participants and equitable
delivery across Ameren Missouri’s service territory.
These programs will conduct individual and/or group educational meetings with participating low-income customers to increase awareness of energy efficiency habits and measures, such as purchasing ENERGY STAR® certified products to encourage market transformation.
The residential single family and multifamily programs are highlighted below.
Single Family Low-Income Program
The program is offered to residential customers residing in single family detached
housing, duplexes, and mobile homes (wood-frame bolted to steel chassis, designed to
be transported). The program will use a neighborhood approach to identify low-income
areas with the greatest need, such as those with high energy usage, high incidence of
arrearages, or payment delinquencies, allowing the Company to group participants and
focus on a single geographic area at a time. In some instances, the program may also
serve a single home as the result of receiving a referral by a qualified low-income
Ameren Missouri MEEIA 2019-24 Plan
Page 16
assistance agency. The program will provide energy assessments and/or diagnostic
testing and install a comprehensive package of whole house energy saving measures at
no or low cost to customers.
The program will seek to collaborate with familiar community-based organizations and
leaders -- such as homeowner associations, churches, senior centers, schools, other non-
profits, and employers or local community leaders -- to obtain their endorsements
promoting the program and their assistance with opportunities to stage cooperative
recruitment drives and/or education events. This approach of utilizing trusted, familiar
organizations generates enthusiasm and momentum behind the effort.
As a subcomponent of the Single Family Low-Income Program, the program administrator
may make free energy saving measure packages or incentives directly available to
organizations that can provide labor for qualified installations of measures at no charge
to low-income residential end users (i.e., provide Low-Income Efficiency Housing Grants).
LEDs will also be available for distribution by qualifying organizations, such as food banks.
In connection with these grants, the program will provide technical information, education,
and support to the receiving organizations so they can understand and comply with the
program requirements. Approved Low-Income Efficiency Housing Grants must:
a. Be implemented by a not-for-profit organization, governmental body, entity representing residential customers served by the Company, or through a Company-sponsored event;
b. Be limited in distribution to residential customers residing in the Ameren Missouri service territory;
c. Be used for a project that provides access and sufficient performance data to allow the project's evaluation, measurement, and verification ("EM&V"); and
d. Include consumer education elements regarding the installed equipment.
Multifamily Low-Income Program
Beginning in 2015, Ameren Missouri revised its Multifamily Low-Income Program to
administer the residential and business components using a single implementation
contractor. To assist in overcoming many of the barriers unique to multifamily properties,
the program established a one-stop-shop offering a concierge approach to assist property
owners through the process of applying for and securing energy efficiency upgrades using
a single application. The program also continued to offer free direct installation of dwelling
unit measures and increased common area/whole building incentives by 25% above
those offered to other business customers. While the increased incentives were a
program enhancement, tying them to business program incentives proved problematic.
For example, lowering business incentives also lowered multifamily low-income
incentives, thus reducing the ability to encourage participation. Having learned from this,

Ameren Missouri MEEIA 2019-24 Plan
Page 17
Ameren Missouri will establish separate low-income multifamily program incentives in the
Plan.
Ameren Missouri will continue the one-stop-shop approach in MEEIA 2019-24 in order to
encourage property owners along in their energy efficiency journey and enable easy
engagement with the program. The goal is to help multifamily property managers
understand their buildings' energy usage amounts, continue to achieve immediate energy
savings through no-cost direct install measures, and move beyond initial measures to
investments in standard and/or custom measures for common areas, building shell, and
whole-building systems in order to benefit from deeper energy savings.
The multifamily implementation strategy includes the following:
Direct outreach and marketing to inform eligible property managers of the many benefits of improving their properties' energy efficiency.
Assignment of a dedicated contact to assist building managers throughout the process.
Offering Level I Energy Assessment to qualifying buildings at no cost to provide a report including:
o list of measures; o estimated energy savings; o estimated cost savings; o estimated cost for equipment and installation; o simple payback analysis; and o identify appropriate incentive package options to achieve whole-building
energy and demand savings.
Providing bid specifications and referrals for repair work, if required.
Identifying scope of work and securing qualified program partners to perform energy efficiency upgrades.
Assisting with retrofit scheduling and completion.
Verifying quality installation of selected measures.
Providing all eligible participants with past 12 months of energy usage and
technical assistance to begin benchmarking buildings using ENERGY STAR®
Portfolio Manager.
Assisting managers of participating multifamily properties in maintaining their
improved building efficiency and boost market transformation by providing
incentives to defray the cost to attend Building Operator Certification ("BOC")
Training.
Along with project incentives, the program will seek to encourage property owners to
achieve maximum savings possible by offering seamless access to financing and other
alternatives to reduce financial barriers to investing in energy efficiency upgrades. For
example, the Company will obtain a list of applicants with allocated low-income housing
tax credits that could be invested in energy efficiency and continue to work with the
Missouri Housing Development Commission to establish a link to new tax credit

Ameren Missouri MEEIA 2019-24 Plan
Page 18
applicants. If the Level I assessment indicates the need for higher capital expenditures,
the program will pay for up to 100% of an ASHRAE6 Level 2 audit for buildings over 4
stories high, not to exceed $10,000 per property for properties applying for tax credits
through MHDC. The Company will also facilitate access for its customers to other funding
that could be used for energy efficiency measures, such as grants (e.g., federal and state
weatherization funding for income-qualified properties), Federal Housing Administration
loan incentives, Fannie and Freddie’s green loan incentives and energy financing
mechanisms such as Property Assessed Clean Energy and energy performance
contracts.
In addition to the strategies noted above, Ameren Missouri will continue its successful
collaboration with gas utilities to co-deliver MEEIA programs, which reduces program
costs and provides a comprehensive energy efficiency solution for our customers. In the
event co-delivery is not possible, the program will ensure participants are aware of all
available utility incentives and will assist participants in claiming them.
In addition to maintaining records to assist in on-going business development
opportunities, data collected for this program will include measure information, financial
data, energy and demand savings, customer outreach and participation information. Data
will be tracked and available for EM&V. The following list is not all inclusive, but is an
example of tracked data points:
Number of buildings and units within each property;
Number of properties that received benchmarking assistance;
Number of audits performed;
Number of and type of measures installed;
Percent energy savings implemented versus identified energy savings opportunity; and
Incentives paid by property.
The Company will continue to provide quarterly updates to stakeholders and, following
receipt of the EM&V report, will provide an annual update to the Missouri Energy
Efficiency Advisory Collaborative ("MEEAC").
Eligibility Guidelines for All Residential Low-Income Programs
The goal of these eligibility guidelines is to reduce barriers to participation in the
Company’s residential low-income offerings by providing multiple pathways to establish
eligibility.
Approved participants will be required to meet one of the following income eligibility requirements:
6 American Society of Heating, Refrigerating and Air-Conditioning Engineers.
Ameren Missouri MEEIA 2019-24 Plan
Page 19
1. Reside in federal, state, or local subsidized housing and fall within the subsidized housing program's income guidelines.
2. Reside in non-subsidized housing with proof of income7 levels at or below 80% of area median income.
3. Fall within a census tract that indicates at least 85% of customers are at or below 80% of area median income.
With respect to the multifamily program, where a multifamily property does not meet one of the income eligibility criteria listed above but has a combination of qualifying tenants and non-qualifying tenants, at least 50% of the tenants must be eligible to qualify the entire property.
Business Social Services Program
The Business Social Services Program will promote the installation of energy efficient technologies by removing participation barriers. Non-profit businesses with qualifying facilities will be eligible for a streamlined program process with no-cost and low-cost project opportunities. Participation will save energy and allow social service businesses to better serve the low-income public. Such non-profit businesses with qualifying facilities will be able to take advantage of no-cost efficiency lighting upgrades and higher than standard incentives for deep dive savings opportunities, such as HVAC, for those facilities.
A non-profit business's qualifying facilities include those that receive small or large general electric service, and that are primarily used for low-income public social services such as food banks, food pantries, soup kitchens, homeless shelters, employment services, worker training, job banks, and childcare.
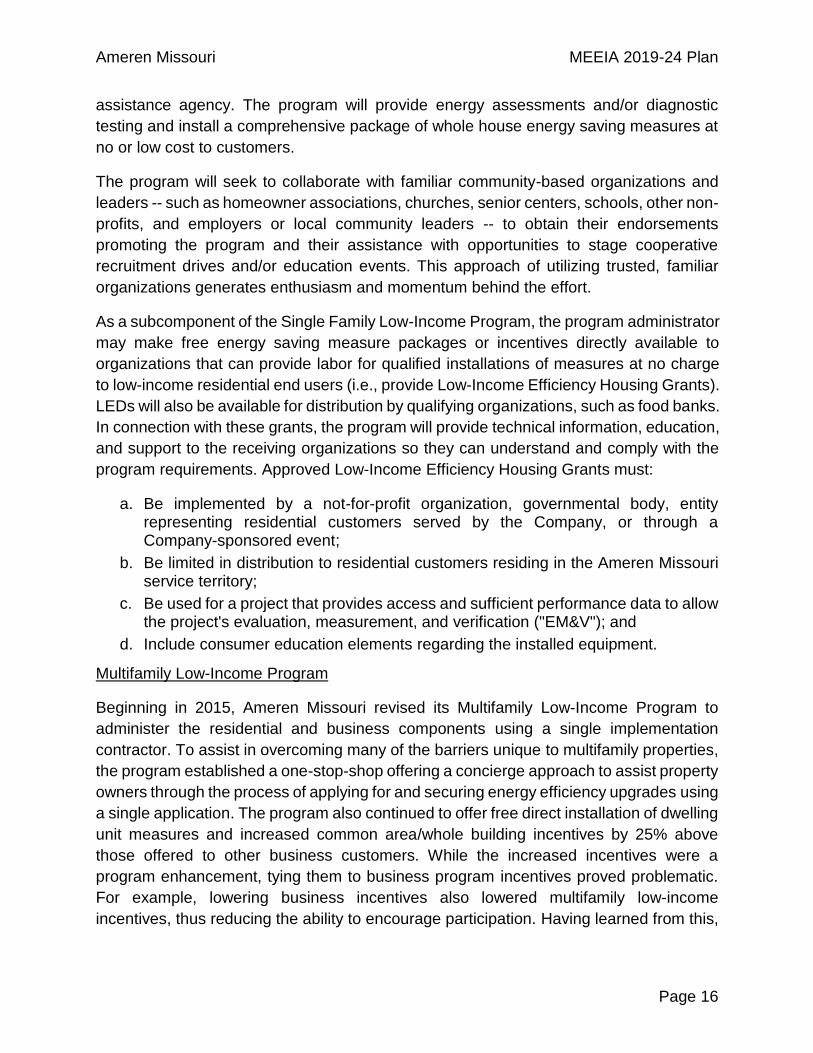
3.1.2 Low-Income Sector Summary Charts
The figure below shows that a large majority of the low-income savings are from the
Multifamily and Single Family programs.
Figure 14 – Cumulative Low-Income Energy Savings by Program
7 Proof of income can be accomplished in multiple ways, including but not limited to submission of rent rolls or documentation of being on the US Department of Energy ("DOE") Weatherization Assistance Program waitlist.
Ameren Missouri MEEIA 2019-24 Plan
Page 20
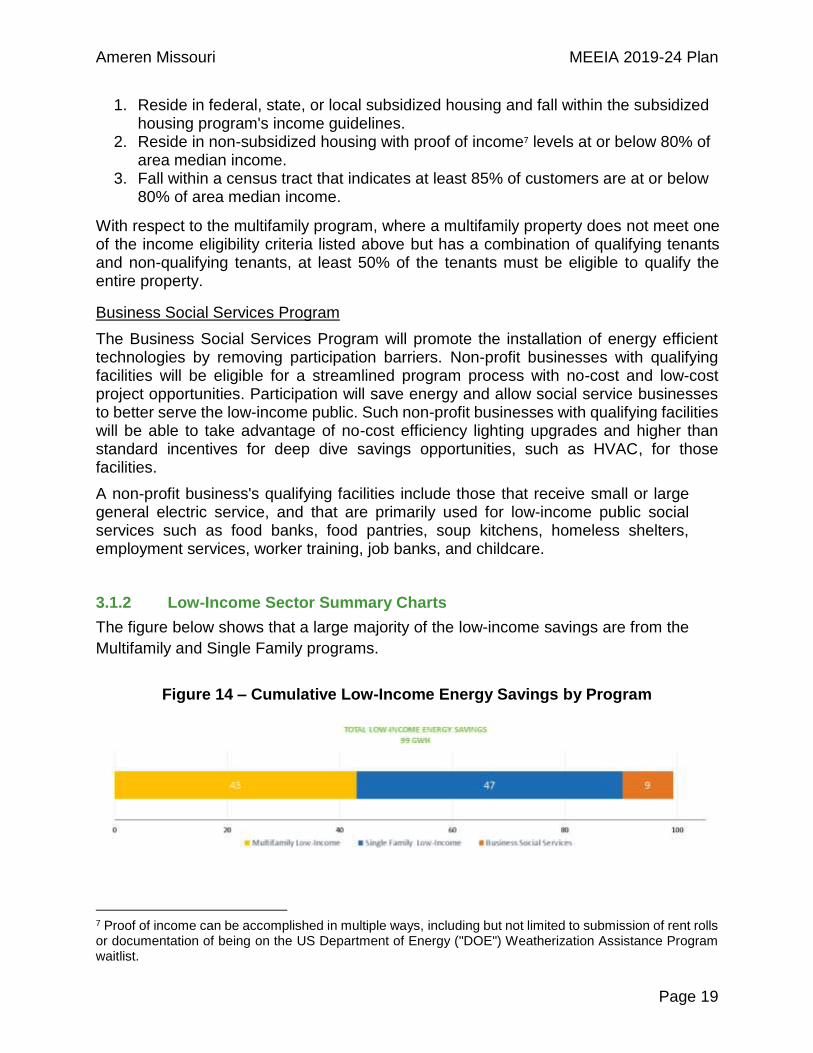
Figure 15 – Cumulative Low-Income Demand Savings by Program
Figure 16 – Cumulative Low-Income Energy Savings by Program by Year
Figure 17 – Cumulative Low-Income Demand Savings by Program by Year
The figures below show that a majority of the budgets are going to the multifamily and
single family low-income programs and the budgets are roughly split in an even manner
between the two programs.
Ameren Missouri MEEIA 2019-24 Plan
Page 21
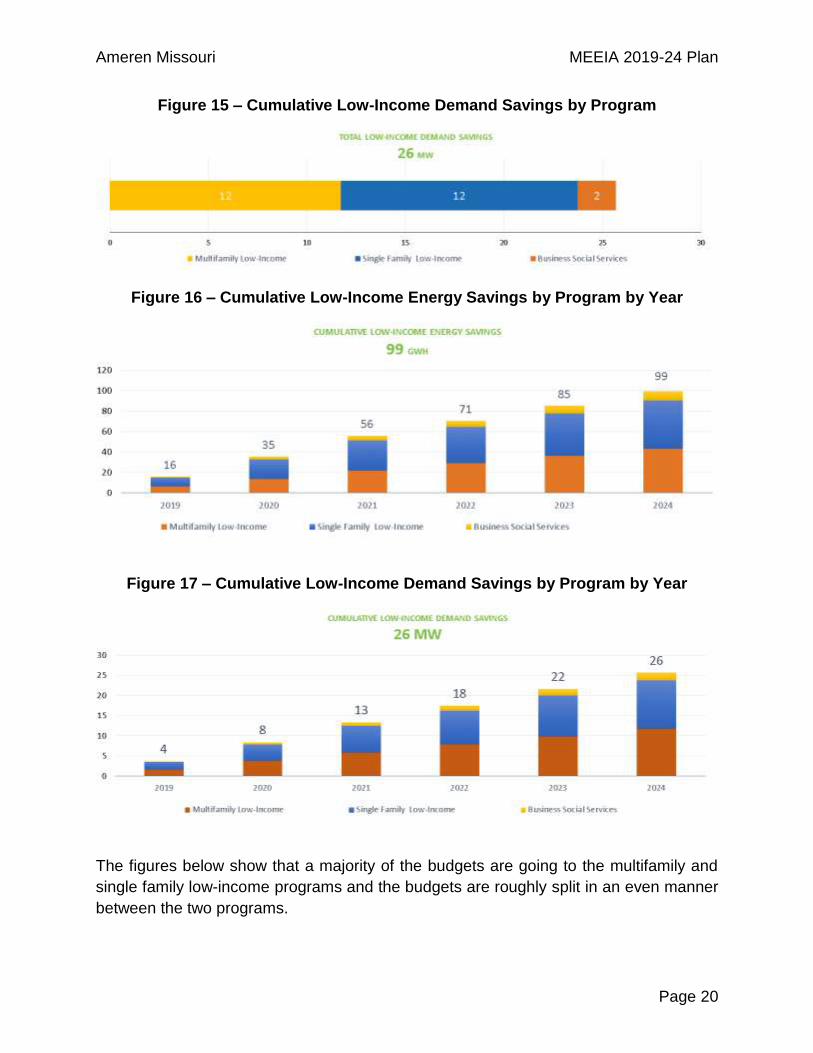
Figure 18 – Total Low-Income Budgets by Program
Figure 19 – Total Low-Income Budgets by Program by Year
Although MEEIA does not require low-income programs to pass cost-effectiveness
testing, the table below shows that the Low-Income programs proposed in the Plan result
in net benefits to all customers:
Table 3 – Low-Income Sector Cost-Effectiveness Summary (NPV)
Utility Cost Test Total Resource Cost
Benefits 58,910,558$ 58,910,558$
Costs 45,448,108$ 50,663,062$
Net Benefits 13,462,449$ 8,247,496$
UCT Benefits/Costs Ratio 1.30
TRC Benefits/Costs Ratio 1.16
Low-Income Cost Effectiveness
Ameren Missouri MEEIA 2019-24 Plan
Page 22
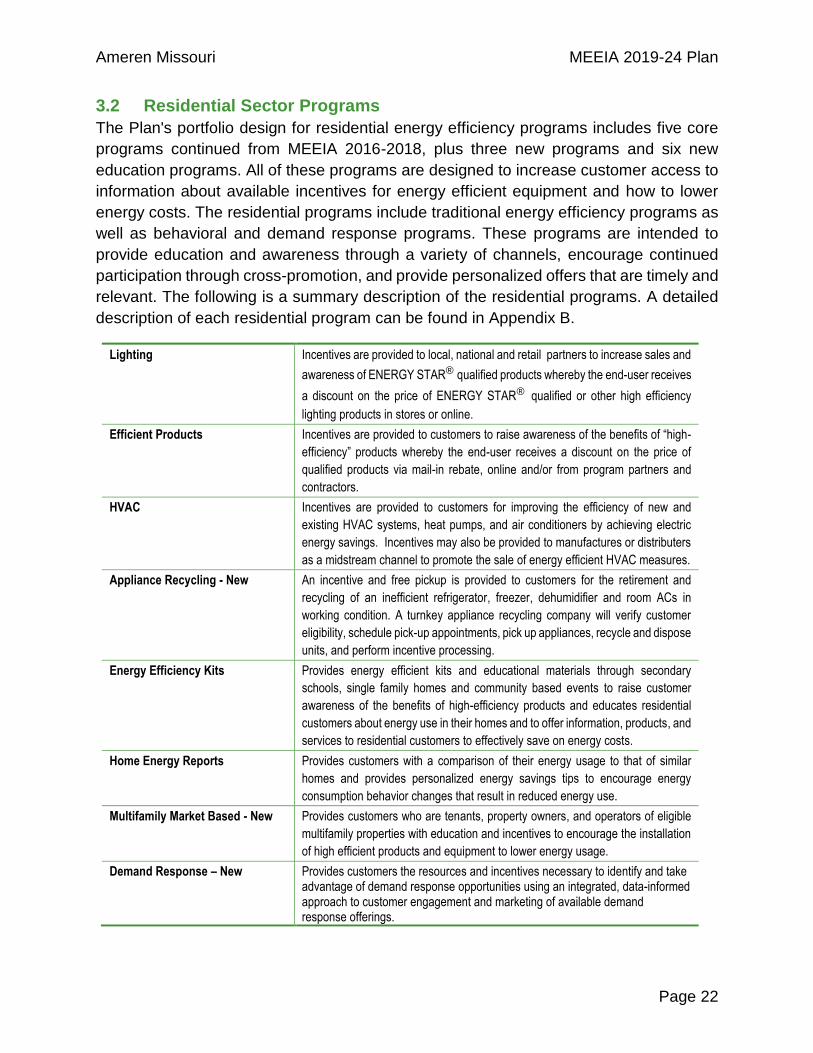
3.2 Residential Sector Programs
The Plan's portfolio design for residential energy efficiency programs includes five core
programs continued from MEEIA 2016-2018, plus three new programs and six new
education programs. All of these programs are designed to increase customer access to
information about available incentives for energy efficient equipment and how to lower
energy costs. The residential programs include traditional energy efficiency programs as
well as behavioral and demand response programs. These programs are intended to
provide education and awareness through a variety of channels, encourage continued
participation through cross-promotion, and provide personalized offers that are timely and
relevant. The following is a summary description of the residential programs. A detailed
description of each residential program can be found in Appendix B.
Lighting Incentives are provided to local, national and retail partners to increase sales and
awareness of ENERGY STAR® qualified products whereby the end-user receives
a discount on the price of ENERGY STAR® qualified or other high efficiency
lighting products in stores or online.
Efficient Products Incentives are provided to customers to raise awareness of the benefits of “high-
efficiency” products whereby the end-user receives a discount on the price of
qualified products via mail-in rebate, online and/or from program partners and
contractors.
HVAC Incentives are provided to customers for improving the efficiency of new and
existing HVAC systems, heat pumps, and air conditioners by achieving electric
energy savings. Incentives may also be provided to manufactures or distributers
as a midstream channel to promote the sale of energy efficient HVAC measures.
Appliance Recycling - New An incentive and free pickup is provided to customers for the retirement and
recycling of an inefficient refrigerator, freezer, dehumidifier and room ACs in
working condition. A turnkey appliance recycling company will verify customer
eligibility, schedule pick-up appointments, pick up appliances, recycle and dispose
units, and perform incentive processing.
Energy Efficiency Kits Provides energy efficient kits and educational materials through secondary
schools, single family homes and community based events to raise customer
awareness of the benefits of high-efficiency products and educates residential
customers about energy use in their homes and to offer information, products, and
services to residential customers to effectively save on energy costs.
Home Energy Reports Provides customers with a comparison of their energy usage to that of similar
homes and provides personalized energy savings tips to encourage energy
consumption behavior changes that result in reduced energy use.
Multifamily Market Based - New Provides customers who are tenants, property owners, and operators of eligible
multifamily properties with education and incentives to encourage the installation
of high efficient products and equipment to lower energy usage.
Demand Response – New Provides customers the resources and incentives necessary to identify and take advantage of demand response opportunities using an integrated, data-informed approach to customer engagement and marketing of available demand response offerings.
Ameren Missouri MEEIA 2019-24 Plan
Page 23
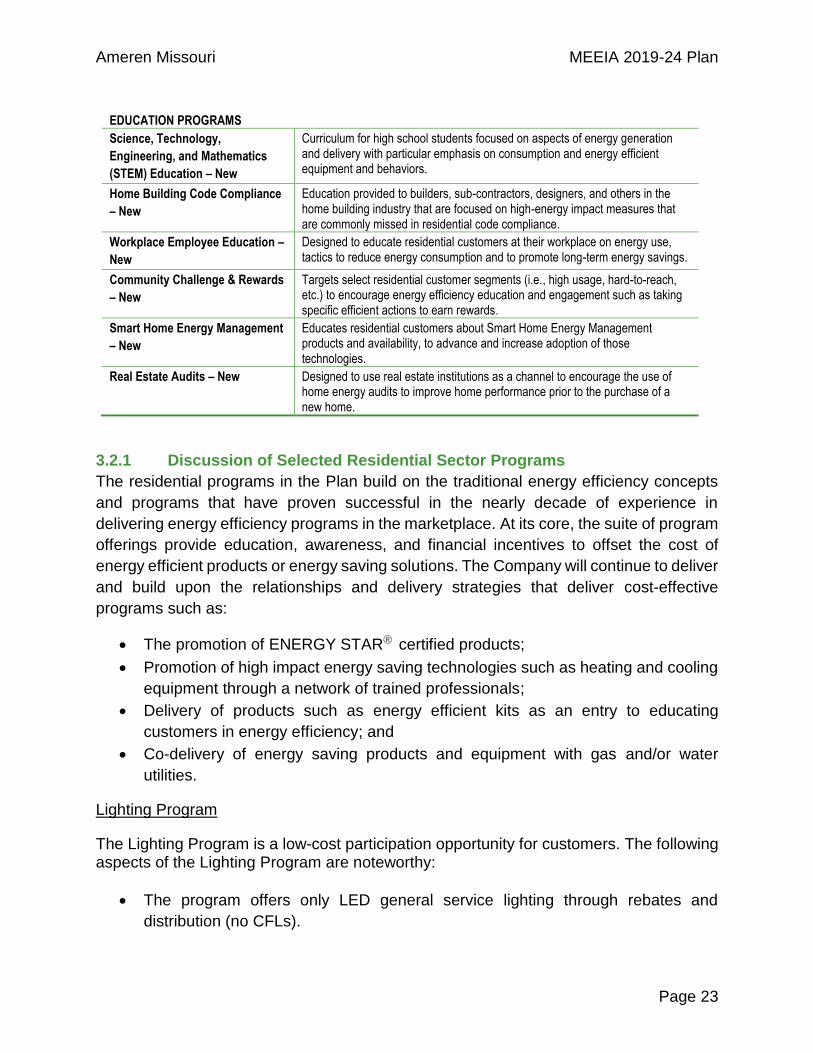
EDUCATION PROGRAMS
Science, Technology,
Engineering, and Mathematics
(STEM) Education – New
Curriculum for high school students focused on aspects of energy generation and delivery with particular emphasis on consumption and energy efficient equipment and behaviors.
Home Building Code Compliance
– New
Education provided to builders, sub-contractors, designers, and others in the home building industry that are focused on high-energy impact measures that are commonly missed in residential code compliance.
Workplace Employee Education –
New
Designed to educate residential customers at their workplace on energy use, tactics to reduce energy consumption and to promote long-term energy savings.
Community Challenge & Rewards
– New
Targets select residential customer segments (i.e., high usage, hard-to-reach, etc.) to encourage energy efficiency education and engagement such as taking specific efficient actions to earn rewards.
Smart Home Energy Management
– New
Educates residential customers about Smart Home Energy Management products and availability, to advance and increase adoption of those technologies.
Real Estate Audits – New Designed to use real estate institutions as a channel to encourage the use of home energy audits to improve home performance prior to the purchase of a new home.
3.2.1 Discussion of Selected Residential Sector Programs
The residential programs in the Plan build on the traditional energy efficiency concepts
and programs that have proven successful in the nearly decade of experience in
delivering energy efficiency programs in the marketplace. At its core, the suite of program
offerings provide education, awareness, and financial incentives to offset the cost of
energy efficient products or energy saving solutions. The Company will continue to deliver
and build upon the relationships and delivery strategies that deliver cost-effective
programs such as:
The promotion of ENERGY STAR® certified products;
Promotion of high impact energy saving technologies such as heating and cooling
equipment through a network of trained professionals;
Delivery of products such as energy efficient kits as an entry to educating
customers in energy efficiency; and
Co-delivery of energy saving products and equipment with gas and/or water
utilities.
Lighting Program
The Lighting Program is a low-cost participation opportunity for customers. The following aspects of the Lighting Program are noteworthy:
The program offers only LED general service lighting through rebates and
distribution (no CFLs).
Ameren Missouri MEEIA 2019-24 Plan
Page 24
The design for the Lighting Program assumes that most general service light bulbs
manufactured in 2020 will be 60-70% efficient.8 The baseline assumption for
standard light bulbs will be halogen technology through 2021 (assuming that there
will still be some halogen products available in 2021) switching to a CFL baseline
starting in 2022. Baselines and lighting product offerings will be assessed by
EM&V throughout the MEEIA 2019-24 implementation period.
For purposes of cost-effectiveness modeling and performance target-setting, an
annual hours-use degradation factor was applied based on the historic and current
observed EM&V assessments. Over time, efficient residential lighting measures
are expected to be installed within sockets with lower hours of use. This
degradation factor (6.94%) accounts for the anticipated decreasing daily hours-of-
use from 2.73 hours for 2019 to 2.2 hours for 2024.
Appliance Recycling Program
The Appliance Recycling Program is a popular program for customers and does not
require a purchase to participate. The program was offered in the MEEIA 2013-15 plan,
but was not included in the MEEIA 2016-18 plan. The 2016 market potential study
included an Appliance Recycling Program and the Company sees this program as a
potential gateway to participation in other programs. While the average savings per
appliance is expected to drop later in the implementation period because of the increased
efficiency inherent in the older units being recycled, the program is still cost effective
through 2024. Annual EM&V analysis will help effectively monitor the market for this
program and support future adjustments if necessary.
Home Energy Report
Since the Home Energy Report ("HER") was first introduced to customers in 2016, several
improvements have been identified and implemented. Such improvements include: the
addition of an eletronic HER; reconstituting the target segment to focus on high energy
users; and redesigned report elements.
The MEEIA 2019-24 program is designed to build off experience thus far and add
powerful new features. The HER will begin with a new design with the following typical
primary components: home comparison; savings tips; and a cross promotion/marketing
module. Three key enhancements will be added upon program launch: 1) end-use
disaggregation; 2) a new engaging online portal; and 3) increased frequency of delivery
over multiple channels. The end-use disaggregation provides customers with more
relevant and actionable tips. The new online portal will provide opportunities to set goals,
8 This is the efficiency standard generally necessary to be compliant with rules pertaining to Energy Independence and Securities Act.
Ameren Missouri MEEIA 2019-24 Plan
Page 25
participate in challenges, and update the home profile, among others. A paper copy will
be mailed to customers 6 times per year, with 12 email reports per year, and 12 energy
challenge emails per year.
Residential Demand Response Program
The Residential Demand Response ("DR") Program is new to the residential portfolio and
enables a new method for obtaining cost-effective peak demand and energy savings.
The Residential DR Program is designed to leverage smart thermostats to reduce
consumption during summer system peak conditions. The program is "comfort-centric,"
as the program will operate with a specific goal to stay within temperature guidelines for
each customer based on the customer's smart thermostat temperature setpoints. In
addition to the peak demand savings from a typical DR program, the Company's program
design includes energy savings from custom smart thermostat programming intended to
achieve energy savings throughout the year that are above and beyond the inherent
energy savings from smart thermostats.
The Residential DR Program will partner with device manufacturers to balance a variety
of channels to recruit program participants, such as integrating with the Ameren Missouri
online marketplace, leveraging the existing network of smart thermostat owners seeded
through the MEEIA 2016-18 programs, and planning for the option of installation
incentives in later years as the program reaches for deeper participation beyond early
adopters.
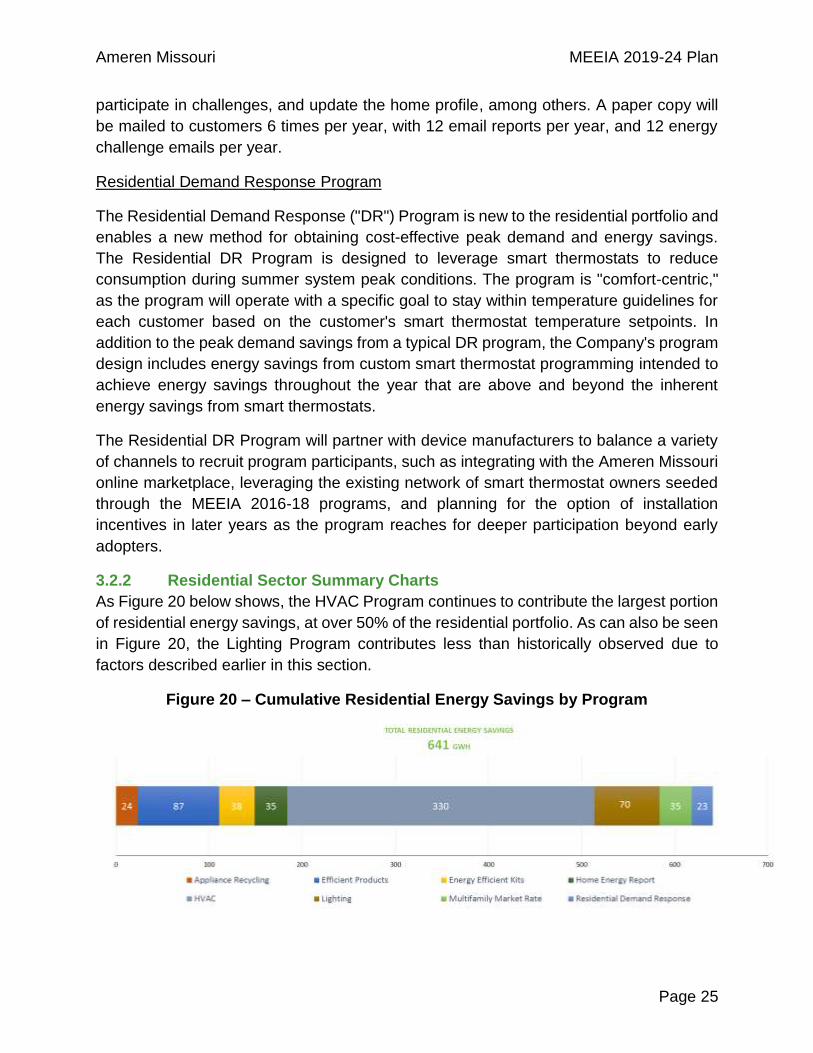
3.2.2 Residential Sector Summary Charts
As Figure 20 below shows, the HVAC Program continues to contribute the largest portion
of residential energy savings, at over 50% of the residential portfolio. As can also be seen
in Figure 20, the Lighting Program contributes less than historically observed due to
factors described earlier in this section.
Figure 20 – Cumulative Residential Energy Savings by Program

Ameren Missouri MEEIA 2019-24 Plan
Page 26
The figure below shows demand response is the largest contributor to demand savings
(at 48%), with HVAC contributing 37% and the remaining 15% from the other programs.
Figure 21 – Cumulative Residential Demand Savings by Program
The figure below illustrates that HER savings are only incremental for the first year. This
is because behavioral energy savings for HER are estimated to have a one-year life and
will occur annually as HERs are distributed throughout the implementation period. Also
reflected is a decline in annual energy savings from the lighting program.
Figure 22 – Incremental Residential Energy Savings by Program by Year
The Residential DR Program is designed to provide significant demand savings, but starts
off relatively slow in order to provide learning about the development and operation of a
residential demand response program and with less expense over the implementation
period.
Ameren Missouri MEEIA 2019-24 Plan
Page 27
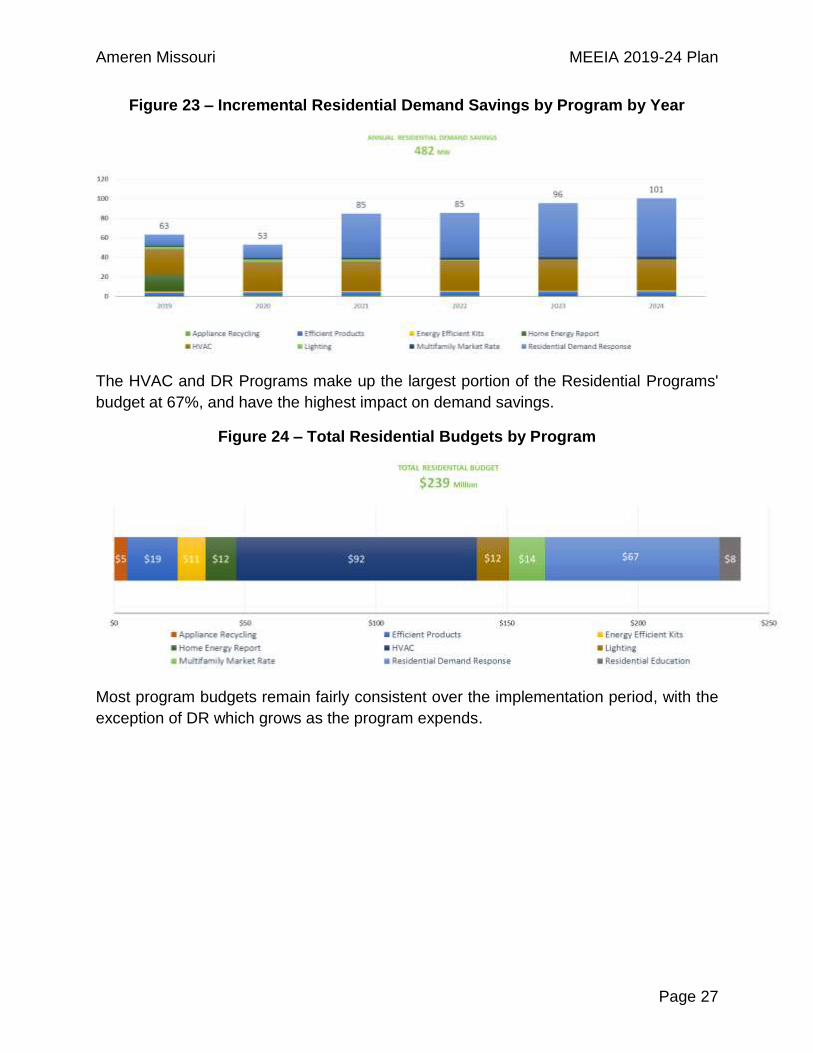
Figure 23 – Incremental Residential Demand Savings by Program by Year
The HVAC and DR Programs make up the largest portion of the Residential Programs'
budget at 67%, and have the highest impact on demand savings.
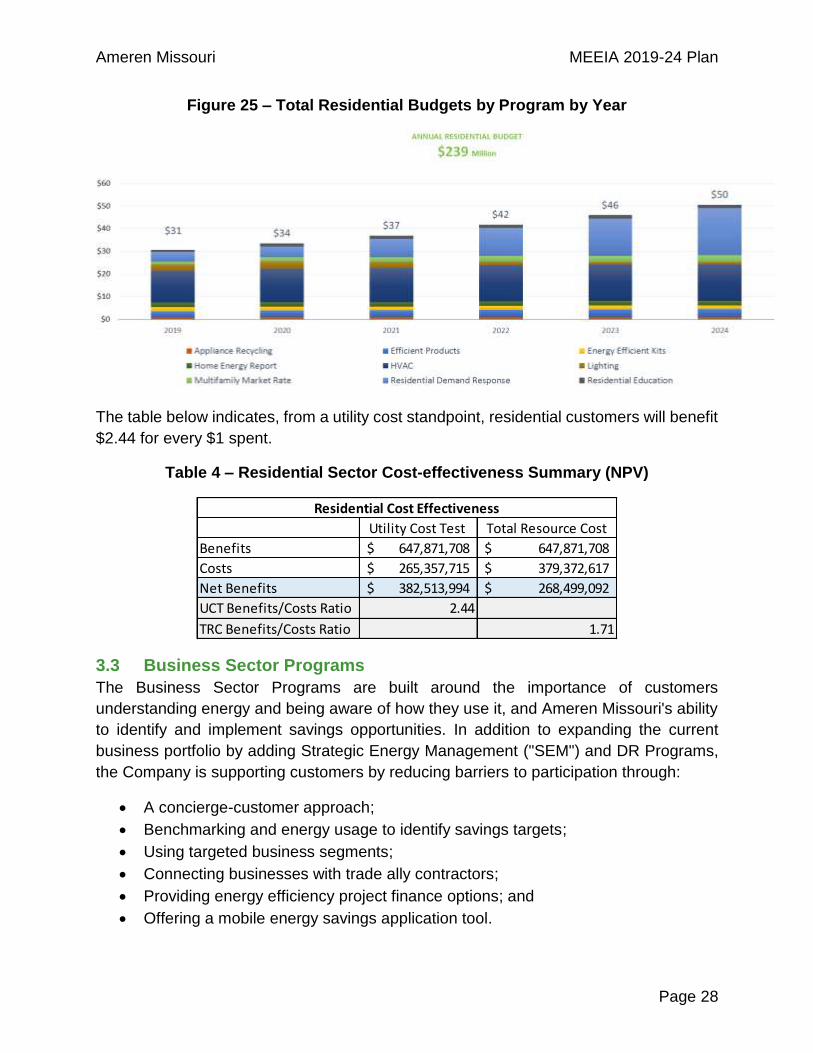
Figure 24 – Total Residential Budgets by Program
Most program budgets remain fairly consistent over the implementation period, with the
exception of DR which grows as the program expends.
Ameren Missouri MEEIA 2019-24 Plan
Page 28
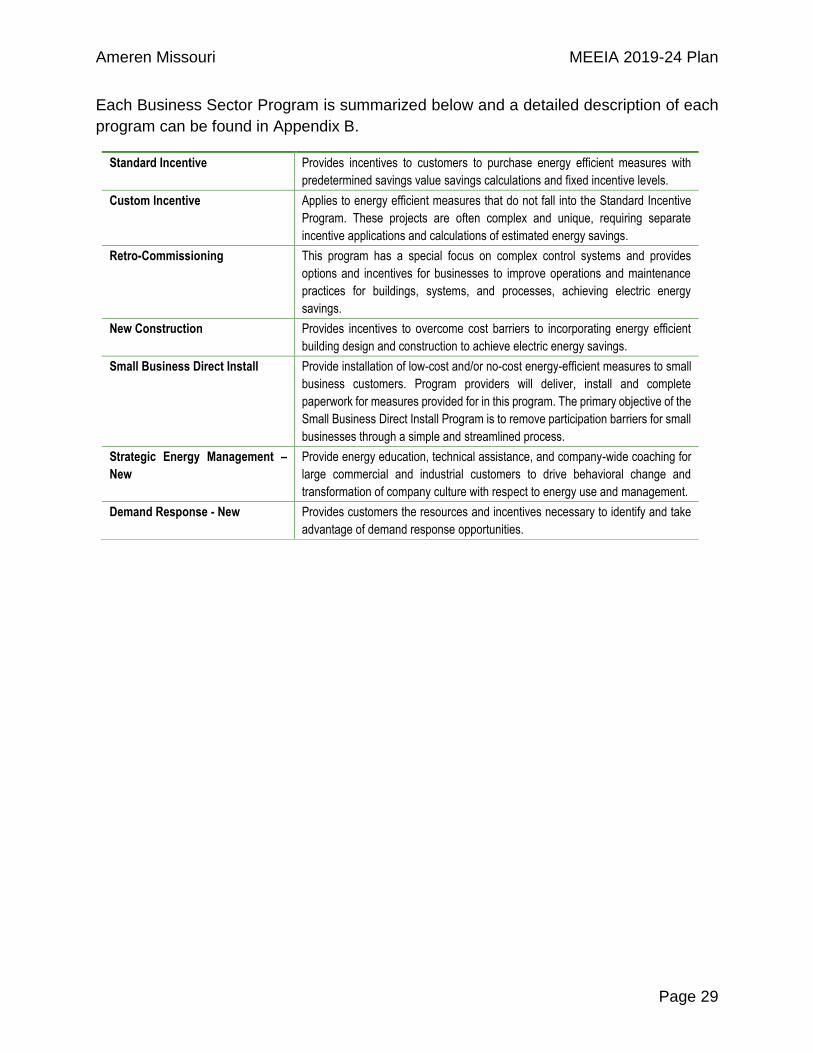
Figure 25 – Total Residential Budgets by Program by Year
The table below indicates, from a utility cost standpoint, residential customers will benefit
$2.44 for every $1 spent.
Table 4 – Residential Sector Cost-effectiveness Summary (NPV)
3.3 Business Sector Programs
The Business Sector Programs are built around the importance of customers
understanding energy and being aware of how they use it, and Ameren Missouri's ability
to identify and implement savings opportunities. In addition to expanding the current
business portfolio by adding Strategic Energy Management ("SEM") and DR Programs,
the Company is supporting customers by reducing barriers to participation through:
A concierge-customer approach;
Benchmarking and energy usage to identify savings targets;
Using targeted business segments;
Connecting businesses with trade ally contractors;
Providing energy efficiency project finance options; and
Offering a mobile energy savings application tool.
Utility Cost Test Total Resource Cost
Benefits 647,871,708$ 647,871,708$
Costs 265,357,715$ 379,372,617$
Net Benefits 382,513,994$ 268,499,092$
UCT Benefits/Costs Ratio 2.44
TRC Benefits/Costs Ratio 1.71
Residential Cost Effectiveness
Ameren Missouri MEEIA 2019-24 Plan
Page 29
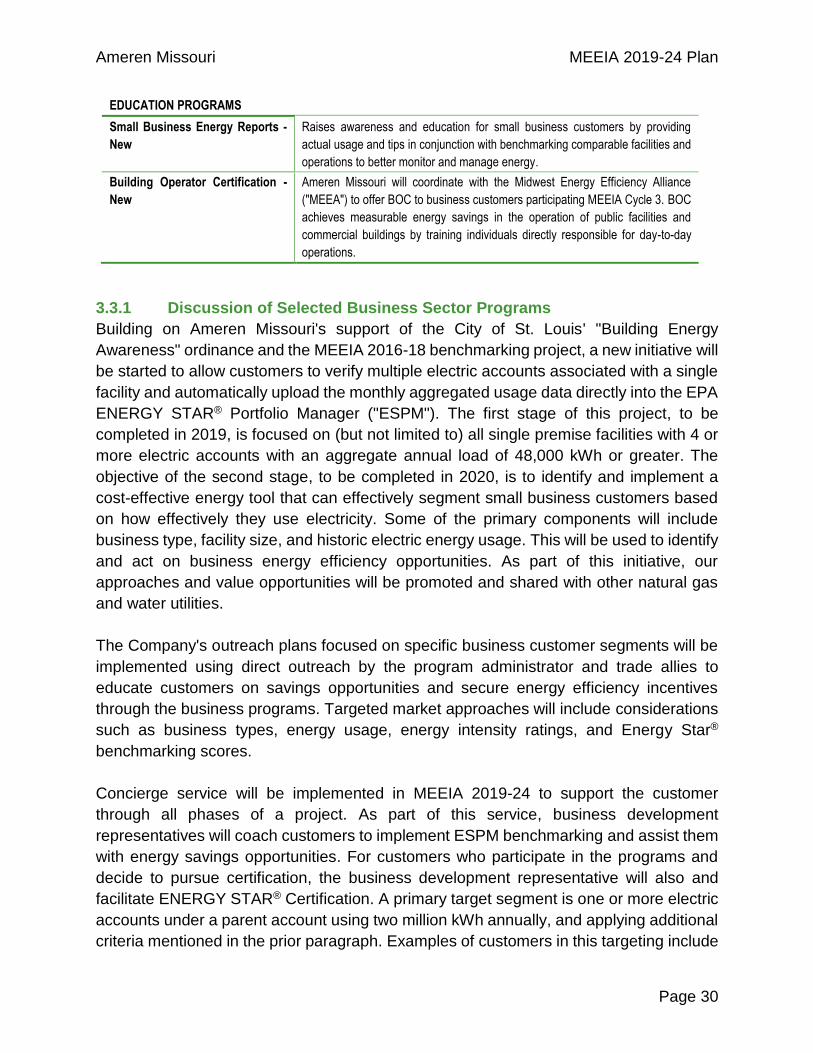
Each Business Sector Program is summarized below and a detailed description of each
program can be found in Appendix B.
Standard Incentive Provides incentives to customers to purchase energy efficient measures with
predetermined savings value savings calculations and fixed incentive levels.
Custom Incentive Applies to energy efficient measures that do not fall into the Standard Incentive
Program. These projects are often complex and unique, requiring separate
incentive applications and calculations of estimated energy savings.
Retro-Commissioning This program has a special focus on complex control systems and provides
options and incentives for businesses to improve operations and maintenance
practices for buildings, systems, and processes, achieving electric energy
savings.
New Construction Provides incentives to overcome cost barriers to incorporating energy efficient
building design and construction to achieve electric energy savings.
Small Business Direct Install Provide installation of low-cost and/or no-cost energy-efficient measures to small
business customers. Program providers will deliver, install and complete
paperwork for measures provided for in this program. The primary objective of the
Small Business Direct Install Program is to remove participation barriers for small
businesses through a simple and streamlined process.
Strategic Energy Management –
New
Provide energy education, technical assistance, and company-wide coaching for
large commercial and industrial customers to drive behavioral change and
transformation of company culture with respect to energy use and management.
Demand Response - New Provides customers the resources and incentives necessary to identify and take
advantage of demand response opportunities.
Ameren Missouri MEEIA 2019-24 Plan
Page 30
EDUCATION PROGRAMS
Small Business Energy Reports -
New
Raises awareness and education for small business customers by providing
actual usage and tips in conjunction with benchmarking comparable facilities and
operations to better monitor and manage energy.
Building Operator Certification -
New
Ameren Missouri will coordinate with the Midwest Energy Efficiency Alliance
("MEEA") to offer BOC to business customers participating MEEIA Cycle 3. BOC
achieves measurable energy savings in the operation of public facilities and
commercial buildings by training individuals directly responsible for day-to-day
operations.
3.3.1 Discussion of Selected Business Sector Programs
Building on Ameren Missouri's support of the City of St. Louis' "Building Energy
Awareness" ordinance and the MEEIA 2016-18 benchmarking project, a new initiative will
be started to allow customers to verify multiple electric accounts associated with a single
facility and automatically upload the monthly aggregated usage data directly into the EPA
ENERGY STAR® Portfolio Manager ("ESPM"). The first stage of this project, to be
completed in 2019, is focused on (but not limited to) all single premise facilities with 4 or
more electric accounts with an aggregate annual load of 48,000 kWh or greater. The
objective of the second stage, to be completed in 2020, is to identify and implement a
cost-effective energy tool that can effectively segment small business customers based
on how effectively they use electricity. Some of the primary components will include
business type, facility size, and historic electric energy usage. This will be used to identify
and act on business energy efficiency opportunities. As part of this initiative, our
approaches and value opportunities will be promoted and shared with other natural gas
and water utilities.
The Company's outreach plans focused on specific business customer segments will be
implemented using direct outreach by the program administrator and trade allies to
educate customers on savings opportunities and secure energy efficiency incentives
through the business programs. Targeted market approaches will include considerations
such as business types, energy usage, energy intensity ratings, and Energy Star®
benchmarking scores.
Concierge service will be implemented in MEEIA 2019-24 to support the customer
through all phases of a project. As part of this service, business development
representatives will coach customers to implement ESPM benchmarking and assist them
with energy savings opportunities. For customers who participate in the programs and
decide to pursue certification, the business development representative will also and
facilitate ENERGY STAR® Certification. A primary target segment is one or more electric
accounts under a parent account using two million kWh annually, and applying additional
criteria mentioned in the prior paragraph. Examples of customers in this targeting include

Ameren Missouri MEEIA 2019-24 Plan
Page 31
school districts, property management groups, and government accounts such as state,
county, and local governments.
Additionally, to aid with connecting customers with energy efficiency program trade allies,
Ameren Missouri will initiate a web connection tool where a customer's potential projects,
identified through the benchmarking process or other means, can be posted. This will
provide trade ally members the opportunity to review each customer's potential project,
engage in project development, and present energy efficiency upgrade proposals to
customers. As part of the concierge service, the implementation specialist or business
development representative will support customers with the upload of their project data
into the web connection tool. This reduces customer barriers associated with identifying
energy efficiency contractors and gives trade ally contractors an additional avenue to
engage potential customers. A simple request form to submit potential projects will
include customer contact information, proposal scope, technology (e.g., lighting, HVAC,
refrigeration, etc.) and proposal timeline.
Ameren Missouri will also add finance options to energy efficiency incentive offers to help
business customers move ahead with proposed upgrades. Continuing with the concierge
service approach, financing options will be an integral part of the total energy efficiency
incentive offer. An energy efficiency financial calculator will be used to demonstrate
different financial structure scenarios, utilizing typical rates, terms, etc. Financing will be
available for qualified customers through traditional business loans along with specialty
financing such as Missouri Energy Loan Program and Property Assessed Clean Energy
("PACE"). The executed loan agreements and financing costs will be between the
customer and lender.
The new SEM Program will provide energy education, technical assistance, and
company-wide coaching for 6 to 10 of the largest commercial and industrial customers to
drive behavioral change and transformation of company culture with respect to energy
use and management.
The SEM Program will provide benefits such as: • Provide a long-term approach to efficiency for the entire participating
company;• Achieve a reduction of Operation and Maintenance (O&M) expenses as a
result of SEM plan implementation;• Improve the persistence of energy savings;• Institutionalize energy efficient behaviors and practices;• Encourage whole building performance improvements;• Increase number and size of traditional energy efficiency projects
implemented; and
Ameren Missouri MEEIA 2019-24 Plan
Page 32
• Achieve greater customer satisfaction to the portfolio of business energy
efficiency programs.
Separately, capital measures that are adopted due to participation in the SEM Program,
and that are eligible for incentives under other energy efficiency business programs (such
as the Standard and Custom Programs), are routed through those programs to receive
the applicable incentives as if they were regular projects. These savings are netted out of
the SEM savings and recorded under the Standard or Custom programs. In this way,
SEM also becomes a lead generator for other programs and further drives portfolio
success.
The Business DR Program is new to the business portfolio.The Company will procure
demand savings through an aggregator who will recruit customers using unique contract
offerings and price points for each customer. With the aggregator providing the contracted
demand savings, Ameren Missouri expects to register this DR program as a Load
Modifying Resource in the MISO market.
Business Customer Opt-Out MEEIA allows eligible customers to opt-out of paying the costs of utility energy efficiency
programs. Three categories of customers can opt-out:
Customers with a single facility exceeding 5,000 kW of peak demand can opt-out
without restriction;
Interstate pipeline pumping station customers can opt-out without restriction; and
Customers that can aggregate accounts to greater than 2,500 kW of coincident
demand can opt-out provided the customer has a comprehensive demand-side or
energy efficiency program and can demonstrate an achievement of savings at
least equal to those expected from utility-provided programs. Opt-out shall be in
effect for 10 years beginning with the first calendar year of the opt-out. Customers
must declare their desire to continue to opt-out after the 10 years.
In 2017, 26 Commercial and Industrial ("C&I") customers opted out of the MEEIA program
with their total annual load of 2,629,990 MWh. This is 14.1% of the total C&I customers'
load. The figure below shows the percentage of energy by rate class that opted-out.

Ameren Missouri MEEIA 2019-24 Plan
Page 33
Figure 32 – Opt-Out Percentage by Rate Class (2017 Actuals)
Based on market information, approximately 9 additional customers with an approximate
total load of 1,131,660 MWh may apply to opt-out in the 2018 fall opt-out window.
Customers electing to opt-out are not eligible to participate in the Business Demand
Response Program since the program provides incentives to participating customers.
Transition Plan for Long-Lead Projects Transition plans between MEEIA cycles are required to obtain all energy savings and
allow customers with long-lead projects that span cycles to take advantage of energy
savings opportunities. A MEEIA 2019-24 transition plan will allow customers to accept an
energy efficiency incentive commitment for projects during the MEEIA 2019-24 term and
receive the incentive payment beyond the term, whether or not there is another MEEIA
plan.
During MEEIA 2016-18, a transition plan was developed collaboratively with regulatory
stakeholders and approved by the Commission. This transition plan allowed customers
with long-lead projects to participate in MEEIA 2016-18 even if the completion dates of
their projects fall after the current MEEIA cycle expires, as long as the completion date
still falls within a specified timeline. With 9 months still remaining in MEEIA 2016-18, 57
long-lead projects in different stages of planning have an estimated total energy savings
of 35,248 MWh and completion dates beyond MEEIA 2016-18. These customers would
not have had the opportunity to obtain these savings without the agreed-upon transition
plan. It is still anticipated the number of projects and savings requests may far exceed the
$4 million MEEIA 2016-18 transition budget.
With the longer 6-year term in MEEIA 2019-24 and the need to obtain additional
knowledge on the effectiveness of the MEEIA 2016-18 transition plan, the Company will
lead discussions with interested regulatory stakeholders about implementing a MEEIA
2019-24 transition plan by the end of the third program year.

Ameren Missouri MEEIA 2019-24 Plan
Page 34
3.3.2 Business Sector Summary Charts
Over the implementation period, Custom and Standard Business Programs make up 80%
of the total energy savings forecast with New Construction, Retro-Commissioning, Small
Business Direct Install, SEM, and DR making up the remainder.
Figure 26 – Cumulative Business Energy Savings by Program
The Custom Program also leads in demand savings with the DR Program a close second,
combining for 70% of the demand savings.
Figure 27 – Cumulative Business Demand Savings by Programs
The first year slow start in energy and demand savings is associated with the beginning
of a new cycle and the programs not starting until March 1, 2019.

Ameren Missouri MEEIA 2019-24 Plan
Page 35
Figure 28 – Incremental Business Energy Savings by Program
DR begins the first 2 years with relatively small MW goals to learn about the recruitment
and operation of the DR Program. Year 3 ramps up the savings to build a significant
capacity resource. The resource will continue for years 4-6, but there are no incremental
MW savings planned for years 4-6.
Figure 29 – Incremental Business Demand Savings by Program
Based on implementation budget cost versus associated demand reduction, the DR
Program is the most cost-effective, with the Small Business Direct Install Program having
the highest implementation costs versus energy and demand savings.
Ameren Missouri MEEIA 2019-24 Plan
Page 36
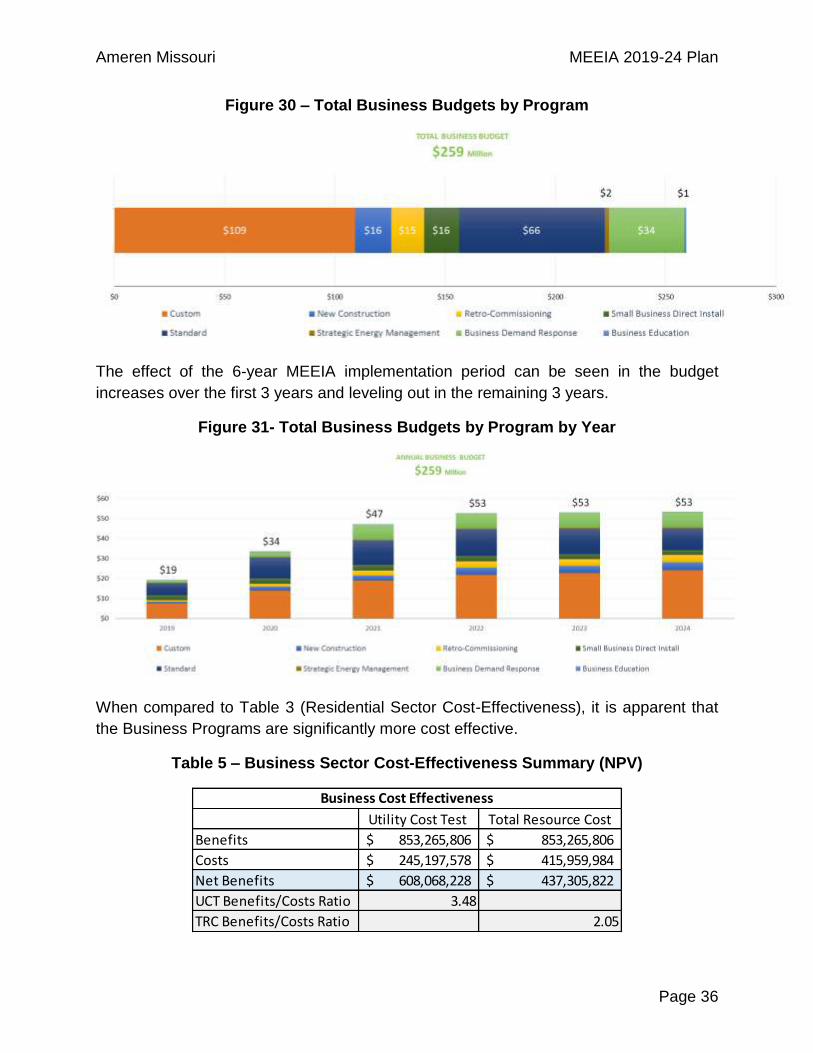
Figure 30 – Total Business Budgets by Program
The effect of the 6-year MEEIA implementation period can be seen in the budget
increases over the first 3 years and leveling out in the remaining 3 years.
Figure 31- Total Business Budgets by Program by Year
When compared to Table 3 (Residential Sector Cost-Effectiveness), it is apparent that
the Business Programs are significantly more cost effective.
Table 5 – Business Sector Cost-Effectiveness Summary (NPV)
Utility Cost Test Total Resource Cost
Benefits 853,265,806$ 853,265,806$
Costs 245,197,578$ 415,959,984$
Net Benefits 608,068,228$ 437,305,822$
UCT Benefits/Costs Ratio 3.48
TRC Benefits/Costs Ratio 2.05
Business Cost Effectiveness
Ameren Missouri MEEIA 2019-24 Plan
Page 37
4.0 Evaluation, Measurement and Verification
4.1 Structure and Processes
A robust EM&V assessment of savings associated with a demand-side program is
comprised of, at a minimum, an impact evaluation and a process evaluation. The impact
evaluation answers whether the program works by taking a systematic assessment of the
relevant data relating to the operational outcomes of a program (e.g., the MWh saved).
The process evaluation provides insights on how the program can be improved through
careful examination of program implementation, by reviewing existing procedures, and by
interviewing program participants and program staff. This review attempts to determine
whether procedures are being followed and how well the procedures are working.
Ameren Missouri will procure the services of an independent, third-party contractor to
provide an objective assessment of the performance of the MEEIA 2019-24 portfolio. The
completed evaluations will be performed in accordance with EM&V best practices like
those documented in the International Performance Measurement and Verification
Protocols and/or the Uniform Methods Project protocols. The use of established protocols
reinforces the reliability of the assessed savings achieved by the energy efficiency
programs.
The Commission rules require the use of an additional EM&V Auditor (“Auditor”) hired by
the Commission to audit and report on the work of Ameren Missouri’s independent EM&V
contractors. Ideally, for the MEEIA 2019-24 programs, the Commission Auditor:
1. Monitors the planning, implementation and analysis activities of Ameren
Missouri's independent EM&V contractors;
2. Provides on-going feedback to Ameren Missouri's stakeholders on EM&V
issues; and
3. Provides stakeholders with a copy of a final annual report in a timely manner.
A budget of 5% of the program administration and incentive costs has been established
for the EM&V efforts during MEEIA 2019-24. Primary market research will be performed
during the course of the EM&V program assessments. This will provide for an important,
broader perspective on market/customer activities beyond the utility's programs, as well
as an ongoing update to critical inputs used for program planning in a way that is internally
consistent with the research conducted on utility demand-side resource programs.
4.2 Evaluation Contractor Role
In addition to the reporting of savings estimates, the evaluation contractors are expected
to contribute meaningfully to operational efforts, to measure consideration discussions,
to inform the design of customer forms and materials, to assist in the setup of the data
Ameren Missouri MEEIA 2019-24 Plan
Page 38
tracking system, and to suggest program delivery modifications. Besides coordinating
independent EM&V, Ameren Missouri requires implementation contractors to develop
and implement internal Quality Assurance and Quality Control (“QA/QC”), inspection, and
due diligence procedures. These procedures will vary by program and are in place to
assure customer eligibility, completion of installations, and the reasonableness and
accuracy of savings upon which incentives are based. Evaluators will review these
QA/QC procedures. To be successful in these areas, it is important to maintain open lines
of communication with both the evaluation contractors and the implementation
contractors
4.2.1 Evaluation Plans
The evaluation plans are work plans developed at the beginning of the program that fulfill
the evaluation objectives and identify the planned activities undertaken in each program
year with step-by-step action plans.
The sample evaluation plans found within Appendix E provide a high level description of
the EM&V effort that will take place for each of the MEEIA 2019-24 programs. The
detailed evaluation plans for each program will be developed and shared with
stakeholders at least 30 days prior to program launch. As programs and markets evolve
each year, the evaluation methods may need to change to ensure the evaluation
method(s) being used continue to be appropriate. Findings from process evaluations and
market assessments will help identify when to reassess impact evaluation methods. The
regulatory stakeholders will be engaged with the development and review of the overall
six-year EM&V plan prior to its implementation and informed as modifications are made
throughout the program cycle.
4.2.2 Impact Evaluation
One of the most important aspects of evaluation is the measurement of savings achieved
by implemented energy efficiency measures. The impact evaluation estimates of gross
measure savings may include engineering analysis and formulas, building simulation
models, meter data, statistical models and billing analysis. The evaluator is expected to
complete annual impact evaluations of all programs. This will include any necessary
measurement to recommend adjustments to the attributes of the measures, including
changes/updates to measure inputs, incremental costs, and formulas to calculate savings
and cost-effectiveness.
4.2.3 Demand Response Evaluation
Evaluations performed for a DR program differ from an evaluation done for an energy
efficiency program. For DR, the evaluation will capture at least the following two measures
of savings:
Ameren Missouri MEEIA 2019-24 Plan
Page 39
The amount of demand reduced during a peakshaving event and the associated
energy savings; and
Total kW under control by the program at program year-end and available to be
called under Ameren Missouri's system peak conditions.9
For Residential DR, the evaluation will include analysis of the time before an event to
account for pre-cooling and after an event to account for snap back usage to return the
home to a normal temperature setting. EM&V will also calculate energy savings on non-
event days due to additional energy management activities undertaken through this
program. Because DR is a resource used to meet future peak demand needs during a
system peak event on the Ameren Missouri system, it is important to also report its
capabilities under conditions that are consistent with how Ameren Missouri forecasts peak
demand and performs its long-term planning analyses. Therefore, DR capability will be
weather-normalized to a design criteria consistent with the Company's peak forecasting
weather assumptions. The normalized DR kW capability at this design criteria will then
be multiplied by the total number of participants in the program at the end of the program
year.
For Business DR, the actual meter readings during a DR event will be compared to the
customer's baseline to calculate the consumption and demand savings per event. The
DR annual capacity will be the average demand savings across all peak shaving events
throughout the summer event season. Events that are called for purposes other than peak
shaving may be excluded from the annual capacity calculation. Similar weather
normalization and resource capability calculations will be performed on the Business DR
to the extent they are relevant.
4.2.4 Process Evaluations
Ameren Missouri will again collaborate with its evaluators to identify appropriate process
evaluation goals, procedures, and practices. These evaluations focus more on program
design and delivery, market segments, and other societal factors that affect the program’s
performance. Additionally, the evaluations will address the requirements of 4 CSR 240-
22.070(8), which include:
1. Identifying primary market imperfections common to the target market
segment;
2. Identifying the adequacy of market segment definition and the
appropriateness of the market segments;
3. Identifying if the mix of end-use measures adequately addresses the market
segment end-use needs and measure diversity;
9 This includes weather-normalized actual average event demand reductions (to system peak design conditions) and scaled to the total number of program participants at year end.
Ameren Missouri MEEIA 2019-24 Plan
Page 40
4. Appropriateness of communication channels of market segment delivery
mechanisms; and
5. Methods for overcoming identified market imperfections to increase customer
acceptance and program effectiveness.
Further, the process evaluation will review the performance of the programs that are being
delivered and make recommendations regarding improvements that can be made
associated with the delivery of energy efficiency products.
Because of uncertainty in the residential lighting market (including the execution of
equipment efficiency standards) and the fast pace of change in LED prices and adoption,
for the Residential Lighting Program, the evaluation contractor will perform an annual
assessment to identify specific Stock Keeping Units of lights for each delivery channel
that should no longer be offered because of market changes.
4.2.5 Annual EM&V Reporting
As required by the Commission’s MEEIA regulations, the evaluators will provide the
regulatory stakeholders with a copy of the draft and the final EM&V report at the same
time as they are provided to Ameren Missouri.
The reports will include energy savings and demand reductions for each of the programs
and each of the residential and non-residential portfolios. The reports will also summarize
ex-ante and ex-post measure level savings on which the updates for the Deemed Savings
Table (Appendix F) and Technical Resource Manual ("TRM") (Appendices G – I) will be
based.10 Finally, the reports will include a summary of the process evaluation and will
identify specific details regarding the impact methodologies and results as well as key
findings, conclusions, and recommendations. Based on the annual evaluations, Ameren
Missouri will complete the cost-effectiveness analysis at the program and portfolio level
and calculate the net lifetime benefits of the programs to be included in the evaluation
reports. Additionally, before the end of 2018, Ameren Missouri will host a meeting with
stakeholders to develop high-level reporting protocols. These protocols include items like
report structure, the use of standardized definitions, etc. This activity aligns well with
certain efforts already underway with the Missouri Statewide Collaborative.
Similar to the process reflected in the Company's MEEIA 2013-15 and 2016-18 plans,
as approved by the Commission, the below-described process is included in this Plan
and will govern review and finalization of annual EM&V:
EM&V reports will be completed for each program year the Plan. Seventy (70)days after the end of each program year, the EM&V contractor will circulate a draftEM&V report to all parties to the MEEIA 2019-24 case ("evaluation stakeholders")and the Commission’s Auditor.
10 The Deemed Savings Table and Technical Resource Manual are discussed further below.
Ameren Missouri MEEIA 2019-24 Plan
Page 41
Fifty-six (56) days after circulation of the draft EM&V report, the Auditor and each evaluation stakeholder can provide any comments and recommendations for report changes to the EM&V contractor and to all other evaluation stakeholders and the Auditor.
Prior to issuing the Final EM&V Report, the EM&V contractor will host at least one conference call/meeting with the Auditor and the evaluation stakeholders to discuss the comments and recommendations for report changes. The EM&V contractor will determine what comments and/or changes are incorporated into the Final EM&V Report. Thirty-five (35) days after the deadline for comments and recommendations for report changes, a Final EM&V Report will be provided to all evaluation stakeholders and the Auditor by the EM&V contractor. Fourteen (14) days following the Final EM&V Report, the Commission’s Auditor will issue its final report.
Any evaluation stakeholder who wants a change to the impact evaluation portion of the Final EM&V Report will have twenty-one (21) days from the issuance of the Final EM&V Report to file a request with the Commission to make such a change (“Change Request”). Any evaluation stakeholder filing a Change Request will set forth all reasons and provide support for the requested change in its initial Change Request filing. Responses to a Change Request may be filed by any evaluation stakeholder and are due twenty-one (21) days after the Change Request is filed. The response must set forth all reasons and provide support for opposing or agreeing with the Change Request. Within seven (7) days after the deadline for filing a Change Request (if a Change Request is filed), the evaluation stakeholders will hold a conference call/meeting to agree upon a proposed procedural schedule that results in any evidentiary hearing that is necessary to resolve the Change Request to be completed within sixty-three (63) days of the filing of the Change Request. The proposed procedural schedule will also recommend to the Commission that a Report and Order resolving the Change Request be issued within thirty (30) days after the conclusion of such a hearing. The evaluation stakeholders will be parties to a Change Request resolution proceeding without the necessity of applying to intervene. The procedural schedule for such a Change Request proceeding will provide that data request objections must be lodged within seven (7) days and responses will be due within ten (10) days (notifications that additional time is required to respond will also be due within seven (7) days).
For purposes of calculating achievements towards annual earnings opportunity
metrics, the Company will utilize the impact evaluation energy and demand
savings (kWh and kW) estimates of the Final EM&V Report, as it may be modified
by the Commission’s resolution (using the above-described process) of any issues
related to the impact evaluation portion of the Final EM&V Report.
Ameren Missouri MEEIA 2019-24 Plan
Page 42
4.3 Technical Resource Manual
The Ameren Missouri MEEIA 2019-24 TRM is largely based on the draft Missouri
Statewide TRM, which was led and created in collaboration with the Missouri Departmetn
of Economic Development - Division of Energy. The draft Missouri Statewide TRM serves
as the source for measure savings formulas and default inputs (to use in the absence of
utility-specific evaluation results). The Deemed Savings Table represents the application
of the formulas in the TRM for discrete measures that are being offered and also reflects
the inputs into those formulas based on utility-specific evaluation results. The Deemed
Savings Table is attached as Appendix F and the TRM is attached in three volumes as
Appendices G - I: TRM-Introduction and User Guide (Appendix G); TRM-Business
Measures (Appendix H); and TRM-Residential Measures (Appendix I). Together, the
TRM and the Deemed Savings Table are important to improve the transparency of
savings calculations. To facilitate further transparency, the Deemed Savings Table has
been created in Excel with working formulas for each measure and organized in a way to
improve connection to the formulas specified in the TRM. The evaluators will utilize the
Excel-based Deemed Savings Table to save time by making updates to the measure
savings/inputs inherent in the evaluation process and thus avoiding the the extra effort
typically expended after an evaluation to translate the EM&V results into the necessary
regulatory updates. To the extent evaluators suggest alternative savings algorithms
compared to what the TRM specifies, such recommendations will be made as part of the
evaluation plans and justification will be provided.
The TRM and Deemed Savings Table are living documents that will be updated
periodically throughout MEEIA 2019-24. Changes to the TRM will be submitted for
Commission approval and will likely be a result of evaluations and/or the need to add
additional measures. The Deemed Savings Table will be the primary source of savings
used as inputs for the throughput disincentive calculations and will be updated regularly
(roughly annually depending on evaluation cycles) to reflect updates to measure savings
from evaluations. To the extent final EM&V results from program year 2017 of MEEIA
2016-18 require, the TRM and/or Deemed Savings Table included with this Plan will be
updated before the start of the Plan's programs. To the extent the Deemed Savings Table
requires only changes to measures and measure inputs, those updates will be achieved
by following steps 3,4,5,6, 10, & 11 of the 11-Step Change Process outlined in the
Company's tariffs.
4.4 Net-To-Gross
The TRM and Deemed Savings Table described above govern the estimation of the gross
impacts of the measures delivered by Ameren Missouri’s programs. However, a second
and important part of the savings equation is the estimation of net savings based on
application of a Net-to-Gross ("NTG") ratio. The NTG ratio is what establishes the amount
of savings that are attributable to utility programs.
Ameren Missouri MEEIA 2019-24 Plan
Page 43
The MEEIA 2019-24 equation for estimating the NTG ratio for energy efficiency programs
is:
𝑵𝑻𝑮 𝑹𝒂𝒕𝒊𝒐 = 1 − 𝐹𝑟𝑒𝑒𝑟𝑖𝑑𝑒𝑟𝑠ℎ𝑖𝑝 𝑟𝑎𝑡𝑖𝑜 + 𝑆𝑝𝑖𝑙𝑙𝑜𝑣𝑒𝑟 𝑟𝑎𝑡𝑖𝑜
(𝑤ℎ𝑒𝑟𝑒 𝑡ℎ𝑒 𝑑𝑒𝑛𝑜𝑚𝑖𝑛𝑎𝑡𝑜𝑟 𝑖𝑛 𝑒𝑎𝑐ℎ 𝑟𝑎𝑡𝑖𝑜 𝑖𝑠 𝑡ℎ𝑒 𝑔𝑟𝑜𝑠𝑠 𝑠𝑎𝑣𝑖𝑛𝑔𝑠)
Free-ridership is the program savings attributable to free-riders (program participants who
would have implemented a program measure or practice in the absence of the program).
There are three types of free-riders:
• Total free-riders: Participants who would have completely replicated the program
measure(s) or practice(s) on their own and at the same time in the absence of the
program.
• Partial free-riders: Participants who would have partially replicated the program
measure(s) or practice(s) by implementing a lesser quantity or lower efficiency
level.
• Deferred free-riders: Participants who would have completely or partially replicated
the program measure(s) or practice(s) at a time after the program timeframe11.
Spillover refers to additional reductions in energy consumption or demand that are due to
program influences beyond those directly associated with program participation. As a
result, these savings may not be recorded in the program tracking system and credited
to the program. There are generally two types of spillover; participant spillover and non-
participant spillover. Each can be described as follows:
Participant spillover: This represents the additional energy savings that are
achieved when a program participant—as a result of the program’s influence—
installs energy efficiency measures or practices outside the efficiency program
after having participated.
Evaluators have further defined the broad category of participant spillover into the
following subcategories:
o Inside spillover: Occurs when participants take additional program-
induced actions at the project site;
o Outside spillover: Occurs when program participants initiate actions
that reduce energy use at sites that are not participating in the
program;
11 Id.
Ameren Missouri MEEIA 2019-24 Plan
Page 44
o Like spillover: Refers to program-induced actions participants make
outside the program that are of the same type as those made through
the program (at the project site or other sites); and
o Unlike spillover: Refers to energy efficiency actions participants make
outside the program that are unlike program actions (at the project site
or other sites) but that are influenced in some way by the program.
Nonparticipant spillover: This represents the additional energy savings that are
achieved when a nonparticipant implements energy efficiency measures or
practices as a result of the program’s influence (for example, through exposure to
the program) but is not accounted for in program savings.12 Nonparticpant spillover
can include both like and unlike spillover.
5.0 Demand-Side Investment Mechanism
The DSIM included in the Plan reflects a set of regulatory policies and practices that
provide timely recovery of program costs, align the financial interests of the Company
with helping its customers use energy more efficiently and in a manner that sustains or
enhances its customers' incentives to use energy more efficiently, and provide an
earnings opportunity. For the MEEIA 2019-24 plan, the DSIM from MEEIA 2016-18
provides a useful framework from which to begin. In fact, the basic structure of the DSIM
proposed for MEEIA 2019-24 is very similar in most respects to the DSIM that is currently
in place for the MEEIA 2016-18 programs. Ameren Missouri has updated its analysis to
reflect new portfolio characteristics, new avoided costs, and new margin rates to produce
updated throughput disincentive and earnings opportunity components of the DSIM.
Overall, the existing framework has been effective in aligning incentives and otherwise
discharging the Commission's obligations under MEEIA. As noted, the proposed DSM
includes three components: 1) program cost recovery; 2) throughput disincentive
recovery; and 3) an earnings opportunity. These components and other terms of the DSIM
are outlined further below. In addition, the operation of the DSIM and its defined terms,
which are explained in this report, are also embedded into the Rider EEIC tariff, included
with this report as part of Appendix J. Appendix K includes the proposed notice to explain
the proposed DSIM to customers, while Appendix L shows a sample of how the DSIM
line item will appear on a residential and non-residential bill.
Below are key elements of the proposed Rider EEIC that are also a continuation of the
MEEIA 2016-18 DSIM framework:
1) The Company will make a Rider EEIC filing each calendar year to become effective
as of the subsequent calendar year’s February billing month. The Company is
12 Id.

Ameren Missouri MEEIA 2019-24 Plan
Page 45
allowed, or may be ordered by the Commission, to make one other Rider EEIC
filing in each calendar year with such subsequent filing to be effective beginning
with either the June or October billing month (to coincide with rate changes in the
Company's Fuel Adjustment Clause rate).
2) The Energy Efficiency Investment Rate (EEIR) will be the sum of the Net Program
Costs (NPC), Net Throughput Disincentive (NTD), Net Earnings Opportunity
(NEO), and Net Ordered Adjustments (NOA) divided by the Projected Energy, in
kWh, forecasted to be delivered to the customers to which the Rider EEIC applies
during the effective period (typically the 12 billing months applicable to the Rider
EEIC filing).
3) Each subcompoent of the EEIR will include a monthly reconciliation of actual costs
to billed revenues with interest at the Company's short-term borrowing rate.
4) Any remaining reconciliation balances from MEEIA 2016-18 for program costs,
earnings opportunity, and other Commission-ordered amounts will be rolled into
the respective reconciliation balances for MEEIA 2019-24 starting in February
2022. Any remaining reconciliation balance for MEEIA 2016-18 throughput
disincentive will be rolled into the throughput disincentive reconciliation balance for
MEEIA 2019-24 starting in February 2024.
5.1 Cost Allocations13
Residential Program costs and throughput disincentive will be recovered from the
residential service class, with the exception of low-income costs as explained below. Non-
residential program costs will be allocated based on non-residential service classification
retail sales (kWh) as adjusted for opt-out, while the non-residential throughput
disincentive will be allocated based on MEEIA 2019-24 energy savings for each
respective non-residential service classification. Portfolio-level common program costs,
low-income program costs, low-income throughput disincentive, and the low-income
Rider EEIC exemption will be allocated to each service classification based on retail sales
(kWh) as adjusted for opt-out of eligible business customers. The earnings opportunity
will also be allocated to each service classification based on retail sales (kWh) as adjusted
for opt-out.
5.2 Program Costs
For the program cost recovery component of the DSIM, the coming year’s program
expenses will be forecasted and included in Rider EEIC. Each month, the cumulative
difference between actual program expenditures and actual revenues billed for program
costs will accrue short-term interest and be trued-up through Rider EEIC over the
13 Ameren Missouri is not proposing programs for its Lighting Service classifications; therefore, no MEEIA 2019-24 costs will be allocated to or charged to those classes at this time.
Ameren Missouri MEEIA 2019-24 Plan
Page 46
following year. In short, Rider EEIC reflects identical mechanics of program costs as
reflected in the current Rider EEIC.
Program costs to be recovered include the cost of customer incentives, administration
and professional services (including business development, project analysis, trade ally
management, planning, and customer interaction), incremental energy efficiency labor
and benefits, marketing (including creative development, direct mail, television, radio,
social media, collateral, and program literature), potential study, EM&V, data tracking,
education (including energy efficiency awareness activities, programs to educate
customers about energy efficiency and conservation), and other costs. These will be
tracked by specific project codes within accounts 908 or 930 and an Activity Code of
"M3PC" for each program in MEEIA 2019-24, as seen in Appendix M. Costs will be further
delineated using Resource Types. For example, the Resource Type "CI" will be used for
customer incentives, "EX" for administration and professional services, and other
Resource Type for other costs, as specified in Appendix M.
Different than MEEIA 2016-18, the MEEIA 2019-24 DISM includes the Company's
internal incremental labor costs until those labor costs are included in base rates. This
change in treatment of internal labor costs is directly related to the expected increase of
internal resources due to the aggressive expansion of the portfolio. Incremental labor for
MEEIA 2019-24 will be for employees hired by Ameren Missouri after Commission
approval of the Plan who: (a) were not an Ameren Missouri or Ameren Services Company
employee at the time of hire; (b) were hired by Ameren Missouri and assigned exclusively
to support Ameren Missouri’s MEEIA programs; and (c) were not an Ameren Missouri or
Ameren Services Company employee as of the date labor and benefit costs were
accounted for in Ameren Missouri’s prior general rate proceeding. For such qualifying
employees, the accounting for their time will be fixed so that it is charged directly to the
MEEIA programs using a unique project code for Incremental Labor and the M3PC
activity code, which will result in such an employee’s labor and benefit costs being
charged to the MEEIA programs as a program cost and included in Rider EEIC. In the
first general rate proceeding following such an employee’s hiring, that employee’s labor
and benefit costs will be rolled into the revenue requirement upon which base rates are
set and, starting with the effective date of new rates in such a general rate proceeding,
their labor and benefit cost will no longer be included in Rider EEIC.
Throughput Disincentive
Over the Company's last two MEEIA cases, the throughput disincentive has been
extensively documented, analyzed, and included in the Commission-approved DSIM. It
is well documented that energy efficiency savings cause negative impacts on utility
earnings due to the combination of regulatory lag (the time it takes to incorporate changes
in billing determinants into base rates) and through the reliance on volumetric rates to
Ameren Missouri MEEIA 2019-24 Plan
Page 47
cover fixed costs. Throughput disincentive starts impacting the utility the moment an
energy efficient measure is installed, so absent an appropriate solution the negative
earnings impact is immediate, cumulative, and continuous until base rates are updated
to reflect the reduction in billing units. Therefore, in order to align utility incentives with
helping customers use energy more efficiently, the reduction in revenues associated with
covering fixed costs must be offset by allowing throughput disincentive recovery. The
recovery of throughput disincentive is explicitly allowed by the updated MEEIA rules. In
addition, to avoid a negative impact to utility earnings, the revenue from recovery of the
throughput disincentive must meet a specific accounting standard due to the nature of
what is being recovered (i.e., revenues that the Company would have received had it not
implemented its MEEIA portfolio).
According to accounting rules that govern the types of revenues that come from Ameren
Missouri’s DSIM, in order to recognize the additional revenues to be billed in the future
and to avoid a contemporaneous reduction in Company earnings, all of the following
conditions must be satisfied:
1) The demand-side program must be established by an order from the utility’s
regulatory commission that allows for automatic adjustment of future rates
(verification of the accuracy of the adjustment to future rates by the regulator would
not preclude the adjustment from being considered automatic);
2) The amount of additional revenues for the period must be objectively
determinable and probable of recovery; and
3) The additional revenues must be collected within 24 months following the end
of the annual period in which they are recognized.
The Company's MEEIA 2016-18 Rider EEIC met these accounting requirements, and the
proposed MEEIA 2019-24 Rider EEIC continues the key elements necessary to meet
these accounting requirements.
Based on a margin rate analysis (that analyzed all customer bills for 12 months) and rate
class level energy and demand savings estimates by end use categories, the Company
has estimated total throughput disincentive for MEEIA 2019-24 of $174 million over 8
years (throughput disincentive continues until the first rate case with a true-up period that
covers the last month of MEEIA 2019-24).14 Acutal throughput disincentive will be based
on actual measure installations and relevant updates to inputs (e.g., TRM and Deemed
Savings Table, margin rates, rebasing amounts, etc.) based on actual future EM&V
results as well as general rate proceeding timing and outcomes.
14 For purposes of this analysis, the Company assumed a rate case is filed July 1, 2019, then every 24 months thereafter.
Ameren Missouri MEEIA 2019-24 Plan
Page 48
Estimating the throughout disincentive requires detailed modeling of energy savings by
rate class and by end-use category, interacted with ratemaking fundamentals. The
Company has developed this detailed modeling over the years and has consistently made
it more granular and more accurate. In fact, the MEEIA 2016-18 throughput disincentive
recovery mechanism reflects these mechanics, and the Company has used the MEEIA
2016-18 Rider EEIC spreadsheets to estimate the throughput disincentive for MEEIA
2019-24. To forecast MEEIA 2019-24 throughput disincentive, the Company assumed
that energy savings by rate class will follow the same split as the recent experience with
MEEIA 2016-18 (March 2016 through January 2018).
With energy savings by rate class and end-use category, the next step is to convert those
energy savings into dollars, which happens by multiplying rate class savings by a rate
class margin rate (i.e., the rate portion associated with covering fixed costs). Because the
Company's MEEIA 2016-18 programs have targeted demand savings more aggressively
than MEEIA 2013-15, the marginal rate analysis needed to determine margin rates has
been updated and the explanation of that update is below.
5.2.1 Marginal Rate Analysis
In order to quantify the financial impact on utility revenues and margins resulting from
the decline in usage associated with the adoption of efficiency measures, it is necessary
to identify the specific rate that is applied to usage of the customers and is reduced as
such measures are implemented. This is more complicated than it may initially appear,
as each customer class has a unique rate structure and not every kilowatt-hour of
energy and kilowatt of demand is priced the same. In order to accurately assess the
financial impacts of the throughput disincentive, the Company has performed a study
to determine the marginal rate for the average customer in each tariff class. Because
of the unique rate structures applicable to each class, customers might pay a different
amount for marginal usage or for the last kWh consumed than they do on average for
all of their usage. This is relevant in the context of the throughput disincentive because
customers that use less energy due to installation of energy efficient measures
experience a reduction on their bill according to the price of the last kWh consumed
(or the last kW of billing demand established for customers on a rate with demand
charges). Therefore, using marginal rates will help accurately measure the bill savings
to participants and of the throughput disincentive to the Company. To come up with
marginal rates for each tariff class, every bill of every customer was analyzed.
The Company first downloaded all of the bills for every customer from the 12-month
period ending with the March 2018 billing month. Every bill was then calculated
manually based on the applicable usage characteristics and tariff rate components.
Next, each bill's usage was reduced by 1%, 5%, and 10%. These usage declines were
used to simulate the effect of various energy efficient measures. For example, replacing
a couple of light bulbs at a customer premise that has a relatively large load might only
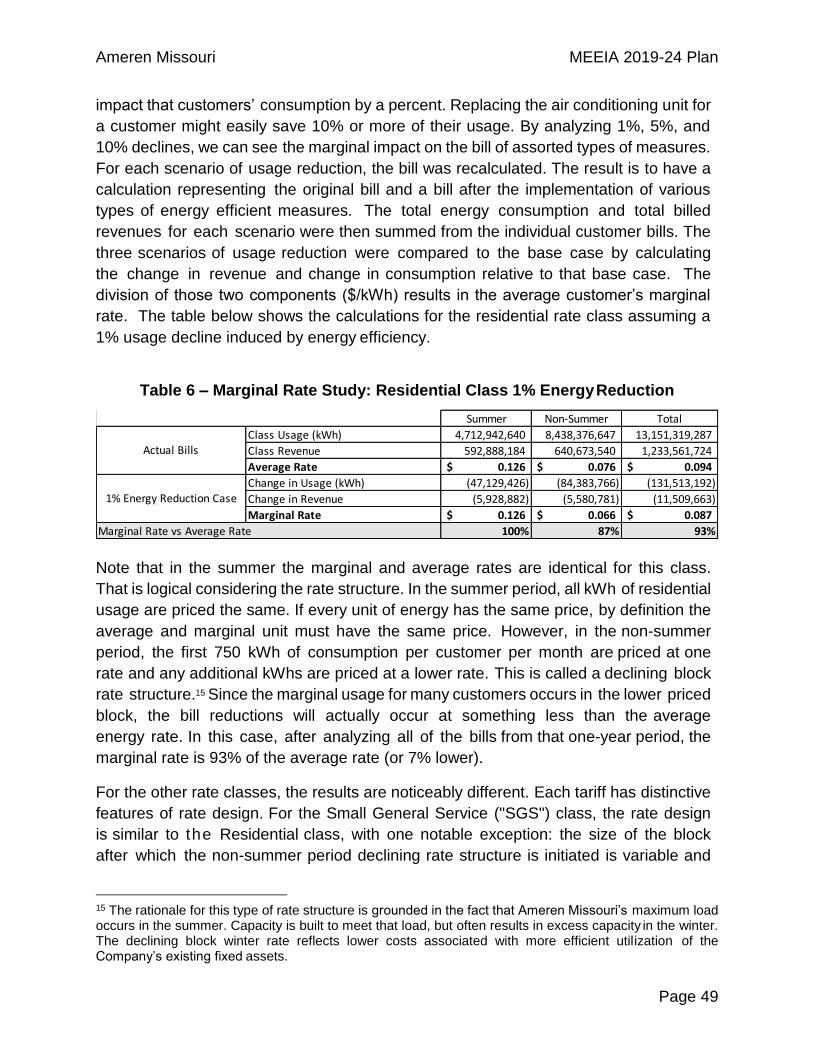
Ameren Missouri MEEIA 2019-24 Plan
Page 49
impact that customers’ consumption by a percent. Replacing the air conditioning unit for
a customer might easily save 10% or more of their usage. By analyzing 1%, 5%, and
10% declines, we can see the marginal impact on the bill of assorted types of measures.
For each scenario of usage reduction, the bill was recalculated. The result is to have a
calculation representing the original bill and a bill after the implementation of various
types of energy efficient measures. The total energy consumption and total billed
revenues for each scenario were then summed from the individual customer bills. The
three scenarios of usage reduction were compared to the base case by calculating
the change in revenue and change in consumption relative to that base case. The
division of those two components ($/kWh) results in the average customer’s marginal
rate. The table below shows the calculations for the residential rate class assuming a
1% usage decline induced by energy efficiency.
Table 6 – Marginal Rate Study: Residential Class 1% Energy Reduction
Note that in the summer the marginal and average rates are identical for this class.
That is logical considering the rate structure. In the summer period, all kWh of residential
usage are priced the same. If every unit of energy has the same price, by definition the
average and marginal unit must have the same price. However, in the non-summer
period, the first 750 kWh of consumption per customer per month are priced at one
rate and any additional kWhs are priced at a lower rate. This is called a declining block
rate structure.15 Since the marginal usage for many customers occurs in the lower priced
block, the bill reductions will actually occur at something less than the average
energy rate. In this case, after analyzing all of the bills from that one-year period, the
marginal rate is 93% of the average rate (or 7% lower).
For the other rate classes, the results are noticeably different. Each tariff has distinctive
features of rate design. For the Small General Service ("SGS") class, the rate design
is similar to the Residential class, with one notable exception: the size of the block
after which the non-summer period declining rate structure is initiated is variable and
15 The rationale for this type of rate structure is grounded in the fact that Ameren Missouri’s maximum load occurs in the summer. Capacity is built to meet that load, but often results in excess capacity in the winter. The declining block winter rate reflects lower costs associated with more efficient utilization of the Company’s existing fixed assets.
Summer Non-Summer Total
Class Usage (kWh) 4,712,942,640 8,438,376,647 13,151,319,287
Class Revenue 592,888,184 640,673,540 1,233,561,724
Average Rate 0.126$ 0.076$ 0.094$
Change in Usage (kWh) (47,129,426) (84,383,766) (131,513,192)
Change in Revenue (5,928,882) (5,580,781) (11,509,663)
Marginal Rate 0.126$ 0.066$ 0.087$
Marginal Rate vs Average Rate 100% 87% 93%
Actual Bills
1% Energy Reduction Case
Ameren Missouri MEEIA 2019-24 Plan
Page 50
customer specific. Each customer’s May through October billing month usage is used
to establish the cut off point for the declining block rate. When a customer uses less in
the May-October timeframe (as they implement energy efficient measures), they
essentially establish for themselves a more favorable block cut-off for the non-summer
months, giving them a discount on more usage for the rest of the year. This unique
feature of this rate actually causes the marginal rate to be higher than the average rate
on an annual basis.
For the Large General Service ("LGS") and Small Primary Service ("SPS") rate
classes, there is a common rate design that is sometimes referred to as an hours use
rate. This more complex rate is not described fully here due to the technical complexity,
but the workpapers with the filing have all of the supporting details. The notable feature
of this rate is that, because it is applicable to a wide range of usage levels of
customers and incorporates interactions between a demand and energy charge, the
hours use rate causes the average and marginal rates to be identical for all customers
and usage levels that have a constant load factor.16 The only way the marginal rate and
average rate can be different is if the energy efficiency measure impacts the customer’s
billing demand differently than its energy. To assess the relative impacts of energy
efficiency on energy consumption relative to demand, the Company used the actual
demand and energy savings impacts by end-use category arising from MEEIA 2016-18
programs during the same period over which the marginal rate analysis was performed
(the twelve months ending March 2018). The analysis incorporated this data and end
use load shape information to determine the estimated percent reduction in customer
billing demand for a given percentage energy reduction. This relationship between
demand and energy was applied to the usage reduction scenarios (1%, 5%, and 10%
savings) to determine corresponding reductions to billing demands to be used when
recalculating customer bills.
Even though the rate design is slightly different, a similar method of analyzing
energy savings by end use categories was utilized for the Large Primary Service
("LPS") rate class to determine demand savings given a kWh or energy savings.
Once the marginal revenue reductions associated with each kWh of savings have been
calculated, the marginal rate is reduced by a factor derived from the Company's Fuel
Adjustment Clause ("FAC"). Due to the mechanics of the FAC, the portion of the forgone
marginal revenue from each kWh of load reduction that was designed to cover net
energy costs is subject to a reconciliation that essentially allows the Company to recover
16 The load factor is the ratio of the average usage level to the maximum usage level. It is informative about how efficiently a load utilizes capacity. A high load factor is indicative of a customer that has a relatively flat usage profile. This results in a lower average rate for the high load factor customer, since there isn’t a need to build as much excess capacity that will remain idle during the customer’s lower usage periods.
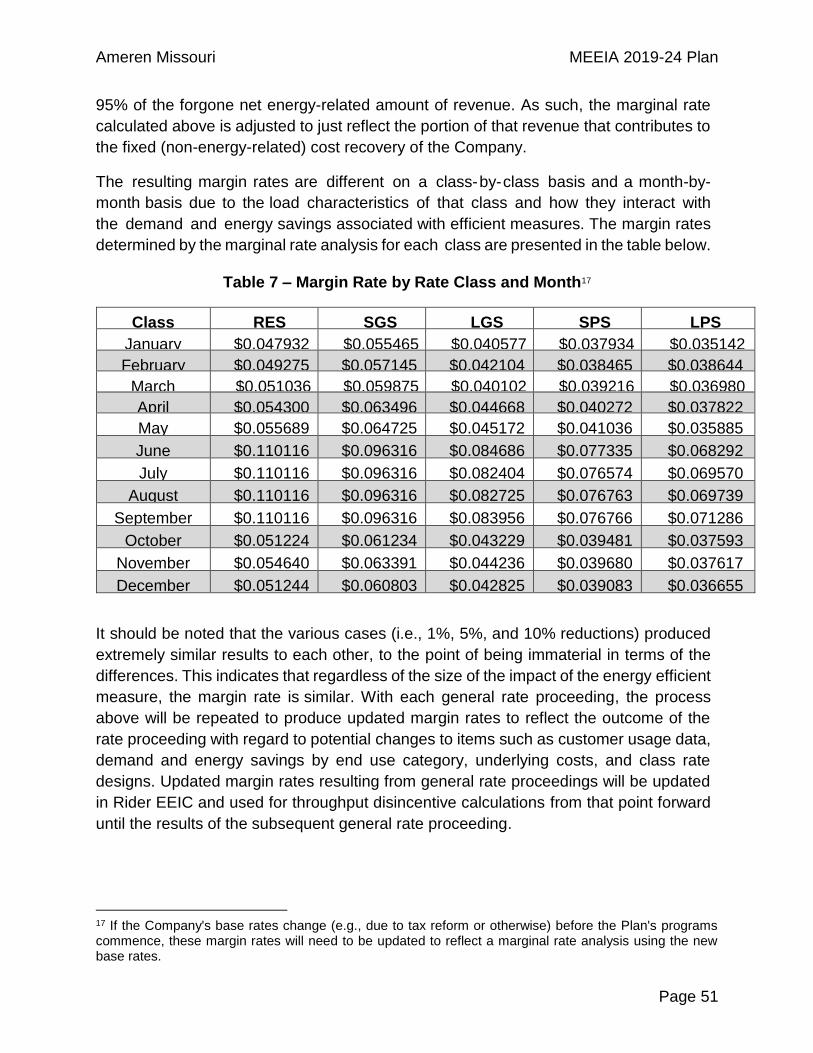
Ameren Missouri MEEIA 2019-24 Plan
Page 51
95% of the forgone net energy-related amount of revenue. As such, the marginal rate
calculated above is adjusted to just reflect the portion of that revenue that contributes to
the fixed (non-energy-related) cost recovery of the Company.
The resulting margin rates are different on a class-by-class basis and a month-by-
month basis due to the load characteristics of that class and how they interact with
the demand and energy savings associated with efficient measures. The margin rates
determined by the marginal rate analysis for each class are presented in the table below.
Table 7 – Margin Rate by Rate Class and Month17
Class RES SGS LGS SPS LPS
January $0.047932 $0.055465 $0.040577 $0.037934 $0.035142
February $0.049275 $0.057145 $0.042104 $0.038465 $0.038644
March $0.051036 $0.059875 $0.040102 $0.039216 $0.036980
April $0.054300 $0.063496 $0.044668 $0.040272 $0.037822
May $0.055689 $0.064725 $0.045172 $0.041036 $0.035885
June $0.110116 $0.096316 $0.084686 $0.077335 $0.068292
July $0.110116 $0.096316 $0.082404 $0.076574 $0.069570
August $0.110116 $0.096316 $0.082725 $0.076763 $0.069739
September $0.110116 $0.096316 $0.083956 $0.076766 $0.071286
October $0.051224 $0.061234 $0.043229 $0.039481 $0.037593
November $0.054640 $0.063391 $0.044236 $0.039680 $0.037617
December $0.051244 $0.060803 $0.042825 $0.039083 $0.036655
It should be noted that the various cases (i.e., 1%, 5%, and 10% reductions) produced
extremely similar results to each other, to the point of being immaterial in terms of the
differences. This indicates that regardless of the size of the impact of the energy efficient
measure, the margin rate is similar. With each general rate proceeding, the process
above will be repeated to produce updated margin rates to reflect the outcome of the
rate proceeding with regard to potential changes to items such as customer usage data,
demand and energy savings by end use category, underlying costs, and class rate
designs. Updated margin rates resulting from general rate proceedings will be updated
in Rider EEIC and used for throughput disincentive calculations from that point forward
until the results of the subsequent general rate proceeding.
17 If the Company's base rates change (e.g., due to tax reform or otherwise) before the Plan's programs commence, these margin rates will need to be updated to reflect a marginal rate analysis using the new base rates.
Ameren Missouri MEEIA 2019-24 Plan
Page 52
5.2.2 Throughput Disincentive Calculation for Rider EEIC
The throughput disincentive ("TD") calculation will largely follow the same procedure as
what is being used in MEEIA 2016-18 with the addition of Demand Response Event Net
Energy component that will be handled differently due to the short-term nature of the
savings associated with peak shaving events.
The first input required for the monthly throughput disincentive calculation is the kWh
savings by end-use category by rate class. Monthly load shapes by end-use category are
used to distribute types of energy savings (which are reported as annualized kWh
savings) across the months in the year to better reflect the seasonality of the savings that
were achieved. For example, the cooling category has most of its savings during the
summer months while the lighting category has savings spread out more evenly with an
increase in the winter months. The end-use categories and load shapes are detailed in
volume 1 of the TRM (Appendix G). The conversion to monthly savings data allows the
Company to determine current month energy savings18 as well as cumulative monthly
energy savings from prior month energy savings activities. As energy savings are
incorporated into base rates, the cumulative monthly savings are reduced to avoid double
counting. The process of including savings in base rates and rebasing the throughput
disincentive is discussed further below. Next, the savings are multiplied by a NTG factor.
Each program year will use an initially-assumed NTG of 0.85 until such time as a NTG
factor is determined through EM&V for that program year. Thereafter, for each given
program year, the NTG factor determined through EM&V will be used. This net monthly
savings (current month plus cumulative savings less savings included in base rates) by
rate class is then multiplied by the appropriate margin rate to arrive at the monthly dollar
value of throughput disincentive by rate class.
When base rates are adjusted, upon the conclusion of a general rate proceeding or
otherwise, the cumulative, annualized, and normalized (at a net-to-gross factor of 1.0)
kWh savings from all active MEEIA programs, except for Demand Response Event Net
Energy ("DRENE"), will be reflected in the unit sales and retail revenues used in setting
the rates through the rate case true-up period.19 In addition, the rate case test period
18 Current month savings are divided by 2 to reflect a "half-month" convention, which reflects the fact that not all measures were installed on day 1 of a month just as all measures were not installed on the last day of the month. 19 The Procedure for computing the MEEIA annualization adjustment for billing units is as follows:
Step 1: Begin with estimated actual hourly load per class; Step 2: Compute hourly weather normalized energy per class for Step 5; Step 3: Compute calendar month energy efficiency annualization adjustment based on the difference between the actual monthly energy efficiency savings realized and the annualized energy efficiency savings for each end-use measure category and rate class; Step 4: Compute hourly energy efficiency annualization adjustment by using the applicable end-use hourly shape for each measure category applied to the results of Step 3;
Ameren Missouri MEEIA 2019-24 Plan
Page 53
hourly loads used for fuel modeling will be adjusted to reflect the annualization of kWh for
MEEIA programs, except those listed above, using hourly end-use category load shapes.
Upon the adjustment for the kWh savings in the rate case, the throughput disincentive will
be rebased to subtract the kWh savings that are reflected in the billing units used to
establish new rates from the cumulative kWh savings when the rates take effect. The
rebasing adjustment will be applied for each program year vintage accordingly with the
relevant vintage portfolio-level net-to-gross factor.
DRENE savings resulting from a demand response event are treated differently than first
year savings from energy efficiency measures (including demand response annual
energy savings). The DRENE savings are for a specific period and would not be allocated
by load shape across the whole year. The savings also do not continue into any
subsequent months. All of the throughput disincentive is occurring within a month and will
be recovered within the same month. Any DRENE savings occurring in the test period
used to establish base rates will be added back to the observed loads in those periods
and the throughput disincentive associated with future DRENE savings will be recovered
through the DSIM.
5.3 Earnings Opportunity
By passing MEEIA, the state of Missouri adopted the policy of valuing demand-side
investments equal to traditional investments in supply and delivery infrastructure. In
support of this policy, the Commission provides utilities with timely earnings opportunities
associated with cost-effective efficiency savings. Furthermore, the Commission's
resource planning rules require the utility to consider and analyze demand-side
resources, renewable energy, and supply-side resources on an equivalent basis. The
utilities in the state of Missouri earn a return on investments they make in supply-side and
delivery resources. Therefore, utility decision-makers evaluate the earnings implications
of demand-side resources they would deploy, and unless demand-side resources are
afforded comparable earnings opportunities those resources would no longer be valued
on an equivalent basis with supply-side and/or delivery resources - circumstances that
MEEIA was explicitly designed and enacted to prevent.
5.3.1 Earnings Opportunity Payouts
Based upon an extensive analysis of forgone earnings and benchmarking to other
jurisdictions, the Company is proposing an annual average earnings opportunity of
approximately $19 million, which equates to a total of $115 million for the life of the Plan.
Step 5: Apply the hourly energy efficiency annualization adjustments from Step 4 to the hourly weather normalized energy from Step 2 (as adjusted for growth). The results of this step are to be used in the hourly loads used for fuel modeling; and Step 6: Convert calendar month energy efficiency annualization adjustments from Step 3 to billing month energy efficiency annualization adjustments by computing a weighted average of the calendar months based on billing cycle percentages
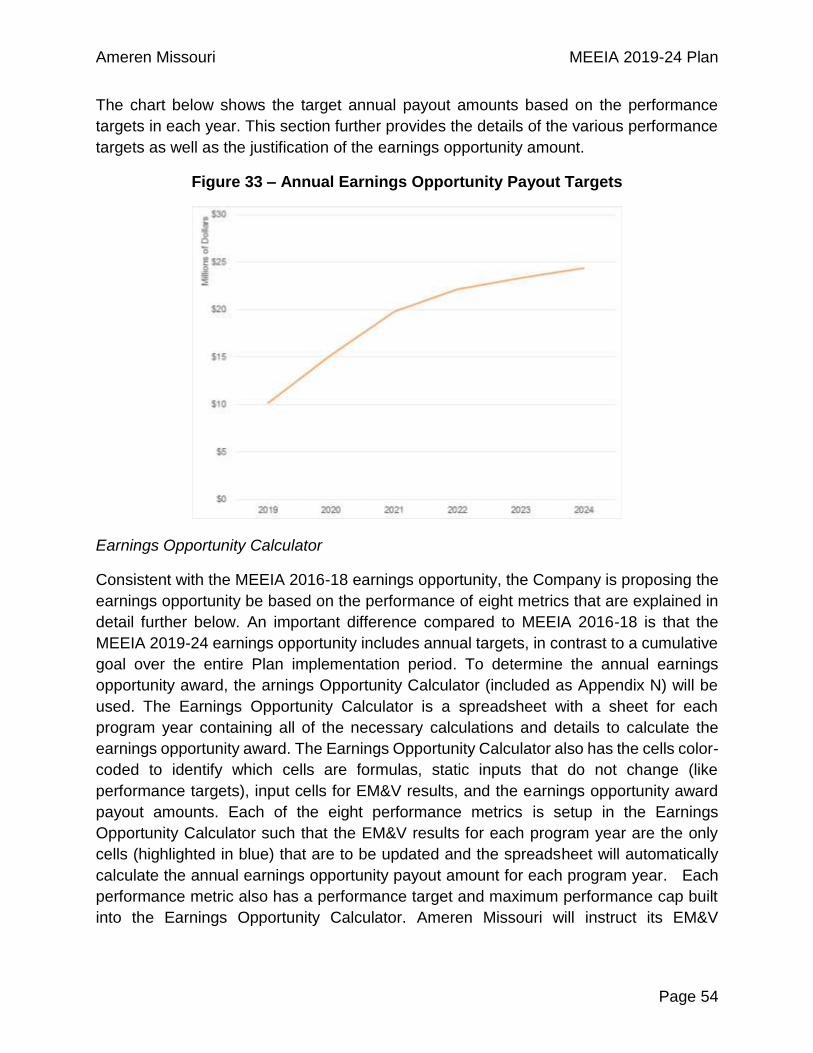
Ameren Missouri MEEIA 2019-24 Plan
Page 54
The chart below shows the target annual payout amounts based on the performance
targets in each year. This section further provides the details of the various performance
targets as well as the justification of the earnings opportunity amount.
Figure 33 – Annual Earnings Opportunity Payout Targets
Earnings Opportunity Calculator
Consistent with the MEEIA 2016-18 earnings opportunity, the Company is proposing the
earnings opportunity be based on the performance of eight metrics that are explained in
detail further below. An important difference compared to MEEIA 2016-18 is that the
MEEIA 2019-24 earnings opportunity includes annual targets, in contrast to a cumulative
goal over the entire Plan implementation period. To determine the annual earnings
opportunity award, the arnings Opportunity Calculator (included as Appendix N) will be
used. The Earnings Opportunity Calculator is a spreadsheet with a sheet for each
program year containing all of the necessary calculations and details to calculate the
earnings opportunity award. The Earnings Opportunity Calculator also has the cells color-
coded to identify which cells are formulas, static inputs that do not change (like
performance targets), input cells for EM&V results, and the earnings opportunity award
payout amounts. Each of the eight performance metrics is setup in the Earnings
Opportunity Calculator such that the EM&V results for each program year are the only
cells (highlighted in blue) that are to be updated and the spreadsheet will automatically
calculate the annual earnings opportunity payout amount for each program year. Each
performance metric also has a performance target and maximum performance cap built
into the Earnings Opportunity Calculator. Ameren Missouri will instruct its EM&V
Ameren Missouri MEEIA 2019-24 Plan
Page 55
contractor to include a separate section in a portfolio summary report with each input for
each performance metric in the Earnings Opportunity Calculator.
The eight metrics used in the earnings opportunities:
1) Average Percent Energy Savings Per Property for Multifamily Low-Income
Program;
2) Average Percent Energy Savings Per Property for Single Family Low-
Income Program;
3) Energy Savings of HER Program;
4) Energy Savings of Residential Lighting Program;
5) Subtotaled Portfolio Energy Savings for energy efficiency programs;
6) Subtotaled Coincident Peak Demand Savings from Measures <10 Year
Useful Life;
7) Subtotaled Coincident Peak Demand Savings from Measures ≥10 Year
Useful Life; and
8) Cumulative Demand Response Capability for demand response programs.
Inclusion of Throughput Disincentive True-up in the Annual Earnings Opportunity
After the completion of each program year, the EM&V schedule will be followed and those evaluated results will be input into the Earnings Opportunity Calculator. The Earnings Opportunity Calculator will determine the annual earnings opportunity award, which will be included in the subsequent Rider EEIC filing for recovery. Along with the annual determination of the earnings opportunity award, a true-up of the throughput disincentive will be determined for the program year based on the EM&V results compared to what was included in Rider EEIC as deemed savings. NTG will be trued-up at the portfolio level. The true-up amount (positive or negative) will be added to the annual earnings opportunity award amount subject to a floor of $0 per year. Program year vintages of throughput disincentive shall be tracked and trued-up separately until they are included in base rates.
Performance Metrics for Earnings Opportunity
Average Percent Energy Savings Per Property for Multifamily Low-Income Program
Rationale for Performance Metric: Provides incentives to pursue deeper savings per
property as well as a holistic assessment of the program's impact.
The annual Multifamily Low-Income Program performance metric consists of two main
elements. First is a threshold criterion that ensures at least 85% of the Commission-
approved annual budget (administrative cost plus customer incentive cost) for the
program year in question is spent. Each program year's budget, along with the calculation
of the 85% threshold, has already been included in the Earnings Opportunity Calculator
and will not change. The only input needed for this metric is the actual spend for each
Ameren Missouri MEEIA 2019-24 Plan
Page 56
program year to compare to the 85% threshold budget. That actual spend will be reported
directly out of the Company's accounting system and included in the EM&V report. If the
Company's actual spend on the Multifamily Low-Income Program is less than the 85%
threshold amount, then the Company is eligible for 0% of the earnings opportunity award
for that specific performance metric for that program year. Otherwise, the Company is
elgible for 100% of the earnings opportunity award amount subject to its performance in
the second main element: Average Percent Energy Savings Per Property.
The Average Percent Energy Savings Per Property will be calculated as the total
Multifamily Low-Income Program's evaluated energy savings for the program year divided
by the total billed energy consumption for all of the properties served during that program
year. The total billed energy consumption for all of the properties will be the billed
consumption for each property covering 12 months prior to the month the property
participated in the program, as reported in the Company's billing system. A property is
defined as a multi-unit dwelling sharing the same address. For each program year, the
EM&V report will report the Mutlifamily Low-Income Program's evaluated energy savings
and the 12-month total billed energy consumption for use as inputs into the Earnings
Opportunity Calculator. This performance metric has an annual cap of 130% performance
compared to the annual target.
Average Percent Savings Per Property for Single Family Low-Income Program
Rationale for Performance Metric: Provides incentive to pursue deeper savings per
property as well as a holistic assessment of the program's impact.
The annual Single Family Low-Income Program performance metric consists of two main
elements. First is a threshold criterion that at least 85% of the Commission-approved
annual budget (administrative cost plus customer incentive cost less the cost of Low-
Income Efficiency Housing Grants) for the program year in question is spent. Each
program year's budget, along with the calculation of the 85% threshold, has already been
included in the Earnings Opportunity Calculator and will not change. The only input
needed for this metric is the actual spend for each program year to compare to the 85%
threshold budget. That actual spend will be reported directly out of the Company's
accounting system and included in the EM&V report. If the Company's actual spend on
the Single Family Low-Income Program is less than the 85% threshold amount, then the
Company is eligible for 0% of the earnings opportunity award on that specific performance
metric for that program year. Otherwise, the Company is elgible for 100% of the earnings
opportunity award amount subject to its performance in the second main element:
Average Percent Energy Savings Per Property.
The Average Percent Energy Savings Per Property will be calculated as the total Single
Family Low-Income Program's evaluated energy savings (less the Low-Income Efficiency
Housing Grants) for the program year divided by the total billed energy consumption for
Ameren Missouri MEEIA 2019-24 Plan
Page 57
all of the properties served during that program year. The total billed energy consumption
for all of the properties will be the billed consumption for each property covering 12
months prior to the month the property participated in the program as reported in the
Company's billing system. A property is defined as the single dwelling at an address. For
each program year, the EM&V report will report the Single Family Low-Income Program's
evaluated energy savings (less the Low-Income Efficiency Housing Grants) and the 12-
month total billed energy consumption for use as inputs into the Earnings Opportunity
Calculator. This performance metric has an annual cap of 130% performance compared
to the annual target.
Energy Savings of Home Energy Report Program
Rationale for Performance Metric: Provides incentives for ongoing intervention to produce
repeatable annual savings from participants.
The performance metric for the HER will be the MWh energy savings reported in the
EM&V report (not incremental savings). The reported energy savings for each program
year will be input into the Earnings Opportunity Calculator to determine the earnings
opportunity award amount for this performance metric. This performance metric has an
annual cap of 130% performance compared to the annual target.
Energy Savings of Residential Lighting Program
Rationale for Performance Metric: Provides incentives for cost-effective lighting upgrades
and reflects the uncertainty in the residential lighting market by allowing the pursuit of
low cost upgrades for customers without allowing the residential lighting performance to
drive overall performance of the energy efficiency portfolio.
The performance metric for the Residential Lighting Program will be the first-year
incremental MWh energy savings reported in the EM&V report. The reported energy
savings for each program year will be input into the Earnings Opportunity Calculator to
determine the earnings opportunity award amount for this performance metric. This
performance metric has an annual cap of 130% performance compared to the annual
target.
Subtotaled Portfolio Energy Savings
Rationale for Performance Metric: Provides incentives for energy savings from qualifying
energy efficiency programs. Energy savings have an important impact on future
renewable resource requirements and therefore provide significant value to all customers.
The performance metric for the Energy Efficiency Energy Savings will be the first-year
incremental MWh energy savings reported in the EM&V report. The residential low-
Ameren Missouri MEEIA 2019-24 Plan
Page 58
income programs, HER Program, Residential Lighting Program, and DR energy savings
will be excluded from the energy savings for this performance metric. The EM&V report
will include a subtotal of portfolio energy savings matching the definition of this
performance metric for each program year and that subtotal will be input into the Earnings
Opportunity Calculator to determine the earnings opportunity award amount for this
performance metric. This performance metric has an annual cap of 150% performance
compared to the annual target.
Subtotaled Coincident Peak Demand Savings from Measures <10 Year Useful Life
Rationale for Performance Metric: Provices incentives to achieve coincident peak
demand savings recognizing that even relatively shorter-lived measures can impact near-
term investments in supply-side resource needs like investments in transmission and
distribution infrastructure. The payout per MW saved is lower than that for longer-life
savings in the category below.
The performance metric for this performance measure will be the first-year incremental
MW coincident peak demand savings determined by multiplying the energy savings by
the relevant measure category energy-to-peak-demand-conversion-factor specified in the
TRM/Deemed Savings Table and will be reported in the EM&V report. Consistent with the
Subtotaled Portfolio Energy Savings performance metric, the Residential Low-Income
Programs, HER Program, Residential Lighting Program, and DR energy savings will be
excluded from this performance metric. Only measures with an effective useful life of
fewer than 10 years will be included in this metric. The EM&V report will include a subtotal
of portfolio coincident peak demand savings matching the definition of this performance
metric for each program year and that subtotal will be input into the Earnings Opportunity
Calculator to determine the earnings opportunity award amount for this performance
metric. This performance metric has an annual cap of 130% performance compared to
the annual target.
Subtotaled Coincident Peak Demand Savings from Measures ≥10 Year Useful Life
Rationale for Performance Metric: Provides incentives for coincident peak demand
savings, recognizing that longer-lived measures' peak demand savings are more likely to
contribute to deferral of large supply-side generation investments in the future. The
payout per MW saved is higher than that for shorter-life savings in the category above.
The performance metric for this performance measure will be the first-year incremental
MW coincident peak demand savings determined by multiplying the MWh energy savings
by the relevant measure category energy-to-peak-demand-conversion-factor specified in
the TRM/Deemed Savings Table and will be reported in the EM&V report. Consistent with
the Subtotaled Portfolio Energy Savings performance metric, the Residential Low-Income

Ameren Missouri MEEIA 2019-24 Plan
Page 59
Programs, HER Program, Residential Lighting Program, and DR energy savings will be
excluded from the energy savings for this performance metric. Only measures with an
effective useful life of 10 or more years will be included in this metric. The EM&V report
will include a subtotal of portfolio coincident peak demand savings matching the definition
of this performance metric for each program year and that subtotal will be input into the
Earnings Opportunity Calculator to determine the earnings opportunity award amount for
this performance metric. This performance metric has an annual cap of 150%
performance compared to the annual target.
Cumulative Demand Response Capability
Rationale for Performance Metric: Provides incentives for peak demand savings as well
as the retention of the demand response capability over the implementation period.
This performance metric will be based on the cumulative MW demand response capability
at the end of each program year. First, demand response savings will be measured during
the peak events called each program year. Then those savings will be adjusted to reflect
normal weather for peak conditions. Finally, peak demand savings will be adjusted to
reflect enrollments through the end of the program year. For Residential DR, the
cumulative demand response capability in each year will be the normalized average peak
savings per participant multiplied by the number of participants enrolled at the end of the
program year. For Business DR, the cumulative demand response capability will be the
evaluated MW from customers enrolled during each year's summer peak events plus
tested20 MW from new enrollees after the summer event period but before the end of the
program year. The cumulative DR capability will be reported each year in the EM&V
report. The reported cumulative MW capability for each program year will be input into
the Earnings Opportunity Calculator to determine the earnings opportunity award amount
for this performance metric. This performance metric has an annual cap of 130%
performance compared to the annual target.
5.3.2 Forgone Earnings Analysis
There are at least three separate sources of earnings Ameren Missouri would forgo by
implementing its proposed 2019-24 MEEIA portfolio:
1) Forgone renewable generation earnings associated with Renewable Energy
Standard ("RES") compliance resource additions;
2) Forgone earnings from deferred supply-side resources – natural gas-fired
Combined Cycles ("CC") in the case of Ameren Missouri's contingency plan; and
20 Tested MWs will be determined by simulating a 1 hour event for a new participant. A 2 week window will be scheduled in which the test event will occur. The parameters for the event will be the same as if it were a real DR event. The notification, the baseline, the expectation of the participant's performance, and the evaluation of the participant's performance will be as if it were a real event.
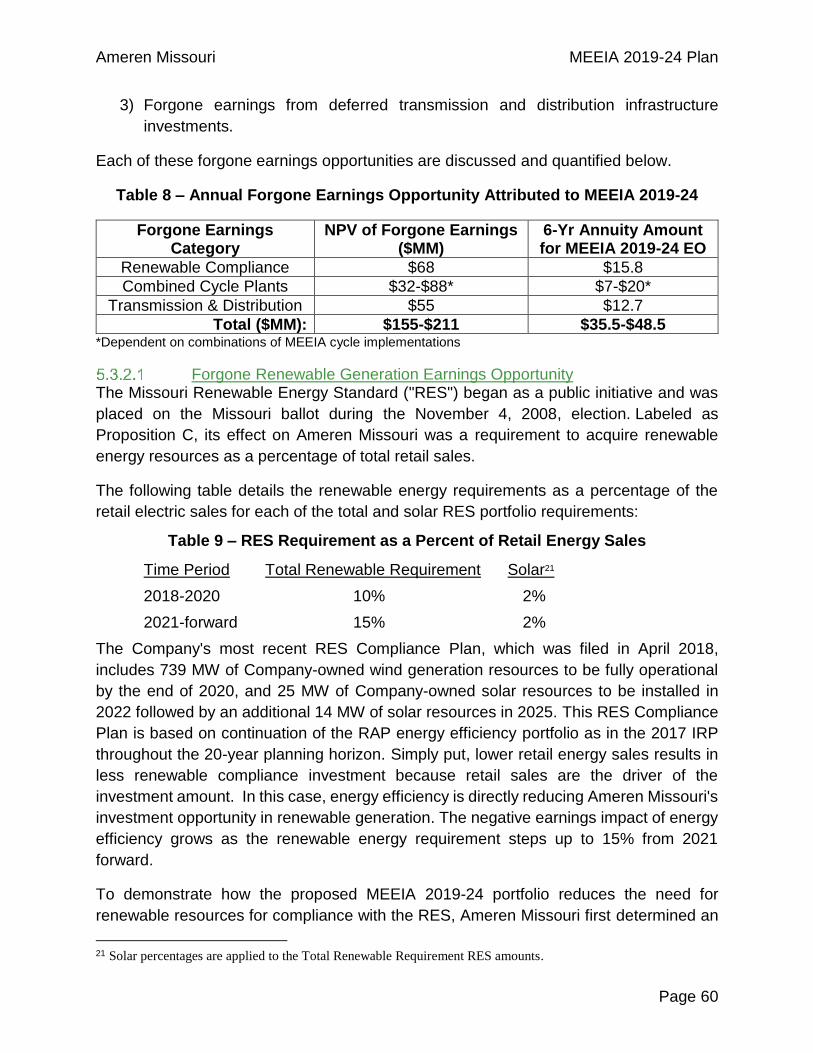
Ameren Missouri MEEIA 2019-24 Plan
Page 60
3) Forgone earnings from deferred transmission and distribution infrastructure
investments.
Each of these forgone earnings opportunities are discussed and quantified below.
Table 8 – Annual Forgone Earnings Opportunity Attributed to MEEIA 2019-24
Forgone Earnings Category
NPV of Forgone Earnings ($MM)
6-Yr Annuity Amount for MEEIA 2019-24 EO
Renewable Compliance $68 $15.8
Combined Cycle Plants $32-$88* $7-$20*
Transmission & Distribution $55 $12.7
Total ($MM): $155-$211 $35.5-$48.5 *Dependent on combinations of MEEIA cycle implementations
Forgone Renewable Generation Earnings Opportunity The Missouri Renewable Energy Standard ("RES") began as a public initiative and was
placed on the Missouri ballot during the November 4, 2008, election. Labeled as
Proposition C, its effect on Ameren Missouri was a requirement to acquire renewable
energy resources as a percentage of total retail sales.
The following table details the renewable energy requirements as a percentage of the
retail electric sales for each of the total and solar RES portfolio requirements:
Table 9 – RES Requirement as a Percent of Retail Energy Sales
Time Period Total Renewable Requirement Solar21
2018-2020 10% 2%
2021-forward 15% 2%
The Company's most recent RES Compliance Plan, which was filed in April 2018,
includes 739 MW of Company-owned wind generation resources to be fully operational
by the end of 2020, and 25 MW of Company-owned solar resources to be installed in
2022 followed by an additional 14 MW of solar resources in 2025. This RES Compliance
Plan is based on continuation of the RAP energy efficiency portfolio as in the 2017 IRP
throughout the 20-year planning horizon. Simply put, lower retail energy sales results in
less renewable compliance investment because retail sales are the driver of the
investment amount. In this case, energy efficiency is directly reducing Ameren Missouri's
investment opportunity in renewable generation. The negative earnings impact of energy
efficiency grows as the renewable energy requirement steps up to 15% from 2021
forward.
To demonstrate how the proposed MEEIA 2019-24 portfolio reduces the need for
renewable resources for compliance with the RES, Ameren Missouri first determined an
21 Solar percentages are applied to the Total Renewable Requirement RES amounts.

Ameren Missouri MEEIA 2019-24 Plan
Page 61
updated compliance plan with the recently finalized energy savings targets for MEEIA
2019-24 versus those included in the 2017 IRP. With the updated MEEIA 2019-24 energy
savings, the RES compliance model resulted in the need for 737 MW of wind and a total
of 40 MW of solar resources.
The Company then generated another RES compliance plan assuming MEEIA 2019-24
was skipped and energy efficiency programs began again in 2025. This hypothetical RES
compliance plan showed that, given the increase in customer energy usage due to a lack
of programs without MEEIA 2019-24, Ameren Missouri would need to include 811 MW of
Company-owned wind generation to be fully operational by the end of 2020, 25 MW of
Company-owned solar generation to be installed in 2022, and an additional 16 MW of
solar generation in 2025.
In other words, the proposed MEEIA 2019-24 portfolio results in avoiding 74 MW of wind
and 1 MW of solar generation resources, which in total reduces Ameren Missouri's NPV
of after-tax earnings opportunity by $68 million. The annuity in order to eliminate
disincentive of forgone earnings for the Company from deployment of DSM programs
would be $15.8 million.
This analysis highlights the importance and the urgency of energy savings as the
renewable energy requirements as a percentage of the retail electric sales will be going
up in 2021.
Forgone Combined Cycle Earnings Opportunity IRP Analysis
The Company's IRP filing provides useful comparisons of demand-side and supply-side
resource earnings opportunities. Ameren Missouri filed its 2017 IRP on September 25,
2017. In that filing, Ameren Missouri communicated its preferred plan, which includes
RAP-level energy efficiency and demand response programs throughout the planning
horizon, provided that the constructive regulatory treatment for DSM continues and utility
incentives are aligned with helping customers use energy more efficiently as required by
the MEEIA.
In its IRP filing, Ameren Missouri also selected a contingency plan in the event the
requirements of MEEIA are not met. In this contingency plan, there are no additional
demand-side programs after the completion of MEEIA 2016-18, and Ameren Missouri
would need to construct three CC plants during the 20-year planning horizon to meet its
capacity needs. The first CC would be needed in 2034, and the second and third CCs
both would be needed in 2037. The IRP analysis showed that RAP DSM would defer the
need for these CCs to 2044, 2049 and 2055. Clearly, the NPV of earnings with the much
delayed CCs would be significantly lower than the NPV of earnings for the no-DSM
contingency plan. Ameren Missouri estimated an annuity for the RAP DSM plan so that it
Ameren Missouri MEEIA 2019-24 Plan
Page 62
can generate earnings equal to the NPV of earnings that earlier deployment of CCs
generate in the contingency plan with no DSM. The analysis indicated that, in order to
make up for the forgone earnings from the deferred CCs, the RAP DSM would need to
have an after-tax earnings annuity of $36.1 million (as tax rates changed, the annuity
would need to be $31.1 million).
Since filing its 2017 IRP, Ameren Missouri updated its IRP analysis using its the MEEIA
2019-24 portfolio savings reflected in the plan. The timing of the CCs in the updated RAP
portfolio plan changed very slightly with the deferral of the CC in 2034 to 2044, and the
two CCs in 2037 to 2049 and 2054 (instead of 2055). The estimated annuity in order to
eliminate the disincentive of forgone earnings for the utility from deployment of demand-
side programs would be $30.65 according to this updated analysis (quite close in the
earlier calculation $31.1 million). This analysis assumes all MEEIA plans within the full
planning horizon are equally compensated for long-term forgone earnings opportunity.
MEEIA Plan Synergies
As stated above, Ameren Missouri selected a preferred plan that includes continued
deployment of demand-side resources throughout the planning horizon (through 2037)
where three CCs are deferred for many years. There is no doubt that the continued and
uninterrupted deployment of demand-side programs and the combined effect from all the
cycles is necessary achieve major deferrals of supply-side resources, as discussed
further below.
As a screening analysis, Ameren Missouri analyzed the impact of 3-year MEEIA plan
cycle by breaking its proposed 6-year plan into two 3-year periods. This demonstrated
that neither 3-year implementation (MEEIA 2019-21 or MEEIA 2022-24) period by itself
would result in any deferral of a new supply-side resource; in contrast, the 6-year
implementation period does impact future supply-side resource timing. This preliminary
screening analysis itself illustrates the value of an extended 6-year plan rather than two
3-year plans.
To further illustrate the importance of the continuation of demand-side programs, Ameren
Missouri also analyzed combinations of implementation cycles,22 e.g., implement Cycle 3
and no more demand-side programs afterwards, or implement Cycle 4 and no demand-
side programs before and after, or Cycles 4 and 5 alone, or Cycles 4, 5, and 6 without
implementing Cycle 3. All of these different cycle combinations demonstrated that
deployment of demand-side resources without interruption is the most effective way to
achieve deferrals of new supply-side resources further into the future because skipping
even one cycle results in the need of a CC earlier than what the need would be with all
22 Cycle 3: MEEIA 2019-24, Cycle 4: 2025-30, Cycle 5: 2031-36, Cycle 6:2037.
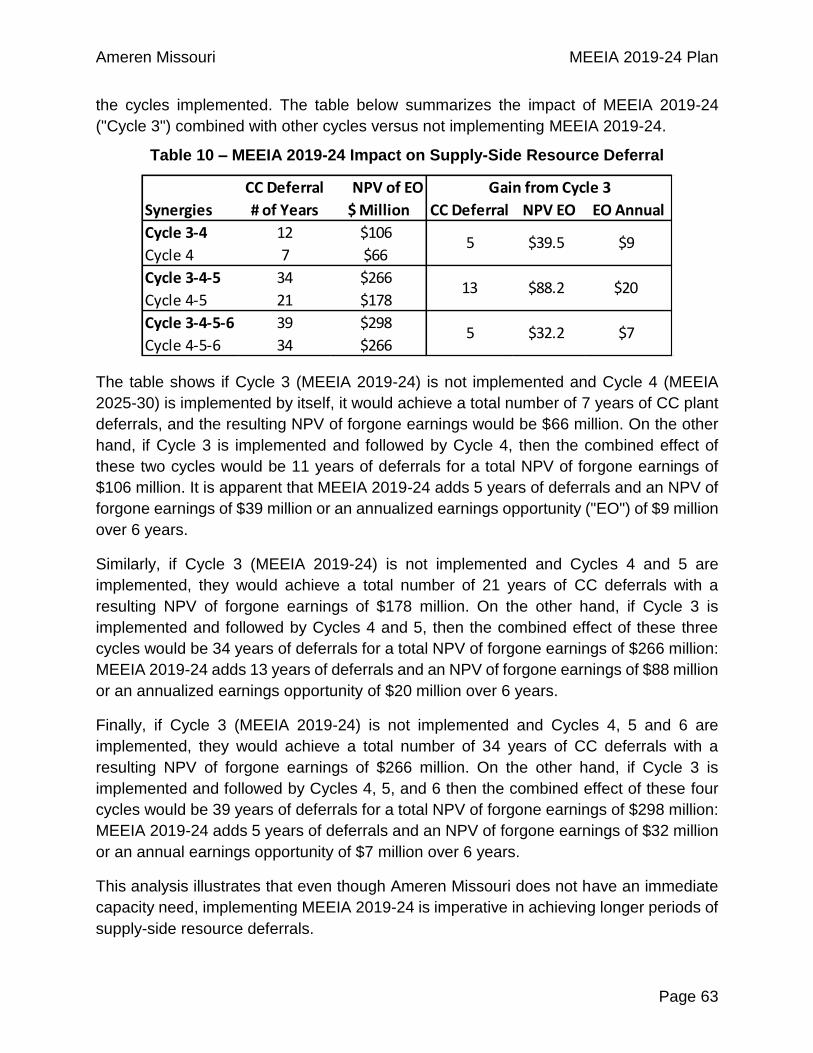
Ameren Missouri MEEIA 2019-24 Plan
Page 63
the cycles implemented. The table below summarizes the impact of MEEIA 2019-24
("Cycle 3") combined with other cycles versus not implementing MEEIA 2019-24.
Table 10 – MEEIA 2019-24 Impact on Supply-Side Resource Deferral
The table shows if Cycle 3 (MEEIA 2019-24) is not implemented and Cycle 4 (MEEIA
2025-30) is implemented by itself, it would achieve a total number of 7 years of CC plant
deferrals, and the resulting NPV of forgone earnings would be $66 million. On the other
hand, if Cycle 3 is implemented and followed by Cycle 4, then the combined effect of
these two cycles would be 11 years of deferrals for a total NPV of forgone earnings of
$106 million. It is apparent that MEEIA 2019-24 adds 5 years of deferrals and an NPV of
forgone earnings of $39 million or an annualized earnings opportunity ("EO") of $9 million
over 6 years.
Similarly, if Cycle 3 (MEEIA 2019-24) is not implemented and Cycles 4 and 5 are
implemented, they would achieve a total number of 21 years of CC deferrals with a
resulting NPV of forgone earnings of $178 million. On the other hand, if Cycle 3 is
implemented and followed by Cycles 4 and 5, then the combined effect of these three
cycles would be 34 years of deferrals for a total NPV of forgone earnings of $266 million:
MEEIA 2019-24 adds 13 years of deferrals and an NPV of forgone earnings of $88 million
or an annualized earnings opportunity of $20 million over 6 years.
Finally, if Cycle 3 (MEEIA 2019-24) is not implemented and Cycles 4, 5 and 6 are
implemented, they would achieve a total number of 34 years of CC deferrals with a
resulting NPV of forgone earnings of $266 million. On the other hand, if Cycle 3 is
implemented and followed by Cycles 4, 5, and 6 then the combined effect of these four
cycles would be 39 years of deferrals for a total NPV of forgone earnings of $298 million:
MEEIA 2019-24 adds 5 years of deferrals and an NPV of forgone earnings of $32 million
or an annual earnings opportunity of $7 million over 6 years.
This analysis illustrates that even though Ameren Missouri does not have an immediate
capacity need, implementing MEEIA 2019-24 is imperative in achieving longer periods of
supply-side resource deferrals.
CC Deferral NPV of EO
Synergies # of Years $ Million CC Deferral NPV EO EO Annual
Cycle 3-4 12 $106
Cycle 4 7 $66
Cycle 3-4-5 34 $266
Cycle 4-5 21 $178
Cycle 3-4-5-6 39 $298
Cycle 4-5-6 34 $266
5
5 $32.2 $7
$39.5
Gain from Cycle 3
$9
13 $88.2 $20
Ameren Missouri MEEIA 2019-24 Plan
Page 64
Forgone Transmission and Distribution Earnings Opportunity It is common industry practice to include avoided transmission and distribution ("T&D")
costs in the cost-effectiveness tests for demand-side resources as these resources defer
investments in delivery infrastructure. In fact, avoided T&D costs are required by the
Commission's IRP rules. Accordingly, when calculating the revenue requirements for the
various alternative resource plans, Ameren Missouri includes reduced T&D capital
expenditures associated with the alternative resource plans that include DSM portfolios.
The 2017 IRP filing showed that the Company's preferred plan, which includes
continuation of RAP DSM programs, results in a reduction of $116 million of pre-tax
earnings (net present value) from avoided T&D investments.
Ameren Missouri analyzed the impact of deferred investments in delivery infrastructure
on its earnings directly attributable to the proposed MEEIA 2019-24 portfolio by isolating
those effects from the IRP modeling. The analysis demonstrates that MEEIA 2019-24
reduces the NPV of after-tax earnings of Ameren Missouri by $55 million. The annuity to
make up for the lost earnings opportunity would be $12.7 million over 6 years.
Unless the Company is given a comparable earnings opportunity for the DSM resources
it deploys, Ameren Missouri will be giving up the opportunity to grow its earnings over
time not just by the deferred supply-side resources, but also by the deferred delivery
infrastructure resources.
5.3.3 Earnings Opportunity Benchmarking
The IRP analysis described above demonstrates forgone utility earnings opportunity are
material and observable, indicating a $35.5-$48.5 million annual earnings opportunity
would allow utility decision makers to value demand-side resources equally to supply
side. Benchmarking results from other states confirm the reasonableness of the earnings
opportunity reflected in the Plan given the calculated forgone earnings the Plan produces.
In an Institute for Electric Innovations ("IEI") report titled, “Energy Efficiency Trends in
Electric Power Industry,” published in December 2017, there is a comprehensive review
of shareholder incentive mechanisms offered in various states around the country. More
than 30 states have regulatory frameworks that support electric company investments in
energy efficiency. Some of those incentives described in the IEI report are reported in
terms of absolute dollars of incentives allowed. Since utilities generally, and their energy
efficiency portfolios specifically may be of significantly different sizes, comparing absolute
dollars of incentives is of little use. However, many state incentive programs are related
in terms of either the percent of program costs that a utility may earn as an incentive, a
percent of benefits the utility may earn, or in terms of a $/kWh incentive that may be
earned. Each of these metrics may be useful for comparing across utilities. Below is a
table comparing sample states as well as prior MEEIA experience to the MEEIA 2019-24
proposed earnings opportunity amounts. While the IRP forgone earnings analysis
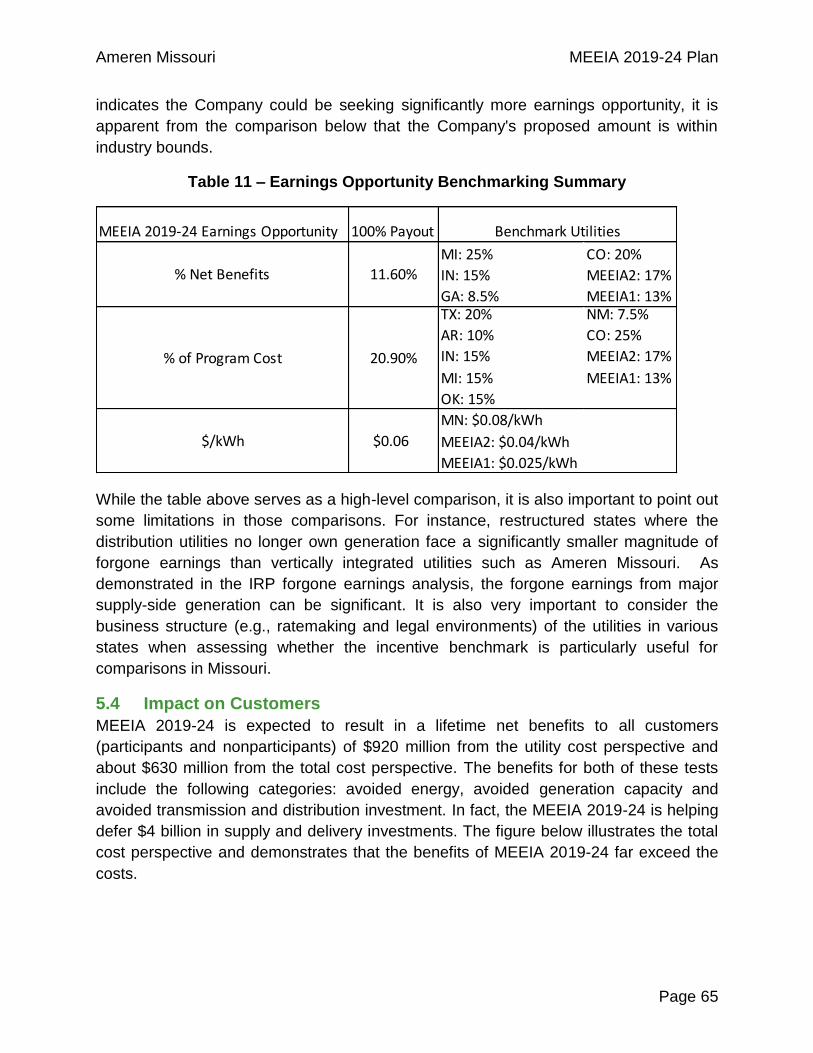
Ameren Missouri MEEIA 2019-24 Plan
Page 65
indicates the Company could be seeking significantly more earnings opportunity, it is
apparent from the comparison below that the Company's proposed amount is within
industry bounds.
Table 11 – Earnings Opportunity Benchmarking Summary
While the table above serves as a high-level comparison, it is also important to point out
some limitations in those comparisons. For instance, restructured states where the
distribution utilities no longer own generation face a significantly smaller magnitude of
forgone earnings than vertically integrated utilities such as Ameren Missouri. As
demonstrated in the IRP forgone earnings analysis, the forgone earnings from major
supply-side generation can be significant. It is also very important to consider the
business structure (e.g., ratemaking and legal environments) of the utilities in various
states when assessing whether the incentive benchmark is particularly useful for
comparisons in Missouri.
5.4 Impact on Customers
MEEIA 2019-24 is expected to result in a lifetime net benefits to all customers
(participants and nonparticipants) of $920 million from the utility cost perspective and
about $630 million from the total cost perspective. The benefits for both of these tests
include the following categories: avoided energy, avoided generation capacity and
avoided transmission and distribution investment. In fact, the MEEIA 2019-24 is helping
defer $4 billion in supply and delivery investments. The figure below illustrates the total
cost perspective and demonstrates that the benefits of MEEIA 2019-24 far exceed the
costs.
MEEIA 2019-24 Earnings Opportunity 100% Payout
MI: 25% CO: 20%
IN: 15% MEEIA2: 17%
GA: 8.5% MEEIA1: 13%TX: 20% NM: 7.5%
AR: 10% CO: 25%
IN: 15% MEEIA2: 17%
MI: 15% MEEIA1: 13%
OK: 15%
MN: $0.08/kWh
MEEIA2: $0.04/kWh
MEEIA1: $0.025/kWh
Benchmark Utilities
% Net Benefits 11.60%
% of Program Cost 20.90%
$/kWh $0.06

Ameren Missouri MEEIA 2019-24 Plan
Page 66
Figure 34 – TRC Cost-Effectiveness Results
It is important to note that the figure above does not include the throughput disincentive
or the throughput disincentive recovery. As a practical matter, the throughput disincentive
is a subset of "lost revenues" that are included in the Ratepayer Impact Measure ("RIM")
cost-effectiveness test. In short, the throughput disincentive represents the amount of
"lost revenue" from the RIM test that is in between rate cases while the RIM test assumes
perfect ratemaking (i.e., that utility costs and revenues automatically balance out). The
"lost revenues" in the RIM test are the same amount as the "bill savings" from the
participant cost test. The TRC and UCT do not include "lost revenues" because they are
not incremental costs to demand-side resources and are a transfer payment between
customers.
The figure below shows the annual and cumulative costs and benefits of MEEIA 2019-
24. It is apparent from the figure below that the costs of the programs are borne by
customers up front, consistent with MEEIA's requirement for timely cost recovery, but
benefits continue to accrue for a long period of time following the end of the program
implementation. The benefits surpass the costs in total magnitude in 2026, and continue
to grow for the useful lives of the installed measures.
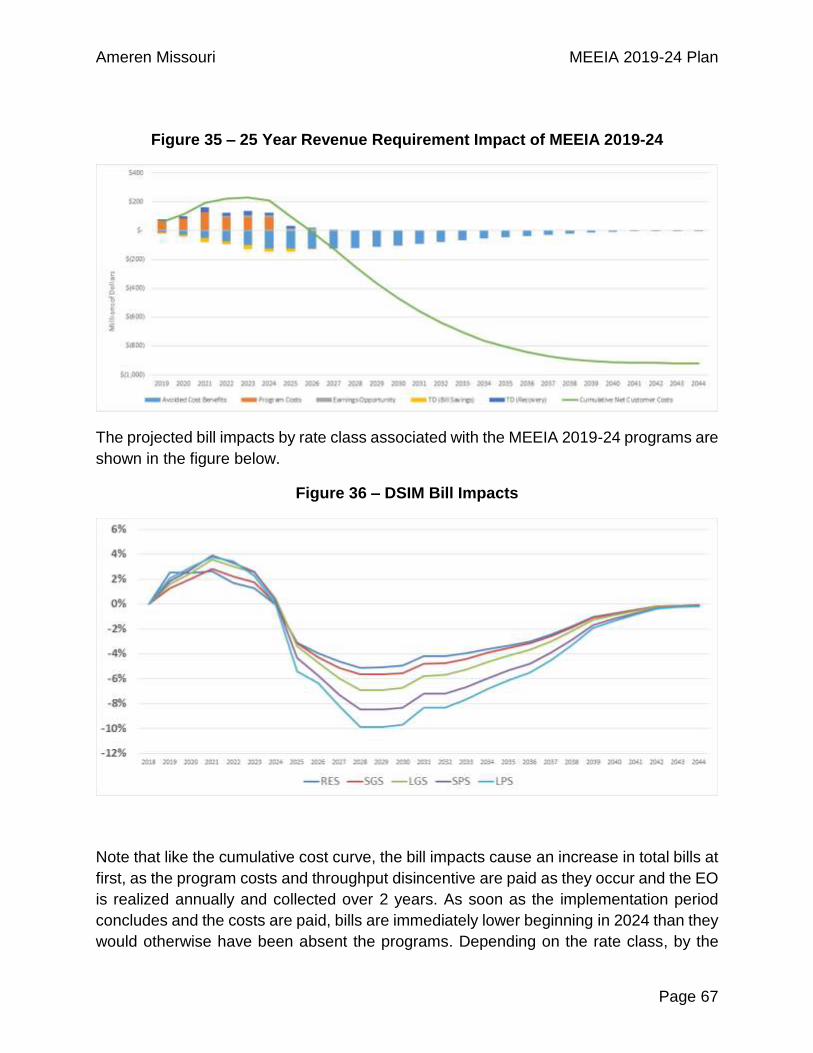
Ameren Missouri MEEIA 2019-24 Plan
Page 67
Figure 35 – 25 Year Revenue Requirement Impact of MEEIA 2019-24
The projected bill impacts by rate class associated with the MEEIA 2019-24 programs are
shown in the figure below.
Figure 36 – DSIM Bill Impacts
Note that like the cumulative cost curve, the bill impacts cause an increase in total bills at
first, as the program costs and throughput disincentive are paid as they occur and the EO
is realized annually and collected over 2 years. As soon as the implementation period
concludes and the costs are paid, bills are immediately lower beginning in 2024 than they
would otherwise have been absent the programs. Depending on the rate class, by the
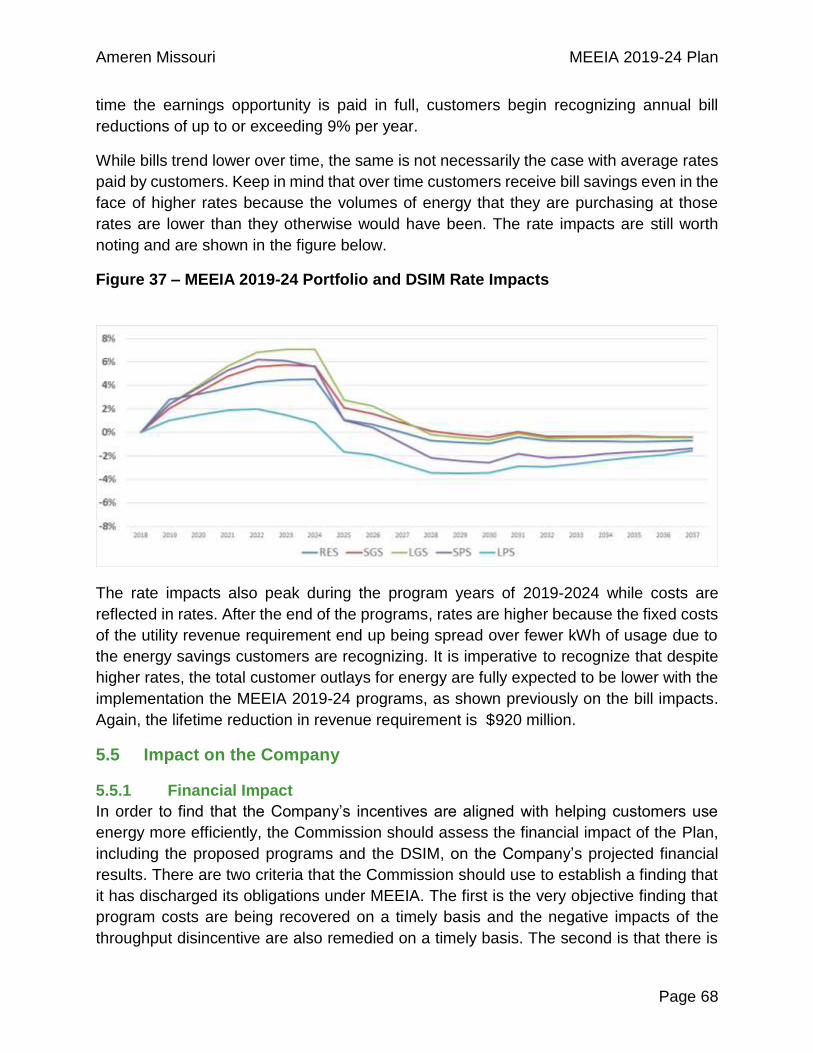
Ameren Missouri MEEIA 2019-24 Plan
Page 68
time the earnings opportunity is paid in full, customers begin recognizing annual bill
reductions of up to or exceeding 9% per year.
While bills trend lower over time, the same is not necessarily the case with average rates
paid by customers. Keep in mind that over time customers receive bill savings even in the
face of higher rates because the volumes of energy that they are purchasing at those
rates are lower than they otherwise would have been. The rate impacts are still worth
noting and are shown in the figure below.
Figure 37 – MEEIA 2019-24 Portfolio and DSIM Rate Impacts
The rate impacts also peak during the program years of 2019-2024 while costs are
reflected in rates. After the end of the programs, rates are higher because the fixed costs
of the utility revenue requirement end up being spread over fewer kWh of usage due to
the energy savings customers are recognizing. It is imperative to recognize that despite
higher rates, the total customer outlays for energy are fully expected to be lower with the
implementation the MEEIA 2019-24 programs, as shown previously on the bill impacts.
Again, the lifetime reduction in revenue requirement is $920 million.
5.5 Impact on the Company
5.5.1 Financial Impact
In order to find that the Company’s incentives are aligned with helping customers use
energy more efficiently, the Commission should assess the financial impact of the Plan,
including the proposed programs and the DSIM, on the Company’s projected financial
results. There are two criteria that the Commission should use to establish a finding that
it has discharged its obligations under MEEIA. The first is the very objective finding that
program costs are being recovered on a timely basis and the negative impacts of the
throughput disincentive are also remedied on a timely basis. The second is that there is
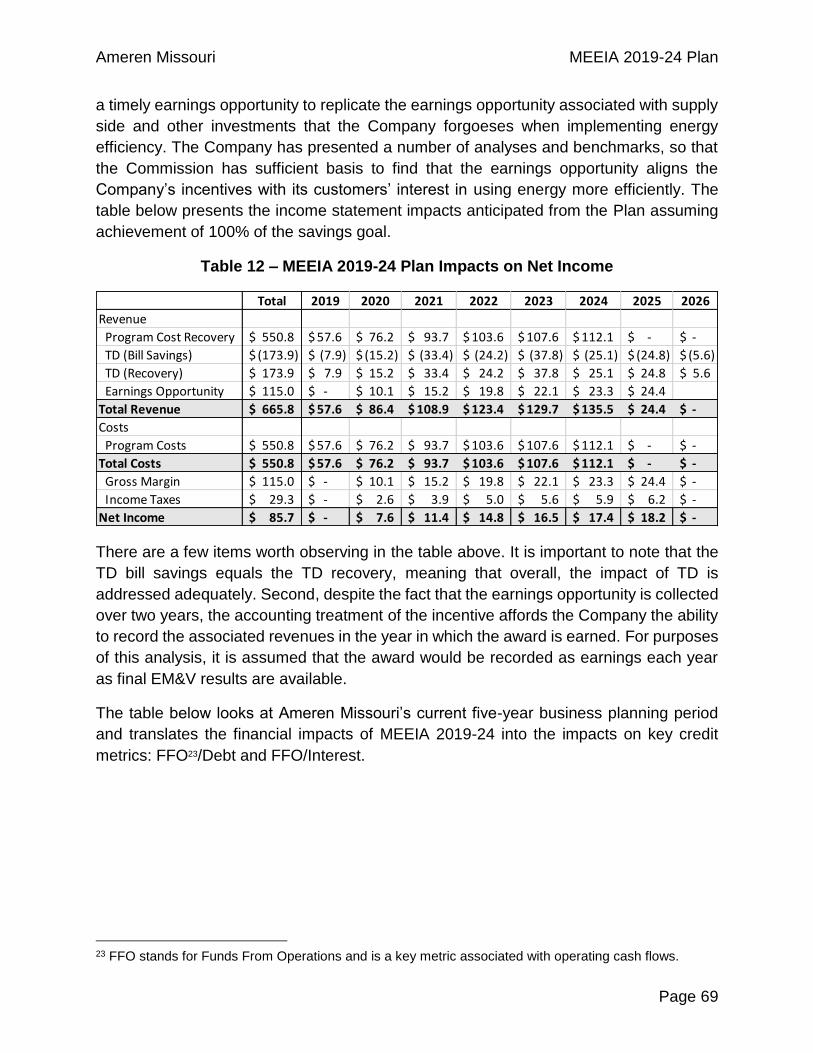
Ameren Missouri MEEIA 2019-24 Plan
Page 69
a timely earnings opportunity to replicate the earnings opportunity associated with supply
side and other investments that the Company forgoeses when implementing energy
efficiency. The Company has presented a number of analyses and benchmarks, so that
the Commission has sufficient basis to find that the earnings opportunity aligns the
Company’s incentives with its customers’ interest in using energy more efficiently. The
table below presents the income statement impacts anticipated from the Plan assuming
achievement of 100% of the savings goal.
Table 12 – MEEIA 2019-24 Plan Impacts on Net Income
There are a few items worth observing in the table above. It is important to note that the
TD bill savings equals the TD recovery, meaning that overall, the impact of TD is
addressed adequately. Second, despite the fact that the earnings opportunity is collected
over two years, the accounting treatment of the incentive affords the Company the ability
to record the associated revenues in the year in which the award is earned. For purposes
of this analysis, it is assumed that the award would be recorded as earnings each year
as final EM&V results are available.
The table below looks at Ameren Missouri’s current five-year business planning period
and translates the financial impacts of MEEIA 2019-24 into the impacts on key credit
metrics: FFO23/Debt and FFO/Interest.
23 FFO stands for Funds From Operations and is a key metric associated with operating cash flows.
Total 2019 2020 2021 2022 2023 2024 2025 2026
Revenue
Program Cost Recovery 550.8$ 57.6$ 76.2$ 93.7$ 103.6$ 107.6$ 112.1$ -$ -$
TD (Bill Savings) (173.9)$ (7.9)$ (15.2)$ (33.4)$ (24.2)$ (37.8)$ (25.1)$ (24.8)$ (5.6)$
TD (Recovery) 173.9$ 7.9$ 15.2$ 33.4$ 24.2$ 37.8$ 25.1$ 24.8$ 5.6$
Earnings Opportunity 115.0$ -$ 10.1$ 15.2$ 19.8$ 22.1$ 23.3$ 24.4$
Total Revenue 665.8$ 57.6$ 86.4$ 108.9$ 123.4$ 129.7$ 135.5$ 24.4$ -$
Costs
Program Costs 550.8$ 57.6$ 76.2$ 93.7$ 103.6$ 107.6$ 112.1$ -$ -$
Total Costs 550.8$ 57.6$ 76.2$ 93.7$ 103.6$ 107.6$ 112.1$ -$ -$
Gross Margin 115.0$ -$ 10.1$ 15.2$ 19.8$ 22.1$ 23.3$ 24.4$ -$
Income Taxes 29.3$ -$ 2.6$ 3.9$ 5.0$ 5.6$ 5.9$ 6.2$ -$
Net Income 85.7$ -$ 7.6$ 11.4$ 14.8$ 16.5$ 17.4$ 18.2$ -$
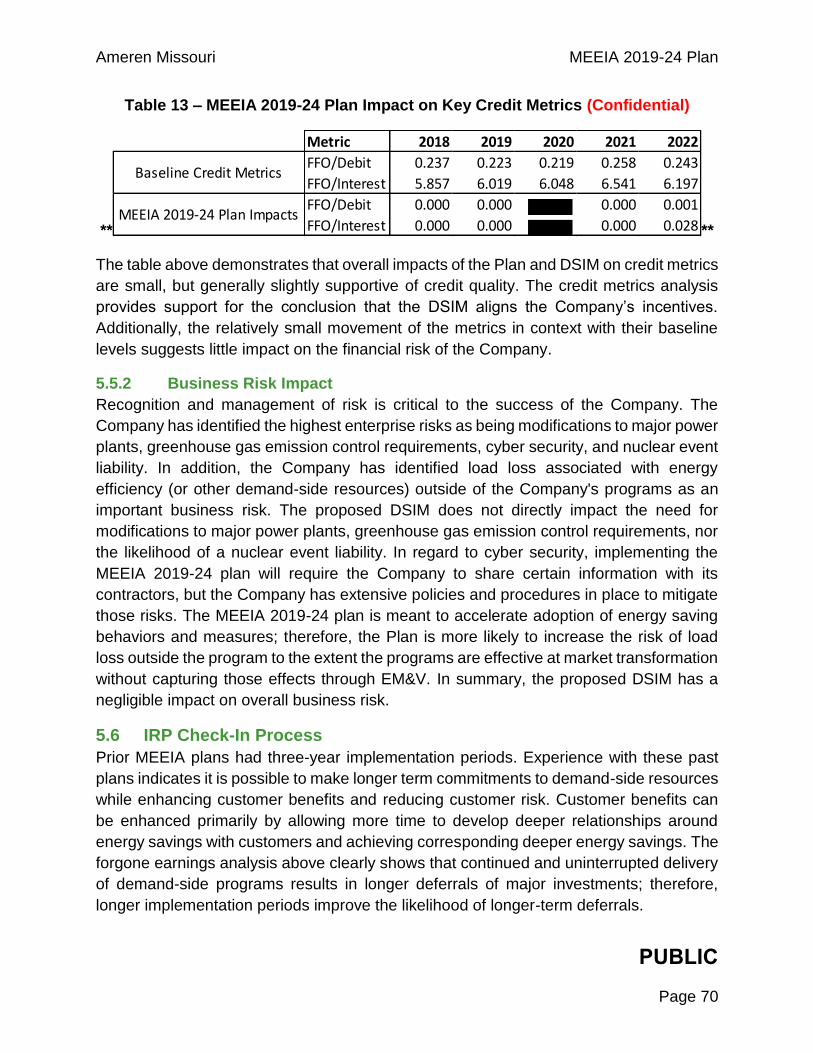
Ameren Missouri MEEIA 2019-24 Plan
Page 70
Table 13 – MEEIA 2019-24 Plan Impact on Key Credit Metrics (Confidential)
** **
The table above demonstrates that overall impacts of the Plan and DSIM on credit metrics
are small, but generally slightly supportive of credit quality. The credit metrics analysis
provides support for the conclusion that the DSIM aligns the Company’s incentives.
Additionally, the relatively small movement of the metrics in context with their baseline
levels suggests little impact on the financial risk of the Company.
5.5.2 Business Risk Impact
Recognition and management of risk is critical to the success of the Company. The
Company has identified the highest enterprise risks as being modifications to major power
plants, greenhouse gas emission control requirements, cyber security, and nuclear event
liability. In addition, the Company has identified load loss associated with energy
efficiency (or other demand-side resources) outside of the Company's programs as an
important business risk. The proposed DSIM does not directly impact the need for
modifications to major power plants, greenhouse gas emission control requirements, nor
the likelihood of a nuclear event liability. In regard to cyber security, implementing the
MEEIA 2019-24 plan will require the Company to share certain information with its
contractors, but the Company has extensive policies and procedures in place to mitigate
those risks. The MEEIA 2019-24 plan is meant to accelerate adoption of energy saving
behaviors and measures; therefore, the Plan is more likely to increase the risk of load
loss outside the program to the extent the programs are effective at market transformation
without capturing those effects through EM&V. In summary, the proposed DSIM has a
negligible impact on overall business risk.
5.6 IRP Check-In Process
Prior MEEIA plans had three-year implementation periods. Experience with these past
plans indicates it is possible to make longer term commitments to demand-side resources
while enhancing customer benefits and reducing customer risk. Customer benefits can
be enhanced primarily by allowing more time to develop deeper relationships around
energy savings with customers and achieving corresponding deeper energy savings. The
forgone earnings analysis above clearly shows that continued and uninterrupted delivery
of demand-side programs results in longer deferrals of major investments; therefore,
longer implementation periods improve the likelihood of longer-term deferrals.
Metric 2018 2019 2020 2021 2022
FFO/Debit 0.237 0.223 0.219 0.258 0.243
FFO/Interest 5.857 6.019 6.048 6.541 6.197
FFO/Debit 0.000 0.000 0.000 0.001
FFO/Interest 0.000 0.000 0.000 0.028
Baseline Credit Metrics
MEEIA 2019-24 Plan Impacts
PUBLIC
Ameren Missouri MEEIA 2019-24 Plan
Page 71
It is possible, however, that significant changes could occur over a 6-year MEEIA 2019-
24 implementation period that warrant considering whether changes to the Plan should
be made. The Commission’s rules and the proposed MEEIA 2019-24 elements provide
significant protection against the impact of any such changes. For instance, the
Commission’s rules already have provisions for starting new programs and stopping
existing programs at any time.24 The continuation of the 11-Step Change Process found
in Ameren Missouri's tariffs allows opportunities for relatively quick program changes to
respond to evolving market conditions. More importantly, the Company is proposing full
evaluations each year to provide important information for decision making about program
offerings and program operations. In addition, MEEIA 2019-24 evaluations will include
additional market research to provide a more holistic view of market conditions that can
influence decisions about programs as well as program planning. In short, there are
provisions in place to identify changes and execute changes to the MEEIA portfolio
without processing a whole new MEEIA filing.
However, Ameren Missouri recognizes that there could be certain "triggers" that warrant
consideration of modifications to three aspects of the Plan before the full 6-year
implementation period is complete. The three aspects are: (a) program budgets; (b)
energy and/or demand targets; or (c) the earnings opportunity. Consequently, the Plan
includes an IRP Check-in process that will allow consideration of modifications to (a), (b),
or (c) if the conditions in one of the following three triggers are satisfied in the 2020
triennial IRP filing:
1) The first capacity resource need changes from 2034 using the capacity position
that will exist without demand-side programs during the planning horizon for
the 2020 IRP.25 Such a change could occur because of the loss or addition of a major
customer, the addition of significant new renewable generation, the early retirement
of a baseload energy center, a significant regulatory policy change, or some similar,
significant event. The significance of such a change in this area is that it indicates that
consideration should be given to whether changes to the earnings opportunity are
warranted and/or whether other resource considerations should be factored into the
commitment to demand-side resources.
2) The 2020 IRP reflects a 20% or greater change in present value per unit avoided
costs as compared to the avoided costs in Appendix C to this Plan. Avoided
costs are the source of economic benefit from demand-side resources. Consequently,
to the extent the economic benefits of demand-side resources are changing materially
24 4 CSR 240-20.094(5) and (6). 25 To effectively determine whether there has been a material net change in the assumptions on which expected resource deferrals due to MEEIA 2019-24 were based, the capacity position will be adjusted to exclude the effects of all demand savings due to MEEIA 2019-24 programs, including any to-date savings achieved. Put another way, the capacity position will be adjusted to represent the capacity need if MEEIA 2019-24 had never been implemented.
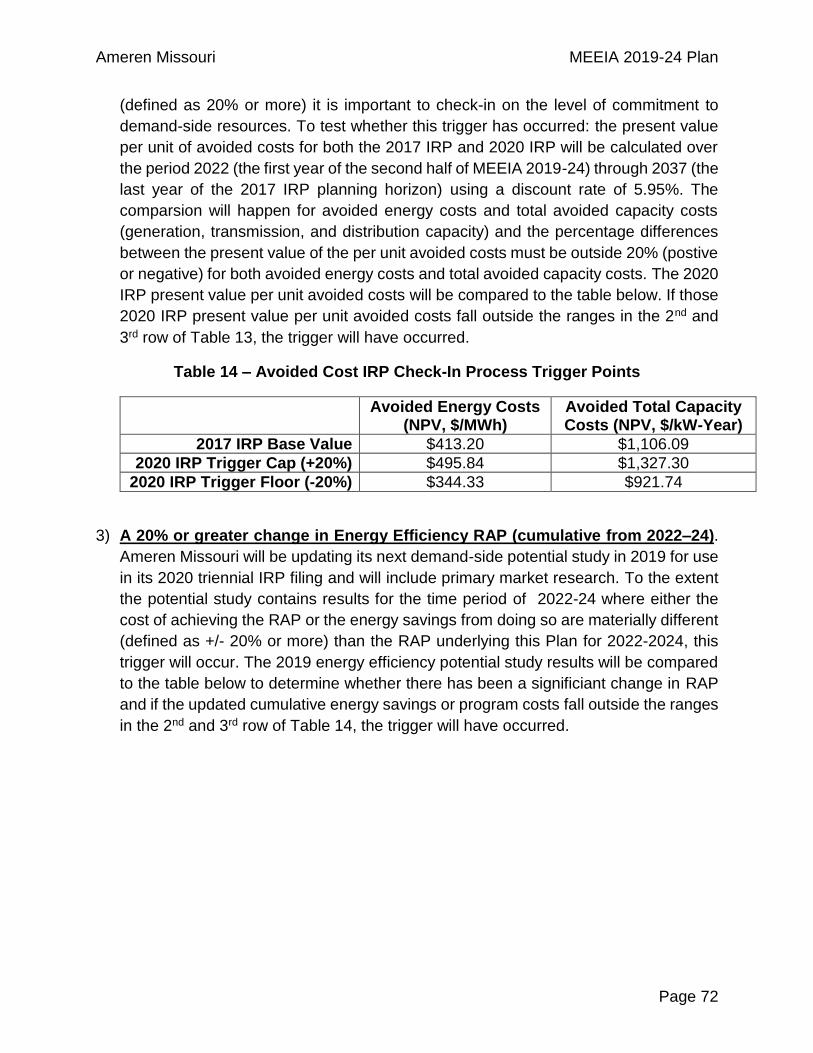
Ameren Missouri MEEIA 2019-24 Plan
Page 72
(defined as 20% or more) it is important to check-in on the level of commitment to
demand-side resources. To test whether this trigger has occurred: the present value
per unit of avoided costs for both the 2017 IRP and 2020 IRP will be calculated over
the period 2022 (the first year of the second half of MEEIA 2019-24) through 2037 (the
last year of the 2017 IRP planning horizon) using a discount rate of 5.95%. The
comparsion will happen for avoided energy costs and total avoided capacity costs
(generation, transmission, and distribution capacity) and the percentage differences
between the present value of the per unit avoided costs must be outside 20% (postive
or negative) for both avoided energy costs and total avoided capacity costs. The 2020
IRP present value per unit avoided costs will be compared to the table below. If those
2020 IRP present value per unit avoided costs fall outside the ranges in the 2nd and
3rd row of Table 13, the trigger will have occurred.
Table 14 – Avoided Cost IRP Check-In Process Trigger Points
Avoided Energy Costs (NPV, $/MWh)
Avoided Total Capacity Costs (NPV, $/kW-Year)
2017 IRP Base Value $413.20 $1,106.09
2020 IRP Trigger Cap (+20%) $495.84 $1,327.30
2020 IRP Trigger Floor (-20%) $344.33 $921.74
3) A 20% or greater change in Energy Efficiency RAP (cumulative from 2022–24).
Ameren Missouri will be updating its next demand-side potential study in 2019 for use
in its 2020 triennial IRP filing and will include primary market research. To the extent
the potential study contains results for the time period of 2022-24 where either the
cost of achieving the RAP or the energy savings from doing so are materially different
(defined as +/- 20% or more) than the RAP underlying this Plan for 2022-2024, this
trigger will occur. The 2019 energy efficiency potential study results will be compared
to the table below to determine whether there has been a significiant change in RAP
and if the updated cumulative energy savings or program costs fall outside the ranges
in the 2nd and 3rd row of Table 14, the trigger will have occurred.
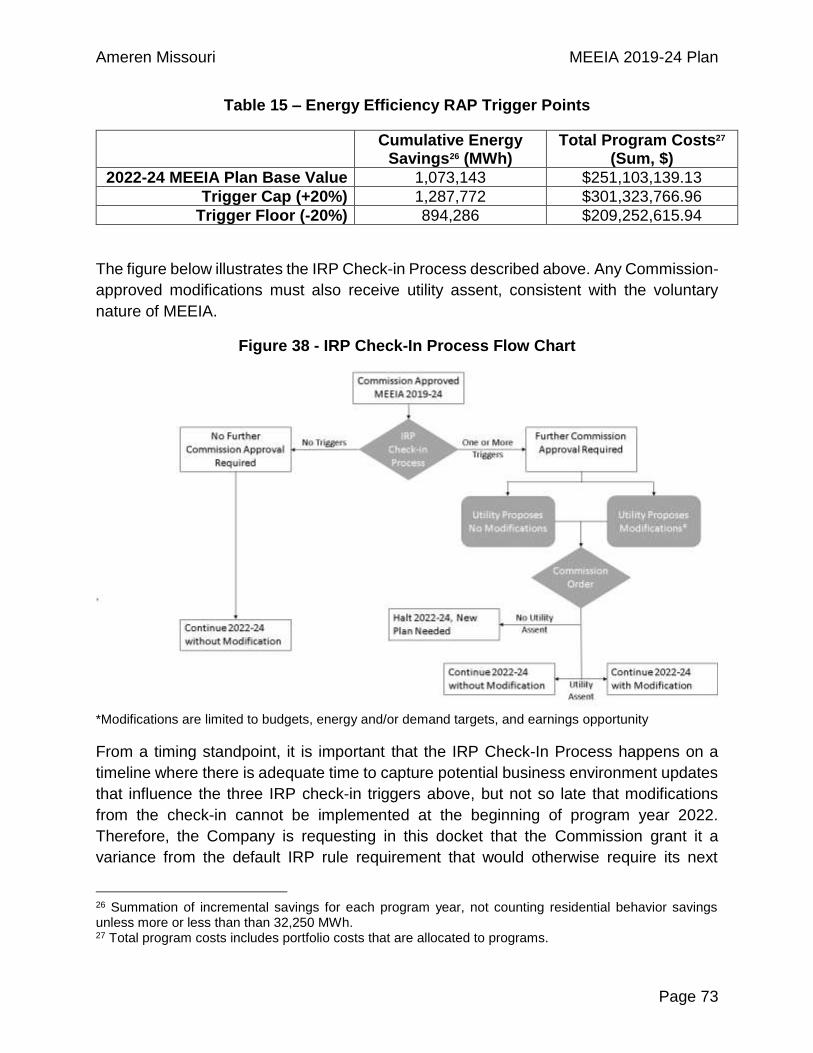
Ameren Missouri MEEIA 2019-24 Plan
Page 73
Table 15 – Energy Efficiency RAP Trigger Points
Cumulative Energy Savings26 (MWh)
Total Program Costs27 (Sum, $)
2022-24 MEEIA Plan Base Value 1,073,143 $251,103,139.13
Trigger Cap (+20%) 1,287,772 $301,323,766.96
Trigger Floor (-20%) 894,286 $209,252,615.94
The figure below illustrates the IRP Check-in Process described above. Any Commission-
approved modifications must also receive utility assent, consistent with the voluntary
nature of MEEIA.
Figure 38 - IRP Check-In Process Flow Chart
*Modifications are limited to budgets, energy and/or demand targets, and earnings opportunity
From a timing standpoint, it is important that the IRP Check-In Process happens on a
timeline where there is adequate time to capture potential business environment updates
that influence the three IRP check-in triggers above, but not so late that modifications
from the check-in cannot be implemented at the beginning of program year 2022.
Therefore, the Company is requesting in this docket that the Commission grant it a
variance from the default IRP rule requirement that would otherwise require its next
26 Summation of incremental savings for each program year, not counting residential behavior savings unless more or less than than 32,250 MWh. 27 Total program costs includes portfolio costs that are allocated to programs.
Ameren Missouri MEEIA 2019-24 Plan
Page 74
triennial IRP to be filed by April 1, 2020, and instead allow it to be filed by October 1,
2020.28 Similar variances were granted for the Company's last two triennial IRP filings,
which were filed on or shortly before October 1 in both 2014 and 2017.
From a process standpoint, collaborative discussions to receive input will start on or
before October 2020 if one of the above-triggers has occurred. By November 2020, if one
of the above-listed triggers is reflected in the 2020 IRP, the Company will propose to the
parties in the MEEIA 2019-24 case, any modifications it believes are warranted to annual
budgets, energy savings/demand savings targets, or the earnings opportunity. The IRP
check-in process will occur on the following schedule so that any changes can be
implemented by January 1, 2022:
No later than February 26, 2021, Ameren Missouri will submit any proposedmodifications to the Commission. The proposed modifications will be limited tobudgets, energy and/or demand savings targets, and the earnings opportunity.The procedural schedule will provide that data request objections or notificationsof the need for additional time must be given within seven (7) days and responseswill be due within ten (10) days.
On April 2, 2021, responses from interested parties to the MEEIA 2019-24 casewill be due. Responses will address the the Company's proposed changes andmay also include alternative proposed modifciations budgets, energy and/ordemand savings targets, or the earnings opportunity.
The Company's response to the other parties' responses will be due 30 days later.
Evidentiary hearings will be held in the first half of June 2021 to the extent possiblebased on Commission availability, with other procedural milestones (such as anydiscovery cutoff date, filing of an issues list and position statements, etc.) to occuraccording an a Commission-approved procedural schedule.
Initial post-hearing briefs will be due 28 days after the end of evidentiary hearingsand reply briefs 14 days thereafter.
Commission order resolving the question of whether modifications are required tocontinue the Plan in 2022-2024 issued by mid-September, 2021.
28 In conjunction with the change in the 2020 IRP filing date, the Company is also requesting that the Commission grant it a waiver from the requirement to file its IRP annual update reports for 2021 and 2022 by April 1st in each year, and instead allow the Company to file these reports by October 1st in each of 2021 and 2022. This will allow the Company to file two annual update reports between its 2020 and 2023 triennial IRP filings on a reasonable schedule.
Ameren Missouri MEEIA 2019-24 Plan
Page 75
6.0 Appendices
6.1 Appendix A – Portfolio and Programs Summary
6.2 Appendix B – Programs Templates
6.3 Appendix C – Avoided Costs
6.4 Appendix D – Incentive Ranges
6.5 Appendix E – Sample Evaluation Plans
6.6 Appendix F – Deemed Savings Table
6.7 Appendix G – TRM: Overview and User Guide
6.8 Appendix H – TRM: Business Measures
6.9 Appendix I – TRM: Residential Measures
6.10 Appendix J – Exemplar Tariffs
6.11 Appendix K – Customer DSIM Explanation
6.12 Appendix L – Customer Bill Examples
6.13 Appendix M – MEEIA 2019-24 Accounting
6.14 Appendix N – Earnings Opportunity Calculator