Embed Size (px)
Citation preview

Amendments to Control Phosphorus Mobility
George O’Connor1, Herschel Elliott2, and Sampson Agyin-Birikorang1
1University of Florida and 2Penn State University
O’Connor Elliott Agyin-Birikorang

The Phosphorus Problem
• High-P soils + off-site P loss = water quality degradation
• Greatest risk– Small soil retention capacity – PSI<0.25
– Short connectivity distances– Sensitive water bodies
– Coastal plain soils– Most of Florida!

Best Management Practices
• Reduce P inputs: – NMPs, CNMPs– Long “lag” times
• Reduce P solubility • Increase soil retention
• Intercept P released
Amenableto
Amendment Augmentation
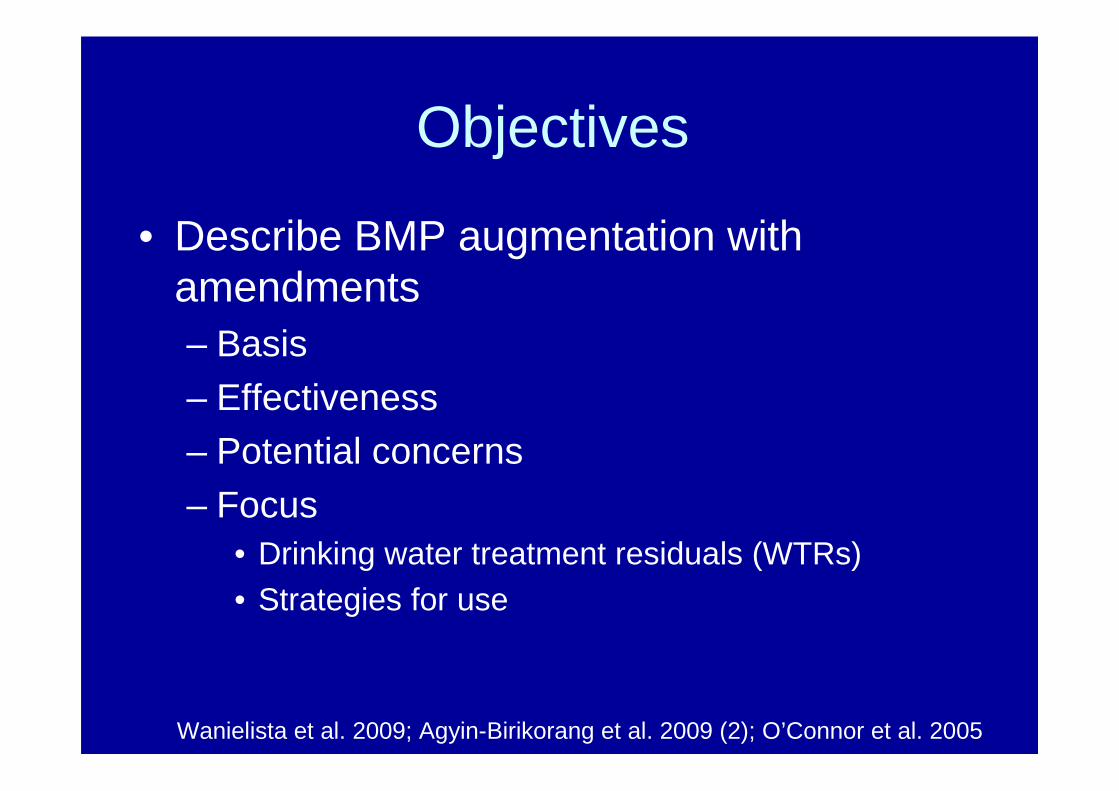
Objectives
• Describe BMP augmentation with amendments– Basis
– Effectiveness– Potential concerns
– Focus• Drinking water treatment residuals (WTRs)• Strategies for use
Wanielista et al. 2009; Agyin-Birikorang et al. 2009 (2); O’Connor et al. 2005

Reduce P Solubility
• Adjust soil or water pH – maintenance• Remove P from water – alum
– Lakes – e.g., Lake Langsjon, Sweden• Al3+ + 6 H2O → 3H2O + Al(OH)3(s) + P →
flocculant enmeshment and adsorption of P
and/or
• Al 3+ + HnPO4n-3 → AlPO4 (s) + nH+
precipitation
• Sometimes with polymers to enhance flocculation

Harper et al., 1998
System
Back
Online
Lake Lucerne, FL
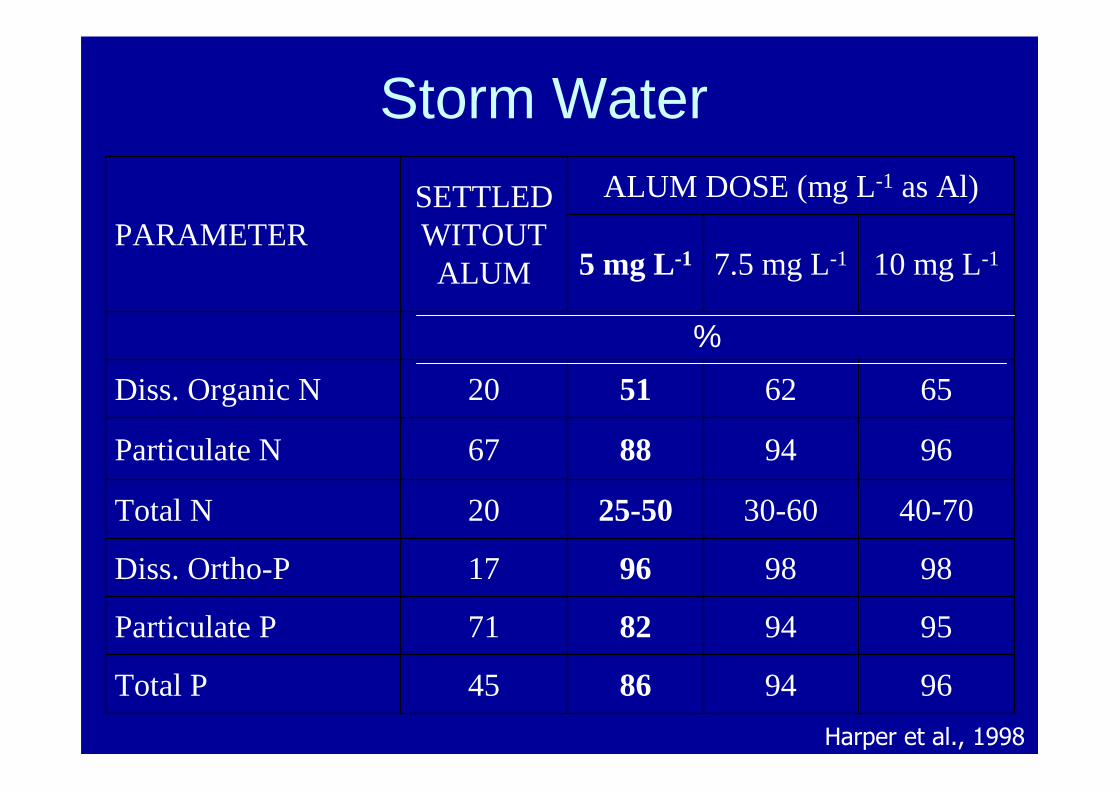
Storm Water
PARAMETERSETTLEDWITOUTALUM
ALUM DOSE (mg L-1 as Al)
5 mg L-1 7.5 mg L-1 10 mg L-1
%
Diss. Organic N 20 51 62 65
Particulate N 67 88 94 96
Total N 20 25-50 30-60 40-70
Diss. Ortho-P 17 96 98 98
Particulate P 71 82 94 95
Total P 45 86 94 96
Harper et al., 1998

• Limit diffusion release of P from sediments in storm water treatment areas (STAs) and constructed wetlands– Al3+ (alum) and Al(OH)3(s) reacts with
sediment surface-bound P to form barrier to diffusion of P from sediments to water column
– Al serves as large capacity sink for P from above and below
Reduce Sediment P Solubility

Cs
SedCs
Soil/sediment
Floodwater
After Amendment (WTR) application
WTR
Cs
SedCs
Soil/sediment
Floodwater
WTR

0
20
40
60
80
100
120
140
Untreatedmanue
low alum low AlCl3 high alum high AlCl3
So
lub
le P
in m
anu
re (
mg
P L
-1)
low AlCl3 high AlCl3
Reduce P-Source Solubility
Smith et al., 2001

Reduce P-Source Solubility
0
2
4
6
8
10
0 10 20 30 40 50 60Time (days)
Wat
er s
olu
ble
P (
mg
kg
-1)
Undigested, no Fe/Al, no lime
Anaerobic, no Fe/Al, no lime
Undigested, Fe and lime added
Anaerobic, Fe and lime added
Control (unamended soil)
Maguire et al., 2001

Amendment Characteristics
Amendment pH Mn Cu Zn As Se Mo
-----------------------mg kg-1 -----------------------
M-Al-WTR 5.0 40 60 20 9.5 1.7 20
O-Al-WTR 6.8 50 10 10 13 2.3 2.2
Fe-WTR 6.1 600 480 30 44 2.3 71
Ca-WTR 8.9 10 10 10 0.3 0.1 0.3
Coal slag 3.7 140 80 440 51 22 173
Pro-Sil 11 820 40 40 1.4 3.8 42
Fe-humate 3.4 20 20 10 1.8 13 0.3
Gypsum 8.3 10 10 10 0.1 2.8 1.7
Lime 8.9 30 10 10 1.9 0.8 0.6
DinoSoil 3.6 350 30 90 16 1.0 0.2

Increase Soil Retention of P
P source TreatmentMean total P
leachedApplied P leached
mg %
TSP - 75.7 20.7
TSP Al-WTR 2.60 0.73
TSP Fe-WTR 12.8 3.5
TSP Ca-WTR 9.1 2.5
TSP Hematite 73.1 20.0
None Fe-WTR 0.16 0.049
None - 0.29 NA
Elliott et al., 2002
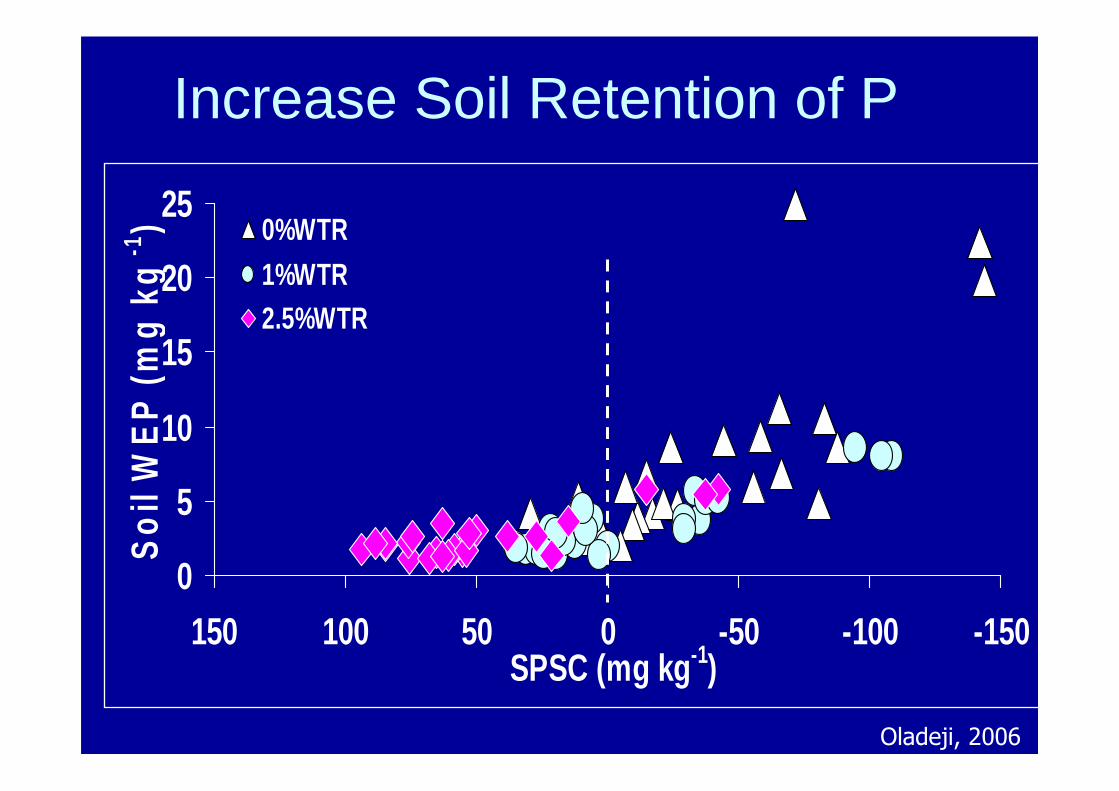
0
5
10
15
20
25
-150-100-50050100150SPSC (mg kg-1)
So
il W
EP
(m
g k
g-1
) 0%WTR1%WTR2.5%WTR
Increase Soil Retention of P
Oladeji, 2006

Buffer Strip Enhancement Buffer Strip Enhancement
WTR A B C D E
WTR rate (Mg ha-1)
---% Soluble P Reduction------
5 3 7 33 38 33
10 25 40 46 49 51
20 71 67 79 84 86
Dayton and Basta, 2005
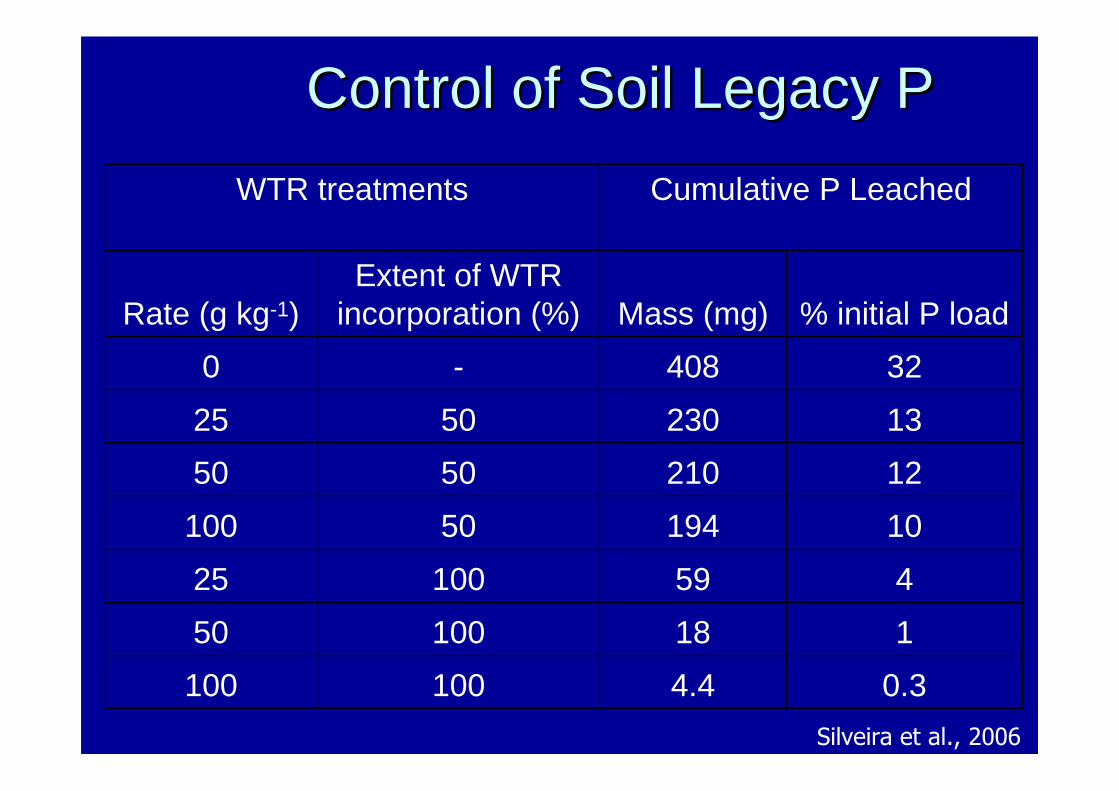
WTR treatments Cumulative P Leached
Rate (g kg-1)Extent of WTR
incorporation (%) Mass (mg) % initial P load
0 - 408 32
25 50 230 13
50 50 210 12
100 50 194 10
25 100 59 4
50 100 18 1
100 100 4.4 0.3
Control of Soil Legacy PControl of Soil Legacy P
Silveira et al., 2006

Intercept Released P:Permeable Reactive Barriers
http://www.p2pays.org/ref/14/0_initiatives/init/winter99/images/Barrier.gif

Permeable Reactive Barrier: Denitrification Wall Demonstration
Holly Factory Nursery
Boston Farm
Santa Fe River
Floodplain
Denitrification
Wall

SW3 Nitrogen Loading
0.0
0.2
0.4
0.6
0.8
1.0
1.2
1.4
1.6
1.8
2.0
8/1
1/0
9
8/1
8/0
9
8/2
5/0
9
9/1
/09
9/8
/09
9/1
5/0
9
9/2
2/0
9
9/2
9/0
9
10
/6/0
9
10
/13
/09
10
/20
/09
10
/27
/09
11
/3/0
9
11
/10
/09
11
/17
/09
11
/24
/09
12
/1/0
9
12
/8/0
9
12
/15
/09
12
/22
/09
12
/29
/09
Da
ily
Nit
rog
en
Lo
ad
ing
Ra
te (
kg
/da
y)
Total Nitrogen Daily Loading Rate (kg/day)
Nitrate Daily Loading Rate (kg/day)
Average Before Denitrification Wall (1.46 kg/day)
Average After Denitrification Wall (0.394 kg/day)
Denitrification Wall
Installed (9/29/09)
Large Storm
12/2/09 18:55 = 11.7
kg/day
12/2/09 19:20 13.8
kg/day


0
2000
4000
6000
8000
10000
12000
0 100 200 300 400 500 600 700 800 900
Equlibrium P concentration (mg L-1)
Sorb
ed P
(m
g kg
-1)
Bradenton-FLHolland-MILowell-ARTampa-FLPanama-FLCocoa-FL
WTRs: All are not the Same!
Makris and O’Connor, 2007

WTR Mechanisms:High P sorption
External Internal
Right (high BET-SA)
Wrong (small BET-SA)
Macropores (High Hg-SA)
Micropores (High CO2-SA)
P in MicroporesMakris, 2004

WTR Mechanisms
Makris and O’Connor, 2007

WTR research and case studies
Elliott et al., 2002
0
20
40
60
80
0 1 2 3 4 5 6
Al-WTR Added (%)
So
lub
le P
(m
g L
-1)
TSP
Largo
Tarpon Springs
Baltimore

WTR research and case studies
0.00
0.25
0.50
0.75
1.00
1.25
Manure Biosolids 1 Biosolids 2 TSP Control
Phosphorus Source
Deg
ree
of
P S
atu
rati
on
N-based, no WTR N-based, with WTR
P-based, no WTR P-based, with WTR
Agyin-Birikorang et al., 2008

0.0
0.5
1.0
1.5
2.0
2.5
3.0
3.5
Manure Biosolids 1 Biosolids 2 TSP Control
Phosphorus Source
So
lub
le r
eact
ive
P (
mg
L-1
)
N-based, no WTR N-based, with WTR
P-based, no WTR P-based, with WTR
WTR research and case studies
Agyin-Birikorang et al., 2009

Evidence of long-term stability
0
20
40
60
80
100
120
t(0) 1 mo 6 mo 1 yr 3.5 yr 4 yr 4.5 yr
Incubation time
Lab
ile P
co
nc.
(m
g k
g-1
)No WTR (pH 3) No WTR (pH 4) No WTR (pH 7)
WTR-amended (pH 3) WTR-amended (pH 4) WTR-amended (pH 7)
Agyin-Birikorang and O’Connor, 2007

Evidence of long-term stability
0
10
20
30
40
50
60
70
80
90
0 5 10 21
Rate of WTR application (Mg ha-1)
So
lub
le P
co
nce
ntr
atio
n (
mg
kg
-1)
Bayley et al., 2008
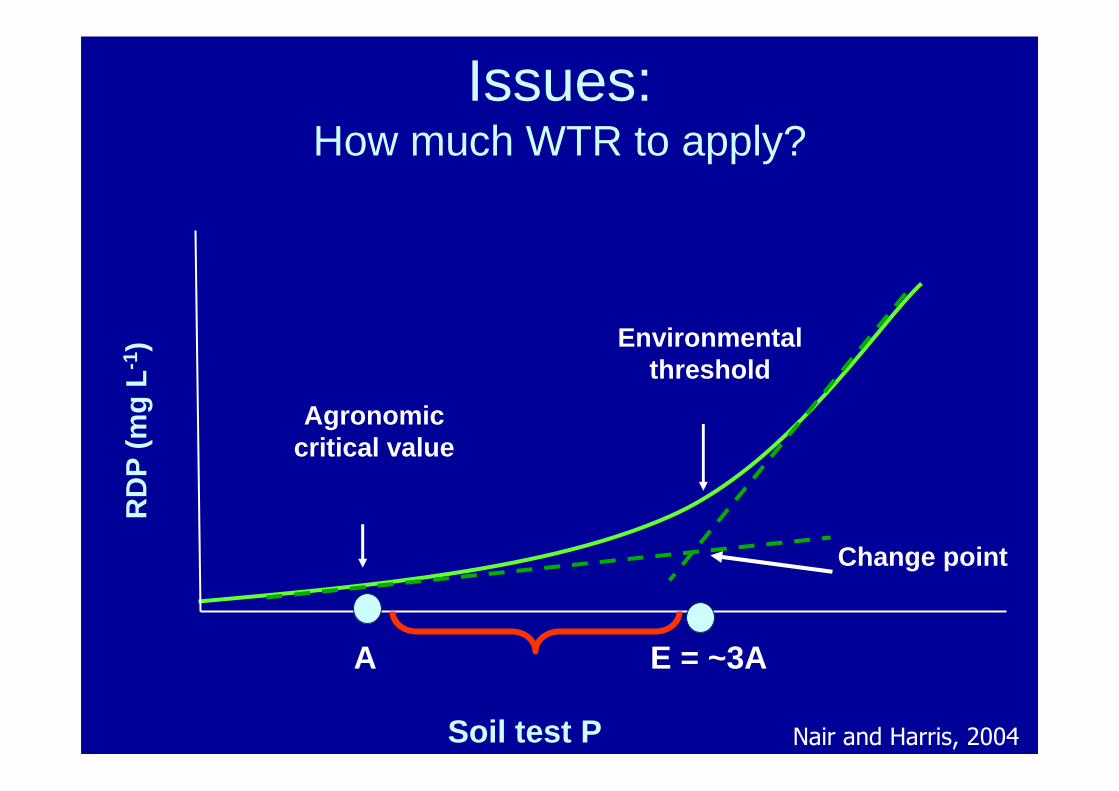
Agronomic critical value
Environmental threshold
Soil test P
A E = ~3A
RD
P (
mg
L-1
)
Change point
RD
P (
mg
L-1
)
Nair and Harris, 2004
Issues:How much WTR to apply?

0
2
4
6
8
10
0 2 4 6Bahiagrass P conc. (g kg-1)
Dry
mat
ter
(Mg
ha-1
)
Plant DM and P concentrations-150
-100
-50
0
50
100
150
0 2 4 6
Bahiagrass P conc. (g kg-1)
SP
SC
(m
g P
kg
-1)
SPSC and plant P concentrations
Oladeji, 2006
How Much WTR?

How Much WTR?(SPSC based)
SPSC (mg P kg-1) = (0.15 – PSI)* (Alox + Feox)*31
where PSI = [(Pox)/(Alox + Feox)]
SPSC < 0: highly P-impacted soilsSPSC > 0: less P-impacted soils, but P deficientSPSC = 0: agronomic and environmentally “safe”
SPSCsoil* Masssoil + APSCsource* Masssource + APSCWTR* MassWTR = 0
MassWTR is the only unknown variable
Oladeji et al., 2007

FL Concerns about WTR Use:Trace element loads
Total Al concentration (104-176 g kg-1) > SCTL (7.2 g kg-1)
• Land application may result in:1.P deficiency2.Al phytotoxicity3.Al contamination of groundwater4.Animal toxicity
Total As > residential exposure limits (2.1 mg kg-1)• Human exposure to As

DM Yield and P Uptake
0
2
4
6
8
10
12
14
2003 2004 Total DMGrowing period
DM
(M
g h
a-1
)
N-based, no WTRP-based, no WTRControlN-based, WTRP-based, WTR
0
5
10
15
20
25
30
35
2003 2004 Total P uptake
Growing periodP
up
take
(kg
ha-1
)
ns ns
ns
a a b b
aab
cc
b
nsb
Oladeji et al., 2009

Plant Al Uptake
a
a a
0
20
40
60
80
100
July Aug. Oct.
Plant Sampling time
Alu
min
um
Up
take
(g
ha-1
)
No WTRWith WTR
aa
aa
aa
Oladeji et al., 2009

Shallow Groundwater Al
0.0
0.2
0.4
0.6
0.8
1.0
1.2
1.4
0 2 4 6 8 10 12 14 16 18
Time after amendment application (mo)
Tot
al d
isso
lved
Al (
mg
L -1
)
N-based,no WTR N-based+WTR ControlP-based,no WTR P-based+WTR
Agyin-Birikorang et al., 2009

Animal Effects:Grazing Cattle
• Duration of study: 2 y
• Cumulative Rate: 76 Mg WTR ha-1
• No effects on liver, bone, and plasma Al, P, Ca, Mg, K, and Zn concentrations
• No effects on growth and development
Madison et al., 2009

Soil Depth App. Method WTR Rate (%)Added Soil As
(mg kg-1)
1 cm surface applied 1 1.8
1 cm surface applied 2.5 4.5
5 cm surface applied 1 0.4
5 cm surface applied 2.5 0.9
15 cm incorporated 1 0.1
15 cm incorporated 2.5 0.3
Soil As Considerations
Residential exposure limits = 2.1 mg kgResidential exposure limits = 2.1 mg kg--11
Industrial exposure limits = 21 mg kgIndustrial exposure limits = 21 mg kg--11

• Know WTR characteristics– Oxalate extractable Fe/Al content– Other constituents (e.g. trace elements)
• New P additions control– Surface apply WTR– Co-apply with P sources– Match rate to P additions and SPSC
• Legacy P control– Incorporate WTR– “Hot spots”
• Permeable Reactive Barriers
Lessons Learned

• Agyin-Birikorang, S., and G.A. O'Connor 2007. Lability of drinking-water treatment residuals (WTR) immobilized phosphorus: Aging and pH effects. J. Environ. Qual. 36:1076-1085.
• Agyin-Birikorang, S., G.A. O'Connor, O.O. Oladeji, T.A. Obreza, J.C. Capece. 2008. Drinking-water treatment residuals (WTR) effects on the phosphorus status of field soils amended with biosolids, manure, and fertilizer. Commun. Soil Sci. Plant Anal. 39:1700-1719.
• Agyin-Birikorang, S., G.A. O'Connor, and T.A. Obreza. 2009. Are alum-based drinking water treatment residuals safe for land application? Extension letter SL 299 Univ. of Florida, 8 pp.
• Agyin-Birikorang, S., O.O. Oladeji, G.A. O’Connor, T.A. Obreza, and J.C. Capece. 2009. Efficacy of drinking-water treatment residual in controlling off-site phosphorus losses: A field study in Florida J. Environ. Qual. 38:1076-1085.
• Bayley, R.M., J.A. Ippolito, M.E. Stromberger, K.A. Barbarick, and M.W. Paschke. 2008. Water treatment residuals and biosolids coapplications affect semiarid rangeland phosphorus cycling. Soil Sci. Soc. Am. J. 72:711-719.
• Dayton, E.A., and N.T. Basta. 2005. Use of drinking water treatment residuals as a potential best management practice to reduce phosphorus risk index scores. J. Environ. Qual. 34: 2112-2117.
• Elliott, H.A., G.A. O'Connor, P. Lu, and S. Brinton. 2002. Influence of water treatment residuals on phosphorus solubility and leaching. J. Environ. Qual. 31:1362-1369.
• Harper, H.H., J.L. Herr, and E.H. Livingston. 1998. "Alum Treatment of Stormwater: The First Ten Years." New Applications in Modeling Urban Water Systems - Monograph 7 - Proceedings of the Conference on Stormwater and Related Modeling: Management and Impacts, Toronto, Canada, February 19-20.
• Madison, R.K., L.R. McDowell, G.A. O'Connor, N.S. Wilkinson, P.A. Davis, A.T. Adesogan, T.L. Felix, and Brennan M. 2009. Effects of aluminum from water-treatment-residual applications to pastures on mineral status of grazing cattle and mineral concentrations of forages. Commun. Soil Sci. Plant Anal. 40:3077-3103.
• Maguire,R.O., J.T. Sims, S.K. Dentel, F.J. Coale, and J.T. Mah. 2001. Relationships between biosolids treatment process and soil phosphorus availability. J. Environ. Qual. 30:1023-1033.
• Makris, K.C., 2004. Long-term stability of sorbed phosphorus by drinking water treatment residuals: mechanisms and implications. PhD diss. Univ. Florida. Gainesville, FL.
• Makris, K.C., and G.A. O’Connor. 2007 Beneficial utilization of drinking-water treatment residuals as contaminant-mitigating agents. In: D. Sarkar et al. (Eds). Developments in Environmental Science, Vol. 5: Concepts and Applications in Environmental Geochemistry, Elsevier Sci. Amsterdam, pp.607-636.
• Nair, V.D., and W.G. Harris. 2004. A capacity factor as an alternative to soil test phosphorus in phosphorus risk assessment. New Zealand J. Agri. Res. 47:491-497.
• O'Connor, G.A., S. Brinton, and M.L. Silveira 2005. Evaluation and selection of soil amendments for field testing to reduce P losses. Soil Crop Sci. Soc. FL. Proc. 64:22-34.
• Oladeji, O.O., 2006. Management of phosphorus sources and water treatment residuals (WTR) for environmental and agronomic benefits. PhD diss. Univ. Florida. Gainesville, FL.
• Oladeji, O.O., G.A. O’Connor, J.B. Sartain, and V.D. Nair., 2007. Controlled application rate of water treatment residual for agronomic and environmental benefits. J. Environ. Qual. 36:1715-1724.
• Oladeji, O.O., J.B. Sartain, and G.A. O’Connor, 2009. Land application of aluminum water treatment residual: Aluminum phytoavailability and forage yield. Commun. Soil Sci. Plant Anal. 40:1483-1498
• Silveira, M.L., M.K. Miyattah, and G.A. O'Connor. 2006. Phosphorus release from a manure-impacted Spodosol: Effects of a water treatment residual. J. Environ. Qual. 35:529-541.
• Smith, D.R., P.A. Moore, C.L. Griffis, T.C. Daniel, D.R. Edwards, and D.L.Boothe. 2001. Effects of alum and aluminum chloride on phosphorus runoff from swine manure. J. Environ. Qual. 30:992-998.
• Wanielista, M., D. Bottcher, T. DeBusk, H. Harper, S. Iwinski, and G.A. O'Connor. 2009. Technical assistance for the northern Everglades chemical treatment pilot project. SFWMD Project ID#: PS 100093, July 6, 2009.
References