Embed Size (px)
Citation preview
Amec Foster Wheeler plc
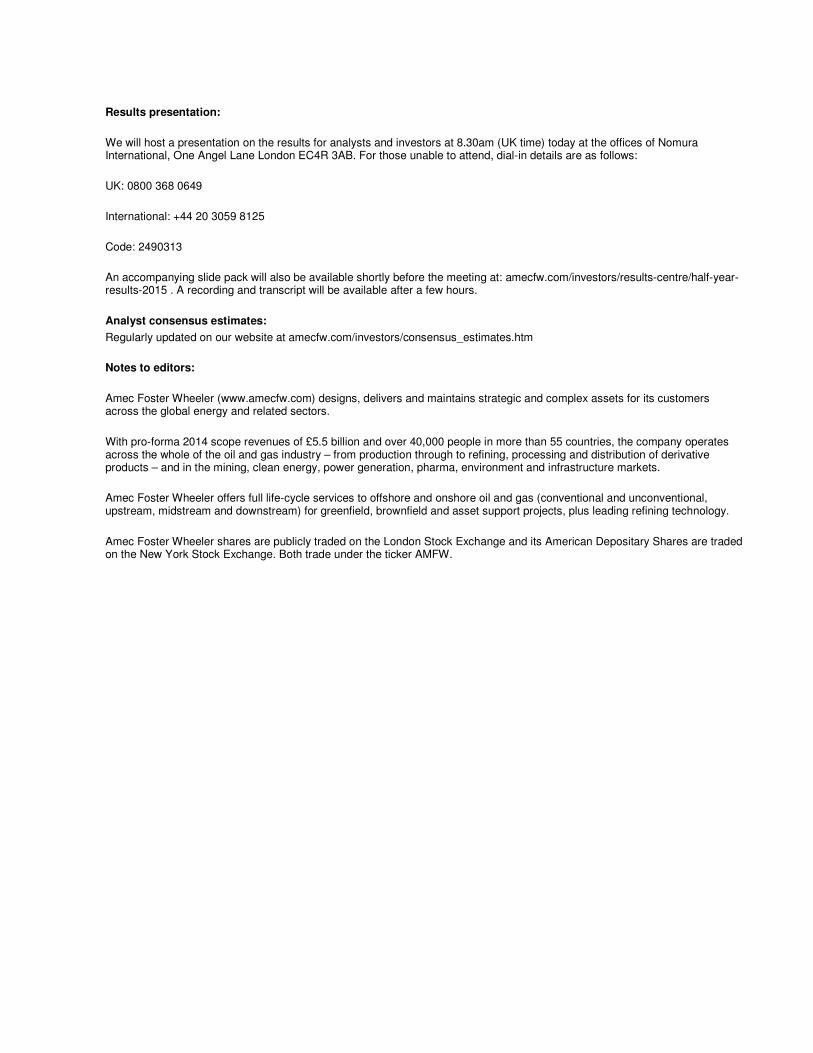
First half 2015 results Chief Executive Samir Brikho said: “In the challenging conditions we find in many of our markets our priorities are clear: to make the most of the integrated Amec Foster Wheeler platform, innovate and adapt to offer customers relevant services and continue to keep a tight control on our own costs. I continue to believe our low-risk, multi-market model is a strong platform from which to create long-term value for shareholders.” H1 2015: Key performance measures1
£m unless stated, for 6 months ended 30 June 2015 2014 PF2 Underlying change3 2014 AMEC only
Continuing operations
Scope revenue(4) 2,581 2,613 -4% 1,808
Trading profit(5) 188 243 -24% 152
Trading margin 7.3% 9.3%(6) -200bps(6) 8.4%
Trading cash flow 84 - - 39
Cash conversion 45% - - 26%
Adjusted diluted earnings per share 34.0p - - 39.1p
H1 2015: Reported under IFRS
£m unless stated, for 6 months ended 30 June 2015 2014 AMEC only Change
Continuing operations
Revenue 2,664 1,858 +43%
Profit before net financing expense 83 76 +9%
Profit before tax 73 83 -12%
Cash flow from operations (9) 11 n/m
Diluted earnings per share 14.5p 19.8p -27%
Dividend per share 14.8p 14.8p -
Outlook statement Our expectations for the group’s full year results remain consistent with previous guidance: underlying scope revenue is expected to be modestly lower than last year’s pro forma result, and we continue to expect a reduction in trading margins. For the full year, based on current forecasts, scope revenue will now benefit by c. £50 million from a stronger US dollar. We expect to see challenging market conditions continue – particularly in upstream Oil & Gas and Mining. Downstream Oil & Gas, particularly petrochemicals, continues to be resilient. Clean Energy E&C scope revenue is likely to be lower than in 2014, due to delays to the start of work for significant projects in our order book. Our strong pipeline also gives us confidence that we will see further progression in the order book from its current level of £6.6 billion. Contacts:
Amec Foster Wheeler plc Julian Walker (media) Rupert Green (investors)
+ 44 (0)20 7429 7500
Brunswick Group LLP Mike Harrison/Stuart Donnelly + 44 (0)20 7404 5959
Notes:
1) Adjusted performance measures used by the group are reconciled to the equivalent IFRS measures in the ‘Performance measures’ section
2) Unaudited pro forma information provided for comparative purposes only, assuming the AMEC and Foster Wheeler businesses had been combined from 1 January 2014. A full description of the adjustments can be found at the beginning of ‘Performance measures’
3) Excluding the impacts of currency movements, bolt-on acquisitions, and pass through procurement 4) Scope revenue represents reported revenue less pass-through procurement revenue 5) Trading profit represents profit before net financing expense excluding exceptional items, the amortisation of intangible assets and
asbestos-related costs (net of insurance recoveries). Trading profit includes the group’s share of the trading profit of joint ventures 6) Includes £20m one-off income from a license settlement within GPG. The impact on group trading margin is c. 80 basis points, and
excluding this, the comparable margin in 2014 was 8.5%.
Results presentation:
We will host a presentation on the results for analysts and investors at 8.30am (UK time) today at the offices of Nomura International, One Angel Lane London EC4R 3AB. For those unable to attend, dial-in details are as follows:
UK: 0800 368 0649
International: +44 20 3059 8125
Code: 2490313
An accompanying slide pack will also be available shortly before the meeting at: amecfw.com/investors/results-centre/half-year-results-2015 . A recording and transcript will be available after a few hours.
Analyst consensus estimates:
Regularly updated on our website at amecfw.com/investors/consensus_estimates.htm
Notes to editors:
Amec Foster Wheeler (www.amecfw.com) designs, delivers and maintains strategic and complex assets for its customers across the global energy and related sectors.
With pro-forma 2014 scope revenues of £5.5 billion and over 40,000 people in more than 55 countries, the company operates across the whole of the oil and gas industry – from production through to refining, processing and distribution of derivative products – and in the mining, clean energy, power generation, pharma, environment and infrastructure markets.
Amec Foster Wheeler offers full life-cycle services to offshore and onshore oil and gas (conventional and unconventional, upstream, midstream and downstream) for greenfield, brownfield and asset support projects, plus leading refining technology.
Amec Foster Wheeler shares are publicly traded on the London Stock Exchange and its American Depositary Shares are traded on the New York Stock Exchange. Both trade under the ticker AMFW.
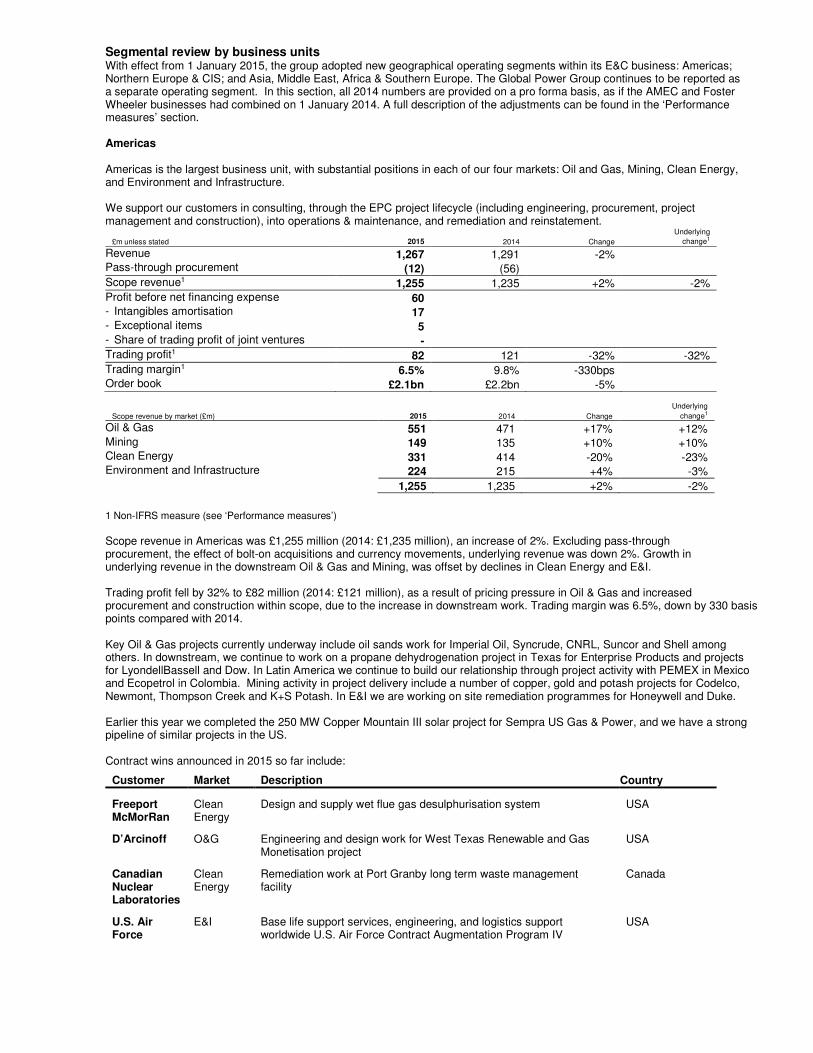
Segmental review by business units With effect from 1 January 2015, the group adopted new geographical operating segments within its E&C business: Americas; Northern Europe & CIS; and Asia, Middle East, Africa & Southern Europe. The Global Power Group continues to be reported as a separate operating segment. In this section, all 2014 numbers are provided on a pro forma basis, as if the AMEC and Foster Wheeler businesses had combined on 1 January 2014. A full description of the adjustments can be found in the ‘Performance measures’ section. Americas Americas is the largest business unit, with substantial positions in each of our four markets: Oil and Gas, Mining, Clean Energy, and Environment and Infrastructure. We support our customers in consulting, through the EPC project lifecycle (including engineering, procurement, project management and construction), into operations & maintenance, and remediation and reinstatement.
£m unless stated 2015 2014 Change
Underlying
change1
Revenue 1,267 1,291 -2% Pass-through procurement (12) (56) Scope revenue1 1,255 1,235 +2% -2% Profit before net financing expense 60 - Intangibles amortisation 17 - Exceptional items 5 - Share of trading profit of joint ventures - Trading profit1 82 121 -32% -32% Trading margin1 6.5% 9.8% -330bps Order book £2.1bn £2.2bn -5%
Scope revenue by market (£m) 2015 2014 Change
Underlying
change1
Oil & Gas 551 471 +17% +12% Mining 149 135 +10% +10% Clean Energy 331 414 -20% -23% Environment and Infrastructure 224 215 +4% -3% 1,255 1,235 +2% -2%
1 Non-IFRS measure (see ‘Performance measures’)
Scope revenue in Americas was £1,255 million (2014: £1,235 million), an increase of 2%. Excluding pass-through procurement, the effect of bolt-on acquisitions and currency movements, underlying revenue was down 2%. Growth in underlying revenue in the downstream Oil & Gas and Mining, was offset by declines in Clean Energy and E&I. Trading profit fell by 32% to £82 million (2014: £121 million), as a result of pricing pressure in Oil & Gas and increased procurement and construction within scope, due to the increase in downstream work. Trading margin was 6.5%, down by 330 basis points compared with 2014. Key Oil & Gas projects currently underway include oil sands work for Imperial Oil, Syncrude, CNRL, Suncor and Shell among others. In downstream, we continue to work on a propane dehydrogenation project in Texas for Enterprise Products and projects for LyondellBassell and Dow. In Latin America we continue to build our relationship through project activity with PEMEX in Mexico and Ecopetrol in Colombia. Mining activity in project delivery include a number of copper, gold and potash projects for Codelco, Newmont, Thompson Creek and K+S Potash. In E&I we are working on site remediation programmes for Honeywell and Duke. Earlier this year we completed the 250 MW Copper Mountain III solar project for Sempra US Gas & Power, and we have a strong pipeline of similar projects in the US. Contract wins announced in 2015 so far include:
Customer Market Description Country
Freeport McMorRan
Clean Energy
Design and supply wet flue gas desulphurisation system USA
D’Arcinoff O&G Engineering and design work for West Texas Renewable and Gas Monetisation project
USA
Canadian Nuclear Laboratories
Clean Energy
Remediation work at Port Granby long term waste management facility
Canada
U.S. Air Force
E&I Base life support services, engineering, and logistics support worldwide U.S. Air Force Contract Augmentation Program IV
USA
Northern Europe & CIS (NECIS)
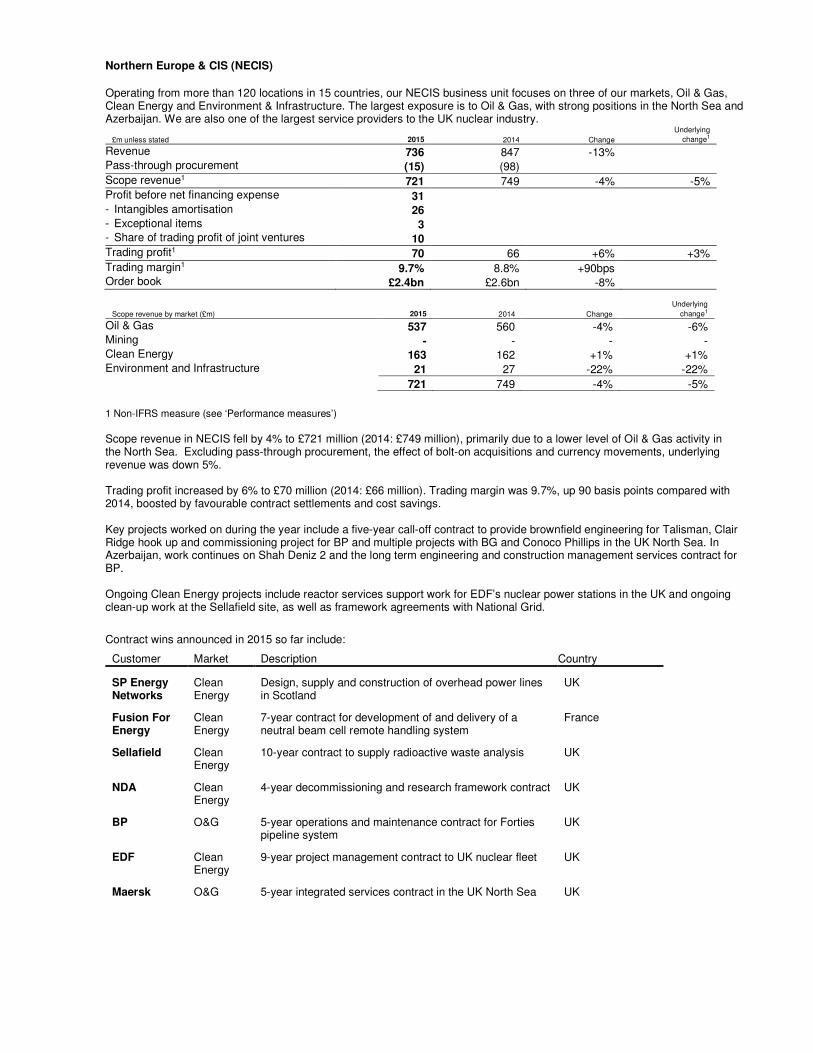
Operating from more than 120 locations in 15 countries, our NECIS business unit focuses on three of our markets, Oil & Gas, Clean Energy and Environment & Infrastructure. The largest exposure is to Oil & Gas, with strong positions in the North Sea and Azerbaijan. We are also one of the largest service providers to the UK nuclear industry.
£m unless stated 2015 2014 Change
Underlying
change1
Revenue 736 847 -13% Pass-through procurement (15) (98) Scope revenue1 721 749 -4% -5% Profit before net financing expense 31 - Intangibles amortisation 26 - Exceptional items 3 - Share of trading profit of joint ventures 10 Trading profit1 70 66 +6% +3% Trading margin1 9.7% 8.8% +90bps Order book £2.4bn £2.6bn -8%
Scope revenue by market (£m) 2015 2014 Change
Underlying
change1
Oil & Gas 537 560 -4% -6% Mining - - - - Clean Energy 163 162 +1% +1% Environment and Infrastructure 21 27 -22% -22% 721 749 -4% -5%
1 Non-IFRS measure (see ‘Performance measures’)
Scope revenue in NECIS fell by 4% to £721 million (2014: £749 million), primarily due to a lower level of Oil & Gas activity in the North Sea. Excluding pass-through procurement, the effect of bolt-on acquisitions and currency movements, underlying revenue was down 5%. Trading profit increased by 6% to £70 million (2014: £66 million). Trading margin was 9.7%, up 90 basis points compared with 2014, boosted by favourable contract settlements and cost savings. Key projects worked on during the year include a five-year call-off contract to provide brownfield engineering for Talisman, Clair Ridge hook up and commissioning project for BP and multiple projects with BG and Conoco Phillips in the UK North Sea. In Azerbaijan, work continues on Shah Deniz 2 and the long term engineering and construction management services contract for BP. Ongoing Clean Energy projects include reactor services support work for EDF’s nuclear power stations in the UK and ongoing clean-up work at the Sellafield site, as well as framework agreements with National Grid.
Contract wins announced in 2015 so far include:
Customer Market Description Country
SP Energy Networks
Clean Energy
Design, supply and construction of overhead power lines in Scotland
UK
Fusion For Energy
Clean Energy
7-year contract for development of and delivery of a neutral beam cell remote handling system
France
Sellafield Clean Energy
10-year contract to supply radioactive waste analysis UK
NDA Clean Energy
4-year decommissioning and research framework contract UK
BP O&G 5-year operations and maintenance contract for Forties pipeline system
UK
EDF Clean Energy
9-year project management contract to UK nuclear fleet UK
Maersk O&G 5-year integrated services contract in the UK North Sea UK

Asia, Middle East, Africa & Southern Europe (AMEASE)
AMEASE is a diverse region with our people spread across more than 40 locations. We now have enhanced capabilities and significantly increased customer reach which positions us well for growth across all of our four markets - Oil & Gas, Environment & Infrastructure, Mining and Clean Energy.
£m unless stated 2015 2014 Change
Underlying
change1
Revenue 518 474 +9% Pass-through procurement (56) (37) Scope revenue1 462 437 +6% +5% Profit before net financing expense 16 - Intangibles amortisation 10 - Exceptional items 6 - Share of trading profit of joint ventures 1 Trading profit1 33 23 +45% +45% Trading margin1 7.1% 5.3% +180bps Order book £1.8bn £1.7bn +6%
Scope revenue by market (£m) 2015 2014 Change
Underlying
change1
Oil & Gas 362 345 +5% +6% Mining 33 41 -20% -30% Clean Energy 6 10 -40% -40% Environment and Infrastructure 61 41 +49% +49% 462 437 +6% +5%
1 Non-IFRS measure (see ‘Performance measures’)
Scope revenue in AMEASE grew by 6% to £462 million (2014: £437 million), driven by an increase in revenue from Oil & Gas activities in the Middle East and Environment and Infrastructure work. Excluding pass-through procurement, the effect of bolt-on acquisitions and currency movements, underlying revenue was up 5%. Trading profit rose by 45% to £33 million (2014: £23 million), reflecting higher contributions from Oil & Gas and E&I. Trading margin was 7.1%, up 180 basis points compared with 2014, due to the early benefits of cost saving initiatives. Key upstream Oil & Gas projects include providing asset support for ConocoPhillips' Bayu-Udan gas facilities in the East Timor Sea, operational readiness services for Chevron’s Wheatstone facility offshore Australia, and onshore turnaround and maintenance support to ENI’s onshore gas treatment plant and offshore unmanned wellhead platform, also in Australia. In the Middle East we are providing technical and project management services on the Upper Zakum project for Zadco, supporting KNPC’s new oil refinery at Al Zour and delivering the propylene oxide plant at Jubail for Sadara Chemical Company. Other downstream projects include the Son refinery in Vietnam, and work on the synthetic rubber plant for Lanxess Butyl in Singapore. In Mining we continue to work on the Husab Uranium project in Namibia. We have a strong pipeline for future projects, including in the Middle East and Africa for Oil & Gas and emerging opportunities across the region for Clean Energy.
Contract wins announced in 2015 so far include:
Customer Market Description Country
Gov of Timor-Leste
O&G Pre-FEED for the proposed Beaço LNG plant Timor-Leste
Anagold Madencilik
Mining Initial phase reimbursable EPC for the Çőpler Gold Mine Turkey
U.S. Air Force
E&I Design and construction of specialist facilities Guam
Orpic O&G 3-year technical services contract for refinery and polypropylene facilities
Oman
Shenhua Ningxia Coal
O&G 3-year project management contract at a coal-chemical complex China
SKS O&G Consultancy services to a new refinery and pet-chem complex in Kedah
Malaysia
Global Power Group (GPG)
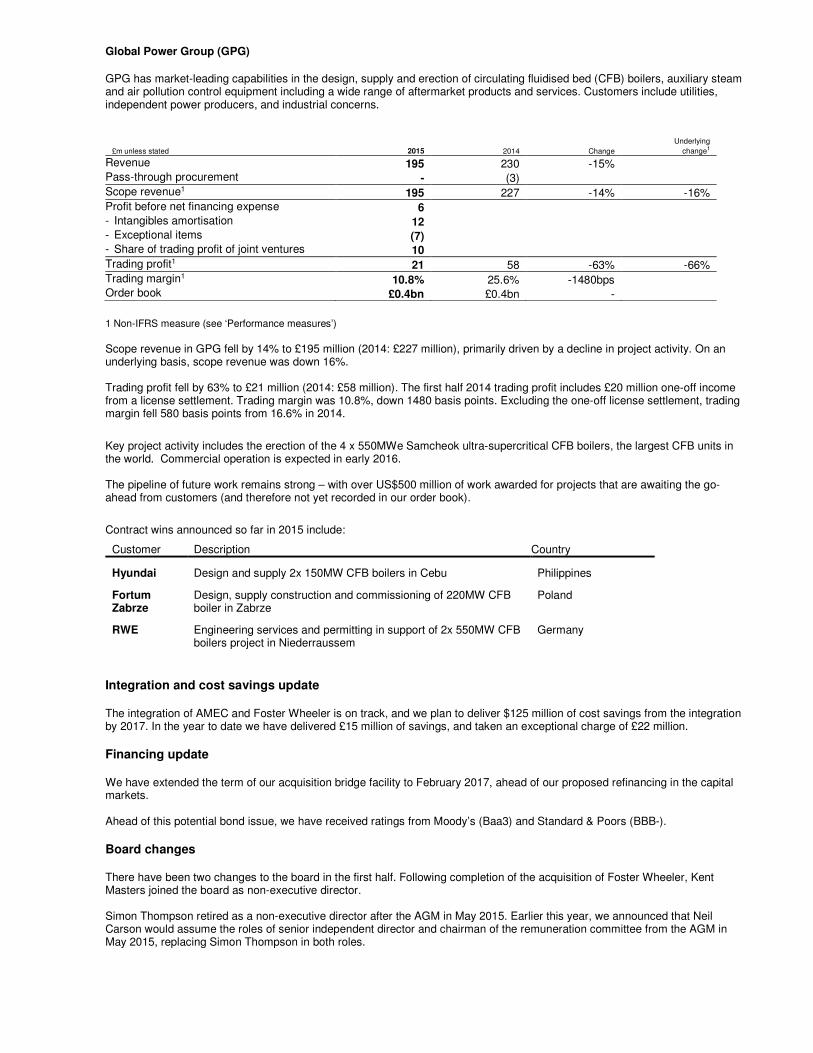
GPG has market-leading capabilities in the design, supply and erection of circulating fluidised bed (CFB) boilers, auxiliary steam and air pollution control equipment including a wide range of aftermarket products and services. Customers include utilities, independent power producers, and industrial concerns.
£m unless stated 2015 2014 Change
Underlying
change1
Revenue 195 230 -15% Pass-through procurement - (3) Scope revenue1 195 227 -14% -16% Profit before net financing expense 6 - Intangibles amortisation 12 - Exceptional items (7) - Share of trading profit of joint ventures 10 Trading profit1 21 58 -63% -66% Trading margin1 10.8% 25.6% -1480bps Order book £0.4bn £0.4bn -
1 Non-IFRS measure (see ‘Performance measures’) Scope revenue in GPG fell by 14% to £195 million (2014: £227 million), primarily driven by a decline in project activity. On an underlying basis, scope revenue was down 16%. Trading profit fell by 63% to £21 million (2014: £58 million). The first half 2014 trading profit includes £20 million one-off income from a license settlement. Trading margin was 10.8%, down 1480 basis points. Excluding the one-off license settlement, trading margin fell 580 basis points from 16.6% in 2014.
Key project activity includes the erection of the 4 x 550MWe Samcheok ultra-supercritical CFB boilers, the largest CFB units in the world. Commercial operation is expected in early 2016. The pipeline of future work remains strong – with over US$500 million of work awarded for projects that are awaiting the go-ahead from customers (and therefore not yet recorded in our order book).
Contract wins announced so far in 2015 include:
Customer Description Country
Hyundai Design and supply 2x 150MW CFB boilers in Cebu Philippines
Fortum Zabrze
Design, supply construction and commissioning of 220MW CFB boiler in Zabrze
Poland
RWE Engineering services and permitting in support of 2x 550MW CFB boilers project in Niederraussem
Germany
Integration and cost savings update The integration of AMEC and Foster Wheeler is on track, and we plan to deliver $125 million of cost savings from the integration by 2017. In the year to date we have delivered £15 million of savings, and taken an exceptional charge of £22 million. Financing update We have extended the term of our acquisition bridge facility to February 2017, ahead of our proposed refinancing in the capital markets. Ahead of this potential bond issue, we have received ratings from Moody’s (Baa3) and Standard & Poors (BBB-). Board changes There have been two changes to the board in the first half. Following completion of the acquisition of Foster Wheeler, Kent Masters joined the board as non-executive director. Simon Thompson retired as a non-executive director after the AGM in May 2015. Earlier this year, we announced that Neil Carson would assume the roles of senior independent director and chairman of the remuneration committee from the AGM in May 2015, replacing Simon Thompson in both roles.
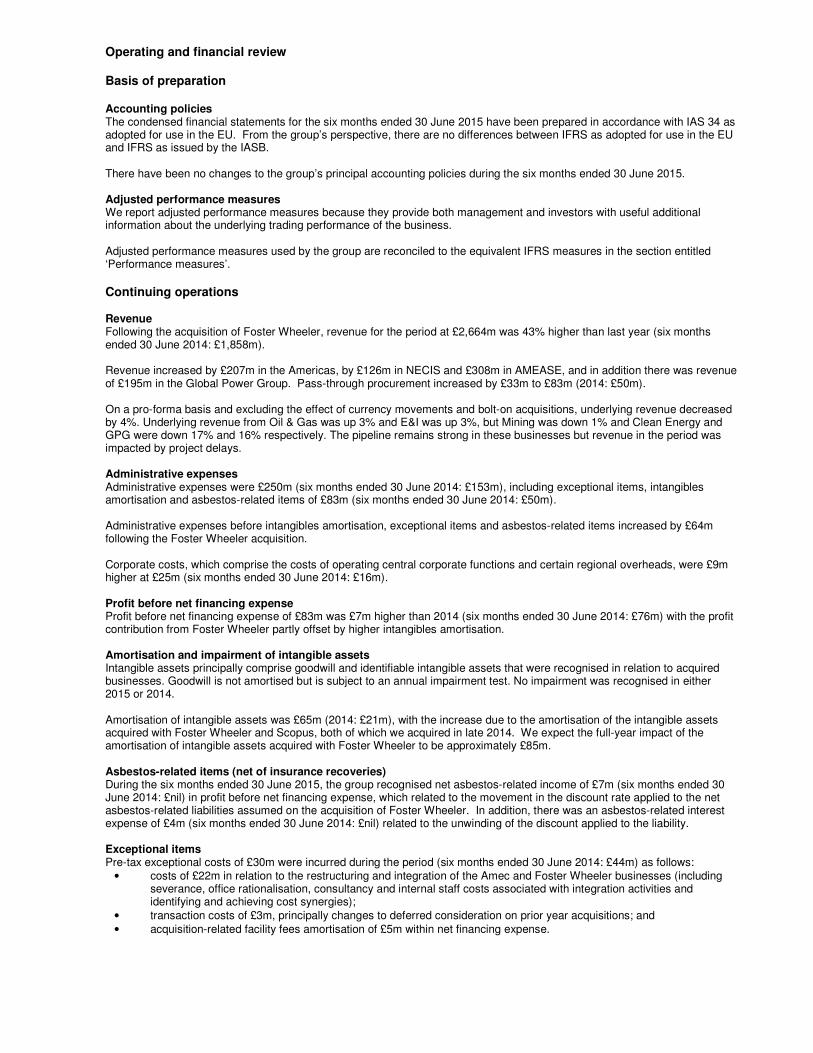
Operating and financial review Basis of preparation Accounting policies The condensed financial statements for the six months ended 30 June 2015 have been prepared in accordance with IAS 34 as adopted for use in the EU. From the group’s perspective, there are no differences between IFRS as adopted for use in the EU and IFRS as issued by the IASB. There have been no changes to the group’s principal accounting policies during the six months ended 30 June 2015. Adjusted performance measures We report adjusted performance measures because they provide both management and investors with useful additional information about the underlying trading performance of the business. Adjusted performance measures used by the group are reconciled to the equivalent IFRS measures in the section entitled ‘Performance measures’. Continuing operations Revenue Following the acquisition of Foster Wheeler, revenue for the period at £2,664m was 43% higher than last year (six months ended 30 June 2014: £1,858m). Revenue increased by £207m in the Americas, by £126m in NECIS and £308m in AMEASE, and in addition there was revenue of £195m in the Global Power Group. Pass-through procurement increased by £33m to £83m (2014: £50m). On a pro-forma basis and excluding the effect of currency movements and bolt-on acquisitions, underlying revenue decreased by 4%. Underlying revenue from Oil & Gas was up 3% and E&I was up 3%, but Mining was down 1% and Clean Energy and GPG were down 17% and 16% respectively. The pipeline remains strong in these businesses but revenue in the period was impacted by project delays. Administrative expenses Administrative expenses were £250m (six months ended 30 June 2014: £153m), including exceptional items, intangibles amortisation and asbestos-related items of £83m (six months ended 30 June 2014: £50m). Administrative expenses before intangibles amortisation, exceptional items and asbestos-related items increased by £64m following the Foster Wheeler acquisition. Corporate costs, which comprise the costs of operating central corporate functions and certain regional overheads, were £9m higher at £25m (six months ended 30 June 2014: £16m). Profit before net financing expense Profit before net financing expense of £83m was £7m higher than 2014 (six months ended 30 June 2014: £76m) with the profit contribution from Foster Wheeler partly offset by higher intangibles amortisation. Amortisation and impairment of intangible assets Intangible assets principally comprise goodwill and identifiable intangible assets that were recognised in relation to acquired businesses. Goodwill is not amortised but is subject to an annual impairment test. No impairment was recognised in either 2015 or 2014. Amortisation of intangible assets was £65m (2014: £21m), with the increase due to the amortisation of the intangible assets acquired with Foster Wheeler and Scopus, both of which we acquired in late 2014. We expect the full-year impact of the amortisation of intangible assets acquired with Foster Wheeler to be approximately £85m. Asbestos-related items (net of insurance recoveries) During the six months ended 30 June 2015, the group recognised net asbestos-related income of £7m (six months ended 30 June 2014: £nil) in profit before net financing expense, which related to the movement in the discount rate applied to the net asbestos-related liabilities assumed on the acquisition of Foster Wheeler. In addition, there was an asbestos-related interest expense of £4m (six months ended 30 June 2014: £nil) related to the unwinding of the discount applied to the liability. Exceptional items Pre-tax exceptional costs of £30m were incurred during the period (six months ended 30 June 2014: £44m) as follows:
• costs of £22m in relation to the restructuring and integration of the Amec and Foster Wheeler businesses (including severance, office rationalisation, consultancy and internal staff costs associated with integration activities and identifying and achieving cost synergies);
• transaction costs of £3m, principally changes to deferred consideration on prior year acquisitions; and • acquisition-related facility fees amortisation of £5m within net financing expense.
Trading profit and trading margin
£m unless stated 2015 2014 Change
Underlying
change1
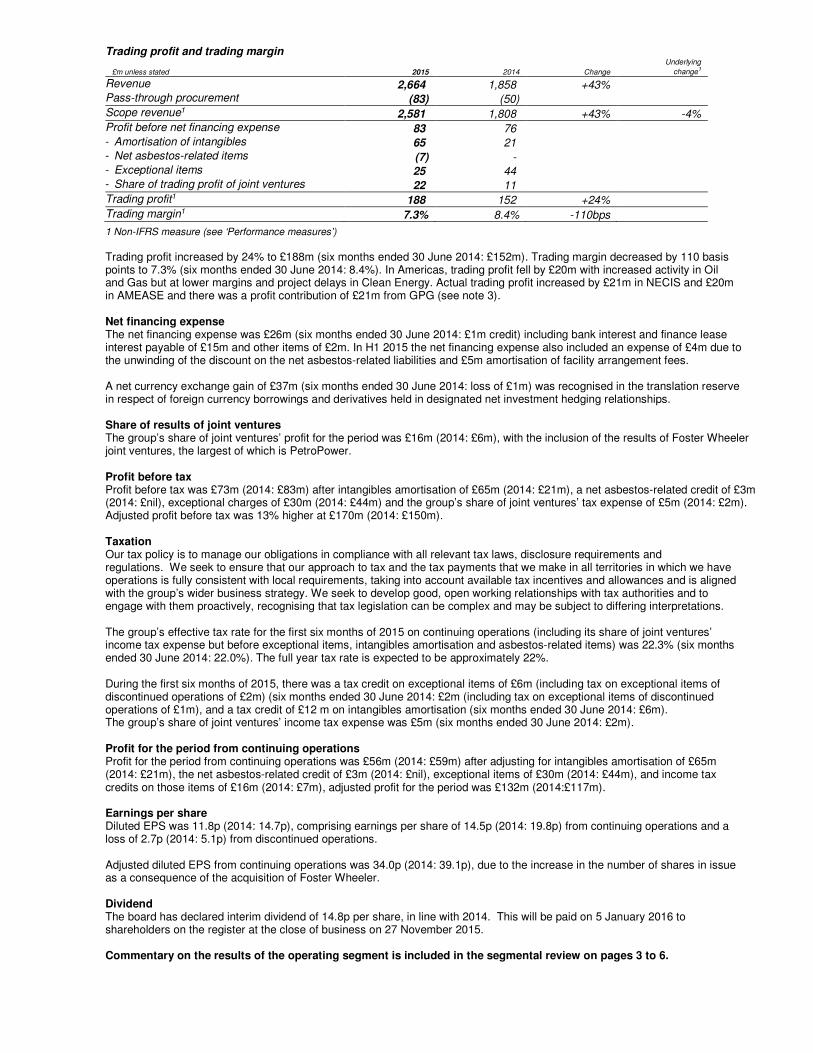
Revenue 2,664 1,858 +43% Pass-through procurement (83) (50) Scope revenue1 2,581 1,808 +43% -4% Profit before net financing expense 83 76 - Amortisation of intangibles 65 21 - Net asbestos-related items (7) - - Exceptional items 25 44 - Share of trading profit of joint ventures 22 11
Trading profit1 188 152 +24%
Trading margin1 7.3% 8.4% -110bps
1 Non-IFRS measure (see ‘Performance measures’)
Trading profit increased by 24% to £188m (six months ended 30 June 2014: £152m). Trading margin decreased by 110 basis points to 7.3% (six months ended 30 June 2014: 8.4%). In Americas, trading profit fell by £20m with increased activity in Oil and Gas but at lower margins and project delays in Clean Energy. Actual trading profit increased by £21m in NECIS and £20m in AMEASE and there was a profit contribution of £21m from GPG (see note 3). Net financing expense The net financing expense was £26m (six months ended 30 June 2014: £1m credit) including bank interest and finance lease interest payable of £15m and other items of £2m. In H1 2015 the net financing expense also included an expense of £4m due to the unwinding of the discount on the net asbestos-related liabilities and £5m amortisation of facility arrangement fees. A net currency exchange gain of £37m (six months ended 30 June 2014: loss of £1m) was recognised in the translation reserve in respect of foreign currency borrowings and derivatives held in designated net investment hedging relationships. Share of results of joint ventures The group’s share of joint ventures’ profit for the period was £16m (2014: £6m), with the inclusion of the results of Foster Wheeler joint ventures, the largest of which is PetroPower. Profit before tax Profit before tax was £73m (2014: £83m) after intangibles amortisation of £65m (2014: £21m), a net asbestos-related credit of £3m (2014: £nil), exceptional charges of £30m (2014: £44m) and the group’s share of joint ventures’ tax expense of £5m (2014: £2m). Adjusted profit before tax was 13% higher at £170m (2014: £150m). Taxation Our tax policy is to manage our obligations in compliance with all relevant tax laws, disclosure requirements and regulations. We seek to ensure that our approach to tax and the tax payments that we make in all territories in which we have operations is fully consistent with local requirements, taking into account available tax incentives and allowances and is aligned with the group’s wider business strategy. We seek to develop good, open working relationships with tax authorities and to engage with them proactively, recognising that tax legislation can be complex and may be subject to differing interpretations. The group’s effective tax rate for the first six months of 2015 on continuing operations (including its share of joint ventures’ income tax expense but before exceptional items, intangibles amortisation and asbestos-related items) was 22.3% (six months ended 30 June 2014: 22.0%). The full year tax rate is expected to be approximately 22%. During the first six months of 2015, there was a tax credit on exceptional items of £6m (including tax on exceptional items of discontinued operations of £2m) (six months ended 30 June 2014: £2m (including tax on exceptional items of discontinued operations of £1m), and a tax credit of £12 m on intangibles amortisation (six months ended 30 June 2014: £6m). The group’s share of joint ventures’ income tax expense was £5m (six months ended 30 June 2014: £2m). Profit for the period from continuing operations Profit for the period from continuing operations was £56m (2014: £59m) after adjusting for intangibles amortisation of £65m (2014: £21m), the net asbestos-related credit of £3m (2014: £nil), exceptional items of £30m (2014: £44m), and income tax credits on those items of £16m (2014: £7m), adjusted profit for the period was £132m (2014:£117m). Earnings per share Diluted EPS was 11.8p (2014: 14.7p), comprising earnings per share of 14.5p (2014: 19.8p) from continuing operations and a loss of 2.7p (2014: 5.1p) from discontinued operations. Adjusted diluted EPS from continuing operations was 34.0p (2014: 39.1p), due to the increase in the number of shares in issue as a consequence of the acquisition of Foster Wheeler. Dividend The board has declared interim dividend of 14.8p per share, in line with 2014. This will be paid on 5 January 2016 to shareholders on the register at the close of business on 27 November 2015. Commentary on the results of the operating segment is included in the segmental review on pages 3 to 6.
Investment Services During the periods under review, Investment Services principally comprised the Incheon Bridge PPP project in Korea, the group’s insurance captive, the group’s wind development activities and a number of Build Own Operate assets that were acquired with Foster Wheeler. Revenue in Investment Services was £8m (2014: £3m) with trading profit of £7m (2014:£4m) which, following positive developments in the first half of 2015, included the release of a provision no longer required on a non-core asset acquired with Foster Wheeler.
Discontinued operations Discontinued operations represent the residual assets and retained obligations of businesses sold in prior years, as well as the UK conventional power business which was discontinued in 2013. Discontinued operations generated a pre-tax trading loss before tax of £5m as a result of an additional provision on a completed contract (six months ended 30 June 2014: £10m). There was an associated tax credit of £1m (six months ended 30 June 2014: £2m) resulting in a post-tax loss for the period of £4m (six months ended 30 June 2014: £8m). Discontinued operations included a pre-tax loss on disposals of £8m (six months ended 30 June 2014: £8m) arising from additional indemnity provisions and costs associated with businesses sold in prior years, there was an associated tax credit of £2m (six months ended 30 June 2014: £1m) giving post-tax exceptional loss of £6m (six months ended 30 June 2014: £7m). Discontinued operations generated an overall post-tax loss for the period of £10m (six months ended 30 June 2014: £15m).
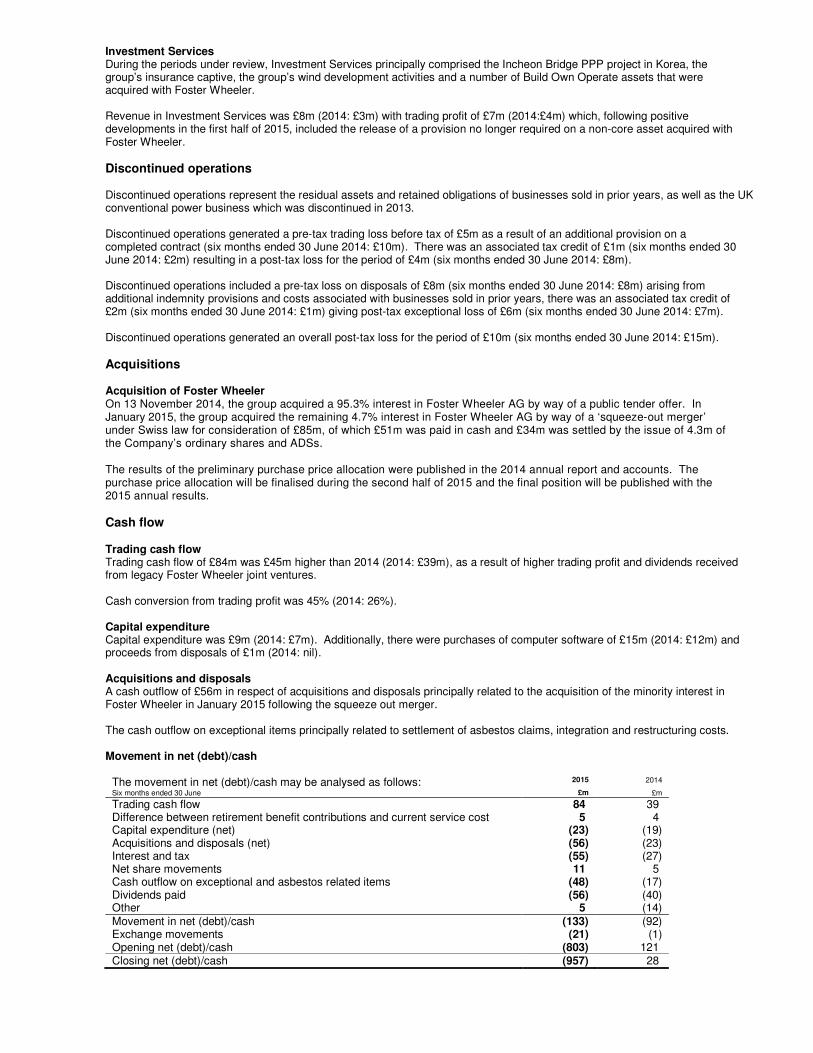
Acquisitions Acquisition of Foster Wheeler On 13 November 2014, the group acquired a 95.3% interest in Foster Wheeler AG by way of a public tender offer. In January 2015, the group acquired the remaining 4.7% interest in Foster Wheeler AG by way of a ‘squeeze-out merger’ under Swiss law for consideration of £85m, of which £51m was paid in cash and £34m was settled by the issue of 4.3m of the Company’s ordinary shares and ADSs. The results of the preliminary purchase price allocation were published in the 2014 annual report and accounts. The purchase price allocation will be finalised during the second half of 2015 and the final position will be published with the 2015 annual results. Cash flow Trading cash flow Trading cash flow of £84m was £45m higher than 2014 (2014: £39m), as a result of higher trading profit and dividends received from legacy Foster Wheeler joint ventures. Cash conversion from trading profit was 45% (2014: 26%). Capital expenditure Capital expenditure was £9m (2014: £7m). Additionally, there were purchases of computer software of £15m (2014: £12m) and proceeds from disposals of £1m (2014: nil). Acquisitions and disposals A cash outflow of £56m in respect of acquisitions and disposals principally related to the acquisition of the minority interest in Foster Wheeler in January 2015 following the squeeze out merger. The cash outflow on exceptional items principally related to settlement of asbestos claims, integration and restructuring costs. Movement in net (debt)/cash
The movement in net (debt)/cash may be analysed as follows: 2015 2014
Six months ended 30 June £m £m
Trading cash flow 84 39 Difference between retirement benefit contributions and current service cost 5 4 Capital expenditure (net) (23) (19) Acquisitions and disposals (net) (56) (23) Interest and tax (55) (27) Net share movements 11 5 Cash outflow on exceptional and asbestos related items (48) (17) Dividends paid (56) (40) Other 5 (14) Movement in net (debt)/cash (133) (92) Exchange movements (21) (1) Opening net (debt)/cash (803) 121 Closing net (debt)/cash (957) 28
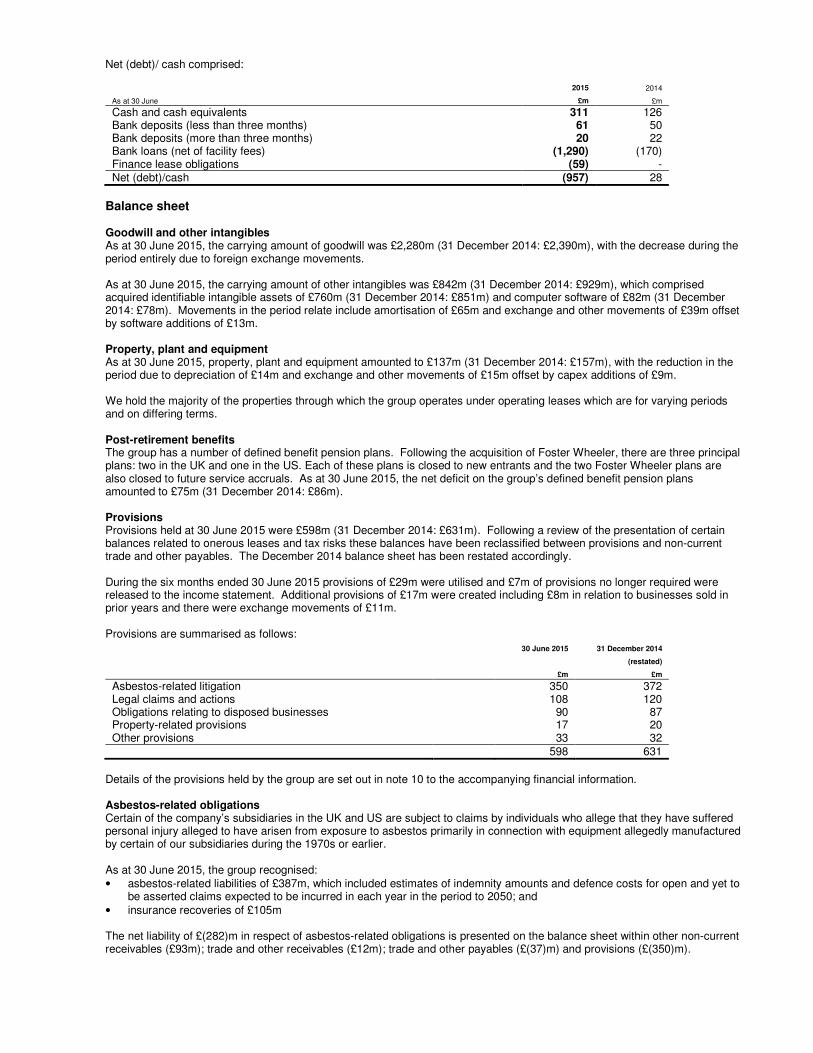
Net (debt)/ cash comprised:
2015 2014
As at 30 June £m £m
Cash and cash equivalents 311 126 Bank deposits (less than three months) 61 50 Bank deposits (more than three months) 20 22 Bank loans (net of facility fees) (1,290) (170) Finance lease obligations (59) - Net (debt)/cash (957) 28
Balance sheet Goodwill and other intangibles As at 30 June 2015, the carrying amount of goodwill was £2,280m (31 December 2014: £2,390m), with the decrease during the period entirely due to foreign exchange movements. As at 30 June 2015, the carrying amount of other intangibles was £842m (31 December 2014: £929m), which comprised acquired identifiable intangible assets of £760m (31 December 2014: £851m) and computer software of £82m (31 December 2014: £78m). Movements in the period relate include amortisation of £65m and exchange and other movements of £39m offset by software additions of £13m. Property, plant and equipment As at 30 June 2015, property, plant and equipment amounted to £137m (31 December 2014: £157m), with the reduction in the period due to depreciation of £14m and exchange and other movements of £15m offset by capex additions of £9m. We hold the majority of the properties through which the group operates under operating leases which are for varying periods and on differing terms. Post-retirement benefits The group has a number of defined benefit pension plans. Following the acquisition of Foster Wheeler, there are three principal plans: two in the UK and one in the US. Each of these plans is closed to new entrants and the two Foster Wheeler plans are also closed to future service accruals. As at 30 June 2015, the net deficit on the group’s defined benefit pension plans amounted to £75m (31 December 2014: £86m). Provisions Provisions held at 30 June 2015 were £598m (31 December 2014: £631m). Following a review of the presentation of certain balances related to onerous leases and tax risks these balances have been reclassified between provisions and non-current trade and other payables. The December 2014 balance sheet has been restated accordingly. During the six months ended 30 June 2015 provisions of £29m were utilised and £7m of provisions no longer required were released to the income statement. Additional provisions of £17m were created including £8m in relation to businesses sold in prior years and there were exchange movements of £11m. Provisions are summarised as follows:
30 June 2015 31 December 2014 (restated) £m £m
Asbestos-related litigation 350 372 Legal claims and actions 108 120 Obligations relating to disposed businesses 90 87 Property-related provisions 17 20 Other provisions 33 32 598 631
Details of the provisions held by the group are set out in note 10 to the accompanying financial information. Asbestos-related obligations Certain of the company’s subsidiaries in the UK and US are subject to claims by individuals who allege that they have suffered personal injury alleged to have arisen from exposure to asbestos primarily in connection with equipment allegedly manufactured by certain of our subsidiaries during the 1970s or earlier. As at 30 June 2015, the group recognised: • asbestos-related liabilities of £387m, which included estimates of indemnity amounts and defence costs for open and yet to
be asserted claims expected to be incurred in each year in the period to 2050; and • insurance recoveries of £105m The net liability of £(282)m in respect of asbestos-related obligations is presented on the balance sheet within other non-current receivables (£93m); trade and other receivables (£12m); trade and other payables (£(37)m) and provisions (£(350)m).

There was a net cash outflow of £13m during H1 2015 due to the excess of forecast indemnity payments and defence costs over insurance proceeds.
Going concern Based on internal forecasts and projections that take into account reasonably possible changes in the group’s trading performance, the directors consider that the group has adequate financial resources to continue in operation for the foreseeable future. Accordingly, the directors continue to adopt the going concern basis in preparing the group’s financial statements. Performance measures Pro forma information The pro forma information is provided for comparative purposes only and does not necessarily reflect what the revenue and trading results of the combined group would have been, nor is it necessarily indicative of the combined group’s future revenue and trading results. The unaudited pro forma information has been prepared based on information derived from the following: • the unaudited consolidated financial statements of Amec Foster Wheeler plc (formerly AMEC plc) for the six months ended 30
June 2014 prepared in accordance with IFRS;
• the unaudited consolidated financial information of Foster Wheeler for the six months ended 30 June 2014 prepared in accordance with US GAAP.
Adjustments have been made to restate Foster Wheeler’s results in accordance with AMEC’s accounting policies under IFRS and to convert them from US dollars into Sterling using the exchange rates that AMEC used to convert the results of its US subsidiaries from US dollars into Sterling for the period presented. Foster Wheeler’s results have not, however, been further adjusted to retrospectively apply the purchase accounting adjustments that were made by AMEC to Foster Wheeler’s balance sheet at the acquisition date in accordance with IFRS.
Scope revenue
Scope revenue represents reported revenue less pass-through procurement revenue. Pass-through procurement revenue is recognised when we purchase materials, equipment or third-party services for our customers on a reimbursable basis and do not recognise any profit. Scope revenue therefore represents the revenue that we have earned from providing services to our customers.
£m unless stated H1 2015
Actual H1 2014
Pro forma H1 2014
Actual
Continuing operations Revenue 2,664 2,807 1,858 Pass-through procurement revenue (83) (194) (50)
Scope revenue 2,581 2,613 1,808
Profitability measures
We use three measures of profitability that are not recognised measures under IFRS: trading profit, trading margin and adjusted profit before tax. As appropriate, we exclude the following specific items in arriving at these measures: exceptional items, the amortisation of intangible assets, and asbestos-related costs (net of insurance recoveries). Exceptional items are items of income and expense that are material by their size, incidence or nature and may include, but are not restricted to: acquisition-related costs, restructuring costs, gains and losses on the disposal of fixed assets, and gains and losses on the disposal or closure of businesses. Acquisition-related costs may include transaction costs (including external advisory, legal, valuation and other professional fees and attributable internal costs), the amortisation of acquisition-related facility fees, payments to selling shareholders that are accounted for as remuneration and changes in the fair value of contingent consideration. Trading profit Trading profit represents profit before net financing expense excluding exceptional items, the amortisation of intangible assets and asbestos-related costs (net of insurance recoveries). Trading profit includes the group’s share of the trading profit of joint ventures.
H1 2015
£m H1 2014
£m
Continuing operations
Profit before net financing expense 83 76 Intangibles amortisation 65 21 Net asbestos-related items (7) - Exceptional items 25 44 Share of trading profit of joint ventures 22 11
Trading profit 188 152
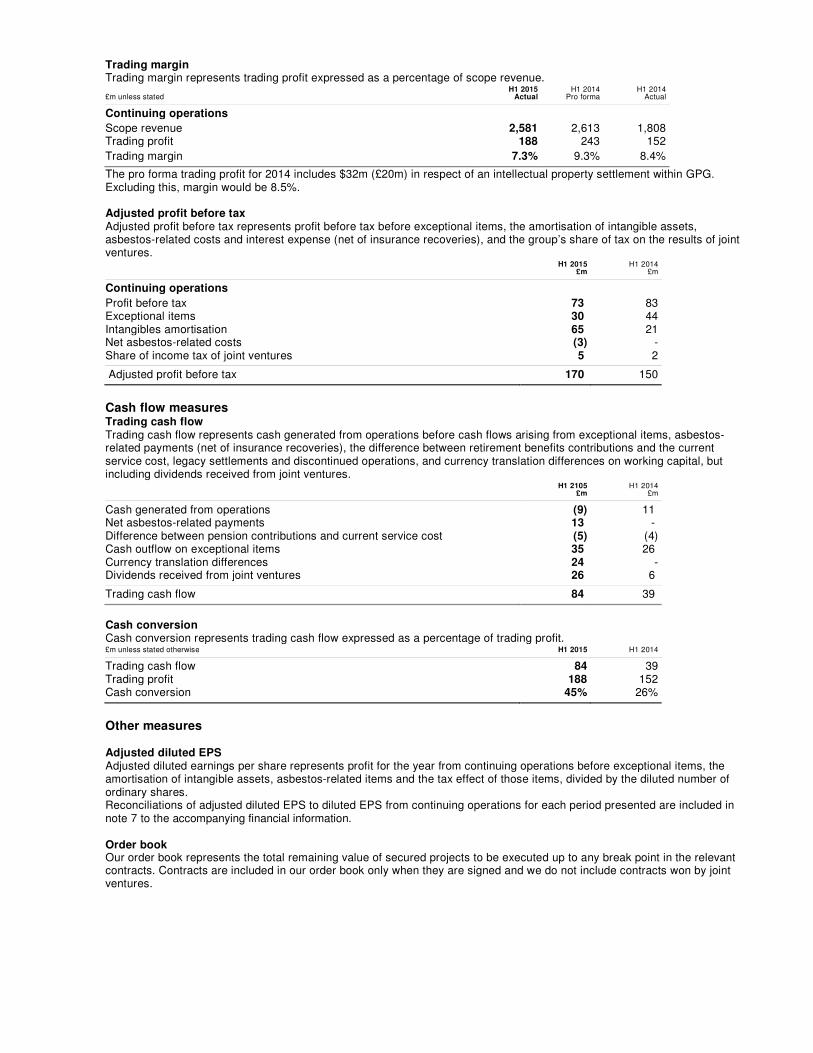
Trading margin Trading margin represents trading profit expressed as a percentage of scope revenue.
£m unless stated H1 2015
Actual H1 2014
Pro forma H1 2014
Actual
Continuing operations
Scope revenue 2,581 2,613 1,808 Trading profit 188 243 152
Trading margin 7.3% 9.3% 8.4%
The pro forma trading profit for 2014 includes $32m (£20m) in respect of an intellectual property settlement within GPG. Excluding this, margin would be 8.5%. Adjusted profit before tax Adjusted profit before tax represents profit before tax before exceptional items, the amortisation of intangible assets, asbestos-related costs and interest expense (net of insurance recoveries), and the group’s share of tax on the results of joint ventures.
H1 2015
£m H1 2014
£m
Continuing operations
Profit before tax 73 83 Exceptional items 30 44 Intangibles amortisation 65 21 Net asbestos-related costs (3) - Share of income tax of joint ventures 5 2
Adjusted profit before tax 170 150
Cash flow measures Trading cash flow Trading cash flow represents cash generated from operations before cash flows arising from exceptional items, asbestos-related payments (net of insurance recoveries), the difference between retirement benefits contributions and the current service cost, legacy settlements and discontinued operations, and currency translation differences on working capital, but including dividends received from joint ventures.
H1 2105
£m H1 2014
£m
Cash generated from operations (9) 11 Net asbestos-related payments 13 - Difference between pension contributions and current service cost (5) (4) Cash outflow on exceptional items 35 26 Currency translation differences 24 - Dividends received from joint ventures 26 6
Trading cash flow 84 39
Cash conversion Cash conversion represents trading cash flow expressed as a percentage of trading profit. £m unless stated otherwise H1 2015 H1 2014
Trading cash flow 84 39 Trading profit 188 152 Cash conversion 45% 26%
Other measures Adjusted diluted EPS Adjusted diluted earnings per share represents profit for the year from continuing operations before exceptional items, the amortisation of intangible assets, asbestos-related items and the tax effect of those items, divided by the diluted number of ordinary shares. Reconciliations of adjusted diluted EPS to diluted EPS from continuing operations for each period presented are included in note 7 to the accompanying financial information. Order book Our order book represents the total remaining value of secured projects to be executed up to any break point in the relevant contracts. Contracts are included in our order book only when they are signed and we do not include contracts won by joint ventures.
Business risks and opportunities
Amec Foster Wheeler operates in some 50 countries globally, serving a broad range of markets and customers. As such, the group is subject to certain general and industry-specific risks. Where practicable, the group seeks to mitigate exposure to all forms of risk through effective risk management and risk transfer practices. Amec Foster Wheeler operates predominantly in Europe and North America and is therefore particularly affected by political and economic conditions in those markets. Changes in general economic conditions may influence customers’ decisions on capital investment and/or asset maintenance, which could lead to volatility in the development of Amec Foster Wheeler’s order intake. These may also lead to change in the customer base, competition and in the way customers procure the services we provide. Amec Foster Wheeler seeks to maintain a balanced geographic presence, and, through acquisition and organic growth, will continue to increase its exposure to other attractive regions of the world. The risks associated with economic conditions resulting in a downturn and affecting the demand for Amec Foster Wheeler’s services has been addressed, as far as practicable, by seeking to maintain a balanced business portfolio in terms of geographies, markets, clients and service offering / business model. In light of continuing global economic uncertainties, steps have been taken to assess and monitor any potential impact on Amec Foster Wheeler’s business opportunities and address potential increased supply chain and, more broadly counter-party risk. In order to mitigate the risks associated with the acquisition of Foster Wheeler and the integration of the AMEC and Foster Wheeler businesses, Amec Foster Wheeler has put in place:
• robust processes for the preparation and submission of the documents and filings, including anti-trust documents • guidelines around communications and investor relations • detailed integration planning with an Integration Director appointed to lead the integration project steering committee
supported by external consultants.
Other risks Other than the specific risks detailed above, the board considers that the nature of the principal risks and uncertainties which may have a material effect on the group’s performance in the second half of the year is unchanged from those identified on pages 20 to 23 and in the risk factors on pages 164 to 168 of the 2014 annual report and accounts. These are changes in commodity prices; project delivery; lump sum contracts; staff recruitment and retention; health, safety, security and environment; environmental licences; information technology; ethical breach; pensions; legacy risks and asbestos liabilities.
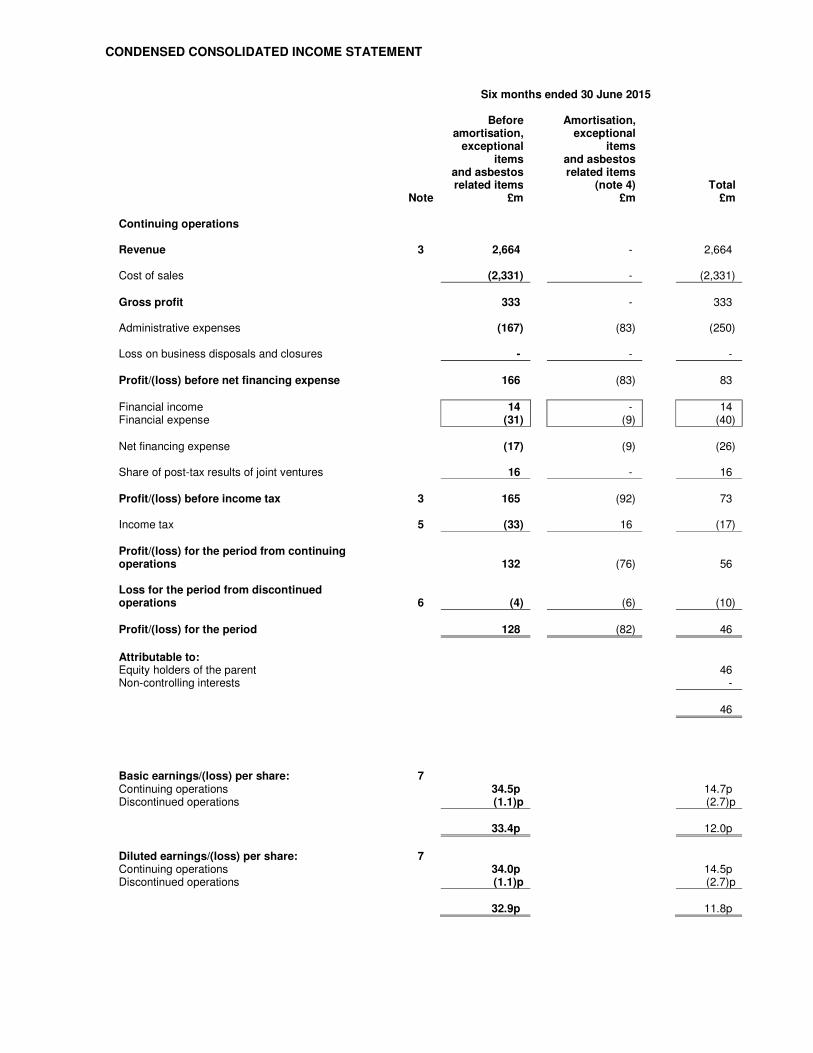
CONDENSED CONSOLIDATED INCOME STATEMENT
Six months ended 30 June 2015
Before Amortisation, amortisation, exceptional exceptional items items and asbestos and asbestos related items related items (note 4) Total Note £m £m £m Continuing operations Revenue 3 2,664 - 2,664 Cost of sales (2,331) - (2,331) Gross profit 333 - 333 Administrative expenses (167) (83) (250) Loss on business disposals and closures - - - Profit/(loss) before net financing expense 166 (83) 83 Financial income 14 - 14 Financial expense (31) (9) (40) Net financing expense (17) (9) (26) Share of post-tax results of joint ventures 16 - 16 Profit/(loss) before income tax 3 165 (92) 73 Income tax 5 (33) 16 (17) Profit/(loss) for the period from continuing operations 132 (76) 56 Loss for the period from discontinued operations 6 (4) (6) (10) Profit/(loss) for the period 128 (82) 46
Attributable to: Equity holders of the parent 46 Non-controlling interests - 46
Basic earnings/(loss) per share: 7 Continuing operations 34.5p 14.7p Discontinued operations (1.1)p (2.7)p 33.4p 12.0p
Diluted earnings/(loss) per share: 7 Continuing operations 34.0p 14.5p Discontinued operations (1.1)p (2.7)p 32.9p 11.8p
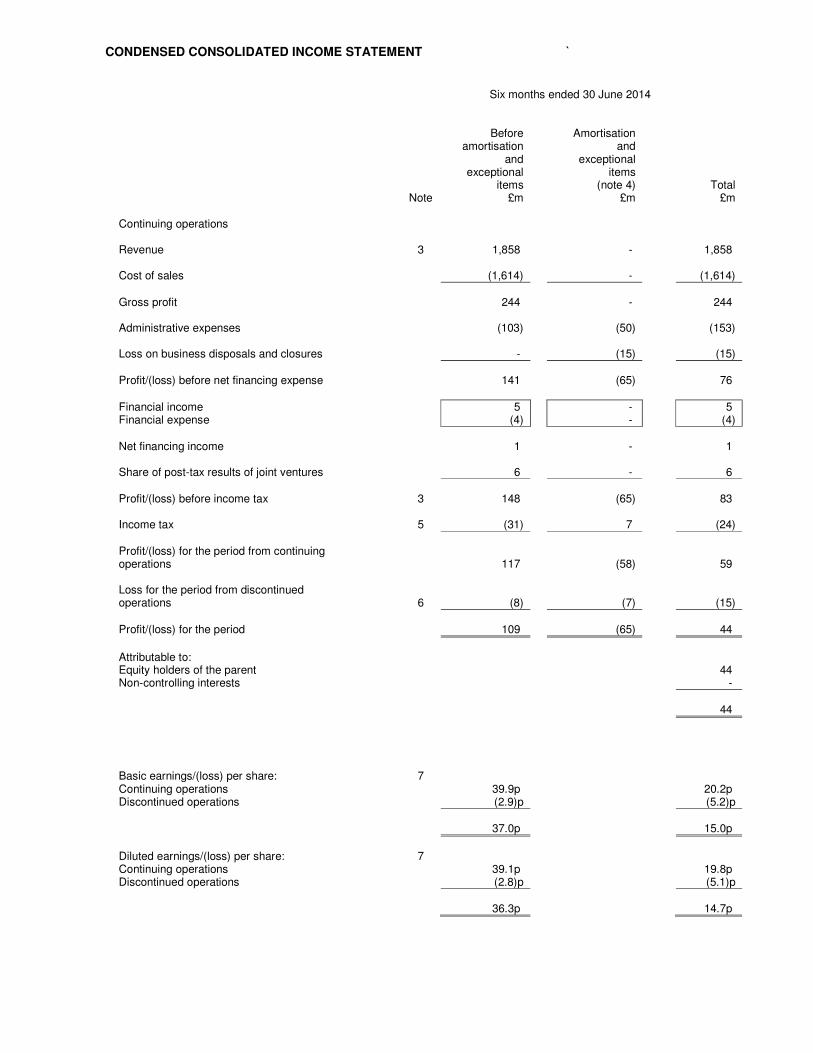
CONDENSED CONSOLIDATED INCOME STATEMENT `
Six months ended 30 June 2014
Before Amortisation amortisation and and exceptional exceptional items items (note 4) Total Note £m £m £m Continuing operations Revenue 3 1,858 - 1,858 Cost of sales (1,614) - (1,614) Gross profit 244 - 244 Administrative expenses (103) (50) (153) Loss on business disposals and closures - (15) (15) Profit/(loss) before net financing expense 141 (65) 76 Financial income 5 - 5 Financial expense (4) - (4) Net financing income 1 - 1 Share of post-tax results of joint ventures 6 - 6 Profit/(loss) before income tax 3 148 (65) 83 Income tax 5 (31) 7 (24) Profit/(loss) for the period from continuing operations 117 (58) 59 Loss for the period from discontinued operations 6 (8) (7) (15) Profit/(loss) for the period 109 (65) 44
Attributable to: Equity holders of the parent 44 Non-controlling interests - 44
Basic earnings/(loss) per share: 7 Continuing operations 39.9p 20.2p Discontinued operations (2.9)p (5.2)p 37.0p 15.0p
Diluted earnings/(loss) per share: 7 Continuing operations 39.1p 19.8p Discontinued operations (2.8)p (5.1)p 36.3p 14.7p
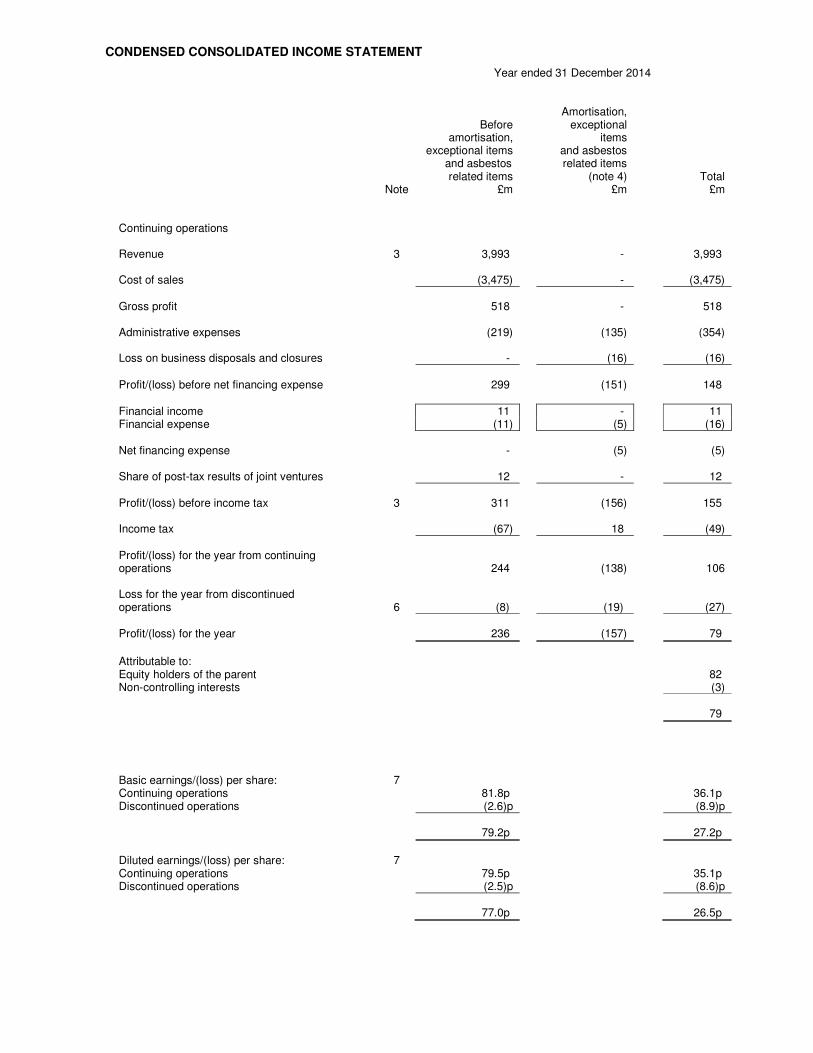
CONDENSED CONSOLIDATED INCOME STATEMENT
Year ended 31 December 2014
Amortisation, Before exceptional amortisation, items exceptional items and asbestos and asbestos related items related items (note 4) Total Note £m £m £m Continuing operations Revenue 3 3,993 - 3,993 Cost of sales (3,475) - (3,475) Gross profit 518 - 518 Administrative expenses (219) (135) (354) Loss on business disposals and closures - (16) (16) Profit/(loss) before net financing expense 299 (151) 148 Financial income 11 - 11 Financial expense (11) (5) (16) Net financing expense - (5) (5) Share of post-tax results of joint ventures 12 - 12 Profit/(loss) before income tax 3 311 (156) 155 Income tax (67) 18 (49) Profit/(loss) for the year from continuing operations 244 (138) 106 Loss for the year from discontinued operations 6 (8) (19) (27) Profit/(loss) for the year 236 (157) 79
Attributable to: Equity holders of the parent 82 Non-controlling interests (3) 79
Basic earnings/(loss) per share: 7 Continuing operations 81.8p 36.1p Discontinued operations (2.6)p (8.9)p 79.2p 27.2p
Diluted earnings/(loss) per share: 7 Continuing operations 79.5p 35.1p Discontinued operations (2.5)p (8.6)p 77.0p 26.5p
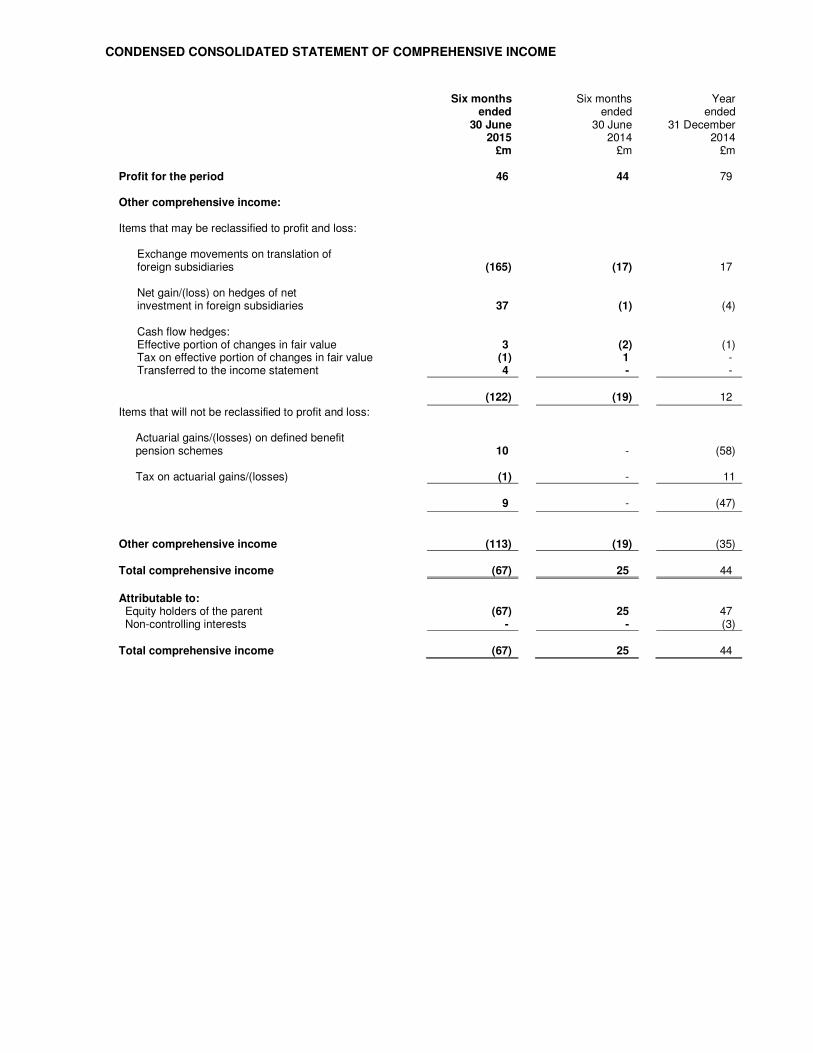
CONDENSED CONSOLIDATED STATEMENT OF COMPREHENSIVE INCOME
Six months Six months Year ended ended ended 30 June 30 June 31 December 2015 2014 2014 £m £m £m Profit for the period 46 44 79 Other comprehensive income: Items that may be reclassified to profit and loss: Exchange movements on translation of foreign subsidiaries (165) (17) 17 Net gain/(loss) on hedges of net investment in foreign subsidiaries 37 (1) (4) Cash flow hedges: Effective portion of changes in fair value 3 (2) (1) Tax on effective portion of changes in fair value (1) 1 - Transferred to the income statement 4 - -
(122)
(19)
12
Items that will not be reclassified to profit and loss:
Actuarial gains/(losses) on defined benefit pension schemes
10
- (58)
Tax on actuarial gains/(losses) (1) - 11
9
-
(47)
Other comprehensive income (113) (19) (35) Total comprehensive income (67) 25 44
Attributable to: Equity holders of the parent (67) 25 47 Non-controlling interests - - (3) Total comprehensive income (67) 25 44
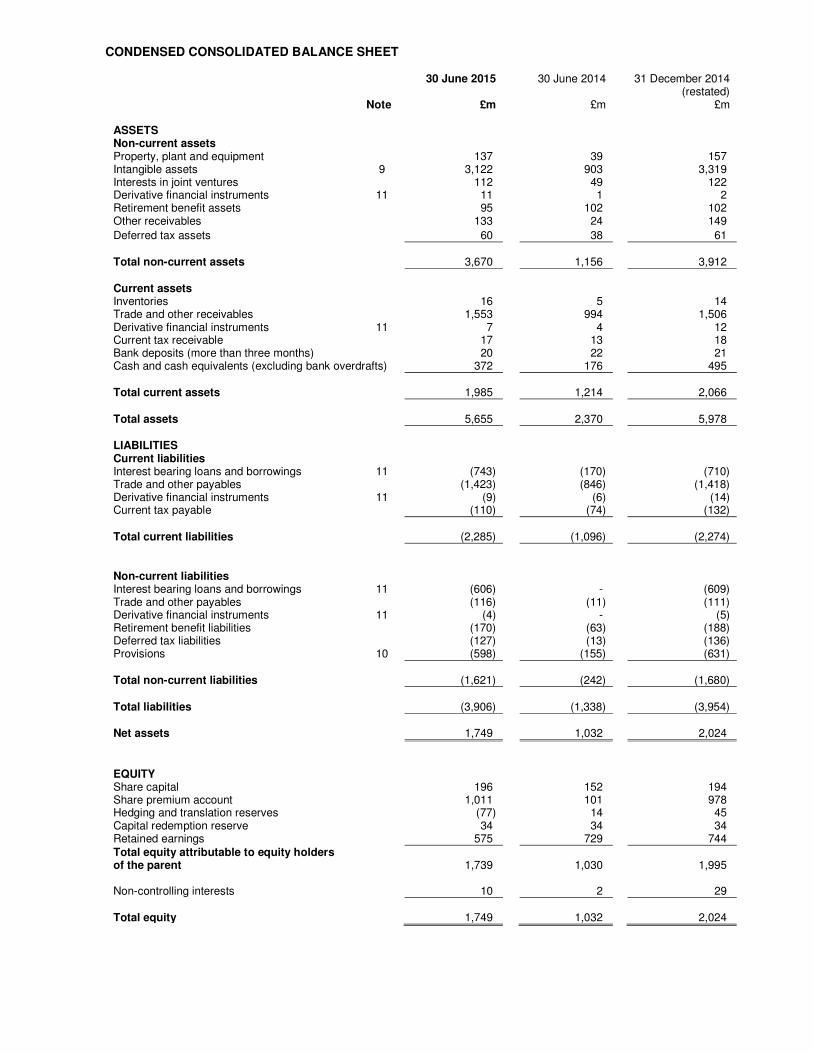
CONDENSED CONSOLIDATED BALANCE SHEET 30 June 2015 30 June 2014 31 December 2014 (restated) Note £m £m £m ASSETS Non-current assets Property, plant and equipment 137 39 157 Intangible assets 9 3,122 903 3,319 Interests in joint ventures 112 49 122 Derivative financial instruments 11 11 1 2 Retirement benefit assets 95 102 102 Other receivables 133 24 149
Deferred tax assets 60 38 61 Total non-current assets 3,670 1,156 3,912 Current assets Inventories 16 5 14 Trade and other receivables 1,553 994 1,506 Derivative financial instruments 11 7 4 12 Current tax receivable 17 13 18 Bank deposits (more than three months) 20 22 21 Cash and cash equivalents (excluding bank overdrafts) 372 176 495 Total current assets 1,985 1,214 2,066 Total assets 5,655 2,370 5,978 LIABILITIES Current liabilities Interest bearing loans and borrowings 11 (743) (170) (710) Trade and other payables (1,423) (846) (1,418) Derivative financial instruments 11 (9) (6) (14) Current tax payable (110) (74) (132) Total current liabilities (2,285) (1,096) (2,274) Non-current liabilities Interest bearing loans and borrowings 11 (606) - (609) Trade and other payables (116) (11) (111) Derivative financial instruments 11 (4) - (5) Retirement benefit liabilities (170) (63) (188) Deferred tax liabilities (127) (13) (136) Provisions 10 (598) (155) (631) Total non-current liabilities (1,621) (242) (1,680) Total liabilities (3,906) (1,338) (3,954) Net assets 1,749 1,032 2,024
EQUITY Share capital 196 152 194 Share premium account 1,011 101 978 Hedging and translation reserves (77) 14 45 Capital redemption reserve 34 34 34 Retained earnings 575 729 744 Total equity attributable to equity holders of the parent 1,739 1,030 1,995 Non-controlling interests 10 2 29 Total equity 1,749 1,032 2,024
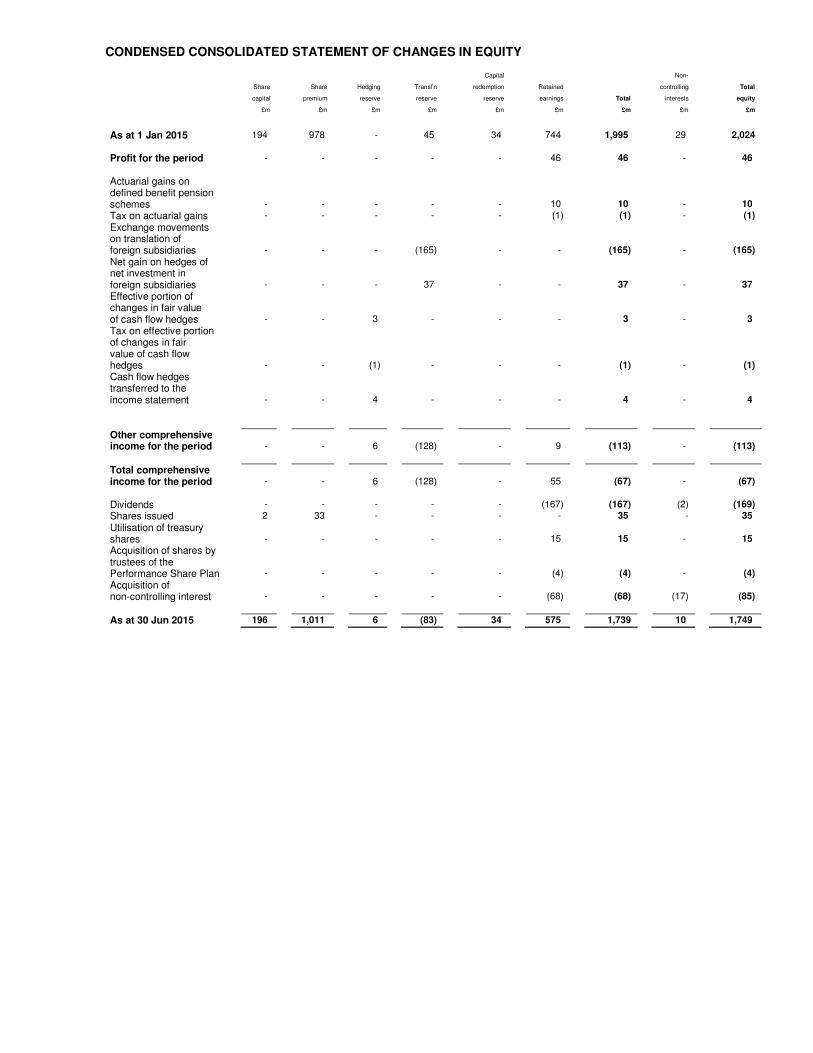
CONDENSED CONSOLIDATED STATEMENT OF CHANGES IN EQUITY Capital Non- Share Share Hedging Transl’n redemption Retained controlling Total
capital premium reserve reserve reserve earnings Total interests equity
£m £m £m £m £m £m £m £m £m
As at 1 Jan 2015 194 978 - 45 34 744 1,995 29 2,024
Profit for the period - - - - - 46 46 - 46
Actuarial gains on
defined benefit pension
schemes - - - - - 10 10 - 10
Tax on actuarial gains - - - - - (1) (1) - (1)
Exchange movements
on translation of
foreign subsidiaries - - - (165) - - (165) - (165)
Net gain on hedges of
net investment in
foreign subsidiaries - - - 37 - - 37 - 37
Effective portion of
changes in fair value
of cash flow hedges - - 3 - - - 3 - 3
Tax on effective portion
of changes in fair
value of cash flow
hedges - - (1) - - - (1) - (1)
Cash flow hedges
transferred to the
income statement - - 4 - - - 4 - 4
Other comprehensive
income for the period - - 6 (128) - 9 (113) - (113)
Total comprehensive
income for the period - - 6 (128) - 55 (67) - (67)
Dividends - - - - - (167) (167) (2) (169)
Shares issued 2 33 - - - - 35 - 35
Utilisation of treasury
shares - - - - - 15 15 - 15
Acquisition of shares by
trustees of the
Performance Share Plan - - - - - (4) (4) - (4)
Acquisition of
non-controlling interest - - - - - (68) (68) (17) (85)
As at 30 Jun 2015 196 1,011 6 (83) 34 575 1,739 10 1,749
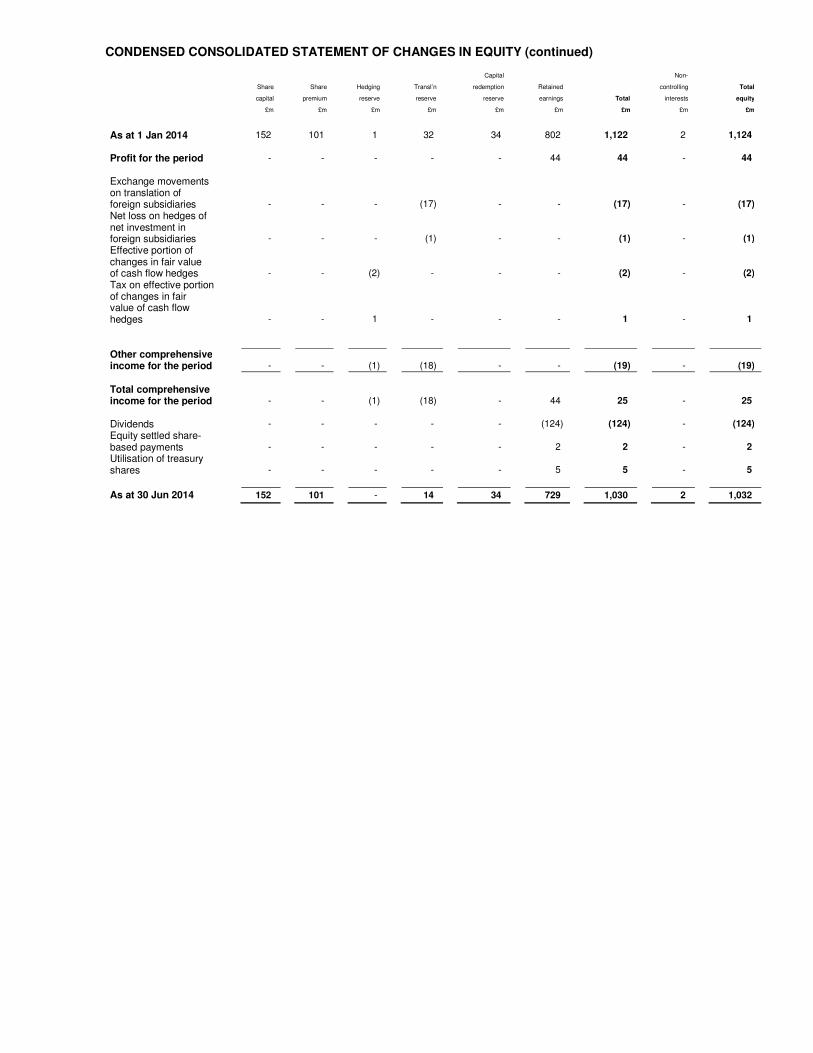
CONDENSED CONSOLIDATED STATEMENT OF CHANGES IN EQUITY (continued) Capital Non- Share Share Hedging Transl’n redemption Retained controlling Total
capital premium reserve reserve reserve earnings Total interests equity
£m £m £m £m £m £m £m £m £m
As at 1 Jan 2014 152 101 1 32 34 802 1,122 2 1,124
Profit for the period - - - - - 44 44 - 44
Exchange movements
on translation of
foreign subsidiaries - - - (17) - - (17) - (17)
Net loss on hedges of
net investment in
foreign subsidiaries - - - (1) - - (1) - (1)
Effective portion of
changes in fair value
of cash flow hedges - - (2) - - - (2) - (2)
Tax on effective portion
of changes in fair
value of cash flow
hedges - - 1 - - - 1 - 1
Other comprehensive
income for the period - - (1) (18) - - (19) - (19)
Total comprehensive
income for the period - - (1) (18) - 44 25 - 25
Dividends - - - - - (124) (124) - (124)
Equity settled share-
based payments - - - - - 2 2 - 2
Utilisation of treasury
shares - - - - - 5 5 - 5
As at 30 Jun 2014 152 101 - 14 34 729 1,030 2 1,032
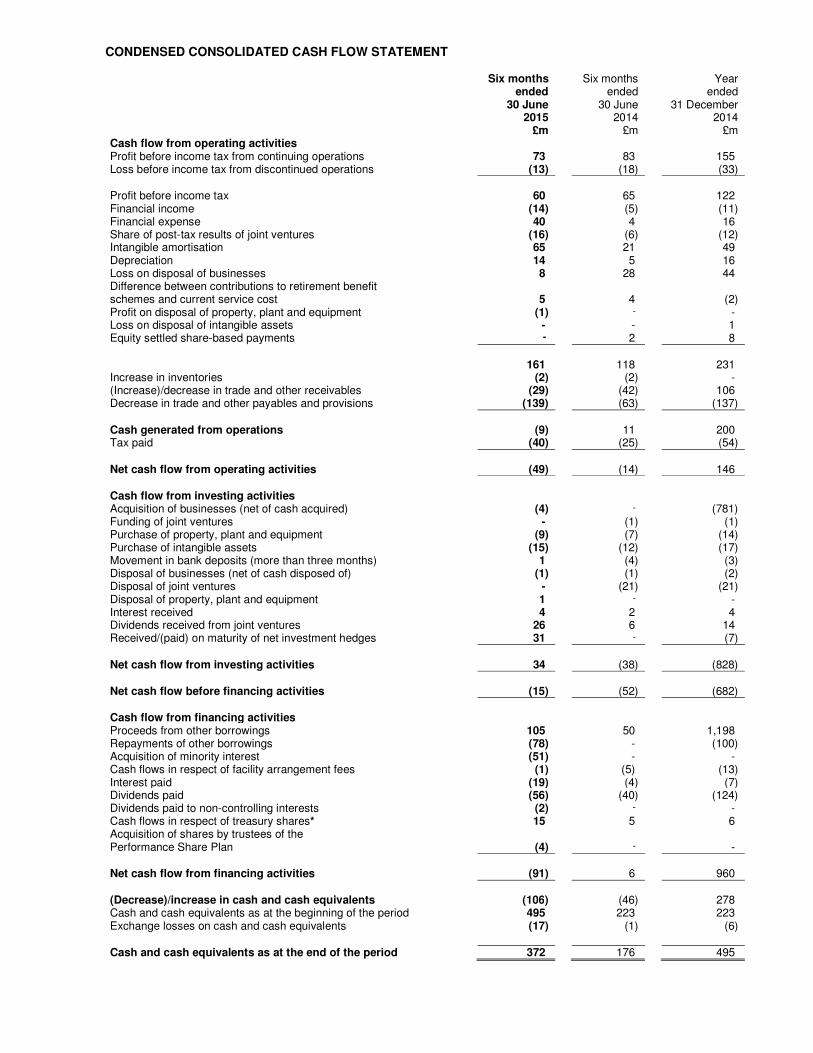
CONDENSED CONSOLIDATED CASH FLOW STATEMENT Six months Six months Year ended ended ended 30 June 30 June 31 December 2015 2014 2014 £m £m £m Cash flow from operating activities Profit before income tax from continuing operations 73 83 155 Loss before income tax from discontinued operations (13) (18) (33) Profit before income tax 60 65 122 Financial income (14) (5) (11) Financial expense 40 4 16 Share of post-tax results of joint ventures (16) (6) (12) Intangible amortisation 65 21 49 Depreciation 14 5 16 Loss on disposal of businesses 8 28 44 Difference between contributions to retirement benefit schemes and current service cost 5 4 (2) Profit on disposal of property, plant and equipment (1) - - Loss on disposal of intangible assets - - 1 Equity settled share-based payments - 2 8 161 118 231 Increase in inventories (2) (2) - (Increase)/decrease in trade and other receivables (29) (42) 106 Decrease in trade and other payables and provisions (139) (63) (137) Cash generated from operations (9) 11 200 Tax paid (40) (25) (54) Net cash flow from operating activities (49) (14) 146 Cash flow from investing activities Acquisition of businesses (net of cash acquired) (4) - (781) Funding of joint ventures - (1) (1) Purchase of property, plant and equipment (9) (7) (14) Purchase of intangible assets (15) (12) (17) Movement in bank deposits (more than three months) 1 (4) (3) Disposal of businesses (net of cash disposed of) (1) (1) (2) Disposal of joint ventures - (21) (21) Disposal of property, plant and equipment 1 - - Interest received 4 2 4 Dividends received from joint ventures 26 6 14 Received/(paid) on maturity of net investment hedges 31 - (7) Net cash flow from investing activities 34 (38) (828) Net cash flow before financing activities (15) (52) (682) Cash flow from financing activities Proceeds from other borrowings 105 50 1,198 Repayments of other borrowings (78) - (100) Acquisition of minority interest (51) - - Cash flows in respect of facility arrangement fees (1) (5) (13) Interest paid (19) (4) (7) Dividends paid (56) (40) (124) Dividends paid to non-controlling interests (2) - - Cash flows in respect of treasury shares* 15 5 6 Acquisition of shares by trustees of the Performance Share Plan (4) - - Net cash flow from financing activities (91) 6 960 (Decrease)/increase in cash and cash equivalents (106) (46) 278 Cash and cash equivalents as at the beginning of the period 495 223 223 Exchange losses on cash and cash equivalents (17) (1) (6) Cash and cash equivalents as at the end of the period 372 176 495
CONDENSED CONSOLIDATED CASH FLOW STATEMENT (continued)
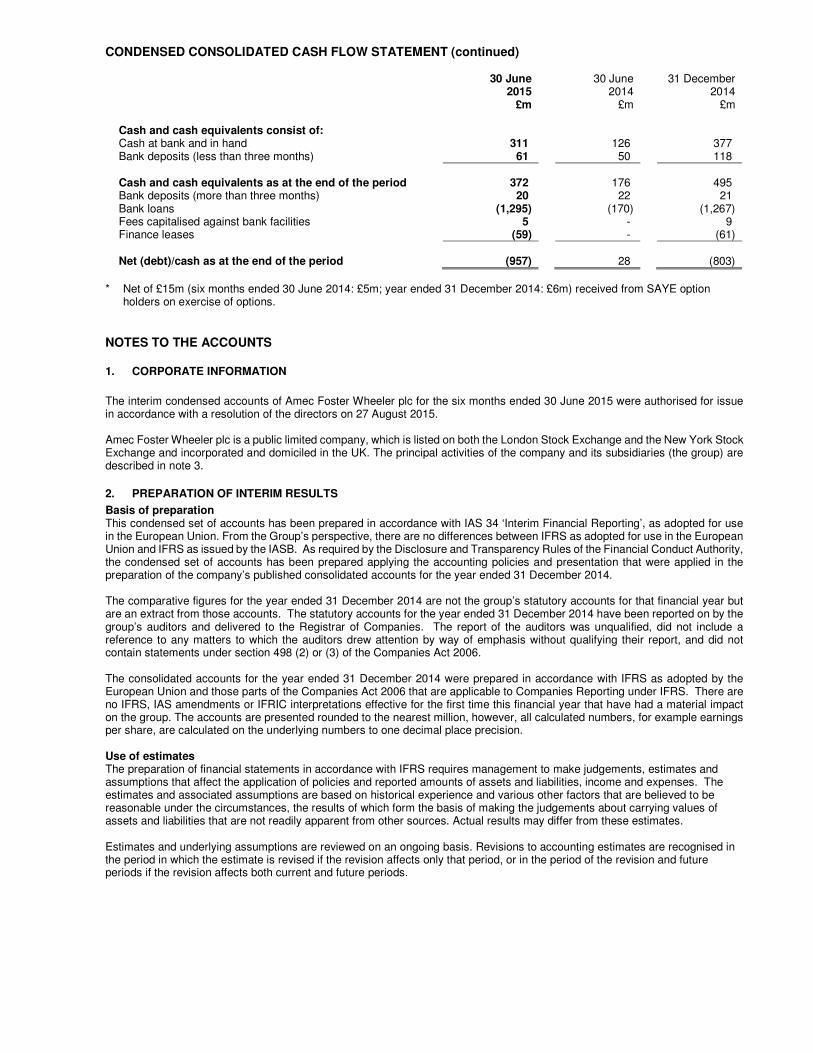
30 June 30 June 31 December 2015 2014 2014 £m £m £m Cash and cash equivalents consist of: Cash at bank and in hand 311 126 377 Bank deposits (less than three months) 61 50 118 Cash and cash equivalents as at the end of the period 372 176 495 Bank deposits (more than three months) 20 22 21 Bank loans (1,295) (170) (1,267) Fees capitalised against bank facilities 5 - 9 Finance leases (59) - (61) Net (debt)/cash as at the end of the period (957) 28 (803)
* Net of £15m (six months ended 30 June 2014: £5m; year ended 31 December 2014: £6m) received from SAYE option
holders on exercise of options. NOTES TO THE ACCOUNTS
1. CORPORATE INFORMATION
The interim condensed accounts of Amec Foster Wheeler plc for the six months ended 30 June 2015 were authorised for issue in accordance with a resolution of the directors on 27 August 2015. Amec Foster Wheeler plc is a public limited company, which is listed on both the London Stock Exchange and the New York Stock Exchange and incorporated and domiciled in the UK. The principal activities of the company and its subsidiaries (the group) are described in note 3.
2. PREPARATION OF INTERIM RESULTS
Basis of preparation This condensed set of accounts has been prepared in accordance with IAS 34 ‘Interim Financial Reporting’, as adopted for use in the European Union. From the Group’s perspective, there are no differences between IFRS as adopted for use in the European Union and IFRS as issued by the IASB. As required by the Disclosure and Transparency Rules of the Financial Conduct Authority, the condensed set of accounts has been prepared applying the accounting policies and presentation that were applied in the preparation of the company’s published consolidated accounts for the year ended 31 December 2014. The comparative figures for the year ended 31 December 2014 are not the group’s statutory accounts for that financial year but are an extract from those accounts. The statutory accounts for the year ended 31 December 2014 have been reported on by the group’s auditors and delivered to the Registrar of Companies. The report of the auditors was unqualified, did not include a reference to any matters to which the auditors drew attention by way of emphasis without qualifying their report, and did not contain statements under section 498 (2) or (3) of the Companies Act 2006. The consolidated accounts for the year ended 31 December 2014 were prepared in accordance with IFRS as adopted by the European Union and those parts of the Companies Act 2006 that are applicable to Companies Reporting under IFRS. There are no IFRS, IAS amendments or IFRIC interpretations effective for the first time this financial year that have had a material impact on the group. The accounts are presented rounded to the nearest million, however, all calculated numbers, for example earnings per share, are calculated on the underlying numbers to one decimal place precision. Use of estimates The preparation of financial statements in accordance with IFRS requires management to make judgements, estimates and assumptions that affect the application of policies and reported amounts of assets and liabilities, income and expenses. The estimates and associated assumptions are based on historical experience and various other factors that are believed to be reasonable under the circumstances, the results of which form the basis of making the judgements about carrying values of assets and liabilities that are not readily apparent from other sources. Actual results may differ from these estimates. Estimates and underlying assumptions are reviewed on an ongoing basis. Revisions to accounting estimates are recognised in the period in which the estimate is revised if the revision affects only that period, or in the period of the revision and future periods if the revision affects both current and future periods.
NOTES TO THE ACCOUNTS (continued)
2. PREPARATION OF INTERIM RESULTS (continued)
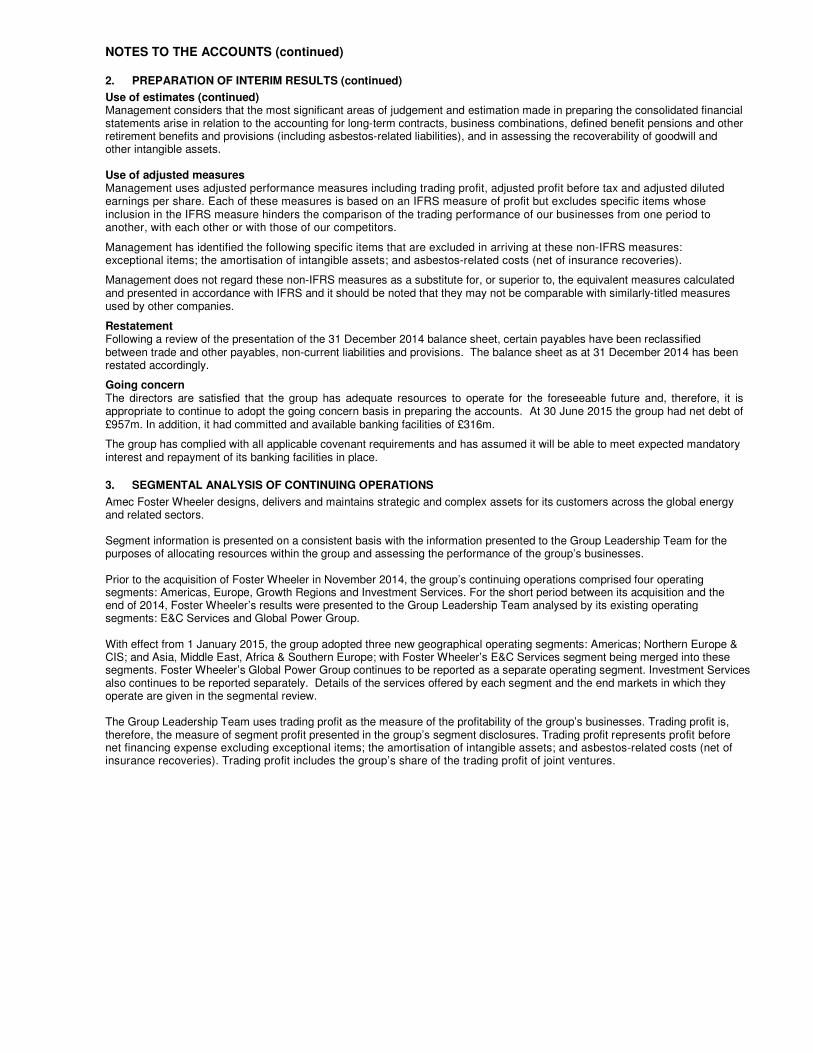
Use of estimates (continued) Management considers that the most significant areas of judgement and estimation made in preparing the consolidated financial statements arise in relation to the accounting for long-term contracts, business combinations, defined benefit pensions and other retirement benefits and provisions (including asbestos-related liabilities), and in assessing the recoverability of goodwill and other intangible assets. Use of adjusted measures Management uses adjusted performance measures including trading profit, adjusted profit before tax and adjusted diluted earnings per share. Each of these measures is based on an IFRS measure of profit but excludes specific items whose inclusion in the IFRS measure hinders the comparison of the trading performance of our businesses from one period to another, with each other or with those of our competitors.
Management has identified the following specific items that are excluded in arriving at these non-IFRS measures: exceptional items; the amortisation of intangible assets; and asbestos-related costs (net of insurance recoveries).
Management does not regard these non-IFRS measures as a substitute for, or superior to, the equivalent measures calculated and presented in accordance with IFRS and it should be noted that they may not be comparable with similarly-titled measures used by other companies.
Restatement Following a review of the presentation of the 31 December 2014 balance sheet, certain payables have been reclassified between trade and other payables, non-current liabilities and provisions. The balance sheet as at 31 December 2014 has been restated accordingly.
Going concern The directors are satisfied that the group has adequate resources to operate for the foreseeable future and, therefore, it is appropriate to continue to adopt the going concern basis in preparing the accounts. At 30 June 2015 the group had net debt of £957m. In addition, it had committed and available banking facilities of £316m.
The group has complied with all applicable covenant requirements and has assumed it will be able to meet expected mandatory interest and repayment of its banking facilities in place.
3. SEGMENTAL ANALYSIS OF CONTINUING OPERATIONS
Amec Foster Wheeler designs, delivers and maintains strategic and complex assets for its customers across the global energy and related sectors. Segment information is presented on a consistent basis with the information presented to the Group Leadership Team for the purposes of allocating resources within the group and assessing the performance of the group’s businesses. Prior to the acquisition of Foster Wheeler in November 2014, the group’s continuing operations comprised four operating segments: Americas, Europe, Growth Regions and Investment Services. For the short period between its acquisition and the end of 2014, Foster Wheeler’s results were presented to the Group Leadership Team analysed by its existing operating segments: E&C Services and Global Power Group. With effect from 1 January 2015, the group adopted three new geographical operating segments: Americas; Northern Europe & CIS; and Asia, Middle East, Africa & Southern Europe; with Foster Wheeler’s E&C Services segment being merged into these segments. Foster Wheeler’s Global Power Group continues to be reported as a separate operating segment. Investment Services also continues to be reported separately. Details of the services offered by each segment and the end markets in which they operate are given in the segmental review. The Group Leadership Team uses trading profit as the measure of the profitability of the group’s businesses. Trading profit is, therefore, the measure of segment profit presented in the group’s segment disclosures. Trading profit represents profit before net financing expense excluding exceptional items; the amortisation of intangible assets; and asbestos-related costs (net of insurance recoveries). Trading profit includes the group’s share of the trading profit of joint ventures.
NOTES TO THE ACCOUNTS (continued)
3. SEGMENTAL ANALYSIS OF CONTINUING OPERATIONS (continued)
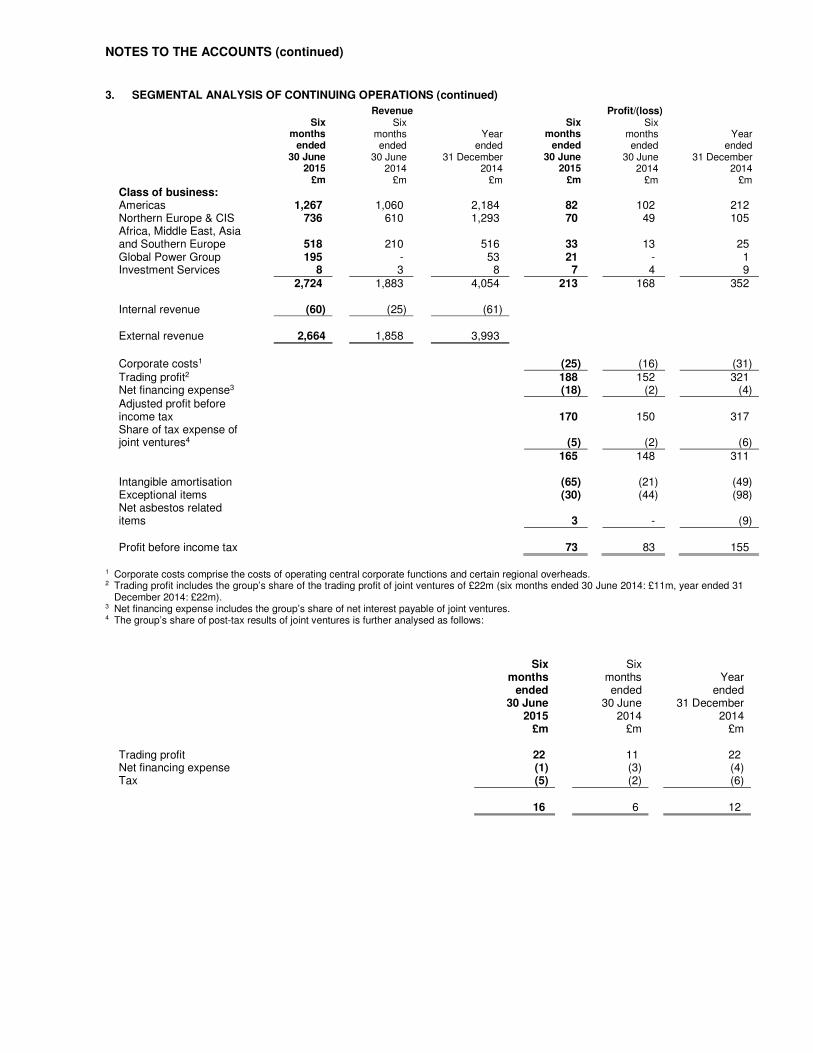
Revenue Profit/(loss) Six Six Six Six months months Year months months Year ended ended ended ended ended ended 30 June 30 June 31 December 30 June 30 June 31 December 2015 2014 2014 2015 2014 2014 £m £m £m £m £m £m
Class of business: Americas 1,267 1,060 2,184 82 102 212 Northern Europe & CIS 736 610 1,293 70 49 105 Africa, Middle East, Asia and Southern Europe 518 210 516 33 13 25 Global Power Group 195 - 53 21 - 1 Investment Services 8 3 8 7 4 9 2,724 1,883 4,054 213 168 352 Internal revenue (60) (25) (61) External revenue 2,664 1,858 3,993
Corporate costs1 (25) (16) (31) Trading profit2 188 152 321 Net financing expense3 (18) (2) (4) Adjusted profit before income tax
170
150 317
Share of tax expense of joint ventures4 (5) (2) (6) 165 148 311 Intangible amortisation (65) (21) (49) Exceptional items (30) (44) (98) Net asbestos related items
3
-
(9)
Profit before income tax 73 83 155
1 Corporate costs comprise the costs of operating central corporate functions and certain regional overheads. 2 Trading profit includes the group’s share of the trading profit of joint ventures of £22m (six months ended 30 June 2014: £11m, year ended 31
December 2014: £22m). 3 Net financing expense includes the group’s share of net interest payable of joint ventures. 4 The group’s share of post-tax results of joint ventures is further analysed as follows:
Six Six months months Year ended ended ended 30 June 30 June 31 December 2015 2014 2014 £m £m £m Trading profit 22 11 22 Net financing expense (1) (3) (4) Tax (5) (2) (6) 16 6 12
NOTES TO THE ACCOUNTS (continued)
4. AMORTISATION, EXCEPTIONAL ITEMS AND ASBESTOS RELATED ITEMS
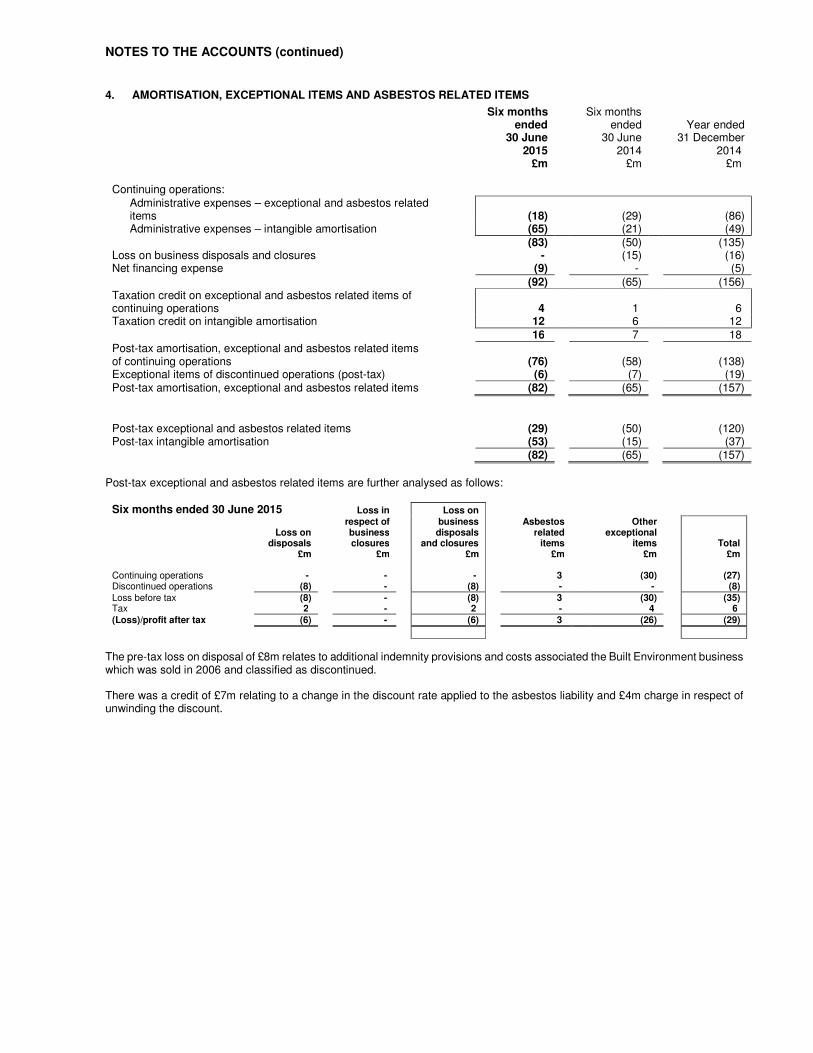
Six months Six months ended ended Year ended 30 June 30 June 31 December 2015 2014 2014 £m £m £m Continuing operations: Administrative expenses – exceptional and asbestos related
items
(18) (29) (86) Administrative expenses – intangible amortisation (65) (21) (49) (83) (50) (135) Loss on business disposals and closures - (15) (16) Net financing expense (9) - (5) (92) (65) (156) Taxation credit on exceptional and asbestos related items of continuing operations
4 1 6
Taxation credit on intangible amortisation 12 6 12 16 7 18 Post-tax amortisation, exceptional and asbestos related items of continuing operations (76) (58) (138) Exceptional items of discontinued operations (post-tax) (6) (7) (19) Post-tax amortisation, exceptional and asbestos related items (82) (65) (157)
Post-tax exceptional and asbestos related items (29) (50) (120) Post-tax intangible amortisation (53) (15) (37) (82) (65) (157)
Post-tax exceptional and asbestos related items are further analysed as follows:
Six months ended 30 June 2015 Loss in Loss on
respect of business Asbestos Other Loss on business disposals related exceptional disposals closures and closures items items Total £m £m £m £m £m £m Continuing operations - - - 3 (30) (27) Discontinued operations (8) - (8) - - (8) Loss before tax (8) - (8) 3 (30) (35) Tax 2 - 2 - 4 6 (Loss)/profit after tax (6) - (6) 3 (26) (29)
The pre-tax loss on disposal of £8m relates to additional indemnity provisions and costs associated the Built Environment business which was sold in 2006 and classified as discontinued. There was a credit of £7m relating to a change in the discount rate applied to the asbestos liability and £4m charge in respect of unwinding the discount.
NOTES TO THE ACCOUNTS (continued)
4. AMORTISATION, EXCEPTIONAL ITEMS AND ASBESTOS RELATED ITEMS (continued)
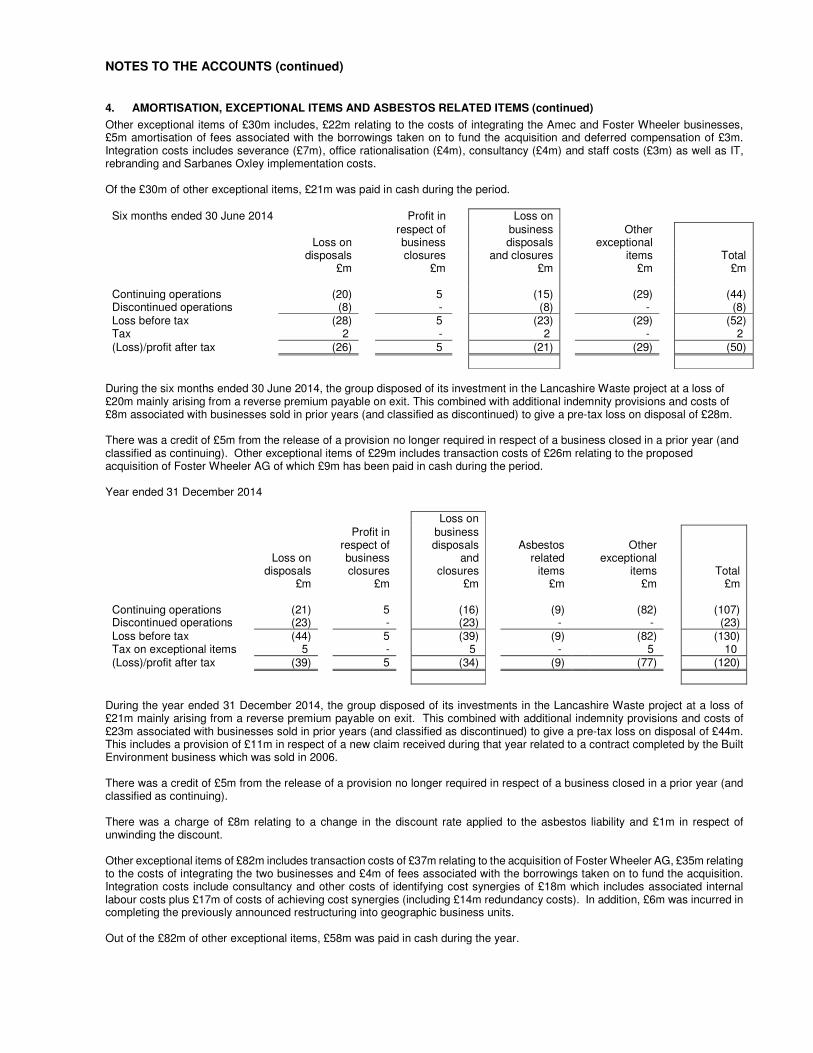
Other exceptional items of £30m includes, £22m relating to the costs of integrating the Amec and Foster Wheeler businesses, £5m amortisation of fees associated with the borrowings taken on to fund the acquisition and deferred compensation of £3m. Integration costs includes severance (£7m), office rationalisation (£4m), consultancy (£4m) and staff costs (£3m) as well as IT, rebranding and Sarbanes Oxley implementation costs. Of the £30m of other exceptional items, £21m was paid in cash during the period.
Six months ended 30 June 2014 Profit in Loss on respect of business Other Loss on business disposals exceptional disposals closures and closures items Total £m £m £m £m £m Continuing operations (20) 5 (15) (29) (44) Discontinued operations (8) - (8) - (8) Loss before tax (28) 5 (23) (29) (52) Tax 2 - 2 - 2 (Loss)/profit after tax (26) 5 (21) (29) (50)
During the six months ended 30 June 2014, the group disposed of its investment in the Lancashire Waste project at a loss of £20m mainly arising from a reverse premium payable on exit. This combined with additional indemnity provisions and costs of £8m associated with businesses sold in prior years (and classified as discontinued) to give a pre-tax loss on disposal of £28m. There was a credit of £5m from the release of a provision no longer required in respect of a business closed in a prior year (and classified as continuing). Other exceptional items of £29m includes transaction costs of £26m relating to the proposed acquisition of Foster Wheeler AG of which £9m has been paid in cash during the period. Year ended 31 December 2014
Loss on Profit in business respect of disposals Asbestos Other Loss on business and related exceptional disposals closures closures items items Total £m £m £m £m £m £m Continuing operations (21) 5 (16) (9) (82) (107) Discontinued operations (23) - (23) - - (23) Loss before tax (44) 5 (39) (9) (82) (130) Tax on exceptional items 5 - 5 - 5 10 (Loss)/profit after tax (39) 5 (34) (9) (77) (120)
During the year ended 31 December 2014, the group disposed of its investments in the Lancashire Waste project at a loss of £21m mainly arising from a reverse premium payable on exit. This combined with additional indemnity provisions and costs of £23m associated with businesses sold in prior years (and classified as discontinued) to give a pre-tax loss on disposal of £44m. This includes a provision of £11m in respect of a new claim received during that year related to a contract completed by the Built Environment business which was sold in 2006. There was a credit of £5m from the release of a provision no longer required in respect of a business closed in a prior year (and classified as continuing). There was a charge of £8m relating to a change in the discount rate applied to the asbestos liability and £1m in respect of unwinding the discount. Other exceptional items of £82m includes transaction costs of £37m relating to the acquisition of Foster Wheeler AG, £35m relating to the costs of integrating the two businesses and £4m of fees associated with the borrowings taken on to fund the acquisition. Integration costs include consultancy and other costs of identifying cost synergies of £18m which includes associated internal labour costs plus £17m of costs of achieving cost synergies (including £14m redundancy costs). In addition, £6m was incurred in completing the previously announced restructuring into geographic business units. Out of the £82m of other exceptional items, £58m was paid in cash during the year.
NOTES TO THE ACCOUNTS (continued)
5. INCOME TAX
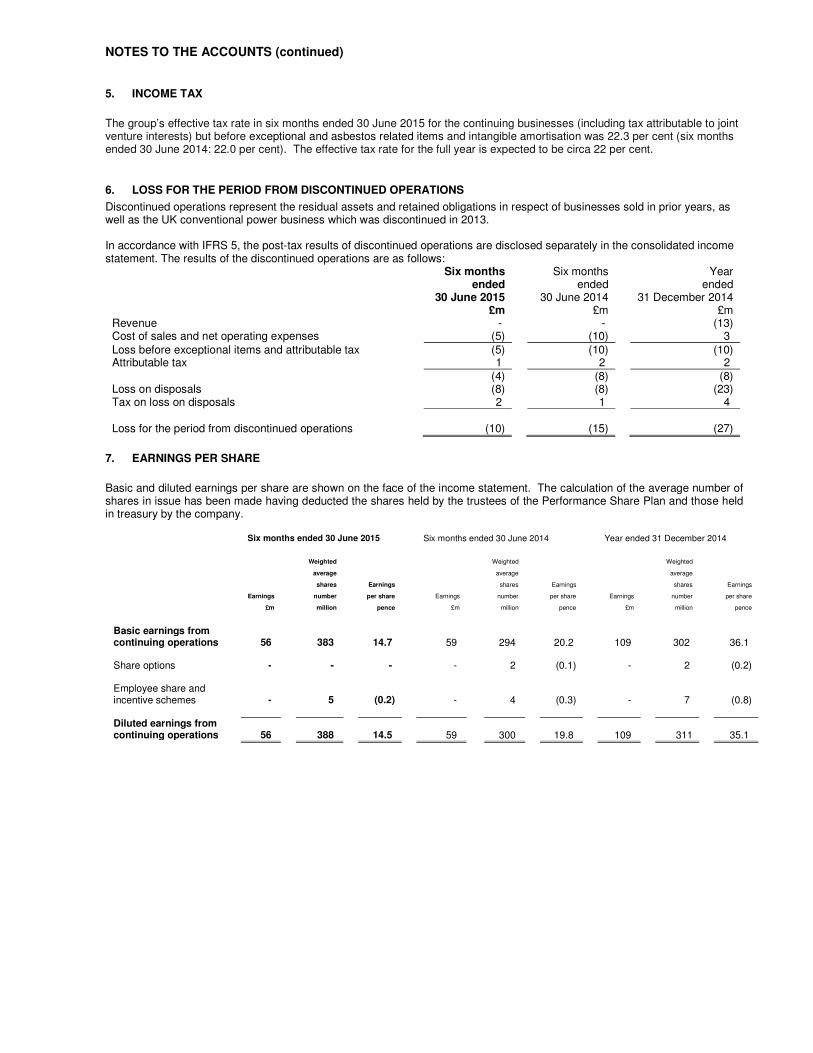
The group’s effective tax rate in six months ended 30 June 2015 for the continuing businesses (including tax attributable to joint venture interests) but before exceptional and asbestos related items and intangible amortisation was 22.3 per cent (six months ended 30 June 2014: 22.0 per cent). The effective tax rate for the full year is expected to be circa 22 per cent.
6. LOSS FOR THE PERIOD FROM DISCONTINUED OPERATIONS
Discontinued operations represent the residual assets and retained obligations in respect of businesses sold in prior years, as well as the UK conventional power business which was discontinued in 2013. In accordance with IFRS 5, the post-tax results of discontinued operations are disclosed separately in the consolidated income statement. The results of the discontinued operations are as follows:
Six months ended
30 June 2015
Six months ended
30 June 2014
Year ended
31 December 2014 £m £m £m Revenue - - (13) Cost of sales and net operating expenses (5) (10) 3 Loss before exceptional items and attributable tax (5) (10) (10) Attributable tax 1 2 2 (4) (8) (8) Loss on disposals (8) (8) (23) Tax on loss on disposals 2 1 4 Loss for the period from discontinued operations (10) (15) (27)
7. EARNINGS PER SHARE
Basic and diluted earnings per share are shown on the face of the income statement. The calculation of the average number of shares in issue has been made having deducted the shares held by the trustees of the Performance Share Plan and those held in treasury by the company.
Six months ended 30 June 2015 Six months ended 30 June 2014 Year ended 31 December 2014
Weighted Weighted Weighted
average average average
shares Earnings shares Earnings shares Earnings
Earnings number per share Earnings number per share Earnings number per share
£m million pence £m million pence £m million pence
Basic earnings from continuing operations 56 383 14.7 59 294 20.2 109 302 36.1 Share options - - - - 2 (0.1) - 2 (0.2) Employee share and incentive schemes - 5 (0.2) - 4 (0.3) - 7 (0.8) Diluted earnings from continuing operations 56 388 14.5 59 300 19.8 109 311 35.1
NOTES TO THE ACCOUNTS (continued)
7. EARNINGS PER SHARE (continued)
Six months ended 30 June 2015 Six months ended 30 June 2014 Year ended 31 December 2014 Weighted Weighted Weighted average average average
shares Earnings shares Earnings shares Earnings
Earnings number per share Earnings number per share Earnings number per share
£m million pence £m million pence £m million pence
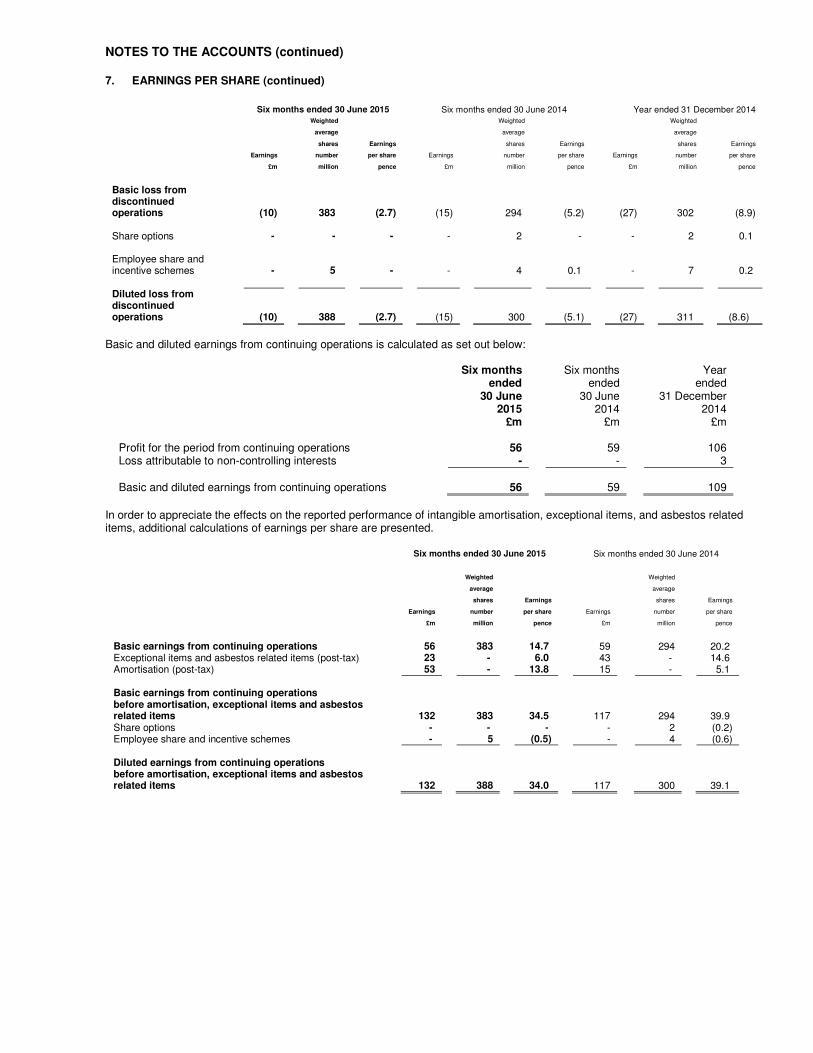
Basic loss from discontinued operations (10) 383 (2.7) (15) 294 (5.2) (27) 302 (8.9) Share options - - - - 2 - - 2 0.1 Employee share and incentive schemes - 5 - - 4 0.1 - 7 0.2 Diluted loss from discontinued
operations (10) 388 (2.7) (15) 300 (5.1) (27) 311 (8.6)
Basic and diluted earnings from continuing operations is calculated as set out below:
Six months Six months Year ended ended ended 30 June 30 June 31 December 2015 2014 2014 £m £m £m Profit for the period from continuing operations 56 59 106 Loss attributable to non-controlling interests - - 3 Basic and diluted earnings from continuing operations 56 59 109
In order to appreciate the effects on the reported performance of intangible amortisation, exceptional items, and asbestos related items, additional calculations of earnings per share are presented.
Six months ended 30 June 2015 Six months ended 30 June 2014
Weighted Weighted
average average
shares Earnings shares Earnings
Earnings number per share Earnings number per share
£m million pence £m million pence
Basic earnings from continuing operations 56 383 14.7 59 294 20.2 Exceptional items and asbestos related items (post-tax) 23 - 6.0 43 - 14.6 Amortisation (post-tax) 53 - 13.8 15 - 5.1 Basic earnings from continuing operations before amortisation, exceptional items and asbestos related items 132 383 34.5 117 294 39.9 Share options - - - - 2 (0.2) Employee share and incentive schemes - 5 (0.5) - 4 (0.6) Diluted earnings from continuing operations before amortisation, exceptional items and asbestos related items
132 388 34.0 117 300 39.1
NOTES TO THE ACCOUNTS (continued)
7. EARNINGS PER SHARE (continued)
Year ended 31 December 2014
Weighted
average Earnings
Earnings shares per share
£m million pence
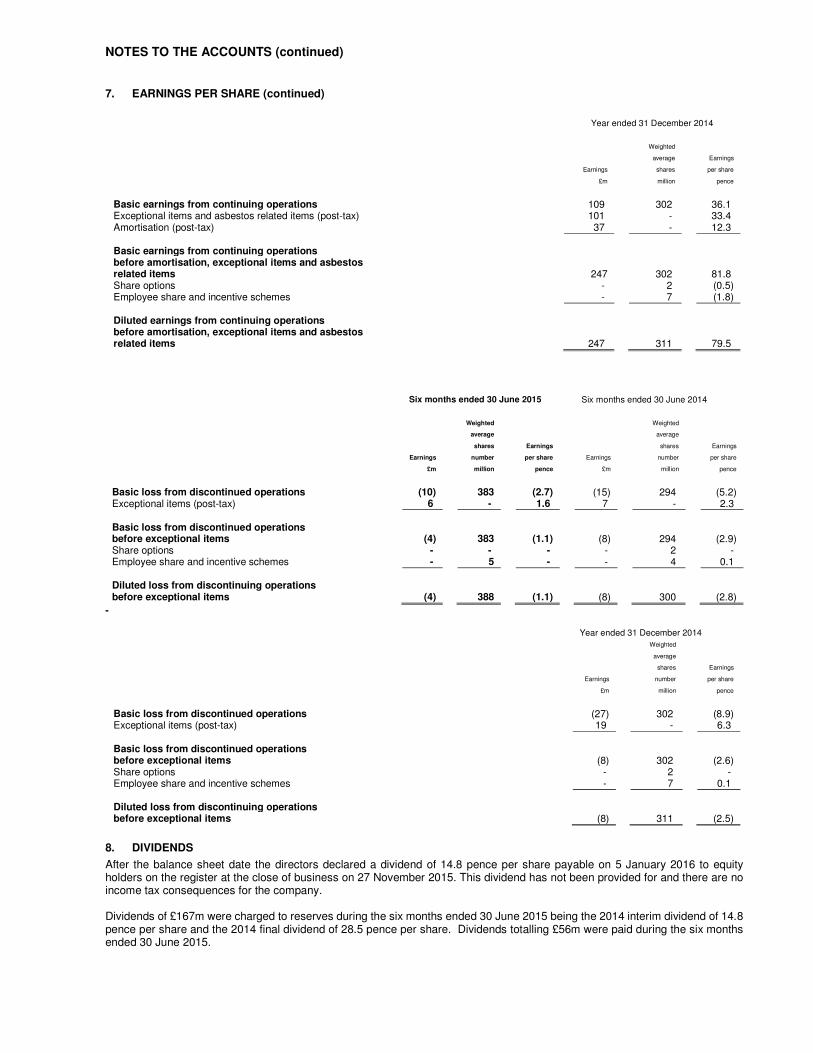
Basic earnings from continuing operations 109 302 36.1 Exceptional items and asbestos related items (post-tax) 101 - 33.4 Amortisation (post-tax) 37 - 12.3 Basic earnings from continuing operations before amortisation, exceptional items and asbestos related items
247 302 81.8
Share options - 2 (0.5) Employee share and incentive schemes - 7 (1.8) Diluted earnings from continuing operations before amortisation, exceptional items and asbestos related items
247 311 79.5
Six months ended 30 June 2015 Six months ended 30 June 2014
Weighted Weighted
average average
shares Earnings shares Earnings
Earnings number per share Earnings number per share
£m million pence £m million pence
Basic loss from discontinued operations (10) 383 (2.7) (15) 294 (5.2) Exceptional items (post-tax) 6 - 1.6 7 - 2.3 Basic loss from discontinued operations before exceptional items (4) 383 (1.1) (8) 294 (2.9) Share options - - - - 2 - Employee share and incentive schemes - 5 - - 4 0.1 Diluted loss from discontinuing operations before exceptional items (4) 388 (1.1) (8) 300 (2.8)
- Year ended 31 December 2014
Weighted average
shares Earnings
Earnings number per share
£m million pence
Basic loss from discontinued operations (27) 302 (8.9) Exceptional items (post-tax) 19 - 6.3 Basic loss from discontinued operations before exceptional items (8) 302 (2.6) Share options - 2 - Employee share and incentive schemes - 7 0.1 Diluted loss from discontinuing operations before exceptional items (8) 311 (2.5)
8. DIVIDENDS
After the balance sheet date the directors declared a dividend of 14.8 pence per share payable on 5 January 2016 to equity holders on the register at the close of business on 27 November 2015. This dividend has not been provided for and there are no income tax consequences for the company. Dividends of £167m were charged to reserves during the six months ended 30 June 2015 being the 2014 interim dividend of 14.8 pence per share and the 2014 final dividend of 28.5 pence per share. Dividends totalling £56m were paid during the six months ended 30 June 2015.
NOTES TO THE ACCOUNTS (continued)
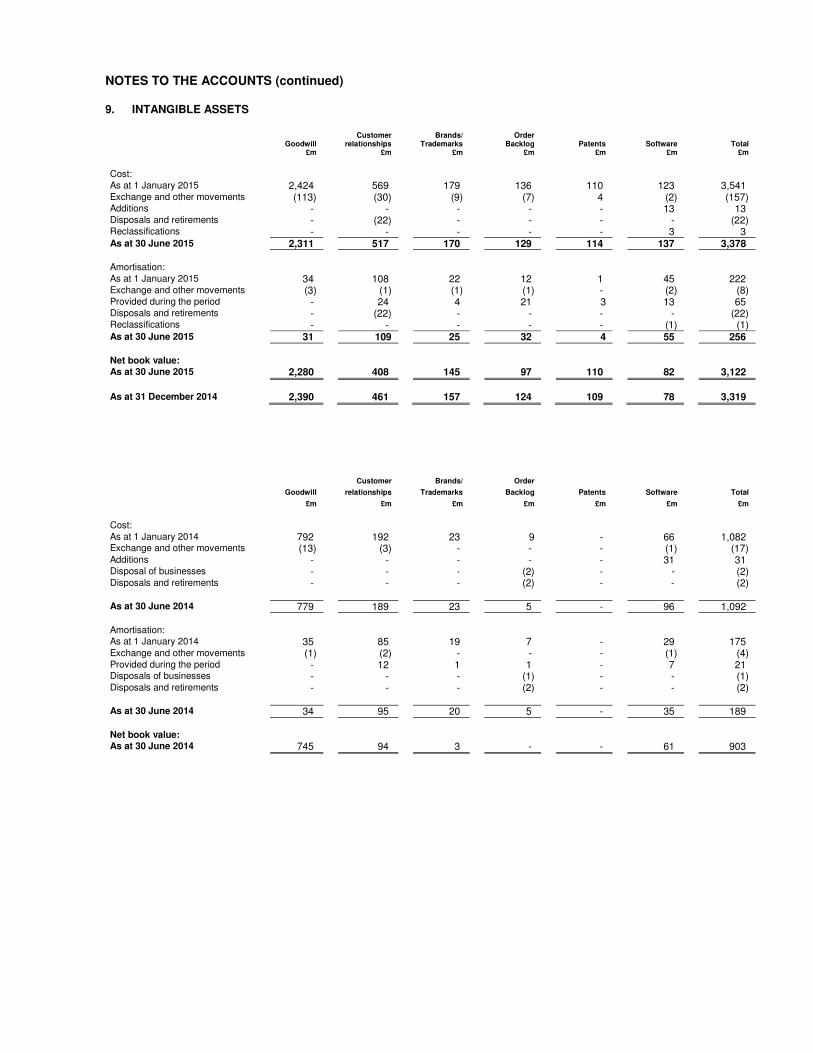
9. INTANGIBLE ASSETS
Customer Brands/ Order Goodwill relationships Trademarks Backlog Patents Software Total £m £m £m £m £m £m £m
Cost: As at 1 January 2015 2,424 569 179 136 110 123 3,541 Exchange and other movements (113) (30) (9) (7) 4 (2) (157) Additions - - - - - 13 13 Disposals and retirements - (22) - - - - (22) Reclassifications - - - - - 3 3 As at 30 June 2015 2,311 517 170 129 114 137 3,378 Amortisation: As at 1 January 2015 34 108 22 12 1 45 222 Exchange and other movements (3) (1) (1) (1) - (2) (8) Provided during the period - 24 4 21 3 13 65 Disposals and retirements - (22) - - - - (22) Reclassifications - - - - - (1) (1) As at 30 June 2015 31 109 25 32 4 55 256 Net book value: As at 30 June 2015 2,280 408 145 97 110 82 3,122
As at 31 December 2014 2,390 461 157 124 109 78 3,319
Customer Brands/ Order
Goodwill relationships Trademarks Backlog Patents Software Total
£m £m £m £m £m £m £m
Cost: As at 1 January 2014 792 192 23 9 - 66 1,082 Exchange and other movements (13) (3) - - - (1) (17) Additions - - - - - 31 31 Disposal of businesses - - - (2) - - (2) Disposals and retirements - - - (2) - - (2) As at 30 June 2014 779 189 23 5 - 96 1,092 Amortisation: As at 1 January 2014 35 85 19 7 - 29 175 Exchange and other movements (1) (2) - - - (1) (4) Provided during the period - 12 1 1 - 7 21 Disposals of businesses - - - (1) - - (1) Disposals and retirements - - - (2) - - (2) As at 30 June 2014 34 95 20 5 - 35 189 Net book value: As at 30 June 2014 745 94 3 - - 61 903
NOTES TO THE ACCOUNTS (continued)
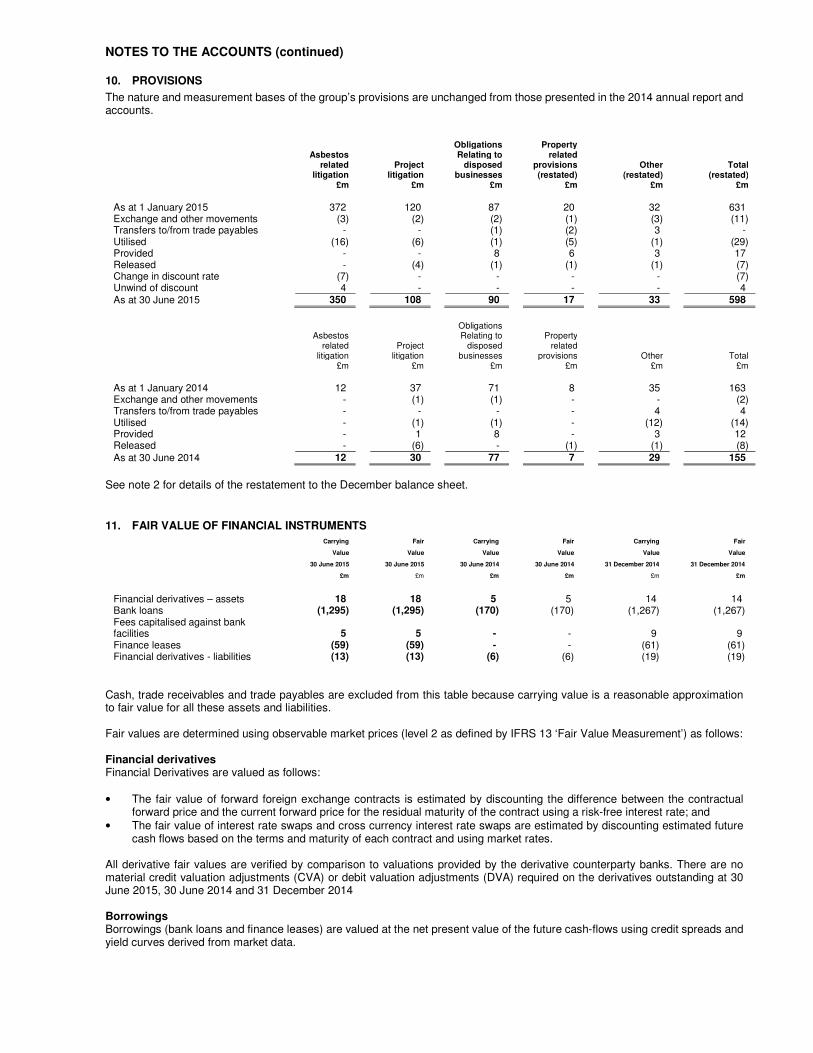
10. PROVISIONS
The nature and measurement bases of the group’s provisions are unchanged from those presented in the 2014 annual report and accounts.
Obligations Property Asbestos Relating to related related Project disposed provisions Other Total litigation litigation businesses (restated) (restated) (restated) £m £m £m £m £m £m
As at 1 January 2015 372 120 87 20 32 631 Exchange and other movements (3) (2) (2) (1) (3) (11) Transfers to/from trade payables - - (1) (2) 3 - Utilised (16) (6) (1) (5) (1) (29) Provided - - 8 6 3 17 Released - (4) (1) (1) (1) (7) Change in discount rate (7) - - - - (7) Unwind of discount 4 - - - - 4 As at 30 June 2015 350 108 90 17 33 598
Obligations Asbestos Relating to Property related Project disposed related litigation litigation businesses provisions Other Total £m £m £m £m £m £m
As at 1 January 2014 12 37 71 8 35 163 Exchange and other movements - (1) (1) - - (2) Transfers to/from trade payables - - - - 4 4 Utilised - (1) (1) - (12) (14) Provided - 1 8 - 3 12 Released - (6) - (1) (1) (8) As at 30 June 2014 12 30 77 7 29 155
See note 2 for details of the restatement to the December balance sheet.
11. FAIR VALUE OF FINANCIAL INSTRUMENTS Carrying Fair Carrying Fair Carrying Fair
Value Value Value Value Value Value
30 June 2015 30 June 2015 30 June 2014 30 June 2014 31 December 2014 31 December 2014
£m £m £m £m £m £m
Financial derivatives – assets 18 18 5 5 14 14 Bank loans (1,295) (1,295) (170) (170) (1,267) (1,267) Fees capitalised against bank facilities 5 5 - - 9 9 Finance leases (59) (59) - - (61) (61) Financial derivatives - liabilities (13) (13) (6) (6) (19) (19)
Cash, trade receivables and trade payables are excluded from this table because carrying value is a reasonable approximation to fair value for all these assets and liabilities. Fair values are determined using observable market prices (level 2 as defined by IFRS 13 ‘Fair Value Measurement’) as follows: Financial derivatives Financial Derivatives are valued as follows: • The fair value of forward foreign exchange contracts is estimated by discounting the difference between the contractual
forward price and the current forward price for the residual maturity of the contract using a risk-free interest rate; and • The fair value of interest rate swaps and cross currency interest rate swaps are estimated by discounting estimated future
cash flows based on the terms and maturity of each contract and using market rates. All derivative fair values are verified by comparison to valuations provided by the derivative counterparty banks. There are no material credit valuation adjustments (CVA) or debit valuation adjustments (DVA) required on the derivatives outstanding at 30 June 2015, 30 June 2014 and 31 December 2014 Borrowings Borrowings (bank loans and finance leases) are valued at the net present value of the future cash-flows using credit spreads and yield curves derived from market data.
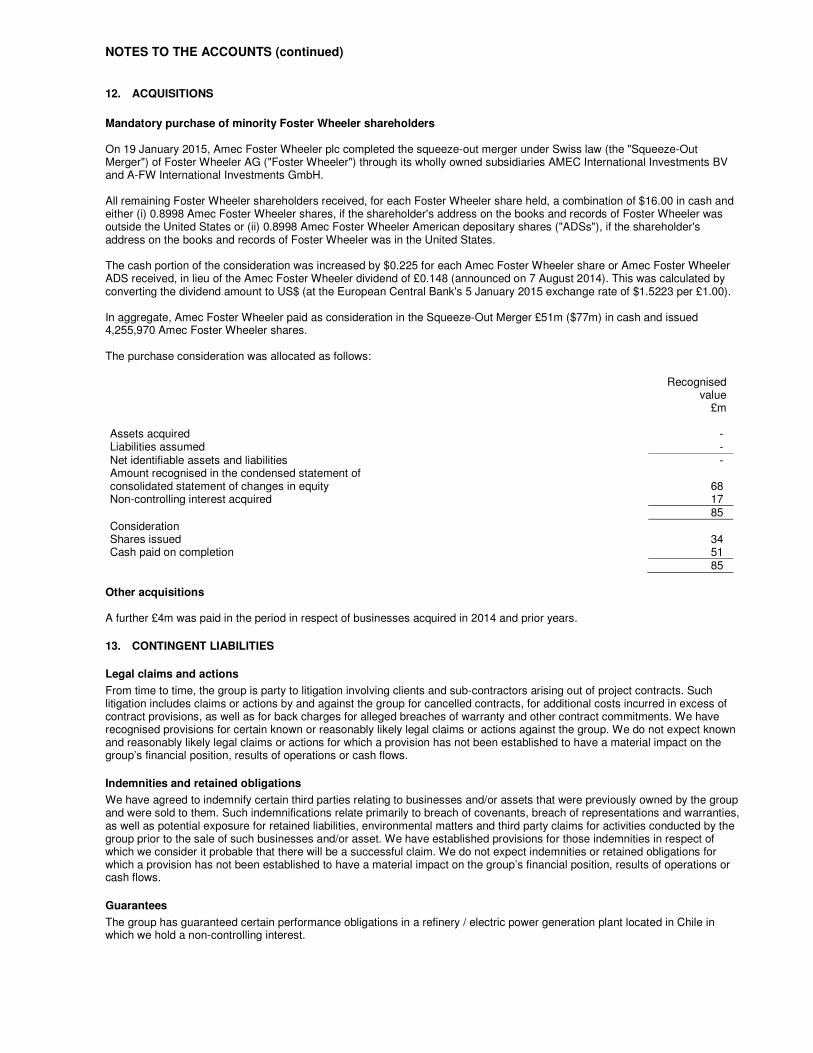
NOTES TO THE ACCOUNTS (continued)
12. ACQUISITIONS Mandatory purchase of minority Foster Wheeler shareholders On 19 January 2015, Amec Foster Wheeler plc completed the squeeze-out merger under Swiss law (the "Squeeze-Out Merger") of Foster Wheeler AG ("Foster Wheeler") through its wholly owned subsidiaries AMEC International Investments BV and A-FW International Investments GmbH. All remaining Foster Wheeler shareholders received, for each Foster Wheeler share held, a combination of $16.00 in cash and either (i) 0.8998 Amec Foster Wheeler shares, if the shareholder's address on the books and records of Foster Wheeler was outside the United States or (ii) 0.8998 Amec Foster Wheeler American depositary shares ("ADSs"), if the shareholder's address on the books and records of Foster Wheeler was in the United States. The cash portion of the consideration was increased by $0.225 for each Amec Foster Wheeler share or Amec Foster Wheeler ADS received, in lieu of the Amec Foster Wheeler dividend of £0.148 (announced on 7 August 2014). This was calculated by converting the dividend amount to US$ (at the European Central Bank's 5 January 2015 exchange rate of $1.5223 per £1.00). In aggregate, Amec Foster Wheeler paid as consideration in the Squeeze-Out Merger £51m ($77m) in cash and issued 4,255,970 Amec Foster Wheeler shares. The purchase consideration was allocated as follows: Recognised value £m Assets acquired - Liabilities assumed - Net identifiable assets and liabilities - Amount recognised in the condensed statement of consolidated statement of changes in equity
68
Non-controlling interest acquired 17 85 Consideration Shares issued 34 Cash paid on completion 51 85
Other acquisitions A further £4m was paid in the period in respect of businesses acquired in 2014 and prior years.
13. CONTINGENT LIABILITIES
Legal claims and actions
From time to time, the group is party to litigation involving clients and sub-contractors arising out of project contracts. Such litigation includes claims or actions by and against the group for cancelled contracts, for additional costs incurred in excess of contract provisions, as well as for back charges for alleged breaches of warranty and other contract commitments. We have recognised provisions for certain known or reasonably likely legal claims or actions against the group. We do not expect known and reasonably likely legal claims or actions for which a provision has not been established to have a material impact on the group’s financial position, results of operations or cash flows.
Indemnities and retained obligations
We have agreed to indemnify certain third parties relating to businesses and/or assets that were previously owned by the group and were sold to them. Such indemnifications relate primarily to breach of covenants, breach of representations and warranties, as well as potential exposure for retained liabilities, environmental matters and third party claims for activities conducted by the group prior to the sale of such businesses and/or asset. We have established provisions for those indemnities in respect of which we consider it probable that there will be a successful claim. We do not expect indemnities or retained obligations for which a provision has not been established to have a material impact on the group’s financial position, results of operations or cash flows.
Guarantees
The group has guaranteed certain performance obligations in a refinery / electric power generation plant located in Chile in which we hold a non-controlling interest.
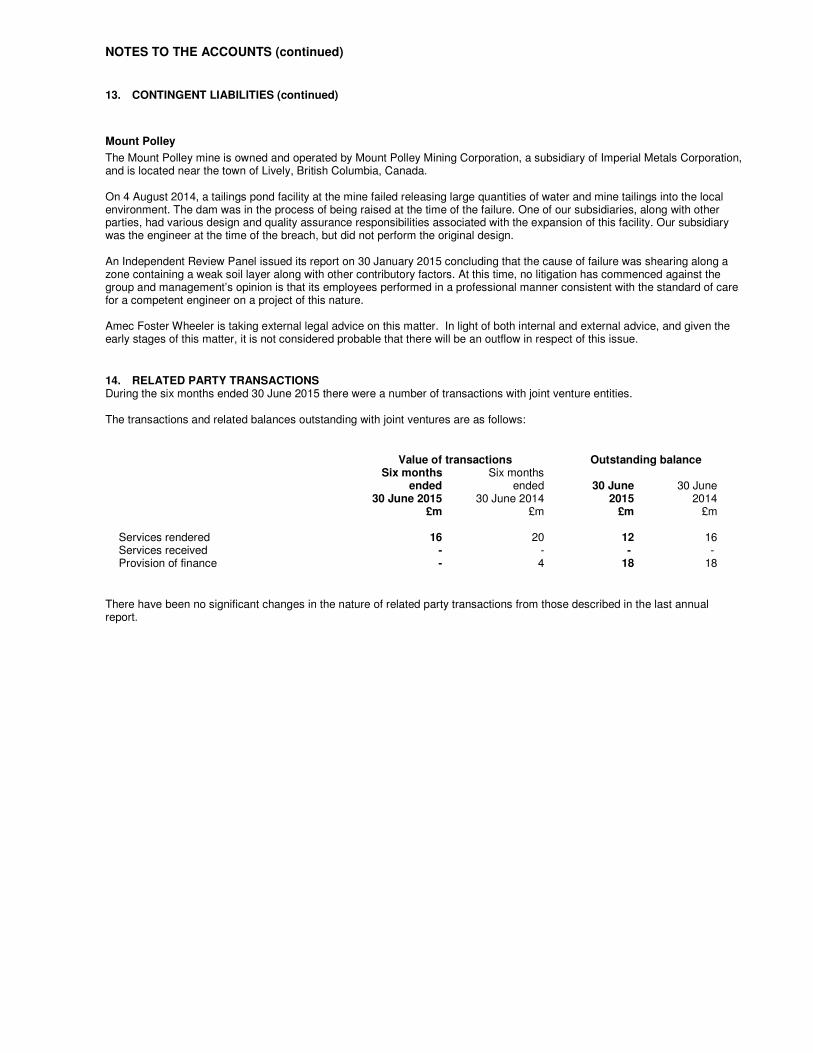
NOTES TO THE ACCOUNTS (continued)
13. CONTINGENT LIABILITIES (continued)
Mount Polley
The Mount Polley mine is owned and operated by Mount Polley Mining Corporation, a subsidiary of Imperial Metals Corporation, and is located near the town of Lively, British Columbia, Canada. On 4 August 2014, a tailings pond facility at the mine failed releasing large quantities of water and mine tailings into the local environment. The dam was in the process of being raised at the time of the failure. One of our subsidiaries, along with other parties, had various design and quality assurance responsibilities associated with the expansion of this facility. Our subsidiary was the engineer at the time of the breach, but did not perform the original design. An Independent Review Panel issued its report on 30 January 2015 concluding that the cause of failure was shearing along a zone containing a weak soil layer along with other contributory factors. At this time, no litigation has commenced against the group and management’s opinion is that its employees performed in a professional manner consistent with the standard of care for a competent engineer on a project of this nature. Amec Foster Wheeler is taking external legal advice on this matter. In light of both internal and external advice, and given the early stages of this matter, it is not considered probable that there will be an outflow in respect of this issue.
14. RELATED PARTY TRANSACTIONS During the six months ended 30 June 2015 there were a number of transactions with joint venture entities. The transactions and related balances outstanding with joint ventures are as follows:
Value of transactions Outstanding balance Six months Six months ended ended 30 June 30 June 30 June 2015 30 June 2014 2015 2014 £m £m £m £m Services rendered 16 20 12 16 Services received - - - - Provision of finance - 4 18 18
There have been no significant changes in the nature of related party transactions from those described in the last annual report.
RESPONSIBILITY STATEMENT OF THE DIRECTORS IN RESPECT OF THE HALF-YEARLY FINANCIAL REPORT We confirm that to the best of our knowledge: • The condensed set of accounts has been prepared in accordance with IAS 34 ‘Interim Financial Reporting’ as adopted by
the EU. • The interim management report includes a fair review of the information required by:
� DTR 4.2.7R of the ‘Disclosures and Transparency Rules’, being an indication of important events that have occurred during the first six months of the financial year and their impact on the condensed set of accounts; and a description of the principal risks and uncertainties for the remaining six months of the year; and
� DTR 4.2.8R of the ‘Disclosure and Transparency Rules’, being related party transactions that have taken place in the
first six months of the current financial year and that have materially affected the financial position or performance of the entity during that period; and any changes in the related party transactions described in the last annual report that could do so.
Samir Brikho Chief Executive Ian McHoul Chief Financial Officer 27 August 2015
INDEPENDENT REVIEW REPORT BY ERNST & YOUNG LLP TO Amec Foster Wheeler plc
Introduction We have been engaged by the company to review the condensed set of accounts in the half-yearly financial report for the six months ended 30 June 2015 which comprises the condensed consolidated Income Statement, condensed consolidated Statement of Comprehensive Income, condensed consolidated Balance Sheet, condensed consolidated Statement of Changes in Equity, condensed consolidated Cash Flow Statement and the related explanatory notes 1 to 14 that have been reviewed. We have read the other information contained in the half-yearly financial report and considered whether it contains any apparent misstatements or material inconsistencies with the information in the condensed set of accounts. This report is made solely to the company in accordance with guidance contained in International Standard on Review Engagements 2410 (United Kingdom and Ireland) ‘Review of Interim Financial Information Performed by the Independent Auditor of the Entity’ issued by the Auditing Practices Board. To the fullest extent permitted by law, we do not accept or assume responsibility to anyone other than the company, for our work, for this report, or for the conclusions we have formed. Directors' responsibilities The half-yearly financial report is the responsibility of, and has been approved by, the directors. The directors are responsible for preparing the half-yearly financial report in accordance with the Disclosure and Transparency Rules of the United Kingdom’s Financial Conduct Authority. As disclosed in note 2, the annual accounts of the group are prepared in accordance with IFRSs as adopted by the European Union. The condensed set of accounts included in this half-yearly financial report has been prepared in accordance with International Accounting Standard 34 ‘Interim Financial Reporting’, as adopted by the European Union. Our responsibility Our responsibility is to express to the company a conclusion on the condensed set of accounts in the half-yearly financial report based on our review. Scope of review We conducted our review in accordance with International Standard on Review Engagements (United Kingdom and Ireland) 2410 ‘Review of Interim Financial Information Performed by the Independent Auditor of the Entity’ issued by the Auditing Practices Board for use in the United Kingdom. A review of interim financial information consists of making enquiries, primarily of persons responsible for financial and accounting matters, and applying analytical and other review procedures. A review is substantially less in scope than an audit conducted in accordance with International Standards on Auditing (United Kingdom and Ireland) and consequently does not enable us to obtain assurance that we would become aware of all significant matters that might be identified in an audit. Accordingly, we do not express an audit opinion. Conclusion Based on our review, nothing has come to our attention that causes us to believe that the condensed set of accounts in the half-yearly financial report for the six months ended 30 June 2015 is not prepared, in all material respects, in accordance with International Accounting Standard 34 as adopted by the European Union and the Disclosure and Transparency Rules of the United Kingdom’s Financial Conduct Authority. Ernst & Young LLP London 27 August 2015
FORWARD-LOOKING STATEMENTS
This announcement contains a number of ‘forward-looking statements’ within the meaning of the US Private Securities Litigation Reform Act of 1995 with respect to the group’s financial condition, results of operations and certain of the group’s plans and objectives.
In particular, such forward-looking statements include statements with respect to:
• our expectations regarding the group’s financial and operating performance, including statements contained within the business review and the outlook statements in this document, and the performance of joint ventures, associates, other investments and newly acquired businesses;
• intentions and expectations regarding the contracts entered into by the group or by third parties, including new services, such as the supply of consultancy, engineering and project management services;
• expectations regarding the global economy and the group’s operating environment, including future market conditions and trends;
• revenue and growth expected from Amec Foster Wheeler’s business and its expectations with respect to long term shareholder value growth;
• our ability to acquire new contracts, expected growth prospects in and growth in its customers generally; • expected benefits associated with the acquisition of Foster Wheeler;
Forward-looking statements are sometimes, but not always, identified by their use of a date in the future or such words as “will”, “anticipates”, “aims”, “could”, “may”, “should”, “expects”, “believes”, “intends”, “plans” or “targets”. By their nature, forward-looking statements are inherently predictive, speculative and involve risk and uncertainty because they relate to events and depend on circumstances that will occur in the future. There are a number of factors that could cause actual results and developments to differ materially from those expressed or implied by these forward-looking statements. These factors include, but are not limited to, the following:
• global economic conditions or other macroeconomic developments in the geographic regions and markets in which the group operates, including fluctuations in exchange rates;
• changes in commodity prices which may impact demand for the group’s services; • the group’s exposure to the risks associated with operating in emerging markets; • the failure to meet customer expectations on project delivery, which could result in damage to reputation and/or loss of
repeat business and potentially lead to litigation; • long term contracts which may be subject to early termination, variation or non-renewal provisions; • projects included in the group’s order book which may be delayed or cancelled; • lump sum contracts, which are subject to the risks associated with unanticipated modifications, technical problems and
delays; • the loss of senior management or difficulty in attracting and retaining appropriately skilled personnel; • the failure to comply with health, safety and environmental laws; • the possibility of major safety incidents that can lead to reputational damage and increase potential liabilities; • obligations and liabilities relating to the group’s divested and non-core businesses; • the failure or security breaches of its information technology systems and/or data security; and • the failure to comply with anti-corruption laws and regulations, economic sanction programmes or other laws and
regulations, which may result in the group becoming subject to fines or penalties and the disruption of its business activities.
A review of the reasons why actual results and developments may differ materially from the expectations disclosed or implied within forward-looking statements can be found under the heading ‘principal business and strategic risks’. All subsequent written or oral forward-looking statements attributable to the company or any persons acting on its behalf are expressly qualified in their entirety by the factors referred to above. No assurances can be given that the forward-looking statements in this document will be realised. Subject to compliance with applicable law and regulations, the company does not intend to update these forward-looking statements and does not undertake any obligation to do so.