Embed Size (px)
Citation preview
AMCS
Baseline Survey Report of Jharkhand Tribal Empowerment & Livelihoods Project (JTELP) 1
1 Introduction
1.1 Background of the Scheduled Tribes & Jharkhand (A) The Scheduled Tribes The word 'tribe' is generally used for a socially cohesive unit, associated with a territory, the
members of which regard them as politically autonomous. Often a tribe possesses a distinct dialect
and distinct cultural traits. The term 'primitive tribes' is often used by anthropologist to denote
"a primary aggregate of people living in a primitive or barbarous condition under a headman or
chief". Various anthropologists define tribe as the people at earlier stage of evolution of the society.
The Constitution of India, Article 366 (25) defines Scheduled Tribes as "such tribes or tribal
communities or part of or groups within such tribes or tribal communities as are deemed under
Article 342 to the Scheduled Tribes (STs) for the purposes of this Constitution". In Article 342, the
procedure to be followed for specification of a Scheduled Tribe is prescribed. However, it does not
contain the criterion for the specification of any community as Scheduled Tribe. An often used
criterion is based on attributes given below —
Geographical Isolation - they live in cloistered, exclusive, remote and inhospitable areas such as
hills and forests.
Backwardness - their livelihood is based on primitive agriculture, low-value closed economy with
low level of technology that leads to their poverty. They have low levels of literacy and health.
Distinctive Culture, Language & Religion - communities have developed their own distinctive
culture, language and religion.
Shyness of Contact – they have a marginal degree of contact with other cultures and people.
The Scheduled Tribe groups who were identified as more backward communities among the tribal
population groups have been categorized as 'Primitive Tribal Groups' (PTGs) by the Government at
the Centre in 1975. So far 75 tribal communities have been identified as 'Primitive Tribal Groups' in
different states of India. They are primarily hunters and food-gatherers while a few are agricultural
communities.
The forest occupies a central position in tribal culture and economy. The tribal way of life is very
much dictated by the forest right from birth to death. It is ironical that the poorest people of India are
living in the areas of richest natural resources. Historically, the tribals have been pushed to corners
owing to economic interests of various dominant groups. In contemporary India, the need for land for
development is still forcing them, albeit this time to integrate with mainstream.
AMCS
Baseline Survey Report of Jharkhand Tribal Empowerment & Livelihoods Project (JTELP) 2
In spite of the protection given to the tribal population by the Constitution of India, the tribals still
remain the most backward ethnic group in India. They rate very low on the three most important
indicators of development - health, education and income. The tribals are most backward not only
compared with the general population, but also compared to the Scheduled Castes (Dalits), the
other backward social group with constitutional protection.
(B) Background of the State of Jharkhand Jharkhand is an ancient land and the name "Jharkhand" comes from the Sanskrit word
“Jharikhanda”, which is the ancient name of the region's dense forest. According to original tribal
language, the word Jharkhand means “the land of jungles” and is popularly known as Vananchal
(meaning land of woods). The state ranks 10th among all the states and union territories in respect of
area under forest cover.
Jharkhand is the 28th State of India which was brought into existence by the Bihar Reorganization
Act on 15th November 2000. With an area of 74,677 sq. kms., which is 2.4 percent of the country’s
geographic area. Jharkhand is located in the eastern part of India and is bordered by Bihar,
Chattisgarh, Orissa and West Bengal to its north, west, south and east respectively. Around 35
percent population of former Bihar is in the Jharkhand region. Jharkhand has a population of 32.96
million, consisting of 16.93 million males and 16.03 million females. The sex ratio is 947 females to
1000 males.
The population consists of 28 percent tribals, 12 percent Scheduled Castes and 60 percent others.
The population density of the state is 413 persons per square kilometer of land; it varies from as low
as 148 per square kilometer in Gumla district to as high as 1167 per square kilometer in Dhanbad
district. The State was formed with 18 districts, which has now increased to 24 districts. Jharkhand
has a rich endowment of natural resources including coal, iron ore, mica, copper, pyrite, graphite,
etc. However, despite there being large deposits of natural resources in the state, it continues to be
counted among the poor states of the country on major development indicators.
The state accounts for 35.5 percent of the country's known coal reserves, 90 percent of its cooking
coal deposits, 40 percent of its copper, 22 percent of its iron ore, 90 percent of its mica and huge
deposits of bauxite, quartz and ceramics. As far as infrastructure is concerned Jharkhand is on its
way to rapid progress. Jharkhand is marked with a good network of roads, railways, airways,
telecommunication, power and water system. The state is well connected by roads, the length of its
National Highway is 1600 Kms. and State Highway is 2711 Kms.
Agriculture was never the mainstay of economy of Jharkhand but almost 80 percent of the
population in this mineral rich state is dependent on agriculture. Paddy is the major crop in the state
with pulses and wheat being the other ones. The state is focusing on increasing the land under
cultivation, development of the irrigation facilities and development of agriculture related business.
AMCS
Baseline Survey Report of Jharkhand Tribal Empowerment & Livelihoods Project (JTELP) 3
(C) Scheduled Tribes of Jharkhand There are 32 tribes inhabiting Jharkhand. They not only differ considerably from the non-tribal
population but from one another as well. The most ancient among them are the Mundas, while the
Santhals are the last of the tribes to settle in Jharkhand. The tribes in Jharkhand were originally
classified on the basis of their cultural types by the world renowned Indian anthropologist late
Professor L.P. Vidyarthi. His classification was as follows :
Hunter-Gatherer — Birhor, Korwa, Hill Kharia
Shifting Agriculture — Sauria Paharia
Simple Artisans — Mahli, Lohra, Karmali, Chik Baraik
Settled Agriculturists — Santhal, Munda, Oraon, Ho, Bhumij, etc.
The tribes prevalent in Jharkhand are — Asur, Baiga, Banjara, Bathudi, Bedia, Bhumij, Binjhia,
Birhor, Birjia, Chero, Chick-Baraik, Gond, Gorait, Ho, Kanwar, Karmali, Kharia, Kharwar, Khond,
Kisan, Kodaku, Kol, Kora, Korwa, Lohra, Mahli, Mal Pahariya, Munda, Oraon, Pahariya, Santhal,
Saurya Pahariya and Savar.
Most tribes are concentrated in heavily forested areas that combine inaccessibility with limited
political or economic significance. They live in mud houses, which are devoid of any window. They
often adorn the external surface of their houses with paintings. The major food for these tribal
people is rice and the flesh of birds and animals. Tribal society is built on a foundation of equality
with respect for all life forms including plants and trees. There is deep recognition of mutual
dependence in nature and human society.
Historically, the economy of most tribes was subsistence agriculture or hunting and gathering. Tribal
members traded with outsiders for the few necessities they lacked. For tribal people, however, land
was often viewed as a common resource, free to who ever needed it. For most tribal people, land-
use rights traditionally derive simply from tribal membership. Tribal society tends to the egalitarian,
with its leadership based on ties of kinship and personality rather than on hereditary status. Tribes
typically consist of segmentary lineages whose extended families provide the basis for social
organization and control. Tribal religion recognizes no authority outside the tribe. In the case of
stratified tribes, the loyalties of clan, kin and family may well predominate over those of the tribe.
Some of the major cultural festivals celebrated by the tribals of Jharkhand include —Sarhul, Karam,
Jawa, Tusu Parab or Makar, Hal Punhya, Bhagta Parab, Rohini, Bandna, Jani-Shikaar, among
others. The major languages spoken by the tribals of the state include Korku, Mundari, Kurmali,
Santhali, Bhumij, Ho and Kharia. The major tribal artworks of the tribals of Jharkhand are — Chhou
Mask, Tribal Woodwork, Tribal Bamboo Artwork, Tribal Pottery, Tribal Jewellery, Godna, Tribal
Weapons, etc.
AMCS
Baseline Survey Report of Jharkhand Tribal Empowerment & Livelihoods Project (JTELP) 4
1.2 About JTELP Natural resources are central to the livelihood systems and coping strategies of the Scheduled
Tribes. Loss of soil fertility due to erosion and degradation, denudation of and increasing state
control over forests have adversely affected tribal livelihoods and wellbeing over the years. In their
relatively recent transition to settled farming and tribal communities, are yet to develop resource
management systems suited to their farming systems in an ecologically complex resource base.
Above all, they lack financial resources and have little access to technical services.
Besides strengthening community-based institutions and improving natural resource management
as in Jharkhand Tribal Development Project (JTDP), Jharkhand Tribal Empowerment & Livelihoods
Project (JTELP) will emphasize productivity enhancement and up-scaling of proven, market-oriented
production activities. JTELP will foster convergence with the on-going tribal and rural development
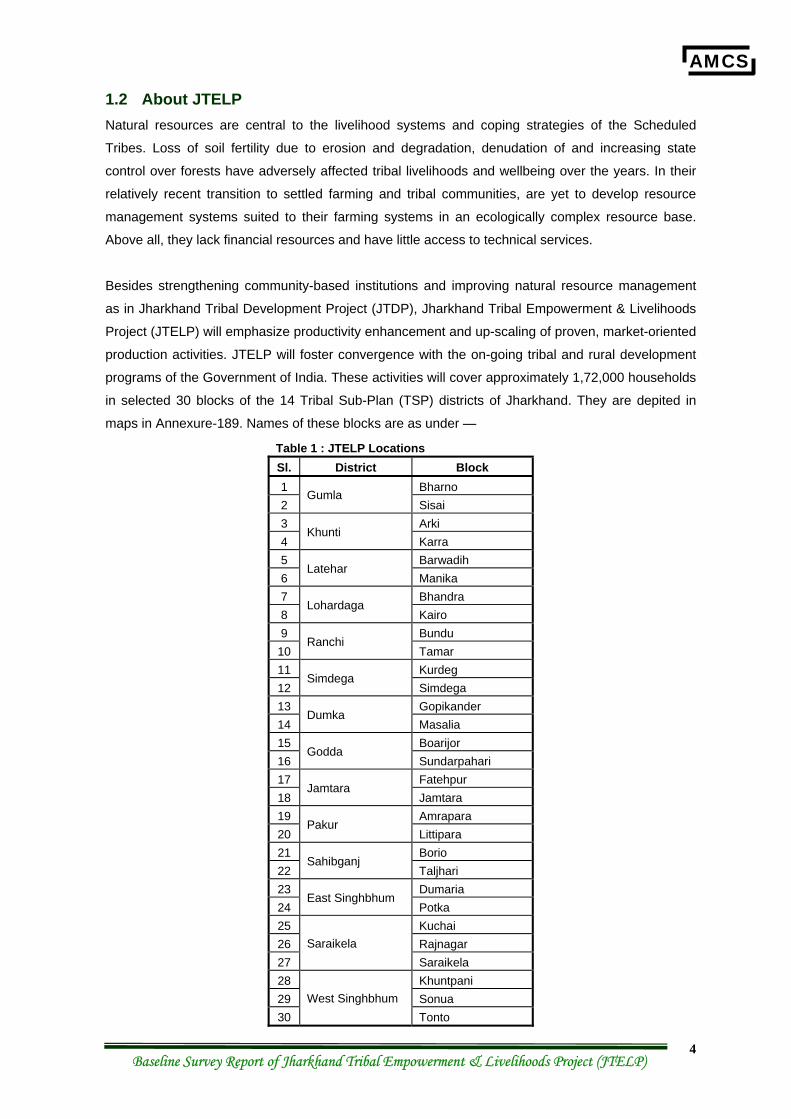
programs of the Government of India. These activities will cover approximately 1,72,000 households
in selected 30 blocks of the 14 Tribal Sub-Plan (TSP) districts of Jharkhand. They are depited in
maps in Annexure-189. Names of these blocks are as under —
Table 1 : JTELP Locations Sl. District Block 1 Bharno 2
Gumla Sisai
3 Arki 4
Khunti Karra
5 Barwadih 6
Latehar Manika
7 Bhandra 8
Lohardaga Kairo
9 Bundu 10
Ranchi Tamar
11 Kurdeg 12
Simdega Simdega
13 Gopikander 14
Dumka Masalia
15 Boarijor 16
Godda Sundarpahari
17 Fatehpur 18
Jamtara Jamtara
19 Amrapara 20
Pakur Littipara
21 Borio 22
Sahibganj Taljhari
23 Dumaria 24
East Singhbhum Potka
25 Kuchai 26 Rajnagar 27
Saraikela Saraikela
28 Khuntpani 29 Sonua 30
West Singhbhum Tonto
AMCS
Baseline Survey Report of Jharkhand Tribal Empowerment & Livelihoods Project (JTELP) 5
The tribal and rural development policies as well as the Approach Paper for the 12th Five Year Plan
of the Government of India emphasize convergence and holistic development through decentralized
governance. Elected Panchayats are now in place to take on the mantle of decentralized planning
and implementation of village development projects. The Jharkhand Tribal Empowerment and
Livelihoods Project (JTELP) will build on the experience of the IFAD-supported Jharkhand Tribal
Development Project (JTDP). JTELP’s objective is aligned with the Country Strategic Opportunities
Program (COSOP) emphasis on tribal people, women, youth and small and marginal farmers and
the strategic objectives of increased access to agricultural technologies and natural resources.
The overall goal of JTELP and JTDP is to improve the living conditions of tribal people in general
and PTGs in particular. This is sought to be achieved by organizing and enabling the communities to
adopt sustainable and productive natural resource management regimes, adopt market-oriented
production systems and learn the skills and gain the experience of planning and implementing
development plans relevant to their villages. In this process, the Project seeks to foster strong
community-based institutions that empower local communities, especially women, introduce
productive and sustainable systems of natural resource management and enhance food and
nutrition security and cash incomes, by introducing more productive farming technologies and
promoting locally proven production technologies.
Taken as a set of interventions, the proposed activities begin to build community and ecological
resilience to climate change. Several of them were explicitly designed as adaptation responses to
climate change. The Project will have four components, namely (i) Community Empowerment; (ii)
Integrated Natural Resource Management; (iii) Livelihoods Support; and (iv) Project Management.
Convergence with ongoing government programs would be a key development strategy of the
Project for mobilizing financial resources. The target group for the Project will be the tribals in
particular PTGs, women-headed households, rural youth and BPL households.
1.3 Need for Baseline Study The baseline study would help in assessing the current way of life of the tribals in Jharkhand and
help gain an insight into the facilities and services presently available to them. The baseline survey
is a necessary part of an evidence-based approach to program implementation. It is expected that
the findings of the baseline survey would assist the Planners and the Project Managers to design
and identify appropriate interventions to strengthen the delivery of support to the target group under
JTELP, thereby, achieving high coverage and better outcomes. Moreover, the baseline study will
establish a benchmark for the performance evaluation of the Project in any future date.
In order to ensure comparability of the baseline survey with the endline survey, care needs to be
taken to ensure that the endline survey is also carried out in the same calander months (February-
March), as seasonality plays a vital role in the day to day lives of the people including their
agricultural practices, livehood, migration, food habiits, access to NTFPs, etc.
AMCS
Baseline Survey Report of Jharkhand Tribal Empowerment & Livelihoods Project (JTELP) 6
2 Objectives & Methodology
2.1 Objectives of the Study The objective of conducting the baseline study is to get an idea of the prevailing socio-economic
profile of the tribals in the state. The specific objectives are mentioned below :
1. To document the tribal household member’s profile.
2. To get an idea of the availability of basic amenities in the tribal households.
3. To study the issue of food security of the tribal households.
4. To find out the availability of livestock in the tribal households.
5. To study the land tenure of the tribal households.
6. To find out the agricultural practices of the tribal households.
7. To document the income generation activities of the tribal households.
8. To assess the assets owned by the tribal households.
9. To find out the use of non-timber forest products by the tribal households.
10. To assess the outstanding loan on the tribal households.
11. To find out the reach of government schemes to the tribal households.
12. To find out the consumption pattern of the tribal households.
13. To find out health status of women & children in tribal households.
14. To find out the association of the tribal households with JTELP.
15. To explore the climate change intervention experience of the tribal households.
2.2 Approach to the Study Jharkhand Tribal Development Society (JTDS) is implementing the Jharkhand Tribal Empowerment
and Livelihood Project (JTELP) in 30 blocks of 14 Tribal Sub-Plan districts of Jharkhand. In each of
the 14 project districts, JTDS has selected at least 2 blocks where the tribal population is more than
50 percent. Similarly, in each selected block, at least 5 gram panchayats have been selected that
have highest concentration of tribal communities. Primitive Tribal Groups (PTGs) have been
particularly targeted in 3 out of the 14 districts, namely, Godda, Pakur and Sahibganj. In the baseline
survey both intervention areas as well as control areas have been covered to arrive at the prevailing
values of the indicators proposed to be studied. This has helped to compare the results in the
intervention areas vis-à-vis the control areas. During the baseline survey, all the 30 blocks of the 14
project districts have been covered.
AMCS
Baseline Survey Report of Jharkhand Tribal Empowerment & Livelihoods Project (JTELP) 7
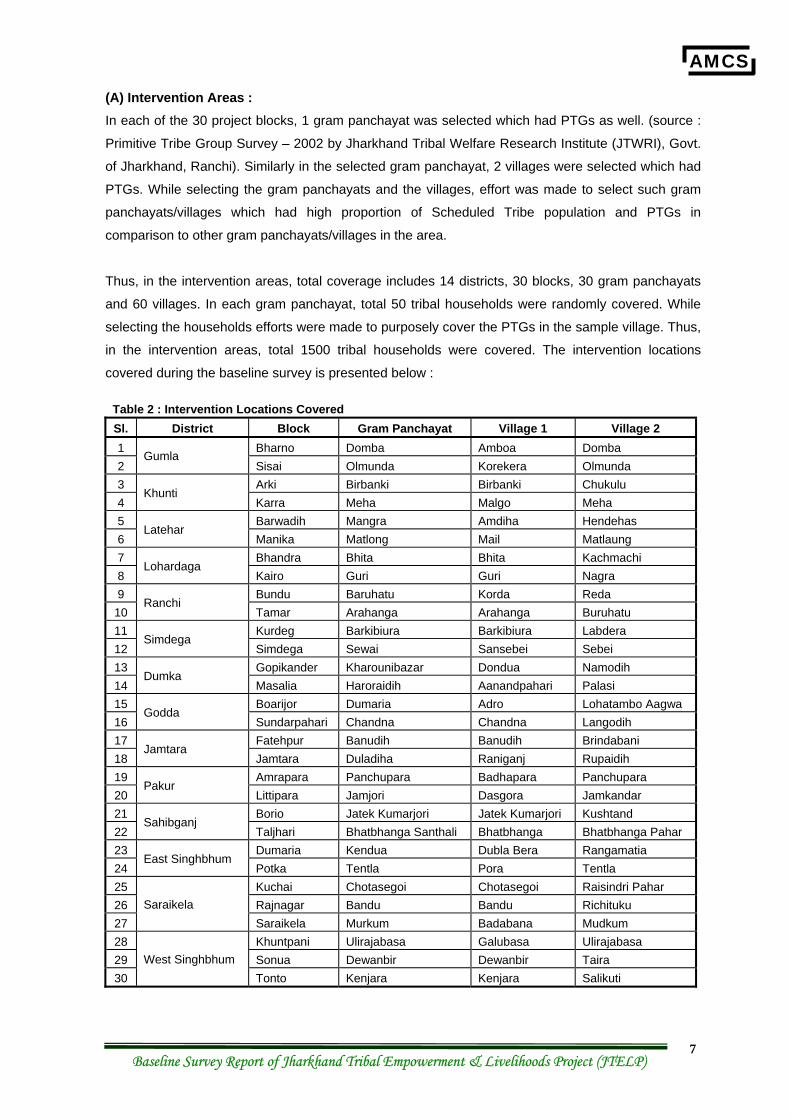
(A) Intervention Areas : In each of the 30 project blocks, 1 gram panchayat was selected which had PTGs as well. (source :
Primitive Tribe Group Survey – 2002 by Jharkhand Tribal Welfare Research Institute (JTWRI), Govt.
of Jharkhand, Ranchi). Similarly in the selected gram panchayat, 2 villages were selected which had
PTGs. While selecting the gram panchayats and the villages, effort was made to select such gram
panchayats/villages which had high proportion of Scheduled Tribe population and PTGs in
comparison to other gram panchayats/villages in the area.
Thus, in the intervention areas, total coverage includes 14 districts, 30 blocks, 30 gram panchayats
and 60 villages. In each gram panchayat, total 50 tribal households were randomly covered. While
selecting the households efforts were made to purposely cover the PTGs in the sample village. Thus,
in the intervention areas, total 1500 tribal households were covered. The intervention locations
covered during the baseline survey is presented below :
Table 2 : Intervention Locations Covered Sl. District Block Gram Panchayat Village 1 Village 2 1 Bharno Domba Amboa Domba 2
Gumla Sisai Olmunda Korekera Olmunda
3 Arki Birbanki Birbanki Chukulu 4
Khunti Karra Meha Malgo Meha
5 Barwadih Mangra Amdiha Hendehas 6
Latehar Manika Matlong Mail Matlaung
7 Bhandra Bhita Bhita Kachmachi 8
Lohardaga Kairo Guri Guri Nagra
9 Bundu Baruhatu Korda Reda 10
Ranchi Tamar Arahanga Arahanga Buruhatu
11 Kurdeg Barkibiura Barkibiura Labdera 12
Simdega Simdega Sewai Sansebei Sebei
13 Gopikander Kharounibazar Dondua Namodih 14
Dumka Masalia Haroraidih Aanandpahari Palasi
15 Boarijor Dumaria Adro Lohatambo Aagwa 16
Godda Sundarpahari Chandna Chandna Langodih
17 Fatehpur Banudih Banudih Brindabani 18
Jamtara Jamtara Duladiha Raniganj Rupaidih
19 Amrapara Panchupara Badhapara Panchupara 20
Pakur Littipara Jamjori Dasgora Jamkandar
21 Borio Jatek Kumarjori Jatek Kumarjori Kushtand 22
Sahibganj Taljhari Bhatbhanga Santhali Bhatbhanga Bhatbhanga Pahar
23 Dumaria Kendua Dubla Bera Rangamatia 24
East Singhbhum Potka Tentla Pora Tentla
25 Kuchai Chotasegoi Chotasegoi Raisindri Pahar 26 Rajnagar Bandu Bandu Richituku 27
Saraikela Saraikela Murkum Badabana Mudkum
28 Khuntpani Ulirajabasa Galubasa Ulirajabasa 29 Sonua Dewanbir Dewanbir Taira 30
West Singhbhum Tonto Kenjara Kenjara Salikuti
AMCS
Baseline Survey Report of Jharkhand Tribal Empowerment & Livelihoods Project (JTELP) 8
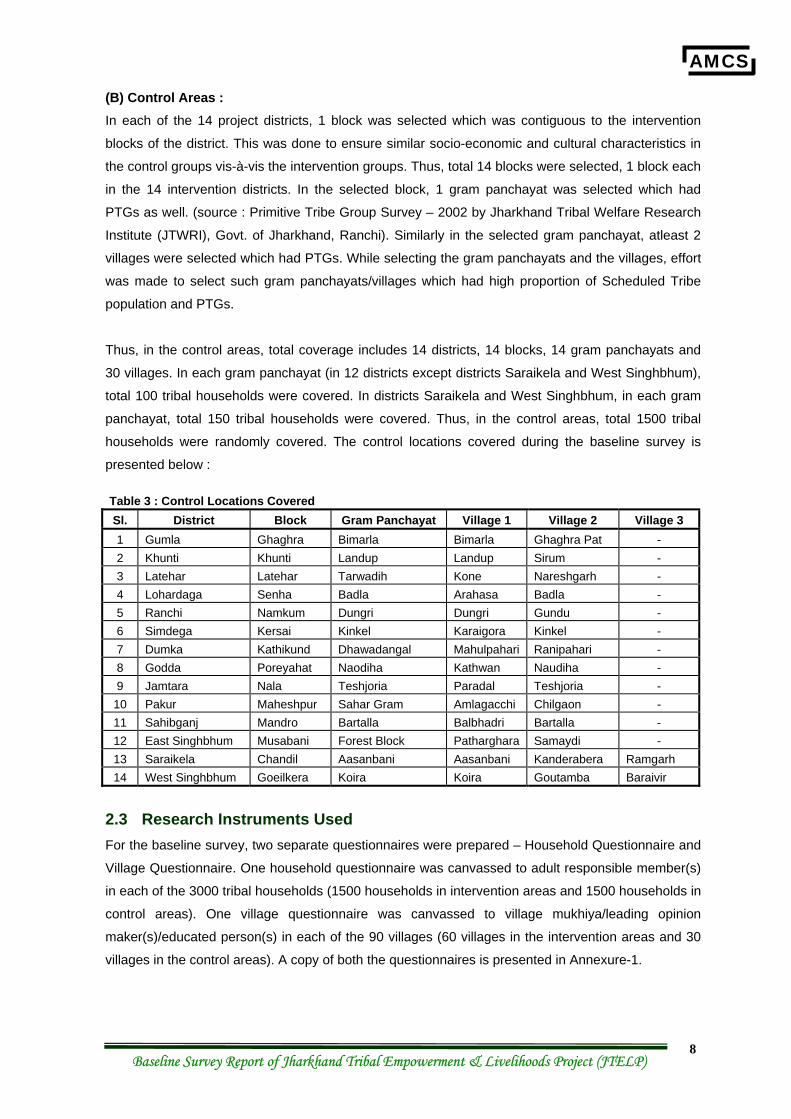
(B) Control Areas : In each of the 14 project districts, 1 block was selected which was contiguous to the intervention
blocks of the district. This was done to ensure similar socio-economic and cultural characteristics in
the control groups vis-à-vis the intervention groups. Thus, total 14 blocks were selected, 1 block each
in the 14 intervention districts. In the selected block, 1 gram panchayat was selected which had
PTGs as well. (source : Primitive Tribe Group Survey – 2002 by Jharkhand Tribal Welfare Research
Institute (JTWRI), Govt. of Jharkhand, Ranchi). Similarly in the selected gram panchayat, atleast 2
villages were selected which had PTGs. While selecting the gram panchayats and the villages, effort
was made to select such gram panchayats/villages which had high proportion of Scheduled Tribe
population and PTGs.
Thus, in the control areas, total coverage includes 14 districts, 14 blocks, 14 gram panchayats and
30 villages. In each gram panchayat (in 12 districts except districts Saraikela and West Singhbhum),
total 100 tribal households were covered. In districts Saraikela and West Singhbhum, in each gram
panchayat, total 150 tribal households were covered. Thus, in the control areas, total 1500 tribal
households were randomly covered. The control locations covered during the baseline survey is
presented below :
Table 3 : Control Locations Covered Sl. District Block Gram Panchayat Village 1 Village 2 Village 3 1 Gumla Ghaghra Bimarla Bimarla Ghaghra Pat - 2 Khunti Khunti Landup Landup Sirum - 3 Latehar Latehar Tarwadih Kone Nareshgarh - 4 Lohardaga Senha Badla Arahasa Badla - 5 Ranchi Namkum Dungri Dungri Gundu - 6 Simdega Kersai Kinkel Karaigora Kinkel - 7 Dumka Kathikund Dhawadangal Mahulpahari Ranipahari - 8 Godda Poreyahat Naodiha Kathwan Naudiha - 9 Jamtara Nala Teshjoria Paradal Teshjoria - 10 Pakur Maheshpur Sahar Gram Amlagacchi Chilgaon - 11 Sahibganj Mandro Bartalla Balbhadri Bartalla - 12 East Singhbhum Musabani Forest Block Patharghara Samaydi - 13 Saraikela Chandil Aasanbani Aasanbani Kanderabera Ramgarh 14 West Singhbhum Goeilkera Koira Koira Goutamba Baraivir
2.3 Research Instruments Used For the baseline survey, two separate questionnaires were prepared – Household Questionnaire and
Village Questionnaire. One household questionnaire was canvassed to adult responsible member(s)
in each of the 3000 tribal households (1500 households in intervention areas and 1500 households in
control areas). One village questionnaire was canvassed to village mukhiya/leading opinion
maker(s)/educated person(s) in each of the 90 villages (60 villages in the intervention areas and 30
villages in the control areas). A copy of both the questionnaires is presented in Annexure-1.
AMCS
Baseline Survey Report of Jharkhand Tribal Empowerment & Livelihoods Project (JTELP) 9
2.4 Operational Modalities For the purpose of data collection from the field, teams of Research Investigators and Supervisors
were formed under the leadership of Field Officers. Before sending the teams to the field for data
collection, intensive training was given to them. All the interview questionnaires were discussed with
them in detail. Each question/issue was read out one by one and the intention of the
question/statement was explained.
This was done to sensitize the team members on each and every question/issue. Mock interviews
were done among the participants to thoroughly prepare the team members on the questionnaire.
For getting the feel of actual field work, the team of Research Investigators, Supervisors, Field
Officers and other functionaries of AMCS visited a village in Bundu block of Ranchi district and each
member filled-up one household questionnaire. The next day, discussions were held on each and
every question and the issues pertaining to asking questions, recording the responses and other
practical field issues were sorted out. Following the training, field visits were made to the identified
locations of the selected districts and the questionnaires were canvassed to the target groups and
the data was collected.
2.5 Data Processing and Analysis All the filled-in questionnaires were brought to AMCS office at Ranchi and thorough scrutiny was
done. All open ended questions were properly coded and separate coding sheets were prepared for
each question. In the mean time, data entry program was prepared with all checks for logical
inclusion and exclusion errors as a means of quality check. All verified and coded questionnaires
were entered into the computer using specialized software.
Data consistency check programs were run on computer and framework for data tables was
prepared. To facilitate easy comprehension of the report, simple language and standard
terminologies have been used. Tables, charts and annexures have been provided at various places
to make the reading simple, interesting and detailed.
AMCS
Baseline Survey Report of Jharkhand Tribal Empowerment & Livelihoods Project (JTELP) 10
3 Profile of Tribals
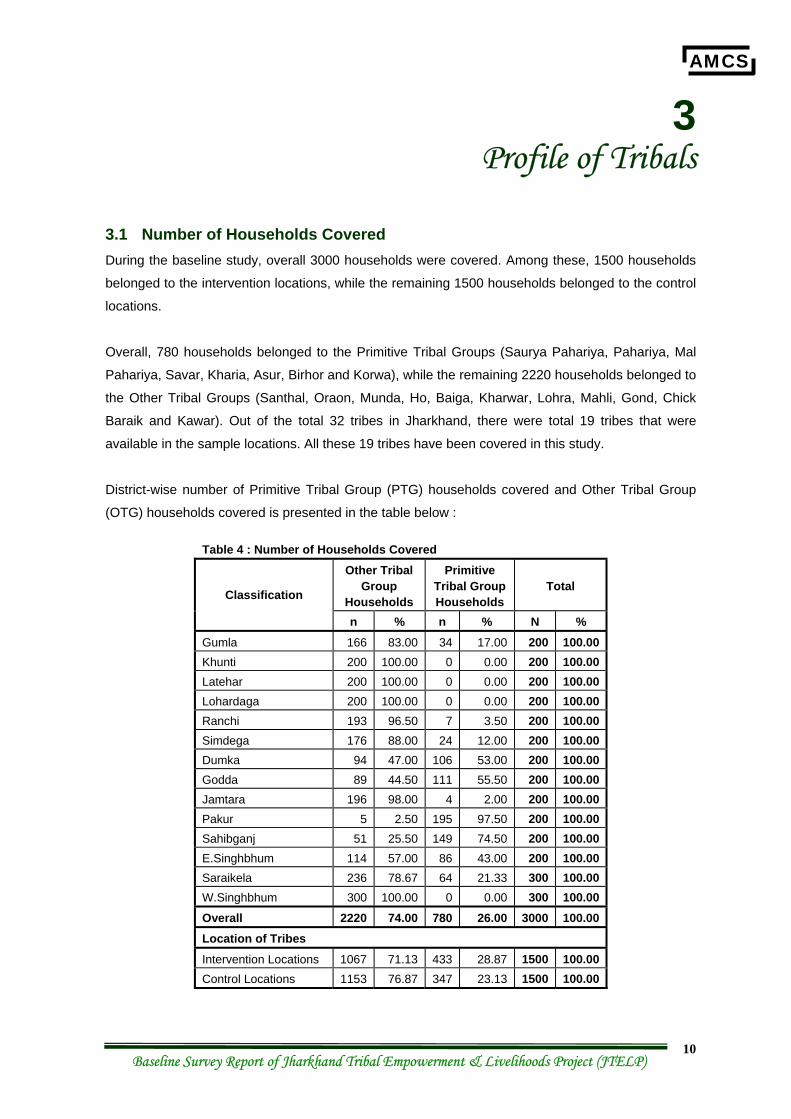
3.1 Number of Households Covered During the baseline study, overall 3000 households were covered. Among these, 1500 households
belonged to the intervention locations, while the remaining 1500 households belonged to the control
locations.
Overall, 780 households belonged to the Primitive Tribal Groups (Saurya Pahariya, Pahariya, Mal
Pahariya, Savar, Kharia, Asur, Birhor and Korwa), while the remaining 2220 households belonged to
the Other Tribal Groups (Santhal, Oraon, Munda, Ho, Baiga, Kharwar, Lohra, Mahli, Gond, Chick
Baraik and Kawar). Out of the total 32 tribes in Jharkhand, there were total 19 tribes that were
available in the sample locations. All these 19 tribes have been covered in this study.
District-wise number of Primitive Tribal Group (PTG) households covered and Other Tribal Group
(OTG) households covered is presented in the table below :
Table 4 : Number of Households Covered Other Tribal
Group Households
Primitive Tribal Group Households
Total Classification
n % n % N % Gumla 166 83.00 34 17.00 200 100.00 Khunti 200 100.00 0 0.00 200 100.00 Latehar 200 100.00 0 0.00 200 100.00 Lohardaga 200 100.00 0 0.00 200 100.00 Ranchi 193 96.50 7 3.50 200 100.00 Simdega 176 88.00 24 12.00 200 100.00 Dumka 94 47.00 106 53.00 200 100.00 Godda 89 44.50 111 55.50 200 100.00 Jamtara 196 98.00 4 2.00 200 100.00 Pakur 5 2.50 195 97.50 200 100.00 Sahibganj 51 25.50 149 74.50 200 100.00 E.Singhbhum 114 57.00 86 43.00 200 100.00 Saraikela 236 78.67 64 21.33 300 100.00 W.Singhbhum 300 100.00 0 0.00 300 100.00 Overall 2220 74.00 780 26.00 3000 100.00 Location of Tribes
Intervention Locations 1067 71.13 433 28.87 1500 100.00 Control Locations 1153 76.87 347 23.13 1500 100.00
AMCS
Baseline Survey Report of Jharkhand Tribal Empowerment & Livelihoods Project (JTELP) 11
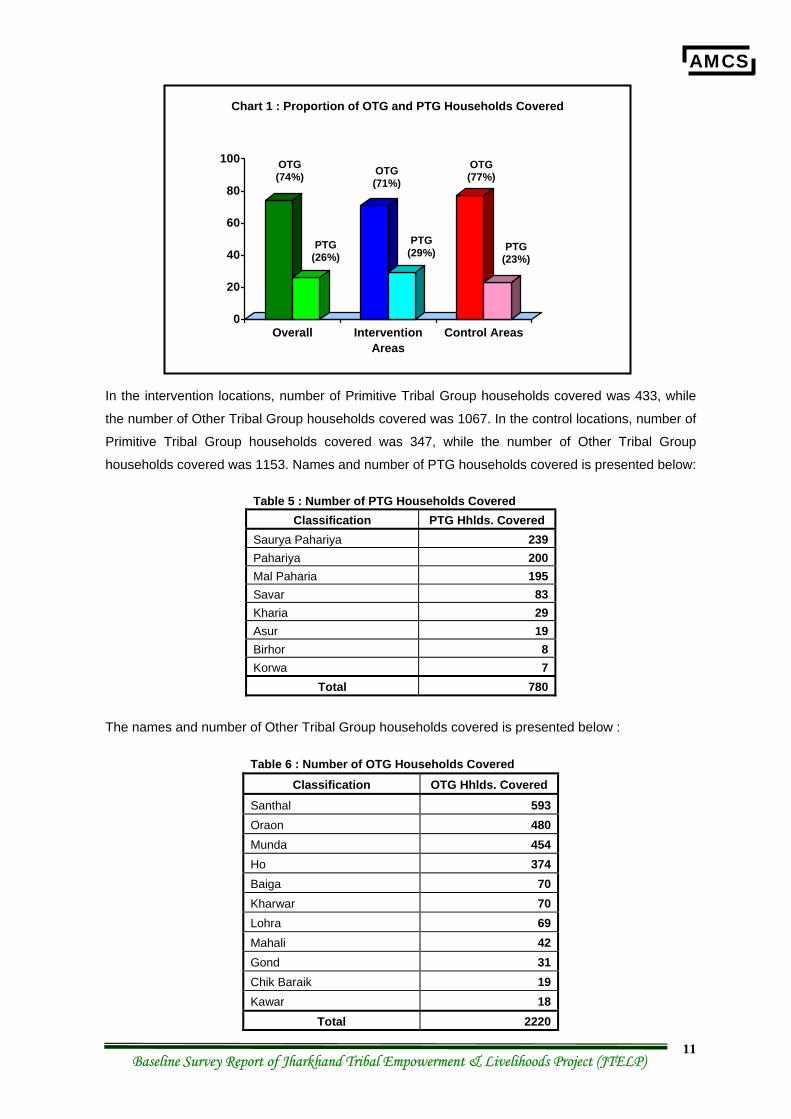
In the intervention locations, number of Primitive Tribal Group households covered was 433, while
the number of Other Tribal Group households covered was 1067. In the control locations, number of
Primitive Tribal Group households covered was 347, while the number of Other Tribal Group
households covered was 1153. Names and number of PTG households covered is presented below:
Table 5 : Number of PTG Households Covered Classification PTG Hhlds. Covered
Saurya Pahariya 239Pahariya 200Mal Paharia 195Savar 83Kharia 29Asur 19Birhor 8Korwa 7
Total 780
The names and number of Other Tribal Group households covered is presented below :
Table 6 : Number of OTG Households Covered Classification OTG Hhlds. Covered
Santhal 593Oraon 480Munda 454Ho 374Baiga 70Kharwar 70Lohra 69Mahali 42Gond 31Chik Baraik 19Kawar 18
Total 2220
0
20
40
60
80
100
Overall InterventionAreas
Control Areas
OTG (74%) OTG
(71%)
OTG (77%)
PTG (26%)
PTG (29%) PTG
(23%)
Chart 1 : Proportion of OTG and PTG Households Covered
AMCS
Baseline Survey Report of Jharkhand Tribal Empowerment & Livelihoods Project (JTELP) 12
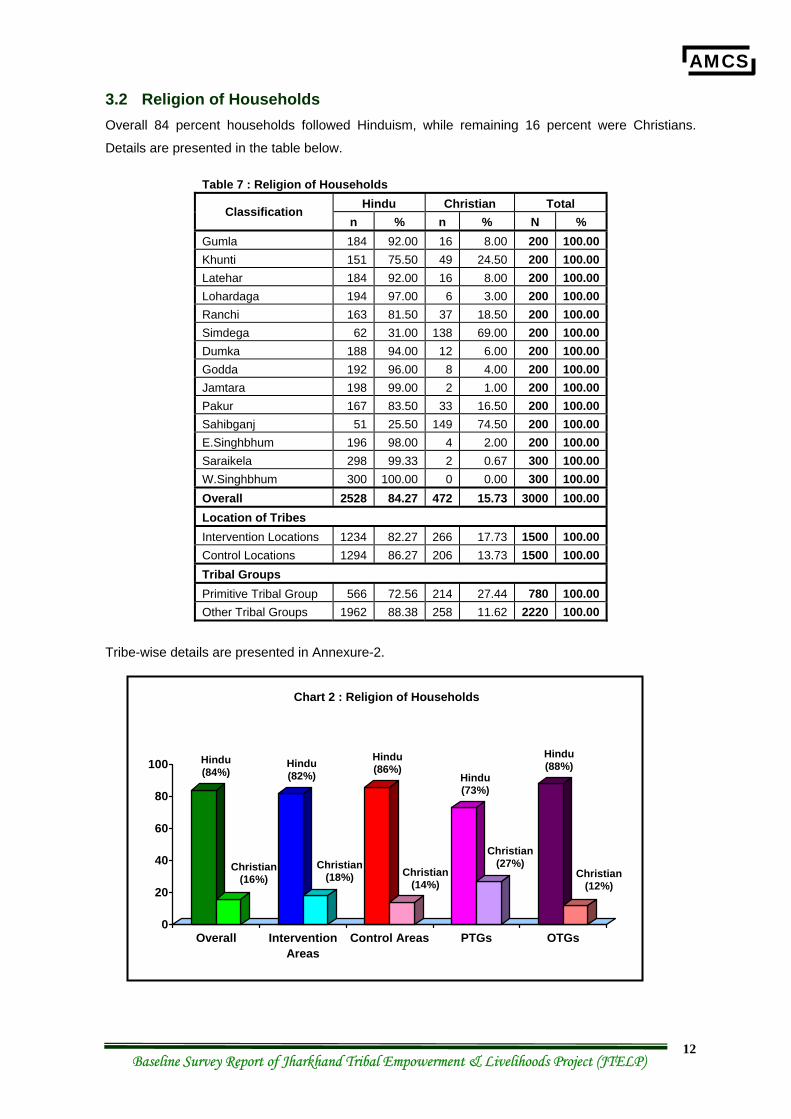
3.2 Religion of Households Overall 84 percent households followed Hinduism, while remaining 16 percent were Christians.
Details are presented in the table below.
Table 7 : Religion of Households Hindu Christian Total Classification
n % n % N % Gumla 184 92.00 16 8.00 200 100.00 Khunti 151 75.50 49 24.50 200 100.00 Latehar 184 92.00 16 8.00 200 100.00 Lohardaga 194 97.00 6 3.00 200 100.00 Ranchi 163 81.50 37 18.50 200 100.00 Simdega 62 31.00 138 69.00 200 100.00 Dumka 188 94.00 12 6.00 200 100.00 Godda 192 96.00 8 4.00 200 100.00 Jamtara 198 99.00 2 1.00 200 100.00 Pakur 167 83.50 33 16.50 200 100.00 Sahibganj 51 25.50 149 74.50 200 100.00 E.Singhbhum 196 98.00 4 2.00 200 100.00 Saraikela 298 99.33 2 0.67 300 100.00 W.Singhbhum 300 100.00 0 0.00 300 100.00 Overall 2528 84.27 472 15.73 3000 100.00 Location of Tribes Intervention Locations 1234 82.27 266 17.73 1500 100.00 Control Locations 1294 86.27 206 13.73 1500 100.00 Tribal Groups Primitive Tribal Group 566 72.56 214 27.44 780 100.00 Other Tribal Groups 1962 88.38 258 11.62 2220 100.00
Tribe-wise details are presented in Annexure-2.
0
20
40
60
80
100
Overall InterventionAreas
Control Areas PTGs OTGs
Hindu (84%)
Christian (16%)
Hindu (82%)
Christian (18%)
Hindu (86%)
Christian (14%)
Hindu (73%)
Christian (27%)
Hindu (88%)
Christian (12%)
Chart 2 : Religion of Households
AMCS
Baseline Survey Report of Jharkhand Tribal Empowerment & Livelihoods Project (JTELP) 13
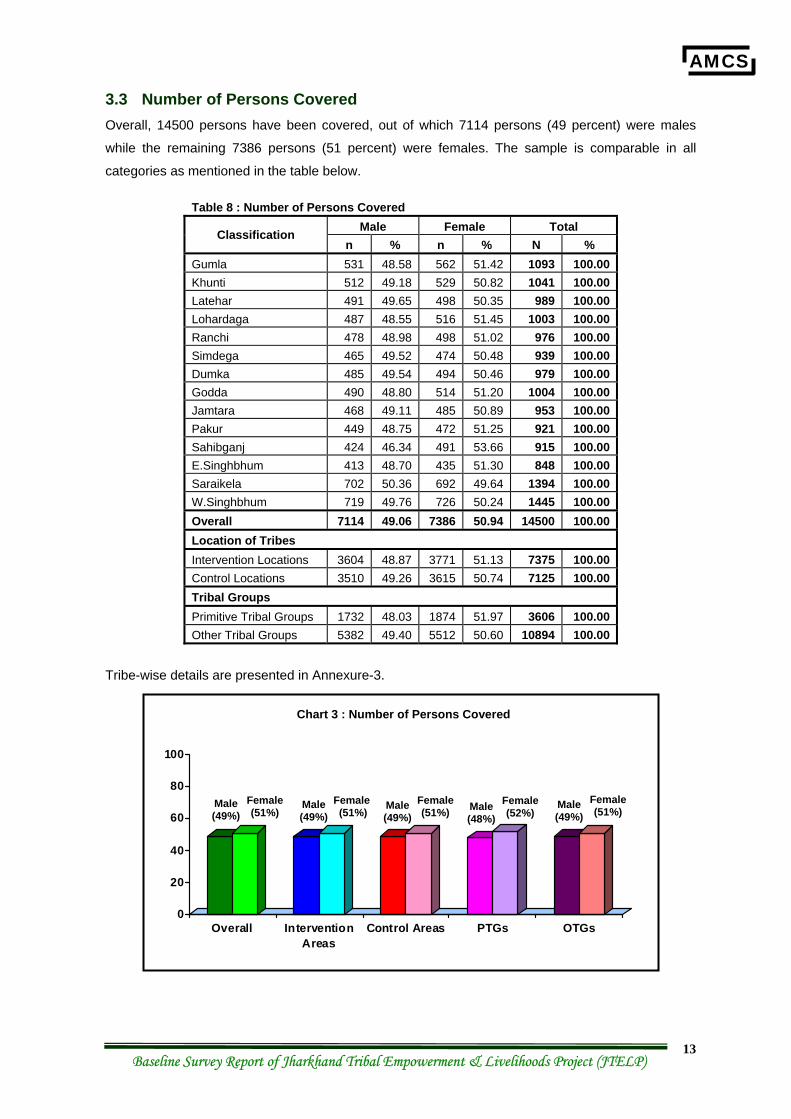
3.3 Number of Persons Covered Overall, 14500 persons have been covered, out of which 7114 persons (49 percent) were males
while the remaining 7386 persons (51 percent) were females. The sample is comparable in all
categories as mentioned in the table below.
Table 8 : Number of Persons Covered Male Female Total Classification
n % n % N % Gumla 531 48.58 562 51.42 1093 100.00 Khunti 512 49.18 529 50.82 1041 100.00 Latehar 491 49.65 498 50.35 989 100.00 Lohardaga 487 48.55 516 51.45 1003 100.00 Ranchi 478 48.98 498 51.02 976 100.00 Simdega 465 49.52 474 50.48 939 100.00 Dumka 485 49.54 494 50.46 979 100.00 Godda 490 48.80 514 51.20 1004 100.00 Jamtara 468 49.11 485 50.89 953 100.00 Pakur 449 48.75 472 51.25 921 100.00 Sahibganj 424 46.34 491 53.66 915 100.00 E.Singhbhum 413 48.70 435 51.30 848 100.00 Saraikela 702 50.36 692 49.64 1394 100.00 W.Singhbhum 719 49.76 726 50.24 1445 100.00 Overall 7114 49.06 7386 50.94 14500 100.00 Location of Tribes Intervention Locations 3604 48.87 3771 51.13 7375 100.00 Control Locations 3510 49.26 3615 50.74 7125 100.00 Tribal Groups Primitive Tribal Groups 1732 48.03 1874 51.97 3606 100.00 Other Tribal Groups 5382 49.40 5512 50.60 10894 100.00
Tribe-wise details are presented in Annexure-3.
0
20
40
60
80
100
Overall InterventionAreas
Control Areas PTGs OTGs
Male (49%)
Female (51%)
Male (49%)
Female (51%)
Male (49%)
Female (51%) Male
(48%)
Female (52%)
Male (49%)
Female (51%)
Chart 3 : Number of Persons Covered
AMCS
Baseline Survey Report of Jharkhand Tribal Empowerment & Livelihoods Project (JTELP) 14
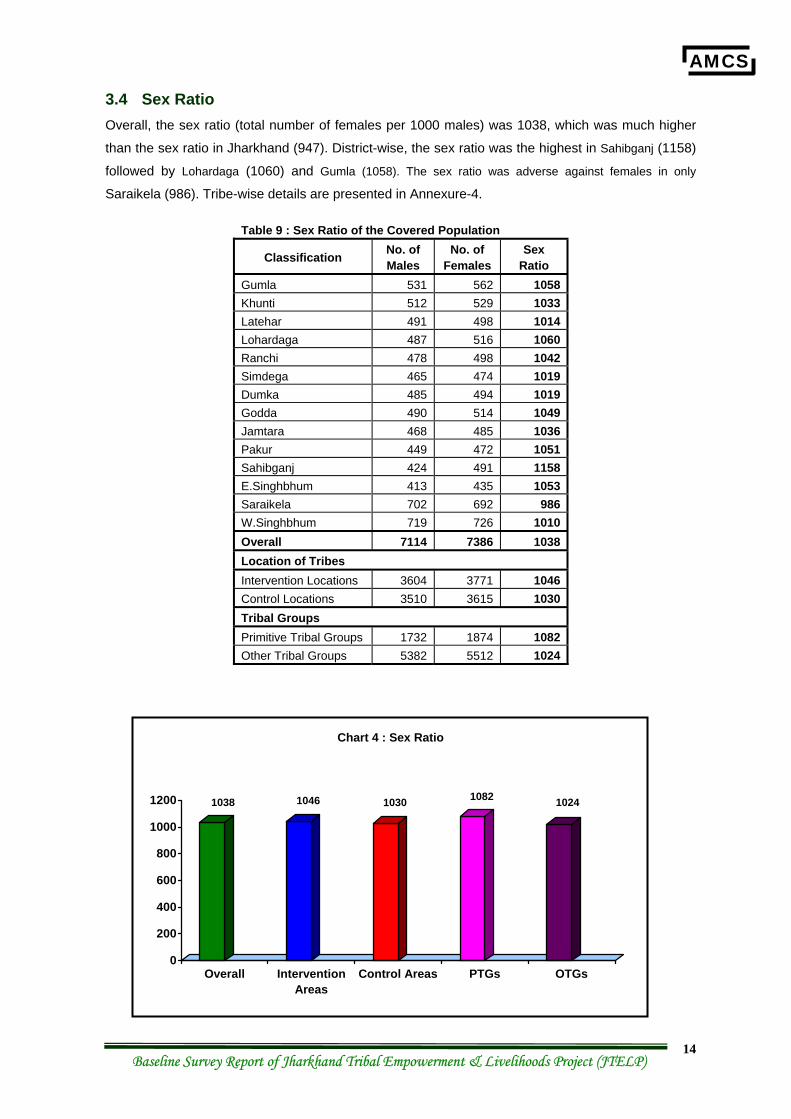
3.4 Sex Ratio Overall, the sex ratio (total number of females per 1000 males) was 1038, which was much higher
than the sex ratio in Jharkhand (947). District-wise, the sex ratio was the highest in Sahibganj (1158)
followed by Lohardaga (1060) and Gumla (1058). The sex ratio was adverse against females in only
Saraikela (986). Tribe-wise details are presented in Annexure-4.
Table 9 : Sex Ratio of the Covered Population
Classification No. of Males
No. of Females
Sex Ratio
Gumla 531 562 1058 Khunti 512 529 1033 Latehar 491 498 1014 Lohardaga 487 516 1060 Ranchi 478 498 1042 Simdega 465 474 1019 Dumka 485 494 1019 Godda 490 514 1049 Jamtara 468 485 1036 Pakur 449 472 1051 Sahibganj 424 491 1158 E.Singhbhum 413 435 1053 Saraikela 702 692 986 W.Singhbhum 719 726 1010 Overall 7114 7386 1038 Location of Tribes Intervention Locations 3604 3771 1046 Control Locations 3510 3615 1030 Tribal Groups Primitive Tribal Groups 1732 1874 1082 Other Tribal Groups 5382 5512 1024
0
200
400
600
800
1000
1200
Overall InterventionAreas
Control Areas PTGs OTGs
Chart 4 : Sex Ratio
1038 1082 1024 1046 1030
AMCS
Baseline Survey Report of Jharkhand Tribal Empowerment & Livelihoods Project (JTELP) 15
In the intervention locations, the sex ratio was higher (1046) in comparison to the control locations
(1030). Among the Primitive Tribal Groups, the sex ratio was much higher (1082), in comparison to
the Other Tribal Groups (1024).
Table 10 : Decadal Change in Sex Ratio of the Population Covered
Overall No. of Males No. of Females Sex Ratio
Age 0-5 yrs. 1753 1780 1015 Age 0-10 yrs. 2790 2936 1052 Age 11-20 yrs. 959 1133 1181 Age 21-30 yrs. 1512 1780 1177 Age 31-40 yrs. 1019 781 766 Age 41-50 yrs. 490 365 745 Age 51-60 yrs. 215 238 1107 Age >60 yrs. 368 431 1171
Similarly, tribe-wise, the sex ratio was the highest among Saurya Pahariya (1170) followed by
Kharia (1108) and Birhor (1091). The sex ratio was the lowest among the Chik Baraik (848),
followed by Mahali (909) and Korwa (952). The trend in sex ratio among the tribals over the decades
is presented in the table above. Details are presented in Annexure-5 to Annexure-12.
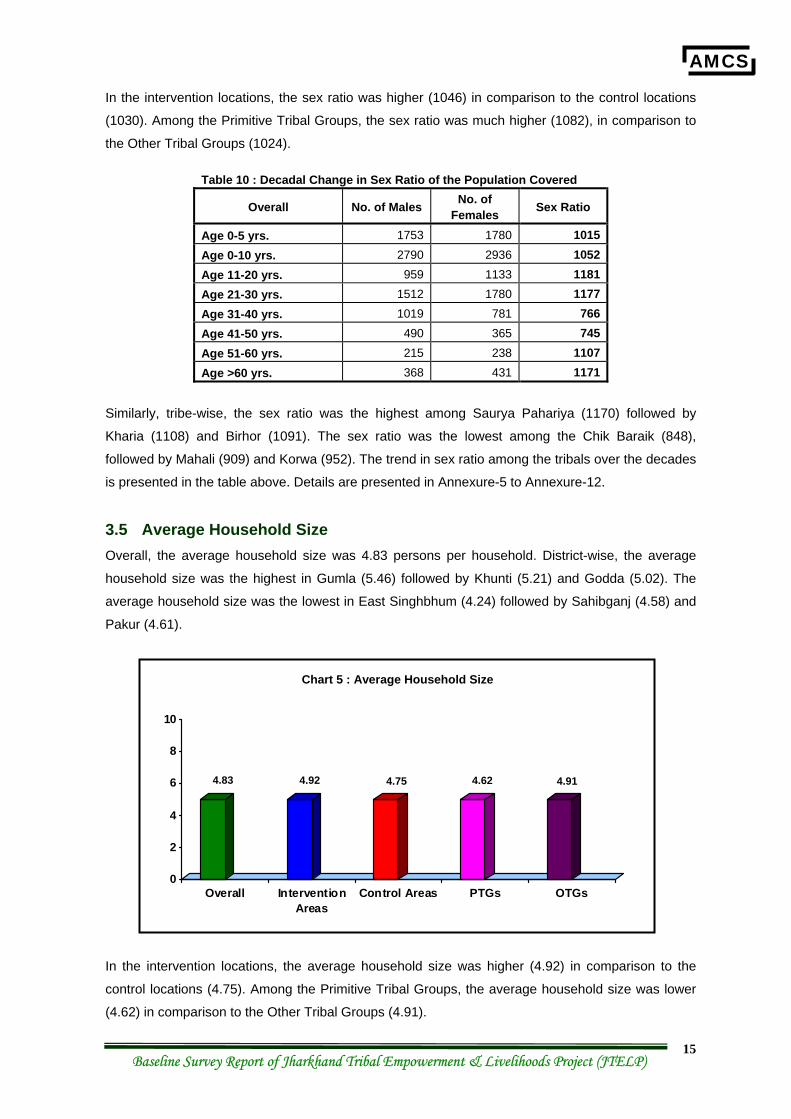
3.5 Average Household Size Overall, the average household size was 4.83 persons per household. District-wise, the average
household size was the highest in Gumla (5.46) followed by Khunti (5.21) and Godda (5.02). The
average household size was the lowest in East Singhbhum (4.24) followed by Sahibganj (4.58) and
Pakur (4.61).
In the intervention locations, the average household size was higher (4.92) in comparison to the
control locations (4.75). Among the Primitive Tribal Groups, the average household size was lower
(4.62) in comparison to the Other Tribal Groups (4.91).
0
2
4
6
8
10
Overall InterventionAreas
Control Areas PTGs OTGs
Chart 5 : Average Household Size
4.83 4.62 4.91 4.92 4.75
AMCS
Baseline Survey Report of Jharkhand Tribal Empowerment & Livelihoods Project (JTELP) 16
Similarly, tribe-wise, the average household size was the highest among Korwa (5.86) followed by
Birhor (5.75) and Kharia (5.38). The average household size was the lowest among Savar (3.93),
followed by Kawar (4.44) and Pahariya (4.45). Tribe-wise details are presented in Annexure-13.
Table 11 : Average Household Size
Classification No. of Members
No. of Hhlds.
Average Hhld. Size
Gumla 1093 200 5.46 Khunti 1041 200 5.21 Latehar 989 200 4.95 Lohardaga 1003 200 5.01 Ranchi 976 200 4.88 Simdega 939 200 4.70 Dumka 979 200 4.89 Godda 1004 200 5.02 Jamtara 953 200 4.76 Pakur 921 200 4.61 Sahibganj 915 200 4.58 E.Singhbhum 848 200 4.24 Saraikela 1394 300 4.65 W.Singhbhum 1445 300 4.82
Overall 14500 3000 4.83 Location of Tribes Intervention Locations 7375 1500 4.92 Control Locations 7125 1500 4.75
Tribal Groups
Primitive Tribal Groups 3606 780 4.62 Other Tribal Groups 10894 2220 4.91
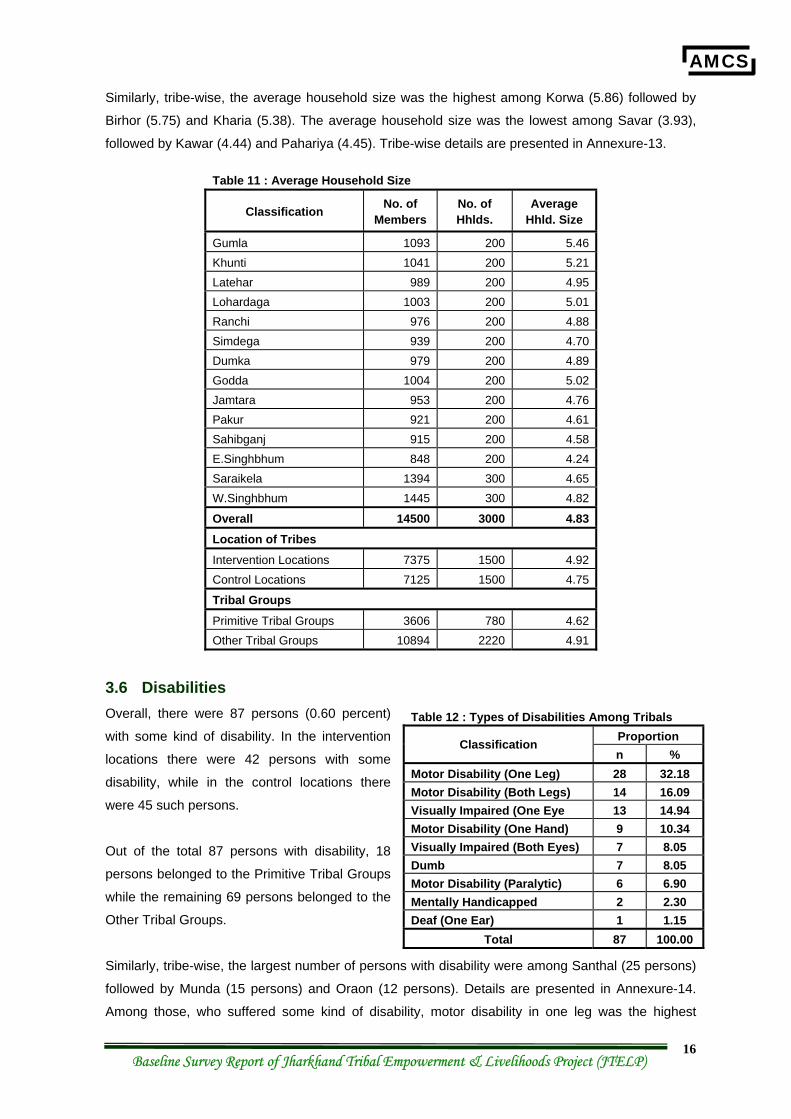
3.6 Disabilities Overall, there were 87 persons (0.60 percent)
with some kind of disability. In the intervention
locations there were 42 persons with some
disability, while in the control locations there
were 45 such persons.
Out of the total 87 persons with disability, 18
persons belonged to the Primitive Tribal Groups
while the remaining 69 persons belonged to the
Other Tribal Groups.
Similarly, tribe-wise, the largest number of persons with disability were among Santhal (25 persons)
followed by Munda (15 persons) and Oraon (12 persons). Details are presented in Annexure-14.
Among those, who suffered some kind of disability, motor disability in one leg was the highest
Table 12 : Types of Disabilities Among Tribals Proportion Classification n %
Motor Disability (One Leg) 28 32.18 Motor Disability (Both Legs) 14 16.09 Visually Impaired (One Eye 13 14.94 Motor Disability (One Hand) 9 10.34 Visually Impaired (Both Eyes) 7 8.05 Dumb 7 8.05 Motor Disability (Paralytic) 6 6.90 Mentally Handicapped 2 2.30 Deaf (One Ear) 1 1.15
Total 87 100.00
AMCS
Baseline Survey Report of Jharkhand Tribal Empowerment & Livelihoods Project (JTELP) 17
(28 persons), followed by motor disability in both legs (14 persons) and visually impaired in one eye
(13 persons). Details are presented in Annexure-15. The break-up is presented in the table below.
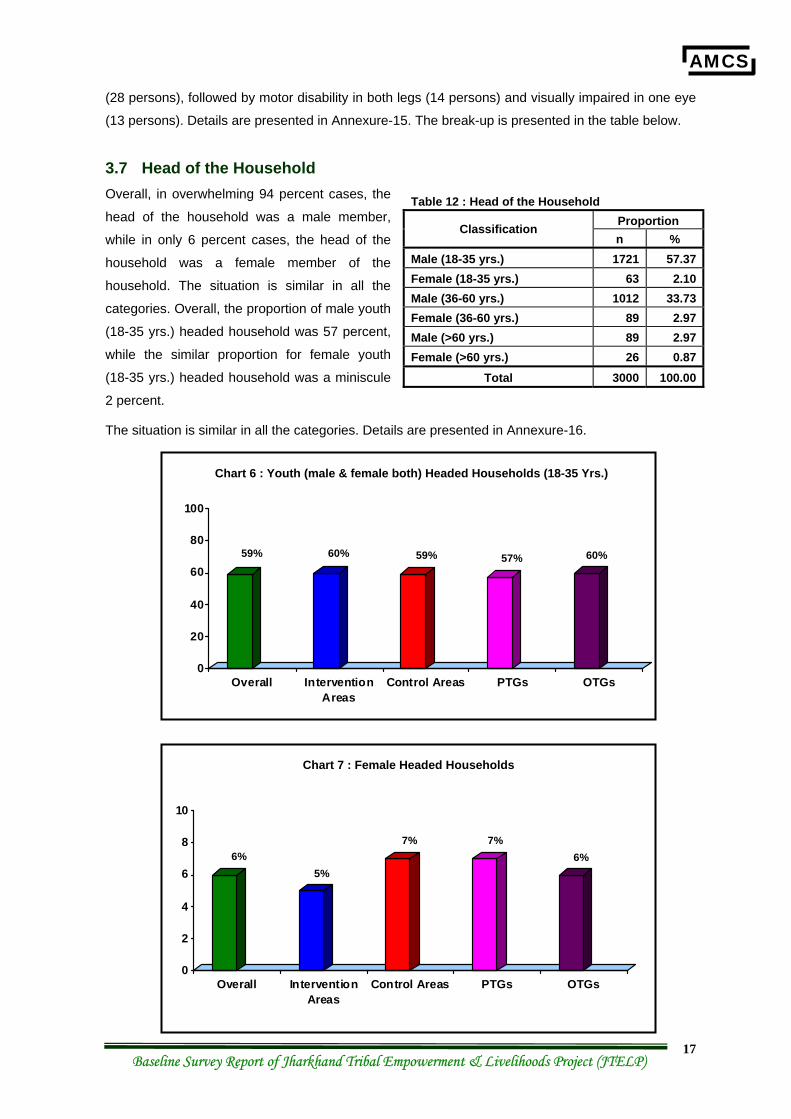
3.7 Head of the Household Overall, in overwhelming 94 percent cases, the
head of the household was a male member,
while in only 6 percent cases, the head of the
household was a female member of the
household. The situation is similar in all the
categories. Overall, the proportion of male youth
(18-35 yrs.) headed household was 57 percent,
while the similar proportion for female youth
(18-35 yrs.) headed household was a miniscule
2 percent.
The situation is similar in all the categories. Details are presented in Annexure-16.
Table 12 : Head of the Household Proportion Classification n %
Male (18-35 yrs.) 1721 57.37Female (18-35 yrs.) 63 2.10Male (36-60 yrs.) 1012 33.73Female (36-60 yrs.) 89 2.97Male (>60 yrs.) 89 2.97Female (>60 yrs.) 26 0.87
Total 3000 100.00
0
20
40
60
80
100
Overall InterventionAreas
Control Areas PTGs OTGs
Chart 6 : Youth (male & female both) Headed Households (18-35 Yrs.)
59% 57% 60% 60% 59%
0
2
4
6
8
10
Overall InterventionAreas
Control Areas PTGs OTGs
Chart 7 : Female Headed Households
7% 6%
5%
7% 6%
AMCS
Baseline Survey Report of Jharkhand Tribal Empowerment & Livelihoods Project (JTELP) 18
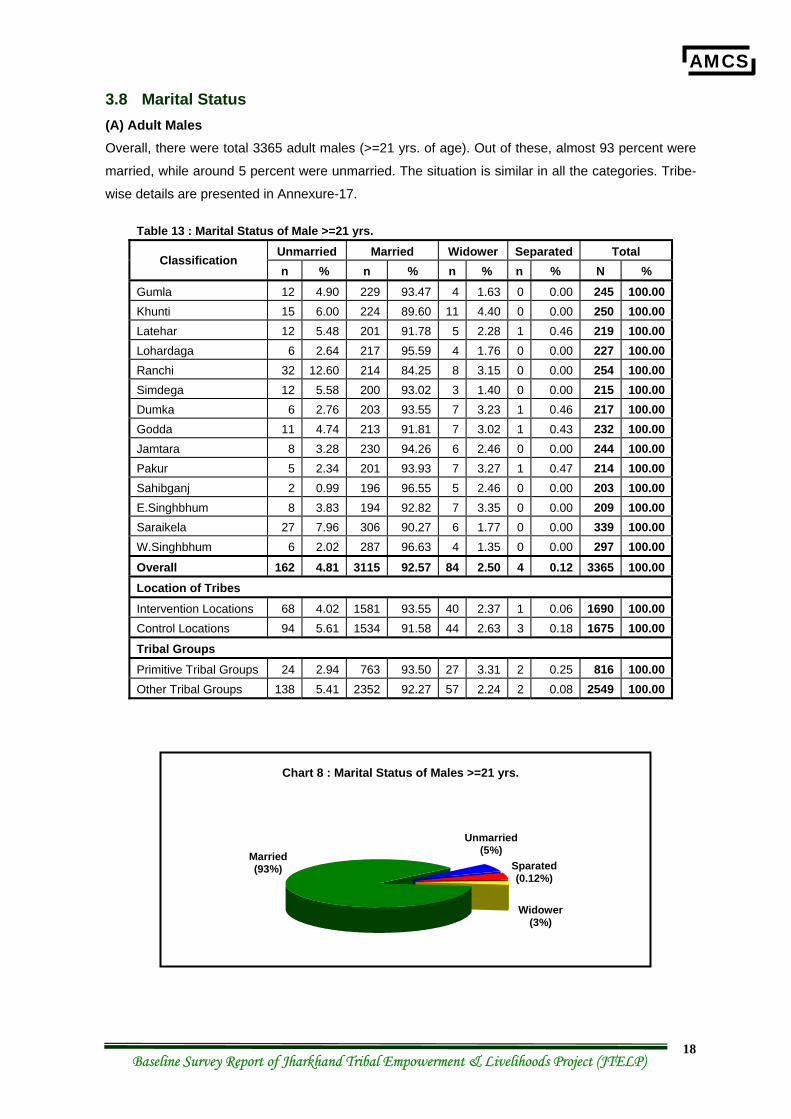
3.8 Marital Status (A) Adult Males Overall, there were total 3365 adult males (>=21 yrs. of age). Out of these, almost 93 percent were
married, while around 5 percent were unmarried. The situation is similar in all the categories. Tribe-
wise details are presented in Annexure-17.
Table 13 : Marital Status of Male >=21 yrs. Unmarried Married Widower Separated Total
Classification n % n % n % n % N %
Gumla 12 4.90 229 93.47 4 1.63 0 0.00 245 100.00Khunti 15 6.00 224 89.60 11 4.40 0 0.00 250 100.00Latehar 12 5.48 201 91.78 5 2.28 1 0.46 219 100.00Lohardaga 6 2.64 217 95.59 4 1.76 0 0.00 227 100.00Ranchi 32 12.60 214 84.25 8 3.15 0 0.00 254 100.00Simdega 12 5.58 200 93.02 3 1.40 0 0.00 215 100.00Dumka 6 2.76 203 93.55 7 3.23 1 0.46 217 100.00Godda 11 4.74 213 91.81 7 3.02 1 0.43 232 100.00Jamtara 8 3.28 230 94.26 6 2.46 0 0.00 244 100.00Pakur 5 2.34 201 93.93 7 3.27 1 0.47 214 100.00Sahibganj 2 0.99 196 96.55 5 2.46 0 0.00 203 100.00E.Singhbhum 8 3.83 194 92.82 7 3.35 0 0.00 209 100.00Saraikela 27 7.96 306 90.27 6 1.77 0 0.00 339 100.00W.Singhbhum 6 2.02 287 96.63 4 1.35 0 0.00 297 100.00Overall 162 4.81 3115 92.57 84 2.50 4 0.12 3365 100.00Location of Tribes
Intervention Locations 68 4.02 1581 93.55 40 2.37 1 0.06 1690 100.00Control Locations 94 5.61 1534 91.58 44 2.63 3 0.18 1675 100.00Tribal Groups Primitive Tribal Groups 24 2.94 763 93.50 27 3.31 2 0.25 816 100.00Other Tribal Groups 138 5.41 2352 92.27 57 2.24 2 0.08 2549 100.00
Chart 8 : Marital Status of Males >=21 yrs.
Unmarried (5%) Married
(93%) Sparated (0.12%)
Widower (3%)
AMCS
Baseline Survey Report of Jharkhand Tribal Empowerment & Livelihoods Project (JTELP) 19
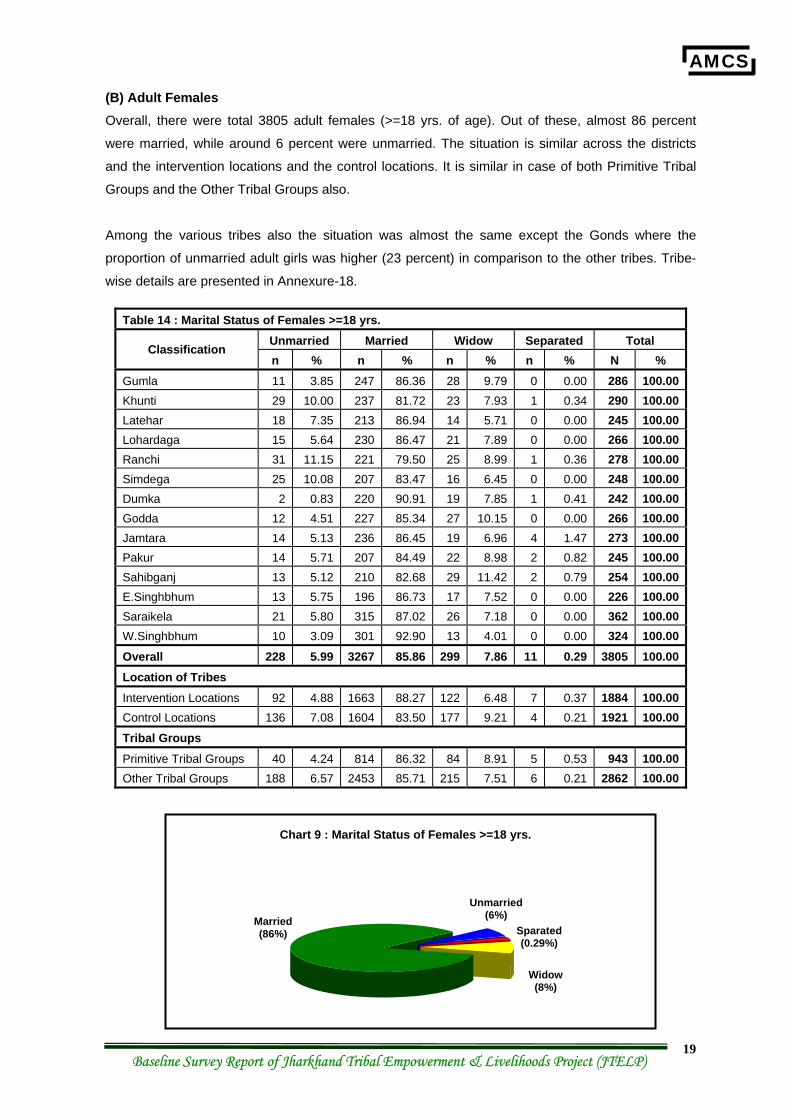
(B) Adult Females Overall, there were total 3805 adult females (>=18 yrs. of age). Out of these, almost 86 percent
were married, while around 6 percent were unmarried. The situation is similar across the districts
and the intervention locations and the control locations. It is similar in case of both Primitive Tribal
Groups and the Other Tribal Groups also.
Among the various tribes also the situation was almost the same except the Gonds where the
proportion of unmarried adult girls was higher (23 percent) in comparison to the other tribes. Tribe-
wise details are presented in Annexure-18.
Table 14 : Marital Status of Females >=18 yrs. Unmarried Married Widow Separated Total
Classification n % n % n % n % N %
Gumla 11 3.85 247 86.36 28 9.79 0 0.00 286 100.00Khunti 29 10.00 237 81.72 23 7.93 1 0.34 290 100.00Latehar 18 7.35 213 86.94 14 5.71 0 0.00 245 100.00Lohardaga 15 5.64 230 86.47 21 7.89 0 0.00 266 100.00Ranchi 31 11.15 221 79.50 25 8.99 1 0.36 278 100.00Simdega 25 10.08 207 83.47 16 6.45 0 0.00 248 100.00Dumka 2 0.83 220 90.91 19 7.85 1 0.41 242 100.00Godda 12 4.51 227 85.34 27 10.15 0 0.00 266 100.00Jamtara 14 5.13 236 86.45 19 6.96 4 1.47 273 100.00Pakur 14 5.71 207 84.49 22 8.98 2 0.82 245 100.00Sahibganj 13 5.12 210 82.68 29 11.42 2 0.79 254 100.00E.Singhbhum 13 5.75 196 86.73 17 7.52 0 0.00 226 100.00Saraikela 21 5.80 315 87.02 26 7.18 0 0.00 362 100.00W.Singhbhum 10 3.09 301 92.90 13 4.01 0 0.00 324 100.00Overall 228 5.99 3267 85.86 299 7.86 11 0.29 3805 100.00Location of Tribes Intervention Locations 92 4.88 1663 88.27 122 6.48 7 0.37 1884 100.00Control Locations 136 7.08 1604 83.50 177 9.21 4 0.21 1921 100.00Tribal Groups
Primitive Tribal Groups 40 4.24 814 86.32 84 8.91 5 0.53 943 100.00Other Tribal Groups 188 6.57 2453 85.71 215 7.51 6 0.21 2862 100.00
Chart 9 : Marital Status of Females >=18 yrs.
Unmarried (6%) Married
(86%) Sparated (0.29%)
Widow (8%)
AMCS
Baseline Survey Report of Jharkhand Tribal Empowerment & Livelihoods Project (JTELP) 20
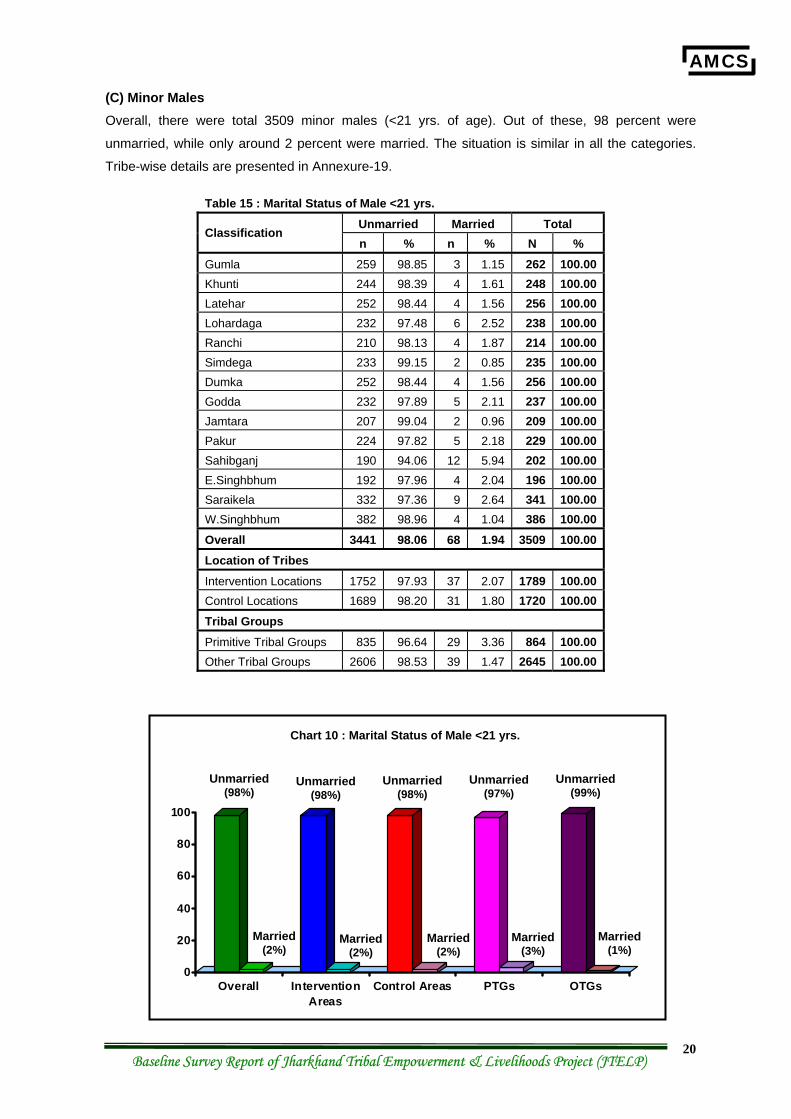
(C) Minor Males Overall, there were total 3509 minor males (<21 yrs. of age). Out of these, 98 percent were
unmarried, while only around 2 percent were married. The situation is similar in all the categories.
Tribe-wise details are presented in Annexure-19.
Table 15 : Marital Status of Male <21 yrs. Unmarried Married Total
Classification n % n % N %
Gumla 259 98.85 3 1.15 262 100.00 Khunti 244 98.39 4 1.61 248 100.00 Latehar 252 98.44 4 1.56 256 100.00 Lohardaga 232 97.48 6 2.52 238 100.00 Ranchi 210 98.13 4 1.87 214 100.00 Simdega 233 99.15 2 0.85 235 100.00 Dumka 252 98.44 4 1.56 256 100.00 Godda 232 97.89 5 2.11 237 100.00 Jamtara 207 99.04 2 0.96 209 100.00 Pakur 224 97.82 5 2.18 229 100.00 Sahibganj 190 94.06 12 5.94 202 100.00 E.Singhbhum 192 97.96 4 2.04 196 100.00 Saraikela 332 97.36 9 2.64 341 100.00 W.Singhbhum 382 98.96 4 1.04 386 100.00 Overall 3441 98.06 68 1.94 3509 100.00 Location of Tribes
Intervention Locations 1752 97.93 37 2.07 1789 100.00 Control Locations 1689 98.20 31 1.80 1720 100.00 Tribal Groups Primitive Tribal Groups 835 96.64 29 3.36 864 100.00 Other Tribal Groups 2606 98.53 39 1.47 2645 100.00
0
20
40
60
80
100
Overall InterventionAreas
Control Areas PTGs OTGs
Chart 10 : Marital Status of Male <21 yrs.
Unmarried (98%)
Married (2%)
Unmarried (98%)
Married (2%)
Unmarried (98%)
Married (2%)
Unmarried (97%)
Married (3%)
Unmarried (99%)
Married (1%)
AMCS
Baseline Survey Report of Jharkhand Tribal Empowerment & Livelihoods Project (JTELP) 21
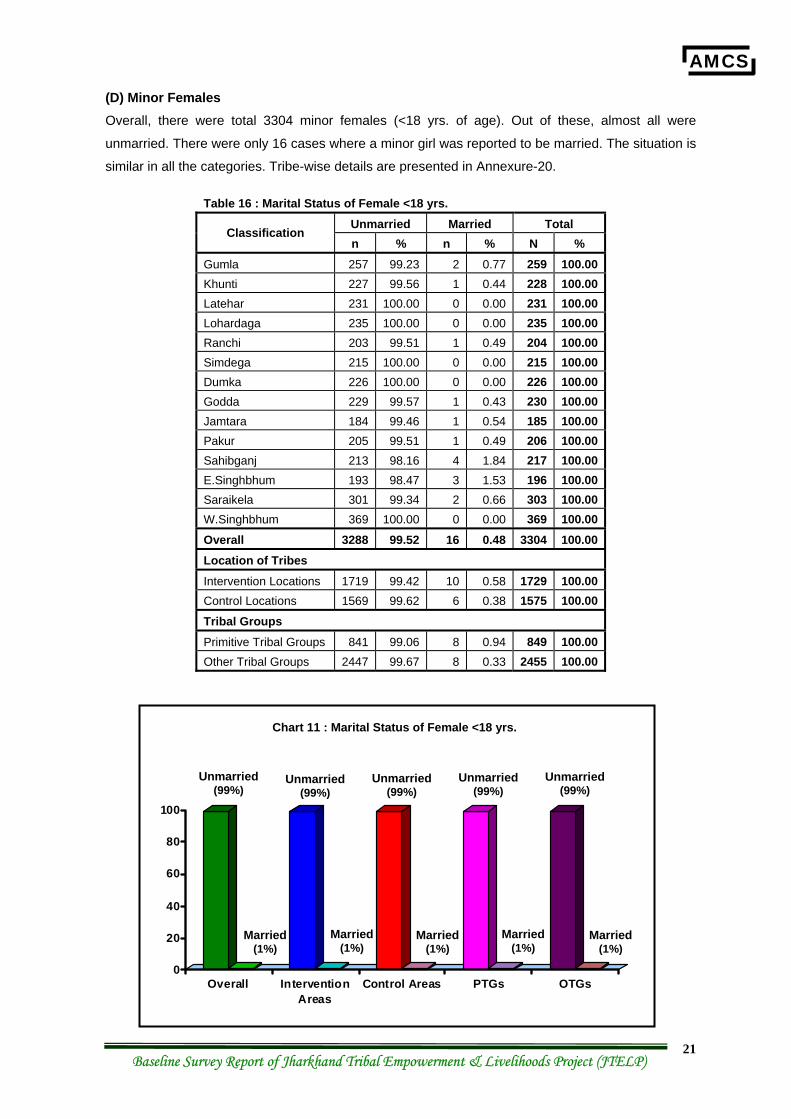
(D) Minor Females Overall, there were total 3304 minor females (<18 yrs. of age). Out of these, almost all were
unmarried. There were only 16 cases where a minor girl was reported to be married. The situation is
similar in all the categories. Tribe-wise details are presented in Annexure-20.
Table 16 : Marital Status of Female <18 yrs. Unmarried Married Total
Classification n % n % N %
Gumla 257 99.23 2 0.77 259 100.00 Khunti 227 99.56 1 0.44 228 100.00 Latehar 231 100.00 0 0.00 231 100.00 Lohardaga 235 100.00 0 0.00 235 100.00 Ranchi 203 99.51 1 0.49 204 100.00 Simdega 215 100.00 0 0.00 215 100.00 Dumka 226 100.00 0 0.00 226 100.00 Godda 229 99.57 1 0.43 230 100.00 Jamtara 184 99.46 1 0.54 185 100.00 Pakur 205 99.51 1 0.49 206 100.00 Sahibganj 213 98.16 4 1.84 217 100.00 E.Singhbhum 193 98.47 3 1.53 196 100.00 Saraikela 301 99.34 2 0.66 303 100.00 W.Singhbhum 369 100.00 0 0.00 369 100.00 Overall 3288 99.52 16 0.48 3304 100.00 Location of Tribes
Intervention Locations 1719 99.42 10 0.58 1729 100.00 Control Locations 1569 99.62 6 0.38 1575 100.00 Tribal Groups Primitive Tribal Groups 841 99.06 8 0.94 849 100.00 Other Tribal Groups 2447 99.67 8 0.33 2455 100.00
0
20
40
60
80
100
Overall InterventionAreas
Control Areas PTGs OTGs
Chart 11 : Marital Status of Female <18 yrs.
Unmarried (99%)
Unmarried (99%)
Unmarried (99%)
Unmarried (99%)
Unmarried (99%)
Married (1%)
Married (1%)
Married (1%)
Married (1%)
Married (1%)
AMCS
Baseline Survey Report of Jharkhand Tribal Empowerment & Livelihoods Project (JTELP) 22
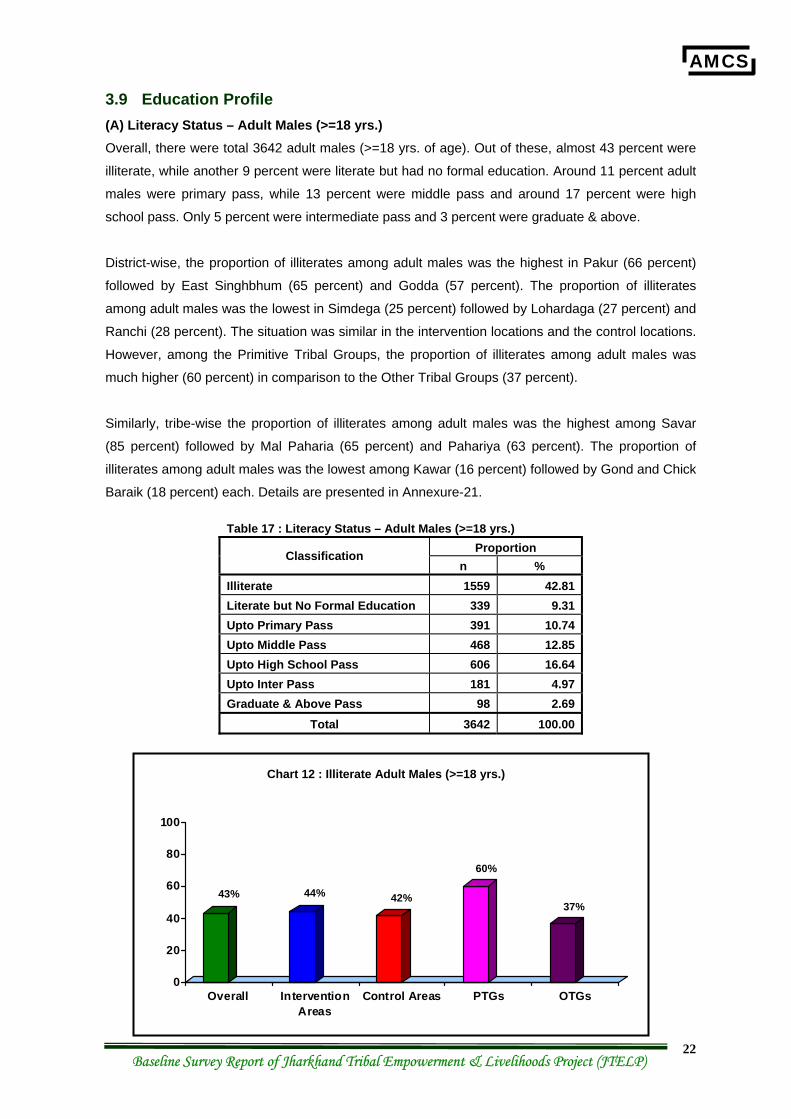
3.9 Education Profile (A) Literacy Status – Adult Males (>=18 yrs.) Overall, there were total 3642 adult males (>=18 yrs. of age). Out of these, almost 43 percent were
illiterate, while another 9 percent were literate but had no formal education. Around 11 percent adult
males were primary pass, while 13 percent were middle pass and around 17 percent were high
school pass. Only 5 percent were intermediate pass and 3 percent were graduate & above.
District-wise, the proportion of illiterates among adult males was the highest in Pakur (66 percent)
followed by East Singhbhum (65 percent) and Godda (57 percent). The proportion of illiterates
among adult males was the lowest in Simdega (25 percent) followed by Lohardaga (27 percent) and
Ranchi (28 percent). The situation was similar in the intervention locations and the control locations.
However, among the Primitive Tribal Groups, the proportion of illiterates among adult males was
much higher (60 percent) in comparison to the Other Tribal Groups (37 percent).
Similarly, tribe-wise the proportion of illiterates among adult males was the highest among Savar
(85 percent) followed by Mal Paharia (65 percent) and Pahariya (63 percent). The proportion of
illiterates among adult males was the lowest among Kawar (16 percent) followed by Gond and Chick
Baraik (18 percent) each. Details are presented in Annexure-21.
Table 17 : Literacy Status – Adult Males (>=18 yrs.) Proportion Classification
n % Illiterate 1559 42.81 Literate but No Formal Education 339 9.31 Upto Primary Pass 391 10.74 Upto Middle Pass 468 12.85 Upto High School Pass 606 16.64 Upto Inter Pass 181 4.97 Graduate & Above Pass 98 2.69
Total 3642 100.00
0
20
40
60
80
100
Overall InterventionAreas
Control Areas PTGs OTGs
Chart 12 : Illiterate Adult Males (>=18 yrs.)
43%
60%
37% 44% 42%
AMCS
Baseline Survey Report of Jharkhand Tribal Empowerment & Livelihoods Project (JTELP) 23
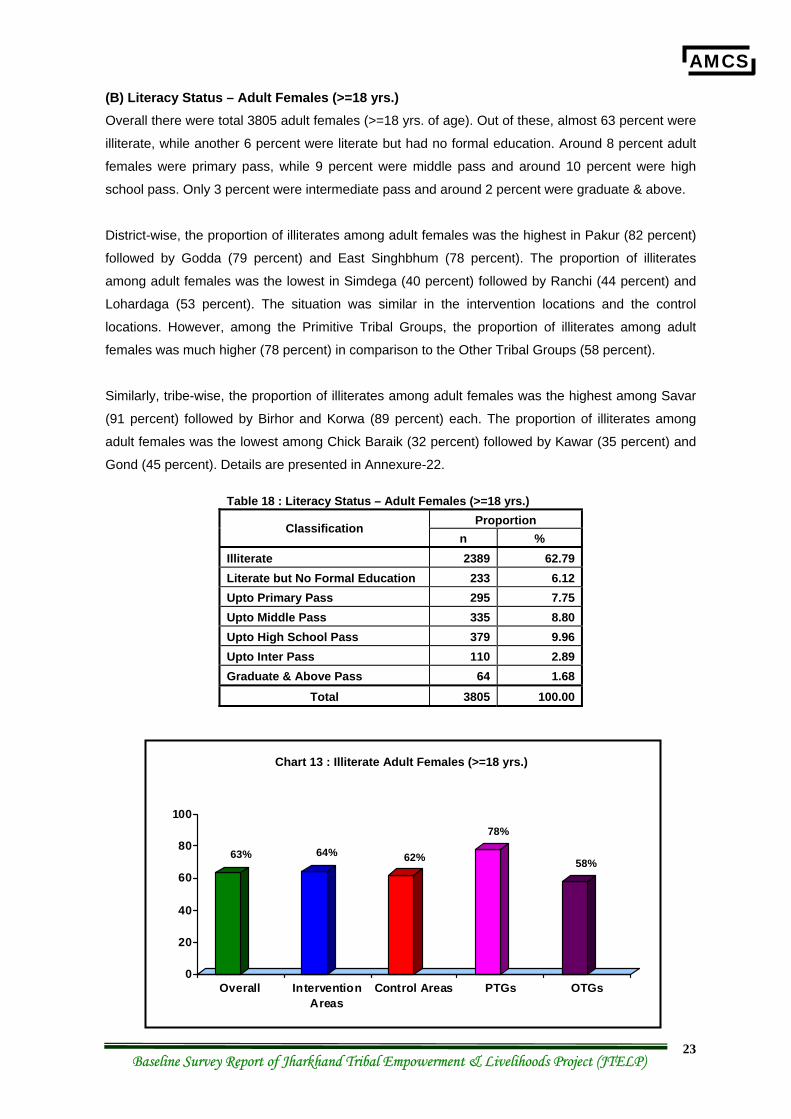
(B) Literacy Status – Adult Females (>=18 yrs.) Overall there were total 3805 adult females (>=18 yrs. of age). Out of these, almost 63 percent were
illiterate, while another 6 percent were literate but had no formal education. Around 8 percent adult
females were primary pass, while 9 percent were middle pass and around 10 percent were high
school pass. Only 3 percent were intermediate pass and around 2 percent were graduate & above.
District-wise, the proportion of illiterates among adult females was the highest in Pakur (82 percent)
followed by Godda (79 percent) and East Singhbhum (78 percent). The proportion of illiterates
among adult females was the lowest in Simdega (40 percent) followed by Ranchi (44 percent) and
Lohardaga (53 percent). The situation was similar in the intervention locations and the control
locations. However, among the Primitive Tribal Groups, the proportion of illiterates among adult
females was much higher (78 percent) in comparison to the Other Tribal Groups (58 percent).
Similarly, tribe-wise, the proportion of illiterates among adult females was the highest among Savar
(91 percent) followed by Birhor and Korwa (89 percent) each. The proportion of illiterates among
adult females was the lowest among Chick Baraik (32 percent) followed by Kawar (35 percent) and
Gond (45 percent). Details are presented in Annexure-22.
Table 18 : Literacy Status – Adult Females (>=18 yrs.) Proportion Classification
n % Illiterate 2389 62.79 Literate but No Formal Education 233 6.12 Upto Primary Pass 295 7.75 Upto Middle Pass 335 8.80 Upto High School Pass 379 9.96 Upto Inter Pass 110 2.89 Graduate & Above Pass 64 1.68
Total 3805 100.00
0
20
40
60
80
100
Overall InterventionAreas
Control Areas PTGs OTGs
Chart 13 : Illiterate Adult Females (>=18 yrs.)
63%
78%
58% 64% 62%
AMCS
Baseline Survey Report of Jharkhand Tribal Empowerment & Livelihoods Project (JTELP) 24
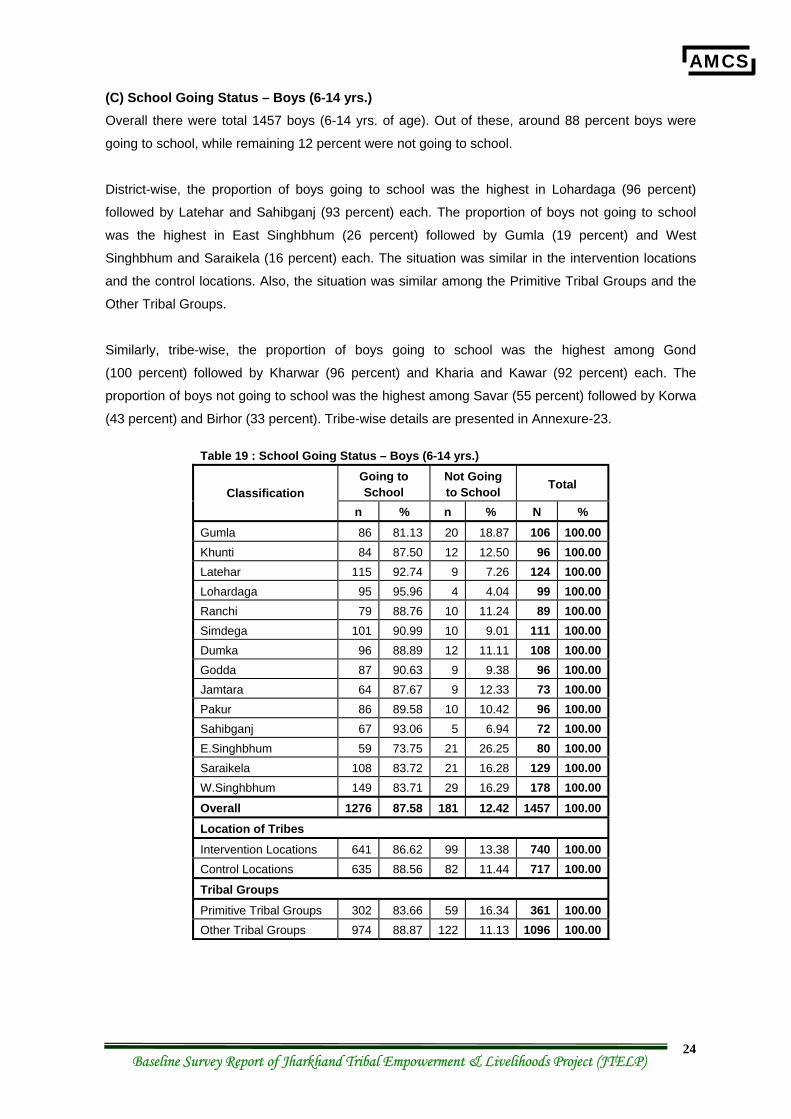
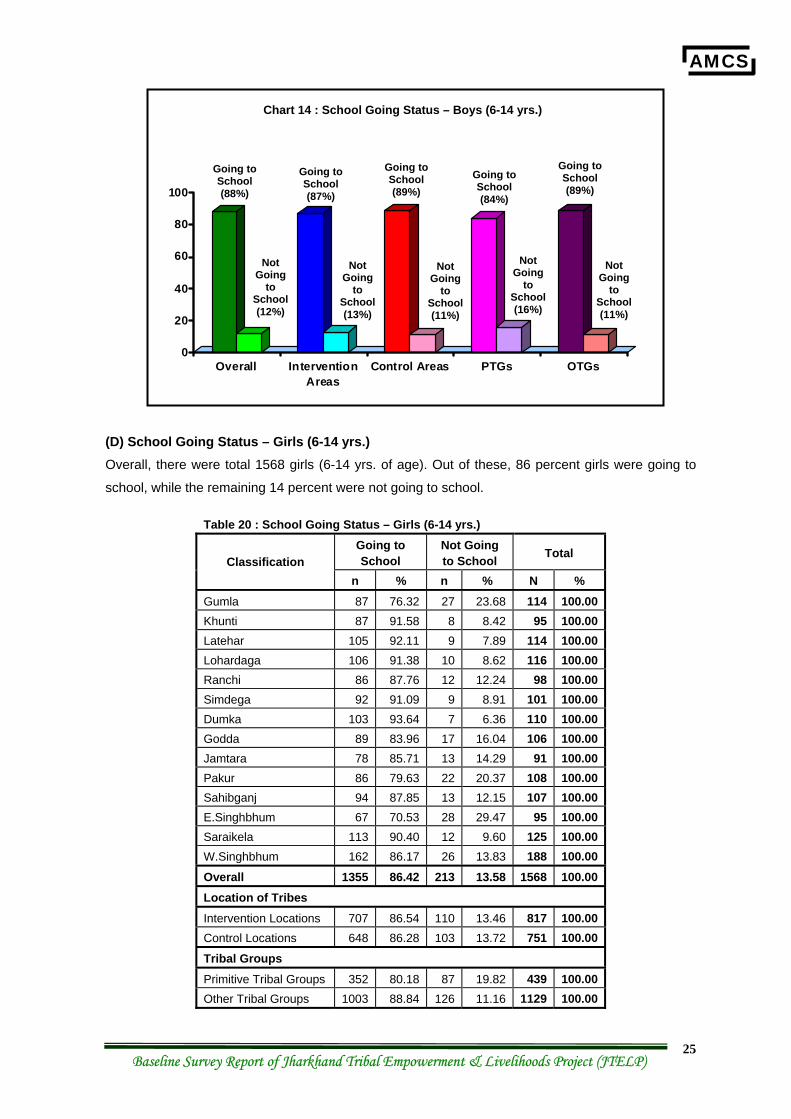
(C) School Going Status – Boys (6-14 yrs.) Overall there were total 1457 boys (6-14 yrs. of age). Out of these, around 88 percent boys were
going to school, while remaining 12 percent were not going to school.
District-wise, the proportion of boys going to school was the highest in Lohardaga (96 percent)
followed by Latehar and Sahibganj (93 percent) each. The proportion of boys not going to school
was the highest in East Singhbhum (26 percent) followed by Gumla (19 percent) and West
Singhbhum and Saraikela (16 percent) each. The situation was similar in the intervention locations
and the control locations. Also, the situation was similar among the Primitive Tribal Groups and the
Other Tribal Groups.
Similarly, tribe-wise, the proportion of boys going to school was the highest among Gond
(100 percent) followed by Kharwar (96 percent) and Kharia and Kawar (92 percent) each. The
proportion of boys not going to school was the highest among Savar (55 percent) followed by Korwa
(43 percent) and Birhor (33 percent). Tribe-wise details are presented in Annexure-23.
Table 19 : School Going Status – Boys (6-14 yrs.) Going to School
Not Going to School Total
Classification n % n % N %
Gumla 86 81.13 20 18.87 106 100.00 Khunti 84 87.50 12 12.50 96 100.00 Latehar 115 92.74 9 7.26 124 100.00 Lohardaga 95 95.96 4 4.04 99 100.00 Ranchi 79 88.76 10 11.24 89 100.00 Simdega 101 90.99 10 9.01 111 100.00 Dumka 96 88.89 12 11.11 108 100.00 Godda 87 90.63 9 9.38 96 100.00 Jamtara 64 87.67 9 12.33 73 100.00 Pakur 86 89.58 10 10.42 96 100.00 Sahibganj 67 93.06 5 6.94 72 100.00 E.Singhbhum 59 73.75 21 26.25 80 100.00 Saraikela 108 83.72 21 16.28 129 100.00 W.Singhbhum 149 83.71 29 16.29 178 100.00 Overall 1276 87.58 181 12.42 1457 100.00 Location of Tribes Intervention Locations 641 86.62 99 13.38 740 100.00 Control Locations 635 88.56 82 11.44 717 100.00 Tribal Groups
Primitive Tribal Groups 302 83.66 59 16.34 361 100.00 Other Tribal Groups 974 88.87 122 11.13 1096 100.00
AMCS
Baseline Survey Report of Jharkhand Tribal Empowerment & Livelihoods Project (JTELP) 25
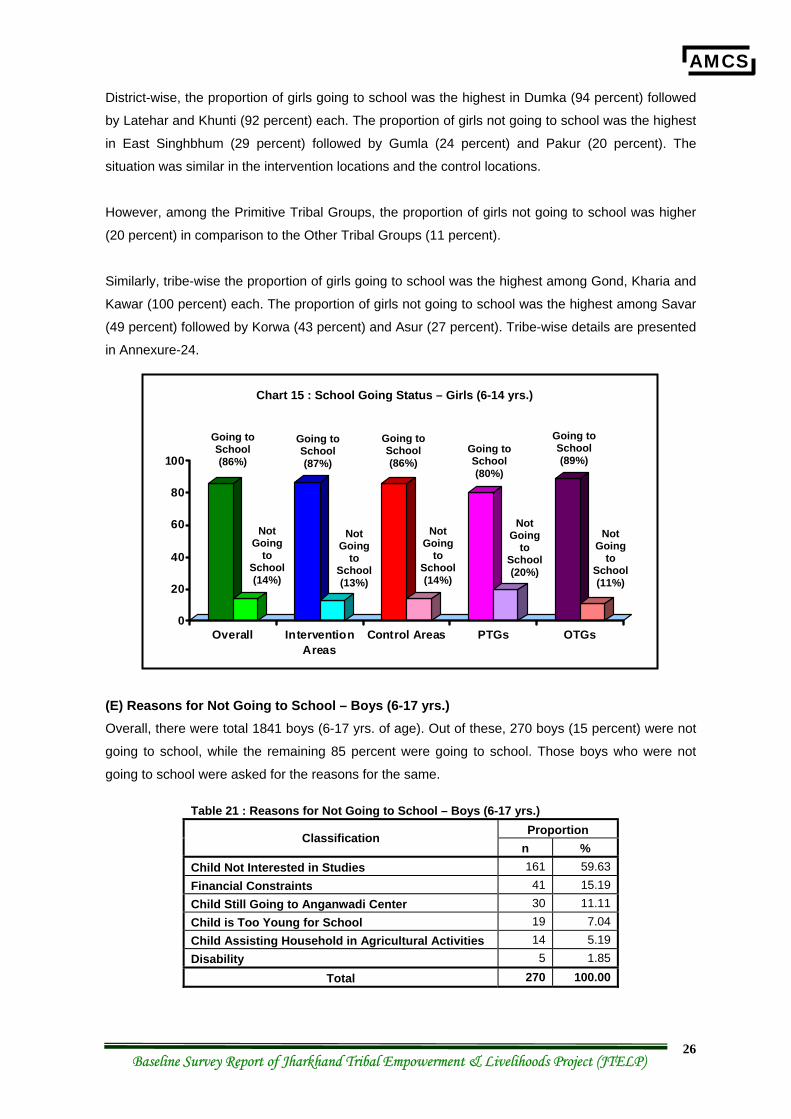
(D) School Going Status – Girls (6-14 yrs.) Overall, there were total 1568 girls (6-14 yrs. of age). Out of these, 86 percent girls were going to
school, while the remaining 14 percent were not going to school.
Table 20 : School Going Status – Girls (6-14 yrs.) Going to School
Not Going to School Total
Classification n % n % N %
Gumla 87 76.32 27 23.68 114 100.00 Khunti 87 91.58 8 8.42 95 100.00 Latehar 105 92.11 9 7.89 114 100.00 Lohardaga 106 91.38 10 8.62 116 100.00 Ranchi 86 87.76 12 12.24 98 100.00 Simdega 92 91.09 9 8.91 101 100.00 Dumka 103 93.64 7 6.36 110 100.00 Godda 89 83.96 17 16.04 106 100.00 Jamtara 78 85.71 13 14.29 91 100.00 Pakur 86 79.63 22 20.37 108 100.00 Sahibganj 94 87.85 13 12.15 107 100.00 E.Singhbhum 67 70.53 28 29.47 95 100.00 Saraikela 113 90.40 12 9.60 125 100.00 W.Singhbhum 162 86.17 26 13.83 188 100.00 Overall 1355 86.42 213 13.58 1568 100.00 Location of Tribes Intervention Locations 707 86.54 110 13.46 817 100.00 Control Locations 648 86.28 103 13.72 751 100.00 Tribal Groups Primitive Tribal Groups 352 80.18 87 19.82 439 100.00 Other Tribal Groups 1003 88.84 126 11.16 1129 100.00
0
20
40
60
80
100
Overall InterventionAreas
Control Areas PTGs OTGs
Chart 14 : School Going Status – Boys (6-14 yrs.)
Not Going
to School (12%)
Not Going
to School (13%)
Not Going
to School (11%)
Not Going
to School (16%)
Going to School (88%)
Going to School (87%)
Going to School (89%)
Going to School (84%)
Going to School (89%)
Not Going
to School (11%)
AMCS
Baseline Survey Report of Jharkhand Tribal Empowerment & Livelihoods Project (JTELP) 26
District-wise, the proportion of girls going to school was the highest in Dumka (94 percent) followed
by Latehar and Khunti (92 percent) each. The proportion of girls not going to school was the highest
in East Singhbhum (29 percent) followed by Gumla (24 percent) and Pakur (20 percent). The
situation was similar in the intervention locations and the control locations.
However, among the Primitive Tribal Groups, the proportion of girls not going to school was higher
(20 percent) in comparison to the Other Tribal Groups (11 percent).
Similarly, tribe-wise the proportion of girls going to school was the highest among Gond, Kharia and
Kawar (100 percent) each. The proportion of girls not going to school was the highest among Savar
(49 percent) followed by Korwa (43 percent) and Asur (27 percent). Tribe-wise details are presented
in Annexure-24.
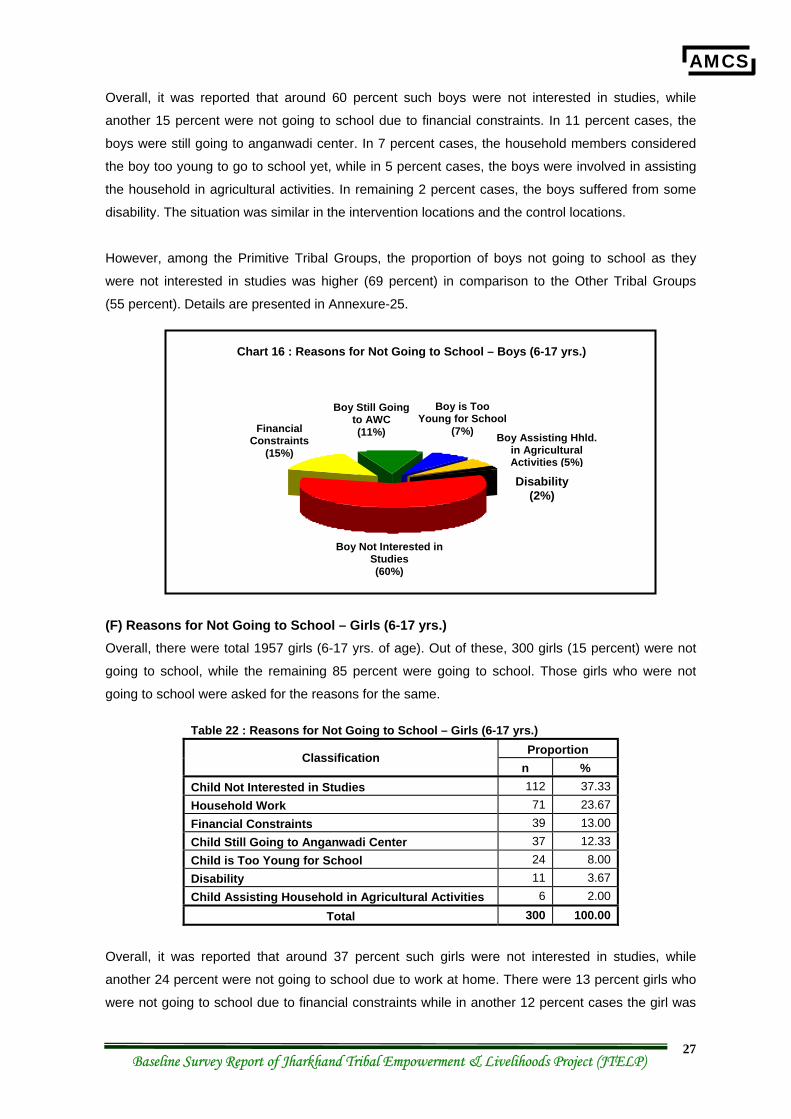
(E) Reasons for Not Going to School – Boys (6-17 yrs.) Overall, there were total 1841 boys (6-17 yrs. of age). Out of these, 270 boys (15 percent) were not
going to school, while the remaining 85 percent were going to school. Those boys who were not
going to school were asked for the reasons for the same.
Table 21 : Reasons for Not Going to School – Boys (6-17 yrs.) Proportion Classification
n % Child Not Interested in Studies 161 59.63 Financial Constraints 41 15.19 Child Still Going to Anganwadi Center 30 11.11 Child is Too Young for School 19 7.04 Child Assisting Household in Agricultural Activities 14 5.19 Disability 5 1.85
Total 270 100.00
0
20
40
60
80
100
Overall InterventionAreas
Control Areas PTGs OTGs
Not Going
to School (14%)
Not Going
to School (13%)
Not Going
to School (14%)
Not Going
to School (20%)
Not Going
to School (11%)
Chart 15 : School Going Status – Girls (6-14 yrs.)
Going to School (86%)
Going to School (87%)
Going to School (86%)
Going to School (80%)
Going to School (89%)
AMCS
Baseline Survey Report of Jharkhand Tribal Empowerment & Livelihoods Project (JTELP) 27
Overall, it was reported that around 60 percent such boys were not interested in studies, while
another 15 percent were not going to school due to financial constraints. In 11 percent cases, the
boys were still going to anganwadi center. In 7 percent cases, the household members considered
the boy too young to go to school yet, while in 5 percent cases, the boys were involved in assisting
the household in agricultural activities. In remaining 2 percent cases, the boys suffered from some
disability. The situation was similar in the intervention locations and the control locations.
However, among the Primitive Tribal Groups, the proportion of boys not going to school as they
were not interested in studies was higher (69 percent) in comparison to the Other Tribal Groups
(55 percent). Details are presented in Annexure-25.
(F) Reasons for Not Going to School – Girls (6-17 yrs.) Overall, there were total 1957 girls (6-17 yrs. of age). Out of these, 300 girls (15 percent) were not
going to school, while the remaining 85 percent were going to school. Those girls who were not
going to school were asked for the reasons for the same.
Table 22 : Reasons for Not Going to School – Girls (6-17 yrs.) Proportion Classification
n % Child Not Interested in Studies 112 37.33 Household Work 71 23.67 Financial Constraints 39 13.00 Child Still Going to Anganwadi Center 37 12.33 Child is Too Young for School 24 8.00 Disability 11 3.67 Child Assisting Household in Agricultural Activities 6 2.00
Total 300 100.00
Overall, it was reported that around 37 percent such girls were not interested in studies, while
another 24 percent were not going to school due to work at home. There were 13 percent girls who
were not going to school due to financial constraints while in another 12 percent cases the girl was
Chart 16 : Reasons for Not Going to School – Boys (6-17 yrs.)
Boy is Too Young for School
(7%) Financial Constraints
(15%)
Disability (2%)
Boy Not Interested in Studies (60%)
Boy Assisting Hhld. in Agricultural Activities (5%)
Boy Still Going to AWC (11%)
AMCS
Baseline Survey Report of Jharkhand Tribal Empowerment & Livelihoods Project (JTELP) 28
still going to anganwadi center. In 8 percent cases the household members considered the girl too
young to go to school yet, while in 4 percent cases the girls suffered from some disability.
In remaining 2 percent cases, the girls were involved in assisting the household in agricultural
activities. The situation was similar in the intervention locations and the control locations. However,
among the Primitive Tribal Groups, the proportion of girls not going to school as they were not
interested in studies was higher (47 percent) in comparison to the Other Tribal Groups (31 percent).
Details are presented in Annexure-26.
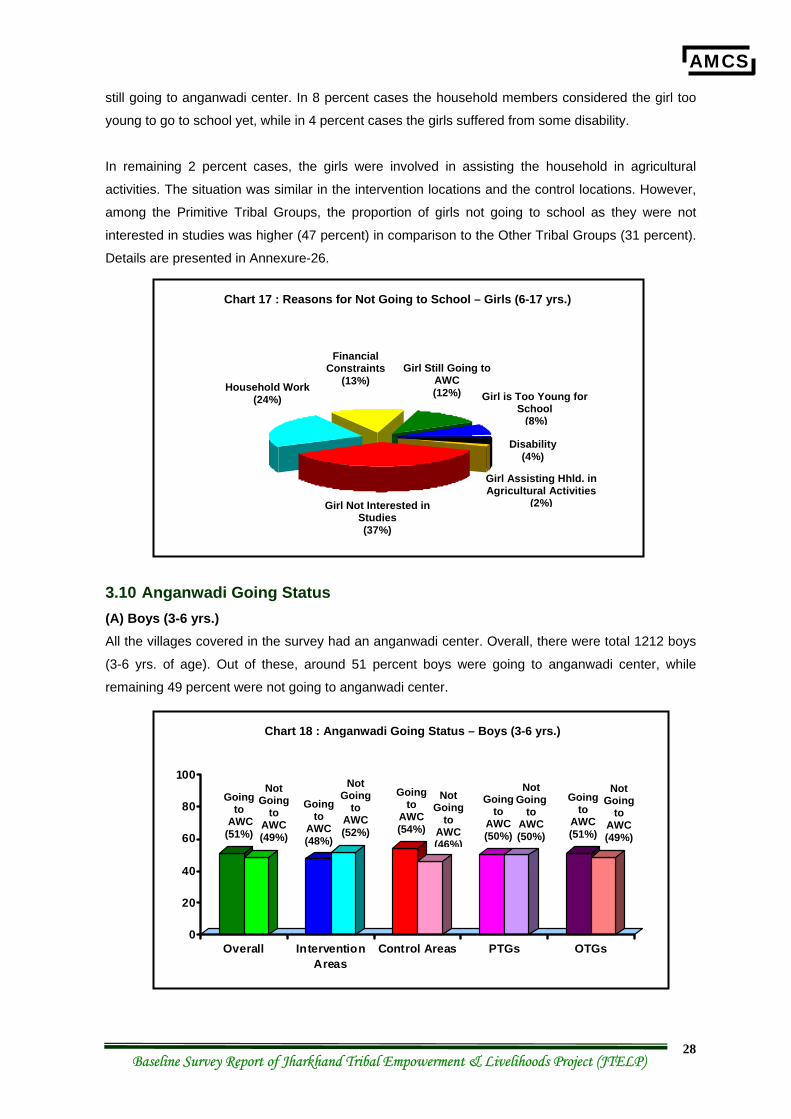
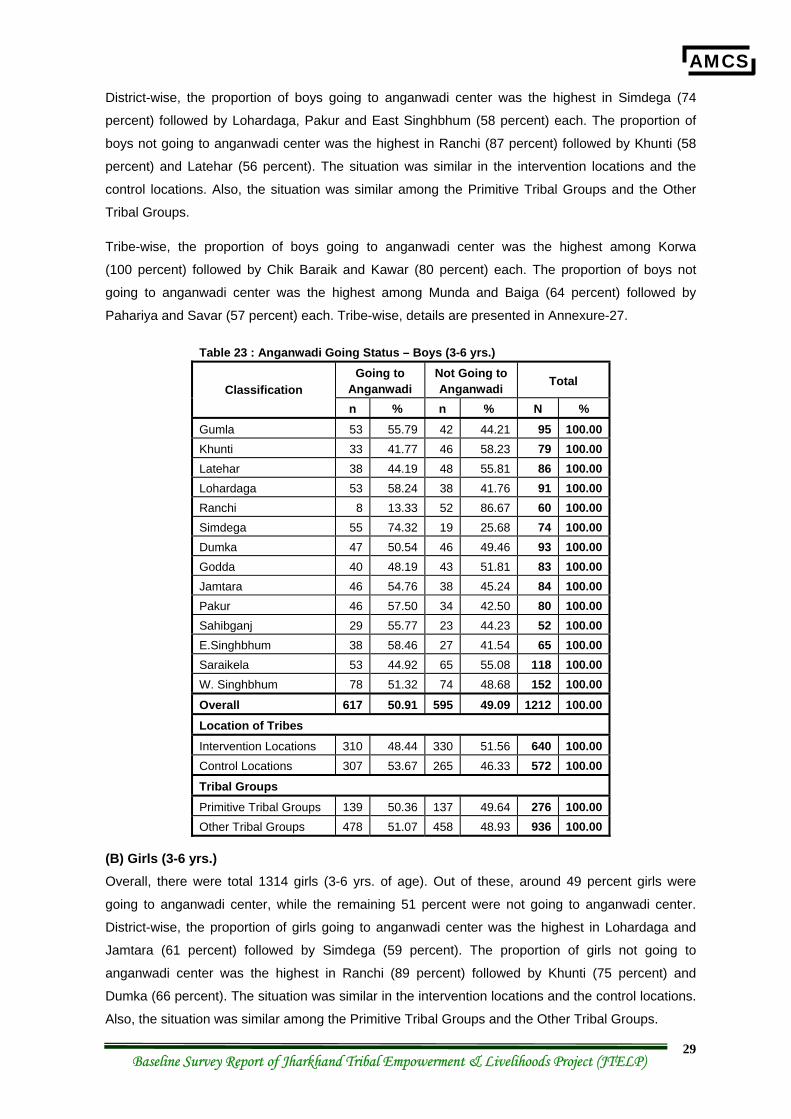
3.10 Anganwadi Going Status (A) Boys (3-6 yrs.) All the villages covered in the survey had an anganwadi center. Overall, there were total 1212 boys
(3-6 yrs. of age). Out of these, around 51 percent boys were going to anganwadi center, while
remaining 49 percent were not going to anganwadi center.
0
20
40
60
80
100
Overall InterventionAreas
Control Areas PTGs OTGs
Chart 18 : Anganwadi Going Status – Boys (3-6 yrs.)
Going to
AWC (51%)
Not Going
to AWC (49%)
Going to
AWC (54%)
Not Going
to AWC (46%)
Going to
AWC (50%)
Not Going
to AWC (50%)
Going to
AWC (51%)
Not Going
to AWC (49%)
Going to
AWC (48%)
Not Going
to AWC (52%)
Chart 17 : Reasons for Not Going to School – Girls (6-17 yrs.)
Girl Still Going to AWC (12%) Household Work
(24%)
Disability (4%)
Girl Not Interested in Studies (37%)
Girl is Too Young for School
(8%)
Financial Constraints
(13%)
Girl Assisting Hhld. in Agricultural Activities
(2%)
AMCS
Baseline Survey Report of Jharkhand Tribal Empowerment & Livelihoods Project (JTELP) 29
District-wise, the proportion of boys going to anganwadi center was the highest in Simdega (74
percent) followed by Lohardaga, Pakur and East Singhbhum (58 percent) each. The proportion of
boys not going to anganwadi center was the highest in Ranchi (87 percent) followed by Khunti (58
percent) and Latehar (56 percent). The situation was similar in the intervention locations and the
control locations. Also, the situation was similar among the Primitive Tribal Groups and the Other
Tribal Groups.
Tribe-wise, the proportion of boys going to anganwadi center was the highest among Korwa
(100 percent) followed by Chik Baraik and Kawar (80 percent) each. The proportion of boys not
going to anganwadi center was the highest among Munda and Baiga (64 percent) followed by
Pahariya and Savar (57 percent) each. Tribe-wise, details are presented in Annexure-27.
Table 23 : Anganwadi Going Status – Boys (3-6 yrs.) Going to
Anganwadi Not Going to Anganwadi Total
Classification n % n % N %
Gumla 53 55.79 42 44.21 95 100.00 Khunti 33 41.77 46 58.23 79 100.00 Latehar 38 44.19 48 55.81 86 100.00 Lohardaga 53 58.24 38 41.76 91 100.00 Ranchi 8 13.33 52 86.67 60 100.00 Simdega 55 74.32 19 25.68 74 100.00 Dumka 47 50.54 46 49.46 93 100.00 Godda 40 48.19 43 51.81 83 100.00 Jamtara 46 54.76 38 45.24 84 100.00 Pakur 46 57.50 34 42.50 80 100.00 Sahibganj 29 55.77 23 44.23 52 100.00 E.Singhbhum 38 58.46 27 41.54 65 100.00 Saraikela 53 44.92 65 55.08 118 100.00 W. Singhbhum 78 51.32 74 48.68 152 100.00 Overall 617 50.91 595 49.09 1212 100.00 Location of Tribes Intervention Locations 310 48.44 330 51.56 640 100.00 Control Locations 307 53.67 265 46.33 572 100.00 Tribal Groups Primitive Tribal Groups 139 50.36 137 49.64 276 100.00 Other Tribal Groups 478 51.07 458 48.93 936 100.00
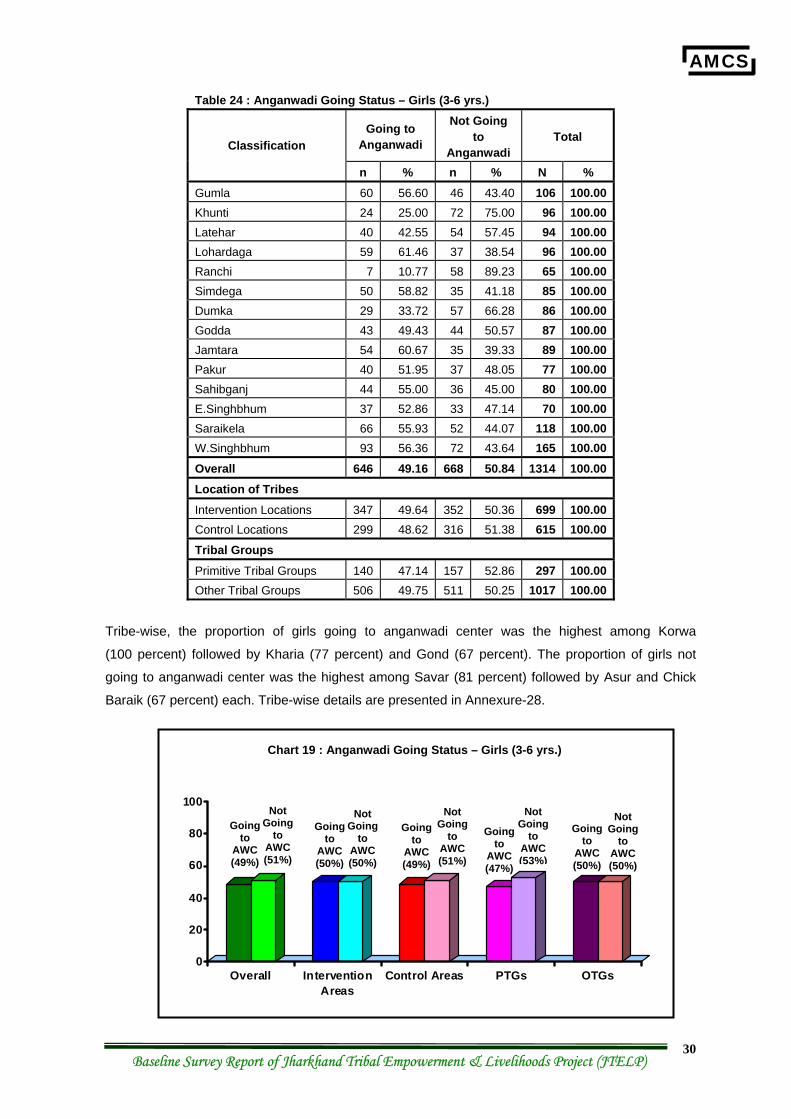
(B) Girls (3-6 yrs.) Overall, there were total 1314 girls (3-6 yrs. of age). Out of these, around 49 percent girls were
going to anganwadi center, while the remaining 51 percent were not going to anganwadi center.
District-wise, the proportion of girls going to anganwadi center was the highest in Lohardaga and
Jamtara (61 percent) followed by Simdega (59 percent). The proportion of girls not going to
anganwadi center was the highest in Ranchi (89 percent) followed by Khunti (75 percent) and
Dumka (66 percent). The situation was similar in the intervention locations and the control locations.
Also, the situation was similar among the Primitive Tribal Groups and the Other Tribal Groups.
AMCS
Baseline Survey Report of Jharkhand Tribal Empowerment & Livelihoods Project (JTELP) 30
Table 24 : Anganwadi Going Status – Girls (3-6 yrs.)
Going to Anganwadi
Not Going to
Anganwadi Total
Classification
n % n % N % Gumla 60 56.60 46 43.40 106 100.00 Khunti 24 25.00 72 75.00 96 100.00 Latehar 40 42.55 54 57.45 94 100.00 Lohardaga 59 61.46 37 38.54 96 100.00 Ranchi 7 10.77 58 89.23 65 100.00 Simdega 50 58.82 35 41.18 85 100.00 Dumka 29 33.72 57 66.28 86 100.00 Godda 43 49.43 44 50.57 87 100.00 Jamtara 54 60.67 35 39.33 89 100.00 Pakur 40 51.95 37 48.05 77 100.00 Sahibganj 44 55.00 36 45.00 80 100.00 E.Singhbhum 37 52.86 33 47.14 70 100.00 Saraikela 66 55.93 52 44.07 118 100.00 W.Singhbhum 93 56.36 72 43.64 165 100.00 Overall 646 49.16 668 50.84 1314 100.00 Location of Tribes Intervention Locations 347 49.64 352 50.36 699 100.00 Control Locations 299 48.62 316 51.38 615 100.00 Tribal Groups
Primitive Tribal Groups 140 47.14 157 52.86 297 100.00 Other Tribal Groups 506 49.75 511 50.25 1017 100.00
Tribe-wise, the proportion of girls going to anganwadi center was the highest among Korwa
(100 percent) followed by Kharia (77 percent) and Gond (67 percent). The proportion of girls not
going to anganwadi center was the highest among Savar (81 percent) followed by Asur and Chick
Baraik (67 percent) each. Tribe-wise details are presented in Annexure-28.
0
20
40
60
80
100
Overall InterventionAreas
Control Areas PTGs OTGs
Chart 19 : Anganwadi Going Status – Girls (3-6 yrs.)
Going to
AWC (49%)
Not Going
to AWC (51%)
Going to
AWC (50%)
Not Going
to AWC (50%)
Going to
AWC (49%)
Not Going
to AWC (51%)
Going to
AWC (47%)
Not Going
to AWC (53%)
Going to
AWC (50%)
Not Going
to AWC (50%)
AMCS
Baseline Survey Report of Jharkhand Tribal Empowerment & Livelihoods Project (JTELP) 31
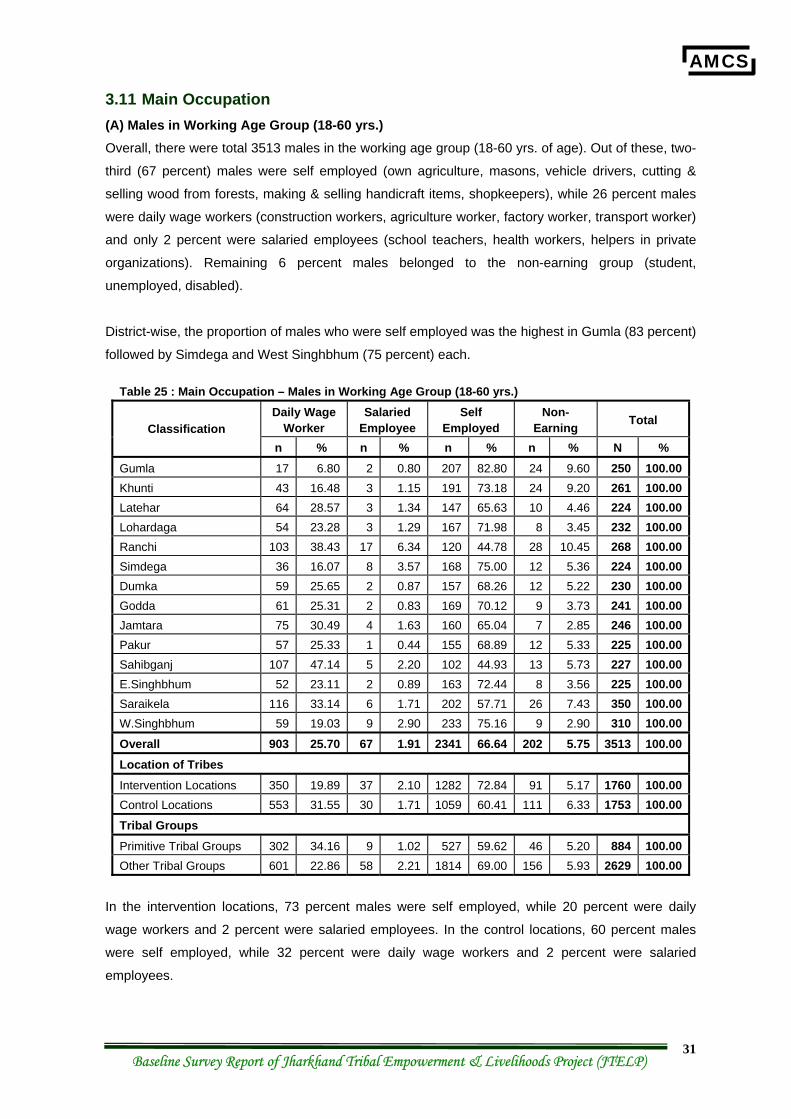
3.11 Main Occupation (A) Males in Working Age Group (18-60 yrs.) Overall, there were total 3513 males in the working age group (18-60 yrs. of age). Out of these, two-
third (67 percent) males were self employed (own agriculture, masons, vehicle drivers, cutting &
selling wood from forests, making & selling handicraft items, shopkeepers), while 26 percent males
were daily wage workers (construction workers, agriculture worker, factory worker, transport worker)
and only 2 percent were salaried employees (school teachers, health workers, helpers in private
organizations). Remaining 6 percent males belonged to the non-earning group (student,
unemployed, disabled).
District-wise, the proportion of males who were self employed was the highest in Gumla (83 percent)
followed by Simdega and West Singhbhum (75 percent) each.
Table 25 : Main Occupation – Males in Working Age Group (18-60 yrs.) Daily Wage
Worker Salaried
Employee Self
Employed Non-
Earning Total Classification
n % n % n % n % N % Gumla 17 6.80 2 0.80 207 82.80 24 9.60 250 100.00Khunti 43 16.48 3 1.15 191 73.18 24 9.20 261 100.00Latehar 64 28.57 3 1.34 147 65.63 10 4.46 224 100.00Lohardaga 54 23.28 3 1.29 167 71.98 8 3.45 232 100.00Ranchi 103 38.43 17 6.34 120 44.78 28 10.45 268 100.00Simdega 36 16.07 8 3.57 168 75.00 12 5.36 224 100.00Dumka 59 25.65 2 0.87 157 68.26 12 5.22 230 100.00Godda 61 25.31 2 0.83 169 70.12 9 3.73 241 100.00Jamtara 75 30.49 4 1.63 160 65.04 7 2.85 246 100.00Pakur 57 25.33 1 0.44 155 68.89 12 5.33 225 100.00Sahibganj 107 47.14 5 2.20 102 44.93 13 5.73 227 100.00E.Singhbhum 52 23.11 2 0.89 163 72.44 8 3.56 225 100.00Saraikela 116 33.14 6 1.71 202 57.71 26 7.43 350 100.00W.Singhbhum 59 19.03 9 2.90 233 75.16 9 2.90 310 100.00Overall 903 25.70 67 1.91 2341 66.64 202 5.75 3513 100.00Location of Tribes Intervention Locations 350 19.89 37 2.10 1282 72.84 91 5.17 1760 100.00Control Locations 553 31.55 30 1.71 1059 60.41 111 6.33 1753 100.00Tribal Groups
Primitive Tribal Groups 302 34.16 9 1.02 527 59.62 46 5.20 884 100.00Other Tribal Groups 601 22.86 58 2.21 1814 69.00 156 5.93 2629 100.00
In the intervention locations, 73 percent males were self employed, while 20 percent were daily
wage workers and 2 percent were salaried employees. In the control locations, 60 percent males
were self employed, while 32 percent were daily wage workers and 2 percent were salaried
employees.
AMCS
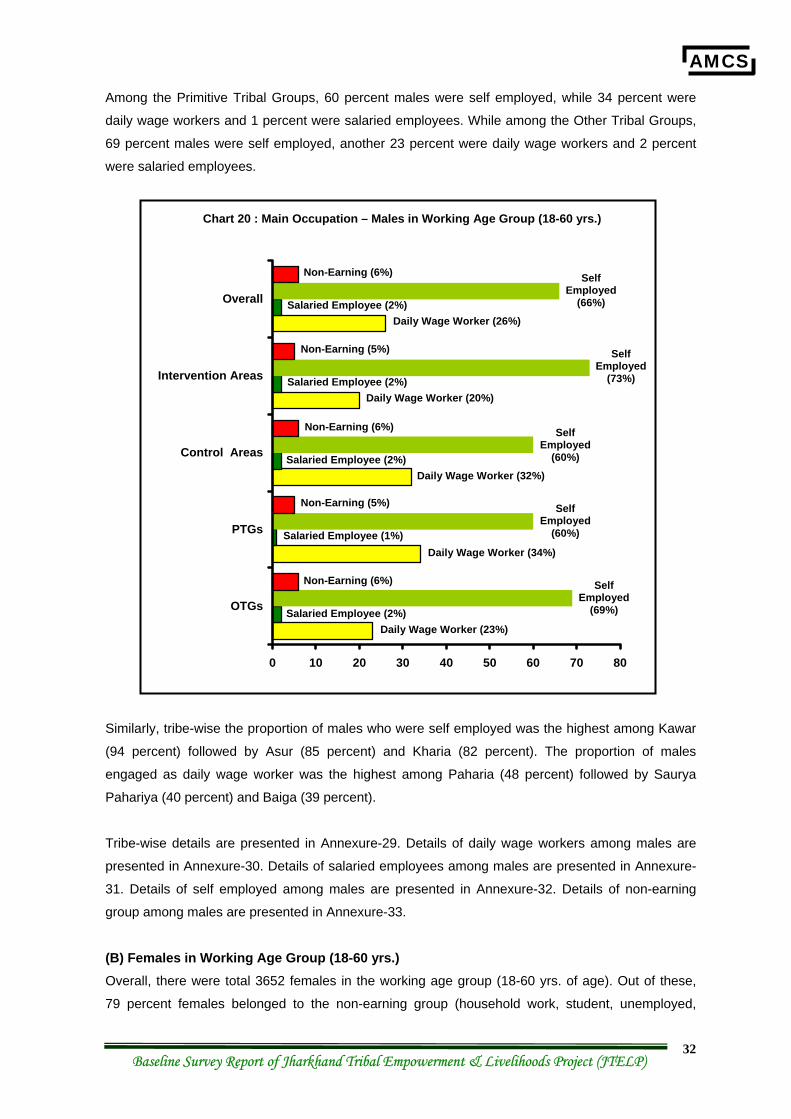
Baseline Survey Report of Jharkhand Tribal Empowerment & Livelihoods Project (JTELP) 32
Among the Primitive Tribal Groups, 60 percent males were self employed, while 34 percent were
daily wage workers and 1 percent were salaried employees. While among the Other Tribal Groups,
69 percent males were self employed, another 23 percent were daily wage workers and 2 percent
were salaried employees.
Similarly, tribe-wise the proportion of males who were self employed was the highest among Kawar
(94 percent) followed by Asur (85 percent) and Kharia (82 percent). The proportion of males
engaged as daily wage worker was the highest among Paharia (48 percent) followed by Saurya
Pahariya (40 percent) and Baiga (39 percent).
Tribe-wise details are presented in Annexure-29. Details of daily wage workers among males are
presented in Annexure-30. Details of salaried employees among males are presented in Annexure-
31. Details of self employed among males are presented in Annexure-32. Details of non-earning
group among males are presented in Annexure-33.
(B) Females in Working Age Group (18-60 yrs.) Overall, there were total 3652 females in the working age group (18-60 yrs. of age). Out of these,
79 percent females belonged to the non-earning group (household work, student, unemployed,
0 10 20 30 40 50 60 70 80
OTGs
PTGs
Control Areas
Intervention Areas
Overall
Chart 20 : Main Occupation – Males in Working Age Group (18-60 yrs.)
Non-Earning (6%)
Salaried Employee (2%) Daily Wage Worker (26%)
Self Employed
(66%)
Non-Earning (5%)
Salaried Employee (2%) Daily Wage Worker (20%)
Self Employed
(73%)
Non-Earning (6%)
Salaried Employee (2%) Daily Wage Worker (32%)
Self Employed
(60%)
Non-Earning (5%)
Salaried Employee (1%) Daily Wage Worker (34%)
Self Employed
(60%)
Non-Earning (6%)
Salaried Employee (2%) Daily Wage Worker (23%)
Self Employed
(69%)
AMCS
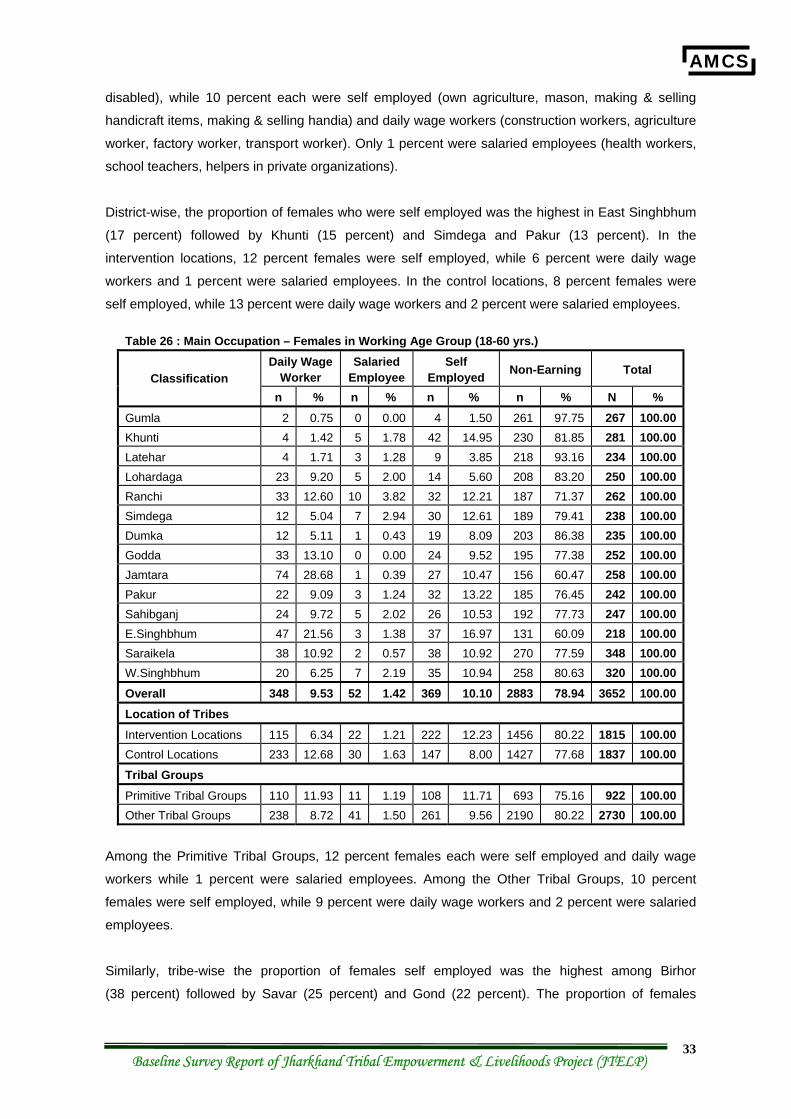
Baseline Survey Report of Jharkhand Tribal Empowerment & Livelihoods Project (JTELP) 33
disabled), while 10 percent each were self employed (own agriculture, mason, making & selling
handicraft items, making & selling handia) and daily wage workers (construction workers, agriculture
worker, factory worker, transport worker). Only 1 percent were salaried employees (health workers,
school teachers, helpers in private organizations).
District-wise, the proportion of females who were self employed was the highest in East Singhbhum
(17 percent) followed by Khunti (15 percent) and Simdega and Pakur (13 percent). In the
intervention locations, 12 percent females were self employed, while 6 percent were daily wage
workers and 1 percent were salaried employees. In the control locations, 8 percent females were
self employed, while 13 percent were daily wage workers and 2 percent were salaried employees.
Table 26 : Main Occupation – Females in Working Age Group (18-60 yrs.) Daily Wage
Worker Salaried
Employee Self
Employed Non-Earning Total Classification
n % n % n % n % N % Gumla 2 0.75 0 0.00 4 1.50 261 97.75 267 100.00Khunti 4 1.42 5 1.78 42 14.95 230 81.85 281 100.00Latehar 4 1.71 3 1.28 9 3.85 218 93.16 234 100.00Lohardaga 23 9.20 5 2.00 14 5.60 208 83.20 250 100.00Ranchi 33 12.60 10 3.82 32 12.21 187 71.37 262 100.00Simdega 12 5.04 7 2.94 30 12.61 189 79.41 238 100.00Dumka 12 5.11 1 0.43 19 8.09 203 86.38 235 100.00Godda 33 13.10 0 0.00 24 9.52 195 77.38 252 100.00Jamtara 74 28.68 1 0.39 27 10.47 156 60.47 258 100.00Pakur 22 9.09 3 1.24 32 13.22 185 76.45 242 100.00Sahibganj 24 9.72 5 2.02 26 10.53 192 77.73 247 100.00E.Singhbhum 47 21.56 3 1.38 37 16.97 131 60.09 218 100.00Saraikela 38 10.92 2 0.57 38 10.92 270 77.59 348 100.00W.Singhbhum 20 6.25 7 2.19 35 10.94 258 80.63 320 100.00Overall 348 9.53 52 1.42 369 10.10 2883 78.94 3652 100.00Location of Tribes Intervention Locations 115 6.34 22 1.21 222 12.23 1456 80.22 1815 100.00Control Locations 233 12.68 30 1.63 147 8.00 1427 77.68 1837 100.00Tribal Groups Primitive Tribal Groups 110 11.93 11 1.19 108 11.71 693 75.16 922 100.00Other Tribal Groups 238 8.72 41 1.50 261 9.56 2190 80.22 2730 100.00
Among the Primitive Tribal Groups, 12 percent females each were self employed and daily wage
workers while 1 percent were salaried employees. Among the Other Tribal Groups, 10 percent
females were self employed, while 9 percent were daily wage workers and 2 percent were salaried
employees.
Similarly, tribe-wise the proportion of females self employed was the highest among Birhor
(38 percent) followed by Savar (25 percent) and Gond (22 percent). The proportion of females
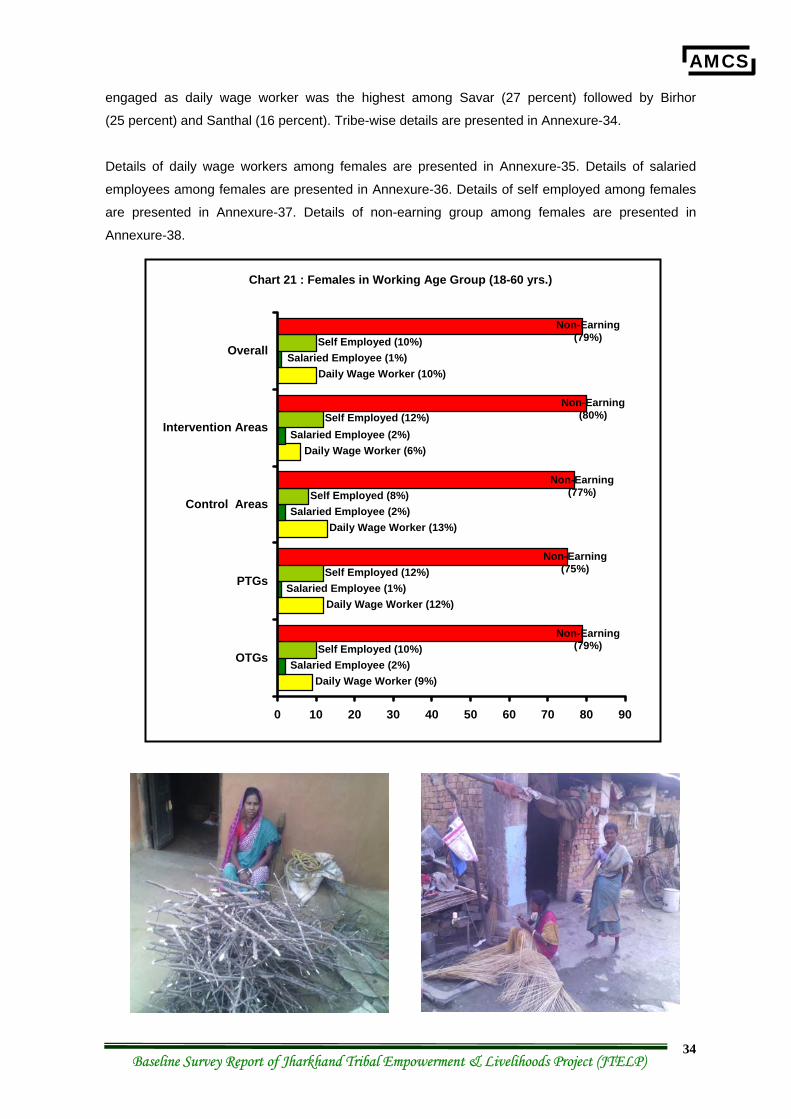
AMCS
Baseline Survey Report of Jharkhand Tribal Empowerment & Livelihoods Project (JTELP) 34
engaged as daily wage worker was the highest among Savar (27 percent) followed by Birhor
(25 percent) and Santhal (16 percent). Tribe-wise details are presented in Annexure-34.
Details of daily wage workers among females are presented in Annexure-35. Details of salaried
employees among females are presented in Annexure-36. Details of self employed among females
are presented in Annexure-37. Details of non-earning group among females are presented in
Annexure-38.
0 10 20 30 40 50 60 70 80 90
OTGs
PTGs
Control Areas
Intervention Areas
Overall
Chart 21 : Females in Working Age Group (18-60 yrs.)
Self Employed (10%) Salaried Employee (1%)
Daily Wage Worker (10%)
Non-Earning (79%)
Self Employed (12%) Salaried Employee (2%)
Daily Wage Worker (6%)
Non-Earning (80%)
Self Employed (8%) Salaried Employee (2%)
Daily Wage Worker (13%)
Non-Earning (77%)
Self Employed (12%) Salaried Employee (1%)
Daily Wage Worker (12%)
Non-Earning (75%)
Self Employed (10%) Salaried Employee (2%)
Daily Wage Worker (9%)
Non-Earning (79%)
AMCS
Baseline Survey Report of Jharkhand Tribal Empowerment & Livelihoods Project (JTELP) 35
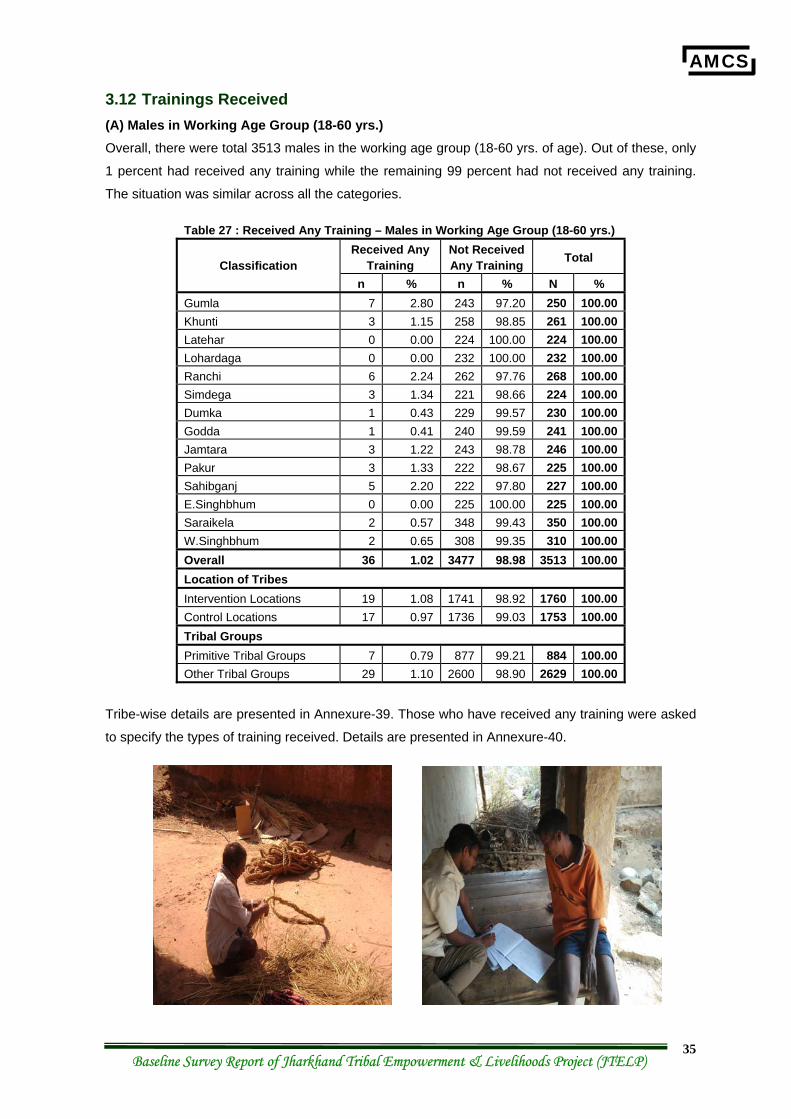
3.12 Trainings Received (A) Males in Working Age Group (18-60 yrs.) Overall, there were total 3513 males in the working age group (18-60 yrs. of age). Out of these, only
1 percent had received any training while the remaining 99 percent had not received any training.
The situation was similar across all the categories.
Table 27 : Received Any Training – Males in Working Age Group (18-60 yrs.) Received Any
Training Not Received Any Training Total Classification
n % n % N % Gumla 7 2.80 243 97.20 250 100.00 Khunti 3 1.15 258 98.85 261 100.00 Latehar 0 0.00 224 100.00 224 100.00 Lohardaga 0 0.00 232 100.00 232 100.00 Ranchi 6 2.24 262 97.76 268 100.00 Simdega 3 1.34 221 98.66 224 100.00 Dumka 1 0.43 229 99.57 230 100.00 Godda 1 0.41 240 99.59 241 100.00 Jamtara 3 1.22 243 98.78 246 100.00 Pakur 3 1.33 222 98.67 225 100.00 Sahibganj 5 2.20 222 97.80 227 100.00 E.Singhbhum 0 0.00 225 100.00 225 100.00 Saraikela 2 0.57 348 99.43 350 100.00 W.Singhbhum 2 0.65 308 99.35 310 100.00 Overall 36 1.02 3477 98.98 3513 100.00 Location of Tribes Intervention Locations 19 1.08 1741 98.92 1760 100.00 Control Locations 17 0.97 1736 99.03 1753 100.00 Tribal Groups Primitive Tribal Groups 7 0.79 877 99.21 884 100.00 Other Tribal Groups 29 1.10 2600 98.90 2629 100.00
Tribe-wise details are presented in Annexure-39. Those who have received any training were asked
to specify the types of training received. Details are presented in Annexure-40.
AMCS
Baseline Survey Report of Jharkhand Tribal Empowerment & Livelihoods Project (JTELP) 36
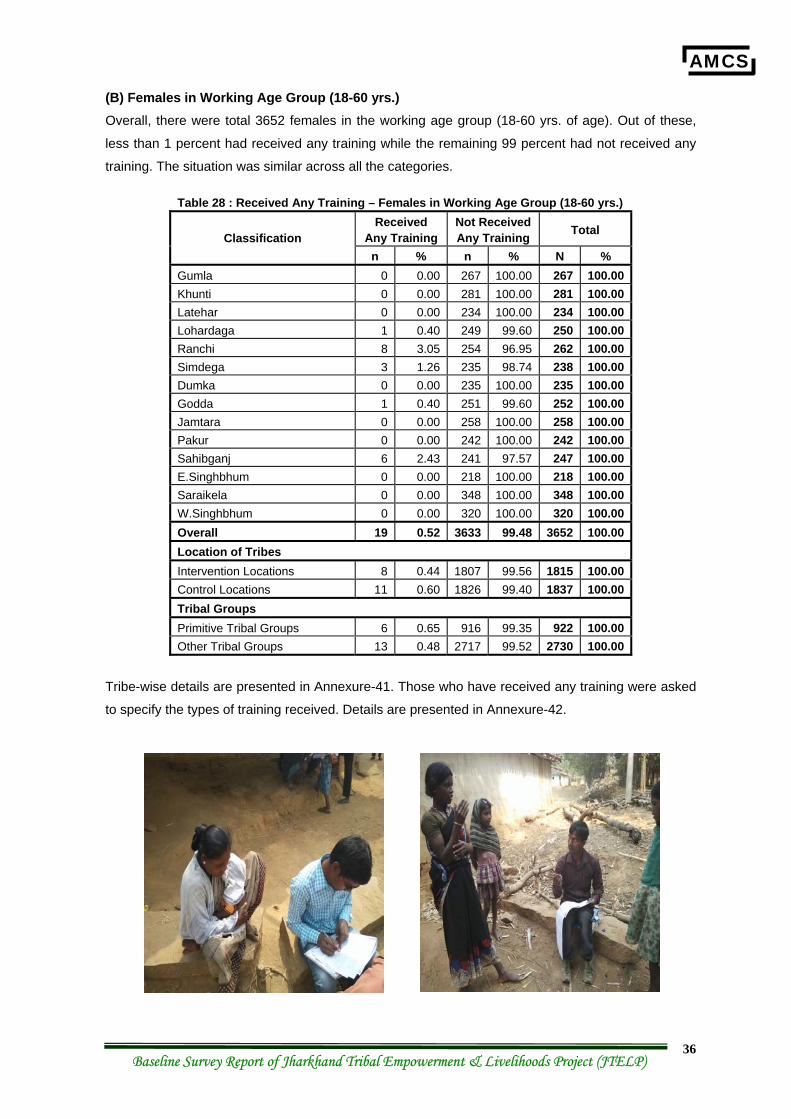
(B) Females in Working Age Group (18-60 yrs.) Overall, there were total 3652 females in the working age group (18-60 yrs. of age). Out of these,
less than 1 percent had received any training while the remaining 99 percent had not received any
training. The situation was similar across all the categories.
Table 28 : Received Any Training – Females in Working Age Group (18-60 yrs.) Received
Any Training Not Received Any Training Total Classification
n % n % N % Gumla 0 0.00 267 100.00 267 100.00 Khunti 0 0.00 281 100.00 281 100.00 Latehar 0 0.00 234 100.00 234 100.00 Lohardaga 1 0.40 249 99.60 250 100.00 Ranchi 8 3.05 254 96.95 262 100.00 Simdega 3 1.26 235 98.74 238 100.00 Dumka 0 0.00 235 100.00 235 100.00 Godda 1 0.40 251 99.60 252 100.00 Jamtara 0 0.00 258 100.00 258 100.00 Pakur 0 0.00 242 100.00 242 100.00 Sahibganj 6 2.43 241 97.57 247 100.00 E.Singhbhum 0 0.00 218 100.00 218 100.00 Saraikela 0 0.00 348 100.00 348 100.00 W.Singhbhum 0 0.00 320 100.00 320 100.00 Overall 19 0.52 3633 99.48 3652 100.00 Location of Tribes Intervention Locations 8 0.44 1807 99.56 1815 100.00 Control Locations 11 0.60 1826 99.40 1837 100.00 Tribal Groups Primitive Tribal Groups 6 0.65 916 99.35 922 100.00 Other Tribal Groups 13 0.48 2717 99.52 2730 100.00
Tribe-wise details are presented in Annexure-41. Those who have received any training were asked
to specify the types of training received. Details are presented in Annexure-42.
AMCS
Baseline Survey Report of Jharkhand Tribal Empowerment & Livelihoods Project (JTELP) 37
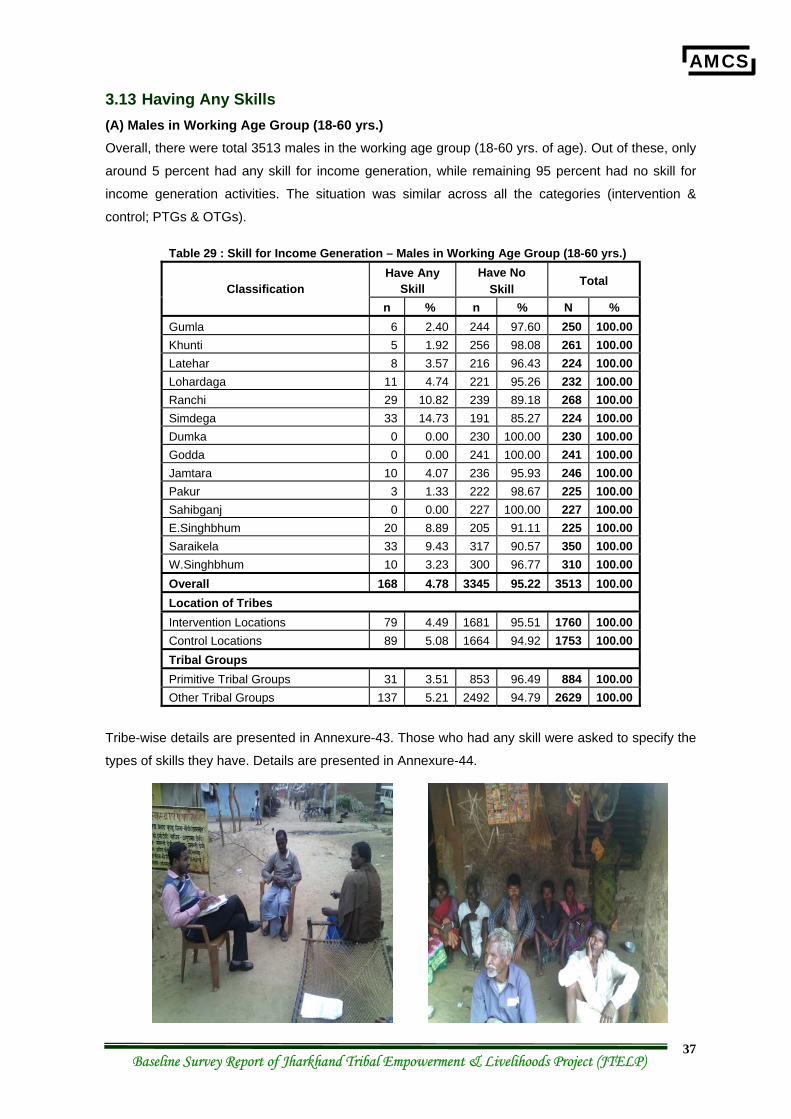
3.13 Having Any Skills (A) Males in Working Age Group (18-60 yrs.) Overall, there were total 3513 males in the working age group (18-60 yrs. of age). Out of these, only
around 5 percent had any skill for income generation, while remaining 95 percent had no skill for
income generation activities. The situation was similar across all the categories (intervention &
control; PTGs & OTGs).
Table 29 : Skill for Income Generation – Males in Working Age Group (18-60 yrs.) Have Any
Skill Have No
Skill Total Classification n % n % N %
Gumla 6 2.40 244 97.60 250 100.00 Khunti 5 1.92 256 98.08 261 100.00 Latehar 8 3.57 216 96.43 224 100.00 Lohardaga 11 4.74 221 95.26 232 100.00 Ranchi 29 10.82 239 89.18 268 100.00 Simdega 33 14.73 191 85.27 224 100.00 Dumka 0 0.00 230 100.00 230 100.00 Godda 0 0.00 241 100.00 241 100.00 Jamtara 10 4.07 236 95.93 246 100.00 Pakur 3 1.33 222 98.67 225 100.00 Sahibganj 0 0.00 227 100.00 227 100.00 E.Singhbhum 20 8.89 205 91.11 225 100.00 Saraikela 33 9.43 317 90.57 350 100.00 W.Singhbhum 10 3.23 300 96.77 310 100.00 Overall 168 4.78 3345 95.22 3513 100.00 Location of Tribes Intervention Locations 79 4.49 1681 95.51 1760 100.00 Control Locations 89 5.08 1664 94.92 1753 100.00 Tribal Groups Primitive Tribal Groups 31 3.51 853 96.49 884 100.00 Other Tribal Groups 137 5.21 2492 94.79 2629 100.00
Tribe-wise details are presented in Annexure-43. Those who had any skill were asked to specify the
types of skills they have. Details are presented in Annexure-44.
AMCS
Baseline Survey Report of Jharkhand Tribal Empowerment & Livelihoods Project (JTELP) 38
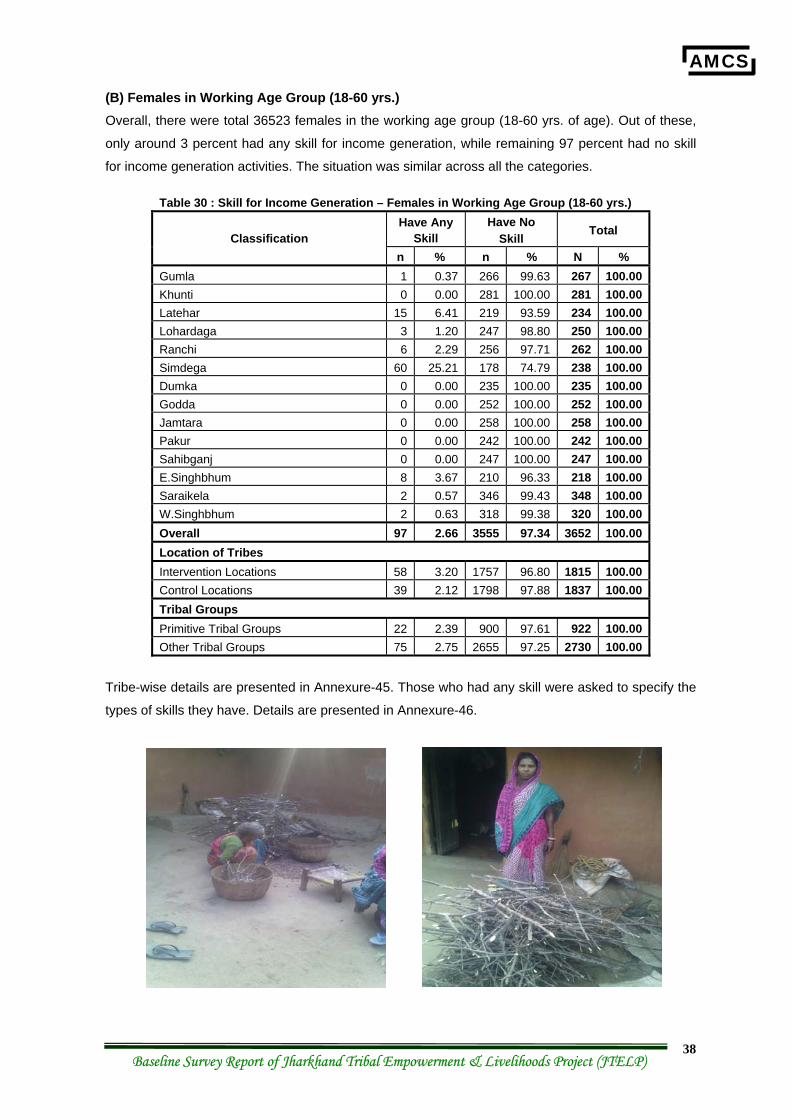
(B) Females in Working Age Group (18-60 yrs.) Overall, there were total 36523 females in the working age group (18-60 yrs. of age). Out of these,
only around 3 percent had any skill for income generation, while remaining 97 percent had no skill
for income generation activities. The situation was similar across all the categories.
Table 30 : Skill for Income Generation – Females in Working Age Group (18-60 yrs.) Have Any
Skill Have No
Skill Total Classification
n % n % N % Gumla 1 0.37 266 99.63 267 100.00 Khunti 0 0.00 281 100.00 281 100.00 Latehar 15 6.41 219 93.59 234 100.00 Lohardaga 3 1.20 247 98.80 250 100.00 Ranchi 6 2.29 256 97.71 262 100.00 Simdega 60 25.21 178 74.79 238 100.00 Dumka 0 0.00 235 100.00 235 100.00 Godda 0 0.00 252 100.00 252 100.00 Jamtara 0 0.00 258 100.00 258 100.00 Pakur 0 0.00 242 100.00 242 100.00 Sahibganj 0 0.00 247 100.00 247 100.00 E.Singhbhum 8 3.67 210 96.33 218 100.00 Saraikela 2 0.57 346 99.43 348 100.00 W.Singhbhum 2 0.63 318 99.38 320 100.00 Overall 97 2.66 3555 97.34 3652 100.00 Location of Tribes Intervention Locations 58 3.20 1757 96.80 1815 100.00 Control Locations 39 2.12 1798 97.88 1837 100.00 Tribal Groups Primitive Tribal Groups 22 2.39 900 97.61 922 100.00 Other Tribal Groups 75 2.75 2655 97.25 2730 100.00
Tribe-wise details are presented in Annexure-45. Those who had any skill were asked to specify the
types of skills they have. Details are presented in Annexure-46.
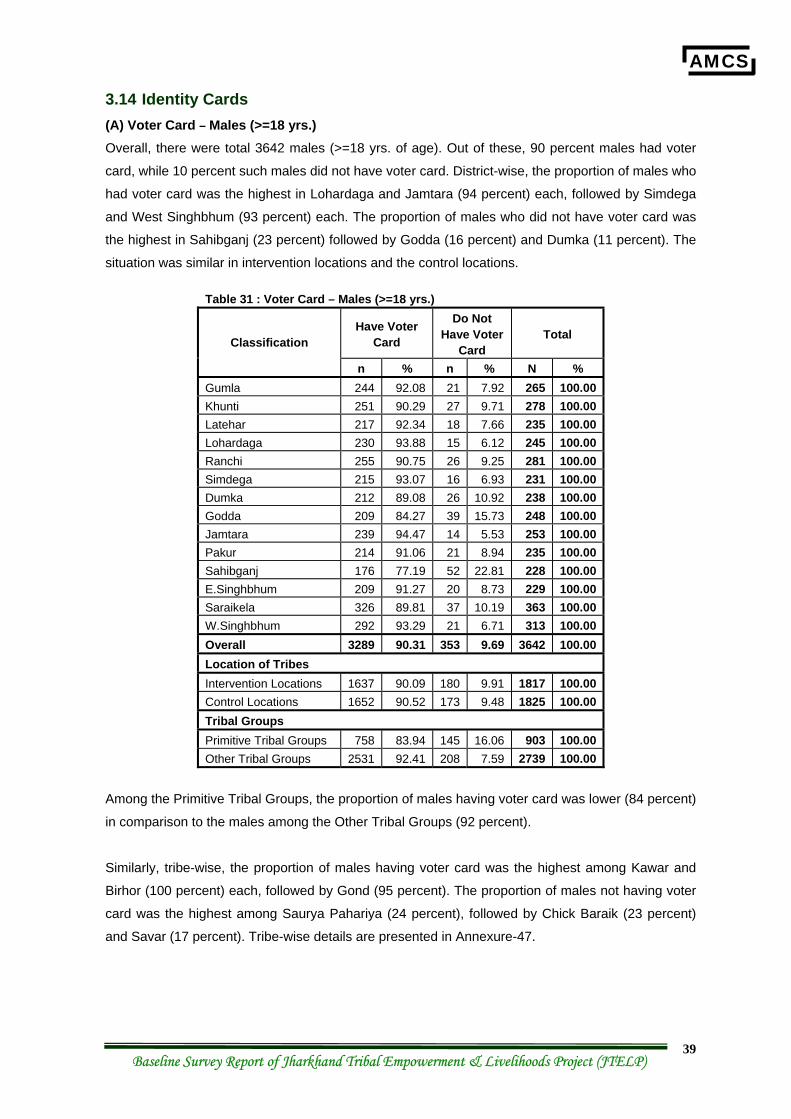
AMCS
Baseline Survey Report of Jharkhand Tribal Empowerment & Livelihoods Project (JTELP) 39
3.14 Identity Cards (A) Voter Card – Males (>=18 yrs.) Overall, there were total 3642 males (>=18 yrs. of age). Out of these, 90 percent males had voter
card, while 10 percent such males did not have voter card. District-wise, the proportion of males who
had voter card was the highest in Lohardaga and Jamtara (94 percent) each, followed by Simdega
and West Singhbhum (93 percent) each. The proportion of males who did not have voter card was
the highest in Sahibganj (23 percent) followed by Godda (16 percent) and Dumka (11 percent). The
situation was similar in intervention locations and the control locations.
Table 31 : Voter Card – Males (>=18 yrs.)
Have Voter Card
Do Not Have Voter
Card Total Classification
n % n % N % Gumla 244 92.08 21 7.92 265 100.00 Khunti 251 90.29 27 9.71 278 100.00 Latehar 217 92.34 18 7.66 235 100.00 Lohardaga 230 93.88 15 6.12 245 100.00 Ranchi 255 90.75 26 9.25 281 100.00 Simdega 215 93.07 16 6.93 231 100.00 Dumka 212 89.08 26 10.92 238 100.00 Godda 209 84.27 39 15.73 248 100.00 Jamtara 239 94.47 14 5.53 253 100.00 Pakur 214 91.06 21 8.94 235 100.00 Sahibganj 176 77.19 52 22.81 228 100.00 E.Singhbhum 209 91.27 20 8.73 229 100.00 Saraikela 326 89.81 37 10.19 363 100.00 W.Singhbhum 292 93.29 21 6.71 313 100.00 Overall 3289 90.31 353 9.69 3642 100.00 Location of Tribes Intervention Locations 1637 90.09 180 9.91 1817 100.00 Control Locations 1652 90.52 173 9.48 1825 100.00 Tribal Groups Primitive Tribal Groups 758 83.94 145 16.06 903 100.00 Other Tribal Groups 2531 92.41 208 7.59 2739 100.00
Among the Primitive Tribal Groups, the proportion of males having voter card was lower (84 percent)
in comparison to the males among the Other Tribal Groups (92 percent).
Similarly, tribe-wise, the proportion of males having voter card was the highest among Kawar and
Birhor (100 percent) each, followed by Gond (95 percent). The proportion of males not having voter
card was the highest among Saurya Pahariya (24 percent), followed by Chick Baraik (23 percent)
and Savar (17 percent). Tribe-wise details are presented in Annexure-47.
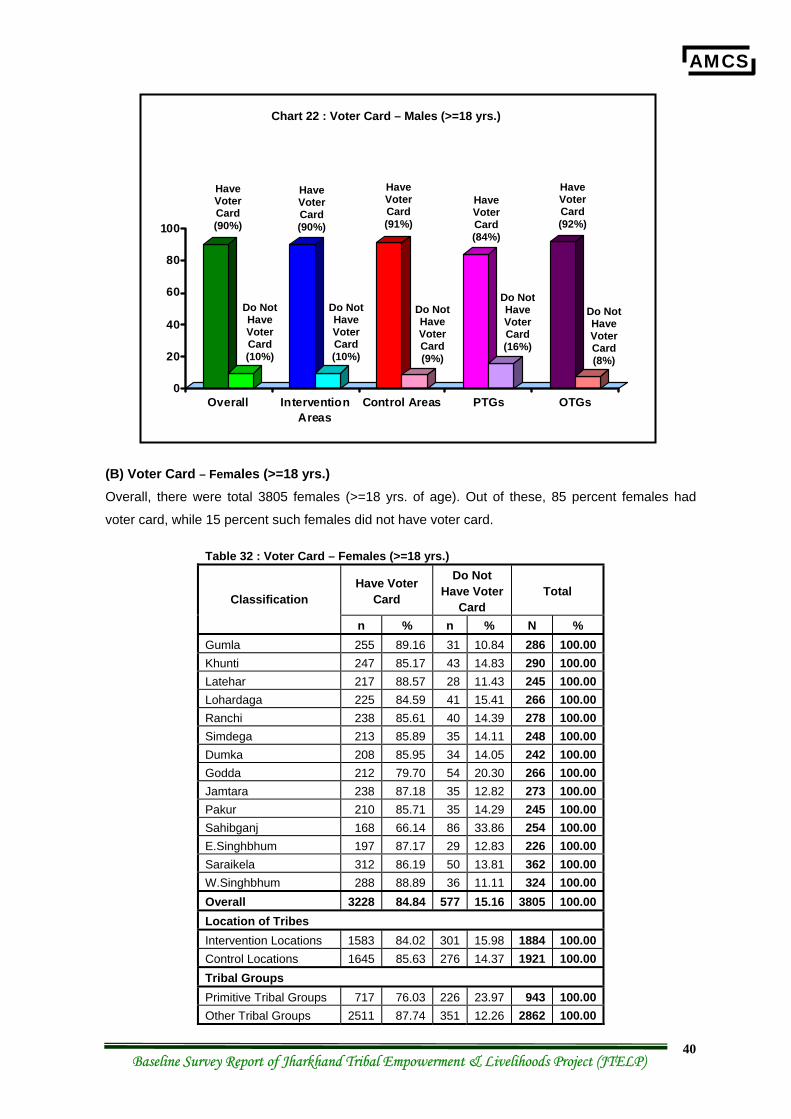
AMCS
Baseline Survey Report of Jharkhand Tribal Empowerment & Livelihoods Project (JTELP) 40
(B) Voter Card – Females (>=18 yrs.) Overall, there were total 3805 females (>=18 yrs. of age). Out of these, 85 percent females had
voter card, while 15 percent such females did not have voter card.
Table 32 : Voter Card – Females (>=18 yrs.)
Have Voter Card
Do Not Have Voter
Card Total Classification
n % n % N % Gumla 255 89.16 31 10.84 286 100.00 Khunti 247 85.17 43 14.83 290 100.00 Latehar 217 88.57 28 11.43 245 100.00 Lohardaga 225 84.59 41 15.41 266 100.00 Ranchi 238 85.61 40 14.39 278 100.00 Simdega 213 85.89 35 14.11 248 100.00 Dumka 208 85.95 34 14.05 242 100.00 Godda 212 79.70 54 20.30 266 100.00 Jamtara 238 87.18 35 12.82 273 100.00 Pakur 210 85.71 35 14.29 245 100.00 Sahibganj 168 66.14 86 33.86 254 100.00 E.Singhbhum 197 87.17 29 12.83 226 100.00 Saraikela 312 86.19 50 13.81 362 100.00 W.Singhbhum 288 88.89 36 11.11 324 100.00 Overall 3228 84.84 577 15.16 3805 100.00 Location of Tribes Intervention Locations 1583 84.02 301 15.98 1884 100.00 Control Locations 1645 85.63 276 14.37 1921 100.00 Tribal Groups Primitive Tribal Groups 717 76.03 226 23.97 943 100.00 Other Tribal Groups 2511 87.74 351 12.26 2862 100.00
0
20
40
60
80
100
Overall InterventionAreas
Control Areas PTGs OTGs
Chart 22 : Voter Card – Males (>=18 yrs.)
Have Voter Card (90%)
Have Voter Card (90%)
Have Voter Card (91%)
Have Voter Card (84%)
Have Voter Card (92%)
Do Not Have Voter Card (10%)
Do Not Have Voter Card (10%)
Do Not Have Voter Card (9%)
Do Not Have Voter Card (16%)
Do Not Have Voter Card (8%)
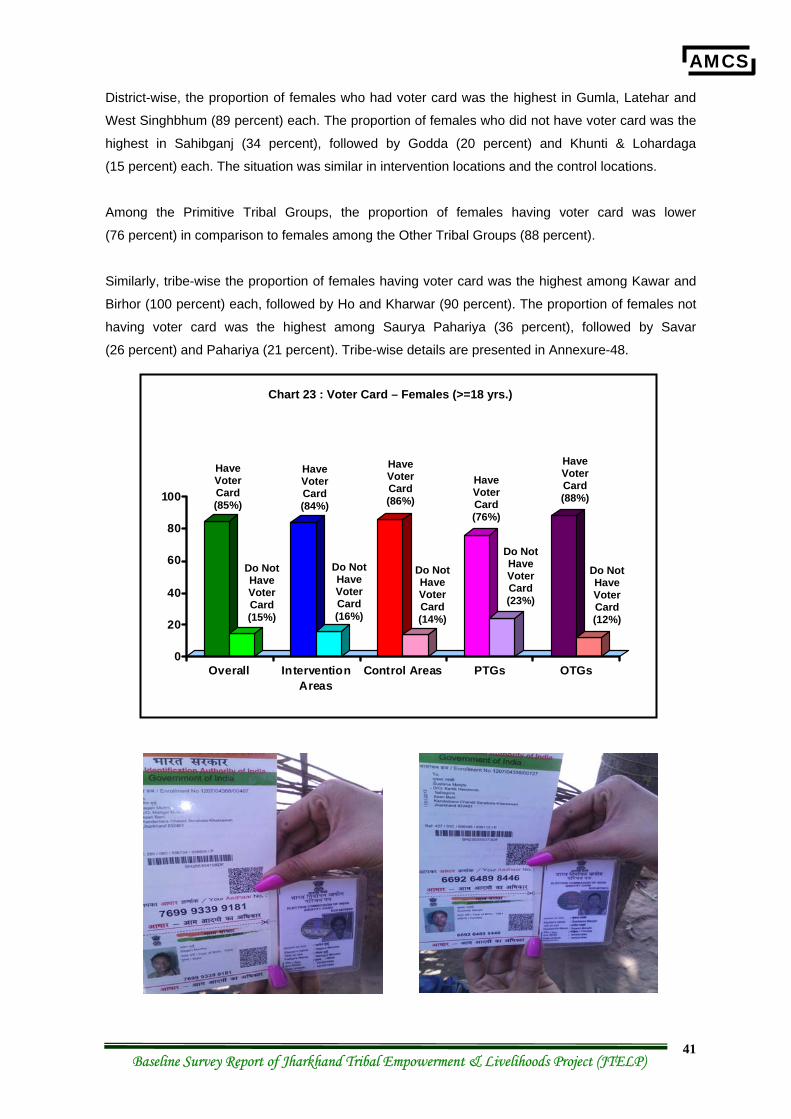
AMCS
Baseline Survey Report of Jharkhand Tribal Empowerment & Livelihoods Project (JTELP) 41
District-wise, the proportion of females who had voter card was the highest in Gumla, Latehar and
West Singhbhum (89 percent) each. The proportion of females who did not have voter card was the
highest in Sahibganj (34 percent), followed by Godda (20 percent) and Khunti & Lohardaga
(15 percent) each. The situation was similar in intervention locations and the control locations.
Among the Primitive Tribal Groups, the proportion of females having voter card was lower
(76 percent) in comparison to females among the Other Tribal Groups (88 percent).
Similarly, tribe-wise the proportion of females having voter card was the highest among Kawar and
Birhor (100 percent) each, followed by Ho and Kharwar (90 percent). The proportion of females not
having voter card was the highest among Saurya Pahariya (36 percent), followed by Savar
(26 percent) and Pahariya (21 percent). Tribe-wise details are presented in Annexure-48.
0
20
40
60
80
100
Overall InterventionAreas
Control Areas PTGs OTGs
Have Voter Card (85%)
Have Voter Card (84%)
Have Voter Card (86%)
Have Voter Card (76%)
Do Not Have Voter Card (15%)
Do Not Have Voter Card (16%)
Do Not Have Voter Card (14%)
Do Not Have Voter Card (23%)
Do Not Have Voter Card (12%)
Chart 23 : Voter Card – Females (>=18 yrs.)
Have Voter Card (88%)
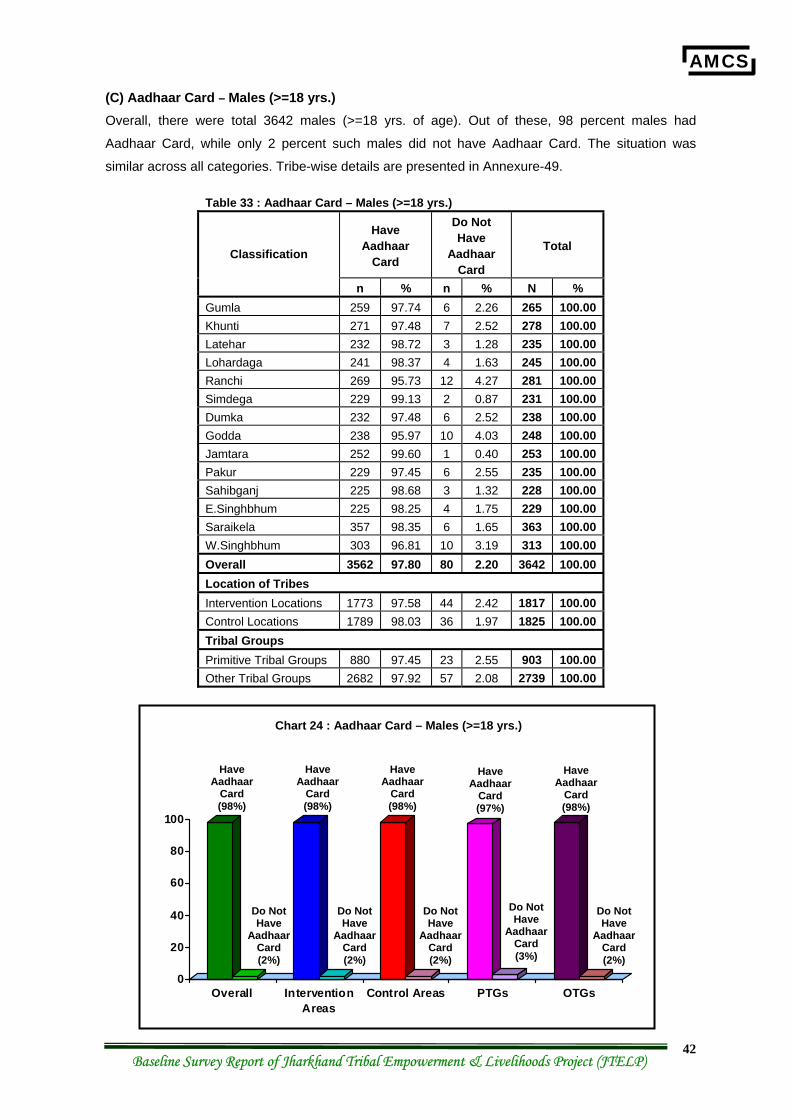
AMCS
Baseline Survey Report of Jharkhand Tribal Empowerment & Livelihoods Project (JTELP) 42
(C) Aadhaar Card – Males (>=18 yrs.) Overall, there were total 3642 males (>=18 yrs. of age). Out of these, 98 percent males had
Aadhaar Card, while only 2 percent such males did not have Aadhaar Card. The situation was
similar across all categories. Tribe-wise details are presented in Annexure-49.
Table 33 : Aadhaar Card – Males (>=18 yrs.)
Have Aadhaar
Card
Do Not Have
Aadhaar Card
Total Classification
n % n % N % Gumla 259 97.74 6 2.26 265 100.00 Khunti 271 97.48 7 2.52 278 100.00 Latehar 232 98.72 3 1.28 235 100.00 Lohardaga 241 98.37 4 1.63 245 100.00 Ranchi 269 95.73 12 4.27 281 100.00 Simdega 229 99.13 2 0.87 231 100.00 Dumka 232 97.48 6 2.52 238 100.00 Godda 238 95.97 10 4.03 248 100.00 Jamtara 252 99.60 1 0.40 253 100.00 Pakur 229 97.45 6 2.55 235 100.00 Sahibganj 225 98.68 3 1.32 228 100.00 E.Singhbhum 225 98.25 4 1.75 229 100.00 Saraikela 357 98.35 6 1.65 363 100.00 W.Singhbhum 303 96.81 10 3.19 313 100.00 Overall 3562 97.80 80 2.20 3642 100.00 Location of Tribes Intervention Locations 1773 97.58 44 2.42 1817 100.00 Control Locations 1789 98.03 36 1.97 1825 100.00 Tribal Groups Primitive Tribal Groups 880 97.45 23 2.55 903 100.00 Other Tribal Groups 2682 97.92 57 2.08 2739 100.00
0
20
40
60
80
100
Overall InterventionAreas
Control Areas PTGs OTGs
Chart 24 : Aadhaar Card – Males (>=18 yrs.)
Have Aadhaar
Card (98%)
Have Aadhaar
Card (98%)
Have Aadhaar
Card (98%)
Have Aadhaar
Card (97%)
Have Aadhaar
Card (98%)
Do Not Have
Aadhaar Card (2%)
Do Not Have
Aadhaar Card (2%)
Do Not Have
Aadhaar Card (2%)
Do Not Have
Aadhaar Card (3%)
Do Not Have
Aadhaar Card (2%)
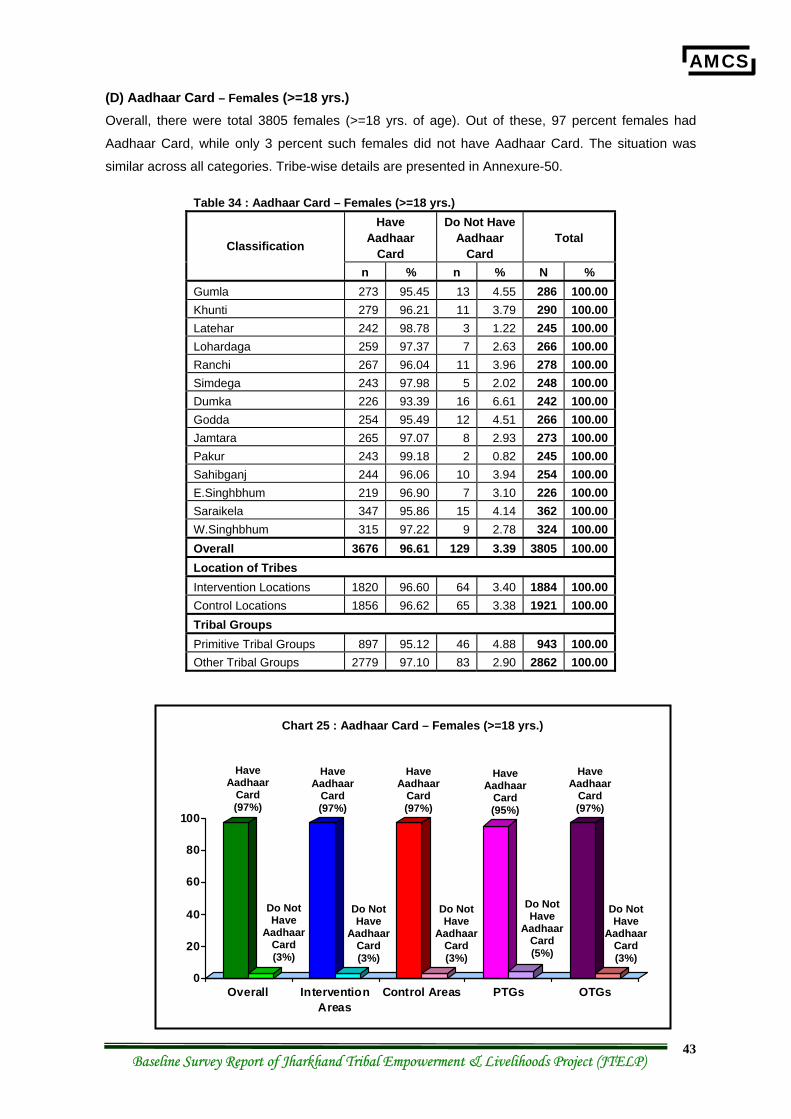
AMCS
Baseline Survey Report of Jharkhand Tribal Empowerment & Livelihoods Project (JTELP) 43
(D) Aadhaar Card – Females (>=18 yrs.) Overall, there were total 3805 females (>=18 yrs. of age). Out of these, 97 percent females had
Aadhaar Card, while only 3 percent such females did not have Aadhaar Card. The situation was
similar across all categories. Tribe-wise details are presented in Annexure-50.
Table 34 : Aadhaar Card – Females (>=18 yrs.) Have
Aadhaar Card
Do Not Have Aadhaar
Card Total Classification
n % n % N % Gumla 273 95.45 13 4.55 286 100.00 Khunti 279 96.21 11 3.79 290 100.00 Latehar 242 98.78 3 1.22 245 100.00 Lohardaga 259 97.37 7 2.63 266 100.00 Ranchi 267 96.04 11 3.96 278 100.00 Simdega 243 97.98 5 2.02 248 100.00 Dumka 226 93.39 16 6.61 242 100.00 Godda 254 95.49 12 4.51 266 100.00 Jamtara 265 97.07 8 2.93 273 100.00 Pakur 243 99.18 2 0.82 245 100.00 Sahibganj 244 96.06 10 3.94 254 100.00 E.Singhbhum 219 96.90 7 3.10 226 100.00 Saraikela 347 95.86 15 4.14 362 100.00 W.Singhbhum 315 97.22 9 2.78 324 100.00 Overall 3676 96.61 129 3.39 3805 100.00 Location of Tribes Intervention Locations 1820 96.60 64 3.40 1884 100.00 Control Locations 1856 96.62 65 3.38 1921 100.00 Tribal Groups Primitive Tribal Groups 897 95.12 46 4.88 943 100.00 Other Tribal Groups 2779 97.10 83 2.90 2862 100.00
0
20
40
60
80
100
Overall InterventionAreas
Control Areas PTGs OTGs
Chart 25 : Aadhaar Card – Females (>=18 yrs.)
Have Aadhaar
Card (97%)
Have Aadhaar
Card (97%)
Have Aadhaar
Card (97%)
Have Aadhaar
Card (95%)
Have Aadhaar
Card (97%)
Do Not Have
Aadhaar Card (3%)
Do Not Have
Aadhaar Card (3%)
Do Not Have
Aadhaar Card (3%)
Do Not Have
Aadhaar Card (5%)
Do Not Have
Aadhaar Card (3%)
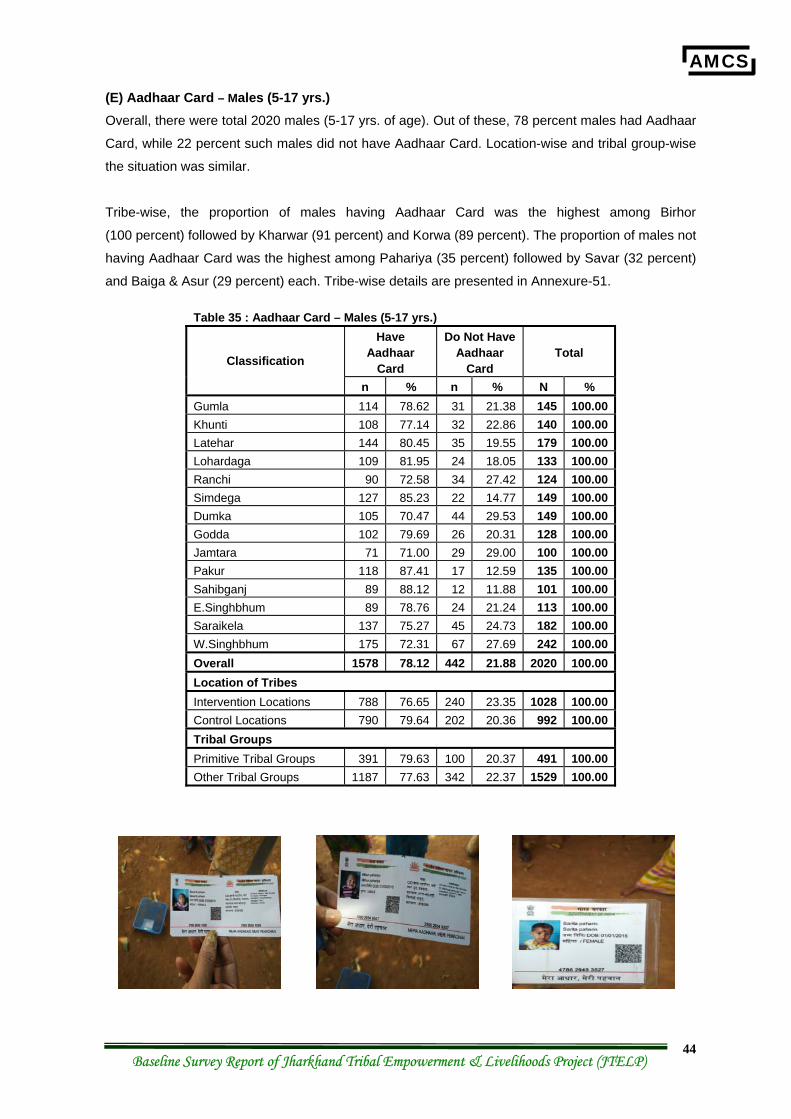
AMCS
Baseline Survey Report of Jharkhand Tribal Empowerment & Livelihoods Project (JTELP) 44
(E) Aadhaar Card – Males (5-17 yrs.) Overall, there were total 2020 males (5-17 yrs. of age). Out of these, 78 percent males had Aadhaar
Card, while 22 percent such males did not have Aadhaar Card. Location-wise and tribal group-wise
the situation was similar.
Tribe-wise, the proportion of males having Aadhaar Card was the highest among Birhor
(100 percent) followed by Kharwar (91 percent) and Korwa (89 percent). The proportion of males not
having Aadhaar Card was the highest among Pahariya (35 percent) followed by Savar (32 percent)
and Baiga & Asur (29 percent) each. Tribe-wise details are presented in Annexure-51.
Table 35 : Aadhaar Card – Males (5-17 yrs.) Have
Aadhaar Card
Do Not Have Aadhaar
Card Total Classification
n % n % N % Gumla 114 78.62 31 21.38 145 100.00 Khunti 108 77.14 32 22.86 140 100.00 Latehar 144 80.45 35 19.55 179 100.00 Lohardaga 109 81.95 24 18.05 133 100.00 Ranchi 90 72.58 34 27.42 124 100.00 Simdega 127 85.23 22 14.77 149 100.00 Dumka 105 70.47 44 29.53 149 100.00 Godda 102 79.69 26 20.31 128 100.00 Jamtara 71 71.00 29 29.00 100 100.00 Pakur 118 87.41 17 12.59 135 100.00 Sahibganj 89 88.12 12 11.88 101 100.00 E.Singhbhum 89 78.76 24 21.24 113 100.00 Saraikela 137 75.27 45 24.73 182 100.00 W.Singhbhum 175 72.31 67 27.69 242 100.00 Overall 1578 78.12 442 21.88 2020 100.00 Location of Tribes Intervention Locations 788 76.65 240 23.35 1028 100.00 Control Locations 790 79.64 202 20.36 992 100.00 Tribal Groups Primitive Tribal Groups 391 79.63 100 20.37 491 100.00 Other Tribal Groups 1187 77.63 342 22.37 1529 100.00
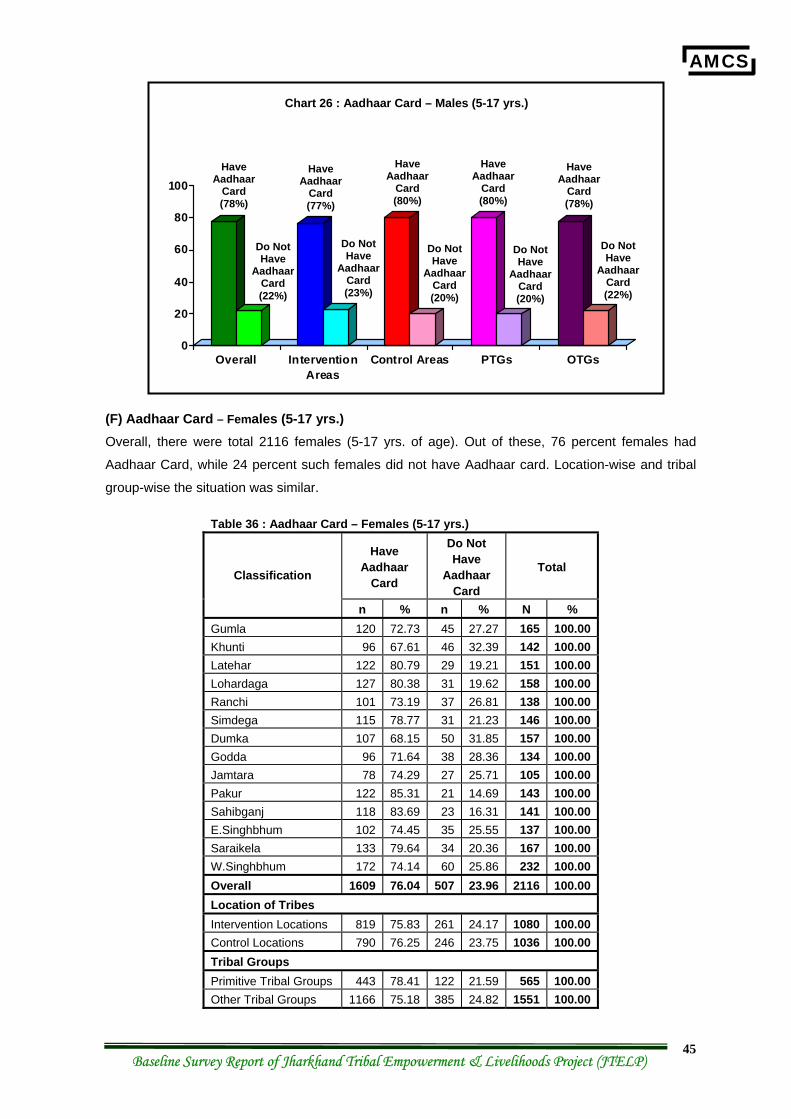
AMCS
Baseline Survey Report of Jharkhand Tribal Empowerment & Livelihoods Project (JTELP) 45
(F) Aadhaar Card – Females (5-17 yrs.) Overall, there were total 2116 females (5-17 yrs. of age). Out of these, 76 percent females had
Aadhaar Card, while 24 percent such females did not have Aadhaar card. Location-wise and tribal
group-wise the situation was similar.
Table 36 : Aadhaar Card – Females (5-17 yrs.)
Have Aadhaar
Card
Do Not Have
Aadhaar Card
Total Classification
n % n % N % Gumla 120 72.73 45 27.27 165 100.00 Khunti 96 67.61 46 32.39 142 100.00 Latehar 122 80.79 29 19.21 151 100.00 Lohardaga 127 80.38 31 19.62 158 100.00 Ranchi 101 73.19 37 26.81 138 100.00 Simdega 115 78.77 31 21.23 146 100.00 Dumka 107 68.15 50 31.85 157 100.00 Godda 96 71.64 38 28.36 134 100.00 Jamtara 78 74.29 27 25.71 105 100.00 Pakur 122 85.31 21 14.69 143 100.00 Sahibganj 118 83.69 23 16.31 141 100.00 E.Singhbhum 102 74.45 35 25.55 137 100.00 Saraikela 133 79.64 34 20.36 167 100.00 W.Singhbhum 172 74.14 60 25.86 232 100.00 Overall 1609 76.04 507 23.96 2116 100.00 Location of Tribes Intervention Locations 819 75.83 261 24.17 1080 100.00 Control Locations 790 76.25 246 23.75 1036 100.00 Tribal Groups Primitive Tribal Groups 443 78.41 122 21.59 565 100.00 Other Tribal Groups 1166 75.18 385 24.82 1551 100.00
0
20
40
60
80
100
Overall InterventionAreas
Control Areas PTGs OTGs
Have Aadhaar
Card (78%)
Have Aadhaar
Card (77%)
Have Aadhaar
Card (80%)
Have Aadhaar
Card (80%)
Have Aadhaar
Card (78%)
Do Not Have
Aadhaar Card (22%)
Do Not Have
Aadhaar Card (23%)
Do Not Have
Aadhaar Card (20%)
Do Not Have
Aadhaar Card (20%)
Do Not Have
Aadhaar Card (22%)
Chart 26 : Aadhaar Card – Males (5-17 yrs.)
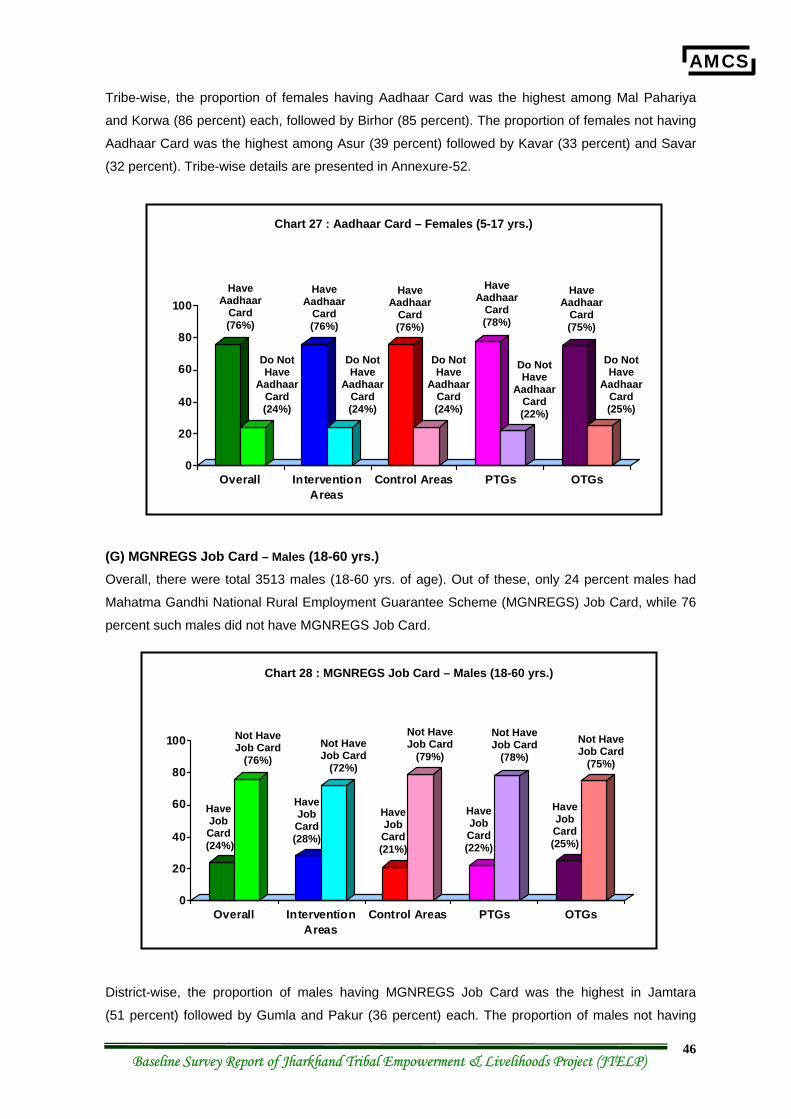
AMCS
Baseline Survey Report of Jharkhand Tribal Empowerment & Livelihoods Project (JTELP) 46
Tribe-wise, the proportion of females having Aadhaar Card was the highest among Mal Pahariya
and Korwa (86 percent) each, followed by Birhor (85 percent). The proportion of females not having
Aadhaar Card was the highest among Asur (39 percent) followed by Kavar (33 percent) and Savar
(32 percent). Tribe-wise details are presented in Annexure-52.
(G) MGNREGS Job Card – Males (18-60 yrs.) Overall, there were total 3513 males (18-60 yrs. of age). Out of these, only 24 percent males had
Mahatma Gandhi National Rural Employment Guarantee Scheme (MGNREGS) Job Card, while 76
percent such males did not have MGNREGS Job Card.
District-wise, the proportion of males having MGNREGS Job Card was the highest in Jamtara
(51 percent) followed by Gumla and Pakur (36 percent) each. The proportion of males not having
0
20
40
60
80
100
Overall InterventionAreas
Control Areas PTGs OTGs
Have Aadhaar
Card (76%)
Have Aadhaar
Card (76%)
Have Aadhaar
Card (76%)
Have Aadhaar
Card (78%)
Have Aadhaar
Card (75%)
Do Not Have
Aadhaar Card (24%)
Do Not Have
Aadhaar Card (24%)
Do Not Have
Aadhaar Card (24%)
Do Not Have
Aadhaar Card (22%)
Do Not Have
Aadhaar Card (25%)
Chart 27 : Aadhaar Card – Females (5-17 yrs.)
0
20
40
60
80
100
Overall InterventionAreas
Control Areas PTGs OTGs
Have Job Card
(24%)
Not Have Job Card
(76%)
Chart 28 : MGNREGS Job Card – Males (18-60 yrs.)
Have Job Card (28%)
Not Have Job Card
(72%)
Have Job Card (21%)
Not Have Job Card
(79%)
Have Job Card (22%)
Not Have Job Card
(78%)
Have Job Card (25%)
Not Have Job Card
(75%)
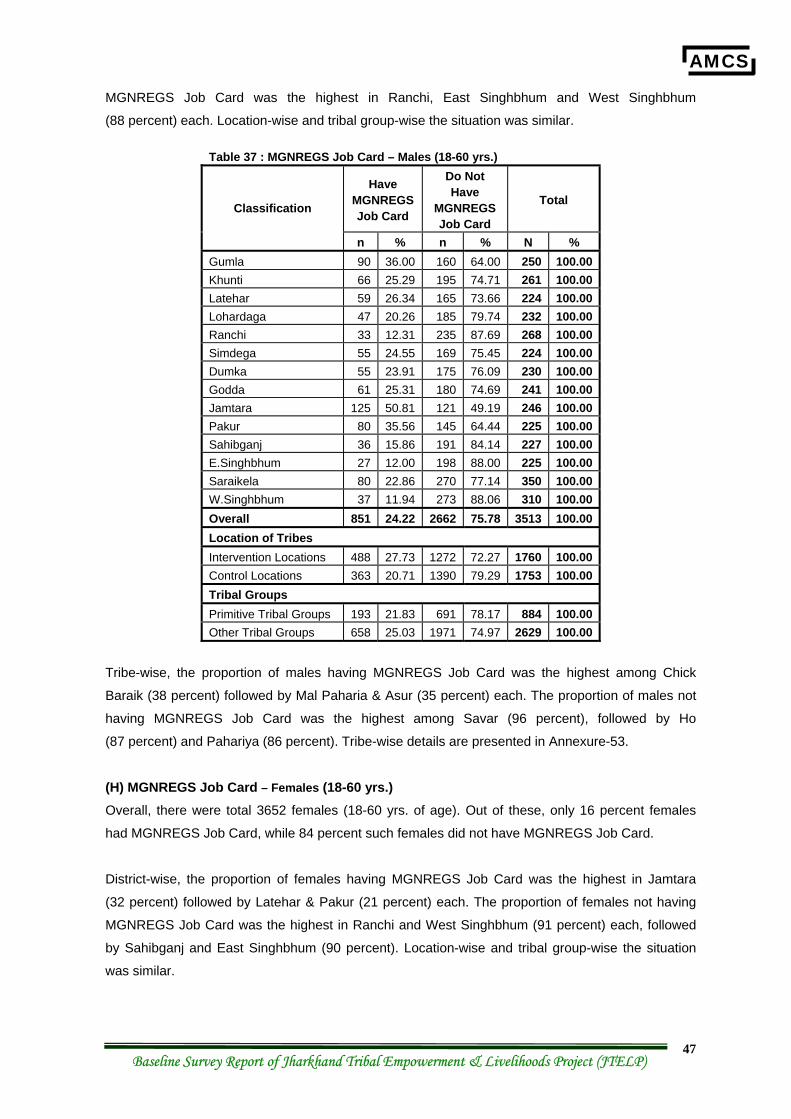
AMCS
Baseline Survey Report of Jharkhand Tribal Empowerment & Livelihoods Project (JTELP) 47
MGNREGS Job Card was the highest in Ranchi, East Singhbhum and West Singhbhum
(88 percent) each. Location-wise and tribal group-wise the situation was similar.
Table 37 : MGNREGS Job Card – Males (18-60 yrs.)
Have MGNREGS Job Card
Do Not Have
MGNREGS Job Card
Total Classification
n % n % N % Gumla 90 36.00 160 64.00 250 100.00 Khunti 66 25.29 195 74.71 261 100.00 Latehar 59 26.34 165 73.66 224 100.00 Lohardaga 47 20.26 185 79.74 232 100.00 Ranchi 33 12.31 235 87.69 268 100.00 Simdega 55 24.55 169 75.45 224 100.00 Dumka 55 23.91 175 76.09 230 100.00 Godda 61 25.31 180 74.69 241 100.00 Jamtara 125 50.81 121 49.19 246 100.00 Pakur 80 35.56 145 64.44 225 100.00 Sahibganj 36 15.86 191 84.14 227 100.00 E.Singhbhum 27 12.00 198 88.00 225 100.00 Saraikela 80 22.86 270 77.14 350 100.00 W.Singhbhum 37 11.94 273 88.06 310 100.00 Overall 851 24.22 2662 75.78 3513 100.00 Location of Tribes Intervention Locations 488 27.73 1272 72.27 1760 100.00 Control Locations 363 20.71 1390 79.29 1753 100.00 Tribal Groups Primitive Tribal Groups 193 21.83 691 78.17 884 100.00 Other Tribal Groups 658 25.03 1971 74.97 2629 100.00
Tribe-wise, the proportion of males having MGNREGS Job Card was the highest among Chick
Baraik (38 percent) followed by Mal Paharia & Asur (35 percent) each. The proportion of males not
having MGNREGS Job Card was the highest among Savar (96 percent), followed by Ho
(87 percent) and Pahariya (86 percent). Tribe-wise details are presented in Annexure-53.
(H) MGNREGS Job Card – Females (18-60 yrs.) Overall, there were total 3652 females (18-60 yrs. of age). Out of these, only 16 percent females
had MGNREGS Job Card, while 84 percent such females did not have MGNREGS Job Card.
District-wise, the proportion of females having MGNREGS Job Card was the highest in Jamtara
(32 percent) followed by Latehar & Pakur (21 percent) each. The proportion of females not having
MGNREGS Job Card was the highest in Ranchi and West Singhbhum (91 percent) each, followed
by Sahibganj and East Singhbhum (90 percent). Location-wise and tribal group-wise the situation
was similar.
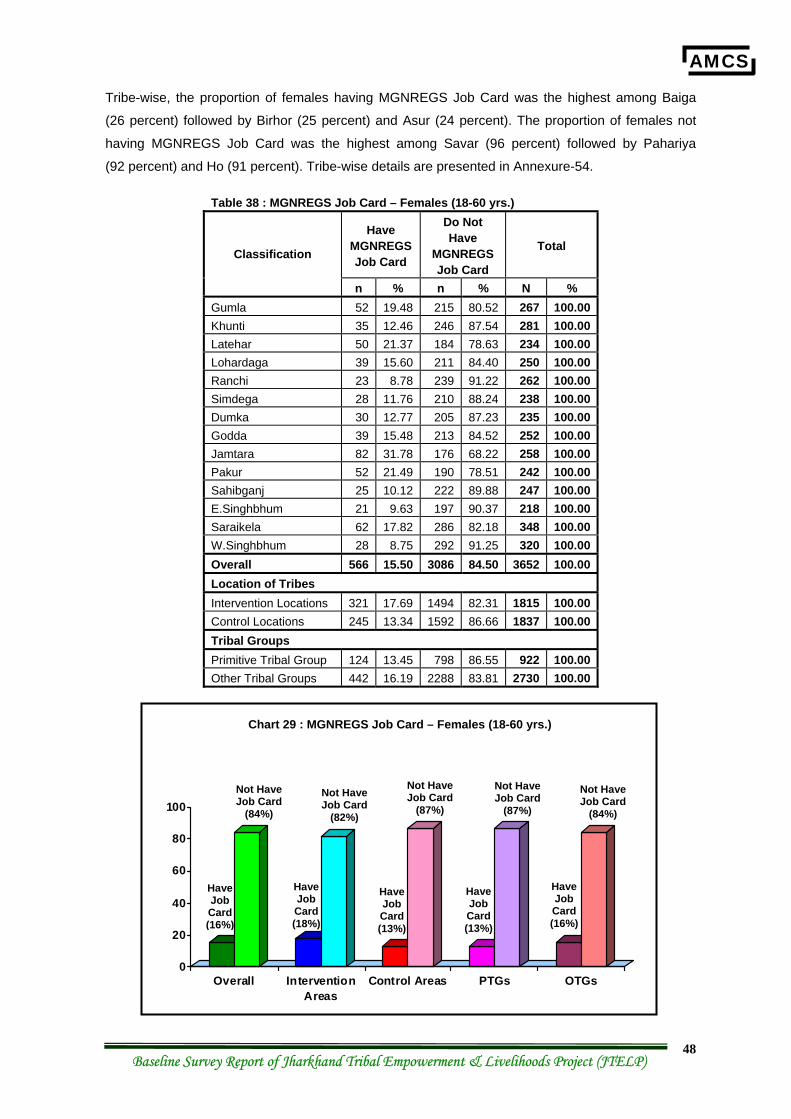
AMCS
Baseline Survey Report of Jharkhand Tribal Empowerment & Livelihoods Project (JTELP) 48
Tribe-wise, the proportion of females having MGNREGS Job Card was the highest among Baiga
(26 percent) followed by Birhor (25 percent) and Asur (24 percent). The proportion of females not
having MGNREGS Job Card was the highest among Savar (96 percent) followed by Pahariya
(92 percent) and Ho (91 percent). Tribe-wise details are presented in Annexure-54.
Table 38 : MGNREGS Job Card – Females (18-60 yrs.)
Have MGNREGS Job Card
Do Not Have
MGNREGS Job Card
Total Classification
n % n % N % Gumla 52 19.48 215 80.52 267 100.00 Khunti 35 12.46 246 87.54 281 100.00 Latehar 50 21.37 184 78.63 234 100.00 Lohardaga 39 15.60 211 84.40 250 100.00 Ranchi 23 8.78 239 91.22 262 100.00 Simdega 28 11.76 210 88.24 238 100.00 Dumka 30 12.77 205 87.23 235 100.00 Godda 39 15.48 213 84.52 252 100.00 Jamtara 82 31.78 176 68.22 258 100.00 Pakur 52 21.49 190 78.51 242 100.00 Sahibganj 25 10.12 222 89.88 247 100.00 E.Singhbhum 21 9.63 197 90.37 218 100.00 Saraikela 62 17.82 286 82.18 348 100.00 W.Singhbhum 28 8.75 292 91.25 320 100.00 Overall 566 15.50 3086 84.50 3652 100.00 Location of Tribes Intervention Locations 321 17.69 1494 82.31 1815 100.00 Control Locations 245 13.34 1592 86.66 1837 100.00 Tribal Groups Primitive Tribal Group 124 13.45 798 86.55 922 100.00 Other Tribal Groups 442 16.19 2288 83.81 2730 100.00
0
20
40
60
80
100
Overall InterventionAreas
Control Areas PTGs OTGs
Have Job Card (16%)
Not Have Job Card
(84%)
Chart 29 : MGNREGS Job Card – Females (18-60 yrs.)
Have Job Card (18%)
Not Have Job Card
(82%)
Have Job Card (13%)
Not Have Job Card
(87%)
Have Job Card (13%)
Not Have Job Card
(87%)
Have Job Card (16%)
Not Have Job Card
(84%)
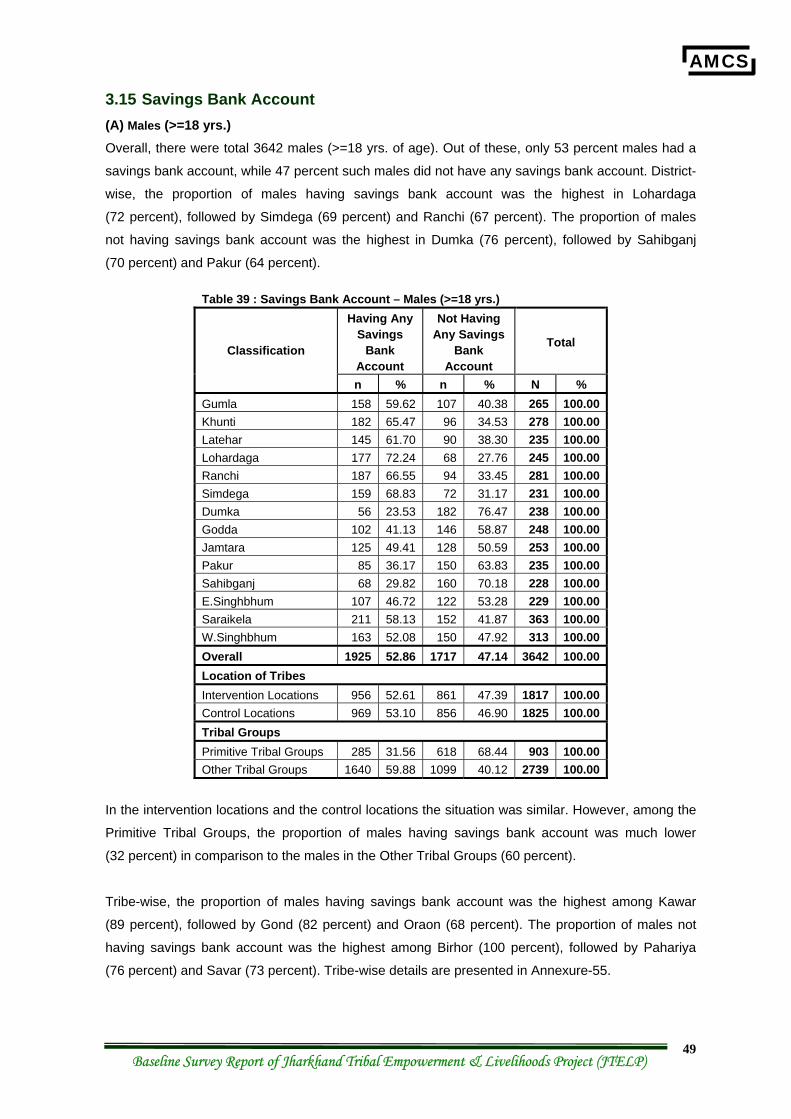
AMCS
Baseline Survey Report of Jharkhand Tribal Empowerment & Livelihoods Project (JTELP) 49
3.15 Savings Bank Account (A) Males (>=18 yrs.) Overall, there were total 3642 males (>=18 yrs. of age). Out of these, only 53 percent males had a
savings bank account, while 47 percent such males did not have any savings bank account. District-
wise, the proportion of males having savings bank account was the highest in Lohardaga
(72 percent), followed by Simdega (69 percent) and Ranchi (67 percent). The proportion of males
not having savings bank account was the highest in Dumka (76 percent), followed by Sahibganj
(70 percent) and Pakur (64 percent).
Table 39 : Savings Bank Account – Males (>=18 yrs.) Having Any
Savings Bank
Account
Not Having Any Savings
Bank Account
Total Classification
n % n % N % Gumla 158 59.62 107 40.38 265 100.00 Khunti 182 65.47 96 34.53 278 100.00 Latehar 145 61.70 90 38.30 235 100.00 Lohardaga 177 72.24 68 27.76 245 100.00 Ranchi 187 66.55 94 33.45 281 100.00 Simdega 159 68.83 72 31.17 231 100.00 Dumka 56 23.53 182 76.47 238 100.00 Godda 102 41.13 146 58.87 248 100.00 Jamtara 125 49.41 128 50.59 253 100.00 Pakur 85 36.17 150 63.83 235 100.00 Sahibganj 68 29.82 160 70.18 228 100.00 E.Singhbhum 107 46.72 122 53.28 229 100.00 Saraikela 211 58.13 152 41.87 363 100.00 W.Singhbhum 163 52.08 150 47.92 313 100.00 Overall 1925 52.86 1717 47.14 3642 100.00 Location of Tribes Intervention Locations 956 52.61 861 47.39 1817 100.00 Control Locations 969 53.10 856 46.90 1825 100.00 Tribal Groups Primitive Tribal Groups 285 31.56 618 68.44 903 100.00 Other Tribal Groups 1640 59.88 1099 40.12 2739 100.00
In the intervention locations and the control locations the situation was similar. However, among the
Primitive Tribal Groups, the proportion of males having savings bank account was much lower
(32 percent) in comparison to the males in the Other Tribal Groups (60 percent).
Tribe-wise, the proportion of males having savings bank account was the highest among Kawar
(89 percent), followed by Gond (82 percent) and Oraon (68 percent). The proportion of males not
having savings bank account was the highest among Birhor (100 percent), followed by Pahariya
(76 percent) and Savar (73 percent). Tribe-wise details are presented in Annexure-55.
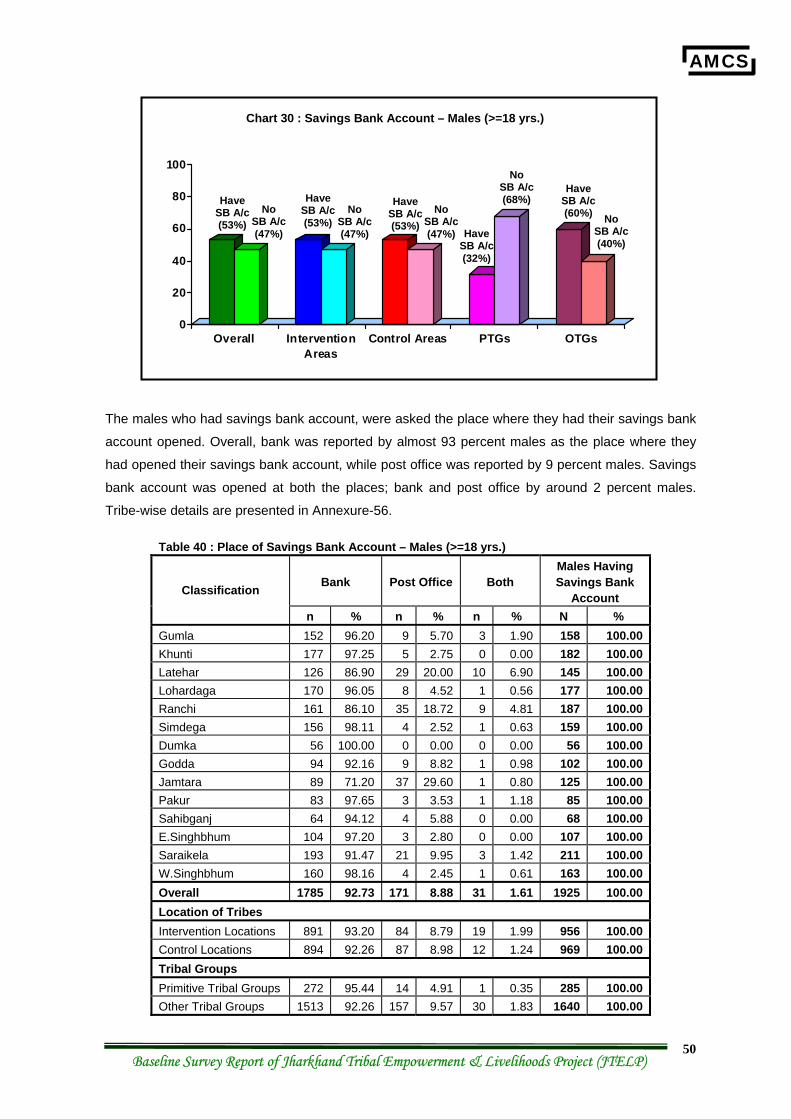
AMCS
Baseline Survey Report of Jharkhand Tribal Empowerment & Livelihoods Project (JTELP) 50
The males who had savings bank account, were asked the place where they had their savings bank
account opened. Overall, bank was reported by almost 93 percent males as the place where they
had opened their savings bank account, while post office was reported by 9 percent males. Savings
bank account was opened at both the places; bank and post office by around 2 percent males.
Tribe-wise details are presented in Annexure-56.
Table 40 : Place of Savings Bank Account – Males (>=18 yrs.)
Bank Post Office Both Males Having Savings Bank
Account Classification
n % n % n % N % Gumla 152 96.20 9 5.70 3 1.90 158 100.00 Khunti 177 97.25 5 2.75 0 0.00 182 100.00 Latehar 126 86.90 29 20.00 10 6.90 145 100.00 Lohardaga 170 96.05 8 4.52 1 0.56 177 100.00 Ranchi 161 86.10 35 18.72 9 4.81 187 100.00 Simdega 156 98.11 4 2.52 1 0.63 159 100.00 Dumka 56 100.00 0 0.00 0 0.00 56 100.00 Godda 94 92.16 9 8.82 1 0.98 102 100.00 Jamtara 89 71.20 37 29.60 1 0.80 125 100.00 Pakur 83 97.65 3 3.53 1 1.18 85 100.00 Sahibganj 64 94.12 4 5.88 0 0.00 68 100.00 E.Singhbhum 104 97.20 3 2.80 0 0.00 107 100.00 Saraikela 193 91.47 21 9.95 3 1.42 211 100.00 W.Singhbhum 160 98.16 4 2.45 1 0.61 163 100.00 Overall 1785 92.73 171 8.88 31 1.61 1925 100.00 Location of Tribes Intervention Locations 891 93.20 84 8.79 19 1.99 956 100.00 Control Locations 894 92.26 87 8.98 12 1.24 969 100.00 Tribal Groups Primitive Tribal Groups 272 95.44 14 4.91 1 0.35 285 100.00 Other Tribal Groups 1513 92.26 157 9.57 30 1.83 1640 100.00
0
20
40
60
80
100
Overall InterventionAreas
Control Areas PTGs OTGs
Have SB A/c (53%)
Chart 30 : Savings Bank Account – Males (>=18 yrs.)
No SB A/c (47%)
Have SB A/c (53%)
No SB A/c (47%)
Have SB A/c (53%)
No SB A/c (47%) Have
SB A/c (32%)
No SB A/c (68%)
Have SB A/c (60%) No
SB A/c (40%)
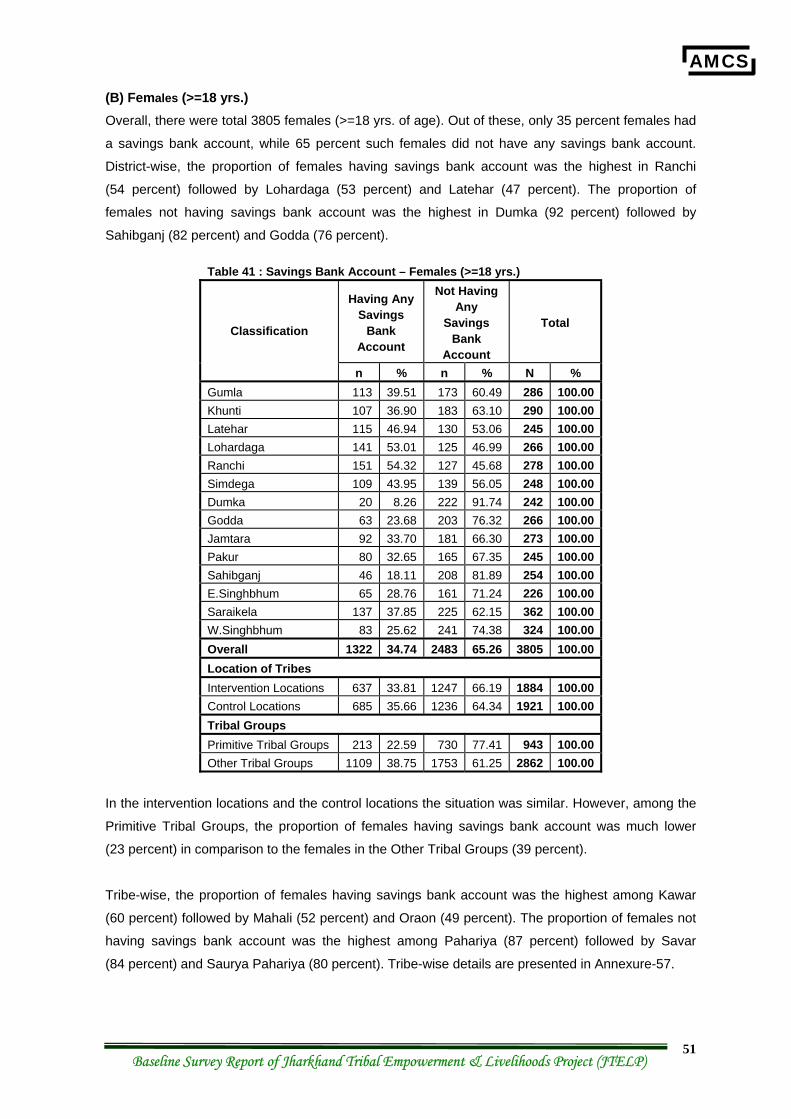
AMCS
Baseline Survey Report of Jharkhand Tribal Empowerment & Livelihoods Project (JTELP) 51
(B) Females (>=18 yrs.) Overall, there were total 3805 females (>=18 yrs. of age). Out of these, only 35 percent females had
a savings bank account, while 65 percent such females did not have any savings bank account.
District-wise, the proportion of females having savings bank account was the highest in Ranchi
(54 percent) followed by Lohardaga (53 percent) and Latehar (47 percent). The proportion of
females not having savings bank account was the highest in Dumka (92 percent) followed by
Sahibganj (82 percent) and Godda (76 percent).
Table 41 : Savings Bank Account – Females (>=18 yrs.)
Having Any Savings
Bank Account
Not Having Any
Savings Bank
Account
Total Classification
n % n % N % Gumla 113 39.51 173 60.49 286 100.00 Khunti 107 36.90 183 63.10 290 100.00 Latehar 115 46.94 130 53.06 245 100.00 Lohardaga 141 53.01 125 46.99 266 100.00 Ranchi 151 54.32 127 45.68 278 100.00 Simdega 109 43.95 139 56.05 248 100.00 Dumka 20 8.26 222 91.74 242 100.00 Godda 63 23.68 203 76.32 266 100.00 Jamtara 92 33.70 181 66.30 273 100.00 Pakur 80 32.65 165 67.35 245 100.00 Sahibganj 46 18.11 208 81.89 254 100.00 E.Singhbhum 65 28.76 161 71.24 226 100.00 Saraikela 137 37.85 225 62.15 362 100.00 W.Singhbhum 83 25.62 241 74.38 324 100.00 Overall 1322 34.74 2483 65.26 3805 100.00 Location of Tribes Intervention Locations 637 33.81 1247 66.19 1884 100.00 Control Locations 685 35.66 1236 64.34 1921 100.00 Tribal Groups Primitive Tribal Groups 213 22.59 730 77.41 943 100.00 Other Tribal Groups 1109 38.75 1753 61.25 2862 100.00
In the intervention locations and the control locations the situation was similar. However, among the
Primitive Tribal Groups, the proportion of females having savings bank account was much lower
(23 percent) in comparison to the females in the Other Tribal Groups (39 percent).
Tribe-wise, the proportion of females having savings bank account was the highest among Kawar
(60 percent) followed by Mahali (52 percent) and Oraon (49 percent). The proportion of females not
having savings bank account was the highest among Pahariya (87 percent) followed by Savar
(84 percent) and Saurya Pahariya (80 percent). Tribe-wise details are presented in Annexure-57.
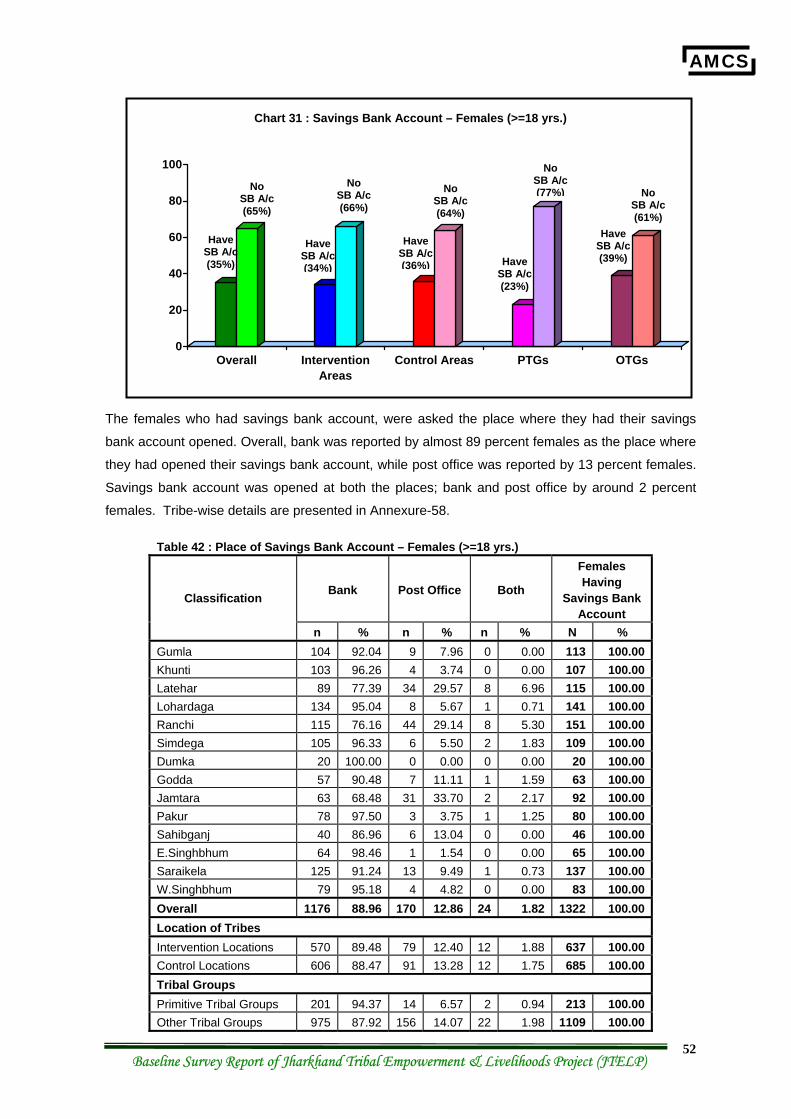
AMCS
Baseline Survey Report of Jharkhand Tribal Empowerment & Livelihoods Project (JTELP) 52
The females who had savings bank account, were asked the place where they had their savings
bank account opened. Overall, bank was reported by almost 89 percent females as the place where
they had opened their savings bank account, while post office was reported by 13 percent females.
Savings bank account was opened at both the places; bank and post office by around 2 percent
females. Tribe-wise details are presented in Annexure-58.
Table 42 : Place of Savings Bank Account – Females (>=18 yrs.)
Bank Post Office Both
Females Having
Savings Bank Account
Classification
n % n % n % N % Gumla 104 92.04 9 7.96 0 0.00 113 100.00 Khunti 103 96.26 4 3.74 0 0.00 107 100.00 Latehar 89 77.39 34 29.57 8 6.96 115 100.00 Lohardaga 134 95.04 8 5.67 1 0.71 141 100.00 Ranchi 115 76.16 44 29.14 8 5.30 151 100.00 Simdega 105 96.33 6 5.50 2 1.83 109 100.00 Dumka 20 100.00 0 0.00 0 0.00 20 100.00 Godda 57 90.48 7 11.11 1 1.59 63 100.00 Jamtara 63 68.48 31 33.70 2 2.17 92 100.00 Pakur 78 97.50 3 3.75 1 1.25 80 100.00 Sahibganj 40 86.96 6 13.04 0 0.00 46 100.00 E.Singhbhum 64 98.46 1 1.54 0 0.00 65 100.00 Saraikela 125 91.24 13 9.49 1 0.73 137 100.00 W.Singhbhum 79 95.18 4 4.82 0 0.00 83 100.00 Overall 1176 88.96 170 12.86 24 1.82 1322 100.00 Location of Tribes Intervention Locations 570 89.48 79 12.40 12 1.88 637 100.00 Control Locations 606 88.47 91 13.28 12 1.75 685 100.00 Tribal Groups Primitive Tribal Groups 201 94.37 14 6.57 2 0.94 213 100.00 Other Tribal Groups 975 87.92 156 14.07 22 1.98 1109 100.00
0
20
40
60
80
100
Overall InterventionAreas
Control Areas PTGs OTGs
Have SB A/c (35%)
Chart 31 : Savings Bank Account – Females (>=18 yrs.)
No SB A/c (65%)
Have SB A/c (34%)
No SB A/c (66%)
Have SB A/c (36%)
No SB A/c (64%)
Have SB A/c (23%)
No SB A/c (77%)
Have SB A/c (39%)
No SB A/c (61%)
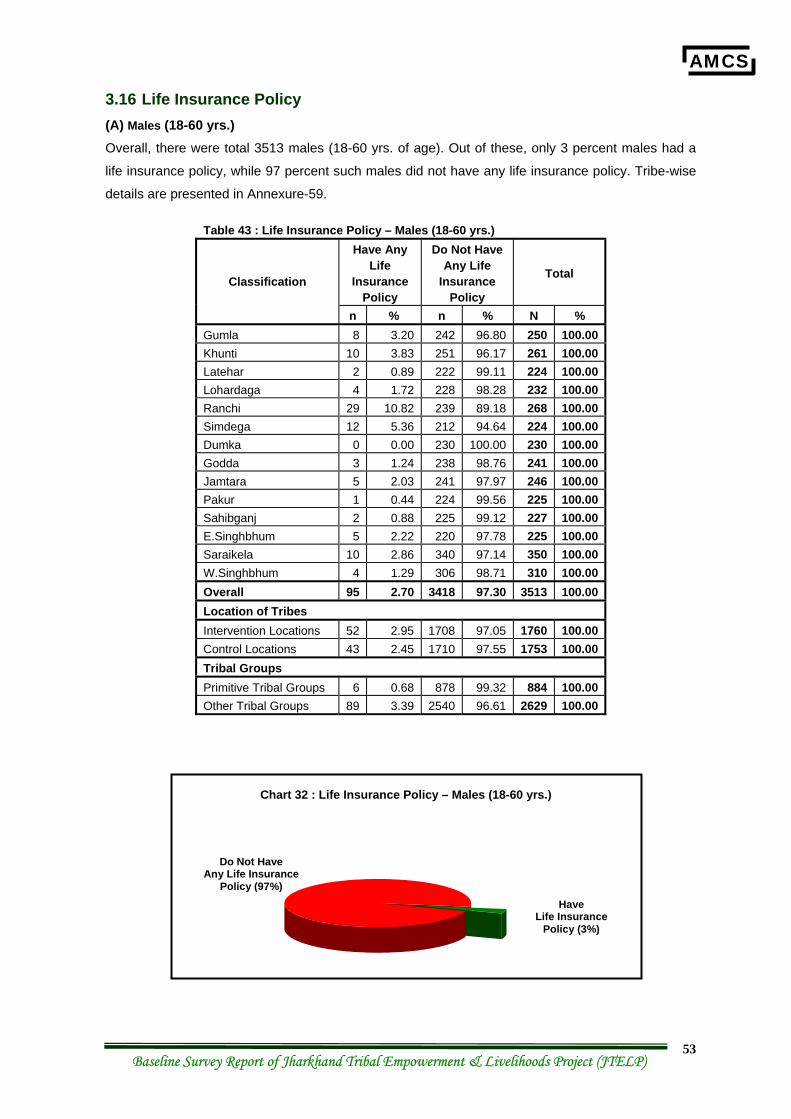
AMCS
Baseline Survey Report of Jharkhand Tribal Empowerment & Livelihoods Project (JTELP) 53
3.16 Life Insurance Policy (A) Males (18-60 yrs.) Overall, there were total 3513 males (18-60 yrs. of age). Out of these, only 3 percent males had a
life insurance policy, while 97 percent such males did not have any life insurance policy. Tribe-wise
details are presented in Annexure-59.
Table 43 : Life Insurance Policy – Males (18-60 yrs.) Have Any
Life Insurance
Policy
Do Not Have Any Life
Insurance Policy
Total Classification
n % n % N % Gumla 8 3.20 242 96.80 250 100.00 Khunti 10 3.83 251 96.17 261 100.00 Latehar 2 0.89 222 99.11 224 100.00 Lohardaga 4 1.72 228 98.28 232 100.00 Ranchi 29 10.82 239 89.18 268 100.00 Simdega 12 5.36 212 94.64 224 100.00 Dumka 0 0.00 230 100.00 230 100.00 Godda 3 1.24 238 98.76 241 100.00 Jamtara 5 2.03 241 97.97 246 100.00 Pakur 1 0.44 224 99.56 225 100.00 Sahibganj 2 0.88 225 99.12 227 100.00 E.Singhbhum 5 2.22 220 97.78 225 100.00 Saraikela 10 2.86 340 97.14 350 100.00 W.Singhbhum 4 1.29 306 98.71 310 100.00 Overall 95 2.70 3418 97.30 3513 100.00 Location of Tribes Intervention Locations 52 2.95 1708 97.05 1760 100.00 Control Locations 43 2.45 1710 97.55 1753 100.00 Tribal Groups Primitive Tribal Groups 6 0.68 878 99.32 884 100.00 Other Tribal Groups 89 3.39 2540 96.61 2629 100.00
Chart 32 : Life Insurance Policy – Males (18-60 yrs.)
Do Not Have Any Life Insurance
Policy (97%) Have
Life Insurance Policy (3%)
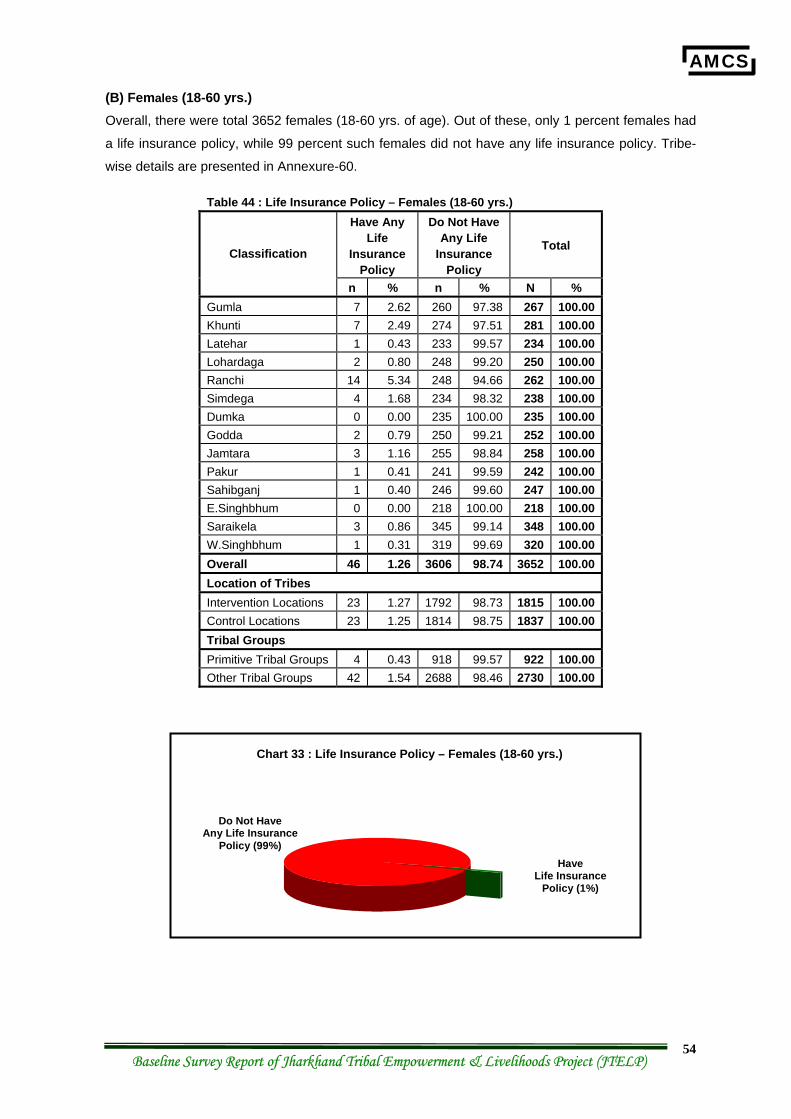
AMCS
Baseline Survey Report of Jharkhand Tribal Empowerment & Livelihoods Project (JTELP) 54
(B) Females (18-60 yrs.) Overall, there were total 3652 females (18-60 yrs. of age). Out of these, only 1 percent females had
a life insurance policy, while 99 percent such females did not have any life insurance policy. Tribe-
wise details are presented in Annexure-60.
Table 44 : Life Insurance Policy – Females (18-60 yrs.) Have Any
Life Insurance
Policy
Do Not Have Any Life
Insurance Policy
Total Classification
n % n % N % Gumla 7 2.62 260 97.38 267 100.00 Khunti 7 2.49 274 97.51 281 100.00 Latehar 1 0.43 233 99.57 234 100.00 Lohardaga 2 0.80 248 99.20 250 100.00 Ranchi 14 5.34 248 94.66 262 100.00 Simdega 4 1.68 234 98.32 238 100.00 Dumka 0 0.00 235 100.00 235 100.00 Godda 2 0.79 250 99.21 252 100.00 Jamtara 3 1.16 255 98.84 258 100.00 Pakur 1 0.41 241 99.59 242 100.00 Sahibganj 1 0.40 246 99.60 247 100.00 E.Singhbhum 0 0.00 218 100.00 218 100.00 Saraikela 3 0.86 345 99.14 348 100.00 W.Singhbhum 1 0.31 319 99.69 320 100.00 Overall 46 1.26 3606 98.74 3652 100.00 Location of Tribes Intervention Locations 23 1.27 1792 98.73 1815 100.00 Control Locations 23 1.25 1814 98.75 1837 100.00 Tribal Groups Primitive Tribal Groups 4 0.43 918 99.57 922 100.00 Other Tribal Groups 42 1.54 2688 98.46 2730 100.00
Chart 33 : Life Insurance Policy – Females (18-60 yrs.)
Do Not Have Any Life Insurance
Policy (99%) Have
Life Insurance Policy (1%)
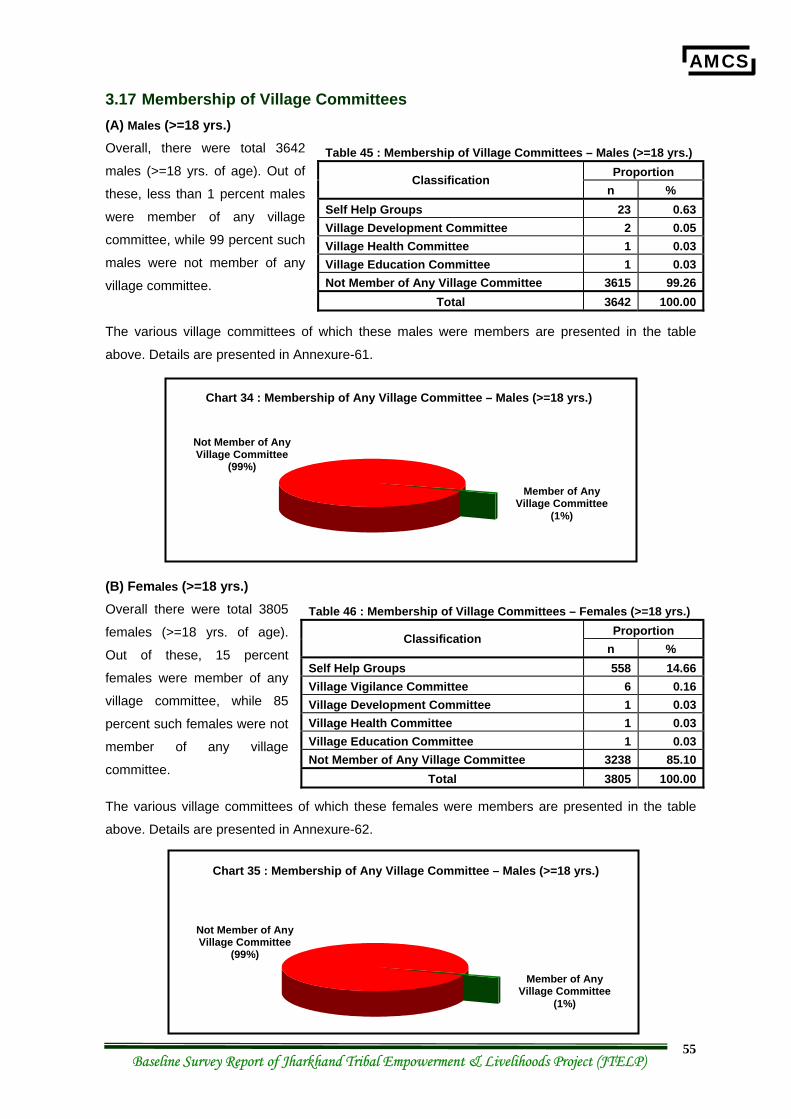
AMCS
Baseline Survey Report of Jharkhand Tribal Empowerment & Livelihoods Project (JTELP) 55
3.17 Membership of Village Committees (A) Males (>=18 yrs.) Overall, there were total 3642
males (>=18 yrs. of age). Out of
these, less than 1 percent males
were member of any village
committee, while 99 percent such
males were not member of any
village committee.
The various village committees of which these males were members are presented in the table
above. Details are presented in Annexure-61.
(B) Females (>=18 yrs.) Overall there were total 3805
females (>=18 yrs. of age).
Out of these, 15 percent
females were member of any
village committee, while 85
percent such females were not
member of any village
committee.
The various village committees of which these females were members are presented in the table
above. Details are presented in Annexure-62.
Table 45 : Membership of Village Committees – Males (>=18 yrs.) Proportion Classification
n % Self Help Groups 23 0.63Village Development Committee 2 0.05Village Health Committee 1 0.03Village Education Committee 1 0.03Not Member of Any Village Committee 3615 99.26
Total 3642 100.00
Table 46 : Membership of Village Committees – Females (>=18 yrs.) Proportion Classification
n % Self Help Groups 558 14.66Village Vigilance Committee 6 0.16Village Development Committee 1 0.03Village Health Committee 1 0.03Village Education Committee 1 0.03Not Member of Any Village Committee 3238 85.10
Total 3805 100.00
Chart 34 : Membership of Any Village Committee – Males (>=18 yrs.)
Member of Any Village Committee
(1%)
Not Member of Any Village Committee
(99%)
Chart 35 : Membership of Any Village Committee – Males (>=18 yrs.)
Member of Any Village Committee
(1%)
Not Member of Any Village Committee
(99%)
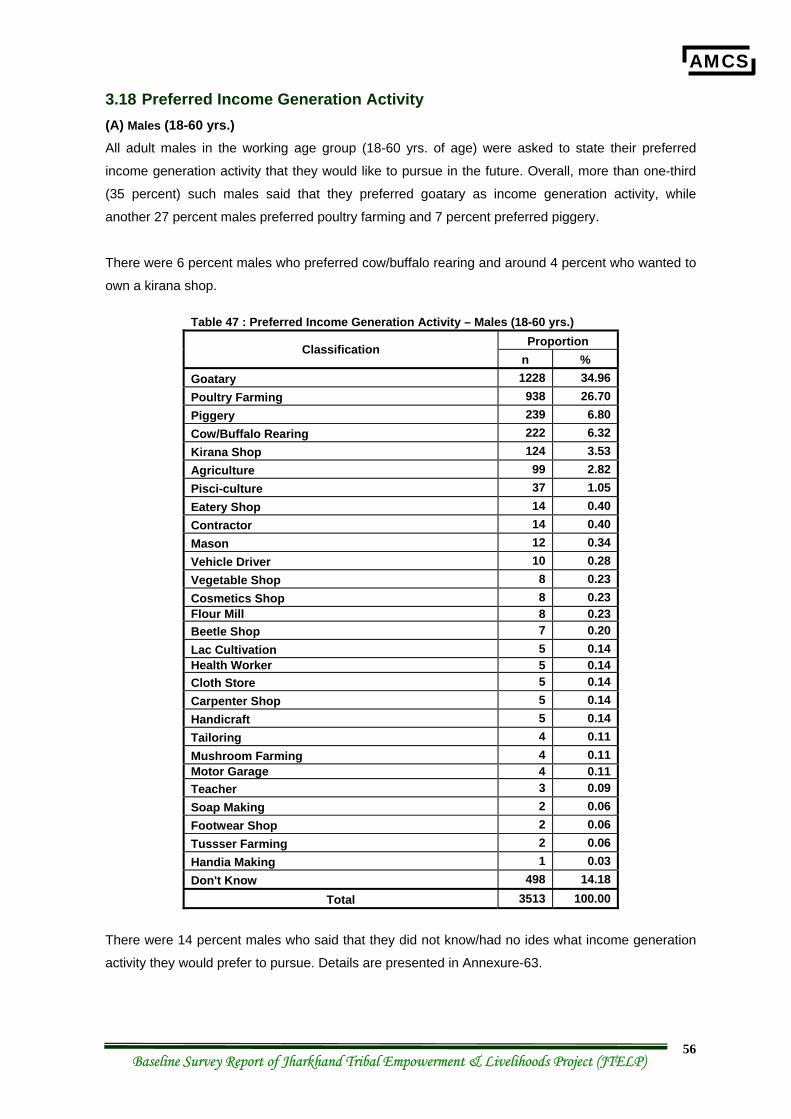
AMCS
Baseline Survey Report of Jharkhand Tribal Empowerment & Livelihoods Project (JTELP) 56
3.18 Preferred Income Generation Activity (A) Males (18-60 yrs.) All adult males in the working age group (18-60 yrs. of age) were asked to state their preferred
income generation activity that they would like to pursue in the future. Overall, more than one-third
(35 percent) such males said that they preferred goatary as income generation activity, while
another 27 percent males preferred poultry farming and 7 percent preferred piggery.
There were 6 percent males who preferred cow/buffalo rearing and around 4 percent who wanted to
own a kirana shop.
Table 47 : Preferred Income Generation Activity – Males (18-60 yrs.) Proportion Classification
n % Goatary 1228 34.96 Poultry Farming 938 26.70 Piggery 239 6.80 Cow/Buffalo Rearing 222 6.32 Kirana Shop 124 3.53 Agriculture 99 2.82 Pisci-culture 37 1.05 Eatery Shop 14 0.40 Contractor 14 0.40 Mason 12 0.34 Vehicle Driver 10 0.28 Vegetable Shop 8 0.23 Cosmetics Shop 8 0.23 Flour Mill 8 0.23 Beetle Shop 7 0.20 Lac Cultivation 5 0.14 Health Worker 5 0.14 Cloth Store 5 0.14 Carpenter Shop 5 0.14 Handicraft 5 0.14 Tailoring 4 0.11 Mushroom Farming 4 0.11 Motor Garage 4 0.11 Teacher 3 0.09 Soap Making 2 0.06 Footwear Shop 2 0.06 Tussser Farming 2 0.06 Handia Making 1 0.03 Don't Know 498 14.18
Total 3513 100.00
There were 14 percent males who said that they did not know/had no ides what income generation
activity they would prefer to pursue. Details are presented in Annexure-63.
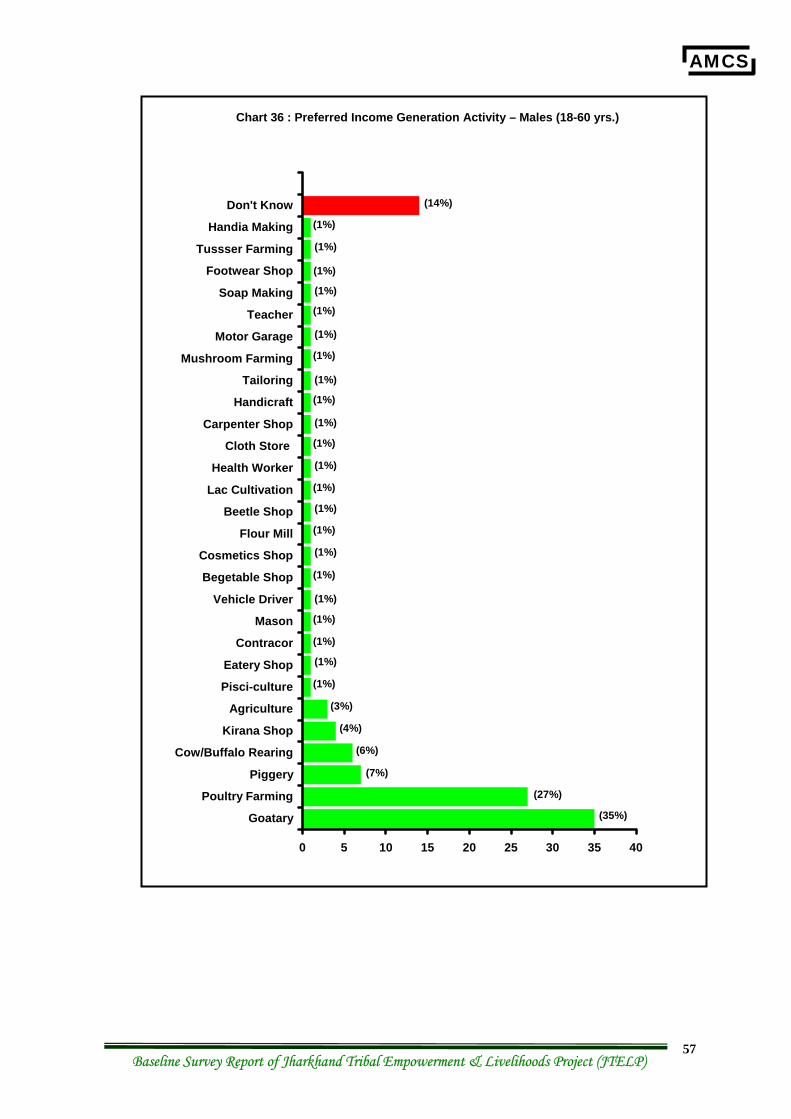
AMCS
Baseline Survey Report of Jharkhand Tribal Empowerment & Livelihoods Project (JTELP) 57
0 5 10 15 20 25 30 35 40
Goatary
Poultry Farming
Piggery
Cow/Buffalo Rearing
Kirana Shop
Agriculture
Pisci-culture
Eatery Shop
Contracor
Mason
Vehicle Driver
Begetable Shop
Cosmetics Shop
Flour Mill
Beetle Shop
Lac Cultivation
Health Worker
Cloth Store
Carpenter Shop
Handicraft
Tailoring
Mushroom Farming
Motor Garage
Teacher
Soap Making
Footwear Shop
Tussser Farming
Handia Making
Don't Know
Chart 36 : Preferred Income Generation Activity – Males (18-60 yrs.)
(14%)
(35%)
(6%)
(27%)
(4%)
(3%)
(1%)
(1%)
(1%)
(1%)
(1%)
(1%)
(1%)
(1%)
(1%)
(1%)
(1%)
(1%)
(1%)
(1%)
(1%)
(1%)
(1%)
(1%)
(1%)
(1%)
(1%)
(1%)
(7%)
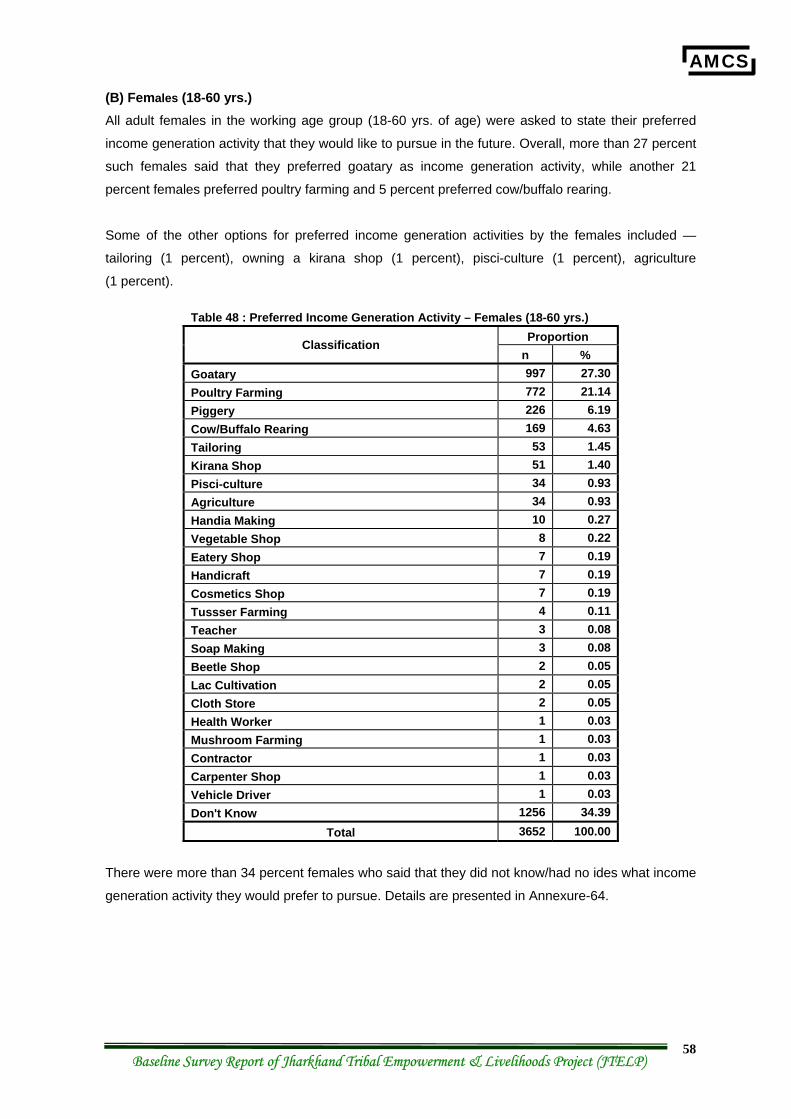
AMCS
Baseline Survey Report of Jharkhand Tribal Empowerment & Livelihoods Project (JTELP) 58
(B) Females (18-60 yrs.) All adult females in the working age group (18-60 yrs. of age) were asked to state their preferred
income generation activity that they would like to pursue in the future. Overall, more than 27 percent
such females said that they preferred goatary as income generation activity, while another 21
percent females preferred poultry farming and 5 percent preferred cow/buffalo rearing.
Some of the other options for preferred income generation activities by the females included —
tailoring (1 percent), owning a kirana shop (1 percent), pisci-culture (1 percent), agriculture
(1 percent).
Table 48 : Preferred Income Generation Activity – Females (18-60 yrs.) Proportion Classification
n % Goatary 997 27.30 Poultry Farming 772 21.14 Piggery 226 6.19 Cow/Buffalo Rearing 169 4.63 Tailoring 53 1.45 Kirana Shop 51 1.40 Pisci-culture 34 0.93 Agriculture 34 0.93 Handia Making 10 0.27 Vegetable Shop 8 0.22 Eatery Shop 7 0.19 Handicraft 7 0.19 Cosmetics Shop 7 0.19 Tussser Farming 4 0.11 Teacher 3 0.08 Soap Making 3 0.08 Beetle Shop 2 0.05 Lac Cultivation 2 0.05 Cloth Store 2 0.05 Health Worker 1 0.03 Mushroom Farming 1 0.03 Contractor 1 0.03 Carpenter Shop 1 0.03 Vehicle Driver 1 0.03 Don't Know 1256 34.39
Total 3652 100.00
There were more than 34 percent females who said that they did not know/had no ides what income
generation activity they would prefer to pursue. Details are presented in Annexure-64.
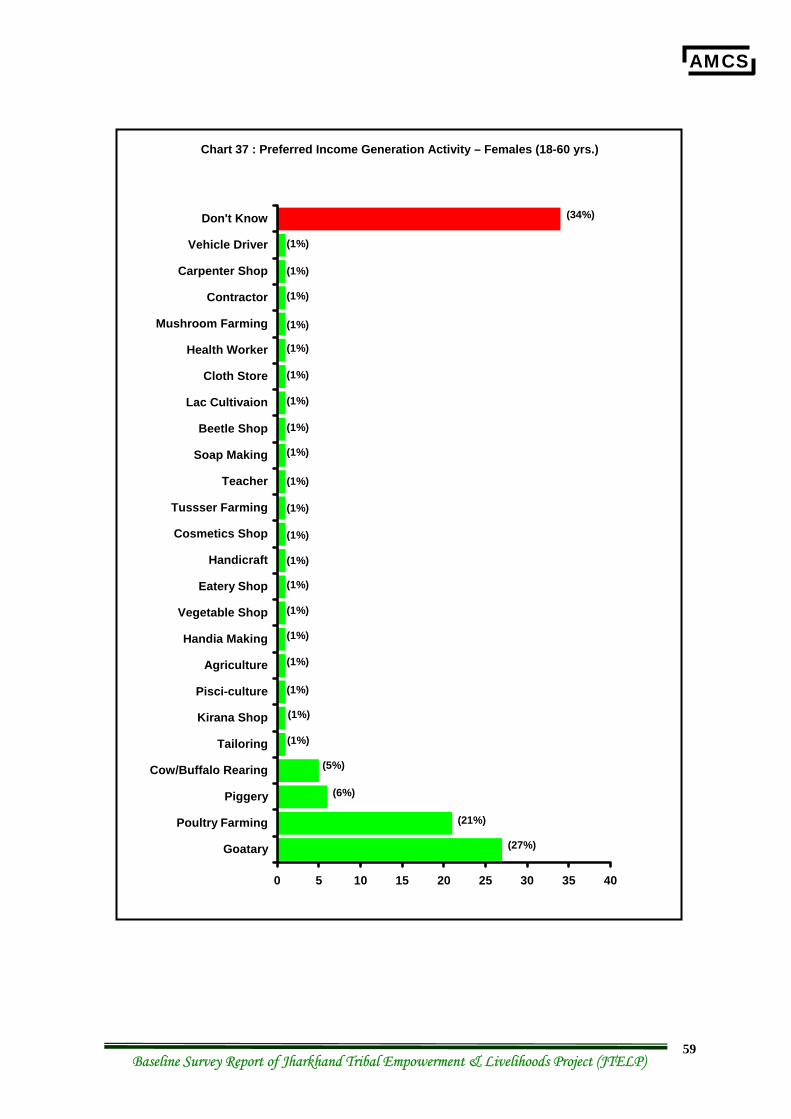
AMCS
Baseline Survey Report of Jharkhand Tribal Empowerment & Livelihoods Project (JTELP) 59
0 5 10 15 20 25 30 35 40
Goatary
Poultry Farming
Piggery
Cow/Buffalo Rearing
Tailoring
Kirana Shop
Pisci-culture
Agriculture
Handia Making
Vegetable Shop
Eatery Shop
Handicraft
Cosmetics Shop
Tussser Farming
Teacher
Soap Making
Beetle Shop
Lac Cultivaion
Cloth Store
Health Worker
Mushroom Farming
Contractor
Carpenter Shop
Vehicle Driver
Don't Know
Chart 37 : Preferred Income Generation Activity – Females (18-60 yrs.)
(34%)
(27%)
(6%)
(21%)
(1%)
(1%)
(1%)
(1%)
(1%)
(1%)
(1%)
(1%)
(1%)
(1%)
(1%)
(1%)
(1%)
(1%)
(1%)
(1%)
(1%)
(1%)
(1%)
(1%)
(5%)
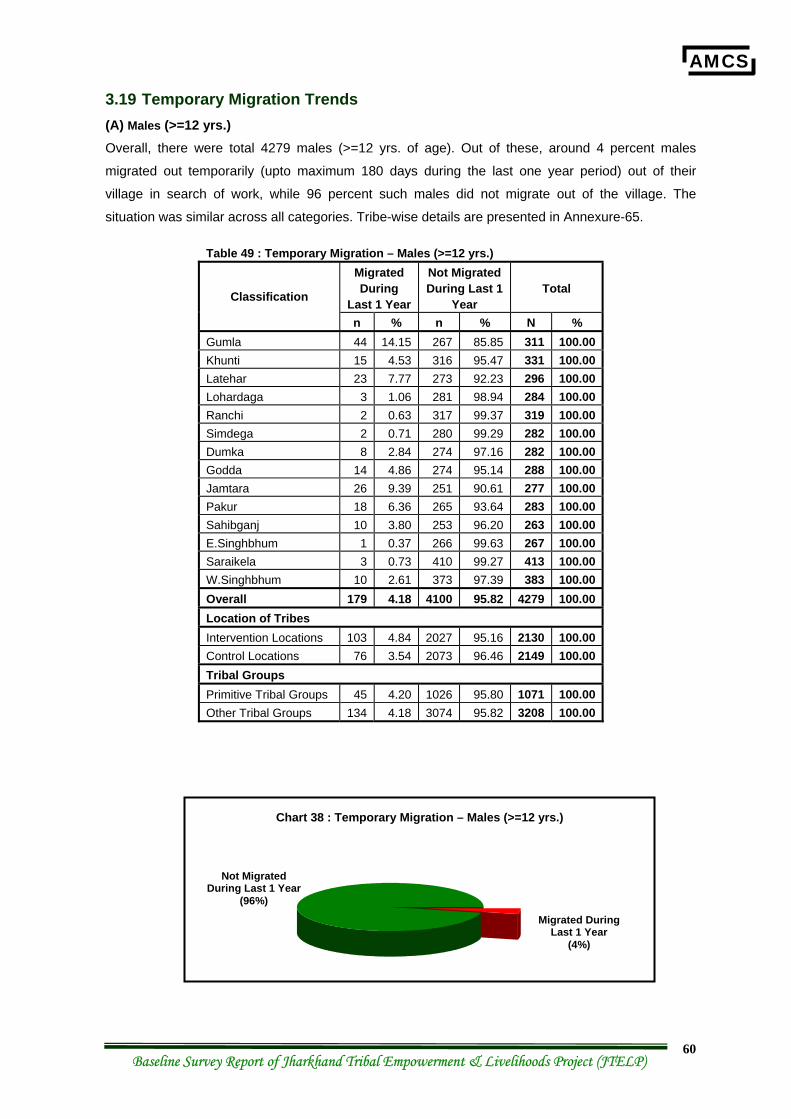
AMCS
Baseline Survey Report of Jharkhand Tribal Empowerment & Livelihoods Project (JTELP) 60
3.19 Temporary Migration Trends (A) Males (>=12 yrs.) Overall, there were total 4279 males (>=12 yrs. of age). Out of these, around 4 percent males
migrated out temporarily (upto maximum 180 days during the last one year period) out of their
village in search of work, while 96 percent such males did not migrate out of the village. The
situation was similar across all categories. Tribe-wise details are presented in Annexure-65.
Table 49 : Temporary Migration – Males (>=12 yrs.) Migrated During
Last 1 Year
Not Migrated During Last 1
Year Total Classification
n % n % N % Gumla 44 14.15 267 85.85 311 100.00 Khunti 15 4.53 316 95.47 331 100.00 Latehar 23 7.77 273 92.23 296 100.00 Lohardaga 3 1.06 281 98.94 284 100.00 Ranchi 2 0.63 317 99.37 319 100.00 Simdega 2 0.71 280 99.29 282 100.00 Dumka 8 2.84 274 97.16 282 100.00 Godda 14 4.86 274 95.14 288 100.00 Jamtara 26 9.39 251 90.61 277 100.00 Pakur 18 6.36 265 93.64 283 100.00 Sahibganj 10 3.80 253 96.20 263 100.00 E.Singhbhum 1 0.37 266 99.63 267 100.00 Saraikela 3 0.73 410 99.27 413 100.00 W.Singhbhum 10 2.61 373 97.39 383 100.00 Overall 179 4.18 4100 95.82 4279 100.00 Location of Tribes Intervention Locations 103 4.84 2027 95.16 2130 100.00 Control Locations 76 3.54 2073 96.46 2149 100.00 Tribal Groups Primitive Tribal Groups 45 4.20 1026 95.80 1071 100.00 Other Tribal Groups 134 4.18 3074 95.82 3208 100.00
Chart 38 : Temporary Migration – Males (>=12 yrs.)
Migrated During Last 1 Year
(4%)
Not Migrated During Last 1 Year
(96%)
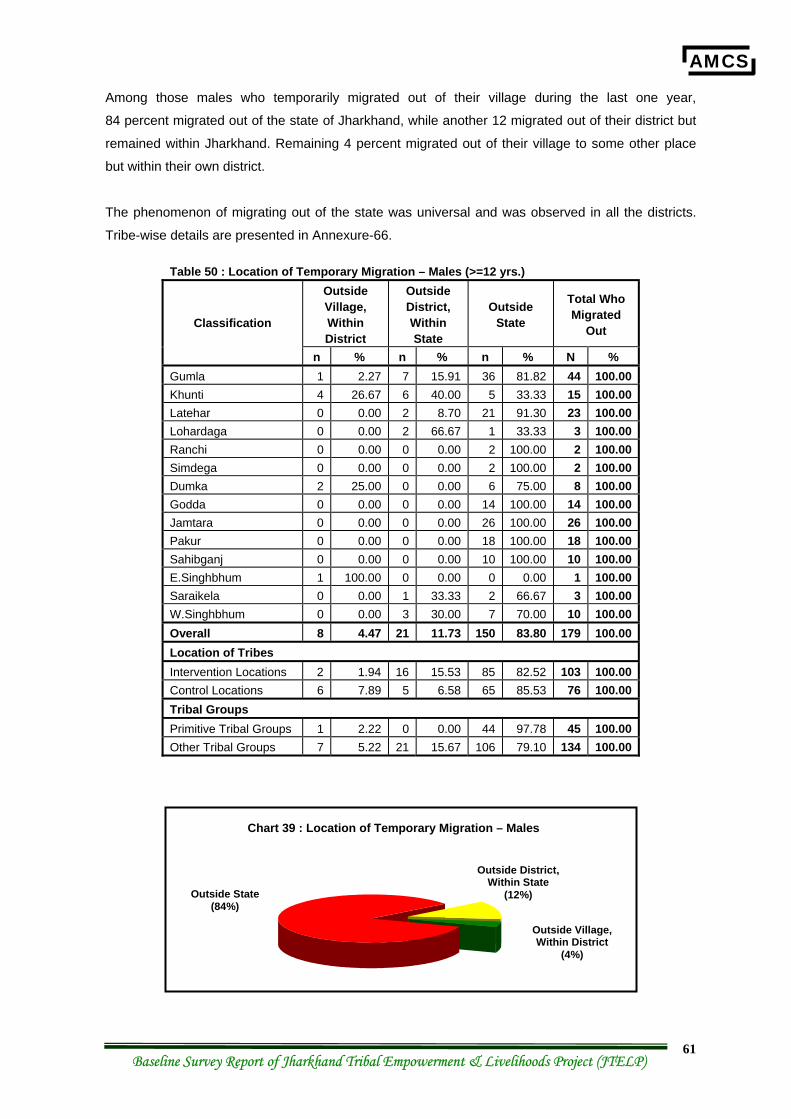
AMCS
Baseline Survey Report of Jharkhand Tribal Empowerment & Livelihoods Project (JTELP) 61
Among those males who temporarily migrated out of their village during the last one year,
84 percent migrated out of the state of Jharkhand, while another 12 migrated out of their district but
remained within Jharkhand. Remaining 4 percent migrated out of their village to some other place
but within their own district.
The phenomenon of migrating out of the state was universal and was observed in all the districts.
Tribe-wise details are presented in Annexure-66.
Table 50 : Location of Temporary Migration – Males (>=12 yrs.) Outside Village, Within District
Outside District, Within State
Outside State
Total Who Migrated
Out Classification
n % n % n % N % Gumla 1 2.27 7 15.91 36 81.82 44 100.00 Khunti 4 26.67 6 40.00 5 33.33 15 100.00 Latehar 0 0.00 2 8.70 21 91.30 23 100.00 Lohardaga 0 0.00 2 66.67 1 33.33 3 100.00 Ranchi 0 0.00 0 0.00 2 100.00 2 100.00 Simdega 0 0.00 0 0.00 2 100.00 2 100.00 Dumka 2 25.00 0 0.00 6 75.00 8 100.00 Godda 0 0.00 0 0.00 14 100.00 14 100.00 Jamtara 0 0.00 0 0.00 26 100.00 26 100.00 Pakur 0 0.00 0 0.00 18 100.00 18 100.00 Sahibganj 0 0.00 0 0.00 10 100.00 10 100.00 E.Singhbhum 1 100.00 0 0.00 0 0.00 1 100.00 Saraikela 0 0.00 1 33.33 2 66.67 3 100.00 W.Singhbhum 0 0.00 3 30.00 7 70.00 10 100.00 Overall 8 4.47 21 11.73 150 83.80 179 100.00 Location of Tribes Intervention Locations 2 1.94 16 15.53 85 82.52 103 100.00 Control Locations 6 7.89 5 6.58 65 85.53 76 100.00 Tribal Groups Primitive Tribal Groups 1 2.22 0 0.00 44 97.78 45 100.00 Other Tribal Groups 7 5.22 21 15.67 106 79.10 134 100.00
Chart 39 : Location of Temporary Migration – Males
Outside Village, Within District
(4%)
Outside State (84%)
Outside District, Within State
(12%)
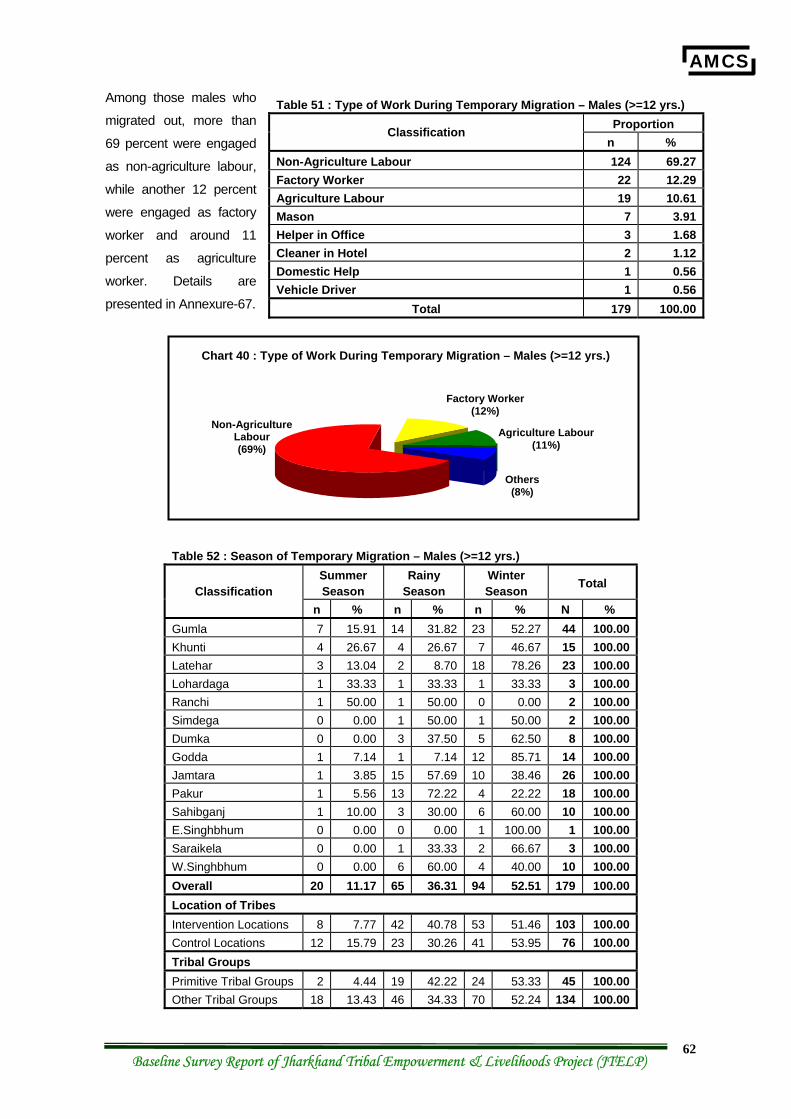
AMCS
Baseline Survey Report of Jharkhand Tribal Empowerment & Livelihoods Project (JTELP) 62
Among those males who
migrated out, more than
69 percent were engaged
as non-agriculture labour,
while another 12 percent
were engaged as factory
worker and around 11
percent as agriculture
worker. Details are
presented in Annexure-67.
Table 52 : Season of Temporary Migration – Males (>=12 yrs.) Summer Season
Rainy Season
Winter Season Total Classification
n % n % n % N % Gumla 7 15.91 14 31.82 23 52.27 44 100.00 Khunti 4 26.67 4 26.67 7 46.67 15 100.00 Latehar 3 13.04 2 8.70 18 78.26 23 100.00 Lohardaga 1 33.33 1 33.33 1 33.33 3 100.00 Ranchi 1 50.00 1 50.00 0 0.00 2 100.00 Simdega 0 0.00 1 50.00 1 50.00 2 100.00 Dumka 0 0.00 3 37.50 5 62.50 8 100.00 Godda 1 7.14 1 7.14 12 85.71 14 100.00 Jamtara 1 3.85 15 57.69 10 38.46 26 100.00 Pakur 1 5.56 13 72.22 4 22.22 18 100.00 Sahibganj 1 10.00 3 30.00 6 60.00 10 100.00 E.Singhbhum 0 0.00 0 0.00 1 100.00 1 100.00 Saraikela 0 0.00 1 33.33 2 66.67 3 100.00 W.Singhbhum 0 0.00 6 60.00 4 40.00 10 100.00 Overall 20 11.17 65 36.31 94 52.51 179 100.00 Location of Tribes Intervention Locations 8 7.77 42 40.78 53 51.46 103 100.00 Control Locations 12 15.79 23 30.26 41 53.95 76 100.00 Tribal Groups Primitive Tribal Groups 2 4.44 19 42.22 24 53.33 45 100.00 Other Tribal Groups 18 13.43 46 34.33 70 52.24 134 100.00
Table 51 : Type of Work During Temporary Migration – Males (>=12 yrs.) Proportion Classification
n % Non-Agriculture Labour 124 69.27Factory Worker 22 12.29Agriculture Labour 19 10.61Mason 7 3.91Helper in Office 3 1.68Cleaner in Hotel 2 1.12Domestic Help 1 0.56Vehicle Driver 1 0.56
Total 179 100.00
Chart 40 : Type of Work During Temporary Migration – Males (>=12 yrs.)
Agriculture Labour (11%)
Non-Agriculture Labour (69%)
Factory Worker (12%)
Others (8%)
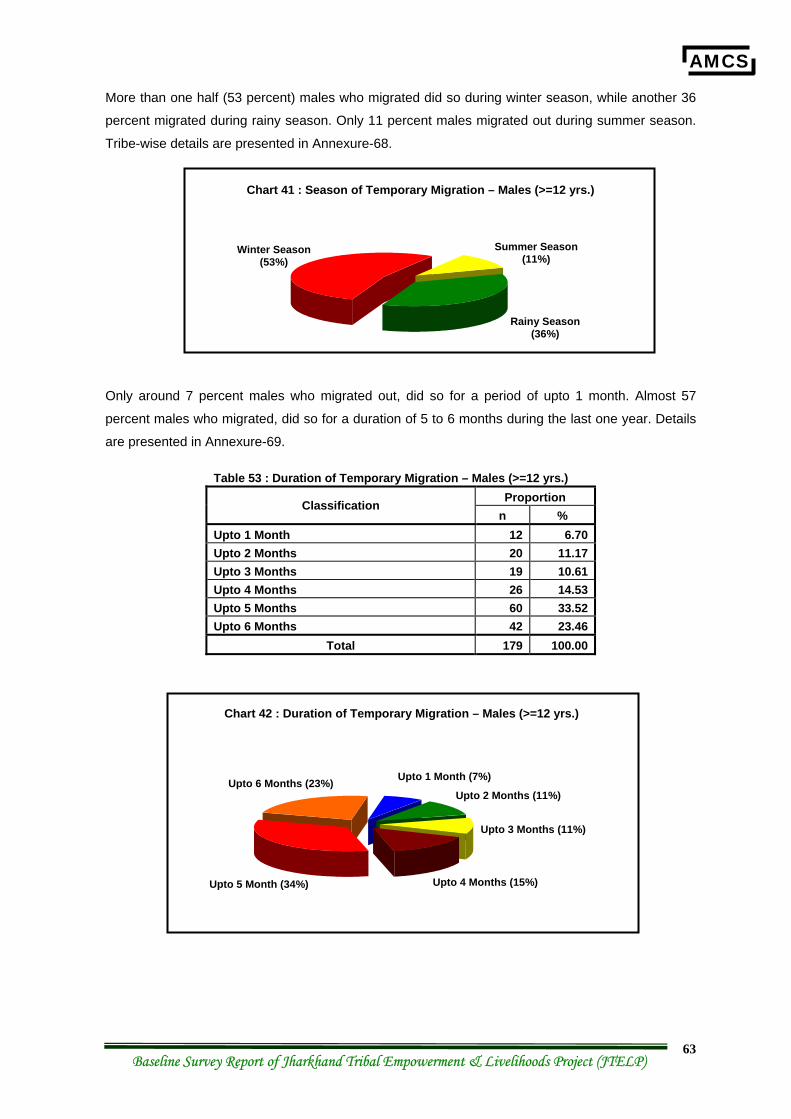
AMCS
Baseline Survey Report of Jharkhand Tribal Empowerment & Livelihoods Project (JTELP) 63
More than one half (53 percent) males who migrated did so during winter season, while another 36
percent migrated during rainy season. Only 11 percent males migrated out during summer season.
Tribe-wise details are presented in Annexure-68.
Only around 7 percent males who migrated out, did so for a period of upto 1 month. Almost 57
percent males who migrated, did so for a duration of 5 to 6 months during the last one year. Details
are presented in Annexure-69.
Table 53 : Duration of Temporary Migration – Males (>=12 yrs.) Proportion Classification
n % Upto 1 Month 12 6.70 Upto 2 Months 20 11.17 Upto 3 Months 19 10.61 Upto 4 Months 26 14.53 Upto 5 Months 60 33.52 Upto 6 Months 42 23.46
Total 179 100.00
Chart 41 : Season of Temporary Migration – Males (>=12 yrs.)
Winter Season (53%)
Rainy Season (36%)
Summer Season (11%)
Chart 42 : Duration of Temporary Migration – Males (>=12 yrs.)
Upto 1 Month (7%)
Upto 2 Months (11%)
Upto 3 Months (11%)
Upto 4 Months (15%) Upto 5 Month (34%)
Upto 6 Months (23%)
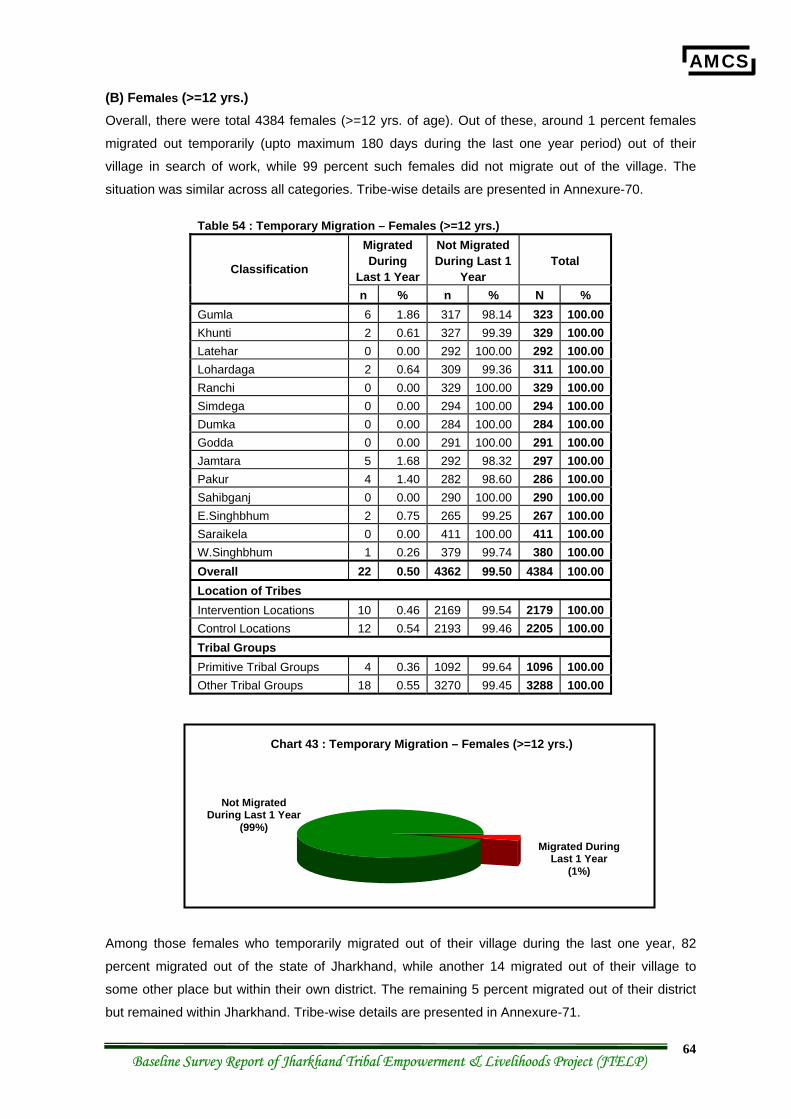
AMCS
Baseline Survey Report of Jharkhand Tribal Empowerment & Livelihoods Project (JTELP) 64
(B) Females (>=12 yrs.) Overall, there were total 4384 females (>=12 yrs. of age). Out of these, around 1 percent females
migrated out temporarily (upto maximum 180 days during the last one year period) out of their
village in search of work, while 99 percent such females did not migrate out of the village. The
situation was similar across all categories. Tribe-wise details are presented in Annexure-70.
Table 54 : Temporary Migration – Females (>=12 yrs.) Migrated During
Last 1 Year
Not Migrated During Last 1
Year Total Classification
n % n % N % Gumla 6 1.86 317 98.14 323 100.00 Khunti 2 0.61 327 99.39 329 100.00 Latehar 0 0.00 292 100.00 292 100.00 Lohardaga 2 0.64 309 99.36 311 100.00 Ranchi 0 0.00 329 100.00 329 100.00 Simdega 0 0.00 294 100.00 294 100.00 Dumka 0 0.00 284 100.00 284 100.00 Godda 0 0.00 291 100.00 291 100.00 Jamtara 5 1.68 292 98.32 297 100.00 Pakur 4 1.40 282 98.60 286 100.00 Sahibganj 0 0.00 290 100.00 290 100.00 E.Singhbhum 2 0.75 265 99.25 267 100.00 Saraikela 0 0.00 411 100.00 411 100.00 W.Singhbhum 1 0.26 379 99.74 380 100.00 Overall 22 0.50 4362 99.50 4384 100.00 Location of Tribes Intervention Locations 10 0.46 2169 99.54 2179 100.00 Control Locations 12 0.54 2193 99.46 2205 100.00 Tribal Groups Primitive Tribal Groups 4 0.36 1092 99.64 1096 100.00 Other Tribal Groups 18 0.55 3270 99.45 3288 100.00
Among those females who temporarily migrated out of their village during the last one year, 82
percent migrated out of the state of Jharkhand, while another 14 migrated out of their village to
some other place but within their own district. The remaining 5 percent migrated out of their district
but remained within Jharkhand. Tribe-wise details are presented in Annexure-71.
Chart 43 : Temporary Migration – Females (>=12 yrs.)
Migrated During Last 1 Year
(1%)
Not Migrated During Last 1 Year
(99%)
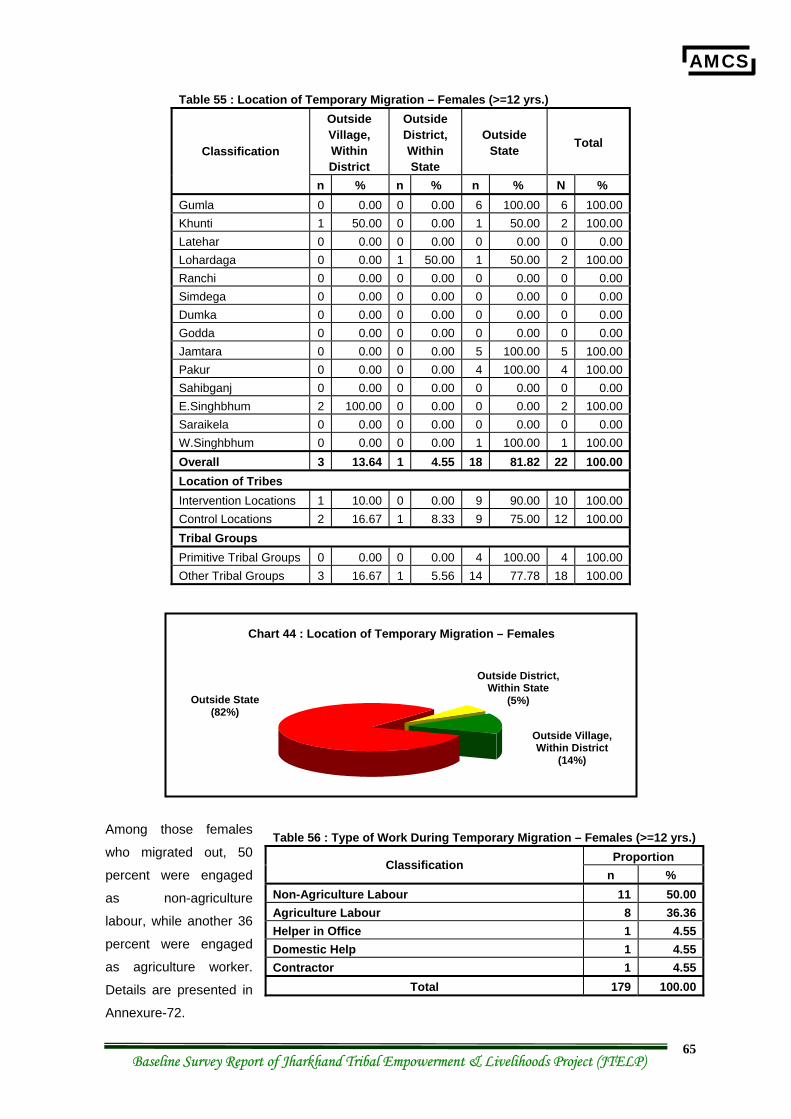
AMCS
Baseline Survey Report of Jharkhand Tribal Empowerment & Livelihoods Project (JTELP) 65
Table 55 : Location of Temporary Migration – Females (>=12 yrs.) Outside Village, Within District
Outside District, Within State
Outside State Total
Classification
n % n % n % N % Gumla 0 0.00 0 0.00 6 100.00 6 100.00 Khunti 1 50.00 0 0.00 1 50.00 2 100.00 Latehar 0 0.00 0 0.00 0 0.00 0 0.00 Lohardaga 0 0.00 1 50.00 1 50.00 2 100.00 Ranchi 0 0.00 0 0.00 0 0.00 0 0.00 Simdega 0 0.00 0 0.00 0 0.00 0 0.00 Dumka 0 0.00 0 0.00 0 0.00 0 0.00 Godda 0 0.00 0 0.00 0 0.00 0 0.00 Jamtara 0 0.00 0 0.00 5 100.00 5 100.00 Pakur 0 0.00 0 0.00 4 100.00 4 100.00 Sahibganj 0 0.00 0 0.00 0 0.00 0 0.00 E.Singhbhum 2 100.00 0 0.00 0 0.00 2 100.00 Saraikela 0 0.00 0 0.00 0 0.00 0 0.00 W.Singhbhum 0 0.00 0 0.00 1 100.00 1 100.00 Overall 3 13.64 1 4.55 18 81.82 22 100.00 Location of Tribes Intervention Locations 1 10.00 0 0.00 9 90.00 10 100.00 Control Locations 2 16.67 1 8.33 9 75.00 12 100.00 Tribal Groups Primitive Tribal Groups 0 0.00 0 0.00 4 100.00 4 100.00 Other Tribal Groups 3 16.67 1 5.56 14 77.78 18 100.00
Among those females
who migrated out, 50
percent were engaged
as non-agriculture
labour, while another 36
percent were engaged
as agriculture worker.
Details are presented in
Annexure-72.
Table 56 : Type of Work During Temporary Migration – Females (>=12 yrs.) Proportion Classification
n % Non-Agriculture Labour 11 50.00Agriculture Labour 8 36.36Helper in Office 1 4.55Domestic Help 1 4.55Contractor 1 4.55
Total 179 100.00
Chart 44 : Location of Temporary Migration – Females
Outside Village, Within District
(14%)
Outside State (82%)
Outside District, Within State
(5%)
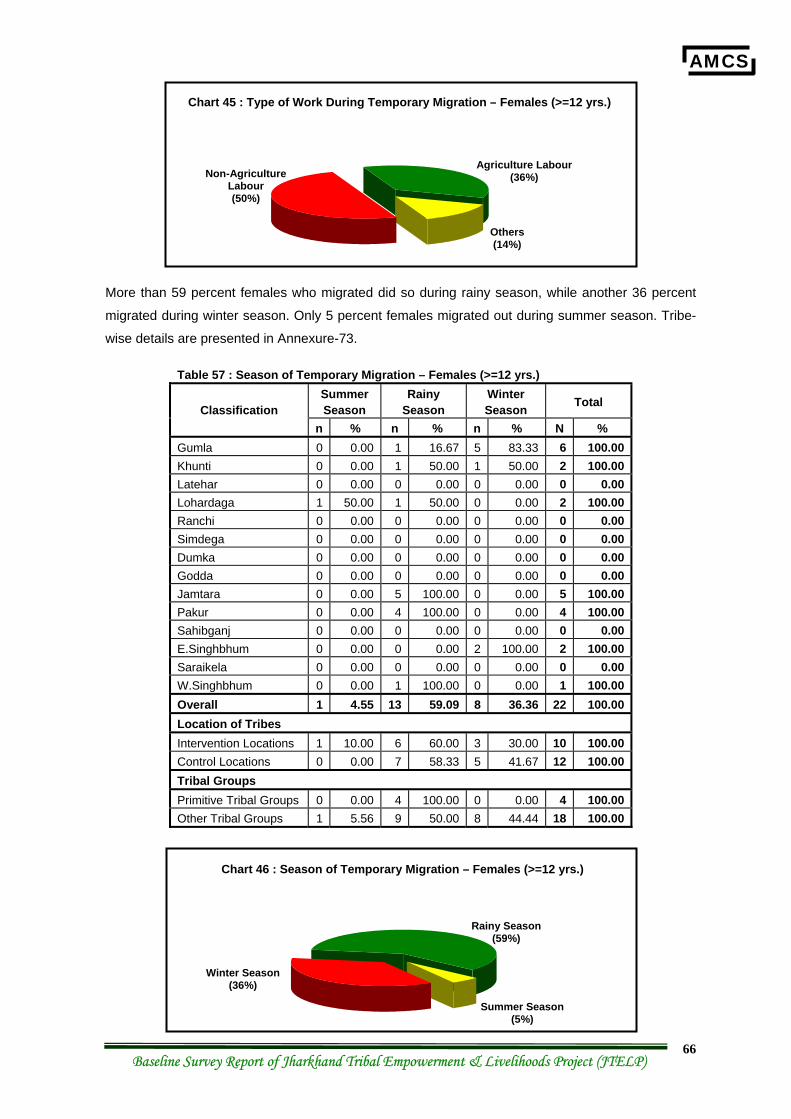
AMCS
Baseline Survey Report of Jharkhand Tribal Empowerment & Livelihoods Project (JTELP) 66
More than 59 percent females who migrated did so during rainy season, while another 36 percent
migrated during winter season. Only 5 percent females migrated out during summer season. Tribe-
wise details are presented in Annexure-73.
Table 57 : Season of Temporary Migration – Females (>=12 yrs.) Summer Season
Rainy Season
Winter Season Total Classification
n % n % n % N % Gumla 0 0.00 1 16.67 5 83.33 6 100.00 Khunti 0 0.00 1 50.00 1 50.00 2 100.00 Latehar 0 0.00 0 0.00 0 0.00 0 0.00 Lohardaga 1 50.00 1 50.00 0 0.00 2 100.00 Ranchi 0 0.00 0 0.00 0 0.00 0 0.00 Simdega 0 0.00 0 0.00 0 0.00 0 0.00 Dumka 0 0.00 0 0.00 0 0.00 0 0.00 Godda 0 0.00 0 0.00 0 0.00 0 0.00 Jamtara 0 0.00 5 100.00 0 0.00 5 100.00 Pakur 0 0.00 4 100.00 0 0.00 4 100.00 Sahibganj 0 0.00 0 0.00 0 0.00 0 0.00 E.Singhbhum 0 0.00 0 0.00 2 100.00 2 100.00 Saraikela 0 0.00 0 0.00 0 0.00 0 0.00 W.Singhbhum 0 0.00 1 100.00 0 0.00 1 100.00 Overall 1 4.55 13 59.09 8 36.36 22 100.00 Location of Tribes Intervention Locations 1 10.00 6 60.00 3 30.00 10 100.00 Control Locations 0 0.00 7 58.33 5 41.67 12 100.00 Tribal Groups Primitive Tribal Groups 0 0.00 4 100.00 0 0.00 4 100.00 Other Tribal Groups 1 5.56 9 50.00 8 44.44 18 100.00
Chart 45 : Type of Work During Temporary Migration – Females (>=12 yrs.)
Agriculture Labour (36%) Non-Agriculture
Labour (50%)
Others (14%)
Chart 46 : Season of Temporary Migration – Females (>=12 yrs.)
Winter Season (36%)
Rainy Season (59%)
Summer Season (5%)
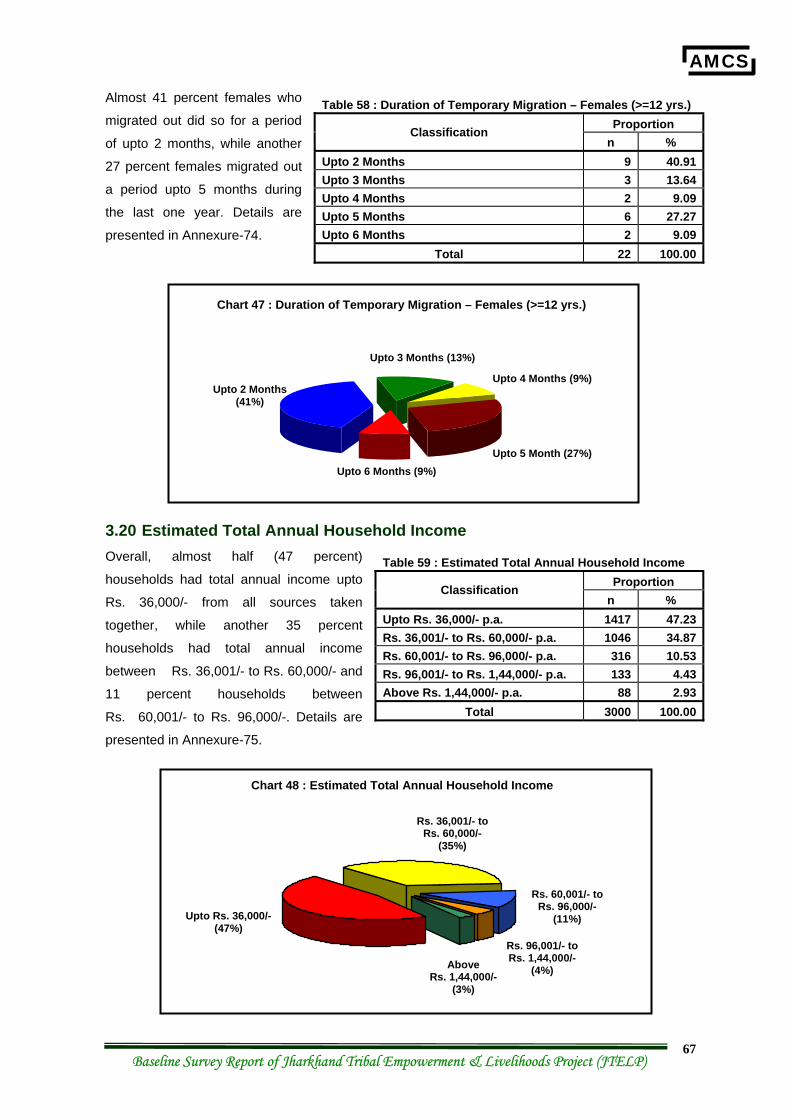
AMCS
Baseline Survey Report of Jharkhand Tribal Empowerment & Livelihoods Project (JTELP) 67
Almost 41 percent females who
migrated out did so for a period
of upto 2 months, while another
27 percent females migrated out
a period upto 5 months during
the last one year. Details are
presented in Annexure-74.
3.20 Estimated Total Annual Household Income Overall, almost half (47 percent)
households had total annual income upto
Rs. 36,000/- from all sources taken
together, while another 35 percent
households had total annual income
between Rs. 36,001/- to Rs. 60,000/- and
11 percent households between
Rs. 60,001/- to Rs. 96,000/-. Details are
presented in Annexure-75.
Table 58 : Duration of Temporary Migration – Females (>=12 yrs.) Proportion Classification
n % Upto 2 Months 9 40.91Upto 3 Months 3 13.64Upto 4 Months 2 9.09Upto 5 Months 6 27.27Upto 6 Months 2 9.09
Total 22 100.00
Table 59 : Estimated Total Annual Household Income Proportion Classification
n % Upto Rs. 36,000/- p.a. 1417 47.23Rs. 36,001/- to Rs. 60,000/- p.a. 1046 34.87Rs. 60,001/- to Rs. 96,000/- p.a. 316 10.53Rs. 96,001/- to Rs. 1,44,000/- p.a. 133 4.43Above Rs. 1,44,000/- p.a. 88 2.93
Total 3000 100.00
Chart 48 : Estimated Total Annual Household Income
Rs. 60,001/- to Rs. 96,000/-
(11%) Upto Rs. 36,000/- (47%)
Rs. 36,001/- to Rs. 60,000/-
(35%)
Rs. 96,001/- to Rs. 1,44,000/-
(4%) Above Rs. 1,44,000/-
(3%)
Chart 47 : Duration of Temporary Migration – Females (>=12 yrs.)
Upto 2 Months (41%)
Upto 3 Months (13%)
Upto 4 Months (9%)
Upto 5 Month (27%) Upto 6 Months (9%)
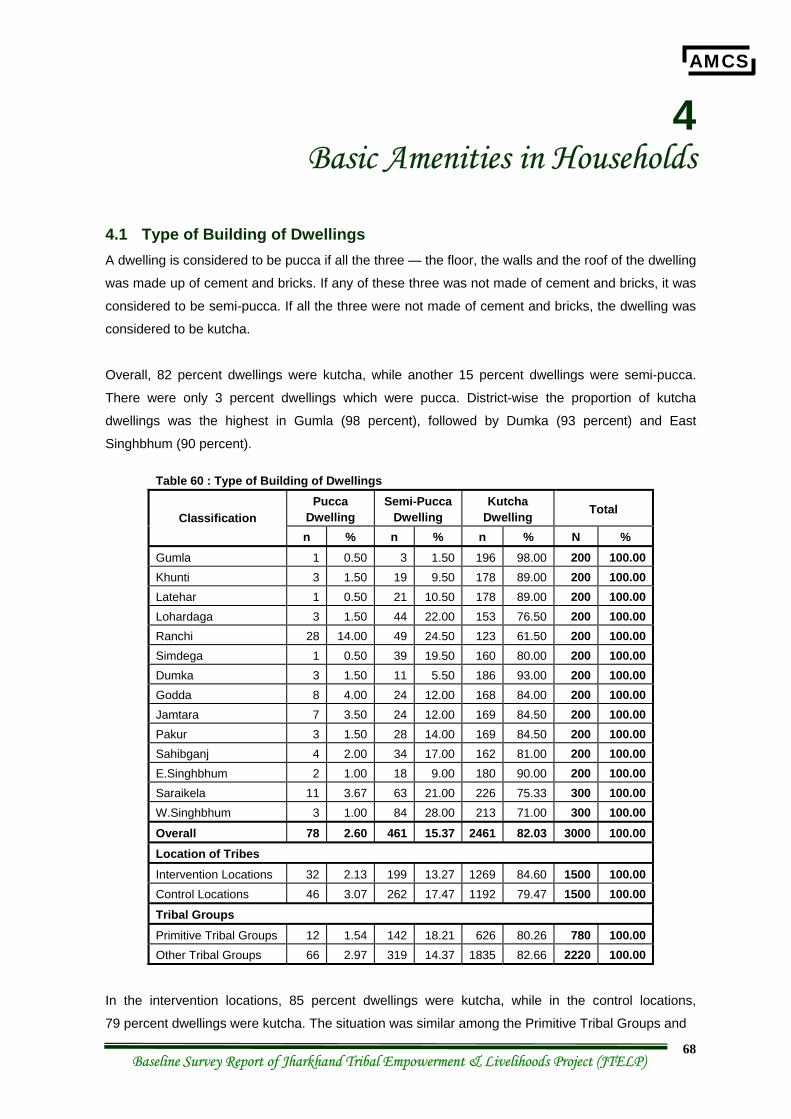
AMCS
Baseline Survey Report of Jharkhand Tribal Empowerment & Livelihoods Project (JTELP) 68
4 Basic Amenities in Households
4.1 Type of Building of Dwellings A dwelling is considered to be pucca if all the three — the floor, the walls and the roof of the dwelling
was made up of cement and bricks. If any of these three was not made of cement and bricks, it was
considered to be semi-pucca. If all the three were not made of cement and bricks, the dwelling was
considered to be kutcha.
Overall, 82 percent dwellings were kutcha, while another 15 percent dwellings were semi-pucca.
There were only 3 percent dwellings which were pucca. District-wise the proportion of kutcha
dwellings was the highest in Gumla (98 percent), followed by Dumka (93 percent) and East
Singhbhum (90 percent).
Table 60 : Type of Building of Dwellings Pucca
Dwelling Semi-Pucca
Dwelling Kutcha
Dwelling Total Classification
n % n % n % N % Gumla 1 0.50 3 1.50 196 98.00 200 100.00 Khunti 3 1.50 19 9.50 178 89.00 200 100.00 Latehar 1 0.50 21 10.50 178 89.00 200 100.00 Lohardaga 3 1.50 44 22.00 153 76.50 200 100.00 Ranchi 28 14.00 49 24.50 123 61.50 200 100.00 Simdega 1 0.50 39 19.50 160 80.00 200 100.00 Dumka 3 1.50 11 5.50 186 93.00 200 100.00 Godda 8 4.00 24 12.00 168 84.00 200 100.00 Jamtara 7 3.50 24 12.00 169 84.50 200 100.00 Pakur 3 1.50 28 14.00 169 84.50 200 100.00 Sahibganj 4 2.00 34 17.00 162 81.00 200 100.00 E.Singhbhum 2 1.00 18 9.00 180 90.00 200 100.00 Saraikela 11 3.67 63 21.00 226 75.33 300 100.00 W.Singhbhum 3 1.00 84 28.00 213 71.00 300 100.00 Overall 78 2.60 461 15.37 2461 82.03 3000 100.00 Location of Tribes Intervention Locations 32 2.13 199 13.27 1269 84.60 1500 100.00 Control Locations 46 3.07 262 17.47 1192 79.47 1500 100.00 Tribal Groups Primitive Tribal Groups 12 1.54 142 18.21 626 80.26 780 100.00 Other Tribal Groups 66 2.97 319 14.37 1835 82.66 2220 100.00
In the intervention locations, 85 percent dwellings were kutcha, while in the control locations,
79 percent dwellings were kutcha. The situation was similar among the Primitive Tribal Groups and
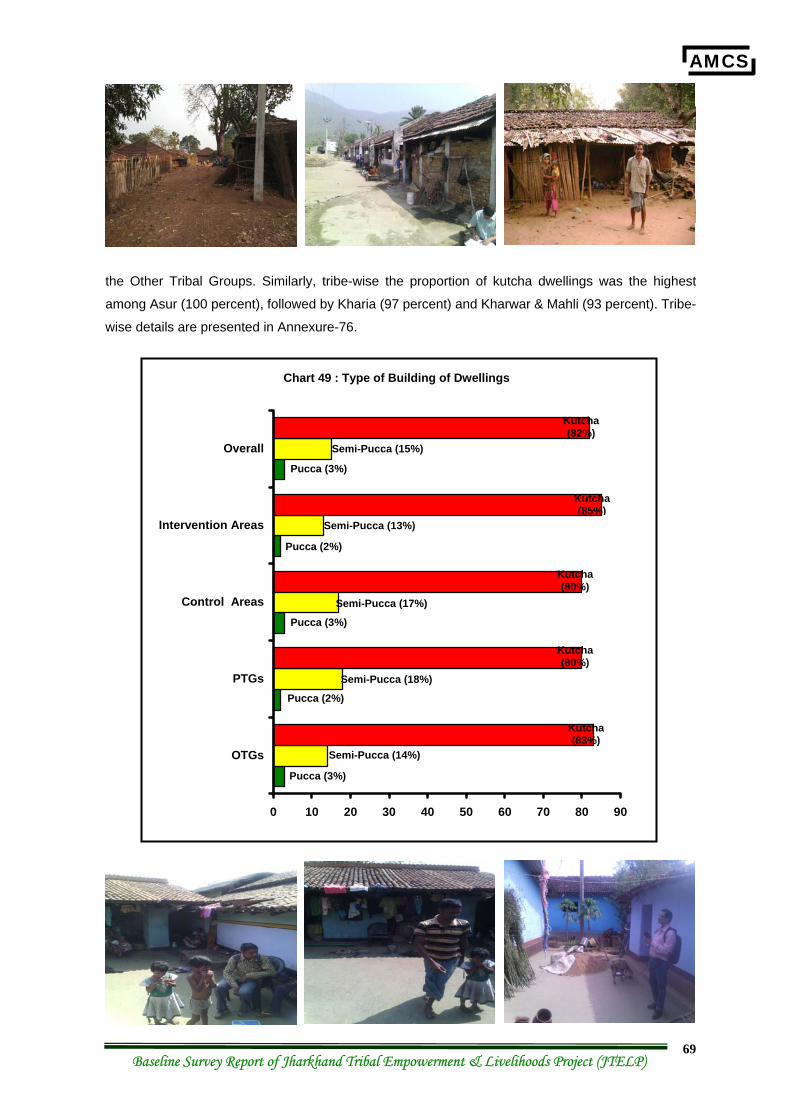
AMCS
Baseline Survey Report of Jharkhand Tribal Empowerment & Livelihoods Project (JTELP) 69
the Other Tribal Groups. Similarly, tribe-wise the proportion of kutcha dwellings was the highest
among Asur (100 percent), followed by Kharia (97 percent) and Kharwar & Mahli (93 percent). Tribe-
wise details are presented in Annexure-76.
0 10 20 30 40 50 60 70 80 90
OTGs
PTGs
Control Areas
Intervention Areas
Overall
Pucca (3%)
Kutcha (83%)
Semi-Pucca (14%)
Chart 49 : Type of Building of Dwellings
Pucca (2%)
Kutcha (80%)
Semi-Pucca (18%)
Pucca (3%)
Kutcha (80%)
Semi-Pucca (17%)
Pucca (2%)
Kutcha (85%)
Semi-Pucca (13%)
Pucca (3%)
Kutcha (82%)
Semi-Pucca (15%)
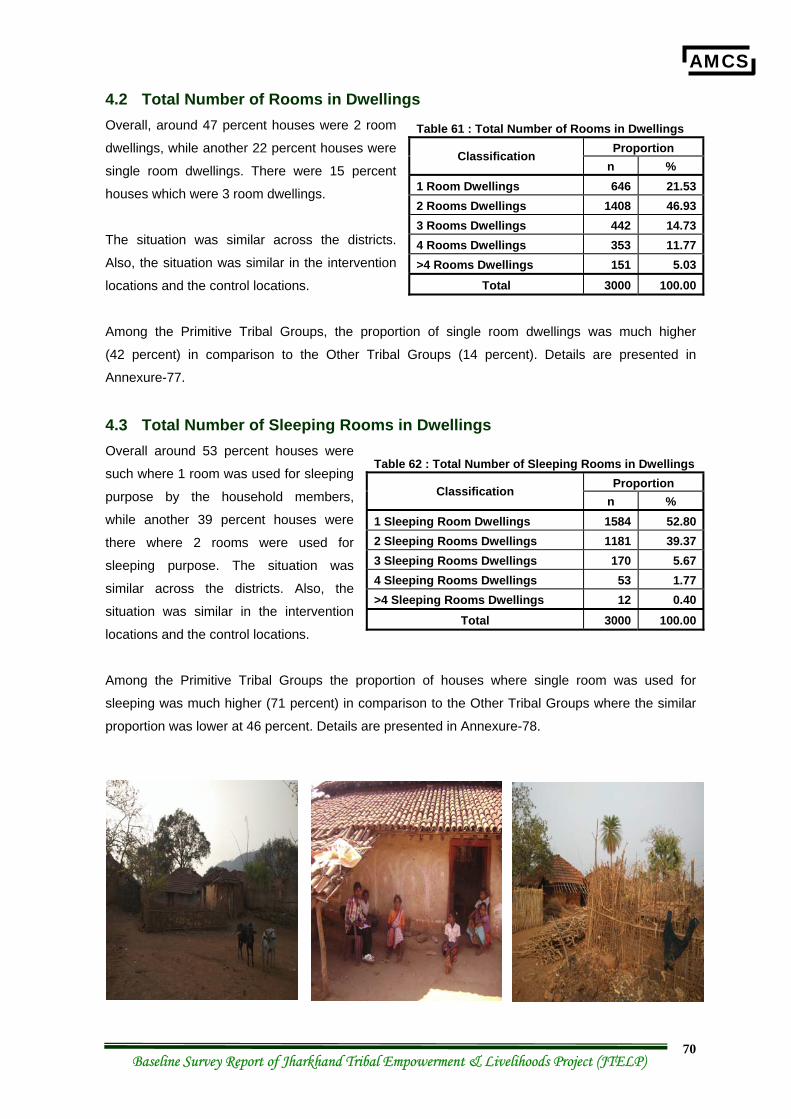
AMCS
Baseline Survey Report of Jharkhand Tribal Empowerment & Livelihoods Project (JTELP) 70
4.2 Total Number of Rooms in Dwellings Overall, around 47 percent houses were 2 room
dwellings, while another 22 percent houses were
single room dwellings. There were 15 percent
houses which were 3 room dwellings.
The situation was similar across the districts.
Also, the situation was similar in the intervention
locations and the control locations.
Among the Primitive Tribal Groups, the proportion of single room dwellings was much higher
(42 percent) in comparison to the Other Tribal Groups (14 percent). Details are presented in
Annexure-77.
4.3 Total Number of Sleeping Rooms in Dwellings Overall around 53 percent houses were
such where 1 room was used for sleeping
purpose by the household members,
while another 39 percent houses were
there where 2 rooms were used for
sleeping purpose. The situation was
similar across the districts. Also, the
situation was similar in the intervention
locations and the control locations.
Among the Primitive Tribal Groups the proportion of houses where single room was used for
sleeping was much higher (71 percent) in comparison to the Other Tribal Groups where the similar
proportion was lower at 46 percent. Details are presented in Annexure-78.
Table 61 : Total Number of Rooms in Dwellings Proportion Classification
n % 1 Room Dwellings 646 21.532 Rooms Dwellings 1408 46.933 Rooms Dwellings 442 14.734 Rooms Dwellings 353 11.77>4 Rooms Dwellings 151 5.03
Total 3000 100.00
Table 62 : Total Number of Sleeping Rooms in Dwellings Proportion Classification
n % 1 Sleeping Room Dwellings 1584 52.802 Sleeping Rooms Dwellings 1181 39.373 Sleeping Rooms Dwellings 170 5.674 Sleeping Rooms Dwellings 53 1.77>4 Sleeping Rooms Dwellings 12 0.40
Total 3000 100.00
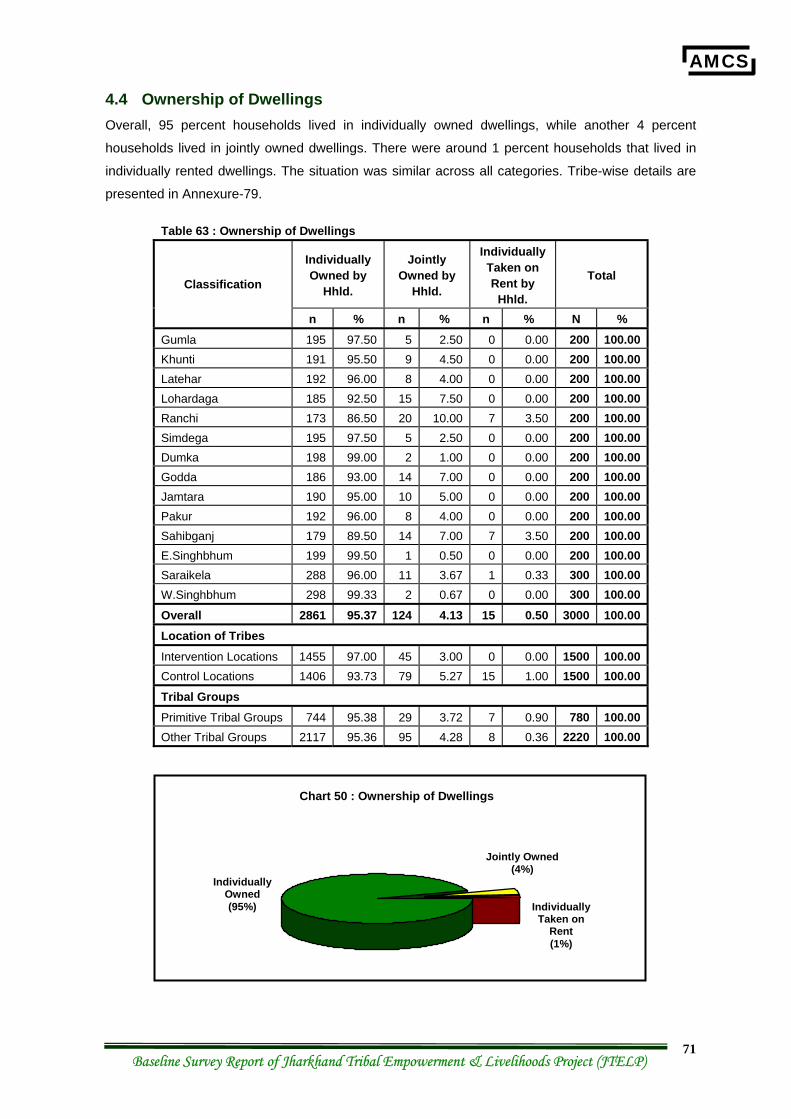
AMCS
Baseline Survey Report of Jharkhand Tribal Empowerment & Livelihoods Project (JTELP) 71
4.4 Ownership of Dwellings Overall, 95 percent households lived in individually owned dwellings, while another 4 percent
households lived in jointly owned dwellings. There were around 1 percent households that lived in
individually rented dwellings. The situation was similar across all categories. Tribe-wise details are
presented in Annexure-79.
Table 63 : Ownership of Dwellings
Individually Owned by
Hhld.
Jointly Owned by
Hhld.
Individually Taken on Rent by
Hhld.
Total Classification
n % n % n % N % Gumla 195 97.50 5 2.50 0 0.00 200 100.00 Khunti 191 95.50 9 4.50 0 0.00 200 100.00 Latehar 192 96.00 8 4.00 0 0.00 200 100.00 Lohardaga 185 92.50 15 7.50 0 0.00 200 100.00 Ranchi 173 86.50 20 10.00 7 3.50 200 100.00 Simdega 195 97.50 5 2.50 0 0.00 200 100.00 Dumka 198 99.00 2 1.00 0 0.00 200 100.00 Godda 186 93.00 14 7.00 0 0.00 200 100.00 Jamtara 190 95.00 10 5.00 0 0.00 200 100.00 Pakur 192 96.00 8 4.00 0 0.00 200 100.00 Sahibganj 179 89.50 14 7.00 7 3.50 200 100.00 E.Singhbhum 199 99.50 1 0.50 0 0.00 200 100.00 Saraikela 288 96.00 11 3.67 1 0.33 300 100.00 W.Singhbhum 298 99.33 2 0.67 0 0.00 300 100.00 Overall 2861 95.37 124 4.13 15 0.50 3000 100.00 Location of Tribes Intervention Locations 1455 97.00 45 3.00 0 0.00 1500 100.00 Control Locations 1406 93.73 79 5.27 15 1.00 1500 100.00 Tribal Groups Primitive Tribal Groups 744 95.38 29 3.72 7 0.90 780 100.00 Other Tribal Groups 2117 95.36 95 4.28 8 0.36 2220 100.00
Chart 50 : Ownership of Dwellings
Individually Owned (95%)
Jointly Owned (4%)
Individually Taken on
Rent (1%)
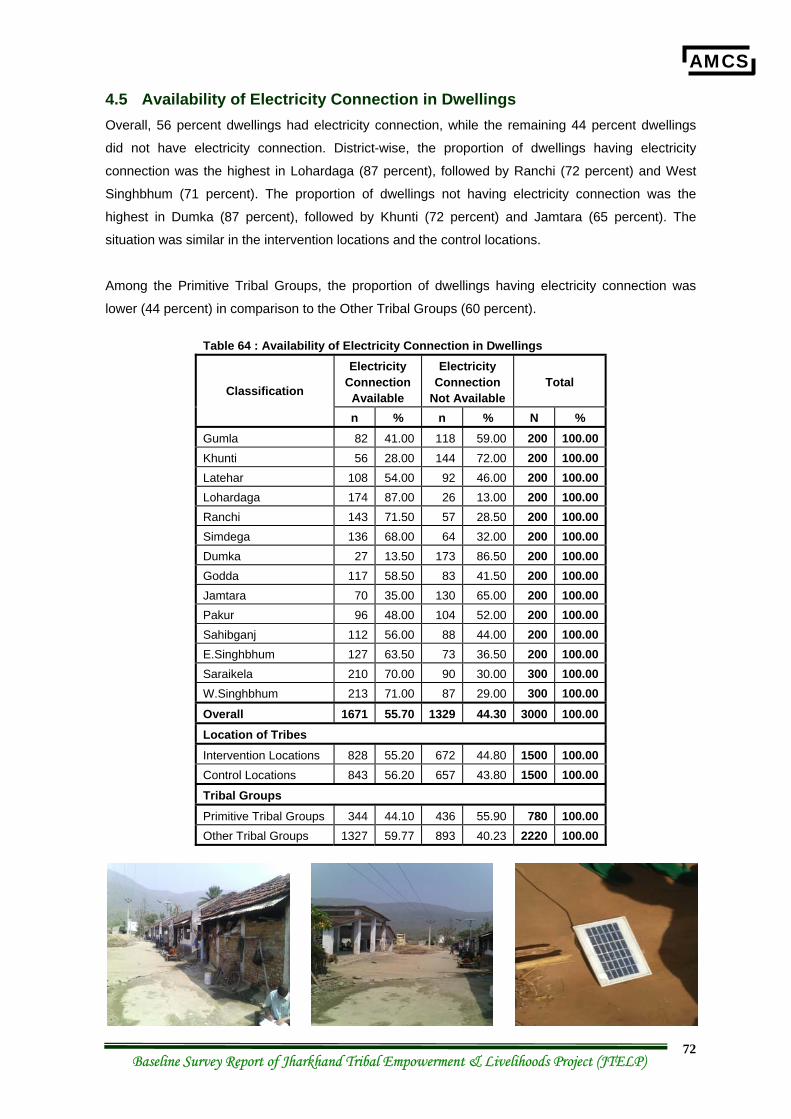
AMCS
Baseline Survey Report of Jharkhand Tribal Empowerment & Livelihoods Project (JTELP) 72
4.5 Availability of Electricity Connection in Dwellings Overall, 56 percent dwellings had electricity connection, while the remaining 44 percent dwellings
did not have electricity connection. District-wise, the proportion of dwellings having electricity
connection was the highest in Lohardaga (87 percent), followed by Ranchi (72 percent) and West
Singhbhum (71 percent). The proportion of dwellings not having electricity connection was the
highest in Dumka (87 percent), followed by Khunti (72 percent) and Jamtara (65 percent). The
situation was similar in the intervention locations and the control locations.
Among the Primitive Tribal Groups, the proportion of dwellings having electricity connection was
lower (44 percent) in comparison to the Other Tribal Groups (60 percent).
Table 64 : Availability of Electricity Connection in Dwellings Electricity
Connection Available
Electricity Connection
Not Available Total
Classification
n % n % N % Gumla 82 41.00 118 59.00 200 100.00 Khunti 56 28.00 144 72.00 200 100.00 Latehar 108 54.00 92 46.00 200 100.00 Lohardaga 174 87.00 26 13.00 200 100.00 Ranchi 143 71.50 57 28.50 200 100.00 Simdega 136 68.00 64 32.00 200 100.00 Dumka 27 13.50 173 86.50 200 100.00 Godda 117 58.50 83 41.50 200 100.00 Jamtara 70 35.00 130 65.00 200 100.00 Pakur 96 48.00 104 52.00 200 100.00 Sahibganj 112 56.00 88 44.00 200 100.00 E.Singhbhum 127 63.50 73 36.50 200 100.00 Saraikela 210 70.00 90 30.00 300 100.00 W.Singhbhum 213 71.00 87 29.00 300 100.00 Overall 1671 55.70 1329 44.30 3000 100.00 Location of Tribes Intervention Locations 828 55.20 672 44.80 1500 100.00 Control Locations 843 56.20 657 43.80 1500 100.00 Tribal Groups Primitive Tribal Groups 344 44.10 436 55.90 780 100.00 Other Tribal Groups 1327 59.77 893 40.23 2220 100.00
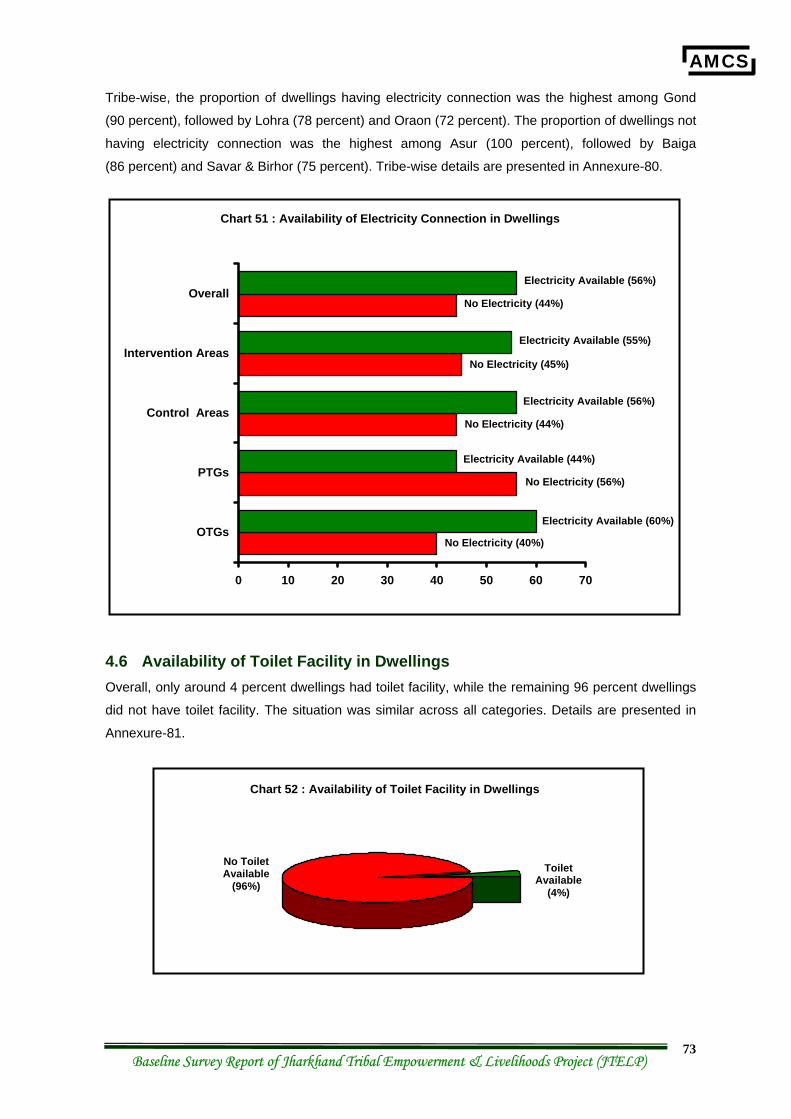
AMCS
Baseline Survey Report of Jharkhand Tribal Empowerment & Livelihoods Project (JTELP) 73
Tribe-wise, the proportion of dwellings having electricity connection was the highest among Gond
(90 percent), followed by Lohra (78 percent) and Oraon (72 percent). The proportion of dwellings not
having electricity connection was the highest among Asur (100 percent), followed by Baiga
(86 percent) and Savar & Birhor (75 percent). Tribe-wise details are presented in Annexure-80.
4.6 Availability of Toilet Facility in Dwellings Overall, only around 4 percent dwellings had toilet facility, while the remaining 96 percent dwellings
did not have toilet facility. The situation was similar across all categories. Details are presented in
Annexure-81.
Chart 51 : Availability of Electricity Connection in Dwellings
Electricity Available (56%)
No Electricity (44%)
Electricity Available (55%)
No Electricity (45%)
Electricity Available (56%)
No Electricity (44%)
Electricity Available (44%)
No Electricity (56%)
Electricity Available (60%)
No Electricity (40%)
0 10 20 30 40 50 60 70
OTGs
PTGs
Control Areas
Intervention Areas
Overall
Chart 52 : Availability of Toilet Facility in Dwellings
Toilet Available
(4%)
No Toilet Available
(96%)
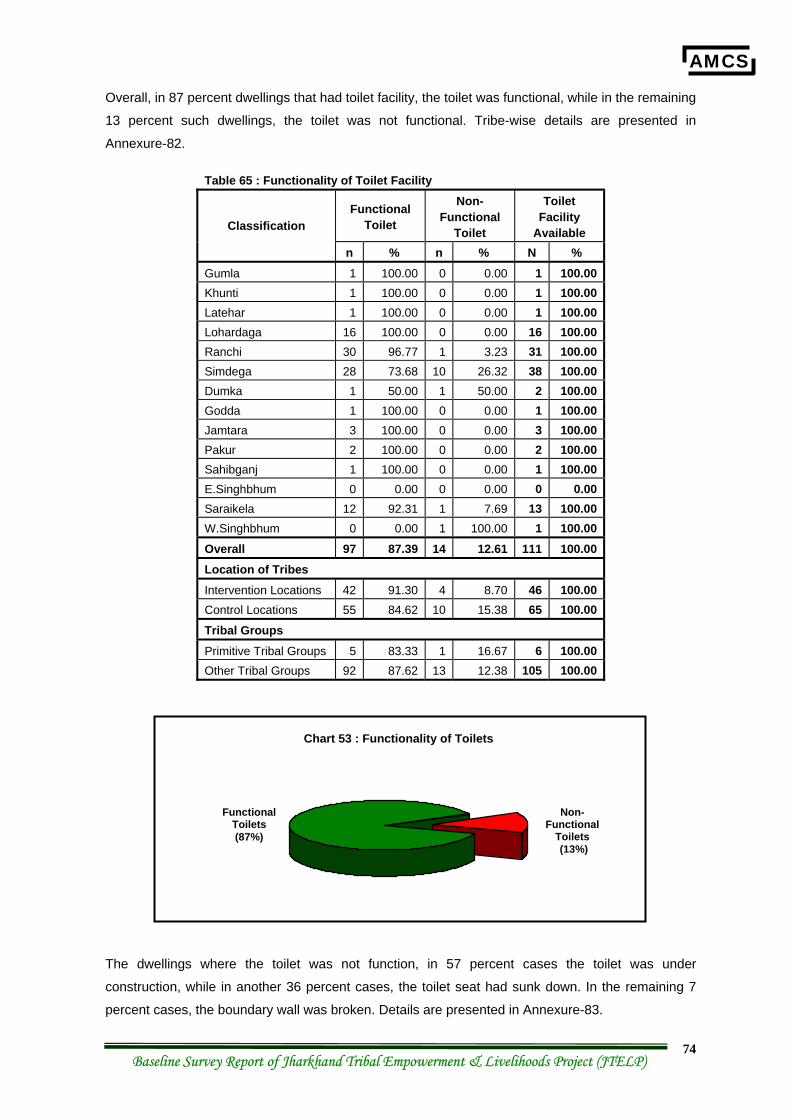
AMCS
Baseline Survey Report of Jharkhand Tribal Empowerment & Livelihoods Project (JTELP) 74
Overall, in 87 percent dwellings that had toilet facility, the toilet was functional, while in the remaining
13 percent such dwellings, the toilet was not functional. Tribe-wise details are presented in
Annexure-82.
Table 65 : Functionality of Toilet Facility
Functional Toilet
Non-Functional
Toilet
Toilet Facility
Available Classification
n % n % N % Gumla 1 100.00 0 0.00 1 100.00 Khunti 1 100.00 0 0.00 1 100.00 Latehar 1 100.00 0 0.00 1 100.00 Lohardaga 16 100.00 0 0.00 16 100.00 Ranchi 30 96.77 1 3.23 31 100.00 Simdega 28 73.68 10 26.32 38 100.00 Dumka 1 50.00 1 50.00 2 100.00 Godda 1 100.00 0 0.00 1 100.00 Jamtara 3 100.00 0 0.00 3 100.00 Pakur 2 100.00 0 0.00 2 100.00 Sahibganj 1 100.00 0 0.00 1 100.00 E.Singhbhum 0 0.00 0 0.00 0 0.00 Saraikela 12 92.31 1 7.69 13 100.00 W.Singhbhum 0 0.00 1 100.00 1 100.00 Overall 97 87.39 14 12.61 111 100.00 Location of Tribes Intervention Locations 42 91.30 4 8.70 46 100.00 Control Locations 55 84.62 10 15.38 65 100.00 Tribal Groups Primitive Tribal Groups 5 83.33 1 16.67 6 100.00 Other Tribal Groups 92 87.62 13 12.38 105 100.00
The dwellings where the toilet was not function, in 57 percent cases the toilet was under
construction, while in another 36 percent cases, the toilet seat had sunk down. In the remaining 7
percent cases, the boundary wall was broken. Details are presented in Annexure-83.
Chart 53 : Functionality of Toilets
Non-Functional
Toilets (13%)
Functional Toilets (87%)
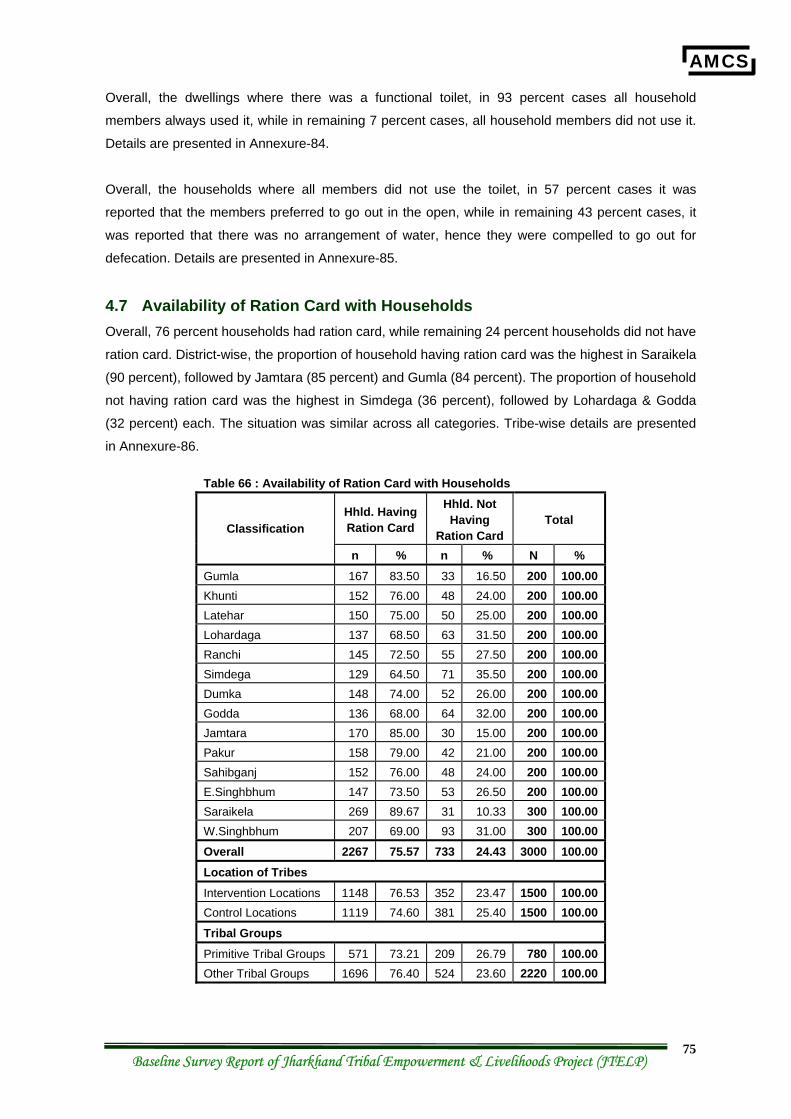
AMCS
Baseline Survey Report of Jharkhand Tribal Empowerment & Livelihoods Project (JTELP) 75
Overall, the dwellings where there was a functional toilet, in 93 percent cases all household
members always used it, while in remaining 7 percent cases, all household members did not use it.
Details are presented in Annexure-84.
Overall, the households where all members did not use the toilet, in 57 percent cases it was
reported that the members preferred to go out in the open, while in remaining 43 percent cases, it
was reported that there was no arrangement of water, hence they were compelled to go out for
defecation. Details are presented in Annexure-85.
4.7 Availability of Ration Card with Households Overall, 76 percent households had ration card, while remaining 24 percent households did not have
ration card. District-wise, the proportion of household having ration card was the highest in Saraikela
(90 percent), followed by Jamtara (85 percent) and Gumla (84 percent). The proportion of household
not having ration card was the highest in Simdega (36 percent), followed by Lohardaga & Godda
(32 percent) each. The situation was similar across all categories. Tribe-wise details are presented
in Annexure-86.
Table 66 : Availability of Ration Card with Households
Hhld. Having Ration Card
Hhld. Not Having
Ration Card Total
Classification
n % n % N % Gumla 167 83.50 33 16.50 200 100.00 Khunti 152 76.00 48 24.00 200 100.00 Latehar 150 75.00 50 25.00 200 100.00 Lohardaga 137 68.50 63 31.50 200 100.00 Ranchi 145 72.50 55 27.50 200 100.00 Simdega 129 64.50 71 35.50 200 100.00 Dumka 148 74.00 52 26.00 200 100.00 Godda 136 68.00 64 32.00 200 100.00 Jamtara 170 85.00 30 15.00 200 100.00 Pakur 158 79.00 42 21.00 200 100.00 Sahibganj 152 76.00 48 24.00 200 100.00 E.Singhbhum 147 73.50 53 26.50 200 100.00 Saraikela 269 89.67 31 10.33 300 100.00 W.Singhbhum 207 69.00 93 31.00 300 100.00 Overall 2267 75.57 733 24.43 3000 100.00 Location of Tribes Intervention Locations 1148 76.53 352 23.47 1500 100.00 Control Locations 1119 74.60 381 25.40 1500 100.00 Tribal Groups Primitive Tribal Groups 571 73.21 209 26.79 780 100.00 Other Tribal Groups 1696 76.40 524 23.60 2220 100.00
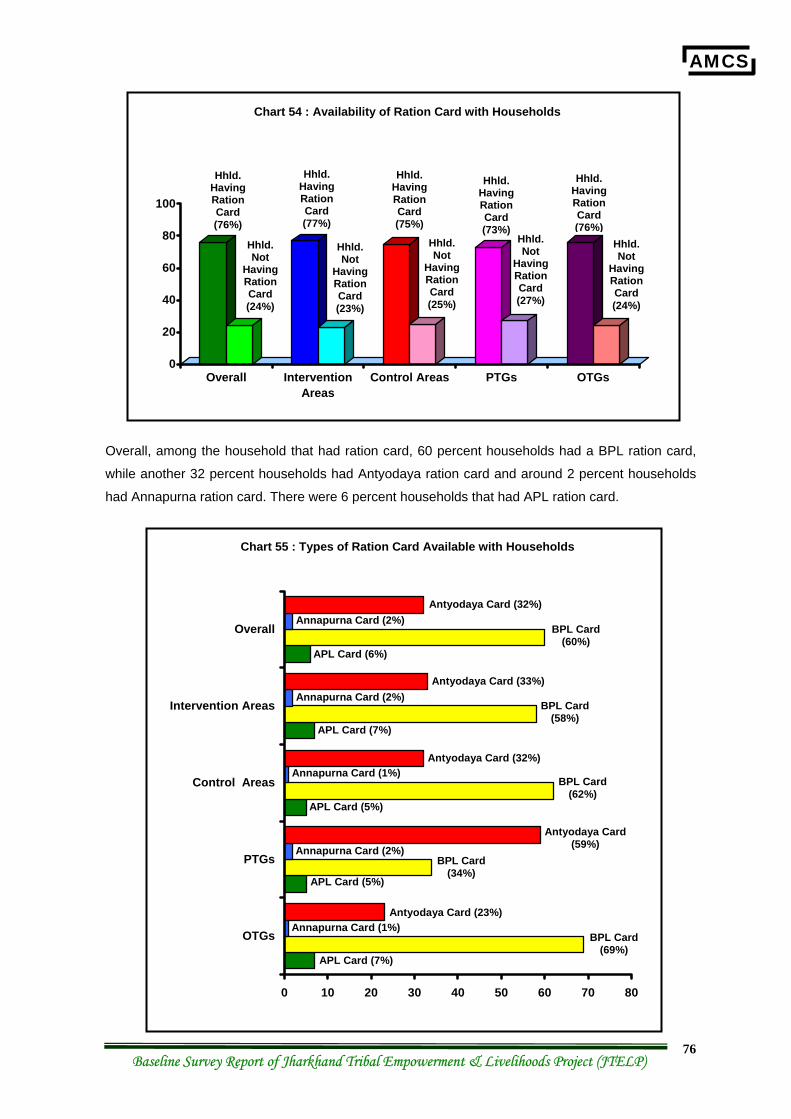
AMCS
Baseline Survey Report of Jharkhand Tribal Empowerment & Livelihoods Project (JTELP) 76
Overall, among the household that had ration card, 60 percent households had a BPL ration card,
while another 32 percent households had Antyodaya ration card and around 2 percent households
had Annapurna ration card. There were 6 percent households that had APL ration card.
0
20
40
60
80
100
Overall InterventionAreas
Control Areas PTGs OTGs
Chart 54 : Availability of Ration Card with Households
Hhld. Not
Having Ration Card (24%)
Hhld. Having Ration Card (76%)
Hhld. Not
Having Ration Card (23%)
Hhld. Having Ration Card (77%)
Hhld. Not
Having Ration Card (25%)
Hhld. Having Ration Card (75%)
Hhld. Not
Having Ration Card (27%)
Hhld. Having Ration Card (73%)
Hhld. Not
Having Ration Card (24%)
Hhld. Having Ration Card (76%)
0 10 20 30 40 50 60 70 80
OTGs
PTGs
Control Areas
Intervention Areas
Overall
Chart 55 : Types of Ration Card Available with Households
Antyodaya Card (23%)
BPL Card (69%)
APL Card (7%)
Annapurna Card (1%)
Antyodaya Card (59%)
BPL Card (34%)
APL Card (5%)
Annapurna Card (2%)
Antyodaya Card (32%)
BPL Card (62%)
APL Card (5%)
Annapurna Card (1%)
Antyodaya Card (32%)
BPL Card (60%)
APL Card (6%)
Annapurna Card (2%)
Antyodaya Card (33%)
BPL Card (58%)
APL Card (7%)
Annapurna Card (2%)
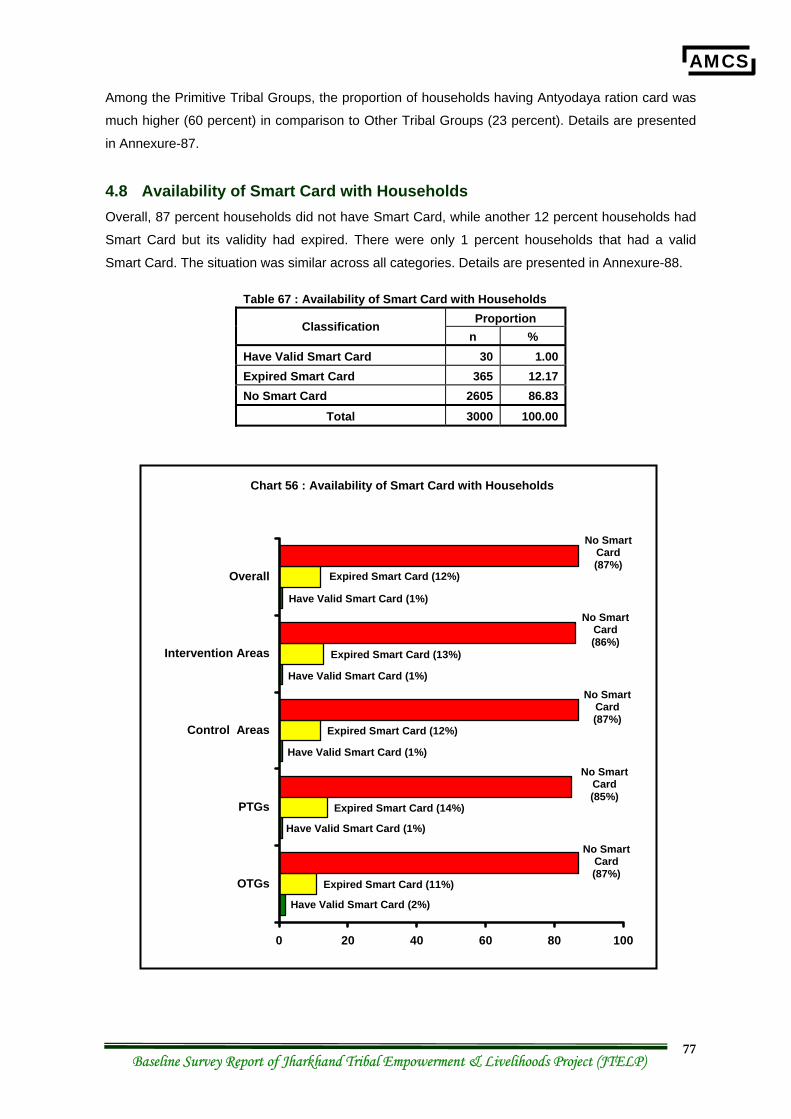
AMCS
Baseline Survey Report of Jharkhand Tribal Empowerment & Livelihoods Project (JTELP) 77
Among the Primitive Tribal Groups, the proportion of households having Antyodaya ration card was
much higher (60 percent) in comparison to Other Tribal Groups (23 percent). Details are presented
in Annexure-87.
4.8 Availability of Smart Card with Households Overall, 87 percent households did not have Smart Card, while another 12 percent households had
Smart Card but its validity had expired. There were only 1 percent households that had a valid
Smart Card. The situation was similar across all categories. Details are presented in Annexure-88.
Table 67 : Availability of Smart Card with Households Proportion Classification
n % Have Valid Smart Card 30 1.00Expired Smart Card 365 12.17No Smart Card 2605 86.83
Total 3000 100.00
0 20 40 60 80 100
OTGs
PTGs
Control Areas
Intervention Areas
Overall
Chart 56 : Availability of Smart Card with Households
Expired Smart Card (12%)
No Smart Card (87%)
Have Valid Smart Card (1%)
Expired Smart Card (13%)
No Smart Card (86%)
Have Valid Smart Card (1%)
Expired Smart Card (12%)
No Smart Card (87%)
Have Valid Smart Card (1%)
Expired Smart Card (14%)
No Smart Card (85%)
Have Valid Smart Card (1%)
Expired Smart Card (11%)
No Smart Card (87%)
Have Valid Smart Card (2%)
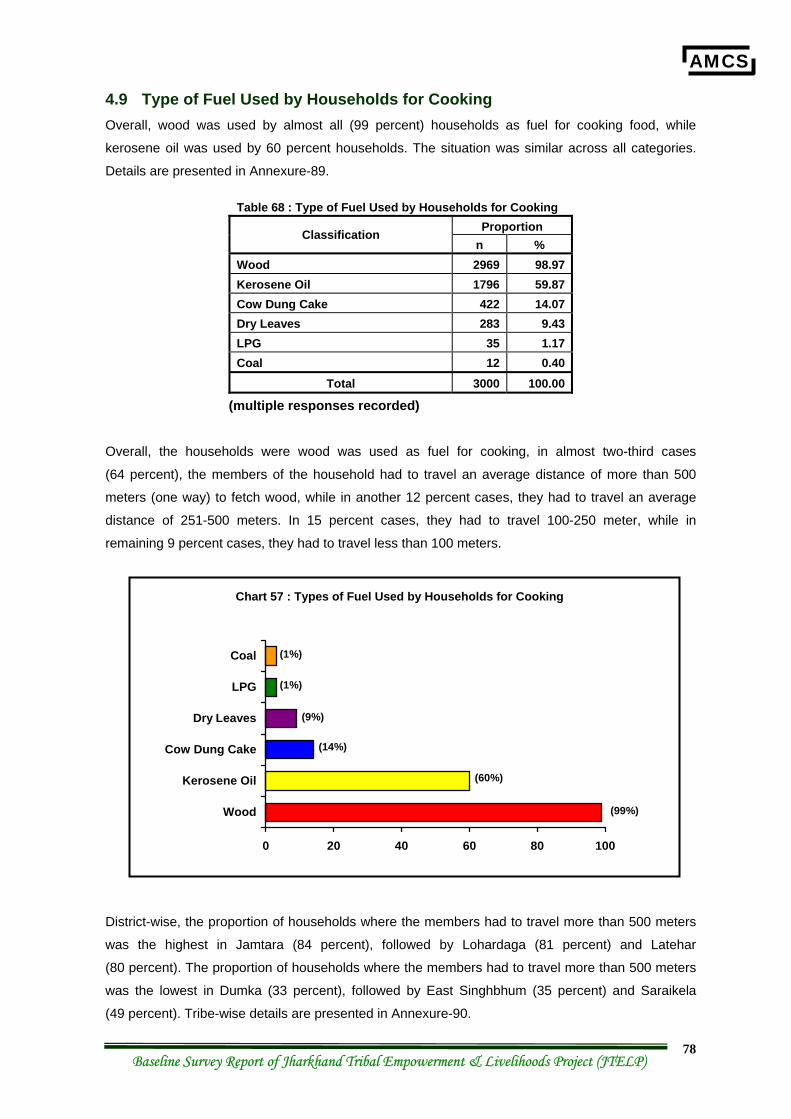
AMCS
Baseline Survey Report of Jharkhand Tribal Empowerment & Livelihoods Project (JTELP) 78
4.9 Type of Fuel Used by Households for Cooking Overall, wood was used by almost all (99 percent) households as fuel for cooking food, while
kerosene oil was used by 60 percent households. The situation was similar across all categories.
Details are presented in Annexure-89.
Table 68 : Type of Fuel Used by Households for Cooking Proportion Classification
n % Wood 2969 98.97 Kerosene Oil 1796 59.87 Cow Dung Cake 422 14.07 Dry Leaves 283 9.43 LPG 35 1.17 Coal 12 0.40
Total 3000 100.00
(multiple responses recorded)
Overall, the households were wood was used as fuel for cooking, in almost two-third cases
(64 percent), the members of the household had to travel an average distance of more than 500
meters (one way) to fetch wood, while in another 12 percent cases, they had to travel an average
distance of 251-500 meters. In 15 percent cases, they had to travel 100-250 meter, while in
remaining 9 percent cases, they had to travel less than 100 meters.
District-wise, the proportion of households where the members had to travel more than 500 meters
was the highest in Jamtara (84 percent), followed by Lohardaga (81 percent) and Latehar
(80 percent). The proportion of households where the members had to travel more than 500 meters
was the lowest in Dumka (33 percent), followed by East Singhbhum (35 percent) and Saraikela
(49 percent). Tribe-wise details are presented in Annexure-90.
Chart 57 : Types of Fuel Used by Households for Cooking
(14%)
(99%)
(60%)
(9%)
(1%)
(1%)
0 20 40 60 80 100
Wood
Kerosene Oil
Cow Dung Cake
Dry Leaves
LPG
Coal
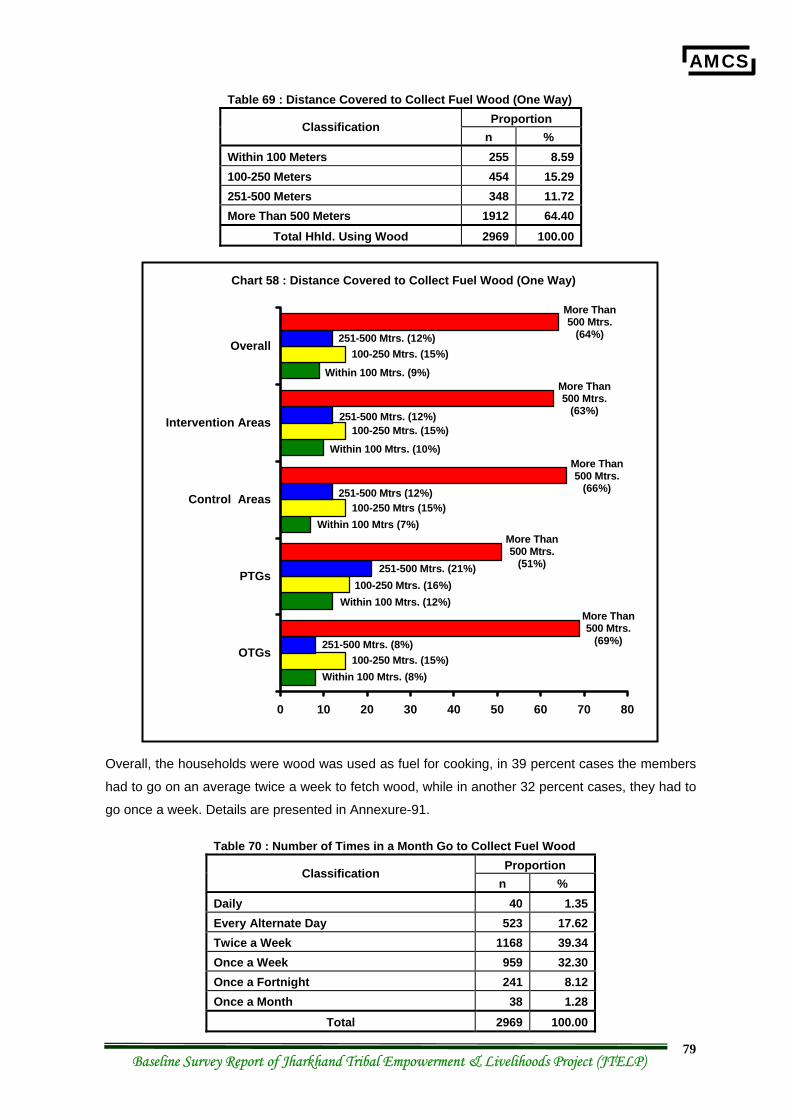
AMCS
Baseline Survey Report of Jharkhand Tribal Empowerment & Livelihoods Project (JTELP) 79
Table 69 : Distance Covered to Collect Fuel Wood (One Way) Proportion Classification
n % Within 100 Meters 255 8.59 100-250 Meters 454 15.29 251-500 Meters 348 11.72 More Than 500 Meters 1912 64.40
Total Hhld. Using Wood 2969 100.00
Overall, the households were wood was used as fuel for cooking, in 39 percent cases the members
had to go on an average twice a week to fetch wood, while in another 32 percent cases, they had to
go once a week. Details are presented in Annexure-91.
Table 70 : Number of Times in a Month Go to Collect Fuel Wood Proportion Classification
n % Daily 40 1.35 Every Alternate Day 523 17.62 Twice a Week 1168 39.34 Once a Week 959 32.30 Once a Fortnight 241 8.12 Once a Month 38 1.28
Total 2969 100.00
0 10 20 30 40 50 60 70 80
OTGs
PTGs
Control Areas
Intervention Areas
Overall
Chart 58 : Distance Covered to Collect Fuel Wood (One Way)
251-500 Mtrs. (8%)
More Than 500 Mtrs.
(69%)
Within 100 Mtrs. (8%) 100-250 Mtrs. (15%)
More Than 500 Mtrs.
(51%)
Within 100 Mtrs. (12%) 100-250 Mtrs. (16%)
251-500 Mtrs. (21%)
More Than 500 Mtrs.
(66%)
Within 100 Mtrs (7%) 100-250 Mtrs (15%)
251-500 Mtrs (12%)
More Than 500 Mtrs.
(63%)
Within 100 Mtrs. (10%)
100-250 Mtrs. (15%) 251-500 Mtrs. (12%)
More Than 500 Mtrs.
(64%)
Within 100 Mtrs. (9%)
100-250 Mtrs. (15%) 251-500 Mtrs. (12%)
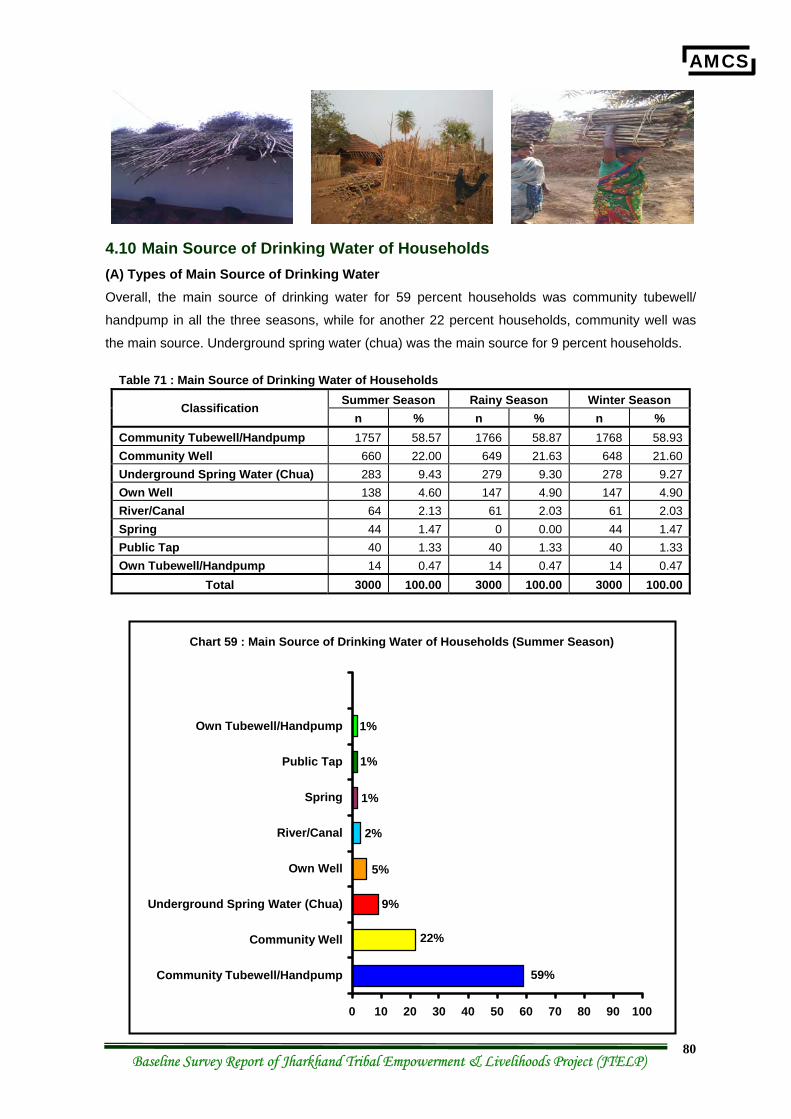
AMCS
Baseline Survey Report of Jharkhand Tribal Empowerment & Livelihoods Project (JTELP) 80
4.10 Main Source of Drinking Water of Households (A) Types of Main Source of Drinking Water Overall, the main source of drinking water for 59 percent households was community tubewell/
handpump in all the three seasons, while for another 22 percent households, community well was
the main source. Underground spring water (chua) was the main source for 9 percent households.
Table 71 : Main Source of Drinking Water of Households Summer Season Rainy Season Winter Season Classification
n % n % n % Community Tubewell/Handpump 1757 58.57 1766 58.87 1768 58.93Community Well 660 22.00 649 21.63 648 21.60Underground Spring Water (Chua) 283 9.43 279 9.30 278 9.27Own Well 138 4.60 147 4.90 147 4.90River/Canal 64 2.13 61 2.03 61 2.03Spring 44 1.47 0 0.00 44 1.47Public Tap 40 1.33 40 1.33 40 1.33Own Tubewell/Handpump 14 0.47 14 0.47 14 0.47
Total 3000 100.00 3000 100.00 3000 100.00
0 10 20 30 40 50 60 70 80 90 100
Community Tubewell/Handpump
Community Well
Underground Spring Water (Chua)
Own Well
River/Canal
Spring
Public Tap
Own Tubewell/Handpump
Chart 59 : Main Source of Drinking Water of Households (Summer Season)
9%
22%
2%
1%
5%
59%
1%
1%
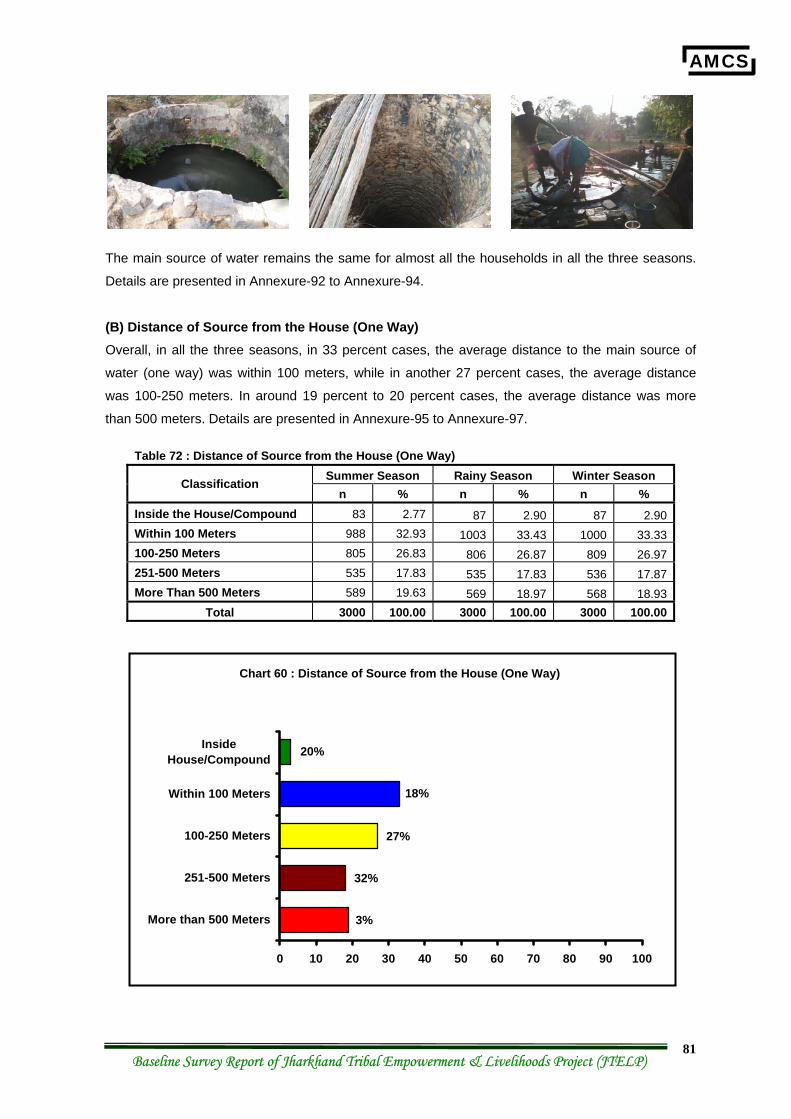
AMCS
Baseline Survey Report of Jharkhand Tribal Empowerment & Livelihoods Project (JTELP) 81
The main source of water remains the same for almost all the households in all the three seasons.
Details are presented in Annexure-92 to Annexure-94. (B) Distance of Source from the House (One Way) Overall, in all the three seasons, in 33 percent cases, the average distance to the main source of
water (one way) was within 100 meters, while in another 27 percent cases, the average distance
was 100-250 meters. In around 19 percent to 20 percent cases, the average distance was more
than 500 meters. Details are presented in Annexure-95 to Annexure-97.
Table 72 : Distance of Source from the House (One Way) Summer Season Rainy Season Winter Season Classification
n % n % n % Inside the House/Compound 83 2.77 87 2.90 87 2.90Within 100 Meters 988 32.93 1003 33.43 1000 33.33100-250 Meters 805 26.83 806 26.87 809 26.97251-500 Meters 535 17.83 535 17.83 536 17.87More Than 500 Meters 589 19.63 569 18.97 568 18.93
Total 3000 100.00 3000 100.00 3000 100.00
0 10 20 30 40 50 60 70 80 90 100
More than 500 Meters
251-500 Meters
100-250 Meters
Within 100 Meters
InsideHouse/Compound
Chart 60 : Distance of Source from the House (One Way)
18%
3%
32%
20%
27%
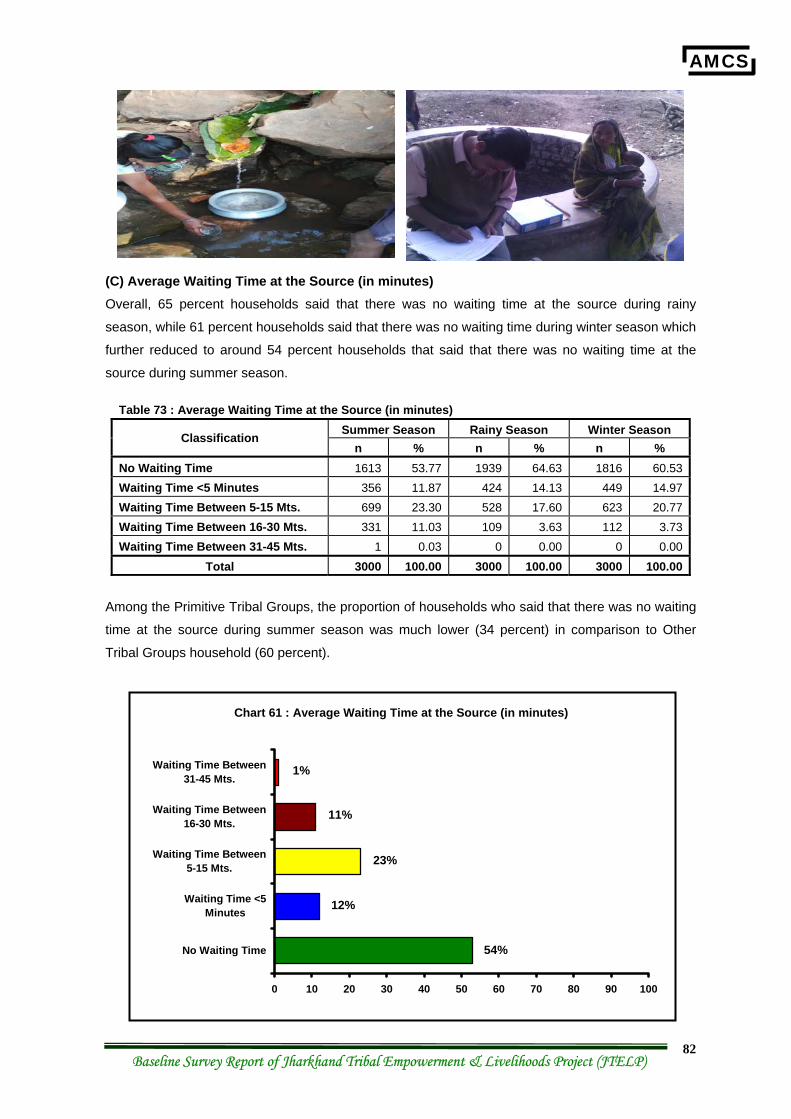
AMCS
Baseline Survey Report of Jharkhand Tribal Empowerment & Livelihoods Project (JTELP) 82
(C) Average Waiting Time at the Source (in minutes) Overall, 65 percent households said that there was no waiting time at the source during rainy
season, while 61 percent households said that there was no waiting time during winter season which
further reduced to around 54 percent households that said that there was no waiting time at the
source during summer season.
Table 73 : Average Waiting Time at the Source (in minutes) Summer Season Rainy Season Winter Season Classification
n % n % n % No Waiting Time 1613 53.77 1939 64.63 1816 60.53Waiting Time <5 Minutes 356 11.87 424 14.13 449 14.97Waiting Time Between 5-15 Mts. 699 23.30 528 17.60 623 20.77Waiting Time Between 16-30 Mts. 331 11.03 109 3.63 112 3.73Waiting Time Between 31-45 Mts. 1 0.03 0 0.00 0 0.00
Total 3000 100.00 3000 100.00 3000 100.00
Among the Primitive Tribal Groups, the proportion of households who said that there was no waiting
time at the source during summer season was much lower (34 percent) in comparison to Other
Tribal Groups household (60 percent).
0 10 20 30 40 50 60 70 80 90 100
No Waiting Time
Waiting Time <5Minutes
Waiting Time Between5-15 Mts.
Waiting Time Between16-30 Mts.
Waiting Time Between31-45 Mts.
Chart 61 : Average Waiting Time at the Source (in minutes)
23%
12%
54%
1%
11%
AMCS
Baseline Survey Report of Jharkhand Tribal Empowerment & Livelihoods Project (JTELP) 83
Similarly, during rainy season, among the Primitive Tribal Groups, the proportion of households who
said that there was no waiting time at the source was much lower (49 percent) in comparison to
Other Tribal Groups household (70 percent).
Also, during winter season, among the Primitive Tribal Groups, the proportion of households who
said that there was no waiting time at the source was much lower (44 percent) in comparison to
Other Tribal Groups household (66 percent). Details are presented in Annexure-98 to Annexure-
100.
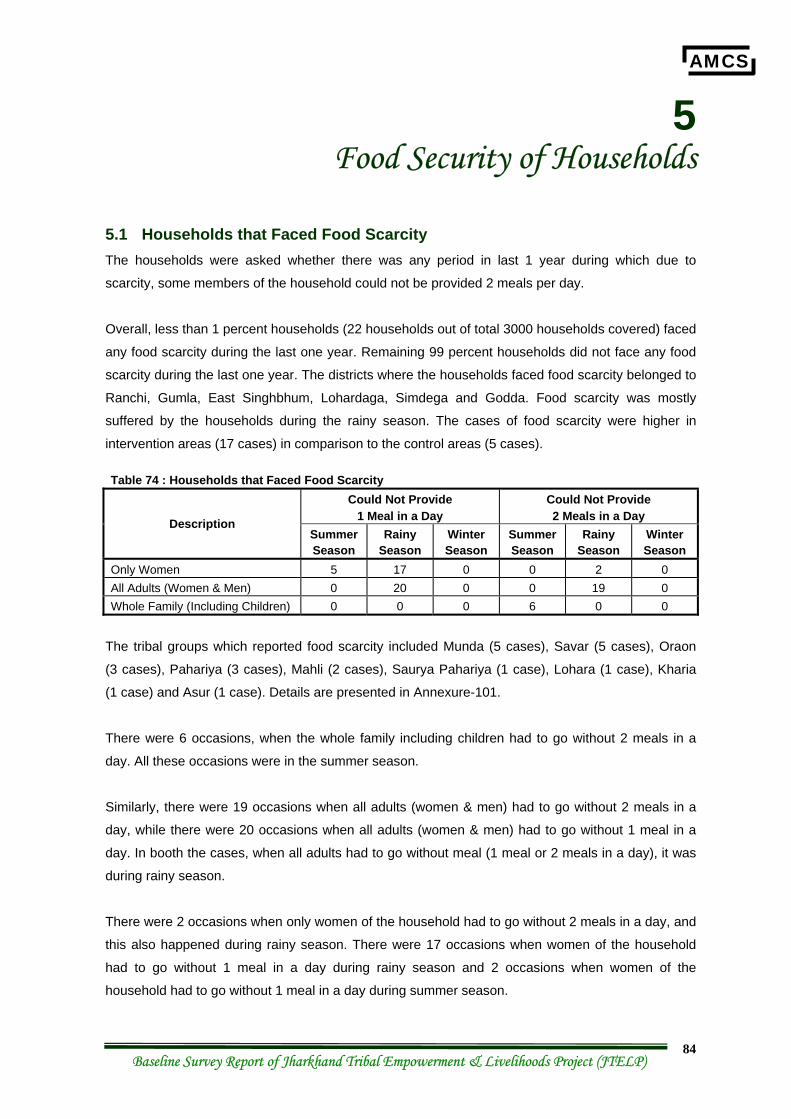
AMCS
Baseline Survey Report of Jharkhand Tribal Empowerment & Livelihoods Project (JTELP) 84
5 Food Security of Households
5.1 Households that Faced Food Scarcity The households were asked whether there was any period in last 1 year during which due to
scarcity, some members of the household could not be provided 2 meals per day.
Overall, less than 1 percent households (22 households out of total 3000 households covered) faced
any food scarcity during the last one year. Remaining 99 percent households did not face any food
scarcity during the last one year. The districts where the households faced food scarcity belonged to
Ranchi, Gumla, East Singhbhum, Lohardaga, Simdega and Godda. Food scarcity was mostly
suffered by the households during the rainy season. The cases of food scarcity were higher in
intervention areas (17 cases) in comparison to the control areas (5 cases).
Table 74 : Households that Faced Food Scarcity Could Not Provide
1 Meal in a Day Could Not Provide 2 Meals in a Day Description
Summer Season
Rainy Season
Winter Season
Summer Season
Rainy Season
Winter Season
Only Women 5 17 0 0 2 0 All Adults (Women & Men) 0 20 0 0 19 0 Whole Family (Including Children) 0 0 0 6 0 0
The tribal groups which reported food scarcity included Munda (5 cases), Savar (5 cases), Oraon
(3 cases), Pahariya (3 cases), Mahli (2 cases), Saurya Pahariya (1 case), Lohara (1 case), Kharia
(1 case) and Asur (1 case). Details are presented in Annexure-101.
There were 6 occasions, when the whole family including children had to go without 2 meals in a
day. All these occasions were in the summer season.
Similarly, there were 19 occasions when all adults (women & men) had to go without 2 meals in a
day, while there were 20 occasions when all adults (women & men) had to go without 1 meal in a
day. In booth the cases, when all adults had to go without meal (1 meal or 2 meals in a day), it was
during rainy season.
There were 2 occasions when only women of the household had to go without 2 meals in a day, and
this also happened during rainy season. There were 17 occasions when women of the household
had to go without 1 meal in a day during rainy season and 2 occasions when women of the
household had to go without 1 meal in a day during summer season.
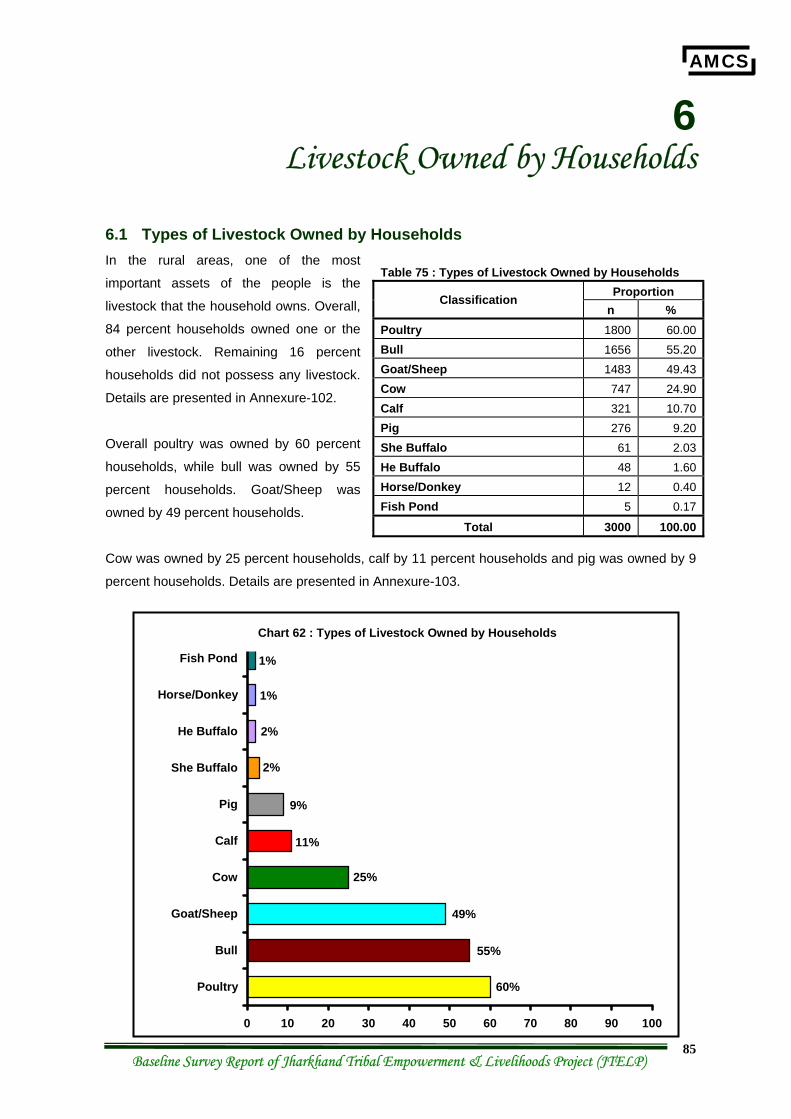
AMCS
Baseline Survey Report of Jharkhand Tribal Empowerment & Livelihoods Project (JTELP) 85
6 Livestock Owned by Households
6.1 Types of Livestock Owned by Households In the rural areas, one of the most
important assets of the people is the
livestock that the household owns. Overall,
84 percent households owned one or the
other livestock. Remaining 16 percent
households did not possess any livestock.
Details are presented in Annexure-102.
Overall poultry was owned by 60 percent
households, while bull was owned by 55
percent households. Goat/Sheep was
owned by 49 percent households.
Cow was owned by 25 percent households, calf by 11 percent households and pig was owned by 9
percent households. Details are presented in Annexure-103.
Table 75 : Types of Livestock Owned by Households Proportion Classification
n % Poultry 1800 60.00Bull 1656 55.20Goat/Sheep 1483 49.43Cow 747 24.90Calf 321 10.70Pig 276 9.20She Buffalo 61 2.03He Buffalo 48 1.60Horse/Donkey 12 0.40Fish Pond 5 0.17
Total 3000 100.00
0 10 20 30 40 50 60 70 80 90 100
Poultry
Bull
Goat/Sheep
Cow
Calf
Pig
She Buffalo
He Buffalo
Horse/Donkey
Fish Pond
Chart 62 : Types of Livestock Owned by Households
11%
25%
60%
9%
55%
49%
2%
2%
1%
1%
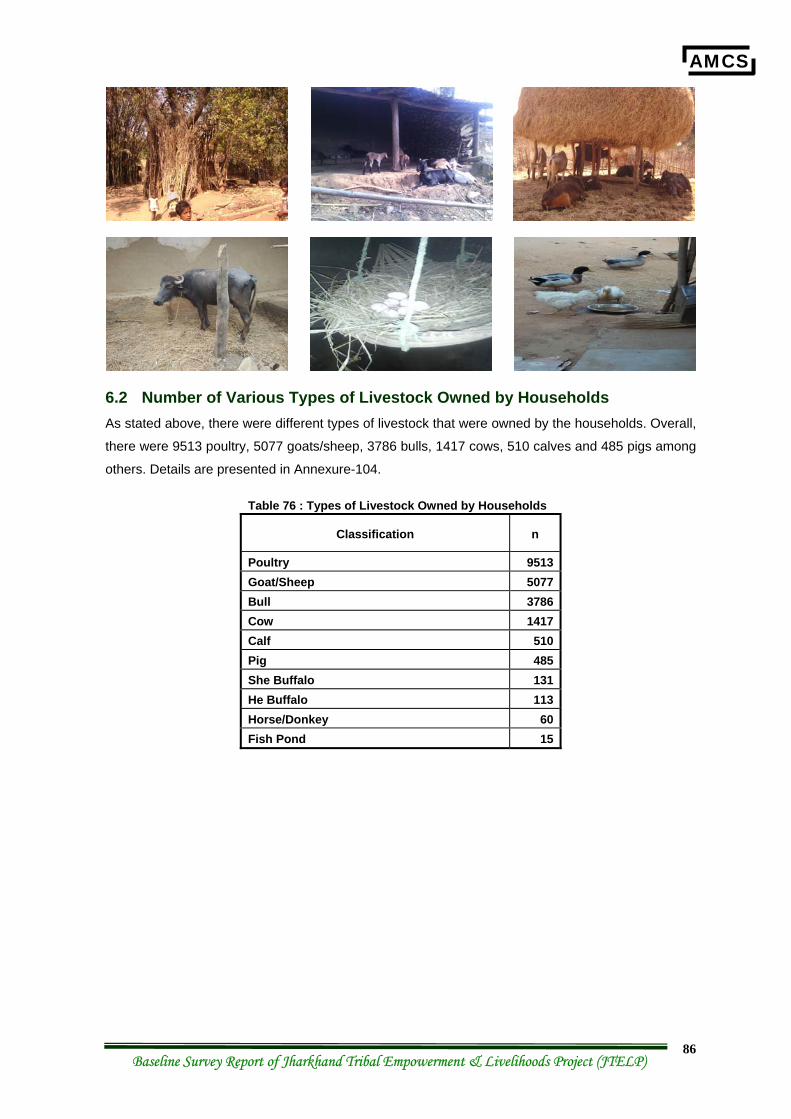
AMCS
Baseline Survey Report of Jharkhand Tribal Empowerment & Livelihoods Project (JTELP) 86
6.2 Number of Various Types of Livestock Owned by Households As stated above, there were different types of livestock that were owned by the households. Overall,
there were 9513 poultry, 5077 goats/sheep, 3786 bulls, 1417 cows, 510 calves and 485 pigs among
others. Details are presented in Annexure-104.
Table 76 : Types of Livestock Owned by Households
Classification n
Poultry 9513Goat/Sheep 5077Bull 3786Cow 1417Calf 510Pig 485She Buffalo 131He Buffalo 113Horse/Donkey 60Fish Pond 15
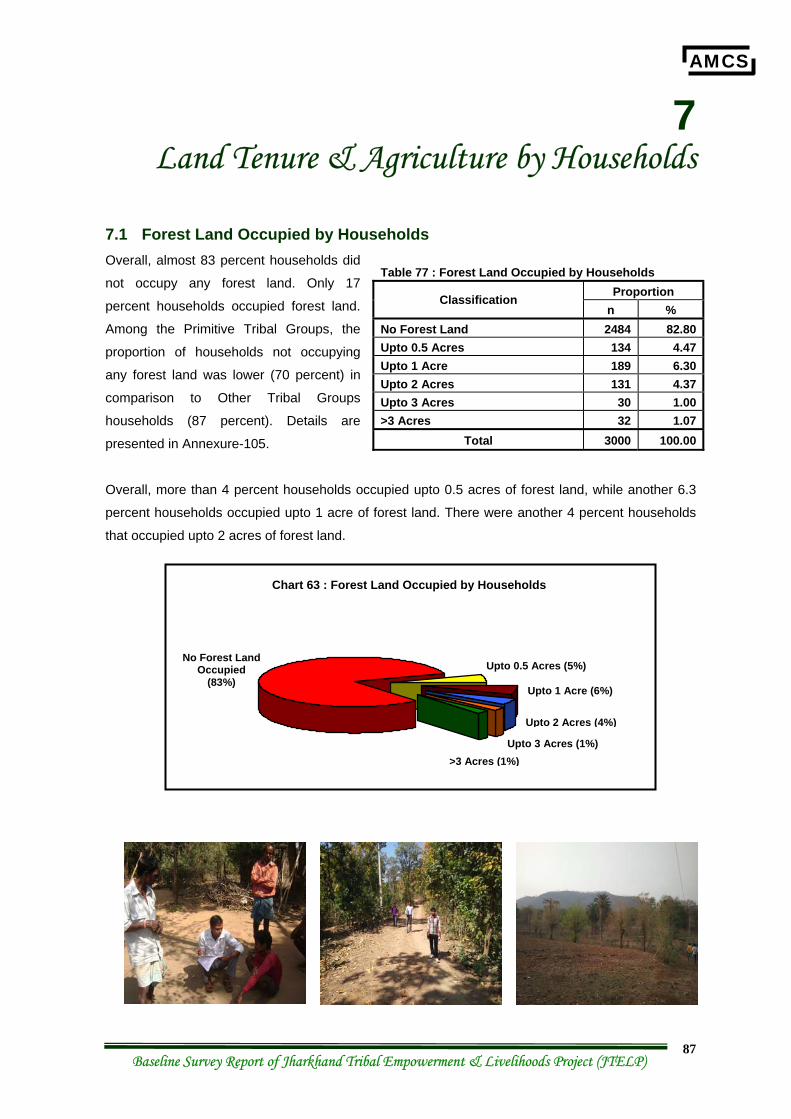
AMCS
Baseline Survey Report of Jharkhand Tribal Empowerment & Livelihoods Project (JTELP) 87
7 Land Tenure & Agriculture by Households
7.1 Forest Land Occupied by Households Overall, almost 83 percent households did
not occupy any forest land. Only 17
percent households occupied forest land.
Among the Primitive Tribal Groups, the
proportion of households not occupying
any forest land was lower (70 percent) in
comparison to Other Tribal Groups
households (87 percent). Details are
presented in Annexure-105.
Overall, more than 4 percent households occupied upto 0.5 acres of forest land, while another 6.3
percent households occupied upto 1 acre of forest land. There were another 4 percent households
that occupied upto 2 acres of forest land.
Table 77 : Forest Land Occupied by Households Proportion Classification
n % No Forest Land 2484 82.80Upto 0.5 Acres 134 4.47Upto 1 Acre 189 6.30Upto 2 Acres 131 4.37Upto 3 Acres 30 1.00>3 Acres 32 1.07
Total 3000 100.00
Chart 63 : Forest Land Occupied by Households
Upto 1 Acre (6%)
No Forest Land Occupied
(83%) Upto 0.5 Acres (5%)
Upto 2 Acres (4%)
Upto 3 Acres (1%) >3 Acres (1%)

AMCS
Baseline Survey Report of Jharkhand Tribal Empowerment & Livelihoods Project (JTELP) 88
7.2 Availability of Forest Land Rights Overall, almost 72 percent households had forest land rights with them, while remaining 28 percent
households did not have forest land rights.
Table 78 : Availability of Forest Land Rights Forest Land
Rights Available
No Forest Land
Rights Total
Classification n % n % N % Gumla 18 66.67 9 33.33 27 100.00 Khunti 27 72.97 10 27.03 37 100.00 Latehar 0 0.00 2 100.00 2 100.00 Lohardaga 0 0.00 0 0.00 0 0.00 Ranchi 6 54.55 5 45.45 11 100.00 Simdega 0 0.00 0 0.00 0 0.00 Dumka 19 86.36 3 13.64 22 100.00 Godda 7 100.00 0 0.00 7 100.00 Jamtara 4 44.44 5 55.56 9 100.00 Pakur 13 81.25 3 18.75 16 100.00 Sahibganj 7 77.78 2 22.22 9 100.00 E.Singhbhum 0 0.00 0 0.00 0 0.00 Saraikela 3 60.00 2 40.00 5 100.00 W.Singhbhum 0 0.00 0 0.00 0 0.00 Overall 104 71.72 41 28.28 145 100.00 Location of Tribes Intervention Locations 61 70.93 25 29.07 86 100.00 Control Locations 43 72.88 16 27.12 59 100.00 Tribal Groups Primitive Tribal Groups 41 82.00 9 18.00 50 100.00 Other Tribal Groups 63 66.32 32 33.68 95 100.00
Among the Primitive Tribal Groups, the proportion of households having forest land rights was
higher (82 percent) in comparison to Other Tribal Groups households (66 percent). Tribe-wise
details are presented in Annexure-106.
0
20
40
60
80
100
Overall InterventionAreas
Control Areas PTGs OTGs
Chart 64 : Availability of Forest Land Rights
No Forest Land
Rights (28%)
Forest Land
Rights Available
(72%) No
Forest Land
Rights (34%)
Forest Land
Rights Available
(71%)
Forest Land
Rights Available
(73%)
No Forest Land
Rights (29%)
No Forest Land
Rights (27%)
Forest Land
Rights Available
(82%)
Forest Land
Rights Available
(66%)
No Forest Land
Rights (18%)
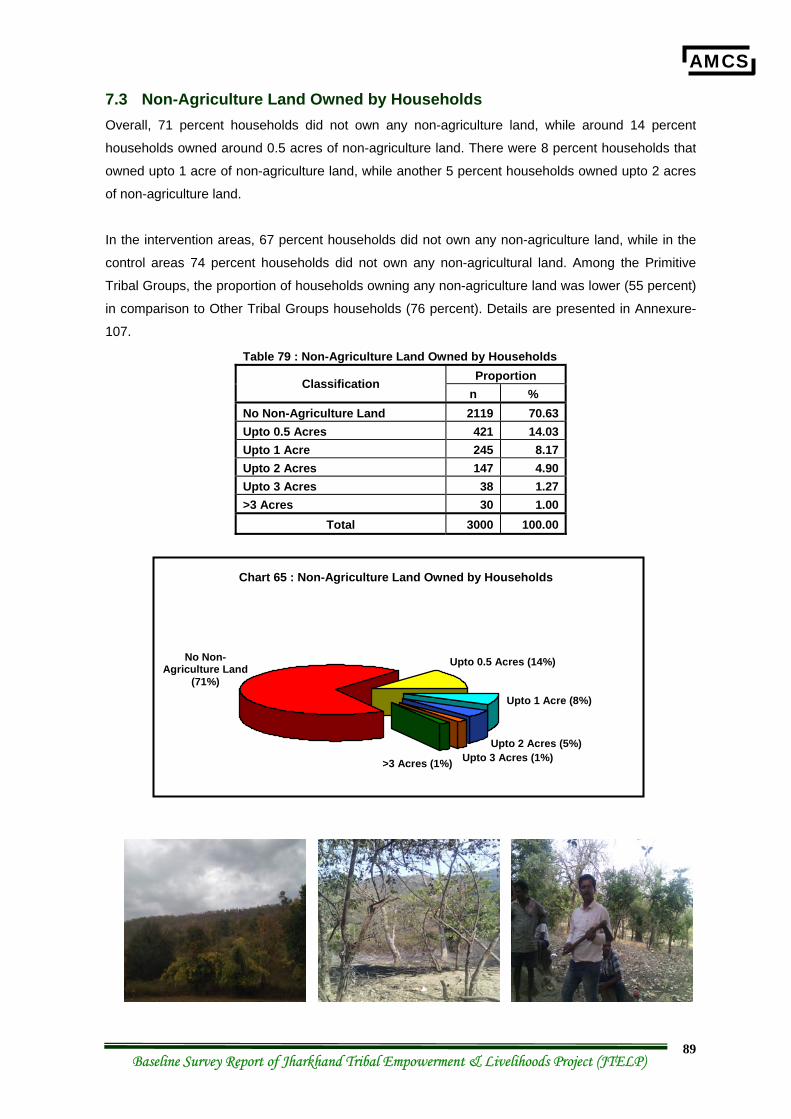
AMCS
Baseline Survey Report of Jharkhand Tribal Empowerment & Livelihoods Project (JTELP) 89
7.3 Non-Agriculture Land Owned by Households Overall, 71 percent households did not own any non-agriculture land, while around 14 percent
households owned around 0.5 acres of non-agriculture land. There were 8 percent households that
owned upto 1 acre of non-agriculture land, while another 5 percent households owned upto 2 acres
of non-agriculture land.
In the intervention areas, 67 percent households did not own any non-agriculture land, while in the
control areas 74 percent households did not own any non-agricultural land. Among the Primitive
Tribal Groups, the proportion of households owning any non-agriculture land was lower (55 percent)
in comparison to Other Tribal Groups households (76 percent). Details are presented in Annexure-
107.
Table 79 : Non-Agriculture Land Owned by Households Proportion Classification
n % No Non-Agriculture Land 2119 70.63Upto 0.5 Acres 421 14.03Upto 1 Acre 245 8.17Upto 2 Acres 147 4.90Upto 3 Acres 38 1.27>3 Acres 30 1.00
Total 3000 100.00
Chart 65 : Non-Agriculture Land Owned by Households
Upto 1 Acre (8%)
No Non-Agriculture Land
(71%)
Upto 0.5 Acres (14%)
Upto 2 Acres (5%) Upto 3 Acres (1%) >3 Acres (1%)
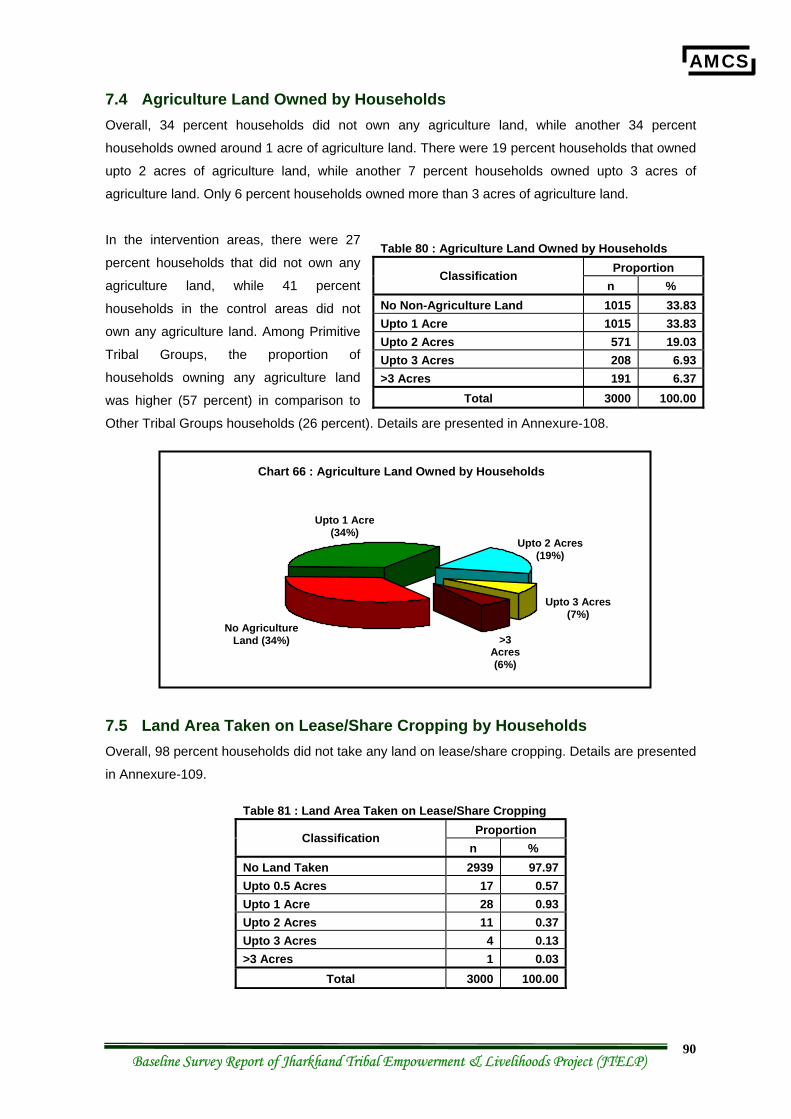
AMCS
Baseline Survey Report of Jharkhand Tribal Empowerment & Livelihoods Project (JTELP) 90
7.4 Agriculture Land Owned by Households Overall, 34 percent households did not own any agriculture land, while another 34 percent
households owned around 1 acre of agriculture land. There were 19 percent households that owned
upto 2 acres of agriculture land, while another 7 percent households owned upto 3 acres of
agriculture land. Only 6 percent households owned more than 3 acres of agriculture land.
In the intervention areas, there were 27
percent households that did not own any
agriculture land, while 41 percent
households in the control areas did not
own any agriculture land. Among Primitive
Tribal Groups, the proportion of
households owning any agriculture land
was higher (57 percent) in comparison to
Other Tribal Groups households (26 percent). Details are presented in Annexure-108.
7.5 Land Area Taken on Lease/Share Cropping by Households Overall, 98 percent households did not take any land on lease/share cropping. Details are presented
in Annexure-109.
Table 81 : Land Area Taken on Lease/Share Cropping Proportion Classification
n % No Land Taken 2939 97.97Upto 0.5 Acres 17 0.57Upto 1 Acre 28 0.93Upto 2 Acres 11 0.37Upto 3 Acres 4 0.13>3 Acres 1 0.03
Total 3000 100.00
Table 80 : Agriculture Land Owned by Households Proportion Classification
n % No Non-Agriculture Land 1015 33.83Upto 1 Acre 1015 33.83Upto 2 Acres 571 19.03Upto 3 Acres 208 6.93>3 Acres 191 6.37
Total 3000 100.00
Chart 66 : Agriculture Land Owned by Households
Upto 1 Acre (34%)
No Agriculture Land (34%)
Upto 2 Acres (19%)
Upto 3 Acres (7%)
>3 Acres (6%)
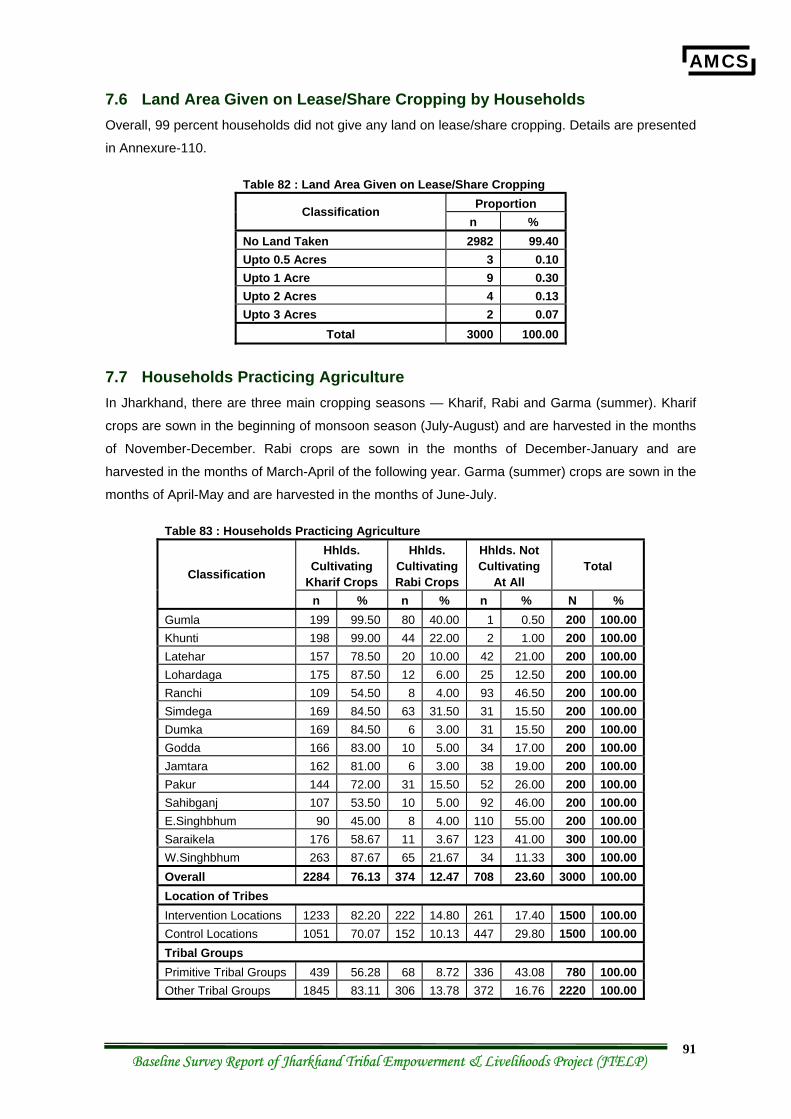
AMCS
Baseline Survey Report of Jharkhand Tribal Empowerment & Livelihoods Project (JTELP) 91
7.6 Land Area Given on Lease/Share Cropping by Households Overall, 99 percent households did not give any land on lease/share cropping. Details are presented
in Annexure-110.
Table 82 : Land Area Given on Lease/Share Cropping Proportion Classification
n % No Land Taken 2982 99.40Upto 0.5 Acres 3 0.10Upto 1 Acre 9 0.30Upto 2 Acres 4 0.13Upto 3 Acres 2 0.07
Total 3000 100.00
7.7 Households Practicing Agriculture In Jharkhand, there are three main cropping seasons — Kharif, Rabi and Garma (summer). Kharif
crops are sown in the beginning of monsoon season (July-August) and are harvested in the months
of November-December. Rabi crops are sown in the months of December-January and are
harvested in the months of March-April of the following year. Garma (summer) crops are sown in the
months of April-May and are harvested in the months of June-July.
Table 83 : Households Practicing Agriculture Hhlds.
Cultivating Kharif Crops
Hhlds. Cultivating Rabi Crops
Hhlds. Not Cultivating
At All Total Classification
n % n % n % N % Gumla 199 99.50 80 40.00 1 0.50 200 100.00 Khunti 198 99.00 44 22.00 2 1.00 200 100.00 Latehar 157 78.50 20 10.00 42 21.00 200 100.00 Lohardaga 175 87.50 12 6.00 25 12.50 200 100.00 Ranchi 109 54.50 8 4.00 93 46.50 200 100.00 Simdega 169 84.50 63 31.50 31 15.50 200 100.00 Dumka 169 84.50 6 3.00 31 15.50 200 100.00 Godda 166 83.00 10 5.00 34 17.00 200 100.00 Jamtara 162 81.00 6 3.00 38 19.00 200 100.00 Pakur 144 72.00 31 15.50 52 26.00 200 100.00 Sahibganj 107 53.50 10 5.00 92 46.00 200 100.00 E.Singhbhum 90 45.00 8 4.00 110 55.00 200 100.00 Saraikela 176 58.67 11 3.67 123 41.00 300 100.00 W.Singhbhum 263 87.67 65 21.67 34 11.33 300 100.00 Overall 2284 76.13 374 12.47 708 23.60 3000 100.00 Location of Tribes Intervention Locations 1233 82.20 222 14.80 261 17.40 1500 100.00 Control Locations 1051 70.07 152 10.13 447 29.80 1500 100.00 Tribal Groups Primitive Tribal Groups 439 56.28 68 8.72 336 43.08 780 100.00 Other Tribal Groups 1845 83.11 306 13.78 372 16.76 2220 100.00
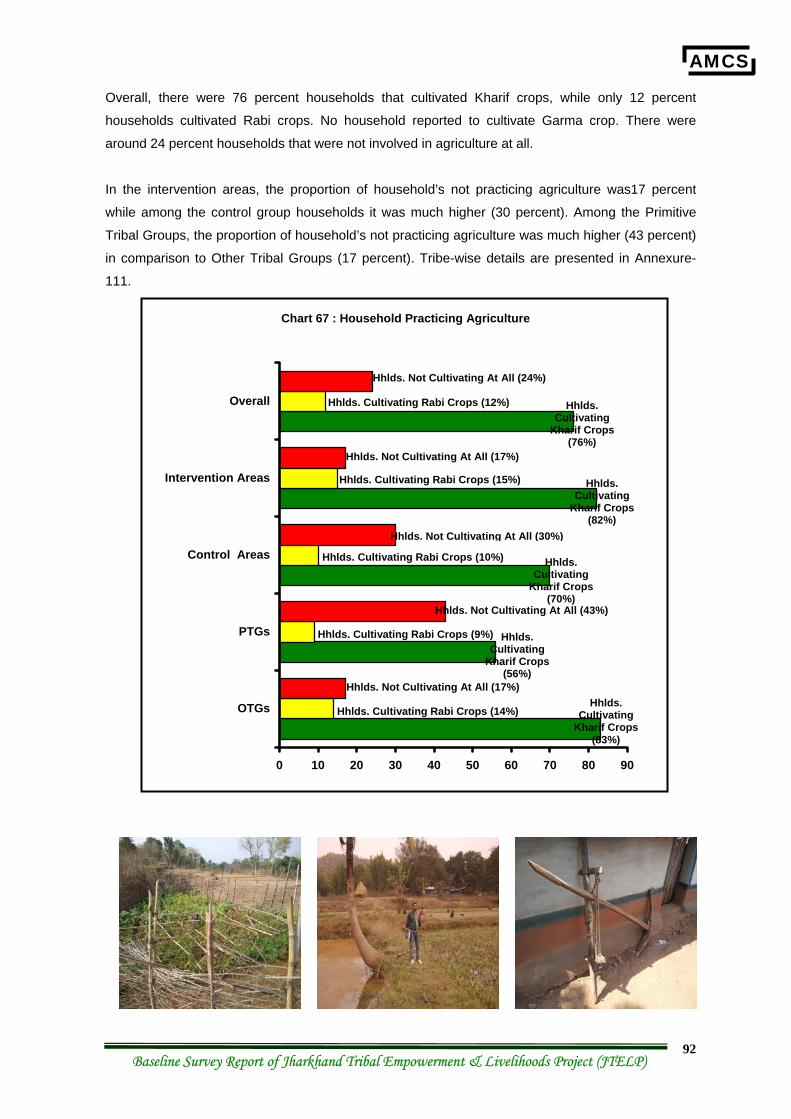
AMCS
Baseline Survey Report of Jharkhand Tribal Empowerment & Livelihoods Project (JTELP) 92
Overall, there were 76 percent households that cultivated Kharif crops, while only 12 percent
households cultivated Rabi crops. No household reported to cultivate Garma crop. There were
around 24 percent households that were not involved in agriculture at all.
In the intervention areas, the proportion of household’s not practicing agriculture was17 percent
while among the control group households it was much higher (30 percent). Among the Primitive
Tribal Groups, the proportion of household’s not practicing agriculture was much higher (43 percent)
in comparison to Other Tribal Groups (17 percent). Tribe-wise details are presented in Annexure-
111.
0 10 20 30 40 50 60 70 80 90
OTGs
PTGs
Control Areas
Intervention Areas
Overall
Chart 67 : Household Practicing Agriculture
Hhlds. Cultivating Rabi Crops (12%)
Hhlds. Cultivating Rabi Crops (15%)
Hhlds. Cultivating Rabi Crops (10%)
Hhlds. Cultivating Rabi Crops (9%) Hhlds. Cultivating
Kharif Crops (56%)
Hhlds. Cultivating Rabi Crops (14%)
Hhlds. Not Cultivating At All (17%) Hhlds.
Cultivating Kharif Crops
(83%)
Hhlds. Not Cultivating At All (43%)
Hhlds. Not Cultivating At All (30%)
Hhlds. Not Cultivating At All (24%)
Hhlds. Not Cultivating At All (17%)
Hhlds. Cultivating
Kharif Crops (70%)
Hhlds. Cultivating
Kharif Crops (82%)
Hhlds. Cultivating
Kharif Crops (76%)
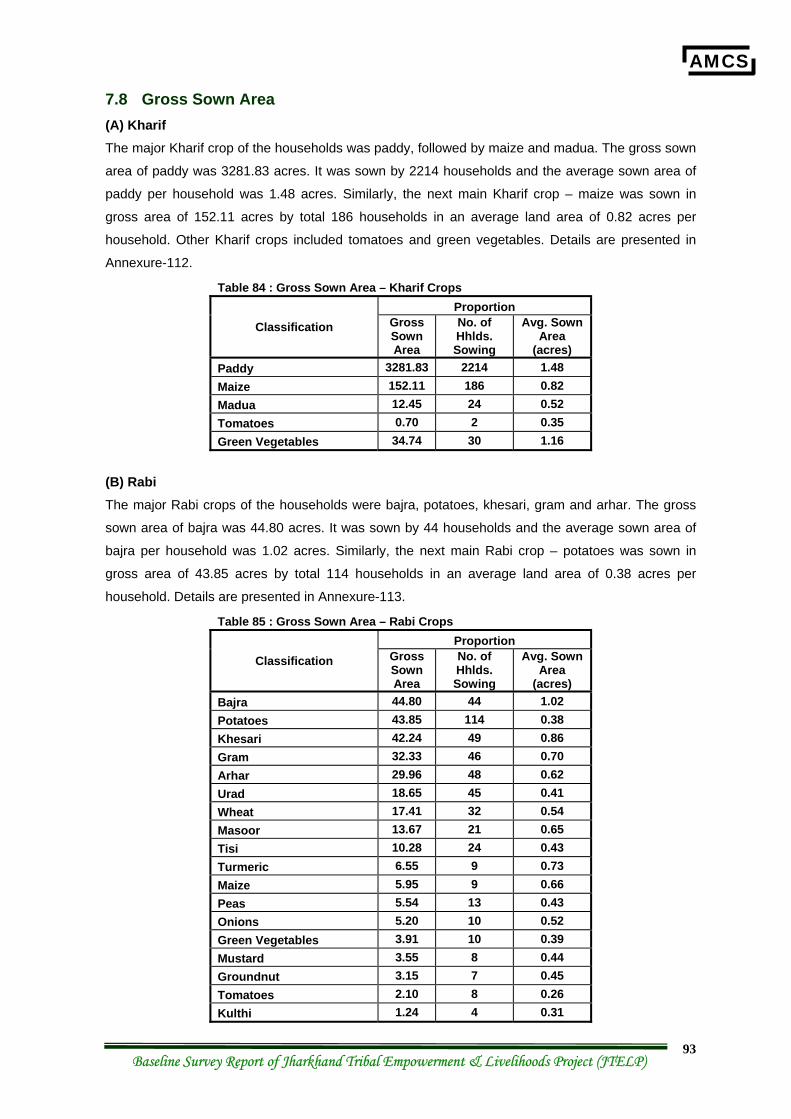
AMCS
Baseline Survey Report of Jharkhand Tribal Empowerment & Livelihoods Project (JTELP) 93
7.8 Gross Sown Area (A) Kharif The major Kharif crop of the households was paddy, followed by maize and madua. The gross sown
area of paddy was 3281.83 acres. It was sown by 2214 households and the average sown area of
paddy per household was 1.48 acres. Similarly, the next main Kharif crop – maize was sown in
gross area of 152.11 acres by total 186 households in an average land area of 0.82 acres per
household. Other Kharif crops included tomatoes and green vegetables. Details are presented in
Annexure-112.
Table 84 : Gross Sown Area – Kharif Crops Proportion
Classification Gross Sown Area
No. of Hhlds. Sowing
Avg. Sown Area
(acres) Paddy 3281.83 2214 1.48 Maize 152.11 186 0.82 Madua 12.45 24 0.52 Tomatoes 0.70 2 0.35 Green Vegetables 34.74 30 1.16
(B) Rabi The major Rabi crops of the households were bajra, potatoes, khesari, gram and arhar. The gross
sown area of bajra was 44.80 acres. It was sown by 44 households and the average sown area of
bajra per household was 1.02 acres. Similarly, the next main Rabi crop – potatoes was sown in
gross area of 43.85 acres by total 114 households in an average land area of 0.38 acres per
household. Details are presented in Annexure-113.
Table 85 : Gross Sown Area – Rabi Crops Proportion
Classification Gross Sown Area
No. of Hhlds. Sowing
Avg. Sown Area
(acres) Bajra 44.80 44 1.02 Potatoes 43.85 114 0.38 Khesari 42.24 49 0.86 Gram 32.33 46 0.70 Arhar 29.96 48 0.62 Urad 18.65 45 0.41 Wheat 17.41 32 0.54 Masoor 13.67 21 0.65 Tisi 10.28 24 0.43 Turmeric 6.55 9 0.73 Maize 5.95 9 0.66 Peas 5.54 13 0.43 Onions 5.20 10 0.52 Green Vegetables 3.91 10 0.39 Mustard 3.55 8 0.44 Groundnut 3.15 7 0.45 Tomatoes 2.10 8 0.26 Kulthi 1.24 4 0.31
AMCS
Baseline Survey Report of Jharkhand Tribal Empowerment & Livelihoods Project (JTELP) 94
7.9 Cropping Pattern (A) Kharif Paddy was the most important crop, as 97
percent households cultivated paddy during
the Kharif season. Next important crop was
maize but it was cultivated by only 8 percent
households. There were few households that
cultivated some vegetables also during the
Kharif season. Details are presented in
Annexure-114.
(B) Rabi Potato was the most important crop as 30 percent households cultivated it during the Rabi season
followed by khesari and arhar (13 percent households each), gram, urad & bajra (12 percent
households each). Details are presented in Annexure-115.
Table 87 : Cropping Pattern – Rabi Crops Proportion Classification
n % Potatoes 114 30.48Khesari 49 13.10Arhar 48 12.83Gram 46 12.30Urad 45 12.03Bajra 44 11.76Wheat 32 8.56Masoor 21 5.61Tisi 24 6.42Peas 13 3.48Onions 10 2.67Green Vegetables 10 2.67Turmeric 9 2.41Maize 9 2.41Mustard 8 2.14Tomatoes 8 2.14Groundnut 7 1.87Kulthi 4 1.07
Total 374 100.00
Table 86 : Cropping Pattern – Kharif Crops Proportion Classification
n % Paddy 2214 96.94Maize 186 8.14Madua 24 1.05Tomatoes 2 0.09Green Vegetables 30 1.31
Total 2284 100.00
AMCS
Baseline Survey Report of Jharkhand Tribal Empowerment & Livelihoods Project (JTELP) 95
7.10 Crop Yield (A) Kharif The average yield of paddy during the Kharif season
was reported to be 5.82 quintals/acre, while the
average yield of madua was 2.41 quintals/acre.
Similarly, the average yield of maize was 2.35
quintals/acre. There are different green vegetables
that are sown, the average yield of which was 1.89
quintals/acre. Details are presented in Annexure-116.
(B) Rabi The average yield of tomatoes was reported to be 8.02 quintals/acre, while the average yield of
wheat was 4.69 quintals/acre. Similarly, the average yield of potatoes was 3.91 quintals/acre.
Details are presented in Annexure-117.
Table 89 : Crop Yield – Rabi Crops
Classification Crop Yield (quintals/acre)
Tomatoes 8.02Wheat 4.69Potatoes 3.91Kulthi 3.79Khesari 3.73Arhar 2.58Green Vegetables 2.46Peas 2.42Onions 1.88Masoor 1.86Bajra 1.71Gram 1.68Groundnut 1.68Turmeric 1.50Mustard 1.45Urad 1.15Maize 1.11Tisi 1.04
Table 88 : Crop Yield – Kharif Crops
Classification Crop Yield (quintals/acre)
Paddy 5.82Madua 2.41Maize 2.35Green Vegetables 1.89Tomatoes 1.43
AMCS
Baseline Survey Report of Jharkhand Tribal Empowerment & Livelihoods Project (JTELP) 96
7.11 Sources of Irrigation Rainfall was the major source of irrigation for more than 98
percent households practicing agriculture. Well was reported
by 6 percent households while pond was reported to be a
source for 3 percent households practicing agriculture.
Details are presented in Annexure-118.
Table 90 : Sources of Irrigation Proportion Classification
n % Rainfall 2249 98.12Well 138 6.02Pond 69 3.01River 43 1.88Canal 16 0.70Underground Deep Boring 13 0.57Stream 11 0.48Tubewell 2 0.09
Total 2292 100.00
(multiple responses recorded)
AMCS
Baseline Survey Report of Jharkhand Tribal Empowerment & Livelihoods Project (JTELP) 97
8 Family Business of Households
8.1 Households Having Any Family Business Overall, only around 9 percent households had any family business, while 91 percent households
did not have any family business. District-wise, the proportion of households having family business
was the highest in East Singhbhum (42 Percent) followed by Pakur & Sahibganj (16 percent) each.
Tribe-wise details are presented in Annexure-119.
Table 91 : Households Having Any Family Business Hhlds. Having Family
Business
Hhlds. Not Having Family
Business
Total Classification
n % n % N % Gumla 10 5.00 190 95.00 200 100.00 Khunti 6 3.00 194 97.00 200 100.00 Latehar 8 4.00 192 96.00 200 100.00 Lohardaga 2 1.00 198 99.00 200 100.00 Ranchi 7 3.50 193 96.50 200 100.00 Simdega 12 6.00 188 94.00 200 100.00 Dumka 14 7.00 186 93.00 200 100.00 Godda 10 5.00 190 95.00 200 100.00 Jamtara 2 1.00 198 99.00 200 100.00 Pakur 32 16.00 168 84.00 200 100.00 Sahibganj 31 15.50 169 84.50 200 100.00 E.Singhbhum 83 41.50 117 58.50 200 100.00 Saraikela 16 5.33 284 94.67 300 100.00 W.Singhbhum 26 8.67 274 91.33 300 100.00 Overall 259 8.63 2741 91.37 3000 100.00 Location of Tribes Intervention Locations 172 11.47 1328 88.53 1500 100.00 Control Locations 87 5.80 1413 94.20 1500 100.00 Tribal Groups Primitive Tribal Groups 166 21.31 613 78.69 779 100.00 Other Tribal Groups 93 4.19 2127 95.81 2220 100.00
8.2 Types of Family Business Owned by Households The various types of business activities being undertaken by the households included cutting wood
from the forests & selling them, handicraft work (making bamboo items, brooms, other household
items), ration shops, making and selling handia, etc.
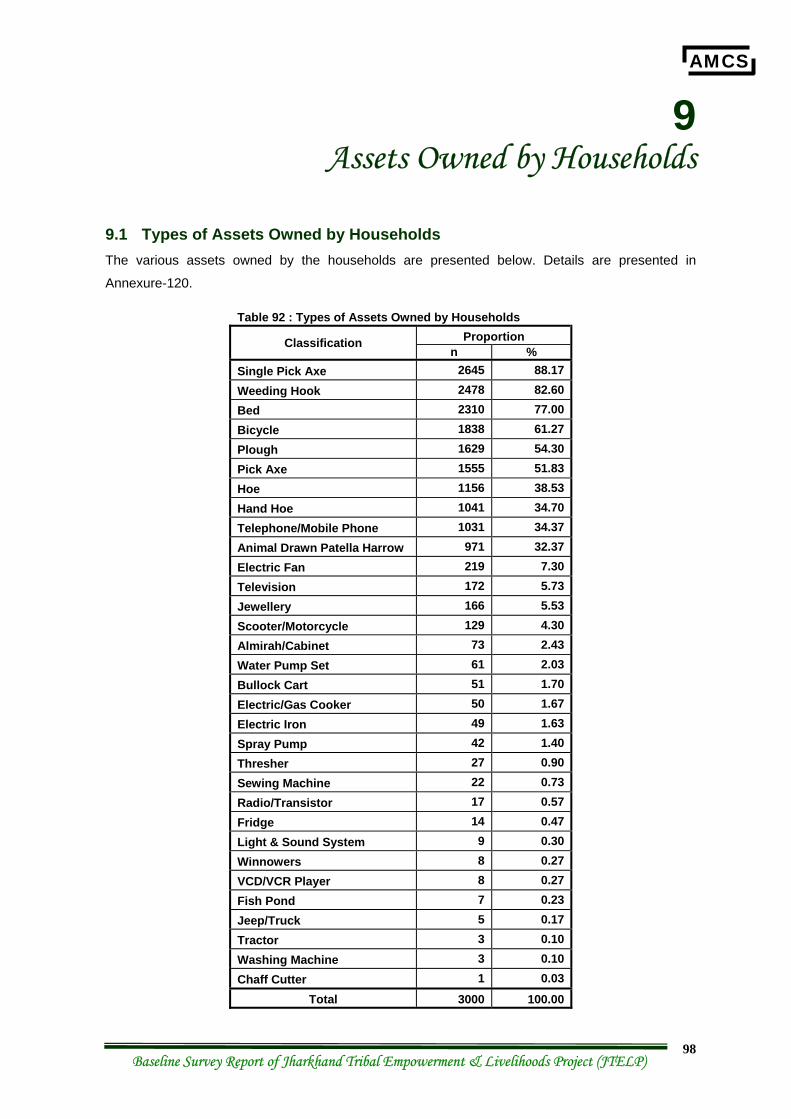
AMCS
Baseline Survey Report of Jharkhand Tribal Empowerment & Livelihoods Project (JTELP) 98
9 Assets Owned by Households
9.1 Types of Assets Owned by Households The various assets owned by the households are presented below. Details are presented in
Annexure-120.
Table 92 : Types of Assets Owned by Households Proportion Classification
n % Single Pick Axe 2645 88.17
Weeding Hook 2478 82.60 Bed 2310 77.00 Bicycle 1838 61.27 Plough 1629 54.30 Pick Axe 1555 51.83 Hoe 1156 38.53 Hand Hoe 1041 34.70 Telephone/Mobile Phone 1031 34.37 Animal Drawn Patella Harrow 971 32.37 Electric Fan 219 7.30 Television 172 5.73 Jewellery 166 5.53 Scooter/Motorcycle 129 4.30 Almirah/Cabinet 73 2.43 Water Pump Set 61 2.03 Bullock Cart 51 1.70 Electric/Gas Cooker 50 1.67 Electric Iron 49 1.63 Spray Pump 42 1.40 Thresher 27 0.90 Sewing Machine 22 0.73 Radio/Transistor 17 0.57 Fridge 14 0.47 Light & Sound System 9 0.30 Winnowers 8 0.27 VCD/VCR Player 8 0.27 Fish Pond 7 0.23 Jeep/Truck 5 0.17 Tractor 3 0.10 Washing Machine 3 0.10 Chaff Cutter 1 0.03
Total 3000 100.00
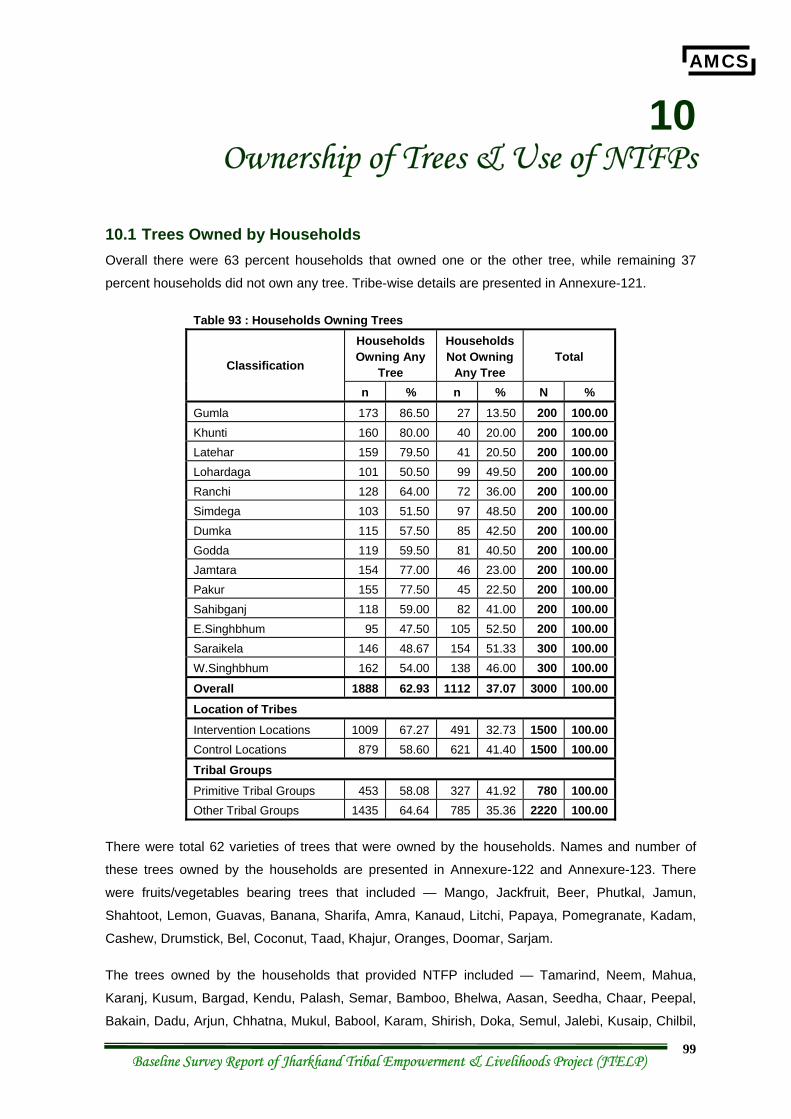
AMCS
Baseline Survey Report of Jharkhand Tribal Empowerment & Livelihoods Project (JTELP) 99
10 Ownership of Trees & Use of NTFPs
10.1 Trees Owned by Households Overall there were 63 percent households that owned one or the other tree, while remaining 37
percent households did not own any tree. Tribe-wise details are presented in Annexure-121.
Table 93 : Households Owning Trees Households Owning Any
Tree
Households Not Owning
Any Tree Total
Classification
n % n % N % Gumla 173 86.50 27 13.50 200 100.00 Khunti 160 80.00 40 20.00 200 100.00 Latehar 159 79.50 41 20.50 200 100.00 Lohardaga 101 50.50 99 49.50 200 100.00 Ranchi 128 64.00 72 36.00 200 100.00 Simdega 103 51.50 97 48.50 200 100.00 Dumka 115 57.50 85 42.50 200 100.00 Godda 119 59.50 81 40.50 200 100.00 Jamtara 154 77.00 46 23.00 200 100.00 Pakur 155 77.50 45 22.50 200 100.00 Sahibganj 118 59.00 82 41.00 200 100.00 E.Singhbhum 95 47.50 105 52.50 200 100.00 Saraikela 146 48.67 154 51.33 300 100.00 W.Singhbhum 162 54.00 138 46.00 300 100.00 Overall 1888 62.93 1112 37.07 3000 100.00 Location of Tribes Intervention Locations 1009 67.27 491 32.73 1500 100.00 Control Locations 879 58.60 621 41.40 1500 100.00 Tribal Groups Primitive Tribal Groups 453 58.08 327 41.92 780 100.00 Other Tribal Groups 1435 64.64 785 35.36 2220 100.00
There were total 62 varieties of trees that were owned by the households. Names and number of
these trees owned by the households are presented in Annexure-122 and Annexure-123. There
were fruits/vegetables bearing trees that included — Mango, Jackfruit, Beer, Phutkal, Jamun,
Shahtoot, Lemon, Guavas, Banana, Sharifa, Amra, Kanaud, Litchi, Papaya, Pomegranate, Kadam,
Cashew, Drumstick, Bel, Coconut, Taad, Khajur, Oranges, Doomar, Sarjam.
The trees owned by the households that provided NTFP included — Tamarind, Neem, Mahua,
Karanj, Kusum, Bargad, Kendu, Palash, Semar, Bamboo, Bhelwa, Aasan, Seedha, Chaar, Peepal,
Bakain, Dadu, Arjun, Chhatna, Mukul, Babool, Karam, Shirish, Doka, Semul, Jalebi, Kusaip, Chilbil,
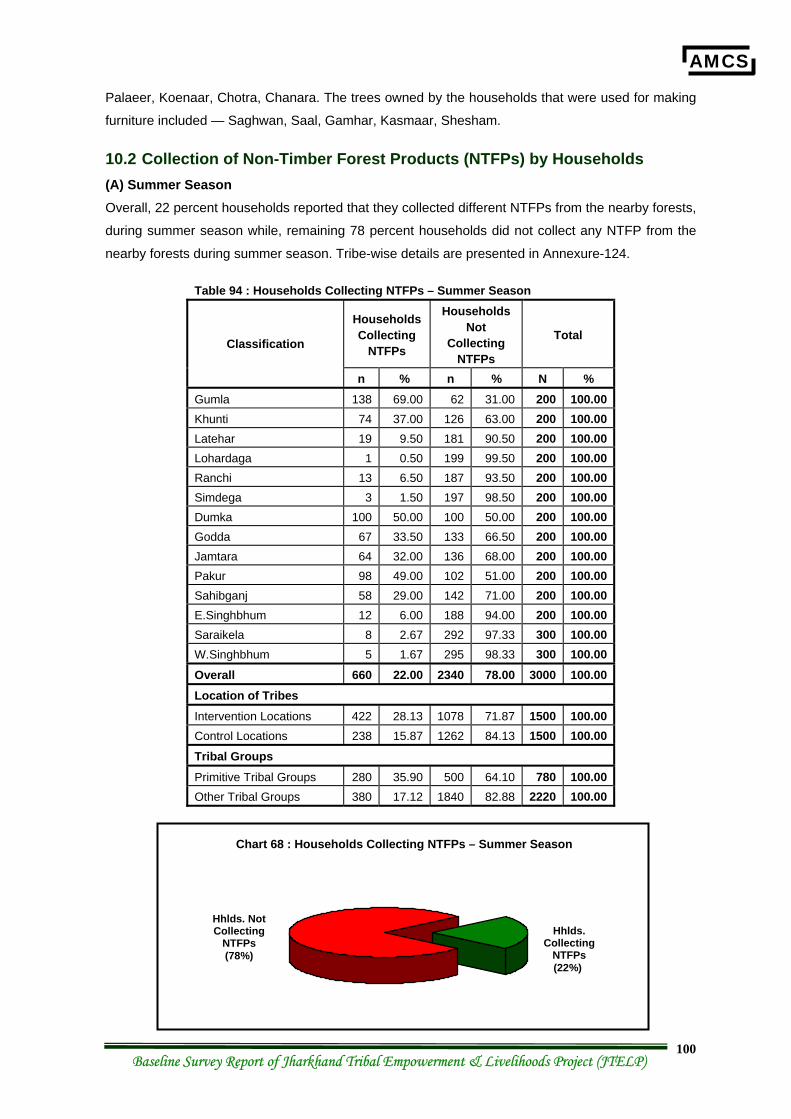
AMCS
Baseline Survey Report of Jharkhand Tribal Empowerment & Livelihoods Project (JTELP) 100
Palaeer, Koenaar, Chotra, Chanara. The trees owned by the households that were used for making
furniture included — Saghwan, Saal, Gamhar, Kasmaar, Shesham.
10.2 Collection of Non-Timber Forest Products (NTFPs) by Households (A) Summer Season Overall, 22 percent households reported that they collected different NTFPs from the nearby forests,
during summer season while, remaining 78 percent households did not collect any NTFP from the
nearby forests during summer season. Tribe-wise details are presented in Annexure-124.
Table 94 : Households Collecting NTFPs – Summer Season
Households Collecting
NTFPs
Households Not
Collecting NTFPs
Total Classification
n % n % N % Gumla 138 69.00 62 31.00 200 100.00 Khunti 74 37.00 126 63.00 200 100.00 Latehar 19 9.50 181 90.50 200 100.00 Lohardaga 1 0.50 199 99.50 200 100.00 Ranchi 13 6.50 187 93.50 200 100.00 Simdega 3 1.50 197 98.50 200 100.00 Dumka 100 50.00 100 50.00 200 100.00 Godda 67 33.50 133 66.50 200 100.00 Jamtara 64 32.00 136 68.00 200 100.00 Pakur 98 49.00 102 51.00 200 100.00 Sahibganj 58 29.00 142 71.00 200 100.00 E.Singhbhum 12 6.00 188 94.00 200 100.00 Saraikela 8 2.67 292 97.33 300 100.00 W.Singhbhum 5 1.67 295 98.33 300 100.00 Overall 660 22.00 2340 78.00 3000 100.00 Location of Tribes Intervention Locations 422 28.13 1078 71.87 1500 100.00 Control Locations 238 15.87 1262 84.13 1500 100.00 Tribal Groups Primitive Tribal Groups 280 35.90 500 64.10 780 100.00 Other Tribal Groups 380 17.12 1840 82.88 2220 100.00
Chart 68 : Households Collecting NTFPs – Summer Season
Hhlds. Not Collecting
NTFPs (78%)
Hhlds. Collecting
NTFPs (22%)
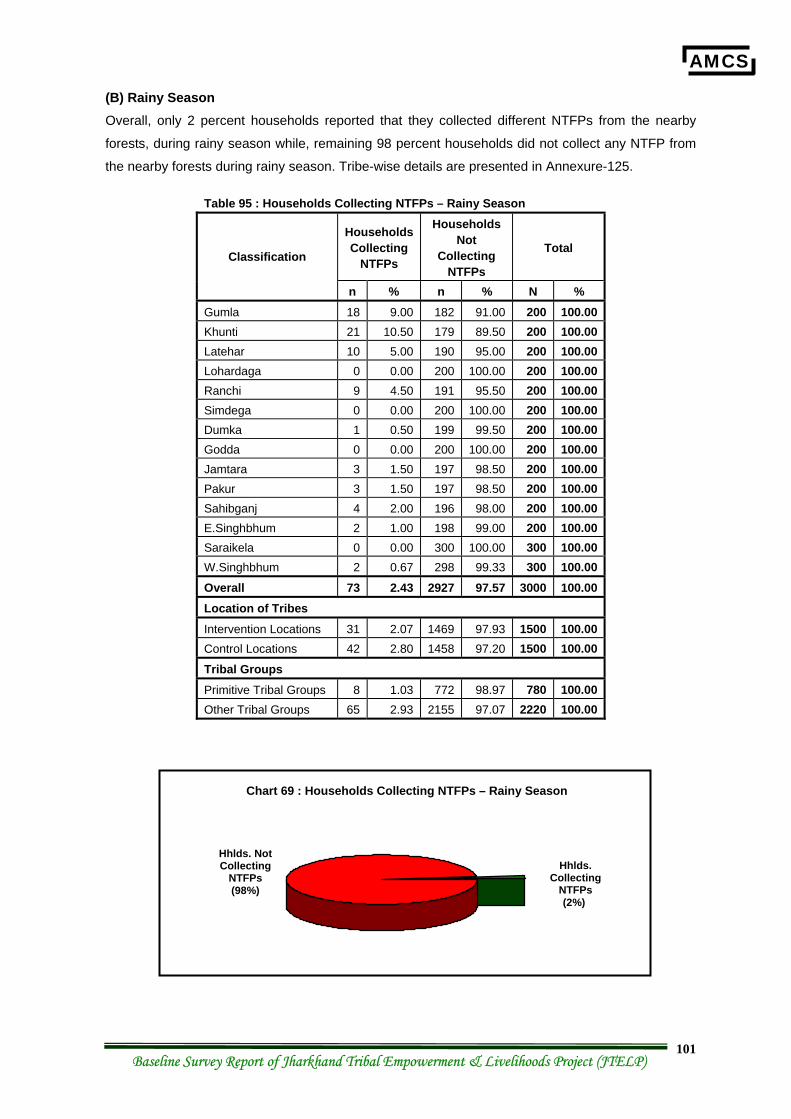
AMCS
Baseline Survey Report of Jharkhand Tribal Empowerment & Livelihoods Project (JTELP) 101
(B) Rainy Season Overall, only 2 percent households reported that they collected different NTFPs from the nearby
forests, during rainy season while, remaining 98 percent households did not collect any NTFP from
the nearby forests during rainy season. Tribe-wise details are presented in Annexure-125.
Table 95 : Households Collecting NTFPs – Rainy Season
Households Collecting
NTFPs
Households Not
Collecting NTFPs
Total Classification
n % n % N % Gumla 18 9.00 182 91.00 200 100.00 Khunti 21 10.50 179 89.50 200 100.00 Latehar 10 5.00 190 95.00 200 100.00 Lohardaga 0 0.00 200 100.00 200 100.00 Ranchi 9 4.50 191 95.50 200 100.00 Simdega 0 0.00 200 100.00 200 100.00 Dumka 1 0.50 199 99.50 200 100.00 Godda 0 0.00 200 100.00 200 100.00 Jamtara 3 1.50 197 98.50 200 100.00 Pakur 3 1.50 197 98.50 200 100.00 Sahibganj 4 2.00 196 98.00 200 100.00 E.Singhbhum 2 1.00 198 99.00 200 100.00 Saraikela 0 0.00 300 100.00 300 100.00 W.Singhbhum 2 0.67 298 99.33 300 100.00 Overall 73 2.43 2927 97.57 3000 100.00 Location of Tribes Intervention Locations 31 2.07 1469 97.93 1500 100.00 Control Locations 42 2.80 1458 97.20 1500 100.00 Tribal Groups Primitive Tribal Groups 8 1.03 772 98.97 780 100.00 Other Tribal Groups 65 2.93 2155 97.07 2220 100.00
Chart 69 : Households Collecting NTFPs – Rainy Season
Hhlds. Not Collecting
NTFPs (98%)
Hhlds. Collecting
NTFPs (2%)
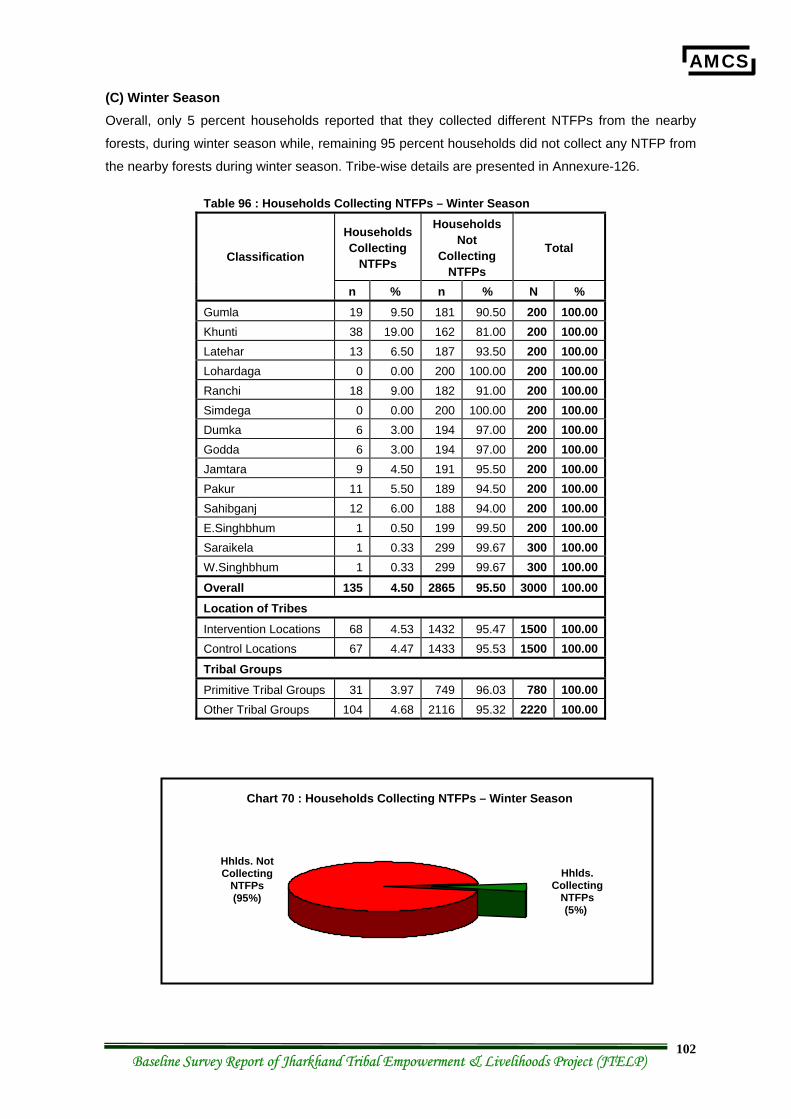
AMCS
Baseline Survey Report of Jharkhand Tribal Empowerment & Livelihoods Project (JTELP) 102
(C) Winter Season Overall, only 5 percent households reported that they collected different NTFPs from the nearby
forests, during winter season while, remaining 95 percent households did not collect any NTFP from
the nearby forests during winter season. Tribe-wise details are presented in Annexure-126.
Table 96 : Households Collecting NTFPs – Winter Season
Households Collecting
NTFPs
Households Not
Collecting NTFPs
Total Classification
n % n % N % Gumla 19 9.50 181 90.50 200 100.00 Khunti 38 19.00 162 81.00 200 100.00 Latehar 13 6.50 187 93.50 200 100.00 Lohardaga 0 0.00 200 100.00 200 100.00 Ranchi 18 9.00 182 91.00 200 100.00 Simdega 0 0.00 200 100.00 200 100.00 Dumka 6 3.00 194 97.00 200 100.00 Godda 6 3.00 194 97.00 200 100.00 Jamtara 9 4.50 191 95.50 200 100.00 Pakur 11 5.50 189 94.50 200 100.00 Sahibganj 12 6.00 188 94.00 200 100.00 E.Singhbhum 1 0.50 199 99.50 200 100.00 Saraikela 1 0.33 299 99.67 300 100.00 W.Singhbhum 1 0.33 299 99.67 300 100.00 Overall 135 4.50 2865 95.50 3000 100.00 Location of Tribes Intervention Locations 68 4.53 1432 95.47 1500 100.00 Control Locations 67 4.47 1433 95.53 1500 100.00 Tribal Groups Primitive Tribal Groups 31 3.97 749 96.03 780 100.00 Other Tribal Groups 104 4.68 2116 95.32 2220 100.00
Chart 70 : Households Collecting NTFPs – Winter Season
Hhlds. Not Collecting
NTFPs (95%)
Hhlds. Collecting
NTFPs (5%)
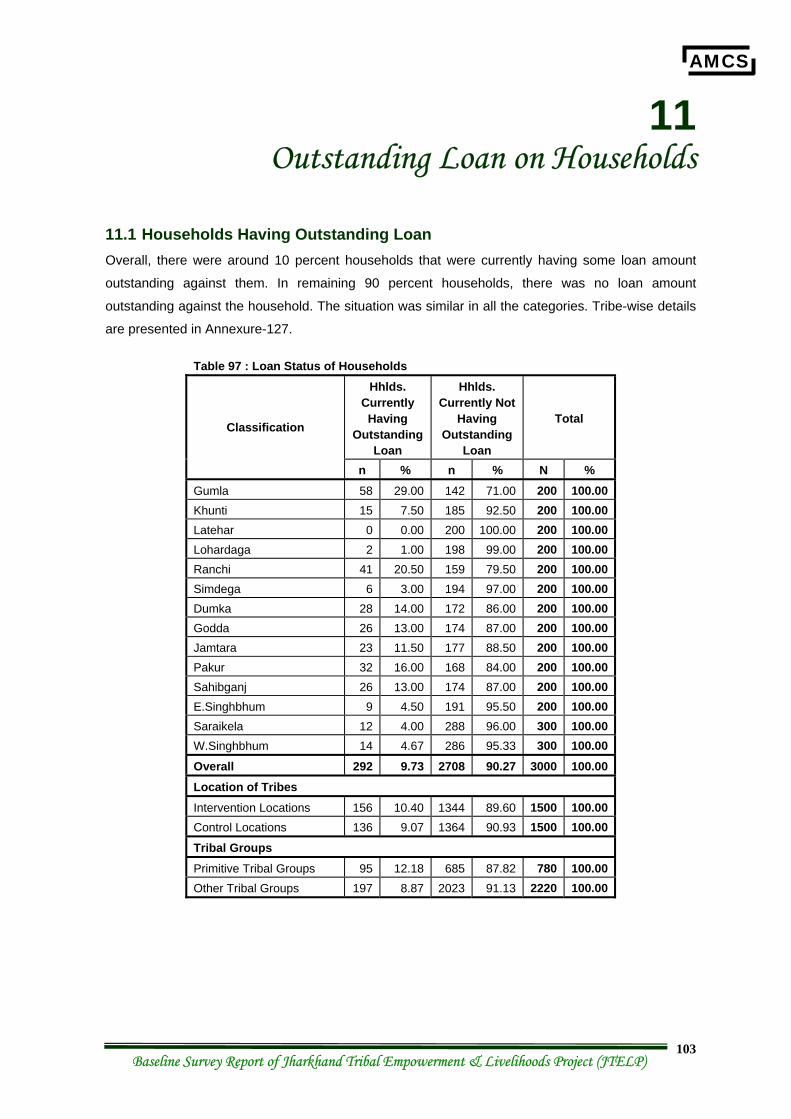
AMCS
Baseline Survey Report of Jharkhand Tribal Empowerment & Livelihoods Project (JTELP) 103
11 Outstanding Loan on Households
11.1 Households Having Outstanding Loan Overall, there were around 10 percent households that were currently having some loan amount
outstanding against them. In remaining 90 percent households, there was no loan amount
outstanding against the household. The situation was similar in all the categories. Tribe-wise details
are presented in Annexure-127.
Table 97 : Loan Status of Households Hhlds.
Currently Having
Outstanding Loan
Hhlds. Currently Not
Having Outstanding
Loan
Total Classification
n % n % N % Gumla 58 29.00 142 71.00 200 100.00 Khunti 15 7.50 185 92.50 200 100.00 Latehar 0 0.00 200 100.00 200 100.00 Lohardaga 2 1.00 198 99.00 200 100.00 Ranchi 41 20.50 159 79.50 200 100.00 Simdega 6 3.00 194 97.00 200 100.00 Dumka 28 14.00 172 86.00 200 100.00 Godda 26 13.00 174 87.00 200 100.00 Jamtara 23 11.50 177 88.50 200 100.00 Pakur 32 16.00 168 84.00 200 100.00 Sahibganj 26 13.00 174 87.00 200 100.00 E.Singhbhum 9 4.50 191 95.50 200 100.00 Saraikela 12 4.00 288 96.00 300 100.00 W.Singhbhum 14 4.67 286 95.33 300 100.00 Overall 292 9.73 2708 90.27 3000 100.00 Location of Tribes Intervention Locations 156 10.40 1344 89.60 1500 100.00 Control Locations 136 9.07 1364 90.93 1500 100.00 Tribal Groups Primitive Tribal Groups 95 12.18 685 87.82 780 100.00 Other Tribal Groups 197 8.87 2023 91.13 2220 100.00
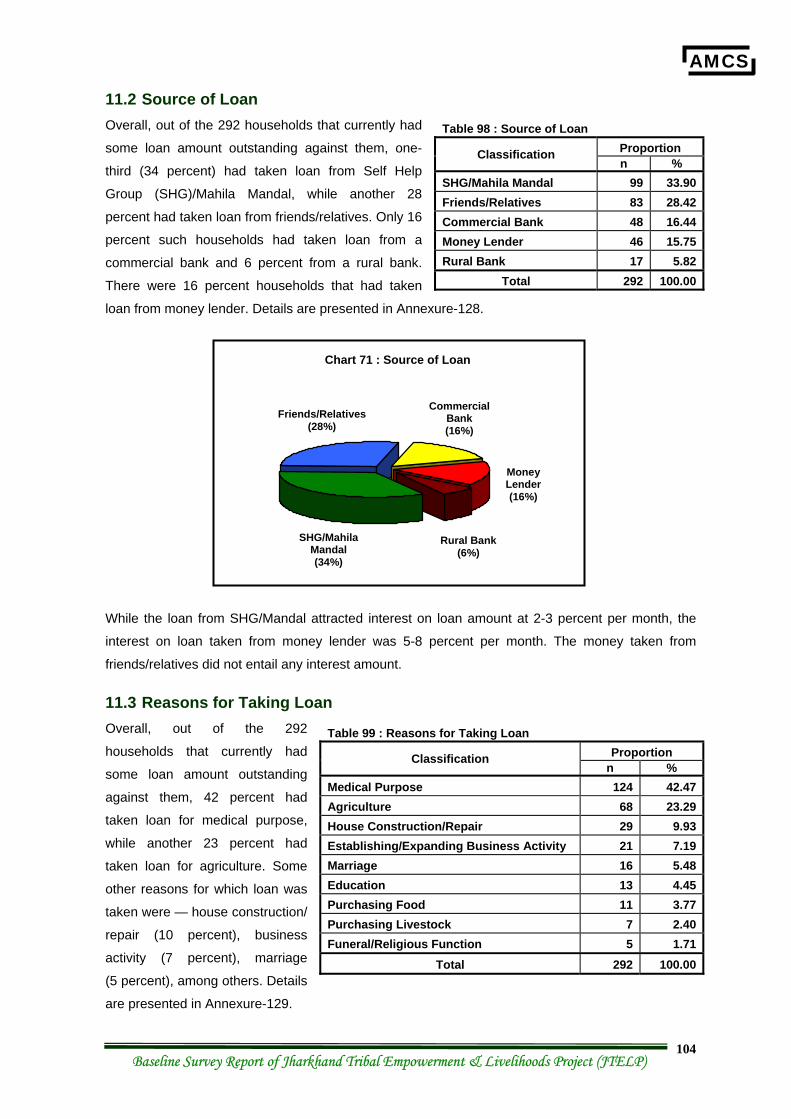
AMCS
Baseline Survey Report of Jharkhand Tribal Empowerment & Livelihoods Project (JTELP) 104
11.2 Source of Loan Overall, out of the 292 households that currently had
some loan amount outstanding against them, one-
third (34 percent) had taken loan from Self Help
Group (SHG)/Mahila Mandal, while another 28
percent had taken loan from friends/relatives. Only 16
percent such households had taken loan from a
commercial bank and 6 percent from a rural bank.
There were 16 percent households that had taken
loan from money lender. Details are presented in Annexure-128.
While the loan from SHG/Mandal attracted interest on loan amount at 2-3 percent per month, the
interest on loan taken from money lender was 5-8 percent per month. The money taken from
friends/relatives did not entail any interest amount.
11.3 Reasons for Taking Loan Overall, out of the 292
households that currently had
some loan amount outstanding
against them, 42 percent had
taken loan for medical purpose,
while another 23 percent had
taken loan for agriculture. Some
other reasons for which loan was
taken were — house construction/
repair (10 percent), business
activity (7 percent), marriage
(5 percent), among others. Details
are presented in Annexure-129.
Table 98 : Source of Loan Proportion Classification n %
SHG/Mahila Mandal 99 33.90Friends/Relatives 83 28.42Commercial Bank 48 16.44Money Lender 46 15.75Rural Bank 17 5.82
Total 292 100.00
Table 99 : Reasons for Taking Loan Proportion Classification
n % Medical Purpose 124 42.47Agriculture 68 23.29House Construction/Repair 29 9.93Establishing/Expanding Business Activity 21 7.19Marriage 16 5.48Education 13 4.45Purchasing Food 11 3.77Purchasing Livestock 7 2.40Funeral/Religious Function 5 1.71
Total 292 100.00
Chart 71 : Source of Loan
Friends/Relatives (28%)
Commercial Bank (16%)
Money Lender (16%)
SHG/Mahila Mandal (34%)
Rural Bank (6%)
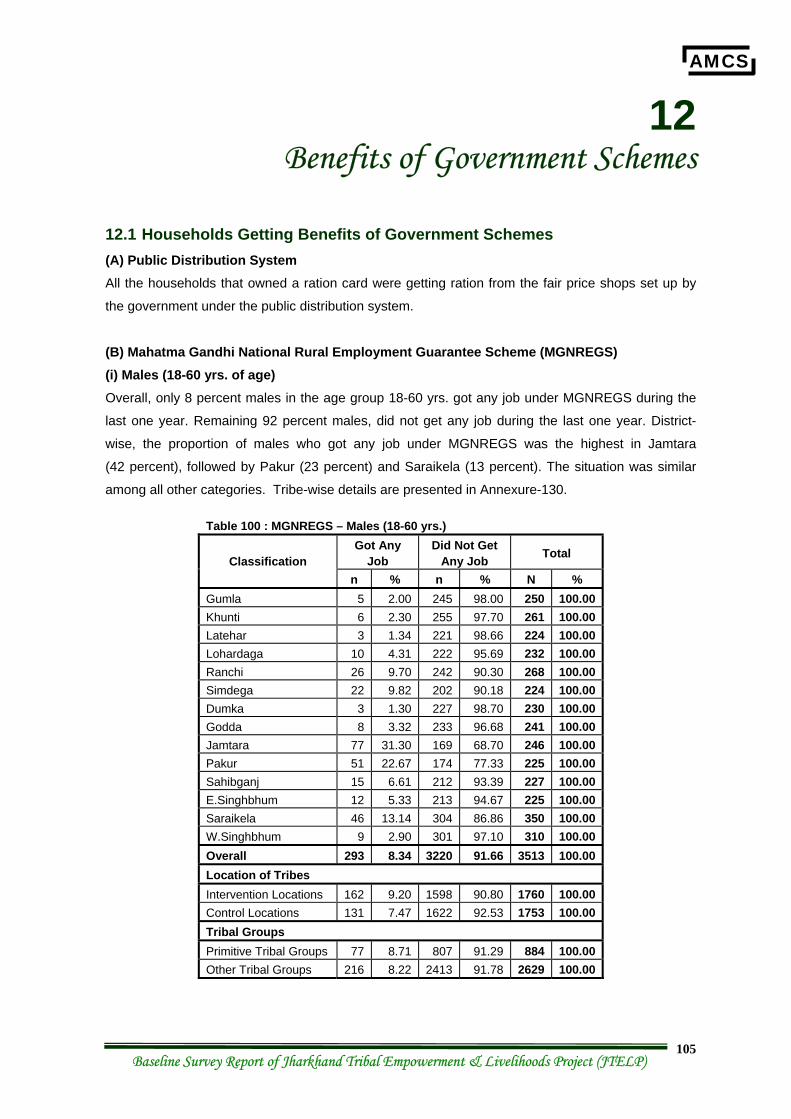
AMCS
Baseline Survey Report of Jharkhand Tribal Empowerment & Livelihoods Project (JTELP) 105
12 Benefits of Government Schemes
12.1 Households Getting Benefits of Government Schemes (A) Public Distribution System All the households that owned a ration card were getting ration from the fair price shops set up by
the government under the public distribution system.
(B) Mahatma Gandhi National Rural Employment Guarantee Scheme (MGNREGS) (i) Males (18-60 yrs. of age) Overall, only 8 percent males in the age group 18-60 yrs. got any job under MGNREGS during the
last one year. Remaining 92 percent males, did not get any job during the last one year. District-
wise, the proportion of males who got any job under MGNREGS was the highest in Jamtara
(42 percent), followed by Pakur (23 percent) and Saraikela (13 percent). The situation was similar
among all other categories. Tribe-wise details are presented in Annexure-130.
Table 100 : MGNREGS – Males (18-60 yrs.) Got Any
Job Did Not Get
Any Job Total Classification n % n % N %
Gumla 5 2.00 245 98.00 250 100.00 Khunti 6 2.30 255 97.70 261 100.00 Latehar 3 1.34 221 98.66 224 100.00 Lohardaga 10 4.31 222 95.69 232 100.00 Ranchi 26 9.70 242 90.30 268 100.00 Simdega 22 9.82 202 90.18 224 100.00 Dumka 3 1.30 227 98.70 230 100.00 Godda 8 3.32 233 96.68 241 100.00 Jamtara 77 31.30 169 68.70 246 100.00 Pakur 51 22.67 174 77.33 225 100.00 Sahibganj 15 6.61 212 93.39 227 100.00 E.Singhbhum 12 5.33 213 94.67 225 100.00 Saraikela 46 13.14 304 86.86 350 100.00 W.Singhbhum 9 2.90 301 97.10 310 100.00 Overall 293 8.34 3220 91.66 3513 100.00 Location of Tribes Intervention Locations 162 9.20 1598 90.80 1760 100.00 Control Locations 131 7.47 1622 92.53 1753 100.00 Tribal Groups Primitive Tribal Groups 77 8.71 807 91.29 884 100.00 Other Tribal Groups 216 8.22 2413 91.78 2629 100.00
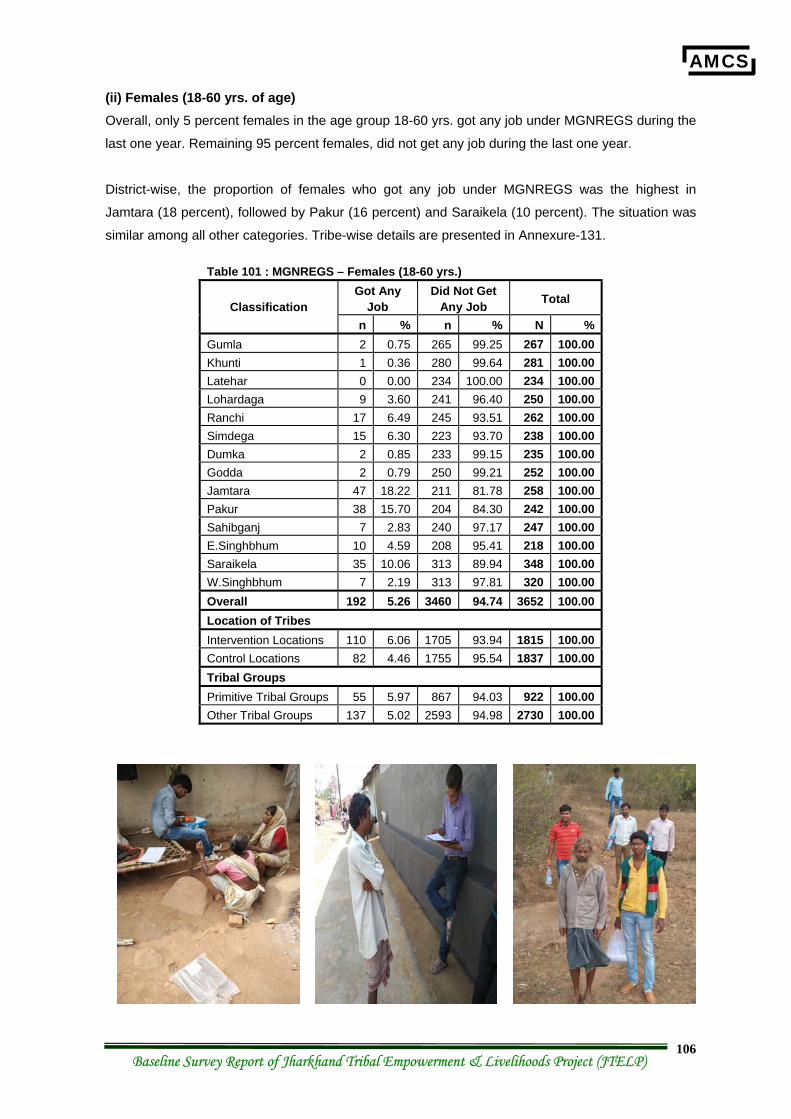
AMCS
Baseline Survey Report of Jharkhand Tribal Empowerment & Livelihoods Project (JTELP) 106
(ii) Females (18-60 yrs. of age) Overall, only 5 percent females in the age group 18-60 yrs. got any job under MGNREGS during the
last one year. Remaining 95 percent females, did not get any job during the last one year.
District-wise, the proportion of females who got any job under MGNREGS was the highest in
Jamtara (18 percent), followed by Pakur (16 percent) and Saraikela (10 percent). The situation was
similar among all other categories. Tribe-wise details are presented in Annexure-131.
Table 101 : MGNREGS – Females (18-60 yrs.) Got Any
Job Did Not Get
Any Job Total Classification n % n % N %
Gumla 2 0.75 265 99.25 267 100.00 Khunti 1 0.36 280 99.64 281 100.00 Latehar 0 0.00 234 100.00 234 100.00 Lohardaga 9 3.60 241 96.40 250 100.00 Ranchi 17 6.49 245 93.51 262 100.00 Simdega 15 6.30 223 93.70 238 100.00 Dumka 2 0.85 233 99.15 235 100.00 Godda 2 0.79 250 99.21 252 100.00 Jamtara 47 18.22 211 81.78 258 100.00 Pakur 38 15.70 204 84.30 242 100.00 Sahibganj 7 2.83 240 97.17 247 100.00 E.Singhbhum 10 4.59 208 95.41 218 100.00 Saraikela 35 10.06 313 89.94 348 100.00 W.Singhbhum 7 2.19 313 97.81 320 100.00 Overall 192 5.26 3460 94.74 3652 100.00 Location of Tribes Intervention Locations 110 6.06 1705 93.94 1815 100.00 Control Locations 82 4.46 1755 95.54 1837 100.00 Tribal Groups Primitive Tribal Groups 55 5.97 867 94.03 922 100.00 Other Tribal Groups 137 5.02 2593 94.98 2730 100.00
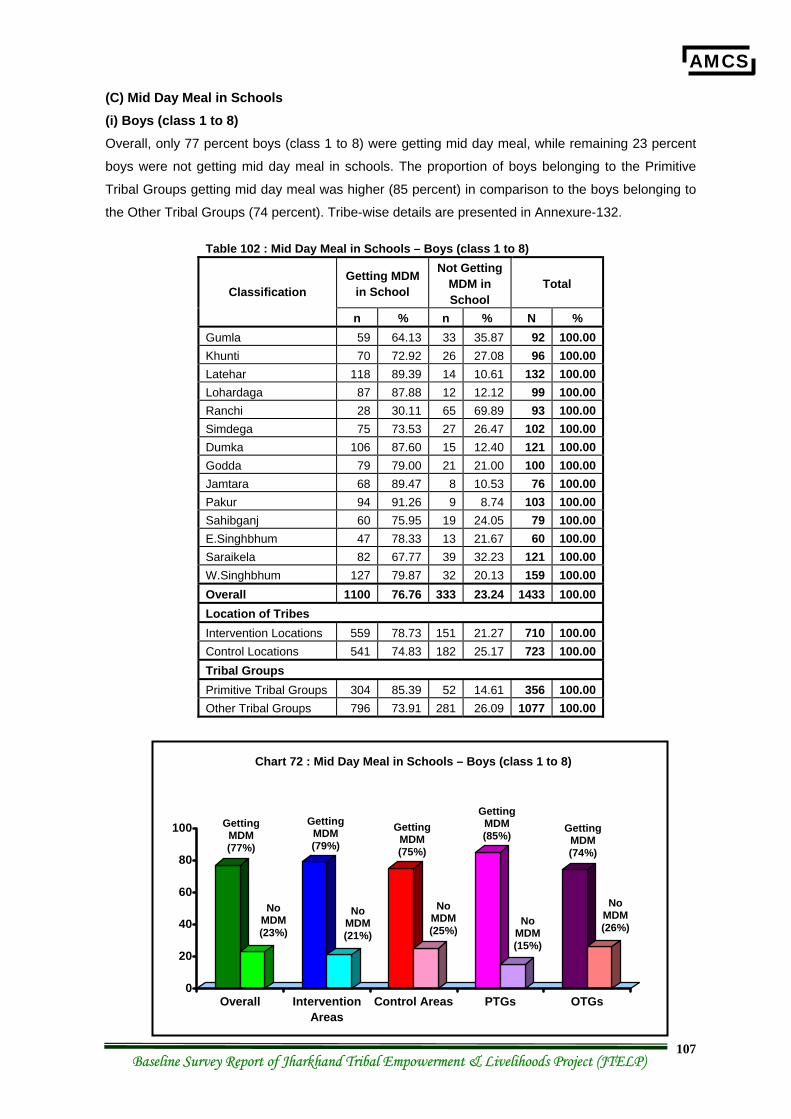
AMCS
Baseline Survey Report of Jharkhand Tribal Empowerment & Livelihoods Project (JTELP) 107
(C) Mid Day Meal in Schools (i) Boys (class 1 to 8) Overall, only 77 percent boys (class 1 to 8) were getting mid day meal, while remaining 23 percent
boys were not getting mid day meal in schools. The proportion of boys belonging to the Primitive
Tribal Groups getting mid day meal was higher (85 percent) in comparison to the boys belonging to
the Other Tribal Groups (74 percent). Tribe-wise details are presented in Annexure-132.
Table 102 : Mid Day Meal in Schools – Boys (class 1 to 8)
Getting MDM in School
Not Getting MDM in School
Total Classification
n % n % N % Gumla 59 64.13 33 35.87 92 100.00 Khunti 70 72.92 26 27.08 96 100.00 Latehar 118 89.39 14 10.61 132 100.00 Lohardaga 87 87.88 12 12.12 99 100.00 Ranchi 28 30.11 65 69.89 93 100.00 Simdega 75 73.53 27 26.47 102 100.00 Dumka 106 87.60 15 12.40 121 100.00 Godda 79 79.00 21 21.00 100 100.00 Jamtara 68 89.47 8 10.53 76 100.00 Pakur 94 91.26 9 8.74 103 100.00 Sahibganj 60 75.95 19 24.05 79 100.00 E.Singhbhum 47 78.33 13 21.67 60 100.00 Saraikela 82 67.77 39 32.23 121 100.00 W.Singhbhum 127 79.87 32 20.13 159 100.00 Overall 1100 76.76 333 23.24 1433 100.00 Location of Tribes Intervention Locations 559 78.73 151 21.27 710 100.00 Control Locations 541 74.83 182 25.17 723 100.00 Tribal Groups Primitive Tribal Groups 304 85.39 52 14.61 356 100.00 Other Tribal Groups 796 73.91 281 26.09 1077 100.00
0
20
40
60
80
100
Overall InterventionAreas
Control Areas PTGs OTGs
Getting MDM (77%)
Chart 72 : Mid Day Meal in Schools – Boys (class 1 to 8)
No MDM (23%)
Getting MDM (79%)
No MDM (21%)
Getting MDM (75%)
No MDM (25%)
Getting MDM (85%)
No MDM (15%)
Getting MDM (74%)
No MDM (26%)
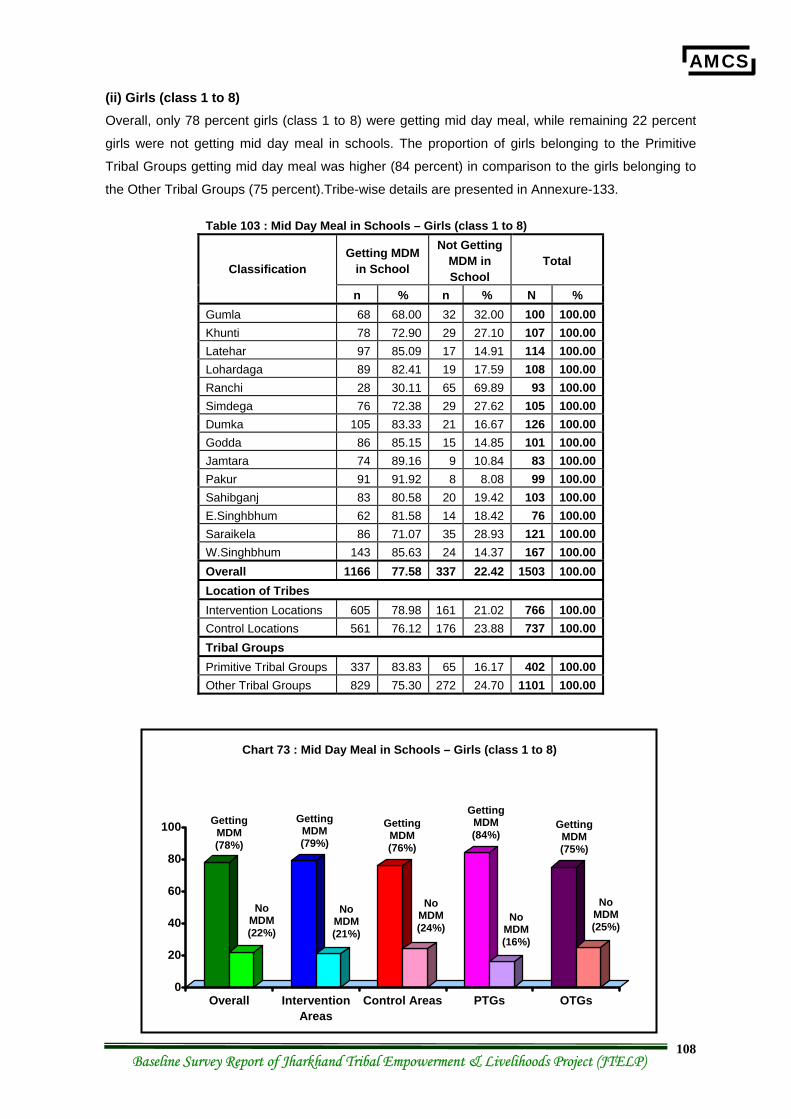
AMCS
Baseline Survey Report of Jharkhand Tribal Empowerment & Livelihoods Project (JTELP) 108
(ii) Girls (class 1 to 8) Overall, only 78 percent girls (class 1 to 8) were getting mid day meal, while remaining 22 percent
girls were not getting mid day meal in schools. The proportion of girls belonging to the Primitive
Tribal Groups getting mid day meal was higher (84 percent) in comparison to the girls belonging to
the Other Tribal Groups (75 percent).Tribe-wise details are presented in Annexure-133.
Table 103 : Mid Day Meal in Schools – Girls (class 1 to 8)
Getting MDM in School
Not Getting MDM in School
Total Classification
n % n % N % Gumla 68 68.00 32 32.00 100 100.00 Khunti 78 72.90 29 27.10 107 100.00 Latehar 97 85.09 17 14.91 114 100.00 Lohardaga 89 82.41 19 17.59 108 100.00 Ranchi 28 30.11 65 69.89 93 100.00 Simdega 76 72.38 29 27.62 105 100.00 Dumka 105 83.33 21 16.67 126 100.00 Godda 86 85.15 15 14.85 101 100.00 Jamtara 74 89.16 9 10.84 83 100.00 Pakur 91 91.92 8 8.08 99 100.00 Sahibganj 83 80.58 20 19.42 103 100.00 E.Singhbhum 62 81.58 14 18.42 76 100.00 Saraikela 86 71.07 35 28.93 121 100.00 W.Singhbhum 143 85.63 24 14.37 167 100.00 Overall 1166 77.58 337 22.42 1503 100.00 Location of Tribes Intervention Locations 605 78.98 161 21.02 766 100.00 Control Locations 561 76.12 176 23.88 737 100.00 Tribal Groups Primitive Tribal Groups 337 83.83 65 16.17 402 100.00 Other Tribal Groups 829 75.30 272 24.70 1101 100.00
0
20
40
60
80
100
Overall InterventionAreas
Control Areas PTGs OTGs
Getting MDM (78%)
Chart 73 : Mid Day Meal in Schools – Girls (class 1 to 8)
No MDM (22%)
Getting MDM (79%)
No MDM (21%)
Getting MDM (76%)
No MDM (24%)
Getting MDM (84%)
No MDM (16%)
Getting MDM (75%)
No MDM (25%)
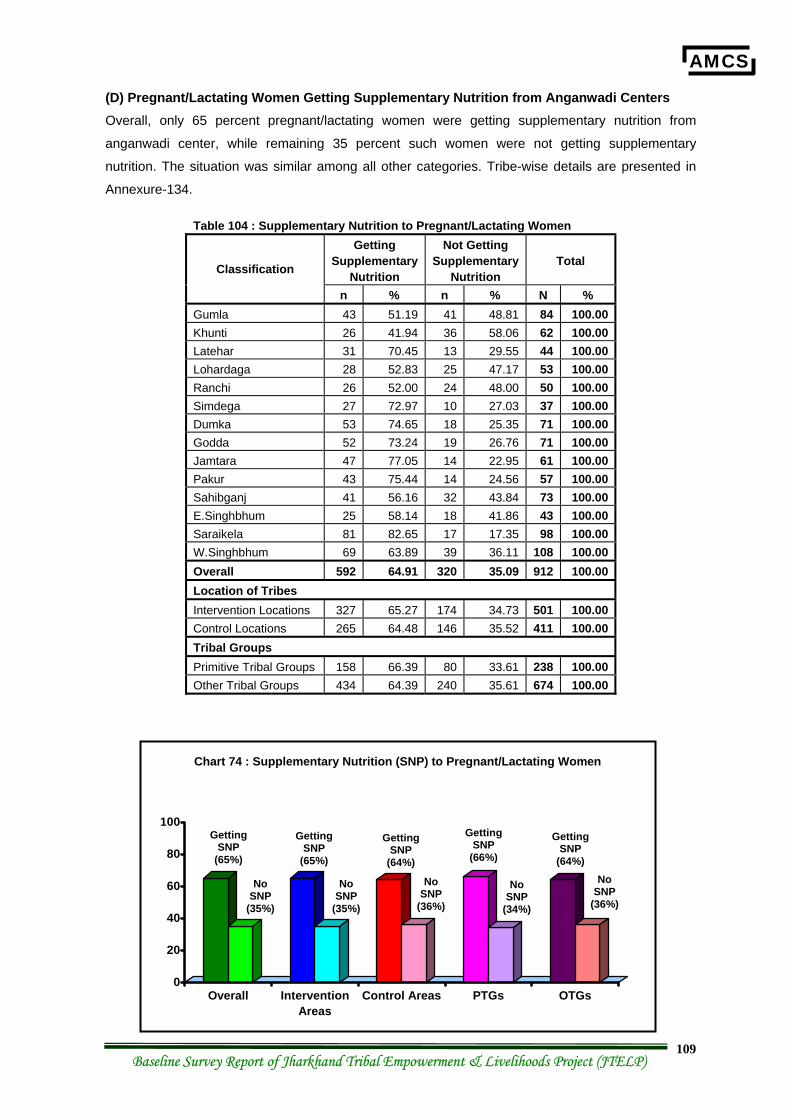
AMCS
Baseline Survey Report of Jharkhand Tribal Empowerment & Livelihoods Project (JTELP) 109
(D) Pregnant/Lactating Women Getting Supplementary Nutrition from Anganwadi Centers Overall, only 65 percent pregnant/lactating women were getting supplementary nutrition from
anganwadi center, while remaining 35 percent such women were not getting supplementary
nutrition. The situation was similar among all other categories. Tribe-wise details are presented in
Annexure-134.
Table 104 : Supplementary Nutrition to Pregnant/Lactating Women Getting
Supplementary Nutrition
Not Getting Supplementary
Nutrition Total Classification
n % n % N % Gumla 43 51.19 41 48.81 84 100.00 Khunti 26 41.94 36 58.06 62 100.00 Latehar 31 70.45 13 29.55 44 100.00 Lohardaga 28 52.83 25 47.17 53 100.00 Ranchi 26 52.00 24 48.00 50 100.00 Simdega 27 72.97 10 27.03 37 100.00 Dumka 53 74.65 18 25.35 71 100.00 Godda 52 73.24 19 26.76 71 100.00 Jamtara 47 77.05 14 22.95 61 100.00 Pakur 43 75.44 14 24.56 57 100.00 Sahibganj 41 56.16 32 43.84 73 100.00 E.Singhbhum 25 58.14 18 41.86 43 100.00 Saraikela 81 82.65 17 17.35 98 100.00 W.Singhbhum 69 63.89 39 36.11 108 100.00 Overall 592 64.91 320 35.09 912 100.00 Location of Tribes Intervention Locations 327 65.27 174 34.73 501 100.00 Control Locations 265 64.48 146 35.52 411 100.00 Tribal Groups Primitive Tribal Groups 158 66.39 80 33.61 238 100.00 Other Tribal Groups 434 64.39 240 35.61 674 100.00
0
20
40
60
80
100
Overall InterventionAreas
Control Areas PTGs OTGs
Getting SNP
(65%)
Chart 74 : Supplementary Nutrition (SNP) to Pregnant/Lactating Women
No SNP
(35%)
Getting SNP
(65%)
No SNP
(35%)
Getting SNP
(64%)
No SNP
(36%)
Getting SNP
(66%)
No SNP
(34%)
Getting SNP
(64%) No
SNP (36%)
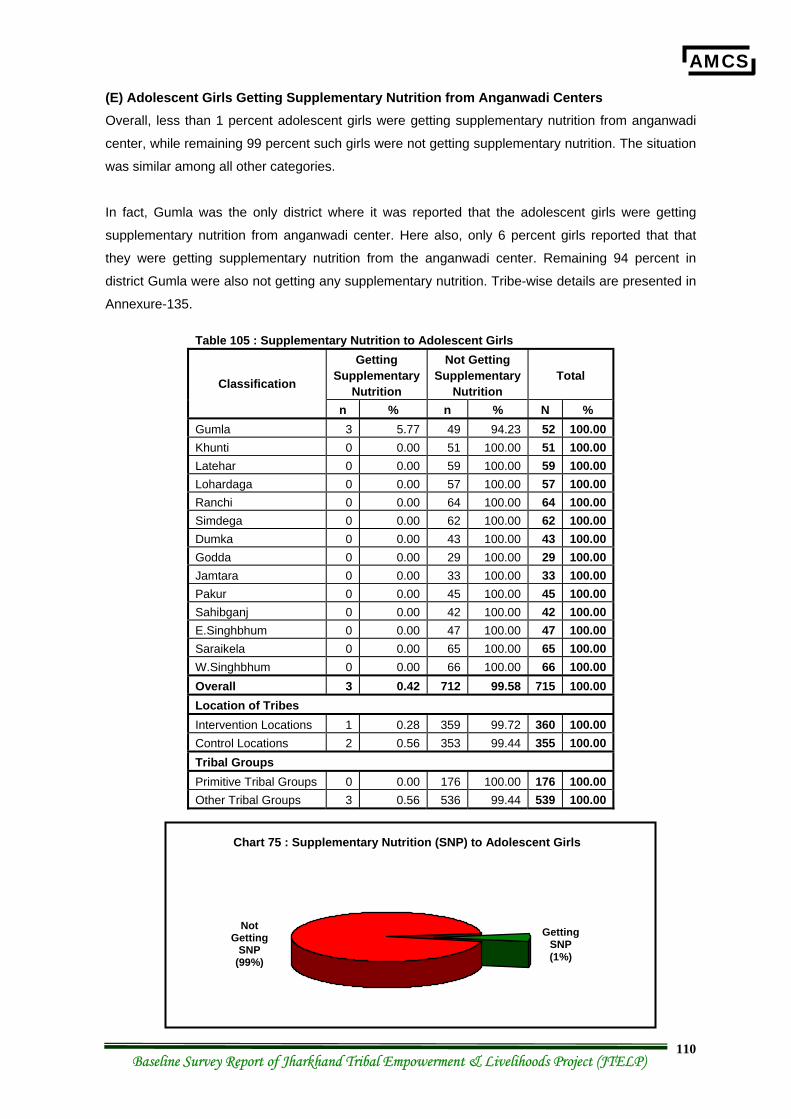
AMCS
Baseline Survey Report of Jharkhand Tribal Empowerment & Livelihoods Project (JTELP) 110
(E) Adolescent Girls Getting Supplementary Nutrition from Anganwadi Centers Overall, less than 1 percent adolescent girls were getting supplementary nutrition from anganwadi
center, while remaining 99 percent such girls were not getting supplementary nutrition. The situation
was similar among all other categories.
In fact, Gumla was the only district where it was reported that the adolescent girls were getting
supplementary nutrition from anganwadi center. Here also, only 6 percent girls reported that that
they were getting supplementary nutrition from the anganwadi center. Remaining 94 percent in
district Gumla were also not getting any supplementary nutrition. Tribe-wise details are presented in
Annexure-135.
Table 105 : Supplementary Nutrition to Adolescent Girls Getting
Supplementary Nutrition
Not Getting Supplementary
Nutrition Total Classification
n % n % N % Gumla 3 5.77 49 94.23 52 100.00 Khunti 0 0.00 51 100.00 51 100.00 Latehar 0 0.00 59 100.00 59 100.00 Lohardaga 0 0.00 57 100.00 57 100.00 Ranchi 0 0.00 64 100.00 64 100.00 Simdega 0 0.00 62 100.00 62 100.00 Dumka 0 0.00 43 100.00 43 100.00 Godda 0 0.00 29 100.00 29 100.00 Jamtara 0 0.00 33 100.00 33 100.00 Pakur 0 0.00 45 100.00 45 100.00 Sahibganj 0 0.00 42 100.00 42 100.00 E.Singhbhum 0 0.00 47 100.00 47 100.00 Saraikela 0 0.00 65 100.00 65 100.00 W.Singhbhum 0 0.00 66 100.00 66 100.00 Overall 3 0.42 712 99.58 715 100.00 Location of Tribes Intervention Locations 1 0.28 359 99.72 360 100.00 Control Locations 2 0.56 353 99.44 355 100.00 Tribal Groups Primitive Tribal Groups 0 0.00 176 100.00 176 100.00 Other Tribal Groups 3 0.56 536 99.44 539 100.00
Getting SNP (1%)
Chart 75 : Supplementary Nutrition (SNP) to Adolescent Girls
Not Getting
SNP (99%)
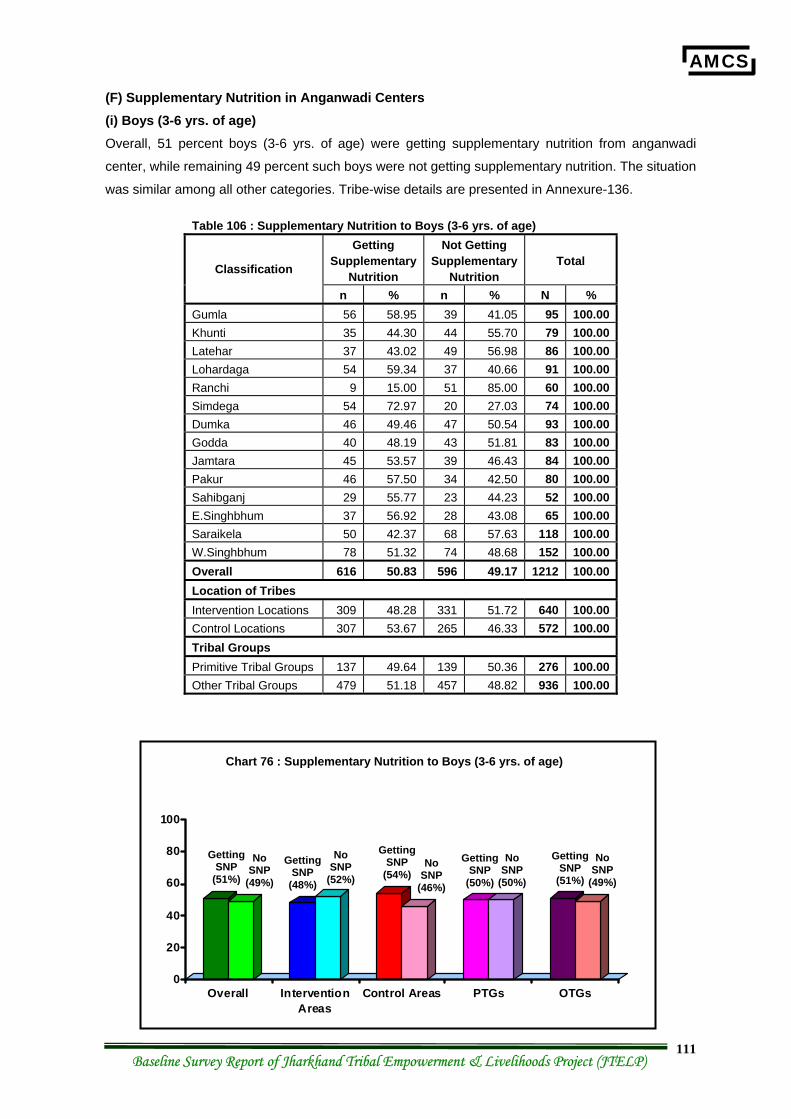
AMCS
Baseline Survey Report of Jharkhand Tribal Empowerment & Livelihoods Project (JTELP) 111
(F) Supplementary Nutrition in Anganwadi Centers (i) Boys (3-6 yrs. of age) Overall, 51 percent boys (3-6 yrs. of age) were getting supplementary nutrition from anganwadi
center, while remaining 49 percent such boys were not getting supplementary nutrition. The situation
was similar among all other categories. Tribe-wise details are presented in Annexure-136.
Table 106 : Supplementary Nutrition to Boys (3-6 yrs. of age) Getting
Supplementary Nutrition
Not Getting Supplementary
Nutrition Total Classification
n % n % N % Gumla 56 58.95 39 41.05 95 100.00 Khunti 35 44.30 44 55.70 79 100.00 Latehar 37 43.02 49 56.98 86 100.00 Lohardaga 54 59.34 37 40.66 91 100.00 Ranchi 9 15.00 51 85.00 60 100.00 Simdega 54 72.97 20 27.03 74 100.00 Dumka 46 49.46 47 50.54 93 100.00 Godda 40 48.19 43 51.81 83 100.00 Jamtara 45 53.57 39 46.43 84 100.00 Pakur 46 57.50 34 42.50 80 100.00 Sahibganj 29 55.77 23 44.23 52 100.00 E.Singhbhum 37 56.92 28 43.08 65 100.00 Saraikela 50 42.37 68 57.63 118 100.00 W.Singhbhum 78 51.32 74 48.68 152 100.00 Overall 616 50.83 596 49.17 1212 100.00 Location of Tribes Intervention Locations 309 48.28 331 51.72 640 100.00 Control Locations 307 53.67 265 46.33 572 100.00 Tribal Groups Primitive Tribal Groups 137 49.64 139 50.36 276 100.00 Other Tribal Groups 479 51.18 457 48.82 936 100.00
0
20
40
60
80
100
Overall InterventionAreas
Control Areas PTGs OTGs
Getting SNP
(51%)
Chart 76 : Supplementary Nutrition to Boys (3-6 yrs. of age)
No SNP
(49%)
Getting SNP
(48%)
No SNP
(52%)
Getting SNP
(54%) No
SNP (46%)
Getting SNP
(50%)
No SNP
(50%)
Getting SNP
(51%)
No SNP
(49%)
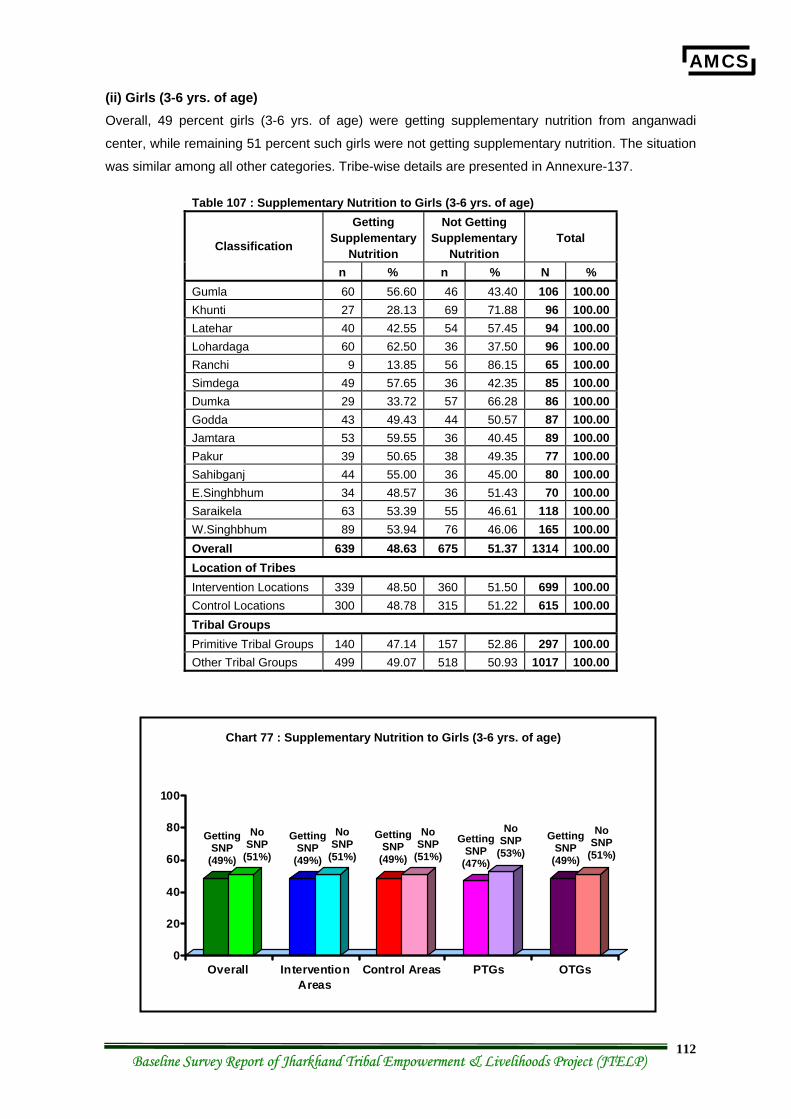
AMCS
Baseline Survey Report of Jharkhand Tribal Empowerment & Livelihoods Project (JTELP) 112
(ii) Girls (3-6 yrs. of age) Overall, 49 percent girls (3-6 yrs. of age) were getting supplementary nutrition from anganwadi
center, while remaining 51 percent such girls were not getting supplementary nutrition. The situation
was similar among all other categories. Tribe-wise details are presented in Annexure-137.
Table 107 : Supplementary Nutrition to Girls (3-6 yrs. of age) Getting
Supplementary Nutrition
Not Getting Supplementary
Nutrition Total Classification
n % n % N % Gumla 60 56.60 46 43.40 106 100.00 Khunti 27 28.13 69 71.88 96 100.00 Latehar 40 42.55 54 57.45 94 100.00 Lohardaga 60 62.50 36 37.50 96 100.00 Ranchi 9 13.85 56 86.15 65 100.00 Simdega 49 57.65 36 42.35 85 100.00 Dumka 29 33.72 57 66.28 86 100.00 Godda 43 49.43 44 50.57 87 100.00 Jamtara 53 59.55 36 40.45 89 100.00 Pakur 39 50.65 38 49.35 77 100.00 Sahibganj 44 55.00 36 45.00 80 100.00 E.Singhbhum 34 48.57 36 51.43 70 100.00 Saraikela 63 53.39 55 46.61 118 100.00 W.Singhbhum 89 53.94 76 46.06 165 100.00 Overall 639 48.63 675 51.37 1314 100.00 Location of Tribes Intervention Locations 339 48.50 360 51.50 699 100.00 Control Locations 300 48.78 315 51.22 615 100.00 Tribal Groups Primitive Tribal Groups 140 47.14 157 52.86 297 100.00 Other Tribal Groups 499 49.07 518 50.93 1017 100.00
0
20
40
60
80
100
Overall InterventionAreas
Control Areas PTGs OTGs
Getting SNP
(49%)
Chart 77 : Supplementary Nutrition to Girls (3-6 yrs. of age)
No SNP
(51%)
Getting SNP
(49%)
No SNP
(51%)
Getting SNP
(49%)
No SNP
(51%) Getting
SNP (47%)
No SNP
(53%) Getting
SNP (49%)
No SNP
(51%)
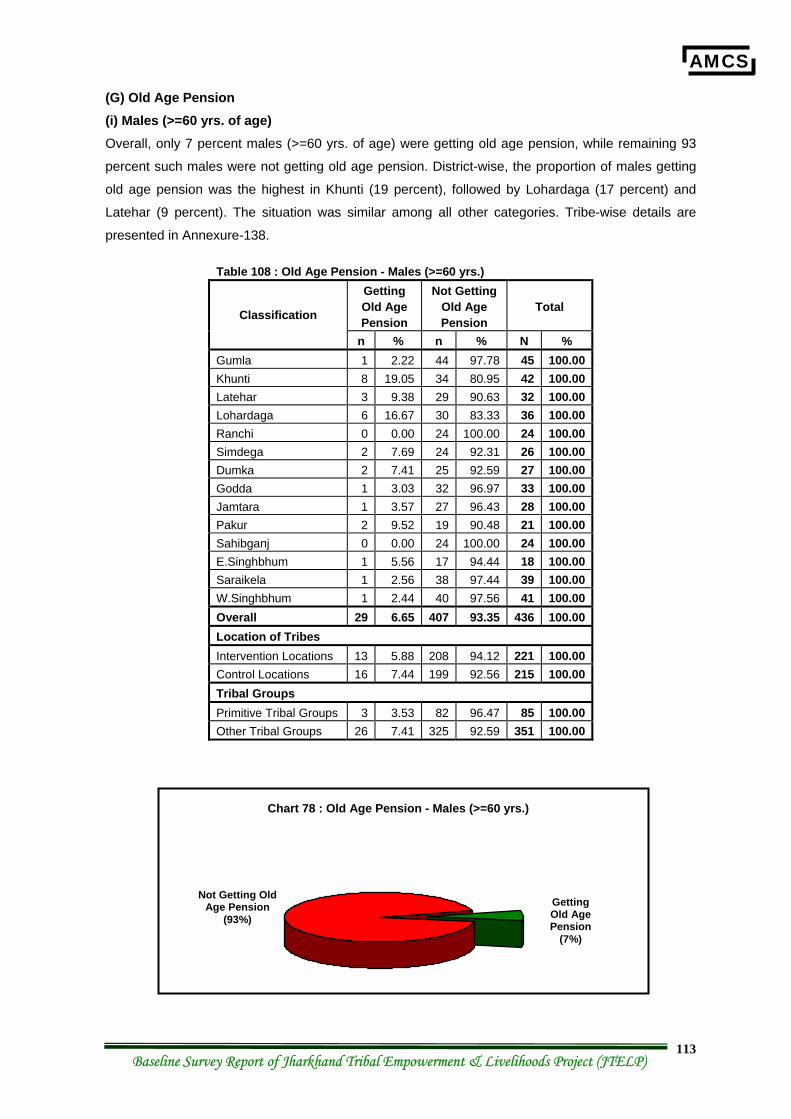
AMCS
Baseline Survey Report of Jharkhand Tribal Empowerment & Livelihoods Project (JTELP) 113
(G) Old Age Pension (i) Males (>=60 yrs. of age) Overall, only 7 percent males (>=60 yrs. of age) were getting old age pension, while remaining 93
percent such males were not getting old age pension. District-wise, the proportion of males getting
old age pension was the highest in Khunti (19 percent), followed by Lohardaga (17 percent) and
Latehar (9 percent). The situation was similar among all other categories. Tribe-wise details are
presented in Annexure-138.
Table 108 : Old Age Pension - Males (>=60 yrs.) Getting Old Age Pension
Not Getting Old Age Pension
Total Classification
n % n % N % Gumla 1 2.22 44 97.78 45 100.00 Khunti 8 19.05 34 80.95 42 100.00 Latehar 3 9.38 29 90.63 32 100.00 Lohardaga 6 16.67 30 83.33 36 100.00 Ranchi 0 0.00 24 100.00 24 100.00 Simdega 2 7.69 24 92.31 26 100.00 Dumka 2 7.41 25 92.59 27 100.00 Godda 1 3.03 32 96.97 33 100.00 Jamtara 1 3.57 27 96.43 28 100.00 Pakur 2 9.52 19 90.48 21 100.00 Sahibganj 0 0.00 24 100.00 24 100.00 E.Singhbhum 1 5.56 17 94.44 18 100.00 Saraikela 1 2.56 38 97.44 39 100.00 W.Singhbhum 1 2.44 40 97.56 41 100.00 Overall 29 6.65 407 93.35 436 100.00 Location of Tribes Intervention Locations 13 5.88 208 94.12 221 100.00 Control Locations 16 7.44 199 92.56 215 100.00 Tribal Groups Primitive Tribal Groups 3 3.53 82 96.47 85 100.00 Other Tribal Groups 26 7.41 325 92.59 351 100.00
Getting Old Age Pension
(7%)
Chart 78 : Old Age Pension - Males (>=60 yrs.)
Not Getting Old Age Pension
(93%)
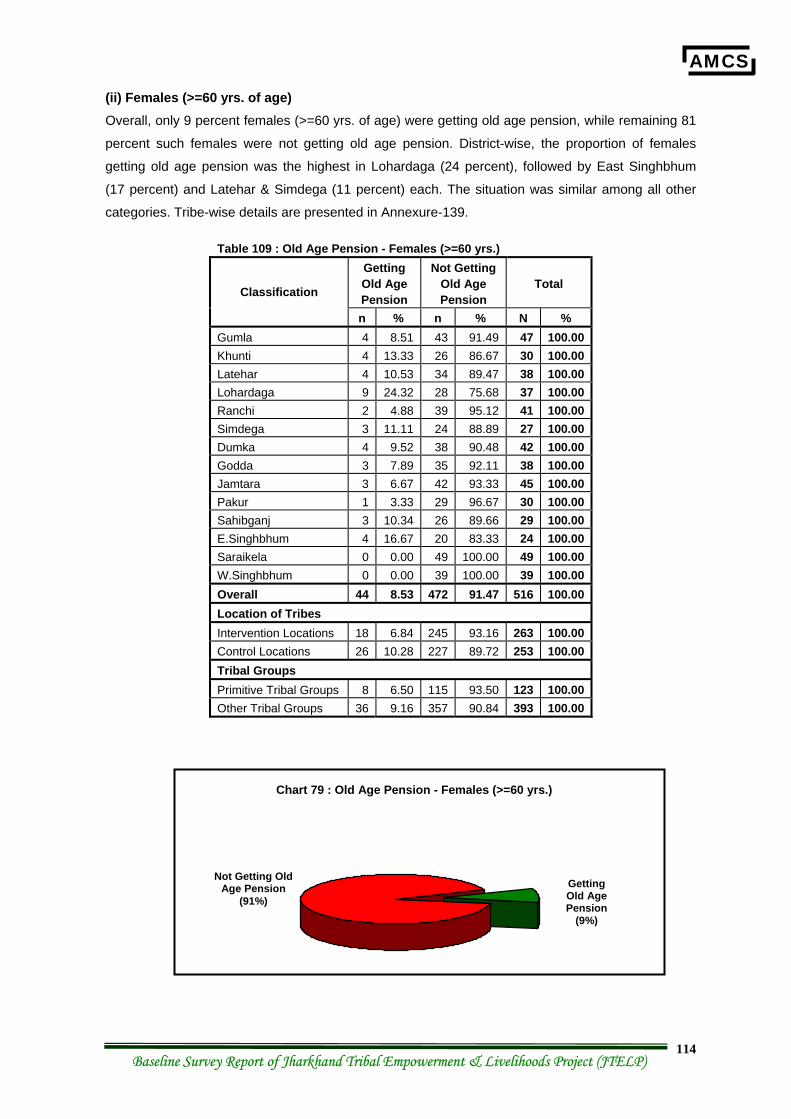
AMCS
Baseline Survey Report of Jharkhand Tribal Empowerment & Livelihoods Project (JTELP) 114
(ii) Females (>=60 yrs. of age) Overall, only 9 percent females (>=60 yrs. of age) were getting old age pension, while remaining 81
percent such females were not getting old age pension. District-wise, the proportion of females
getting old age pension was the highest in Lohardaga (24 percent), followed by East Singhbhum
(17 percent) and Latehar & Simdega (11 percent) each. The situation was similar among all other
categories. Tribe-wise details are presented in Annexure-139.
Table 109 : Old Age Pension - Females (>=60 yrs.) Getting Old Age Pension
Not Getting Old Age Pension
Total Classification
n % n % N % Gumla 4 8.51 43 91.49 47 100.00 Khunti 4 13.33 26 86.67 30 100.00 Latehar 4 10.53 34 89.47 38 100.00 Lohardaga 9 24.32 28 75.68 37 100.00 Ranchi 2 4.88 39 95.12 41 100.00 Simdega 3 11.11 24 88.89 27 100.00 Dumka 4 9.52 38 90.48 42 100.00 Godda 3 7.89 35 92.11 38 100.00 Jamtara 3 6.67 42 93.33 45 100.00 Pakur 1 3.33 29 96.67 30 100.00 Sahibganj 3 10.34 26 89.66 29 100.00 E.Singhbhum 4 16.67 20 83.33 24 100.00 Saraikela 0 0.00 49 100.00 49 100.00 W.Singhbhum 0 0.00 39 100.00 39 100.00 Overall 44 8.53 472 91.47 516 100.00 Location of Tribes Intervention Locations 18 6.84 245 93.16 263 100.00 Control Locations 26 10.28 227 89.72 253 100.00 Tribal Groups Primitive Tribal Groups 8 6.50 115 93.50 123 100.00 Other Tribal Groups 36 9.16 357 90.84 393 100.00
Getting Old Age Pension
(9%)
Chart 79 : Old Age Pension - Females (>=60 yrs.)
Not Getting Old Age Pension
(91%)
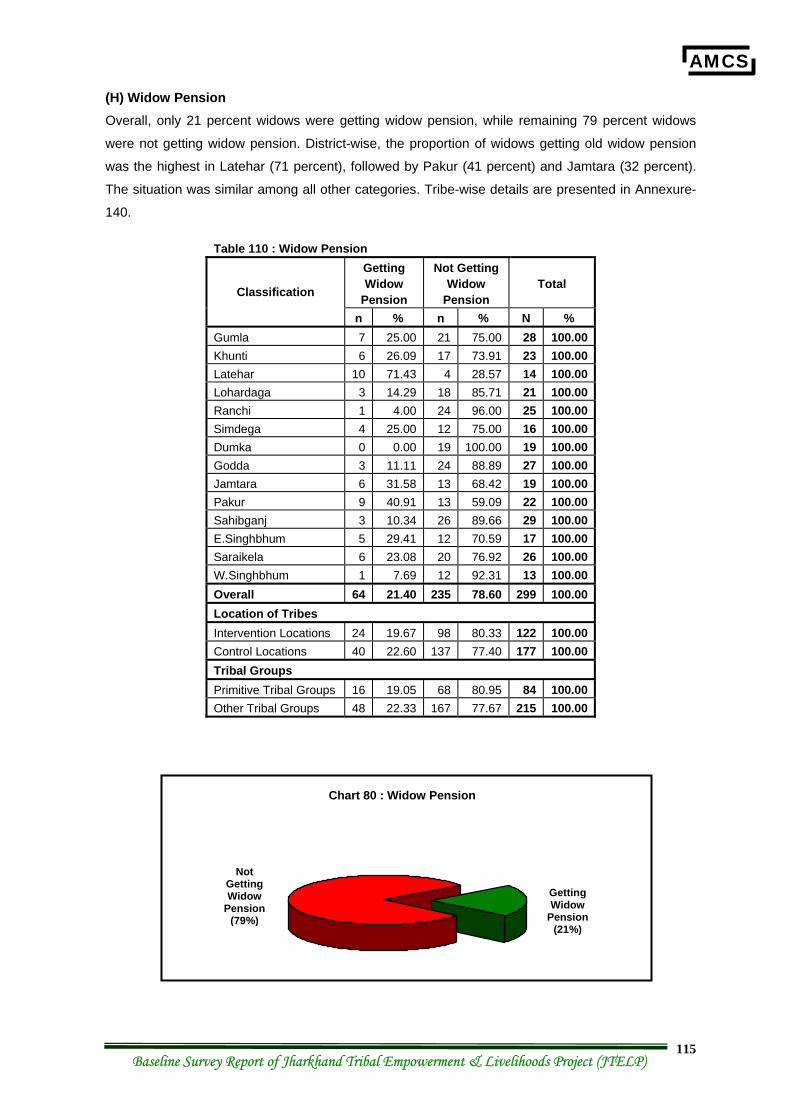
AMCS
Baseline Survey Report of Jharkhand Tribal Empowerment & Livelihoods Project (JTELP) 115
(H) Widow Pension Overall, only 21 percent widows were getting widow pension, while remaining 79 percent widows
were not getting widow pension. District-wise, the proportion of widows getting old widow pension
was the highest in Latehar (71 percent), followed by Pakur (41 percent) and Jamtara (32 percent).
The situation was similar among all other categories. Tribe-wise details are presented in Annexure-
140.
Table 110 : Widow Pension Getting Widow
Pension
Not Getting Widow
Pension Total Classification
n % n % N % Gumla 7 25.00 21 75.00 28 100.00 Khunti 6 26.09 17 73.91 23 100.00 Latehar 10 71.43 4 28.57 14 100.00 Lohardaga 3 14.29 18 85.71 21 100.00 Ranchi 1 4.00 24 96.00 25 100.00 Simdega 4 25.00 12 75.00 16 100.00 Dumka 0 0.00 19 100.00 19 100.00 Godda 3 11.11 24 88.89 27 100.00 Jamtara 6 31.58 13 68.42 19 100.00 Pakur 9 40.91 13 59.09 22 100.00 Sahibganj 3 10.34 26 89.66 29 100.00 E.Singhbhum 5 29.41 12 70.59 17 100.00 Saraikela 6 23.08 20 76.92 26 100.00 W.Singhbhum 1 7.69 12 92.31 13 100.00 Overall 64 21.40 235 78.60 299 100.00 Location of Tribes Intervention Locations 24 19.67 98 80.33 122 100.00 Control Locations 40 22.60 137 77.40 177 100.00 Tribal Groups Primitive Tribal Groups 16 19.05 68 80.95 84 100.00 Other Tribal Groups 48 22.33 167 77.67 215 100.00
Getting Widow
Pension (21%)
Chart 80 : Widow Pension
Not Getting Widow
Pension (79%)
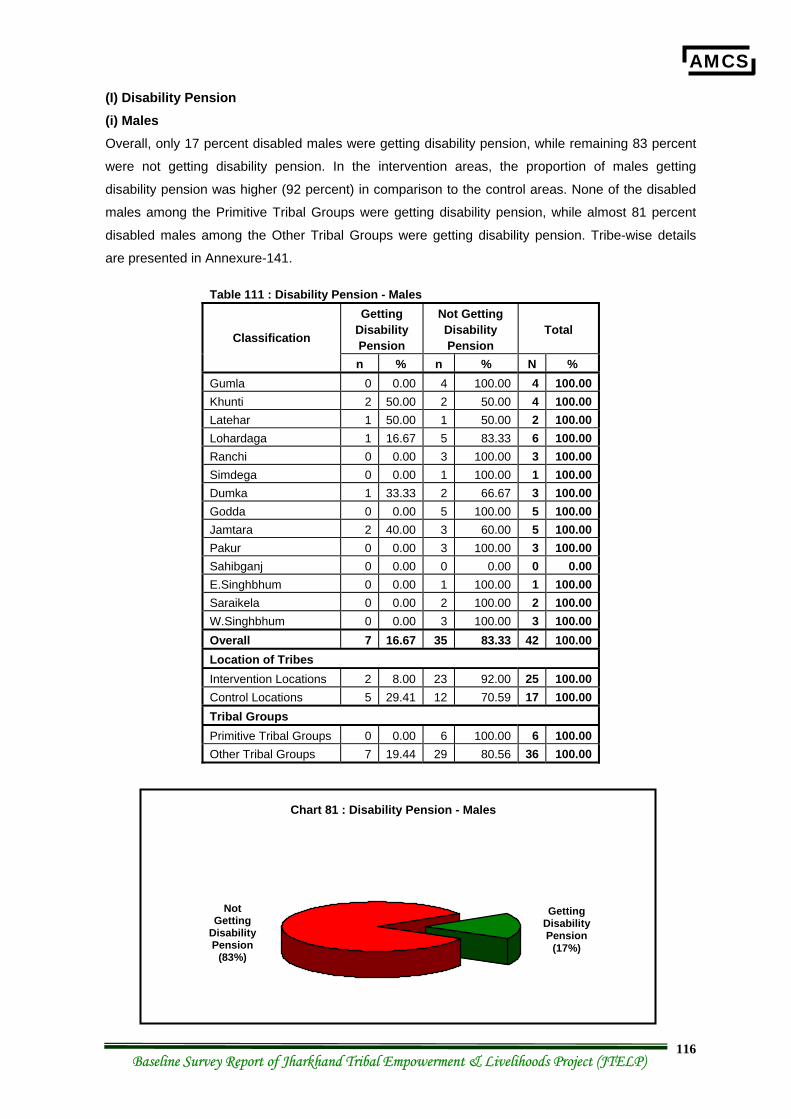
AMCS
Baseline Survey Report of Jharkhand Tribal Empowerment & Livelihoods Project (JTELP) 116
(I) Disability Pension (i) Males Overall, only 17 percent disabled males were getting disability pension, while remaining 83 percent
were not getting disability pension. In the intervention areas, the proportion of males getting
disability pension was higher (92 percent) in comparison to the control areas. None of the disabled
males among the Primitive Tribal Groups were getting disability pension, while almost 81 percent
disabled males among the Other Tribal Groups were getting disability pension. Tribe-wise details
are presented in Annexure-141.
Table 111 : Disability Pension - Males Getting
Disability Pension
Not Getting Disability Pension
Total Classification
n % n % N % Gumla 0 0.00 4 100.00 4 100.00 Khunti 2 50.00 2 50.00 4 100.00 Latehar 1 50.00 1 50.00 2 100.00 Lohardaga 1 16.67 5 83.33 6 100.00 Ranchi 0 0.00 3 100.00 3 100.00 Simdega 0 0.00 1 100.00 1 100.00 Dumka 1 33.33 2 66.67 3 100.00 Godda 0 0.00 5 100.00 5 100.00 Jamtara 2 40.00 3 60.00 5 100.00 Pakur 0 0.00 3 100.00 3 100.00 Sahibganj 0 0.00 0 0.00 0 0.00 E.Singhbhum 0 0.00 1 100.00 1 100.00 Saraikela 0 0.00 2 100.00 2 100.00 W.Singhbhum 0 0.00 3 100.00 3 100.00 Overall 7 16.67 35 83.33 42 100.00 Location of Tribes Intervention Locations 2 8.00 23 92.00 25 100.00 Control Locations 5 29.41 12 70.59 17 100.00 Tribal Groups Primitive Tribal Groups 0 0.00 6 100.00 6 100.00 Other Tribal Groups 7 19.44 29 80.56 36 100.00
Getting Disability Pension
(17%)
Chart 81 : Disability Pension - Males
Not Getting
Disability Pension
(83%)
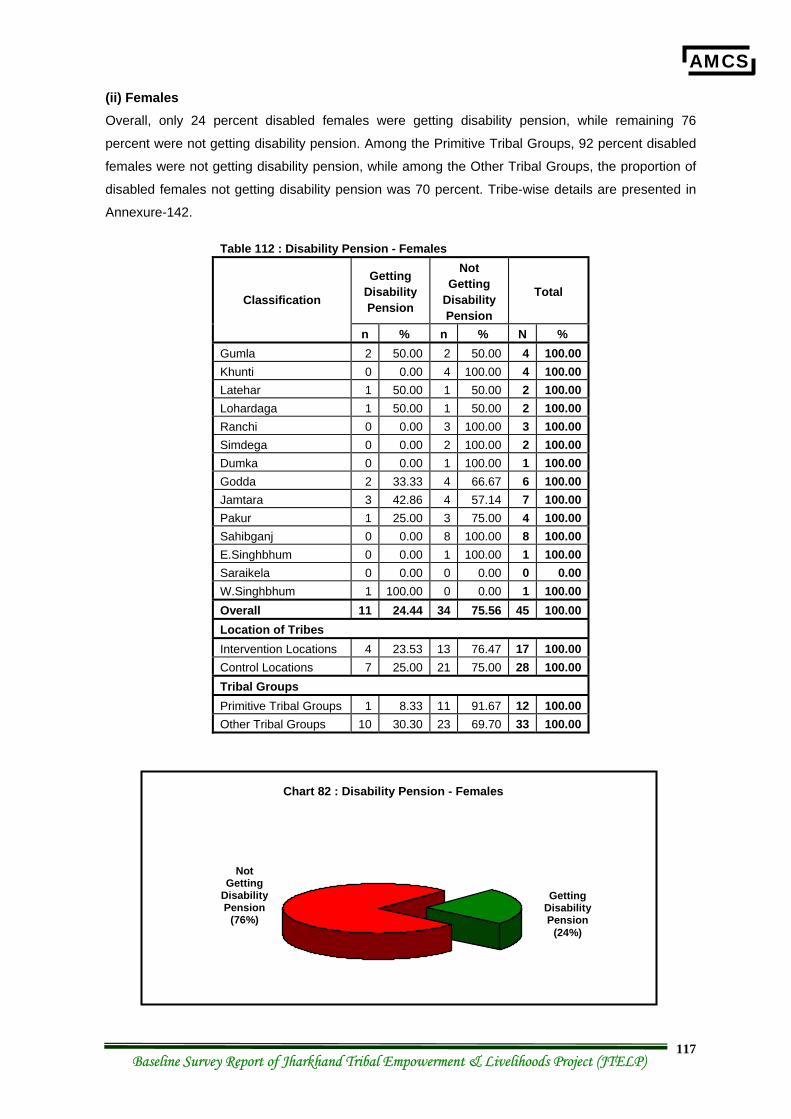
AMCS
Baseline Survey Report of Jharkhand Tribal Empowerment & Livelihoods Project (JTELP) 117
(ii) Females Overall, only 24 percent disabled females were getting disability pension, while remaining 76
percent were not getting disability pension. Among the Primitive Tribal Groups, 92 percent disabled
females were not getting disability pension, while among the Other Tribal Groups, the proportion of
disabled females not getting disability pension was 70 percent. Tribe-wise details are presented in
Annexure-142.
Table 112 : Disability Pension - Females
Getting Disability Pension
Not Getting
Disability Pension
Total Classification
n % n % N % Gumla 2 50.00 2 50.00 4 100.00 Khunti 0 0.00 4 100.00 4 100.00 Latehar 1 50.00 1 50.00 2 100.00 Lohardaga 1 50.00 1 50.00 2 100.00 Ranchi 0 0.00 3 100.00 3 100.00 Simdega 0 0.00 2 100.00 2 100.00 Dumka 0 0.00 1 100.00 1 100.00 Godda 2 33.33 4 66.67 6 100.00 Jamtara 3 42.86 4 57.14 7 100.00 Pakur 1 25.00 3 75.00 4 100.00 Sahibganj 0 0.00 8 100.00 8 100.00 E.Singhbhum 0 0.00 1 100.00 1 100.00 Saraikela 0 0.00 0 0.00 0 0.00 W.Singhbhum 1 100.00 0 0.00 1 100.00 Overall 11 24.44 34 75.56 45 100.00 Location of Tribes Intervention Locations 4 23.53 13 76.47 17 100.00 Control Locations 7 25.00 21 75.00 28 100.00 Tribal Groups Primitive Tribal Groups 1 8.33 11 91.67 12 100.00 Other Tribal Groups 10 30.30 23 69.70 33 100.00
Chart 82 : Disability Pension - Females
Getting Disability Pension
(24%)
Not Getting
Disability Pension
(76%)
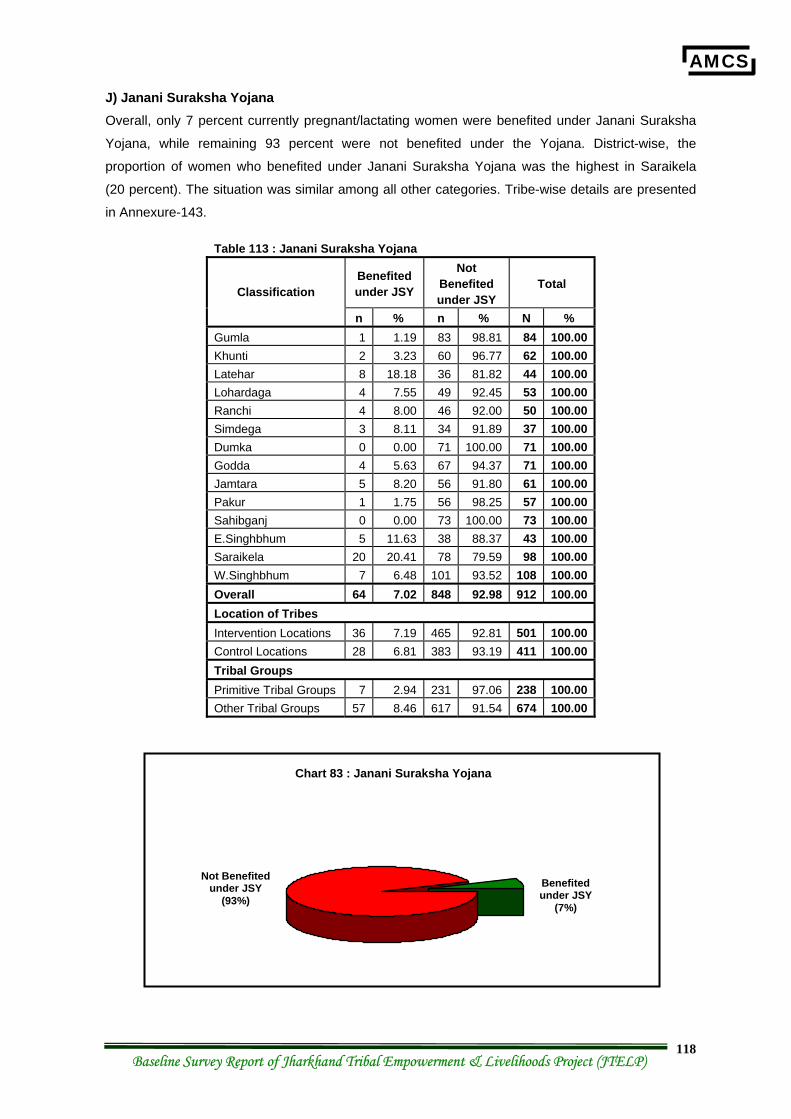
AMCS
Baseline Survey Report of Jharkhand Tribal Empowerment & Livelihoods Project (JTELP) 118
J) Janani Suraksha Yojana Overall, only 7 percent currently pregnant/lactating women were benefited under Janani Suraksha
Yojana, while remaining 93 percent were not benefited under the Yojana. District-wise, the
proportion of women who benefited under Janani Suraksha Yojana was the highest in Saraikela
(20 percent). The situation was similar among all other categories. Tribe-wise details are presented
in Annexure-143.
Table 113 : Janani Suraksha Yojana
Benefited under JSY
Not Benefited under JSY
Total Classification
n % n % N % Gumla 1 1.19 83 98.81 84 100.00 Khunti 2 3.23 60 96.77 62 100.00 Latehar 8 18.18 36 81.82 44 100.00 Lohardaga 4 7.55 49 92.45 53 100.00 Ranchi 4 8.00 46 92.00 50 100.00 Simdega 3 8.11 34 91.89 37 100.00 Dumka 0 0.00 71 100.00 71 100.00 Godda 4 5.63 67 94.37 71 100.00 Jamtara 5 8.20 56 91.80 61 100.00 Pakur 1 1.75 56 98.25 57 100.00 Sahibganj 0 0.00 73 100.00 73 100.00 E.Singhbhum 5 11.63 38 88.37 43 100.00 Saraikela 20 20.41 78 79.59 98 100.00 W.Singhbhum 7 6.48 101 93.52 108 100.00 Overall 64 7.02 848 92.98 912 100.00 Location of Tribes Intervention Locations 36 7.19 465 92.81 501 100.00 Control Locations 28 6.81 383 93.19 411 100.00 Tribal Groups Primitive Tribal Groups 7 2.94 231 97.06 238 100.00 Other Tribal Groups 57 8.46 617 91.54 674 100.00
Benefited under JSY
(7%)
Chart 83 : Janani Suraksha Yojana
Not Benefited under JSY
(93%)
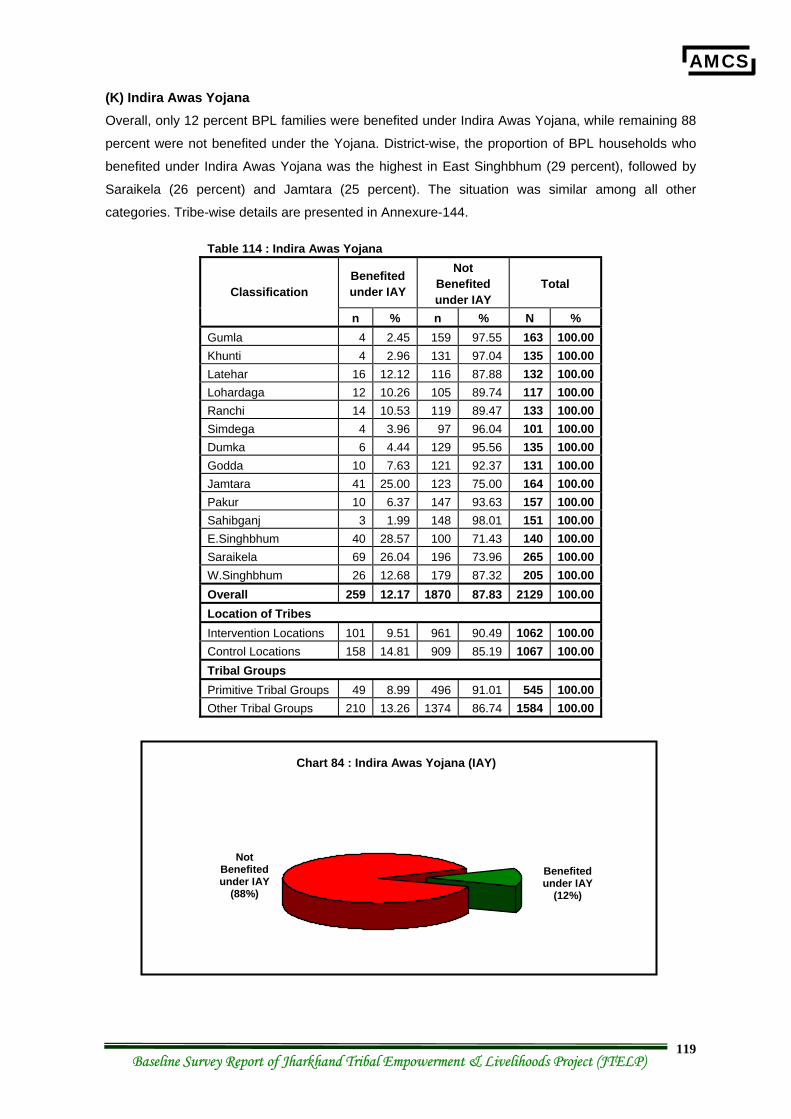
AMCS
Baseline Survey Report of Jharkhand Tribal Empowerment & Livelihoods Project (JTELP) 119
(K) Indira Awas Yojana Overall, only 12 percent BPL families were benefited under Indira Awas Yojana, while remaining 88
percent were not benefited under the Yojana. District-wise, the proportion of BPL households who
benefited under Indira Awas Yojana was the highest in East Singhbhum (29 percent), followed by
Saraikela (26 percent) and Jamtara (25 percent). The situation was similar among all other
categories. Tribe-wise details are presented in Annexure-144.
Table 114 : Indira Awas Yojana
Benefited under IAY
Not Benefited under IAY
Total Classification
n % n % N % Gumla 4 2.45 159 97.55 163 100.00 Khunti 4 2.96 131 97.04 135 100.00 Latehar 16 12.12 116 87.88 132 100.00 Lohardaga 12 10.26 105 89.74 117 100.00 Ranchi 14 10.53 119 89.47 133 100.00 Simdega 4 3.96 97 96.04 101 100.00 Dumka 6 4.44 129 95.56 135 100.00 Godda 10 7.63 121 92.37 131 100.00 Jamtara 41 25.00 123 75.00 164 100.00 Pakur 10 6.37 147 93.63 157 100.00 Sahibganj 3 1.99 148 98.01 151 100.00 E.Singhbhum 40 28.57 100 71.43 140 100.00 Saraikela 69 26.04 196 73.96 265 100.00 W.Singhbhum 26 12.68 179 87.32 205 100.00 Overall 259 12.17 1870 87.83 2129 100.00 Location of Tribes Intervention Locations 101 9.51 961 90.49 1062 100.00 Control Locations 158 14.81 909 85.19 1067 100.00 Tribal Groups Primitive Tribal Groups 49 8.99 496 91.01 545 100.00 Other Tribal Groups 210 13.26 1374 86.74 1584 100.00
Benefited under IAY
(12%)
Chart 84 : Indira Awas Yojana (IAY)
Not Benefited under IAY
(88%)
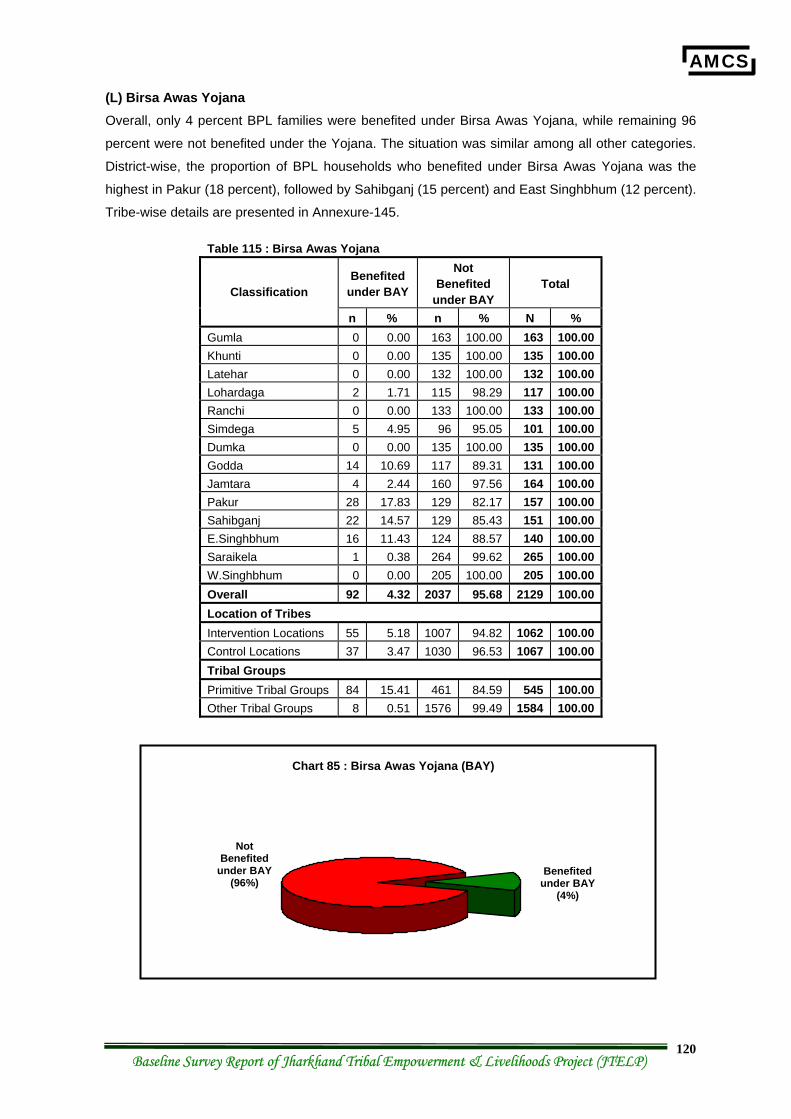
AMCS
Baseline Survey Report of Jharkhand Tribal Empowerment & Livelihoods Project (JTELP) 120
(L) Birsa Awas Yojana Overall, only 4 percent BPL families were benefited under Birsa Awas Yojana, while remaining 96
percent were not benefited under the Yojana. The situation was similar among all other categories.
District-wise, the proportion of BPL households who benefited under Birsa Awas Yojana was the
highest in Pakur (18 percent), followed by Sahibganj (15 percent) and East Singhbhum (12 percent).
Tribe-wise details are presented in Annexure-145.
Table 115 : Birsa Awas Yojana
Benefited under BAY
Not Benefited
under BAY Total Classification
n % n % N % Gumla 0 0.00 163 100.00 163 100.00 Khunti 0 0.00 135 100.00 135 100.00 Latehar 0 0.00 132 100.00 132 100.00 Lohardaga 2 1.71 115 98.29 117 100.00 Ranchi 0 0.00 133 100.00 133 100.00 Simdega 5 4.95 96 95.05 101 100.00 Dumka 0 0.00 135 100.00 135 100.00 Godda 14 10.69 117 89.31 131 100.00 Jamtara 4 2.44 160 97.56 164 100.00 Pakur 28 17.83 129 82.17 157 100.00 Sahibganj 22 14.57 129 85.43 151 100.00 E.Singhbhum 16 11.43 124 88.57 140 100.00 Saraikela 1 0.38 264 99.62 265 100.00 W.Singhbhum 0 0.00 205 100.00 205 100.00 Overall 92 4.32 2037 95.68 2129 100.00 Location of Tribes Intervention Locations 55 5.18 1007 94.82 1062 100.00 Control Locations 37 3.47 1030 96.53 1067 100.00 Tribal Groups Primitive Tribal Groups 84 15.41 461 84.59 545 100.00 Other Tribal Groups 8 0.51 1576 99.49 1584 100.00
Chart 85 : Birsa Awas Yojana (BAY)
Benefited under BAY
(4%)
Not Benefited
under BAY (96%)
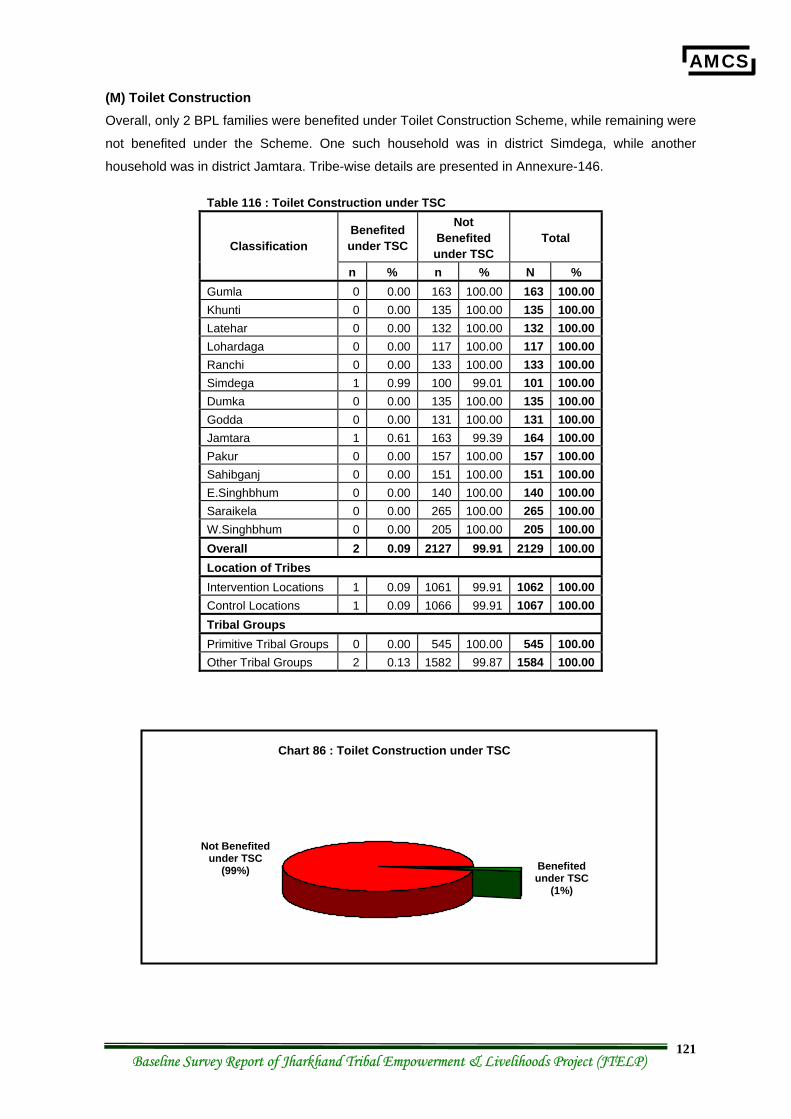
AMCS
Baseline Survey Report of Jharkhand Tribal Empowerment & Livelihoods Project (JTELP) 121
(M) Toilet Construction Overall, only 2 BPL families were benefited under Toilet Construction Scheme, while remaining were
not benefited under the Scheme. One such household was in district Simdega, while another
household was in district Jamtara. Tribe-wise details are presented in Annexure-146.
Table 116 : Toilet Construction under TSC
Benefited under TSC
Not Benefited under TSC
Total Classification
n % n % N % Gumla 0 0.00 163 100.00 163 100.00 Khunti 0 0.00 135 100.00 135 100.00 Latehar 0 0.00 132 100.00 132 100.00 Lohardaga 0 0.00 117 100.00 117 100.00 Ranchi 0 0.00 133 100.00 133 100.00 Simdega 1 0.99 100 99.01 101 100.00 Dumka 0 0.00 135 100.00 135 100.00 Godda 0 0.00 131 100.00 131 100.00 Jamtara 1 0.61 163 99.39 164 100.00 Pakur 0 0.00 157 100.00 157 100.00 Sahibganj 0 0.00 151 100.00 151 100.00 E.Singhbhum 0 0.00 140 100.00 140 100.00 Saraikela 0 0.00 265 100.00 265 100.00 W.Singhbhum 0 0.00 205 100.00 205 100.00 Overall 2 0.09 2127 99.91 2129 100.00 Location of Tribes Intervention Locations 1 0.09 1061 99.91 1062 100.00 Control Locations 1 0.09 1066 99.91 1067 100.00 Tribal Groups Primitive Tribal Groups 0 0.00 545 100.00 545 100.00 Other Tribal Groups 2 0.13 1582 99.87 1584 100.00
Chart 86 : Toilet Construction under TSC
Benefited under TSC
(1%)
Not Benefited under TSC
(99%)
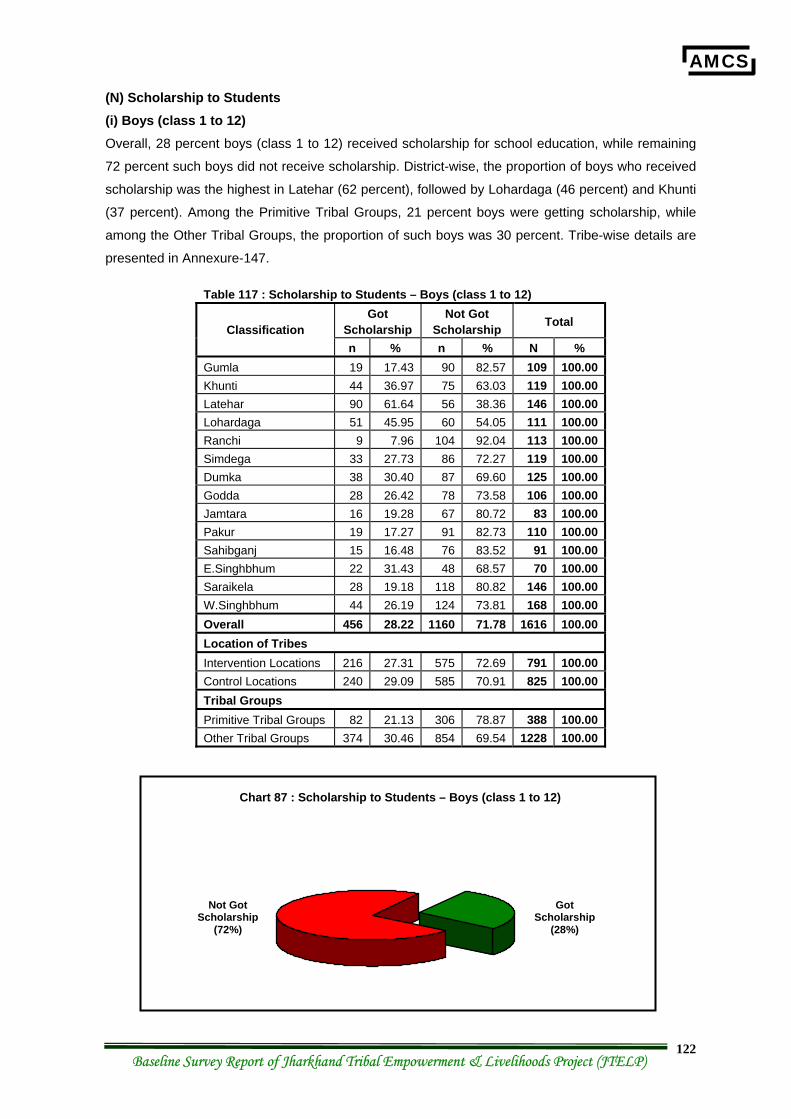
AMCS
Baseline Survey Report of Jharkhand Tribal Empowerment & Livelihoods Project (JTELP) 122
(N) Scholarship to Students (i) Boys (class 1 to 12) Overall, 28 percent boys (class 1 to 12) received scholarship for school education, while remaining
72 percent such boys did not receive scholarship. District-wise, the proportion of boys who received
scholarship was the highest in Latehar (62 percent), followed by Lohardaga (46 percent) and Khunti
(37 percent). Among the Primitive Tribal Groups, 21 percent boys were getting scholarship, while
among the Other Tribal Groups, the proportion of such boys was 30 percent. Tribe-wise details are
presented in Annexure-147.
Table 117 : Scholarship to Students – Boys (class 1 to 12) Got
Scholarship Not Got
Scholarship Total Classification n % n % N %
Gumla 19 17.43 90 82.57 109 100.00 Khunti 44 36.97 75 63.03 119 100.00 Latehar 90 61.64 56 38.36 146 100.00 Lohardaga 51 45.95 60 54.05 111 100.00 Ranchi 9 7.96 104 92.04 113 100.00 Simdega 33 27.73 86 72.27 119 100.00 Dumka 38 30.40 87 69.60 125 100.00 Godda 28 26.42 78 73.58 106 100.00 Jamtara 16 19.28 67 80.72 83 100.00 Pakur 19 17.27 91 82.73 110 100.00 Sahibganj 15 16.48 76 83.52 91 100.00 E.Singhbhum 22 31.43 48 68.57 70 100.00 Saraikela 28 19.18 118 80.82 146 100.00 W.Singhbhum 44 26.19 124 73.81 168 100.00 Overall 456 28.22 1160 71.78 1616 100.00 Location of Tribes Intervention Locations 216 27.31 575 72.69 791 100.00 Control Locations 240 29.09 585 70.91 825 100.00 Tribal Groups Primitive Tribal Groups 82 21.13 306 78.87 388 100.00 Other Tribal Groups 374 30.46 854 69.54 1228 100.00
Got Scholarship
(28%)
Chart 87 : Scholarship to Students – Boys (class 1 to 12)
Not Got Scholarship
(72%)
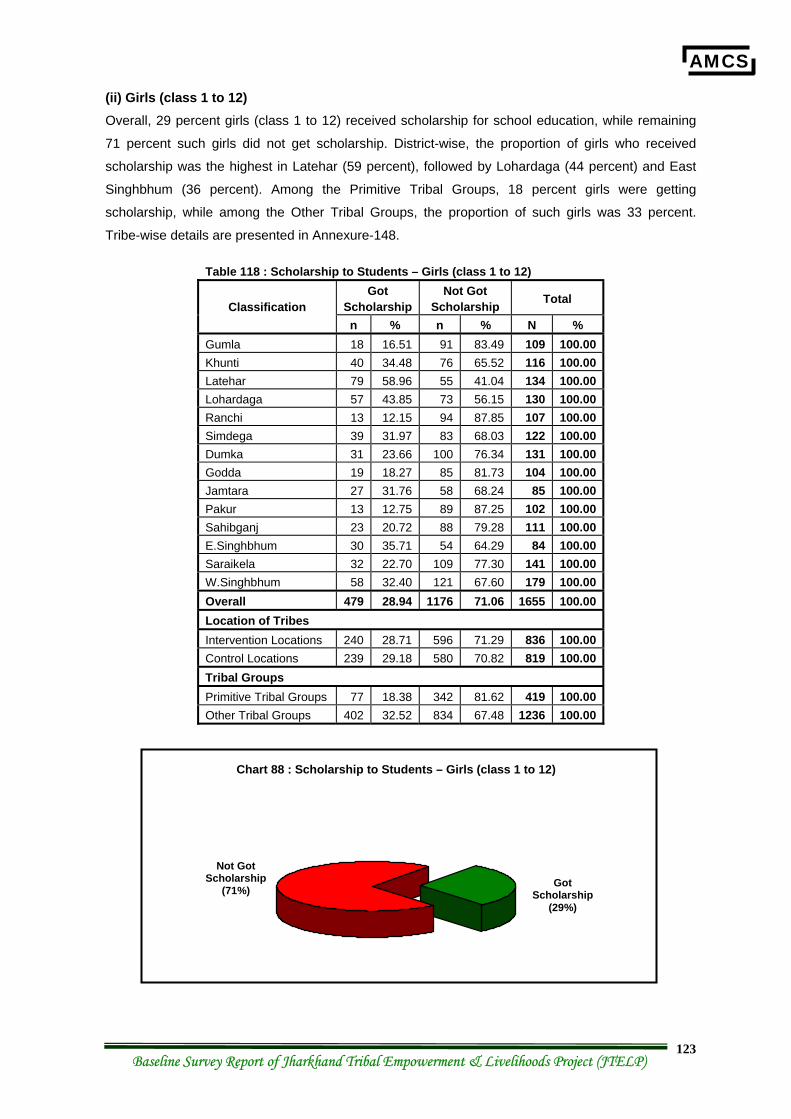
AMCS
Baseline Survey Report of Jharkhand Tribal Empowerment & Livelihoods Project (JTELP) 123
(ii) Girls (class 1 to 12) Overall, 29 percent girls (class 1 to 12) received scholarship for school education, while remaining
71 percent such girls did not get scholarship. District-wise, the proportion of girls who received
scholarship was the highest in Latehar (59 percent), followed by Lohardaga (44 percent) and East
Singhbhum (36 percent). Among the Primitive Tribal Groups, 18 percent girls were getting
scholarship, while among the Other Tribal Groups, the proportion of such girls was 33 percent.
Tribe-wise details are presented in Annexure-148.
Table 118 : Scholarship to Students – Girls (class 1 to 12) Got
Scholarship Not Got
Scholarship Total Classification n % n % N %
Gumla 18 16.51 91 83.49 109 100.00 Khunti 40 34.48 76 65.52 116 100.00 Latehar 79 58.96 55 41.04 134 100.00 Lohardaga 57 43.85 73 56.15 130 100.00 Ranchi 13 12.15 94 87.85 107 100.00 Simdega 39 31.97 83 68.03 122 100.00 Dumka 31 23.66 100 76.34 131 100.00 Godda 19 18.27 85 81.73 104 100.00 Jamtara 27 31.76 58 68.24 85 100.00 Pakur 13 12.75 89 87.25 102 100.00 Sahibganj 23 20.72 88 79.28 111 100.00 E.Singhbhum 30 35.71 54 64.29 84 100.00 Saraikela 32 22.70 109 77.30 141 100.00 W.Singhbhum 58 32.40 121 67.60 179 100.00 Overall 479 28.94 1176 71.06 1655 100.00 Location of Tribes Intervention Locations 240 28.71 596 71.29 836 100.00 Control Locations 239 29.18 580 70.82 819 100.00 Tribal Groups Primitive Tribal Groups 77 18.38 342 81.62 419 100.00 Other Tribal Groups 402 32.52 834 67.48 1236 100.00
Chart 88 : Scholarship to Students – Girls (class 1 to 12)
Got Scholarship
(29%)
Not Got Scholarship
(71%)
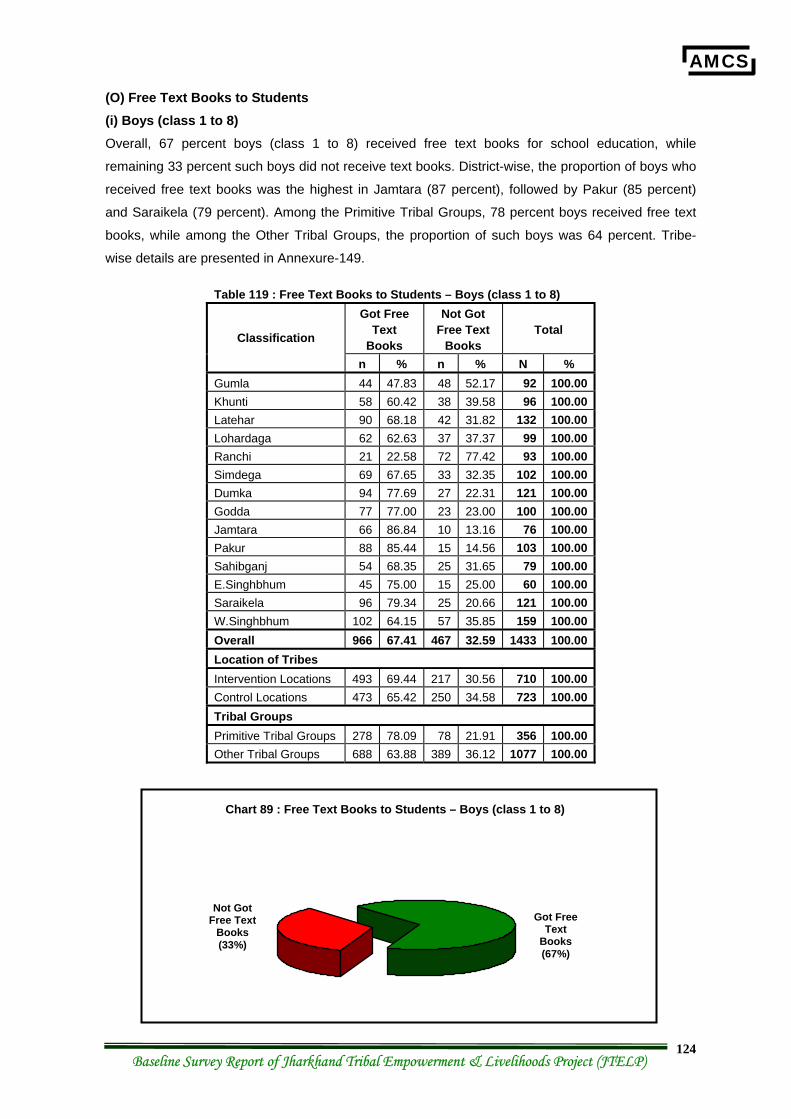
AMCS
Baseline Survey Report of Jharkhand Tribal Empowerment & Livelihoods Project (JTELP) 124
(O) Free Text Books to Students (i) Boys (class 1 to 8) Overall, 67 percent boys (class 1 to 8) received free text books for school education, while
remaining 33 percent such boys did not receive text books. District-wise, the proportion of boys who
received free text books was the highest in Jamtara (87 percent), followed by Pakur (85 percent)
and Saraikela (79 percent). Among the Primitive Tribal Groups, 78 percent boys received free text
books, while among the Other Tribal Groups, the proportion of such boys was 64 percent. Tribe-
wise details are presented in Annexure-149.
Table 119 : Free Text Books to Students – Boys (class 1 to 8) Got Free
Text Books
Not Got Free Text
Books Total Classification
n % n % N % Gumla 44 47.83 48 52.17 92 100.00 Khunti 58 60.42 38 39.58 96 100.00 Latehar 90 68.18 42 31.82 132 100.00 Lohardaga 62 62.63 37 37.37 99 100.00 Ranchi 21 22.58 72 77.42 93 100.00 Simdega 69 67.65 33 32.35 102 100.00 Dumka 94 77.69 27 22.31 121 100.00 Godda 77 77.00 23 23.00 100 100.00 Jamtara 66 86.84 10 13.16 76 100.00 Pakur 88 85.44 15 14.56 103 100.00 Sahibganj 54 68.35 25 31.65 79 100.00 E.Singhbhum 45 75.00 15 25.00 60 100.00 Saraikela 96 79.34 25 20.66 121 100.00 W.Singhbhum 102 64.15 57 35.85 159 100.00 Overall 966 67.41 467 32.59 1433 100.00 Location of Tribes Intervention Locations 493 69.44 217 30.56 710 100.00 Control Locations 473 65.42 250 34.58 723 100.00 Tribal Groups Primitive Tribal Groups 278 78.09 78 21.91 356 100.00 Other Tribal Groups 688 63.88 389 36.12 1077 100.00
Got Free Text
Books (67%)
Chart 89 : Free Text Books to Students – Boys (class 1 to 8)
Not Got Free Text
Books (33%)
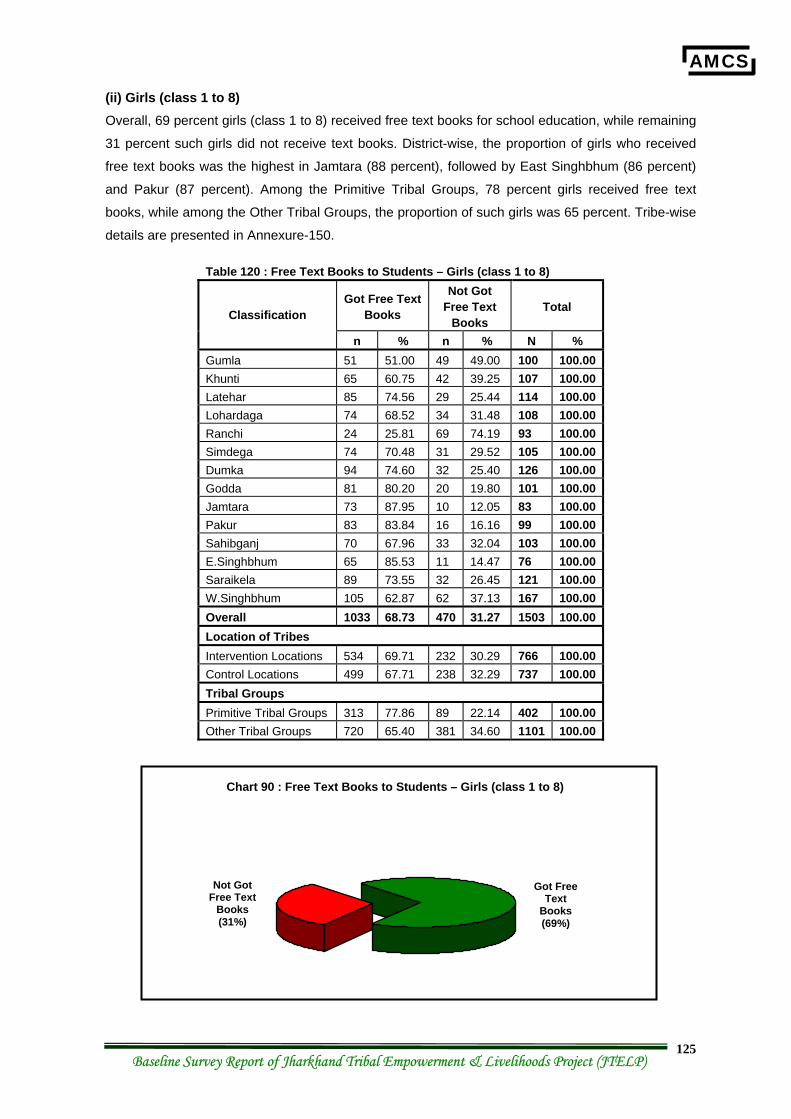
AMCS
Baseline Survey Report of Jharkhand Tribal Empowerment & Livelihoods Project (JTELP) 125
(ii) Girls (class 1 to 8) Overall, 69 percent girls (class 1 to 8) received free text books for school education, while remaining
31 percent such girls did not receive text books. District-wise, the proportion of girls who received
free text books was the highest in Jamtara (88 percent), followed by East Singhbhum (86 percent)
and Pakur (87 percent). Among the Primitive Tribal Groups, 78 percent girls received free text
books, while among the Other Tribal Groups, the proportion of such girls was 65 percent. Tribe-wise
details are presented in Annexure-150.
Table 120 : Free Text Books to Students – Girls (class 1 to 8)
Got Free Text Books
Not Got Free Text
Books Total Classification
n % n % N % Gumla 51 51.00 49 49.00 100 100.00 Khunti 65 60.75 42 39.25 107 100.00 Latehar 85 74.56 29 25.44 114 100.00 Lohardaga 74 68.52 34 31.48 108 100.00 Ranchi 24 25.81 69 74.19 93 100.00 Simdega 74 70.48 31 29.52 105 100.00 Dumka 94 74.60 32 25.40 126 100.00 Godda 81 80.20 20 19.80 101 100.00 Jamtara 73 87.95 10 12.05 83 100.00 Pakur 83 83.84 16 16.16 99 100.00 Sahibganj 70 67.96 33 32.04 103 100.00 E.Singhbhum 65 85.53 11 14.47 76 100.00 Saraikela 89 73.55 32 26.45 121 100.00 W.Singhbhum 105 62.87 62 37.13 167 100.00 Overall 1033 68.73 470 31.27 1503 100.00 Location of Tribes Intervention Locations 534 69.71 232 30.29 766 100.00 Control Locations 499 67.71 238 32.29 737 100.00 Tribal Groups Primitive Tribal Groups 313 77.86 89 22.14 402 100.00 Other Tribal Groups 720 65.40 381 34.60 1101 100.00
Chart 90 : Free Text Books to Students – Girls (class 1 to 8)
Got Free Text
Books (69%)
Not Got Free Text
Books (31%)
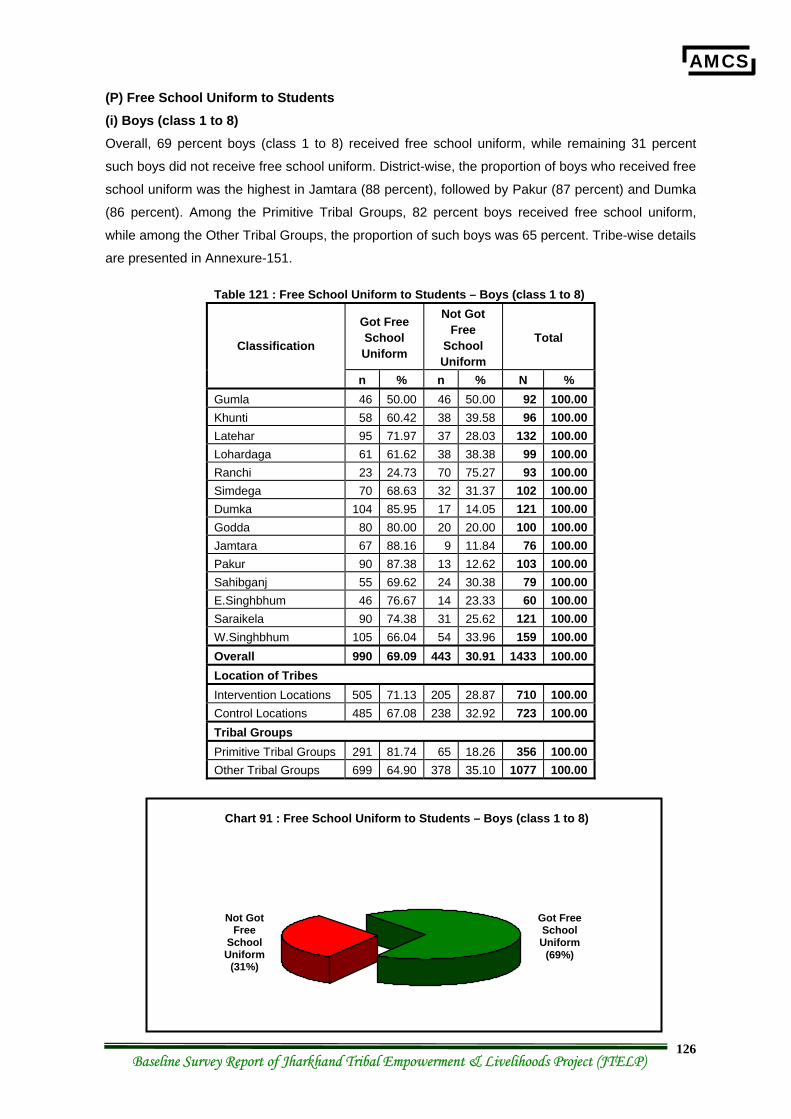
AMCS
Baseline Survey Report of Jharkhand Tribal Empowerment & Livelihoods Project (JTELP) 126
(P) Free School Uniform to Students (i) Boys (class 1 to 8) Overall, 69 percent boys (class 1 to 8) received free school uniform, while remaining 31 percent
such boys did not receive free school uniform. District-wise, the proportion of boys who received free
school uniform was the highest in Jamtara (88 percent), followed by Pakur (87 percent) and Dumka
(86 percent). Among the Primitive Tribal Groups, 82 percent boys received free school uniform,
while among the Other Tribal Groups, the proportion of such boys was 65 percent. Tribe-wise details
are presented in Annexure-151.
Table 121 : Free School Uniform to Students – Boys (class 1 to 8)
Got Free School Uniform
Not Got Free
School Uniform
Total Classification
n % n % N % Gumla 46 50.00 46 50.00 92 100.00 Khunti 58 60.42 38 39.58 96 100.00 Latehar 95 71.97 37 28.03 132 100.00 Lohardaga 61 61.62 38 38.38 99 100.00 Ranchi 23 24.73 70 75.27 93 100.00 Simdega 70 68.63 32 31.37 102 100.00 Dumka 104 85.95 17 14.05 121 100.00 Godda 80 80.00 20 20.00 100 100.00 Jamtara 67 88.16 9 11.84 76 100.00 Pakur 90 87.38 13 12.62 103 100.00 Sahibganj 55 69.62 24 30.38 79 100.00 E.Singhbhum 46 76.67 14 23.33 60 100.00 Saraikela 90 74.38 31 25.62 121 100.00 W.Singhbhum 105 66.04 54 33.96 159 100.00 Overall 990 69.09 443 30.91 1433 100.00 Location of Tribes Intervention Locations 505 71.13 205 28.87 710 100.00 Control Locations 485 67.08 238 32.92 723 100.00 Tribal Groups Primitive Tribal Groups 291 81.74 65 18.26 356 100.00 Other Tribal Groups 699 64.90 378 35.10 1077 100.00
Chart 91 : Free School Uniform to Students – Boys (class 1 to 8)
Got Free School Uniform
(69%)
Not Got Free
School Uniform
(31%)
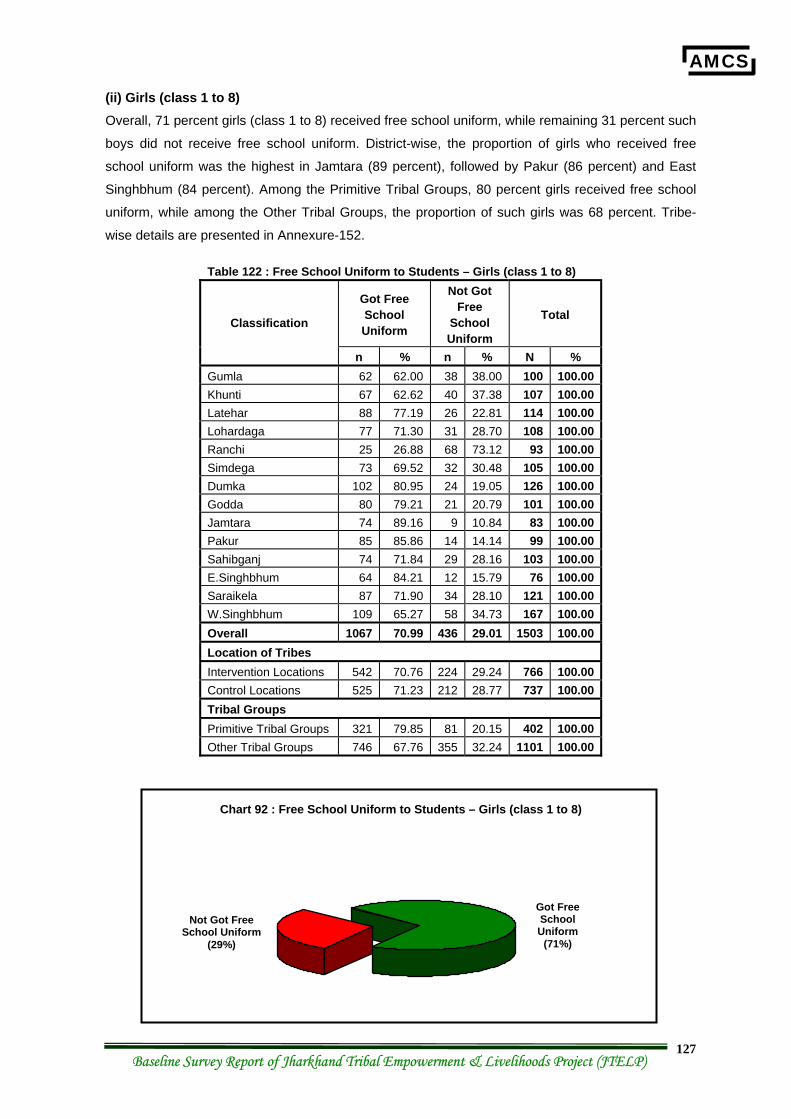
AMCS
Baseline Survey Report of Jharkhand Tribal Empowerment & Livelihoods Project (JTELP) 127
(ii) Girls (class 1 to 8) Overall, 71 percent girls (class 1 to 8) received free school uniform, while remaining 31 percent such
boys did not receive free school uniform. District-wise, the proportion of girls who received free
school uniform was the highest in Jamtara (89 percent), followed by Pakur (86 percent) and East
Singhbhum (84 percent). Among the Primitive Tribal Groups, 80 percent girls received free school
uniform, while among the Other Tribal Groups, the proportion of such girls was 68 percent. Tribe-
wise details are presented in Annexure-152.
Table 122 : Free School Uniform to Students – Girls (class 1 to 8)
Got Free School Uniform
Not Got Free
School Uniform
Total Classification
n % n % N % Gumla 62 62.00 38 38.00 100 100.00 Khunti 67 62.62 40 37.38 107 100.00 Latehar 88 77.19 26 22.81 114 100.00 Lohardaga 77 71.30 31 28.70 108 100.00 Ranchi 25 26.88 68 73.12 93 100.00 Simdega 73 69.52 32 30.48 105 100.00 Dumka 102 80.95 24 19.05 126 100.00 Godda 80 79.21 21 20.79 101 100.00 Jamtara 74 89.16 9 10.84 83 100.00 Pakur 85 85.86 14 14.14 99 100.00 Sahibganj 74 71.84 29 28.16 103 100.00 E.Singhbhum 64 84.21 12 15.79 76 100.00 Saraikela 87 71.90 34 28.10 121 100.00 W.Singhbhum 109 65.27 58 34.73 167 100.00 Overall 1067 70.99 436 29.01 1503 100.00 Location of Tribes Intervention Locations 542 70.76 224 29.24 766 100.00 Control Locations 525 71.23 212 28.77 737 100.00 Tribal Groups Primitive Tribal Groups 321 79.85 81 20.15 402 100.00 Other Tribal Groups 746 67.76 355 32.24 1101 100.00
Chart 92 : Free School Uniform to Students – Girls (class 1 to 8)
Got Free School Uniform
(71%)
Not Got Free School Uniform
(29%)
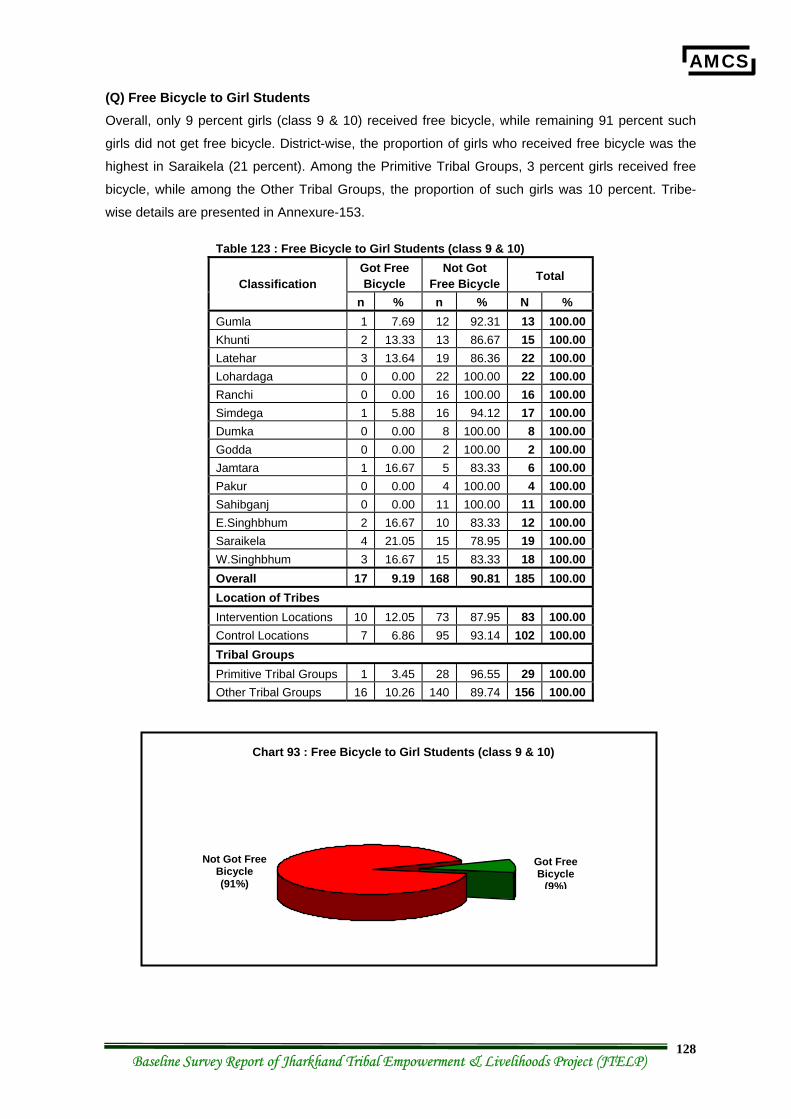
AMCS
Baseline Survey Report of Jharkhand Tribal Empowerment & Livelihoods Project (JTELP) 128
(Q) Free Bicycle to Girl Students Overall, only 9 percent girls (class 9 & 10) received free bicycle, while remaining 91 percent such
girls did not get free bicycle. District-wise, the proportion of girls who received free bicycle was the
highest in Saraikela (21 percent). Among the Primitive Tribal Groups, 3 percent girls received free
bicycle, while among the Other Tribal Groups, the proportion of such girls was 10 percent. Tribe-
wise details are presented in Annexure-153.
Table 123 : Free Bicycle to Girl Students (class 9 & 10) Got Free Bicycle
Not Got Free Bicycle Total Classification
n % n % N % Gumla 1 7.69 12 92.31 13 100.00 Khunti 2 13.33 13 86.67 15 100.00 Latehar 3 13.64 19 86.36 22 100.00 Lohardaga 0 0.00 22 100.00 22 100.00 Ranchi 0 0.00 16 100.00 16 100.00 Simdega 1 5.88 16 94.12 17 100.00 Dumka 0 0.00 8 100.00 8 100.00 Godda 0 0.00 2 100.00 2 100.00 Jamtara 1 16.67 5 83.33 6 100.00 Pakur 0 0.00 4 100.00 4 100.00 Sahibganj 0 0.00 11 100.00 11 100.00 E.Singhbhum 2 16.67 10 83.33 12 100.00 Saraikela 4 21.05 15 78.95 19 100.00 W.Singhbhum 3 16.67 15 83.33 18 100.00 Overall 17 9.19 168 90.81 185 100.00 Location of Tribes Intervention Locations 10 12.05 73 87.95 83 100.00 Control Locations 7 6.86 95 93.14 102 100.00 Tribal Groups Primitive Tribal Groups 1 3.45 28 96.55 29 100.00 Other Tribal Groups 16 10.26 140 89.74 156 100.00
Chart 93 : Free Bicycle to Girl Students (class 9 & 10)
Not Got Free Bicycle (91%)
Got Free Bicycle
(9%)
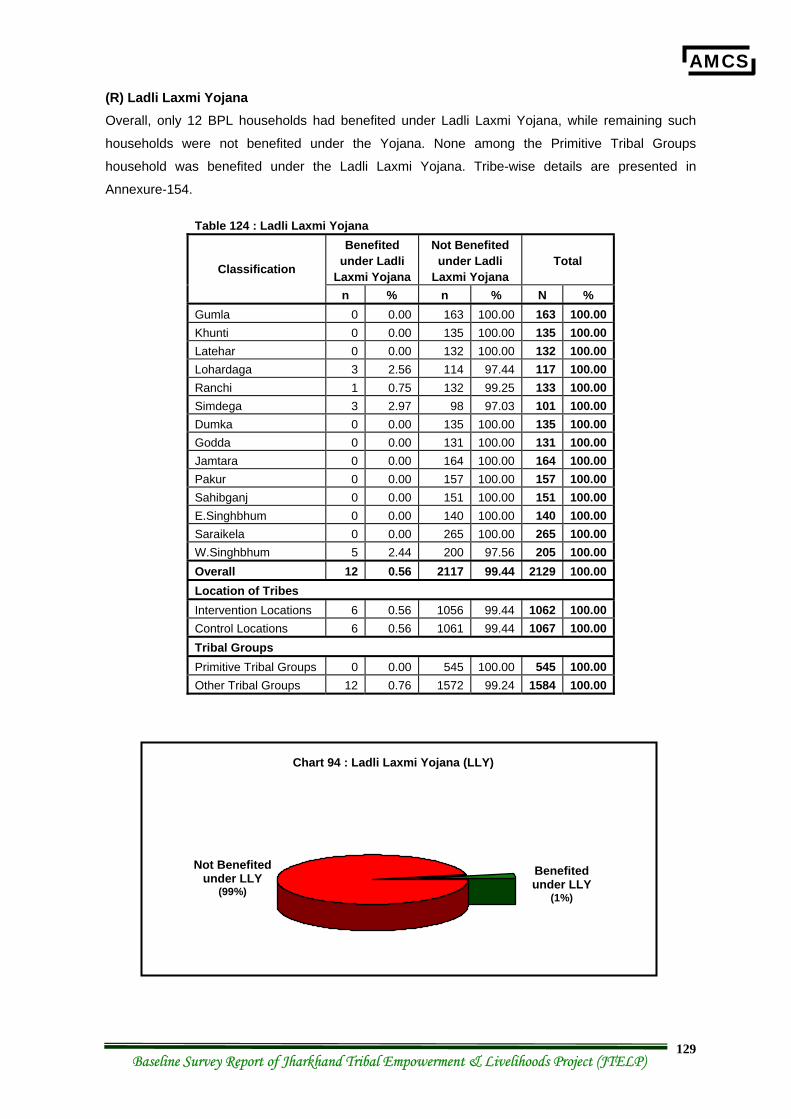
AMCS
Baseline Survey Report of Jharkhand Tribal Empowerment & Livelihoods Project (JTELP) 129
(R) Ladli Laxmi Yojana Overall, only 12 BPL households had benefited under Ladli Laxmi Yojana, while remaining such
households were not benefited under the Yojana. None among the Primitive Tribal Groups
household was benefited under the Ladli Laxmi Yojana. Tribe-wise details are presented in
Annexure-154.
Table 124 : Ladli Laxmi Yojana Benefited
under Ladli Laxmi Yojana
Not Benefited under Ladli
Laxmi Yojana Total Classification
n % n % N % Gumla 0 0.00 163 100.00 163 100.00 Khunti 0 0.00 135 100.00 135 100.00 Latehar 0 0.00 132 100.00 132 100.00 Lohardaga 3 2.56 114 97.44 117 100.00 Ranchi 1 0.75 132 99.25 133 100.00 Simdega 3 2.97 98 97.03 101 100.00 Dumka 0 0.00 135 100.00 135 100.00 Godda 0 0.00 131 100.00 131 100.00 Jamtara 0 0.00 164 100.00 164 100.00 Pakur 0 0.00 157 100.00 157 100.00 Sahibganj 0 0.00 151 100.00 151 100.00 E.Singhbhum 0 0.00 140 100.00 140 100.00 Saraikela 0 0.00 265 100.00 265 100.00 W.Singhbhum 5 2.44 200 97.56 205 100.00 Overall 12 0.56 2117 99.44 2129 100.00 Location of Tribes Intervention Locations 6 0.56 1056 99.44 1062 100.00 Control Locations 6 0.56 1061 99.44 1067 100.00 Tribal Groups Primitive Tribal Groups 0 0.00 545 100.00 545 100.00 Other Tribal Groups 12 0.76 1572 99.24 1584 100.00
Benefited under LLY
(1%)
Chart 94 : Ladli Laxmi Yojana (LLY)
Not Benefited under LLY
(99%)
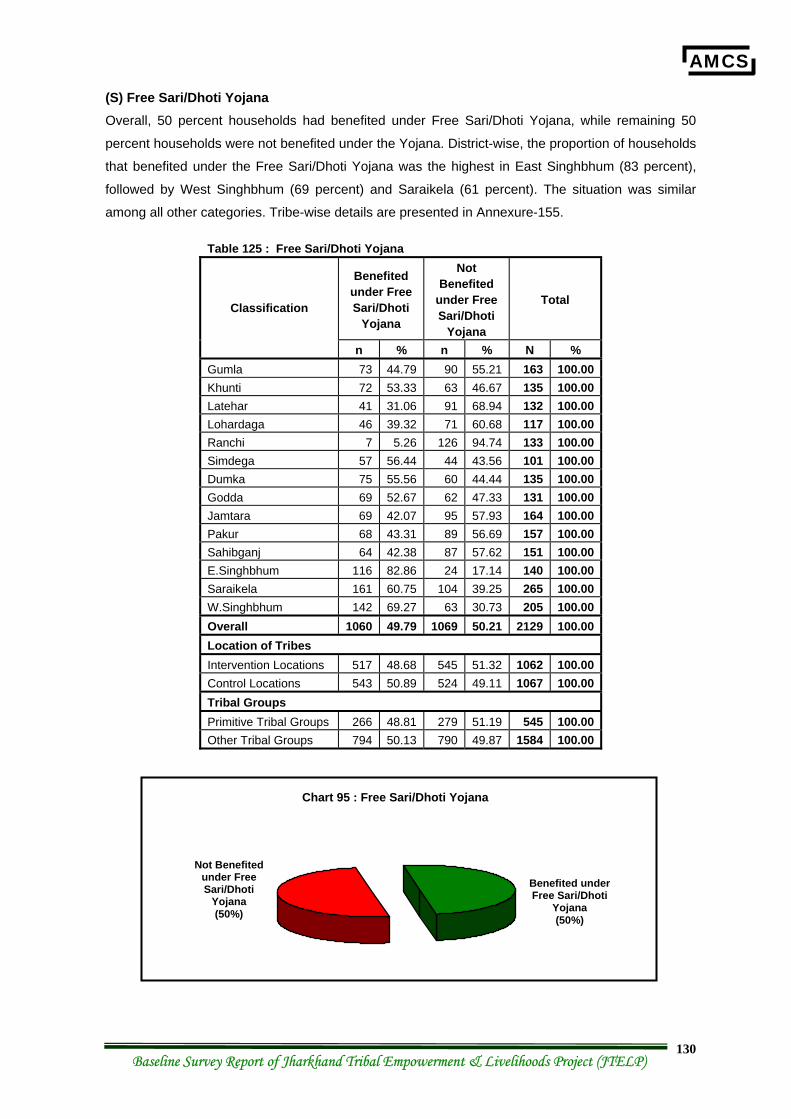
AMCS
Baseline Survey Report of Jharkhand Tribal Empowerment & Livelihoods Project (JTELP) 130
(S) Free Sari/Dhoti Yojana Overall, 50 percent households had benefited under Free Sari/Dhoti Yojana, while remaining 50
percent households were not benefited under the Yojana. District-wise, the proportion of households
that benefited under the Free Sari/Dhoti Yojana was the highest in East Singhbhum (83 percent),
followed by West Singhbhum (69 percent) and Saraikela (61 percent). The situation was similar
among all other categories. Tribe-wise details are presented in Annexure-155.
Table 125 : Free Sari/Dhoti Yojana
Benefited under Free Sari/Dhoti
Yojana
Not Benefited
under Free Sari/Dhoti
Yojana
Total Classification
n % n % N % Gumla 73 44.79 90 55.21 163 100.00 Khunti 72 53.33 63 46.67 135 100.00 Latehar 41 31.06 91 68.94 132 100.00 Lohardaga 46 39.32 71 60.68 117 100.00 Ranchi 7 5.26 126 94.74 133 100.00 Simdega 57 56.44 44 43.56 101 100.00 Dumka 75 55.56 60 44.44 135 100.00 Godda 69 52.67 62 47.33 131 100.00 Jamtara 69 42.07 95 57.93 164 100.00 Pakur 68 43.31 89 56.69 157 100.00 Sahibganj 64 42.38 87 57.62 151 100.00 E.Singhbhum 116 82.86 24 17.14 140 100.00 Saraikela 161 60.75 104 39.25 265 100.00 W.Singhbhum 142 69.27 63 30.73 205 100.00 Overall 1060 49.79 1069 50.21 2129 100.00 Location of Tribes Intervention Locations 517 48.68 545 51.32 1062 100.00 Control Locations 543 50.89 524 49.11 1067 100.00 Tribal Groups Primitive Tribal Groups 266 48.81 279 51.19 545 100.00 Other Tribal Groups 794 50.13 790 49.87 1584 100.00
Benefited under Free Sari/Dhoti
Yojana (50%)
Chart 95 : Free Sari/Dhoti Yojana
Not Benefited under Free Sari/Dhoti
Yojana (50%)

AMCS
Baseline Survey Report of Jharkhand Tribal Empowerment & Livelihoods Project (JTELP) 131
(T) Jan Dhan Yojana Overall, only 1 percent households had benefited under Jan Dhan Yojana, while remaining 99
percent households were not benefited under the Yojana. The situation was similar among all other
categories. Tribe-wise details are presented in Annexure-156.
Table 126 : Jan Dhan Yojana Benefited under Jan
Dhan Yojana
Not Benefited under Jan
Dhan Yojana
Total Classification
n % n % N % Gumla 2 1.23 161 98.77 163 100.00 Khunti 6 4.44 129 95.56 135 100.00 Latehar 0 0.00 132 100.00 132 100.00 Lohardaga 0 0.00 117 100.00 117 100.00 Ranchi 9 6.77 124 93.23 133 100.00 Simdega 0 0.00 101 100.00 101 100.00 Dumka 0 0.00 135 100.00 135 100.00 Godda 0 0.00 131 100.00 131 100.00 Jamtara 0 0.00 164 100.00 164 100.00 Pakur 0 0.00 157 100.00 157 100.00 Sahibganj 0 0.00 151 100.00 151 100.00 E.Singhbhum 0 0.00 140 100.00 140 100.00 Saraikela 4 1.51 261 98.49 265 100.00 W.Singhbhum 0 0.00 205 100.00 205 100.00 Overall 21 0.99 2108 99.01 2129 100.00 Location of Tribes Intervention Locations 4 0.38 1058 99.62 1062 100.00 Control Locations 17 1.59 1050 98.41 1067 100.00 Tribal Groups Primitive Tribal Groups 3 0.55 542 99.45 545 100.00 Other Tribal Groups 18 1.14 1566 98.86 1584 100.00
Benefited under JDY
(1%)
Chart 96 : Jan Dhan Yojana (JDY)
Not Benefited under JDY
(99%)
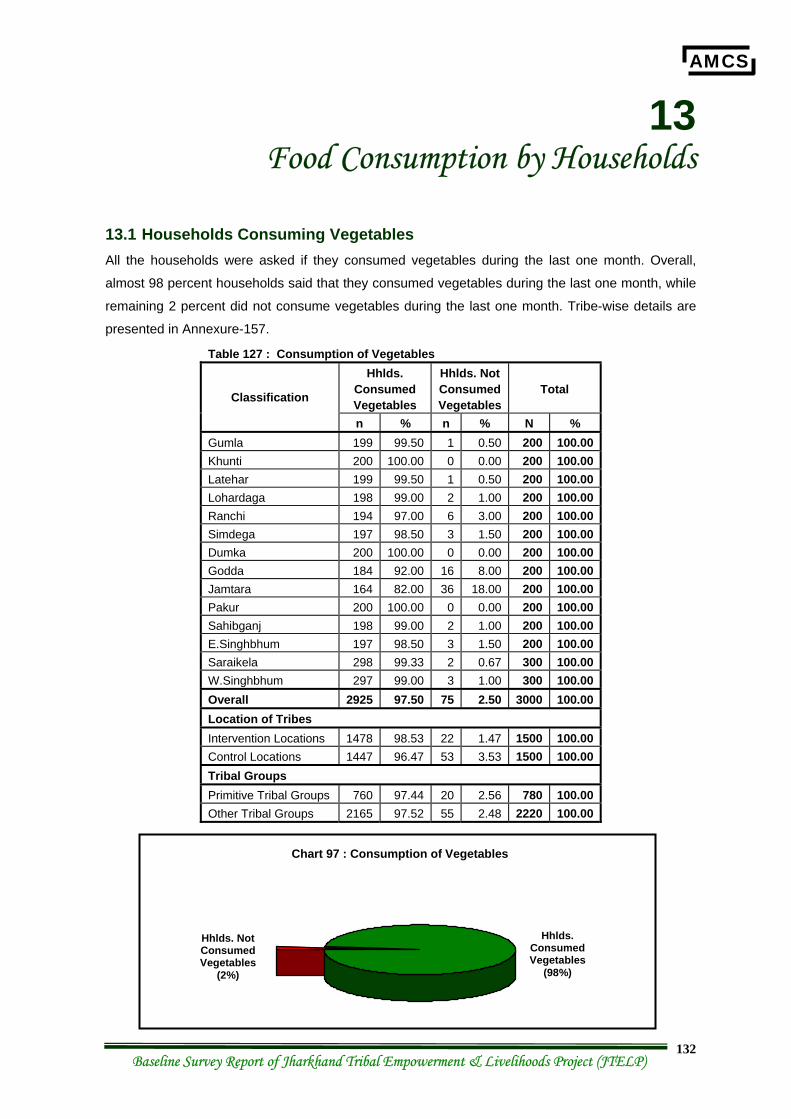
AMCS
Baseline Survey Report of Jharkhand Tribal Empowerment & Livelihoods Project (JTELP) 132
13 Food Consumption by Households
13.1 Households Consuming Vegetables All the households were asked if they consumed vegetables during the last one month. Overall,
almost 98 percent households said that they consumed vegetables during the last one month, while
remaining 2 percent did not consume vegetables during the last one month. Tribe-wise details are
presented in Annexure-157.
Table 127 : Consumption of Vegetables Hhlds.
Consumed Vegetables
Hhlds. Not Consumed Vegetables
Total Classification
n % n % N % Gumla 199 99.50 1 0.50 200 100.00 Khunti 200 100.00 0 0.00 200 100.00 Latehar 199 99.50 1 0.50 200 100.00 Lohardaga 198 99.00 2 1.00 200 100.00 Ranchi 194 97.00 6 3.00 200 100.00 Simdega 197 98.50 3 1.50 200 100.00 Dumka 200 100.00 0 0.00 200 100.00 Godda 184 92.00 16 8.00 200 100.00 Jamtara 164 82.00 36 18.00 200 100.00 Pakur 200 100.00 0 0.00 200 100.00 Sahibganj 198 99.00 2 1.00 200 100.00 E.Singhbhum 197 98.50 3 1.50 200 100.00 Saraikela 298 99.33 2 0.67 300 100.00 W.Singhbhum 297 99.00 3 1.00 300 100.00 Overall 2925 97.50 75 2.50 3000 100.00 Location of Tribes Intervention Locations 1478 98.53 22 1.47 1500 100.00 Control Locations 1447 96.47 53 3.53 1500 100.00 Tribal Groups Primitive Tribal Groups 760 97.44 20 2.56 780 100.00 Other Tribal Groups 2165 97.52 55 2.48 2220 100.00
Hhlds. Consumed Vegetables
(98%)
Chart 97 : Consumption of Vegetables
Hhlds. Not Consumed Vegetables
(2%)
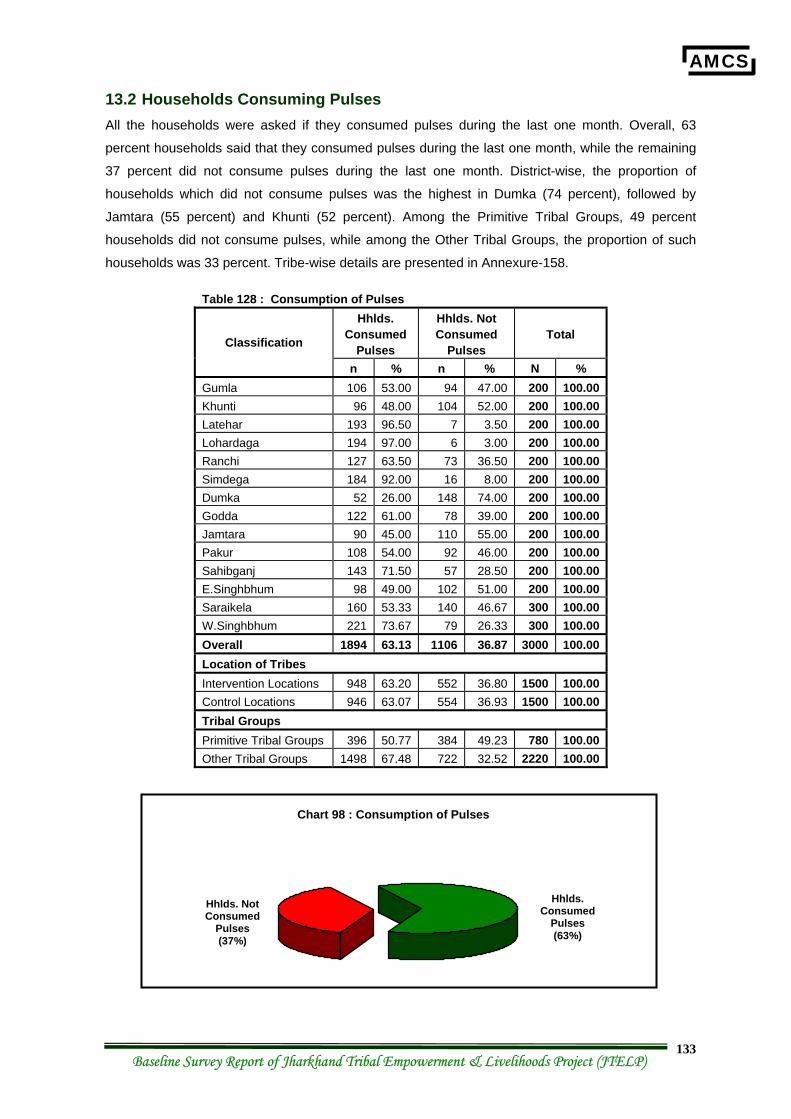
AMCS
Baseline Survey Report of Jharkhand Tribal Empowerment & Livelihoods Project (JTELP) 133
13.2 Households Consuming Pulses All the households were asked if they consumed pulses during the last one month. Overall, 63
percent households said that they consumed pulses during the last one month, while the remaining
37 percent did not consume pulses during the last one month. District-wise, the proportion of
households which did not consume pulses was the highest in Dumka (74 percent), followed by
Jamtara (55 percent) and Khunti (52 percent). Among the Primitive Tribal Groups, 49 percent
households did not consume pulses, while among the Other Tribal Groups, the proportion of such
households was 33 percent. Tribe-wise details are presented in Annexure-158.
Table 128 : Consumption of Pulses Hhlds.
Consumed Pulses
Hhlds. Not Consumed
Pulses Total Classification
n % n % N % Gumla 106 53.00 94 47.00 200 100.00 Khunti 96 48.00 104 52.00 200 100.00 Latehar 193 96.50 7 3.50 200 100.00 Lohardaga 194 97.00 6 3.00 200 100.00 Ranchi 127 63.50 73 36.50 200 100.00 Simdega 184 92.00 16 8.00 200 100.00 Dumka 52 26.00 148 74.00 200 100.00 Godda 122 61.00 78 39.00 200 100.00 Jamtara 90 45.00 110 55.00 200 100.00 Pakur 108 54.00 92 46.00 200 100.00 Sahibganj 143 71.50 57 28.50 200 100.00 E.Singhbhum 98 49.00 102 51.00 200 100.00 Saraikela 160 53.33 140 46.67 300 100.00 W.Singhbhum 221 73.67 79 26.33 300 100.00 Overall 1894 63.13 1106 36.87 3000 100.00 Location of Tribes Intervention Locations 948 63.20 552 36.80 1500 100.00 Control Locations 946 63.07 554 36.93 1500 100.00 Tribal Groups Primitive Tribal Groups 396 50.77 384 49.23 780 100.00 Other Tribal Groups 1498 67.48 722 32.52 2220 100.00
Chart 98 : Consumption of Pulses
Hhlds. Consumed
Pulses (63%)
Hhlds. Not Consumed
Pulses (37%)
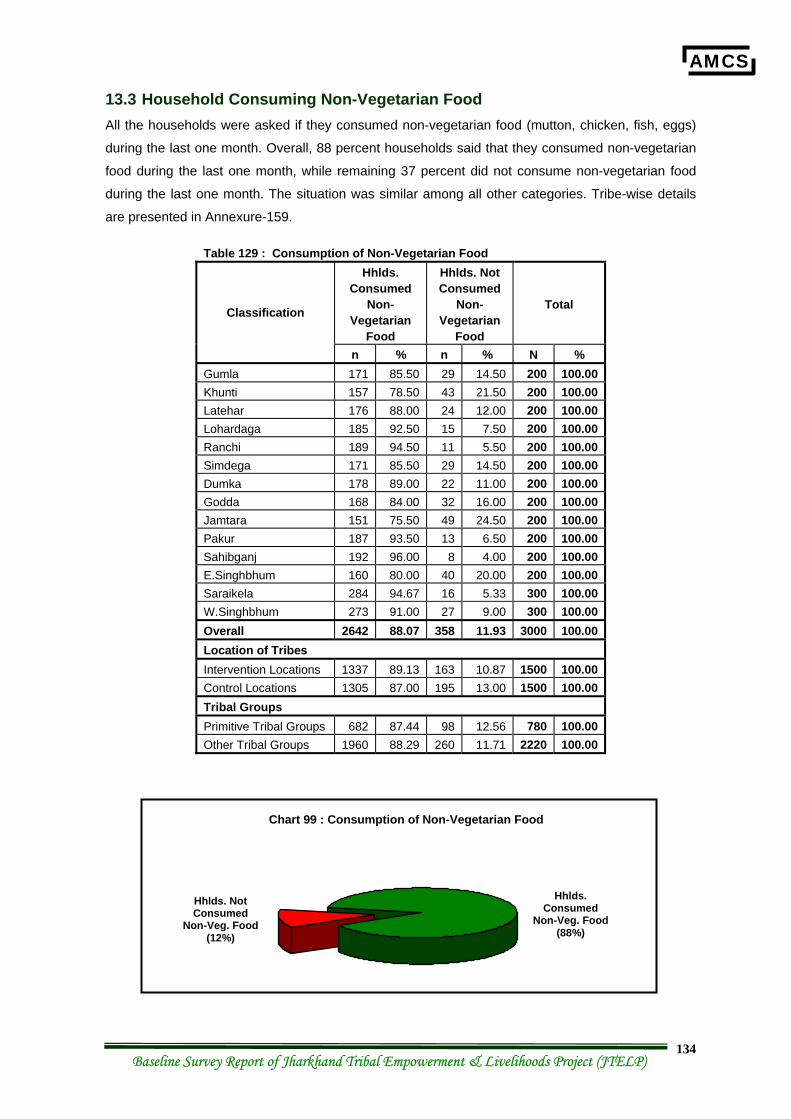
AMCS
Baseline Survey Report of Jharkhand Tribal Empowerment & Livelihoods Project (JTELP) 134
13.3 Household Consuming Non-Vegetarian Food All the households were asked if they consumed non-vegetarian food (mutton, chicken, fish, eggs)
during the last one month. Overall, 88 percent households said that they consumed non-vegetarian
food during the last one month, while remaining 37 percent did not consume non-vegetarian food
during the last one month. The situation was similar among all other categories. Tribe-wise details
are presented in Annexure-159.
Table 129 : Consumption of Non-Vegetarian Food Hhlds.
Consumed Non-
Vegetarian Food
Hhlds. Not Consumed
Non-Vegetarian
Food
Total Classification
n % n % N % Gumla 171 85.50 29 14.50 200 100.00 Khunti 157 78.50 43 21.50 200 100.00 Latehar 176 88.00 24 12.00 200 100.00 Lohardaga 185 92.50 15 7.50 200 100.00 Ranchi 189 94.50 11 5.50 200 100.00 Simdega 171 85.50 29 14.50 200 100.00 Dumka 178 89.00 22 11.00 200 100.00 Godda 168 84.00 32 16.00 200 100.00 Jamtara 151 75.50 49 24.50 200 100.00 Pakur 187 93.50 13 6.50 200 100.00 Sahibganj 192 96.00 8 4.00 200 100.00 E.Singhbhum 160 80.00 40 20.00 200 100.00 Saraikela 284 94.67 16 5.33 300 100.00 W.Singhbhum 273 91.00 27 9.00 300 100.00 Overall 2642 88.07 358 11.93 3000 100.00 Location of Tribes Intervention Locations 1337 89.13 163 10.87 1500 100.00 Control Locations 1305 87.00 195 13.00 1500 100.00 Tribal Groups Primitive Tribal Groups 682 87.44 98 12.56 780 100.00 Other Tribal Groups 1960 88.29 260 11.71 2220 100.00
Hhlds. Consumed
Non-Veg. Food (88%)
Chart 99 : Consumption of Non-Vegetarian Food
Hhlds. Not Consumed
Non-Veg. Food (12%)
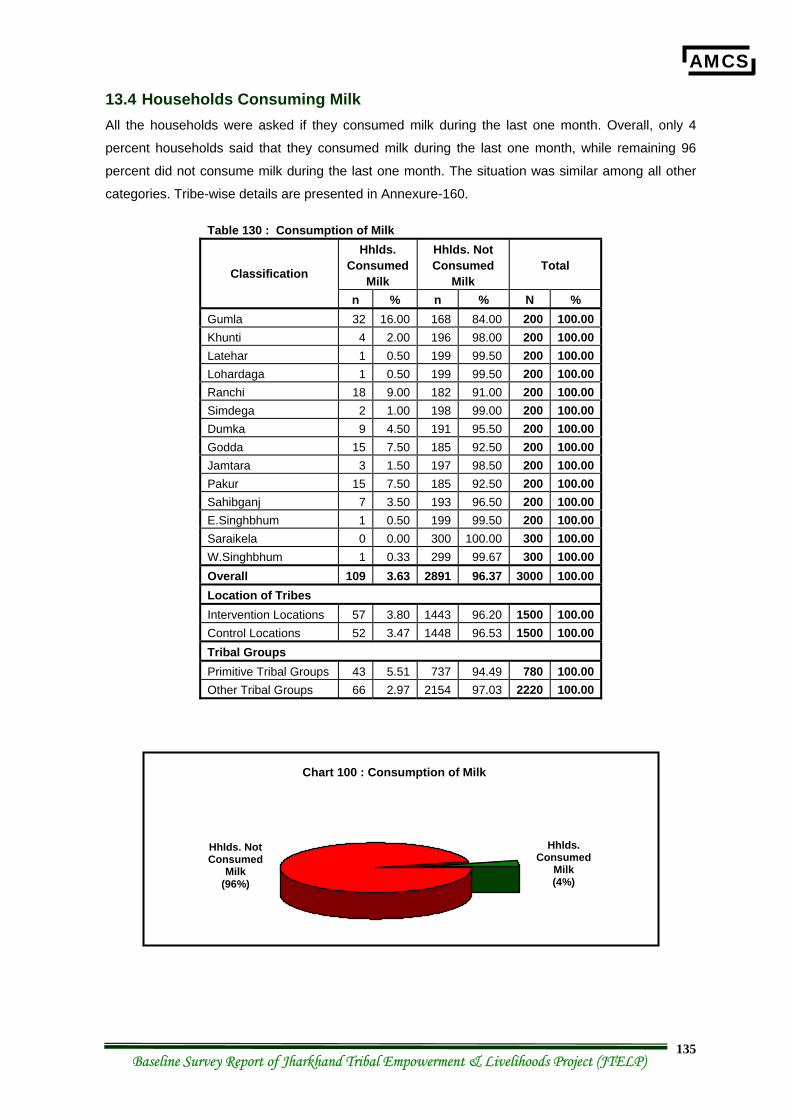
AMCS
Baseline Survey Report of Jharkhand Tribal Empowerment & Livelihoods Project (JTELP) 135
13.4 Households Consuming Milk All the households were asked if they consumed milk during the last one month. Overall, only 4
percent households said that they consumed milk during the last one month, while remaining 96
percent did not consume milk during the last one month. The situation was similar among all other
categories. Tribe-wise details are presented in Annexure-160.
Table 130 : Consumption of Milk Hhlds.
Consumed Milk
Hhlds. Not Consumed
Milk Total Classification
n % n % N % Gumla 32 16.00 168 84.00 200 100.00 Khunti 4 2.00 196 98.00 200 100.00 Latehar 1 0.50 199 99.50 200 100.00 Lohardaga 1 0.50 199 99.50 200 100.00 Ranchi 18 9.00 182 91.00 200 100.00 Simdega 2 1.00 198 99.00 200 100.00 Dumka 9 4.50 191 95.50 200 100.00 Godda 15 7.50 185 92.50 200 100.00 Jamtara 3 1.50 197 98.50 200 100.00 Pakur 15 7.50 185 92.50 200 100.00 Sahibganj 7 3.50 193 96.50 200 100.00 E.Singhbhum 1 0.50 199 99.50 200 100.00 Saraikela 0 0.00 300 100.00 300 100.00 W.Singhbhum 1 0.33 299 99.67 300 100.00 Overall 109 3.63 2891 96.37 3000 100.00 Location of Tribes Intervention Locations 57 3.80 1443 96.20 1500 100.00 Control Locations 52 3.47 1448 96.53 1500 100.00 Tribal Groups Primitive Tribal Groups 43 5.51 737 94.49 780 100.00 Other Tribal Groups 66 2.97 2154 97.03 2220 100.00
Hhlds. Consumed
Milk (4%)
Chart 100 : Consumption of Milk
Hhlds. Not Consumed
Milk (96%)
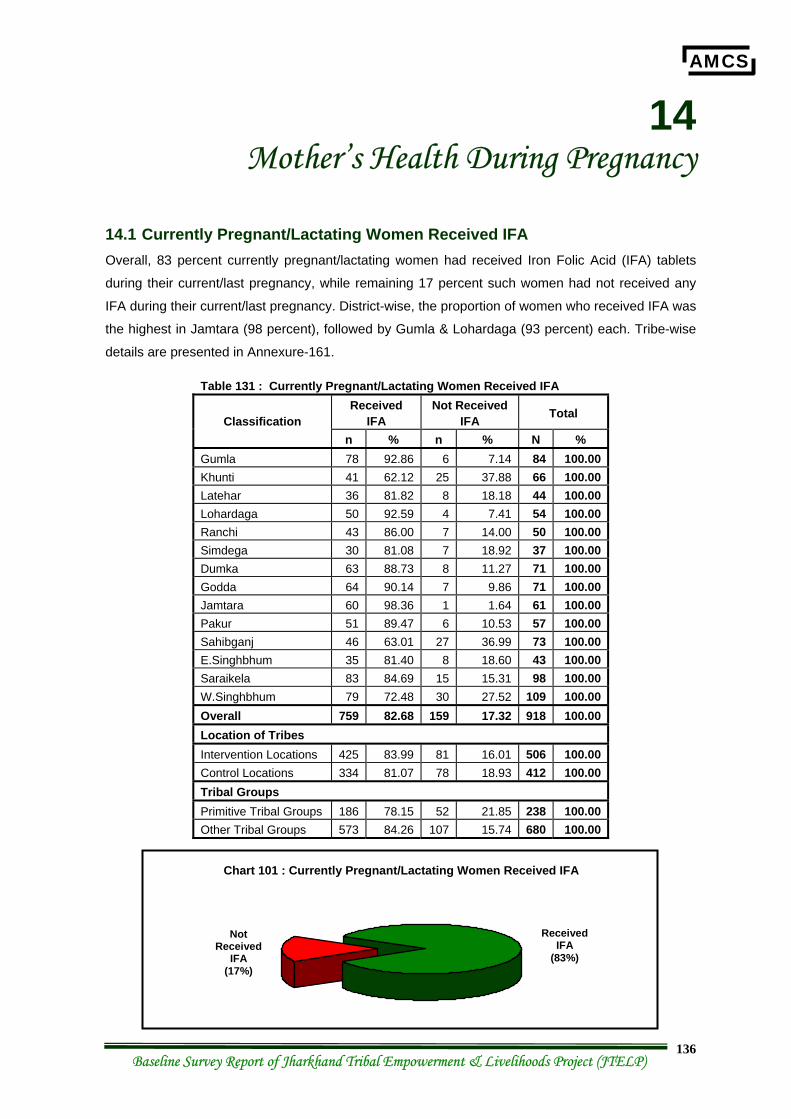
AMCS
Baseline Survey Report of Jharkhand Tribal Empowerment & Livelihoods Project (JTELP) 136
14 Mother’s Health During Pregnancy
14.1 Currently Pregnant/Lactating Women Received IFA Overall, 83 percent currently pregnant/lactating women had received Iron Folic Acid (IFA) tablets
during their current/last pregnancy, while remaining 17 percent such women had not received any
IFA during their current/last pregnancy. District-wise, the proportion of women who received IFA was
the highest in Jamtara (98 percent), followed by Gumla & Lohardaga (93 percent) each. Tribe-wise
details are presented in Annexure-161.
Table 131 : Currently Pregnant/Lactating Women Received IFA Received
IFA Not Received
IFA Total Classification n % n % N %
Gumla 78 92.86 6 7.14 84 100.00 Khunti 41 62.12 25 37.88 66 100.00 Latehar 36 81.82 8 18.18 44 100.00 Lohardaga 50 92.59 4 7.41 54 100.00 Ranchi 43 86.00 7 14.00 50 100.00 Simdega 30 81.08 7 18.92 37 100.00 Dumka 63 88.73 8 11.27 71 100.00 Godda 64 90.14 7 9.86 71 100.00 Jamtara 60 98.36 1 1.64 61 100.00 Pakur 51 89.47 6 10.53 57 100.00 Sahibganj 46 63.01 27 36.99 73 100.00 E.Singhbhum 35 81.40 8 18.60 43 100.00 Saraikela 83 84.69 15 15.31 98 100.00 W.Singhbhum 79 72.48 30 27.52 109 100.00 Overall 759 82.68 159 17.32 918 100.00 Location of Tribes Intervention Locations 425 83.99 81 16.01 506 100.00 Control Locations 334 81.07 78 18.93 412 100.00 Tribal Groups Primitive Tribal Groups 186 78.15 52 21.85 238 100.00 Other Tribal Groups 573 84.26 107 15.74 680 100.00
Received IFA
(83%)
Chart 101 : Currently Pregnant/Lactating Women Received IFA
Not Received
IFA (17%)
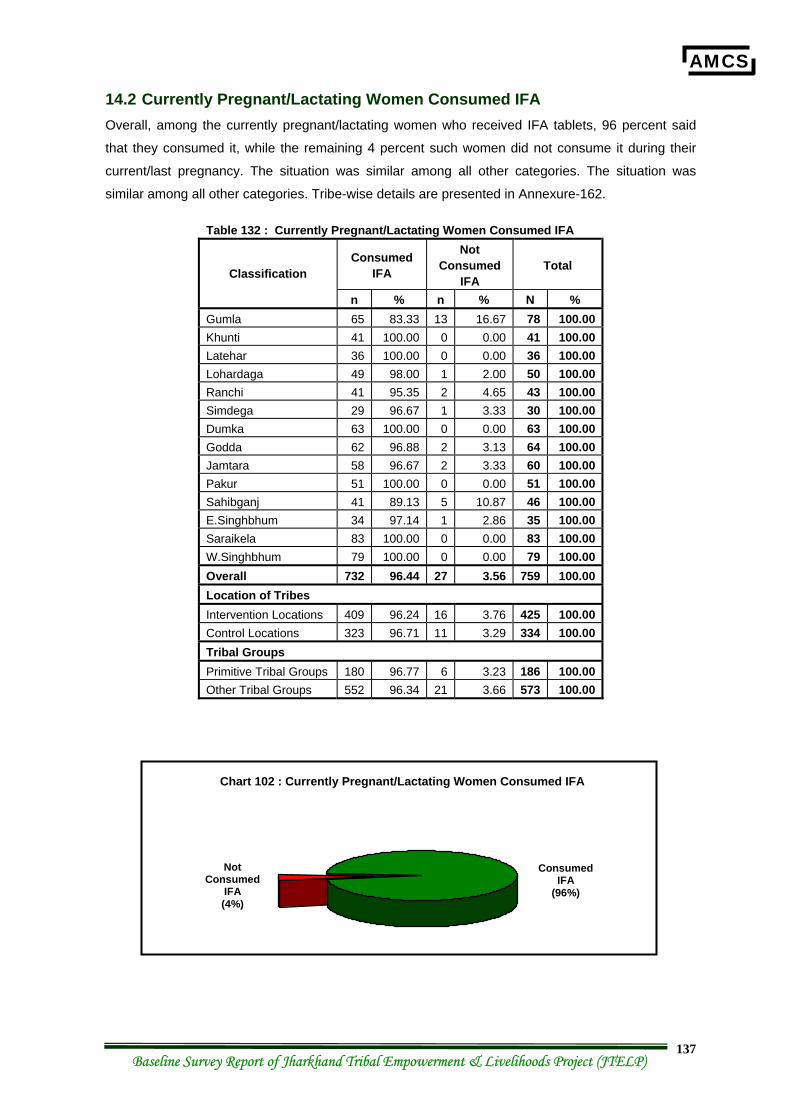
AMCS
Baseline Survey Report of Jharkhand Tribal Empowerment & Livelihoods Project (JTELP) 137
14.2 Currently Pregnant/Lactating Women Consumed IFA Overall, among the currently pregnant/lactating women who received IFA tablets, 96 percent said
that they consumed it, while the remaining 4 percent such women did not consume it during their
current/last pregnancy. The situation was similar among all other categories. The situation was
similar among all other categories. Tribe-wise details are presented in Annexure-162.
Table 132 : Currently Pregnant/Lactating Women Consumed IFA
Consumed IFA
Not Consumed
IFA Total Classification
n % n % N % Gumla 65 83.33 13 16.67 78 100.00 Khunti 41 100.00 0 0.00 41 100.00 Latehar 36 100.00 0 0.00 36 100.00 Lohardaga 49 98.00 1 2.00 50 100.00 Ranchi 41 95.35 2 4.65 43 100.00 Simdega 29 96.67 1 3.33 30 100.00 Dumka 63 100.00 0 0.00 63 100.00 Godda 62 96.88 2 3.13 64 100.00 Jamtara 58 96.67 2 3.33 60 100.00 Pakur 51 100.00 0 0.00 51 100.00 Sahibganj 41 89.13 5 10.87 46 100.00 E.Singhbhum 34 97.14 1 2.86 35 100.00 Saraikela 83 100.00 0 0.00 83 100.00 W.Singhbhum 79 100.00 0 0.00 79 100.00 Overall 732 96.44 27 3.56 759 100.00 Location of Tribes Intervention Locations 409 96.24 16 3.76 425 100.00 Control Locations 323 96.71 11 3.29 334 100.00 Tribal Groups Primitive Tribal Groups 180 96.77 6 3.23 186 100.00 Other Tribal Groups 552 96.34 21 3.66 573 100.00
Chart 102 : Currently Pregnant/Lactating Women Consumed IFA
Consumed IFA
(96%)
Not Consumed
IFA (4%)
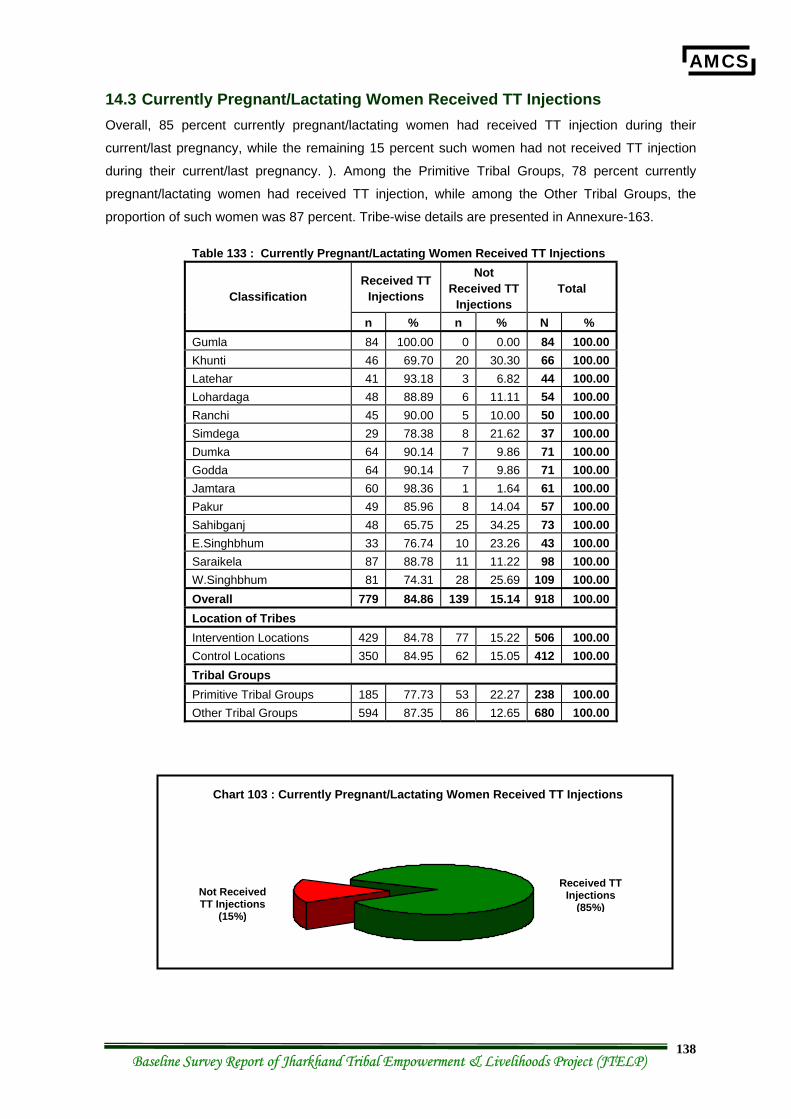
AMCS
Baseline Survey Report of Jharkhand Tribal Empowerment & Livelihoods Project (JTELP) 138
14.3 Currently Pregnant/Lactating Women Received TT Injections Overall, 85 percent currently pregnant/lactating women had received TT injection during their
current/last pregnancy, while the remaining 15 percent such women had not received TT injection
during their current/last pregnancy. ). Among the Primitive Tribal Groups, 78 percent currently
pregnant/lactating women had received TT injection, while among the Other Tribal Groups, the
proportion of such women was 87 percent. Tribe-wise details are presented in Annexure-163.
Table 133 : Currently Pregnant/Lactating Women Received TT Injections
Received TT Injections
Not Received TT
Injections Total Classification
n % n % N % Gumla 84 100.00 0 0.00 84 100.00 Khunti 46 69.70 20 30.30 66 100.00 Latehar 41 93.18 3 6.82 44 100.00 Lohardaga 48 88.89 6 11.11 54 100.00 Ranchi 45 90.00 5 10.00 50 100.00 Simdega 29 78.38 8 21.62 37 100.00 Dumka 64 90.14 7 9.86 71 100.00 Godda 64 90.14 7 9.86 71 100.00 Jamtara 60 98.36 1 1.64 61 100.00 Pakur 49 85.96 8 14.04 57 100.00 Sahibganj 48 65.75 25 34.25 73 100.00 E.Singhbhum 33 76.74 10 23.26 43 100.00 Saraikela 87 88.78 11 11.22 98 100.00 W.Singhbhum 81 74.31 28 25.69 109 100.00 Overall 779 84.86 139 15.14 918 100.00 Location of Tribes Intervention Locations 429 84.78 77 15.22 506 100.00 Control Locations 350 84.95 62 15.05 412 100.00 Tribal Groups Primitive Tribal Groups 185 77.73 53 22.27 238 100.00 Other Tribal Groups 594 87.35 86 12.65 680 100.00
Received TT Injections
(85%)
Chart 103 : Currently Pregnant/Lactating Women Received TT Injections
Not Received TT Injections
(15%)
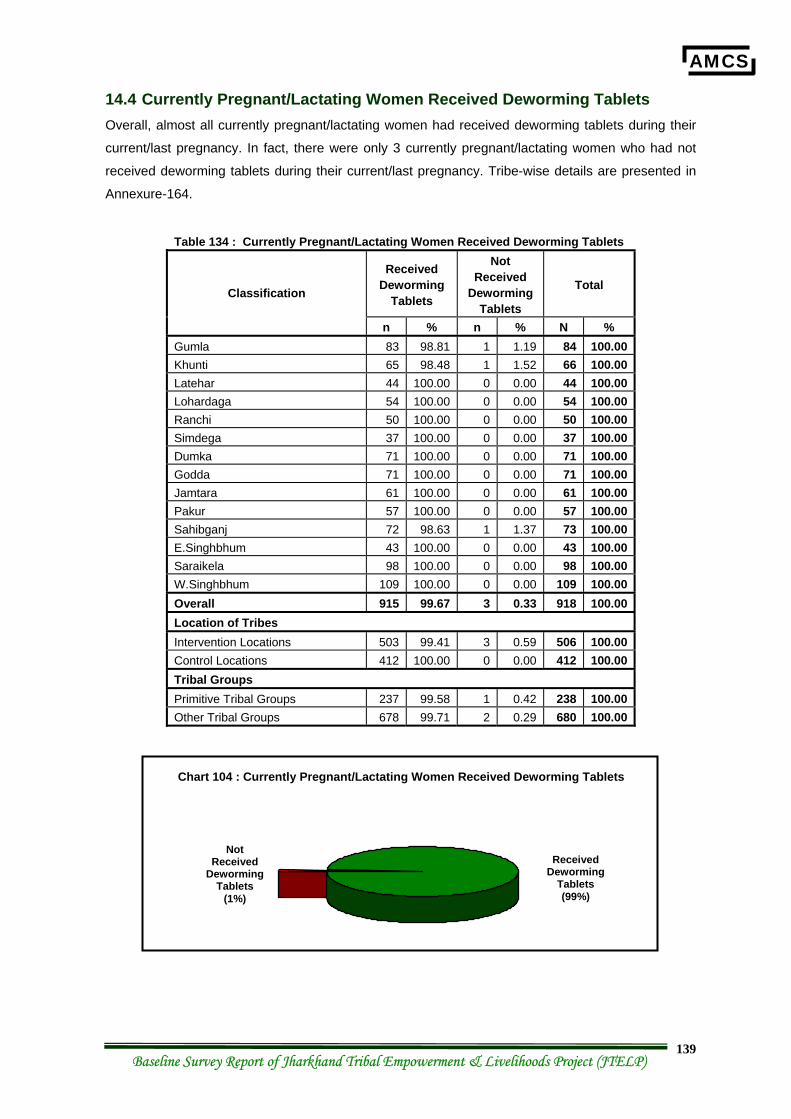
AMCS
Baseline Survey Report of Jharkhand Tribal Empowerment & Livelihoods Project (JTELP) 139
14.4 Currently Pregnant/Lactating Women Received Deworming Tablets Overall, almost all currently pregnant/lactating women had received deworming tablets during their
current/last pregnancy. In fact, there were only 3 currently pregnant/lactating women who had not
received deworming tablets during their current/last pregnancy. Tribe-wise details are presented in
Annexure-164.
Table 134 : Currently Pregnant/Lactating Women Received Deworming Tablets
Received Deworming
Tablets
Not Received
Deworming Tablets
Total Classification
n % n % N % Gumla 83 98.81 1 1.19 84 100.00 Khunti 65 98.48 1 1.52 66 100.00 Latehar 44 100.00 0 0.00 44 100.00 Lohardaga 54 100.00 0 0.00 54 100.00 Ranchi 50 100.00 0 0.00 50 100.00 Simdega 37 100.00 0 0.00 37 100.00 Dumka 71 100.00 0 0.00 71 100.00 Godda 71 100.00 0 0.00 71 100.00 Jamtara 61 100.00 0 0.00 61 100.00 Pakur 57 100.00 0 0.00 57 100.00 Sahibganj 72 98.63 1 1.37 73 100.00 E.Singhbhum 43 100.00 0 0.00 43 100.00 Saraikela 98 100.00 0 0.00 98 100.00 W.Singhbhum 109 100.00 0 0.00 109 100.00 Overall 915 99.67 3 0.33 918 100.00 Location of Tribes Intervention Locations 503 99.41 3 0.59 506 100.00 Control Locations 412 100.00 0 0.00 412 100.00 Tribal Groups Primitive Tribal Groups 237 99.58 1 0.42 238 100.00 Other Tribal Groups 678 99.71 2 0.29 680 100.00
Received Deworming
Tablets (99%)
Chart 104 : Currently Pregnant/Lactating Women Received Deworming Tablets
Not Received
Deworming Tablets
(1%)
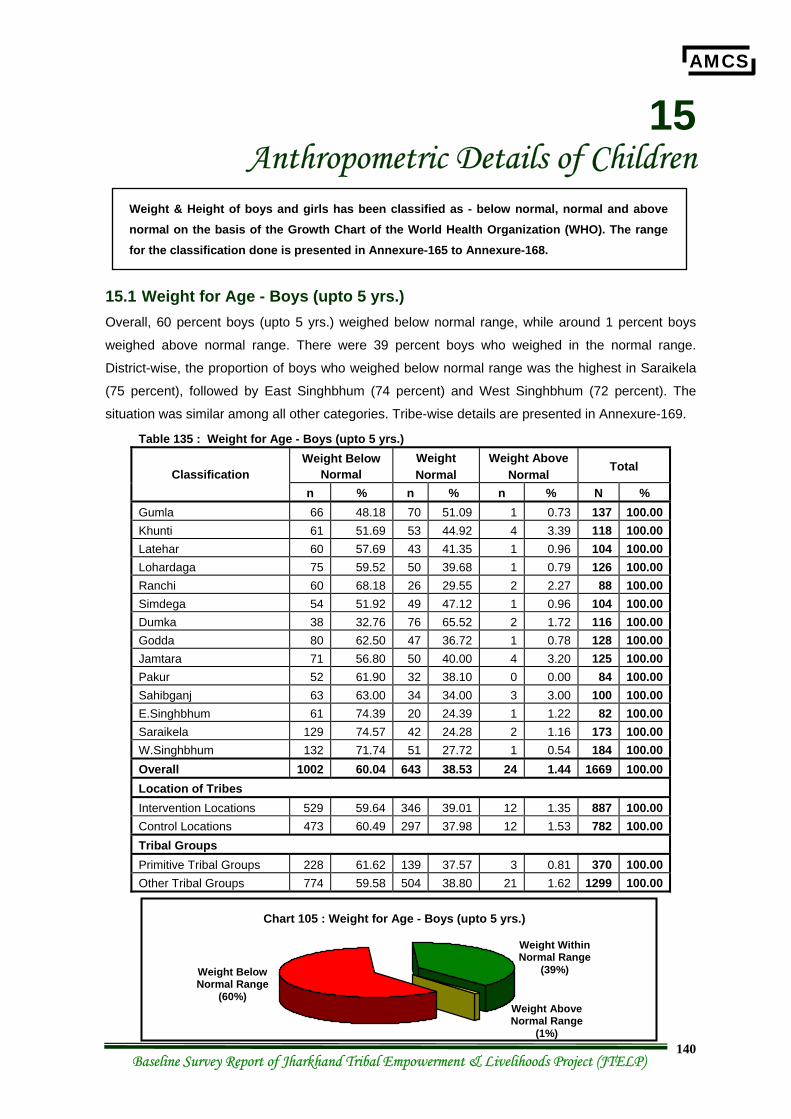
AMCS
Baseline Survey Report of Jharkhand Tribal Empowerment & Livelihoods Project (JTELP) 140
15 Anthropometric Details of Children
Weight & Height of boys and girls has been classified as - below normal, normal and above normal on the basis of the Growth Chart of the World Health Organization (WHO). The range for the classification done is presented in Annexure-165 to Annexure-168.
15.1 Weight for Age - Boys (upto 5 yrs.) Overall, 60 percent boys (upto 5 yrs.) weighed below normal range, while around 1 percent boys
weighed above normal range. There were 39 percent boys who weighed in the normal range.
District-wise, the proportion of boys who weighed below normal range was the highest in Saraikela
(75 percent), followed by East Singhbhum (74 percent) and West Singhbhum (72 percent). The
situation was similar among all other categories. Tribe-wise details are presented in Annexure-169.
Table 135 : Weight for Age - Boys (upto 5 yrs.) Weight Below
Normal Weight Normal
Weight Above Normal
Total Classification n % n % n % N %
Gumla 66 48.18 70 51.09 1 0.73 137 100.00Khunti 61 51.69 53 44.92 4 3.39 118 100.00Latehar 60 57.69 43 41.35 1 0.96 104 100.00Lohardaga 75 59.52 50 39.68 1 0.79 126 100.00Ranchi 60 68.18 26 29.55 2 2.27 88 100.00Simdega 54 51.92 49 47.12 1 0.96 104 100.00Dumka 38 32.76 76 65.52 2 1.72 116 100.00Godda 80 62.50 47 36.72 1 0.78 128 100.00Jamtara 71 56.80 50 40.00 4 3.20 125 100.00Pakur 52 61.90 32 38.10 0 0.00 84 100.00Sahibganj 63 63.00 34 34.00 3 3.00 100 100.00E.Singhbhum 61 74.39 20 24.39 1 1.22 82 100.00Saraikela 129 74.57 42 24.28 2 1.16 173 100.00W.Singhbhum 132 71.74 51 27.72 1 0.54 184 100.00Overall 1002 60.04 643 38.53 24 1.44 1669 100.00Location of Tribes Intervention Locations 529 59.64 346 39.01 12 1.35 887 100.00Control Locations 473 60.49 297 37.98 12 1.53 782 100.00Tribal Groups Primitive Tribal Groups 228 61.62 139 37.57 3 0.81 370 100.00Other Tribal Groups 774 59.58 504 38.80 21 1.62 1299 100.00
Chart 105 : Weight for Age - Boys (upto 5 yrs.)
Weight Below Normal Range
(60%)
Weight Within Normal Range
(39%)
Weight Above Normal Range
(1%)
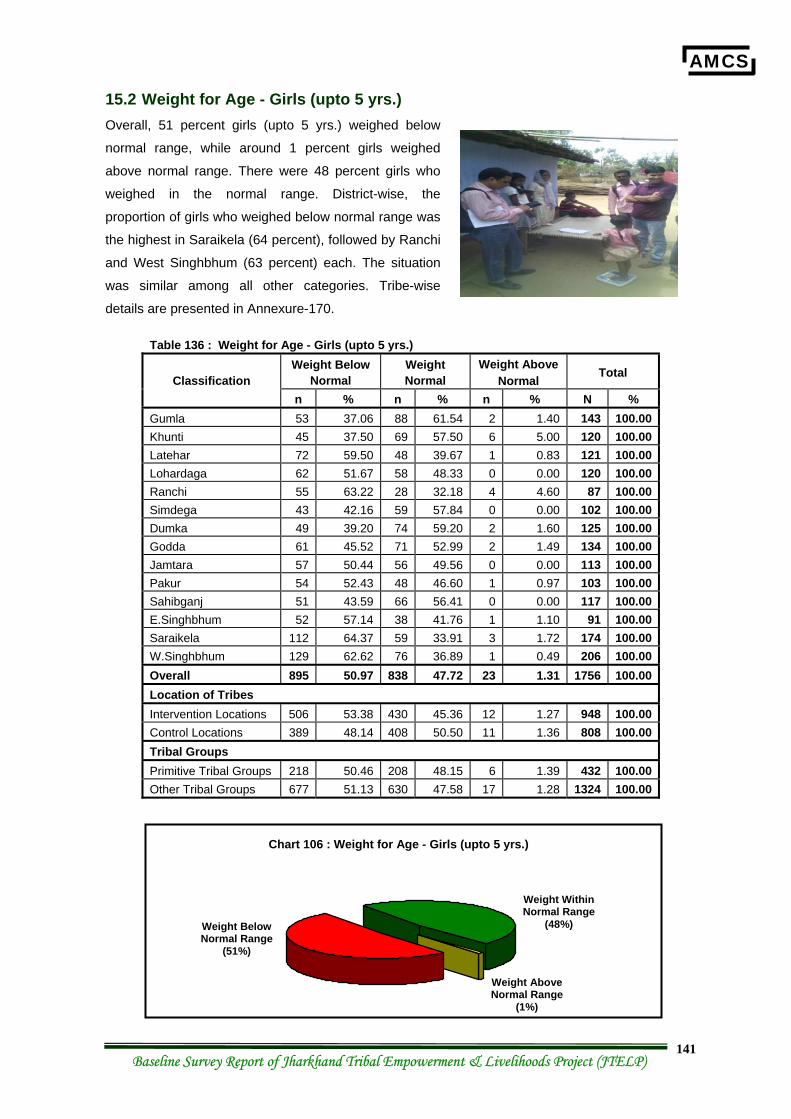
AMCS
Baseline Survey Report of Jharkhand Tribal Empowerment & Livelihoods Project (JTELP) 141
15.2 Weight for Age - Girls (upto 5 yrs.) Overall, 51 percent girls (upto 5 yrs.) weighed below
normal range, while around 1 percent girls weighed
above normal range. There were 48 percent girls who
weighed in the normal range. District-wise, the
proportion of girls who weighed below normal range was
the highest in Saraikela (64 percent), followed by Ranchi
and West Singhbhum (63 percent) each. The situation
was similar among all other categories. Tribe-wise
details are presented in Annexure-170.
Table 136 : Weight for Age - Girls (upto 5 yrs.) Weight Below
Normal Weight Normal
Weight Above Normal Total Classification
n % n % n % N % Gumla 53 37.06 88 61.54 2 1.40 143 100.00 Khunti 45 37.50 69 57.50 6 5.00 120 100.00 Latehar 72 59.50 48 39.67 1 0.83 121 100.00 Lohardaga 62 51.67 58 48.33 0 0.00 120 100.00 Ranchi 55 63.22 28 32.18 4 4.60 87 100.00 Simdega 43 42.16 59 57.84 0 0.00 102 100.00 Dumka 49 39.20 74 59.20 2 1.60 125 100.00 Godda 61 45.52 71 52.99 2 1.49 134 100.00 Jamtara 57 50.44 56 49.56 0 0.00 113 100.00 Pakur 54 52.43 48 46.60 1 0.97 103 100.00 Sahibganj 51 43.59 66 56.41 0 0.00 117 100.00 E.Singhbhum 52 57.14 38 41.76 1 1.10 91 100.00 Saraikela 112 64.37 59 33.91 3 1.72 174 100.00 W.Singhbhum 129 62.62 76 36.89 1 0.49 206 100.00 Overall 895 50.97 838 47.72 23 1.31 1756 100.00 Location of Tribes Intervention Locations 506 53.38 430 45.36 12 1.27 948 100.00 Control Locations 389 48.14 408 50.50 11 1.36 808 100.00 Tribal Groups Primitive Tribal Groups 218 50.46 208 48.15 6 1.39 432 100.00 Other Tribal Groups 677 51.13 630 47.58 17 1.28 1324 100.00
Chart 106 : Weight for Age - Girls (upto 5 yrs.)
Weight Below Normal Range
(51%)
Weight Above Normal Range
(1%)
Weight Within Normal Range
(48%)
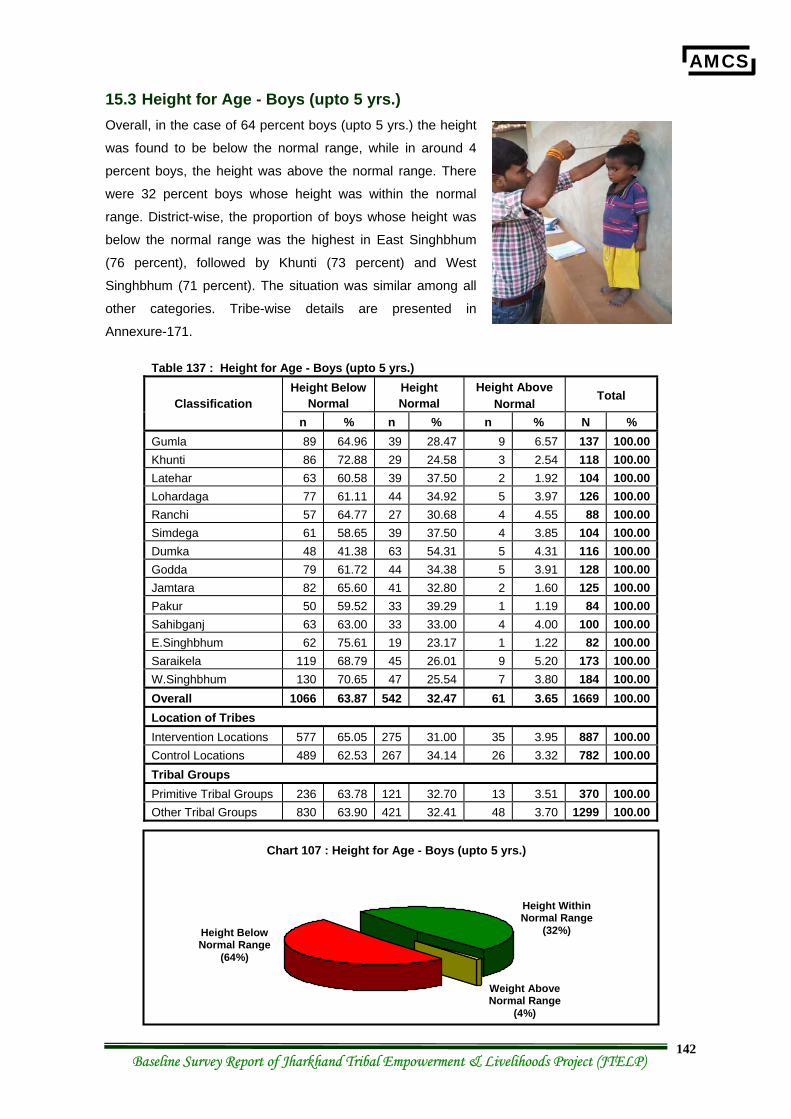
AMCS
Baseline Survey Report of Jharkhand Tribal Empowerment & Livelihoods Project (JTELP) 142
15.3 Height for Age - Boys (upto 5 yrs.) Overall, in the case of 64 percent boys (upto 5 yrs.) the height
was found to be below the normal range, while in around 4
percent boys, the height was above the normal range. There
were 32 percent boys whose height was within the normal
range. District-wise, the proportion of boys whose height was
below the normal range was the highest in East Singhbhum
(76 percent), followed by Khunti (73 percent) and West
Singhbhum (71 percent). The situation was similar among all
other categories. Tribe-wise details are presented in
Annexure-171.
Table 137 : Height for Age - Boys (upto 5 yrs.) Height Below
Normal Height Normal
Height Above Normal
Total Classification n % n % n % N %
Gumla 89 64.96 39 28.47 9 6.57 137 100.00 Khunti 86 72.88 29 24.58 3 2.54 118 100.00 Latehar 63 60.58 39 37.50 2 1.92 104 100.00 Lohardaga 77 61.11 44 34.92 5 3.97 126 100.00 Ranchi 57 64.77 27 30.68 4 4.55 88 100.00 Simdega 61 58.65 39 37.50 4 3.85 104 100.00 Dumka 48 41.38 63 54.31 5 4.31 116 100.00 Godda 79 61.72 44 34.38 5 3.91 128 100.00 Jamtara 82 65.60 41 32.80 2 1.60 125 100.00 Pakur 50 59.52 33 39.29 1 1.19 84 100.00 Sahibganj 63 63.00 33 33.00 4 4.00 100 100.00 E.Singhbhum 62 75.61 19 23.17 1 1.22 82 100.00 Saraikela 119 68.79 45 26.01 9 5.20 173 100.00 W.Singhbhum 130 70.65 47 25.54 7 3.80 184 100.00 Overall 1066 63.87 542 32.47 61 3.65 1669 100.00 Location of Tribes Intervention Locations 577 65.05 275 31.00 35 3.95 887 100.00 Control Locations 489 62.53 267 34.14 26 3.32 782 100.00 Tribal Groups Primitive Tribal Groups 236 63.78 121 32.70 13 3.51 370 100.00 Other Tribal Groups 830 63.90 421 32.41 48 3.70 1299 100.00
Chart 107 : Height for Age - Boys (upto 5 yrs.)
Height Below Normal Range
(64%)
Weight Above Normal Range
(4%)
Height Within Normal Range
(32%)
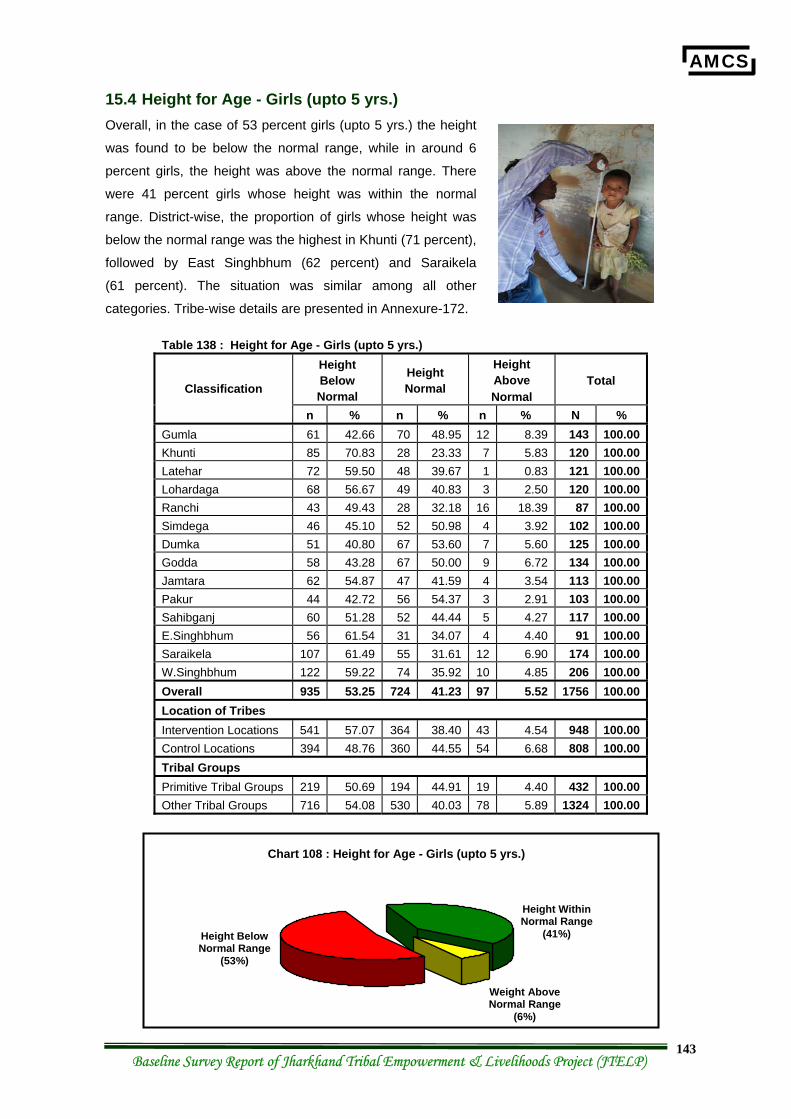
AMCS
Baseline Survey Report of Jharkhand Tribal Empowerment & Livelihoods Project (JTELP) 143
15.4 Height for Age - Girls (upto 5 yrs.) Overall, in the case of 53 percent girls (upto 5 yrs.) the height
was found to be below the normal range, while in around 6
percent girls, the height was above the normal range. There
were 41 percent girls whose height was within the normal
range. District-wise, the proportion of girls whose height was
below the normal range was the highest in Khunti (71 percent),
followed by East Singhbhum (62 percent) and Saraikela
(61 percent). The situation was similar among all other
categories. Tribe-wise details are presented in Annexure-172.
Table 138 : Height for Age - Girls (upto 5 yrs.) Height Below Normal
Height Normal
Height Above Normal
Total Classification
n % n % n % N % Gumla 61 42.66 70 48.95 12 8.39 143 100.00 Khunti 85 70.83 28 23.33 7 5.83 120 100.00 Latehar 72 59.50 48 39.67 1 0.83 121 100.00 Lohardaga 68 56.67 49 40.83 3 2.50 120 100.00 Ranchi 43 49.43 28 32.18 16 18.39 87 100.00 Simdega 46 45.10 52 50.98 4 3.92 102 100.00 Dumka 51 40.80 67 53.60 7 5.60 125 100.00 Godda 58 43.28 67 50.00 9 6.72 134 100.00 Jamtara 62 54.87 47 41.59 4 3.54 113 100.00 Pakur 44 42.72 56 54.37 3 2.91 103 100.00 Sahibganj 60 51.28 52 44.44 5 4.27 117 100.00 E.Singhbhum 56 61.54 31 34.07 4 4.40 91 100.00 Saraikela 107 61.49 55 31.61 12 6.90 174 100.00 W.Singhbhum 122 59.22 74 35.92 10 4.85 206 100.00 Overall 935 53.25 724 41.23 97 5.52 1756 100.00 Location of Tribes Intervention Locations 541 57.07 364 38.40 43 4.54 948 100.00 Control Locations 394 48.76 360 44.55 54 6.68 808 100.00 Tribal Groups Primitive Tribal Groups 219 50.69 194 44.91 19 4.40 432 100.00 Other Tribal Groups 716 54.08 530 40.03 78 5.89 1324 100.00
Chart 108 : Height for Age - Girls (upto 5 yrs.)
Height Below Normal Range
(53%)
Weight Above Normal Range
(6%)
Height Within Normal Range
(41%)
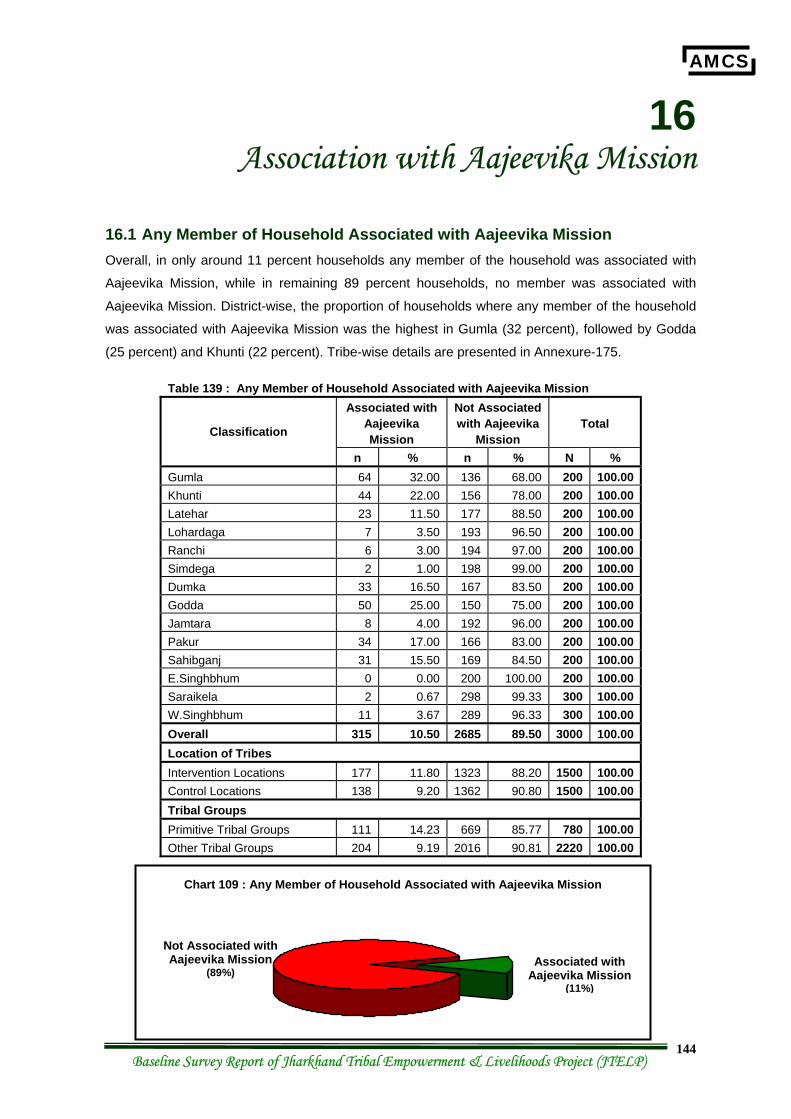
AMCS
Baseline Survey Report of Jharkhand Tribal Empowerment & Livelihoods Project (JTELP) 144
16 Association with Aajeevika Mission
16.1 Any Member of Household Associated with Aajeevika Mission Overall, in only around 11 percent households any member of the household was associated with
Aajeevika Mission, while in remaining 89 percent households, no member was associated with
Aajeevika Mission. District-wise, the proportion of households where any member of the household
was associated with Aajeevika Mission was the highest in Gumla (32 percent), followed by Godda
(25 percent) and Khunti (22 percent). Tribe-wise details are presented in Annexure-175.
Table 139 : Any Member of Household Associated with Aajeevika Mission Associated with
Aajeevika Mission
Not Associated with Aajeevika
Mission Total Classification
n % n % N % Gumla 64 32.00 136 68.00 200 100.00 Khunti 44 22.00 156 78.00 200 100.00 Latehar 23 11.50 177 88.50 200 100.00 Lohardaga 7 3.50 193 96.50 200 100.00 Ranchi 6 3.00 194 97.00 200 100.00 Simdega 2 1.00 198 99.00 200 100.00 Dumka 33 16.50 167 83.50 200 100.00 Godda 50 25.00 150 75.00 200 100.00 Jamtara 8 4.00 192 96.00 200 100.00 Pakur 34 17.00 166 83.00 200 100.00 Sahibganj 31 15.50 169 84.50 200 100.00 E.Singhbhum 0 0.00 200 100.00 200 100.00 Saraikela 2 0.67 298 99.33 300 100.00 W.Singhbhum 11 3.67 289 96.33 300 100.00 Overall 315 10.50 2685 89.50 3000 100.00 Location of Tribes Intervention Locations 177 11.80 1323 88.20 1500 100.00 Control Locations 138 9.20 1362 90.80 1500 100.00 Tribal Groups Primitive Tribal Groups 111 14.23 669 85.77 780 100.00 Other Tribal Groups 204 9.19 2016 90.81 2220 100.00
Chart 109 : Any Member of Household Associated with Aajeevika Mission
Associated with Aajeevika Mission
(11%)
Not Associated with Aajeevika Mission
(89%)

AMCS
Baseline Survey Report of Jharkhand Tribal Empowerment & Livelihoods Project (JTELP) 145
16.2 Type of Income Generation Activity done by the Group Overall, among the households where any member of the household was associated with Aajeevika
Mission, in around 76 percent cases, no income generation activity was being undertaken and the
members were only making regular contributions to their group. In another 22 percent cases, it was
reported that the group was involved in inter-loaning activities. In around 2 cases, the group
members were involved in taking up collective wage labour work, while in remaining 1 percent
cases, the members were involved in collective farming. Tribe-wise details are presented in
Annexure-176.
Table 140 : Type of Income Generation Activity done by the Group
Only Savings
Inter-loaning
Collective Wage
Labour
Collective Agriculture Total Classification
n % n % n % n % N % Gumla 49 76.56 15 23.44 0 0.00 0 0.00 64 100.00Khunti 38 86.36 2 4.55 4 9.09 0 0.00 44 100.00Latehar 23 100.00 0 0.00 0 0.00 0 0.00 23 100.00Lohardaga 7 100.00 0 0.00 0 0.00 0 0.00 7 100.00Ranchi 5 83.33 0 0.00 1 16.67 0 0.00 6 100.00Simdega 1 50.00 0 0.00 0 0.00 1 50.00 2 100.00Dumka 25 75.76 8 24.24 0 0.00 0 0.00 33 100.00Godda 27 54.00 22 44.00 0 0.00 1 2.00 50 100.00Jamtara 7 87.50 1 12.50 0 0.00 0 0.00 8 100.00Pakur 20 58.82 14 41.18 0 0.00 0 0.00 34 100.00Sahibganj 23 74.19 8 25.81 0 0.00 0 0.00 31 100.00E.Singhbhum 0 0.00 0 0.00 0 0.00 0 0.00 0 0.00Saraikela 2 100.00 0 0.00 0 0.00 0 0.00 2 100.00W.Singhbhum 11 100.00 0 0.00 0 0.00 0 0.00 11 100.00Overall 238 75.56 70 22.22 5 1.59 2 0.63 315 100.00Location of Tribes Intervention Locations 144 81.36 31 17.51 2 1.13 0 0.00 177 100.00Control Locations 94 68.12 39 28.26 3 2.17 2 1.45 138 100.00Tribal Groups Primitive Tribal Groups 73 65.77 38 34.23 0 0.00 0 0.00 111 100.00Other Tribal Groups 165 80.88 32 15.69 5 2.45 2 0.98 204 100.00
Chart 110 : Type of Income Generation Activity done by the Group
Collective Agriculture (1%)
Only Savings (75%)
Inter-loaning (22%)
Collective Wage Labour
(2%)
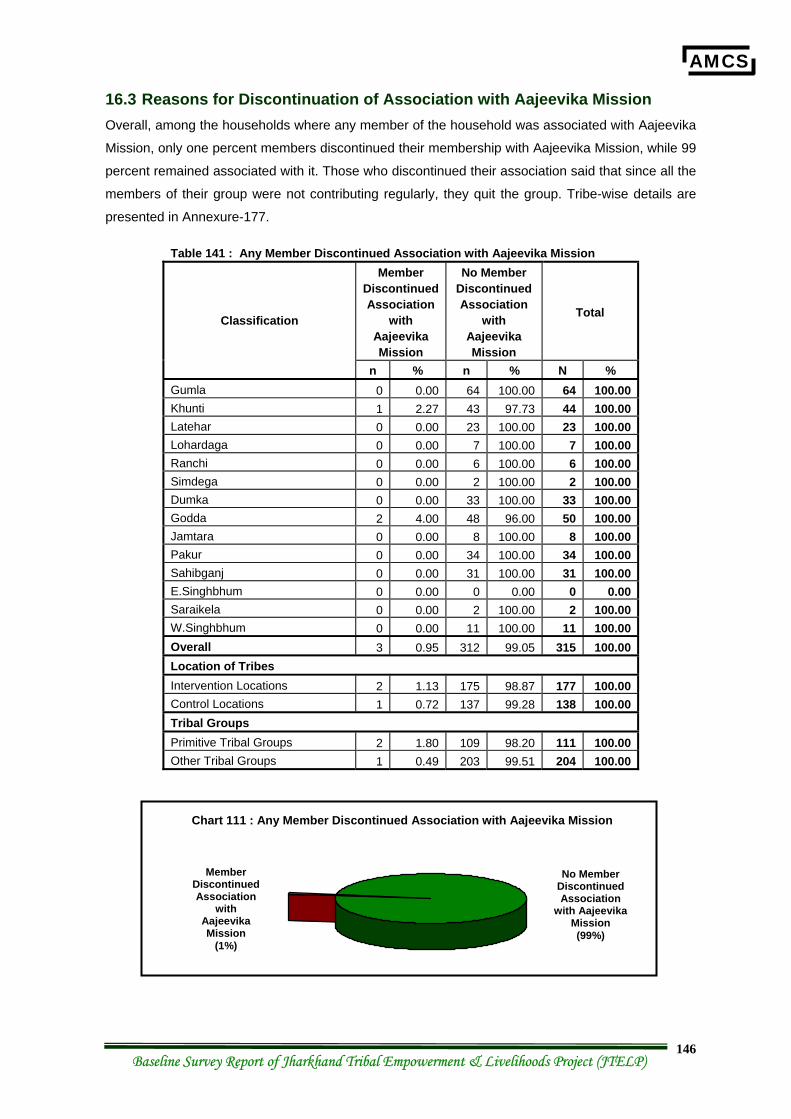
AMCS
Baseline Survey Report of Jharkhand Tribal Empowerment & Livelihoods Project (JTELP) 146
16.3 Reasons for Discontinuation of Association with Aajeevika Mission Overall, among the households where any member of the household was associated with Aajeevika
Mission, only one percent members discontinued their membership with Aajeevika Mission, while 99
percent remained associated with it. Those who discontinued their association said that since all the
members of their group were not contributing regularly, they quit the group. Tribe-wise details are
presented in Annexure-177.
Table 141 : Any Member Discontinued Association with Aajeevika Mission Member
Discontinued Association
with Aajeevika Mission
No Member Discontinued Association
with Aajeevika Mission
Total Classification
n % n % N % Gumla 0 0.00 64 100.00 64 100.00 Khunti 1 2.27 43 97.73 44 100.00 Latehar 0 0.00 23 100.00 23 100.00 Lohardaga 0 0.00 7 100.00 7 100.00 Ranchi 0 0.00 6 100.00 6 100.00 Simdega 0 0.00 2 100.00 2 100.00 Dumka 0 0.00 33 100.00 33 100.00 Godda 2 4.00 48 96.00 50 100.00 Jamtara 0 0.00 8 100.00 8 100.00 Pakur 0 0.00 34 100.00 34 100.00 Sahibganj 0 0.00 31 100.00 31 100.00 E.Singhbhum 0 0.00 0 0.00 0 0.00 Saraikela 0 0.00 2 100.00 2 100.00 W.Singhbhum 0 0.00 11 100.00 11 100.00 Overall 3 0.95 312 99.05 315 100.00 Location of Tribes Intervention Locations 2 1.13 175 98.87 177 100.00 Control Locations 1 0.72 137 99.28 138 100.00 Tribal Groups Primitive Tribal Groups 2 1.80 109 98.20 111 100.00 Other Tribal Groups 1 0.49 203 99.51 204 100.00
Chart 111 : Any Member Discontinued Association with Aajeevika Mission
No Member Discontinued Association
with Aajeevika Mission (99%)
Member Discontinued Association
with Aajeevika Mission
(1%)
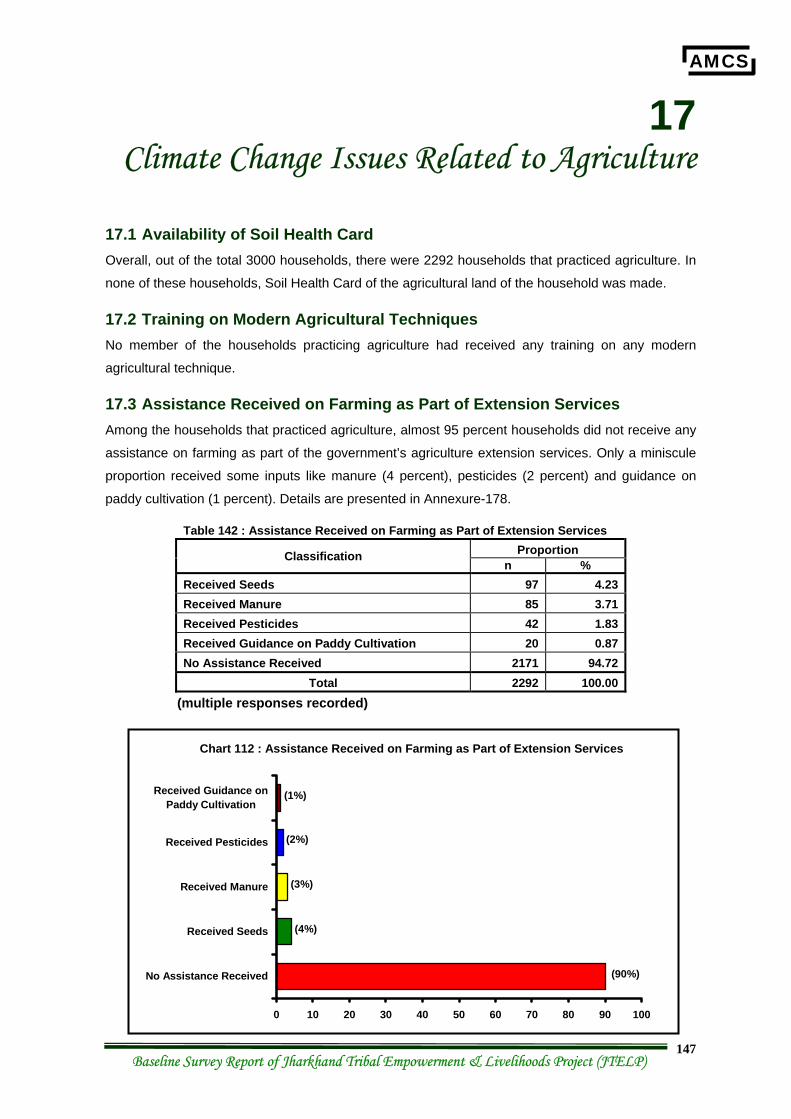
AMCS
Baseline Survey Report of Jharkhand Tribal Empowerment & Livelihoods Project (JTELP) 147
17 Climate Change Issues Related to Agriculture
17.1 Availability of Soil Health Card Overall, out of the total 3000 households, there were 2292 households that practiced agriculture. In
none of these households, Soil Health Card of the agricultural land of the household was made.
17.2 Training on Modern Agricultural Techniques No member of the households practicing agriculture had received any training on any modern
agricultural technique.
17.3 Assistance Received on Farming as Part of Extension Services Among the households that practiced agriculture, almost 95 percent households did not receive any
assistance on farming as part of the government’s agriculture extension services. Only a miniscule
proportion received some inputs like manure (4 percent), pesticides (2 percent) and guidance on
paddy cultivation (1 percent). Details are presented in Annexure-178.
Table 142 : Assistance Received on Farming as Part of Extension Services Proportion Classification
n % Received Seeds 97 4.23 Received Manure 85 3.71 Received Pesticides 42 1.83 Received Guidance on Paddy Cultivation 20 0.87 No Assistance Received 2171 94.72
Total 2292 100.00 (multiple responses recorded)
Chart 112 : Assistance Received on Farming as Part of Extension Services
(90%)
(2%)
(3%)
(4%)
(1%)
0 10 20 30 40 50 60 70 80 90 100
No Assistance Received
Received Seeds
Received Manure
Received Pesticides
Received Guidance onPaddy Cultivation
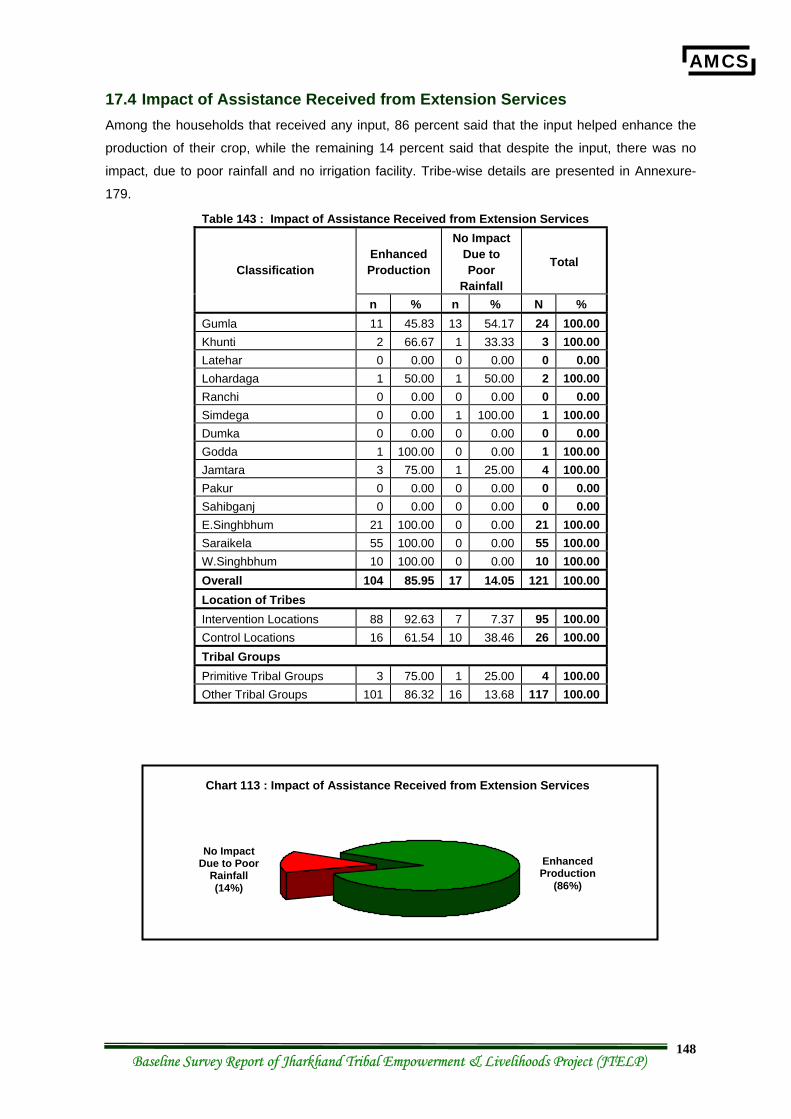
AMCS
Baseline Survey Report of Jharkhand Tribal Empowerment & Livelihoods Project (JTELP) 148
17.4 Impact of Assistance Received from Extension Services Among the households that received any input, 86 percent said that the input helped enhance the
production of their crop, while the remaining 14 percent said that despite the input, there was no
impact, due to poor rainfall and no irrigation facility. Tribe-wise details are presented in Annexure-
179.
Table 143 : Impact of Assistance Received from Extension Services
Enhanced Production
No Impact Due to Poor
Rainfall
Total Classification
n % n % N % Gumla 11 45.83 13 54.17 24 100.00 Khunti 2 66.67 1 33.33 3 100.00 Latehar 0 0.00 0 0.00 0 0.00 Lohardaga 1 50.00 1 50.00 2 100.00 Ranchi 0 0.00 0 0.00 0 0.00 Simdega 0 0.00 1 100.00 1 100.00 Dumka 0 0.00 0 0.00 0 0.00 Godda 1 100.00 0 0.00 1 100.00 Jamtara 3 75.00 1 25.00 4 100.00 Pakur 0 0.00 0 0.00 0 0.00 Sahibganj 0 0.00 0 0.00 0 0.00 E.Singhbhum 21 100.00 0 0.00 21 100.00 Saraikela 55 100.00 0 0.00 55 100.00 W.Singhbhum 10 100.00 0 0.00 10 100.00 Overall 104 85.95 17 14.05 121 100.00 Location of Tribes Intervention Locations 88 92.63 7 7.37 95 100.00 Control Locations 16 61.54 10 38.46 26 100.00 Tribal Groups Primitive Tribal Groups 3 75.00 1 25.00 4 100.00 Other Tribal Groups 101 86.32 16 13.68 117 100.00
Chart 113 : Impact of Assistance Received from Extension Services
Enhanced Production
(86%)
No Impact Due to Poor
Rainfall (14%)
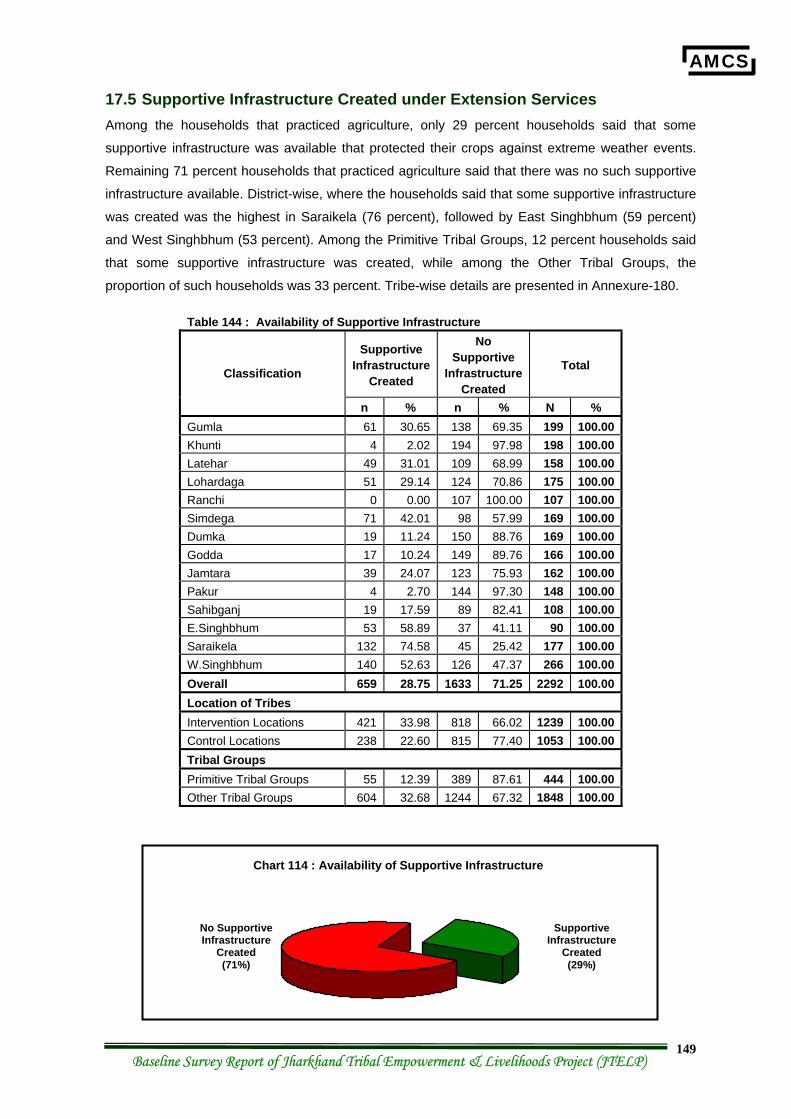
AMCS
Baseline Survey Report of Jharkhand Tribal Empowerment & Livelihoods Project (JTELP) 149
17.5 Supportive Infrastructure Created under Extension Services Among the households that practiced agriculture, only 29 percent households said that some
supportive infrastructure was available that protected their crops against extreme weather events.
Remaining 71 percent households that practiced agriculture said that there was no such supportive
infrastructure available. District-wise, where the households said that some supportive infrastructure
was created was the highest in Saraikela (76 percent), followed by East Singhbhum (59 percent)
and West Singhbhum (53 percent). Among the Primitive Tribal Groups, 12 percent households said
that some supportive infrastructure was created, while among the Other Tribal Groups, the
proportion of such households was 33 percent. Tribe-wise details are presented in Annexure-180.
Table 144 : Availability of Supportive Infrastructure
Supportive Infrastructure
Created
No Supportive
Infrastructure Created
Total Classification
n % n % N % Gumla 61 30.65 138 69.35 199 100.00 Khunti 4 2.02 194 97.98 198 100.00 Latehar 49 31.01 109 68.99 158 100.00 Lohardaga 51 29.14 124 70.86 175 100.00 Ranchi 0 0.00 107 100.00 107 100.00 Simdega 71 42.01 98 57.99 169 100.00 Dumka 19 11.24 150 88.76 169 100.00 Godda 17 10.24 149 89.76 166 100.00 Jamtara 39 24.07 123 75.93 162 100.00 Pakur 4 2.70 144 97.30 148 100.00 Sahibganj 19 17.59 89 82.41 108 100.00 E.Singhbhum 53 58.89 37 41.11 90 100.00 Saraikela 132 74.58 45 25.42 177 100.00 W.Singhbhum 140 52.63 126 47.37 266 100.00 Overall 659 28.75 1633 71.25 2292 100.00 Location of Tribes Intervention Locations 421 33.98 818 66.02 1239 100.00 Control Locations 238 22.60 815 77.40 1053 100.00 Tribal Groups Primitive Tribal Groups 55 12.39 389 87.61 444 100.00 Other Tribal Groups 604 32.68 1244 67.32 1848 100.00
Supportive Infrastructure
Created (29%)
Chart 114 : Availability of Supportive Infrastructure
No Supportive Infrastructure
Created (71%)
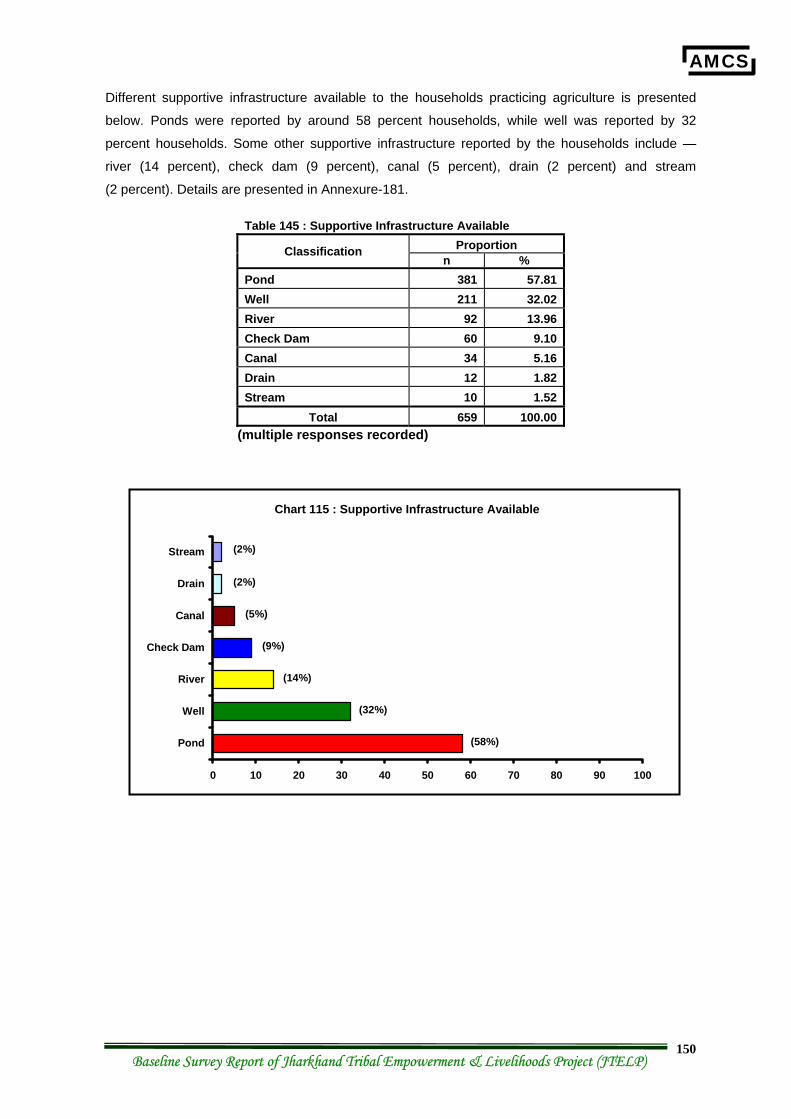
AMCS
Baseline Survey Report of Jharkhand Tribal Empowerment & Livelihoods Project (JTELP) 150
Different supportive infrastructure available to the households practicing agriculture is presented
below. Ponds were reported by around 58 percent households, while well was reported by 32
percent households. Some other supportive infrastructure reported by the households include —
river (14 percent), check dam (9 percent), canal (5 percent), drain (2 percent) and stream
(2 percent). Details are presented in Annexure-181.
Table 145 : Supportive Infrastructure Available Proportion Classification
n % Pond 381 57.81Well 211 32.02River 92 13.96Check Dam 60 9.10Canal 34 5.16Drain 12 1.82Stream 10 1.52
Total 659 100.00(multiple responses recorded)
Chart 115 : Supportive Infrastructure Available
0 10 20 30 40 50 60 70 80 90 100
Pond
Well
River
Check Dam
Canal
Drain
Stream
(58%)
(32%)
(14%)
(9%)
(5%)
(2%)
(2%)
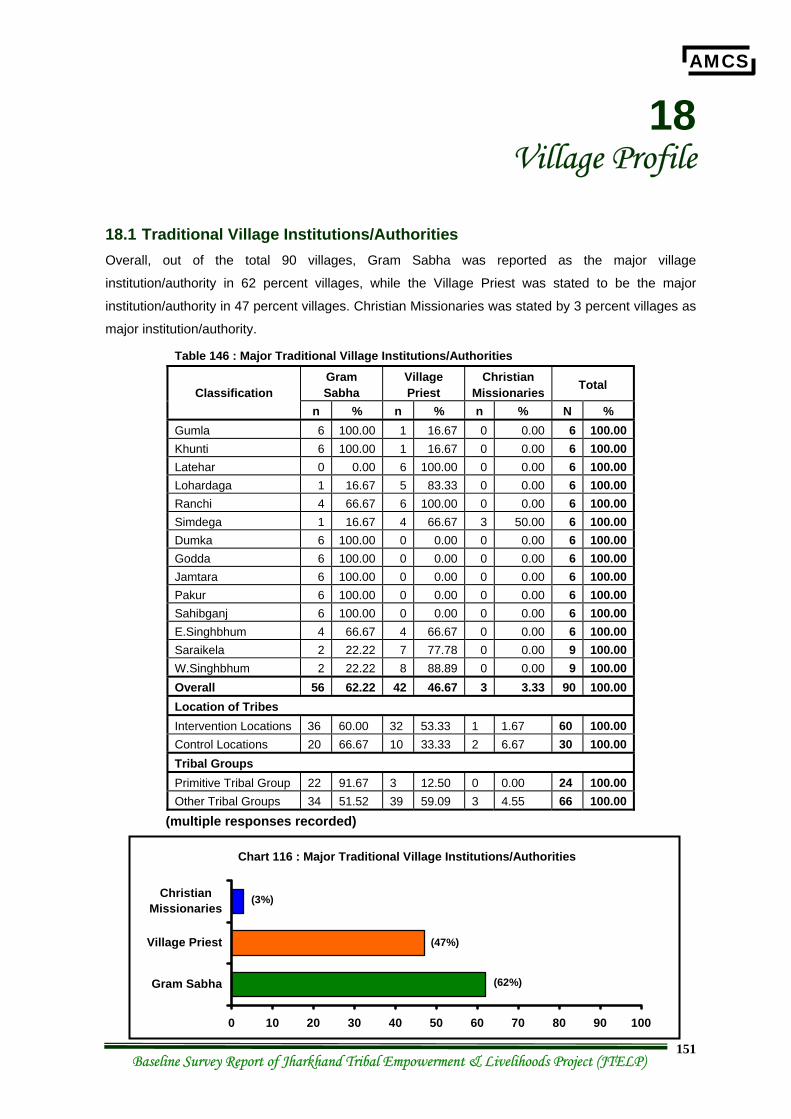
AMCS
Baseline Survey Report of Jharkhand Tribal Empowerment & Livelihoods Project (JTELP) 151
18 Village Profile
18.1 Traditional Village Institutions/Authorities Overall, out of the total 90 villages, Gram Sabha was reported as the major village
institution/authority in 62 percent villages, while the Village Priest was stated to be the major
institution/authority in 47 percent villages. Christian Missionaries was stated by 3 percent villages as
major institution/authority.
Table 146 : Major Traditional Village Institutions/Authorities
Gram Sabha
Village Priest
Christian Missionaries Total Classification
n % n % n % N % Gumla 6 100.00 1 16.67 0 0.00 6 100.00 Khunti 6 100.00 1 16.67 0 0.00 6 100.00 Latehar 0 0.00 6 100.00 0 0.00 6 100.00 Lohardaga 1 16.67 5 83.33 0 0.00 6 100.00 Ranchi 4 66.67 6 100.00 0 0.00 6 100.00 Simdega 1 16.67 4 66.67 3 50.00 6 100.00 Dumka 6 100.00 0 0.00 0 0.00 6 100.00 Godda 6 100.00 0 0.00 0 0.00 6 100.00 Jamtara 6 100.00 0 0.00 0 0.00 6 100.00 Pakur 6 100.00 0 0.00 0 0.00 6 100.00 Sahibganj 6 100.00 0 0.00 0 0.00 6 100.00 E.Singhbhum 4 66.67 4 66.67 0 0.00 6 100.00 Saraikela 2 22.22 7 77.78 0 0.00 9 100.00 W.Singhbhum 2 22.22 8 88.89 0 0.00 9 100.00 Overall 56 62.22 42 46.67 3 3.33 90 100.00 Location of Tribes Intervention Locations 36 60.00 32 53.33 1 1.67 60 100.00 Control Locations 20 66.67 10 33.33 2 6.67 30 100.00 Tribal Groups Primitive Tribal Group 22 91.67 3 12.50 0 0.00 24 100.00 Other Tribal Groups 34 51.52 39 59.09 3 4.55 66 100.00
(multiple responses recorded)
Chart 116 : Major Traditional Village Institutions/Authorities
0 10 20 30 40 50 60 70 80 90 100
Gram Sabha
Village Priest
ChristianMissionaries
(62%)
(47%)
(3%)
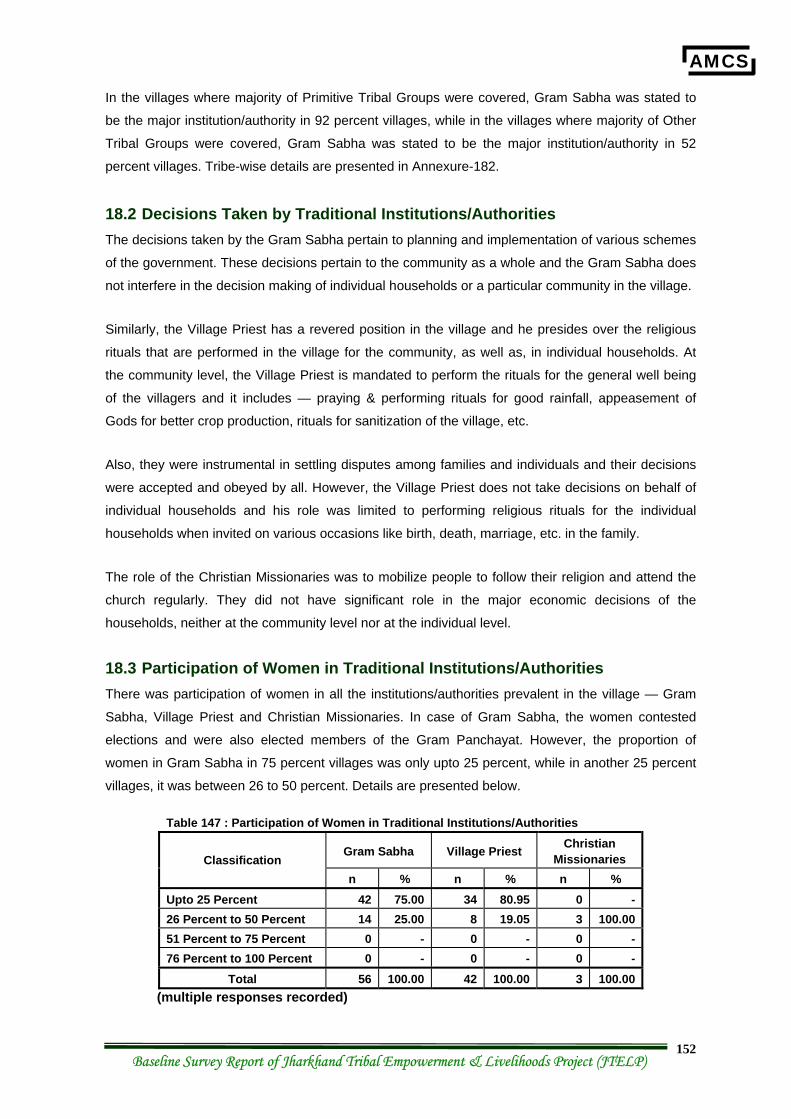
AMCS
Baseline Survey Report of Jharkhand Tribal Empowerment & Livelihoods Project (JTELP) 152
In the villages where majority of Primitive Tribal Groups were covered, Gram Sabha was stated to
be the major institution/authority in 92 percent villages, while in the villages where majority of Other
Tribal Groups were covered, Gram Sabha was stated to be the major institution/authority in 52
percent villages. Tribe-wise details are presented in Annexure-182.
18.2 Decisions Taken by Traditional Institutions/Authorities The decisions taken by the Gram Sabha pertain to planning and implementation of various schemes
of the government. These decisions pertain to the community as a whole and the Gram Sabha does
not interfere in the decision making of individual households or a particular community in the village.
Similarly, the Village Priest has a revered position in the village and he presides over the religious
rituals that are performed in the village for the community, as well as, in individual households. At
the community level, the Village Priest is mandated to perform the rituals for the general well being
of the villagers and it includes — praying & performing rituals for good rainfall, appeasement of
Gods for better crop production, rituals for sanitization of the village, etc.
Also, they were instrumental in settling disputes among families and individuals and their decisions
were accepted and obeyed by all. However, the Village Priest does not take decisions on behalf of
individual households and his role was limited to performing religious rituals for the individual
households when invited on various occasions like birth, death, marriage, etc. in the family.
The role of the Christian Missionaries was to mobilize people to follow their religion and attend the
church regularly. They did not have significant role in the major economic decisions of the
households, neither at the community level nor at the individual level.
18.3 Participation of Women in Traditional Institutions/Authorities There was participation of women in all the institutions/authorities prevalent in the village — Gram
Sabha, Village Priest and Christian Missionaries. In case of Gram Sabha, the women contested
elections and were also elected members of the Gram Panchayat. However, the proportion of
women in Gram Sabha in 75 percent villages was only upto 25 percent, while in another 25 percent
villages, it was between 26 to 50 percent. Details are presented below.
Table 147 : Participation of Women in Traditional Institutions/Authorities
Gram Sabha Village Priest Christian Missionaries Classification
n % n % n % Upto 25 Percent 42 75.00 34 80.95 0 - 26 Percent to 50 Percent 14 25.00 8 19.05 3 100.00 51 Percent to 75 Percent 0 - 0 - 0 - 76 Percent to 100 Percent 0 - 0 - 0 -
Total 56 100.00 42 100.00 3 100.00 (multiple responses recorded)
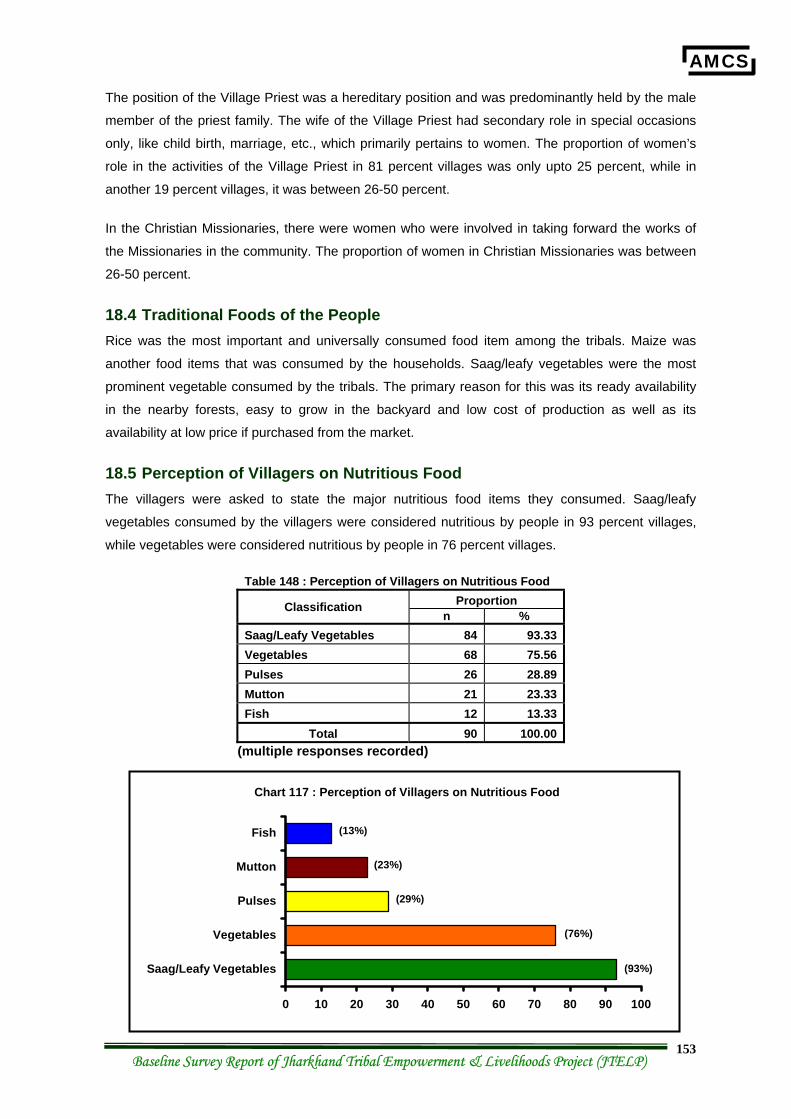
AMCS
Baseline Survey Report of Jharkhand Tribal Empowerment & Livelihoods Project (JTELP) 153
The position of the Village Priest was a hereditary position and was predominantly held by the male
member of the priest family. The wife of the Village Priest had secondary role in special occasions
only, like child birth, marriage, etc., which primarily pertains to women. The proportion of women’s
role in the activities of the Village Priest in 81 percent villages was only upto 25 percent, while in
another 19 percent villages, it was between 26-50 percent.
In the Christian Missionaries, there were women who were involved in taking forward the works of
the Missionaries in the community. The proportion of women in Christian Missionaries was between
26-50 percent.
18.4 Traditional Foods of the People Rice was the most important and universally consumed food item among the tribals. Maize was
another food items that was consumed by the households. Saag/leafy vegetables were the most
prominent vegetable consumed by the tribals. The primary reason for this was its ready availability
in the nearby forests, easy to grow in the backyard and low cost of production as well as its
availability at low price if purchased from the market.
18.5 Perception of Villagers on Nutritious Food The villagers were asked to state the major nutritious food items they consumed. Saag/leafy
vegetables consumed by the villagers were considered nutritious by people in 93 percent villages,
while vegetables were considered nutritious by people in 76 percent villages.
Table 148 : Perception of Villagers on Nutritious Food Proportion Classification
n % Saag/Leafy Vegetables 84 93.33Vegetables 68 75.56Pulses 26 28.89Mutton 21 23.33Fish 12 13.33
Total 90 100.00(multiple responses recorded)
Chart 117 : Perception of Villagers on Nutritious Food
0 10 20 30 40 50 60 70 80 90 100
Saag/Leafy Vegetables
Vegetables
Pulses
Mutton
Fish
(93%)
(76%)
(29%)
(23%)
(13%)
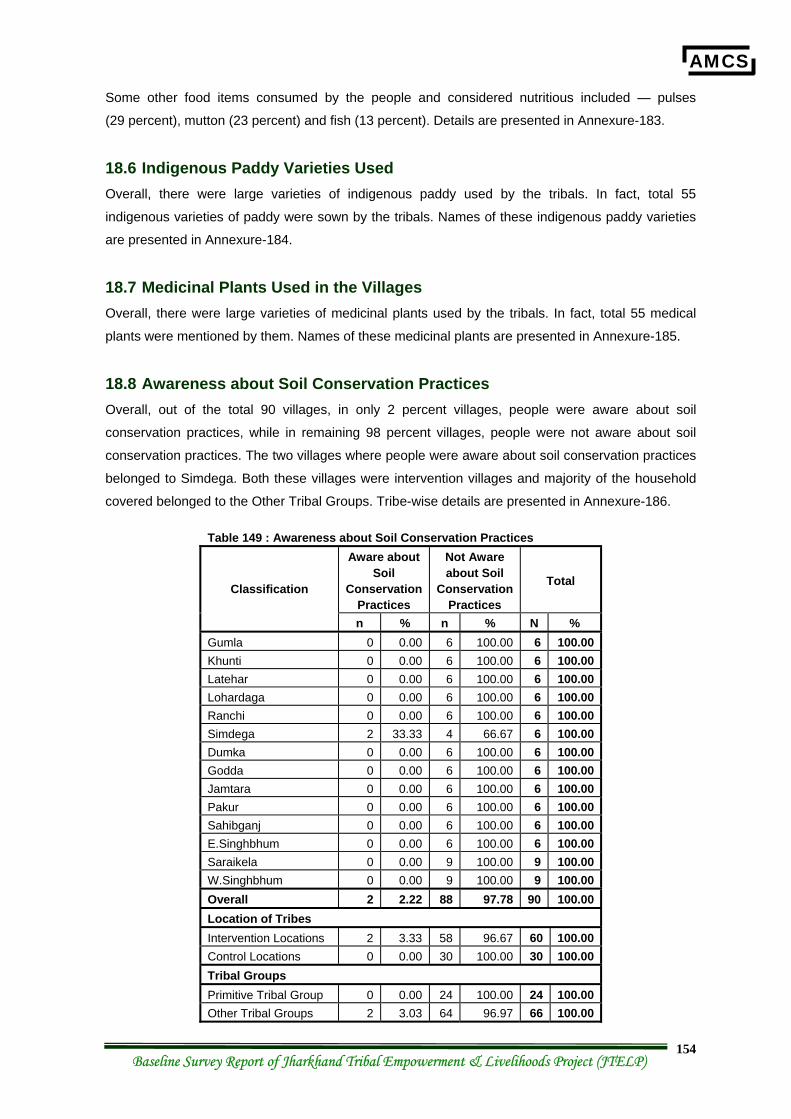
AMCS
Baseline Survey Report of Jharkhand Tribal Empowerment & Livelihoods Project (JTELP) 154
Some other food items consumed by the people and considered nutritious included — pulses
(29 percent), mutton (23 percent) and fish (13 percent). Details are presented in Annexure-183.
18.6 Indigenous Paddy Varieties Used Overall, there were large varieties of indigenous paddy used by the tribals. In fact, total 55
indigenous varieties of paddy were sown by the tribals. Names of these indigenous paddy varieties
are presented in Annexure-184.
18.7 Medicinal Plants Used in the Villages Overall, there were large varieties of medicinal plants used by the tribals. In fact, total 55 medical
plants were mentioned by them. Names of these medicinal plants are presented in Annexure-185.
18.8 Awareness about Soil Conservation Practices Overall, out of the total 90 villages, in only 2 percent villages, people were aware about soil
conservation practices, while in remaining 98 percent villages, people were not aware about soil
conservation practices. The two villages where people were aware about soil conservation practices
belonged to Simdega. Both these villages were intervention villages and majority of the household
covered belonged to the Other Tribal Groups. Tribe-wise details are presented in Annexure-186.
Table 149 : Awareness about Soil Conservation Practices Aware about
Soil Conservation
Practices
Not Aware about Soil
Conservation Practices
Total Classification
n % n % N % Gumla 0 0.00 6 100.00 6 100.00 Khunti 0 0.00 6 100.00 6 100.00 Latehar 0 0.00 6 100.00 6 100.00 Lohardaga 0 0.00 6 100.00 6 100.00 Ranchi 0 0.00 6 100.00 6 100.00 Simdega 2 33.33 4 66.67 6 100.00 Dumka 0 0.00 6 100.00 6 100.00 Godda 0 0.00 6 100.00 6 100.00 Jamtara 0 0.00 6 100.00 6 100.00 Pakur 0 0.00 6 100.00 6 100.00 Sahibganj 0 0.00 6 100.00 6 100.00 E.Singhbhum 0 0.00 6 100.00 6 100.00 Saraikela 0 0.00 9 100.00 9 100.00 W.Singhbhum 0 0.00 9 100.00 9 100.00 Overall 2 2.22 88 97.78 90 100.00 Location of Tribes Intervention Locations 2 3.33 58 96.67 60 100.00 Control Locations 0 0.00 30 100.00 30 100.00 Tribal Groups Primitive Tribal Group 0 0.00 24 100.00 24 100.00 Other Tribal Groups 2 3.03 64 96.97 66 100.00
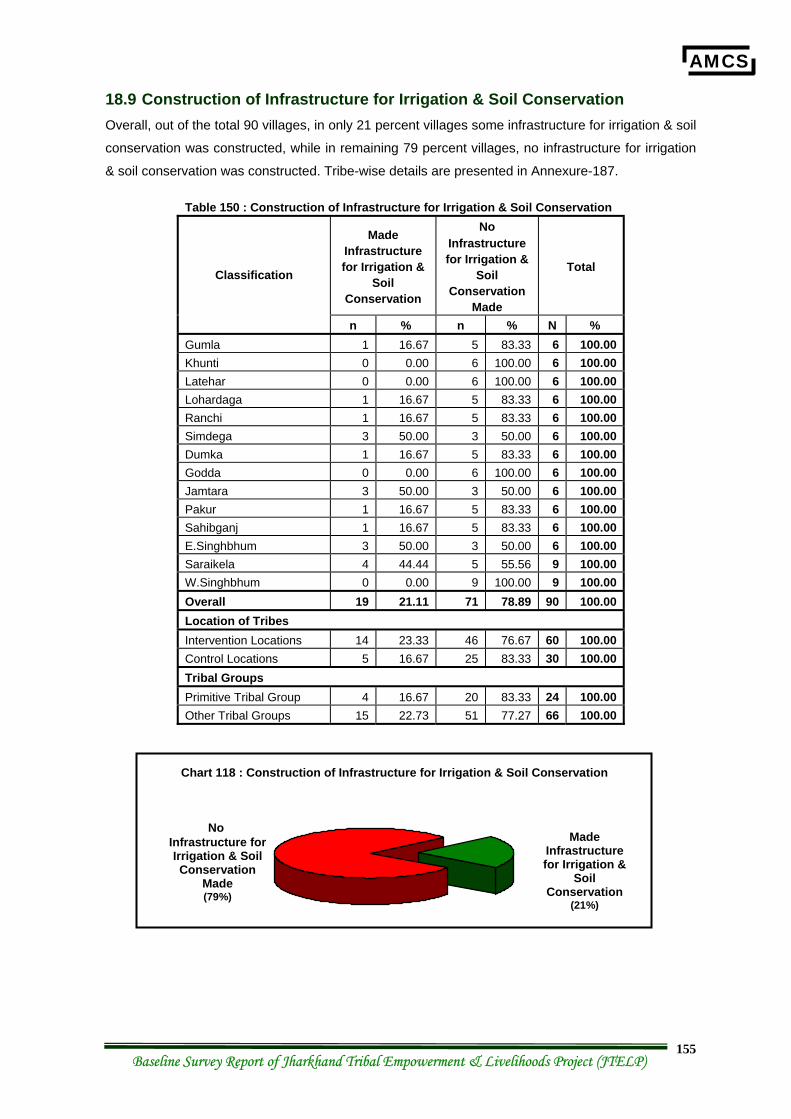
AMCS
Baseline Survey Report of Jharkhand Tribal Empowerment & Livelihoods Project (JTELP) 155
18.9 Construction of Infrastructure for Irrigation & Soil Conservation Overall, out of the total 90 villages, in only 21 percent villages some infrastructure for irrigation & soil
conservation was constructed, while in remaining 79 percent villages, no infrastructure for irrigation
& soil conservation was constructed. Tribe-wise details are presented in Annexure-187.
Table 150 : Construction of Infrastructure for Irrigation & Soil Conservation
Made Infrastructure for Irrigation &
Soil Conservation
No Infrastructure for Irrigation &
Soil Conservation
Made
Total Classification
n % n % N % Gumla 1 16.67 5 83.33 6 100.00 Khunti 0 0.00 6 100.00 6 100.00 Latehar 0 0.00 6 100.00 6 100.00 Lohardaga 1 16.67 5 83.33 6 100.00 Ranchi 1 16.67 5 83.33 6 100.00 Simdega 3 50.00 3 50.00 6 100.00 Dumka 1 16.67 5 83.33 6 100.00 Godda 0 0.00 6 100.00 6 100.00 Jamtara 3 50.00 3 50.00 6 100.00 Pakur 1 16.67 5 83.33 6 100.00 Sahibganj 1 16.67 5 83.33 6 100.00 E.Singhbhum 3 50.00 3 50.00 6 100.00 Saraikela 4 44.44 5 55.56 9 100.00 W.Singhbhum 0 0.00 9 100.00 9 100.00 Overall 19 21.11 71 78.89 90 100.00 Location of Tribes Intervention Locations 14 23.33 46 76.67 60 100.00 Control Locations 5 16.67 25 83.33 30 100.00 Tribal Groups Primitive Tribal Group 4 16.67 20 83.33 24 100.00 Other Tribal Groups 15 22.73 51 77.27 66 100.00
Made Infrastructure for Irrigation &
Soil Conservation
(21%)
Chart 118 : Construction of Infrastructure for Irrigation & Soil Conservation
No Infrastructure for Irrigation & Soil Conservation
Made (79%)
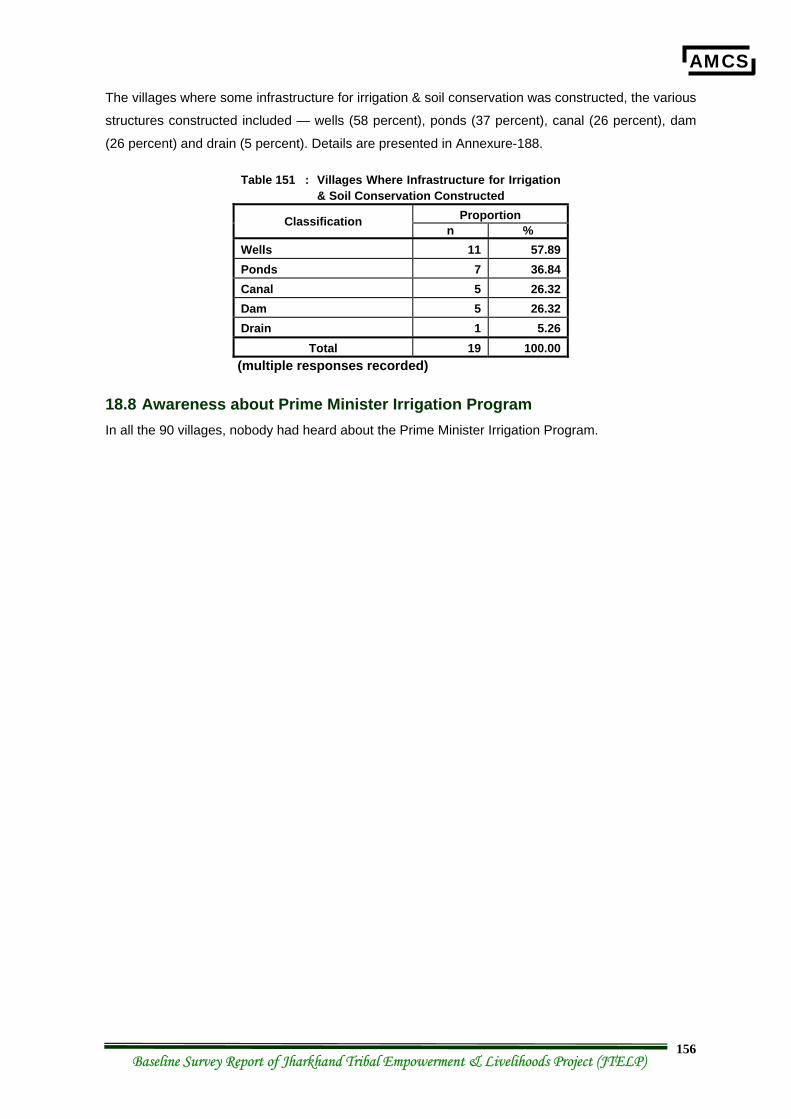
AMCS
Baseline Survey Report of Jharkhand Tribal Empowerment & Livelihoods Project (JTELP) 156
The villages where some infrastructure for irrigation & soil conservation was constructed, the various
structures constructed included — wells (58 percent), ponds (37 percent), canal (26 percent), dam
(26 percent) and drain (5 percent). Details are presented in Annexure-188.
Table 151 : Villages Where Infrastructure for Irrigation & Soil Conservation Constructed
Proportion Classification n %
Wells 11 57.89 Ponds 7 36.84 Canal 5 26.32 Dam 5 26.32 Drain 1 5.26
Total 19 100.00 (multiple responses recorded)
18.8 Awareness about Prime Minister Irrigation Program In all the 90 villages, nobody had heard about the Prime Minister Irrigation Program.