Embed Size (px)
Citation preview
Wrocław, Poland, 2014
1
DESIGN RESISTANCE OF CONCRETE STRUCTURES BY NUMERICAL SIMULATION
Cervenka, V., Cervenka, J., Pukl, R. Cervenka Consulting, s.r.o., Prague, Czech Republic, [email protected]
Summary
Numerical simulation is an alternative method for assessment of design resistance of concrete and reinforced concrete structures. It requires a global approach for the design condition. Several safety formats are proposed in Model Code 2010 for the verification of safety of resistance calculated by non-linear analysis. The paper describes the experience of the authors obtained in recent years in various projects involving the application of nonlinear finite element analysis in a wide range of concrete structures.
Keywords: nonlinear analysis, global safety formats, Model Code 2010, reinforced concrete design
1. INTRODUCTION
Non-linear analysis is used by engineers for design of new and assessment of existing structures. Until recently they were facing difficulties, how to introduce their results into a suitable engineering safety concept. Non-linear analysis can be regarded as a virtual testing, where a section-oriented local safety verification is not relevant and a global safety format should be applied. The authors have been involved in several research projects dealing with this topic and published a comparison of global safety formats in [6]. This investigation included some typical concrete structures with failure modes due to bending and combined shear-bending and compression. Both ductile and brittle failure modes were addressed in this investigation. It confirmed that simplified global safety formats can be used in practise for design and structural verification. This development is supported by the new fib Model Code 2010 where rational safety assessment approach is presented, which reflects new developments in safety formats based on probabilistic methods. In Chapter 4 on Principles of structural design the probabilistic safety format is introduced as a general and rational basis of safety evaluation. In addition to the partial factor format (which remains as the main safety format for most practical cases) a global resistance format is recommended for nonlinear analysis. In Section 7.11 Verification assisted by numerical simulations a guide for application of nonlinear analysis for resistance assessment is offered. The paper briefly summarizes the background of these innovative approaches. The case studies presented in [6] are extended by two new examples involving fibre reinforced concrete structural elements.
In the second part of this paper, several examples from practice are presented, where the global resistance format is used for design or assessment of real engineering structures.
Wrocław, Poland, 2014
2
2. GLOBAL SAFETY FORMATS
2.1 Full probabilistic analysis
The full probabilistic approach represents the most accurate method for the safety assessment of structures. The accuracy of this approach is much higher if a non-linear structural analysis is used as a limit state function. The numerical simulation resembles a real testing of structures by considering a representative group of samples, which can be statistically analyzed for the assessment of safety. The detail description of the probabilistic analysis is presented for instance in Bergmeister et al [1].
The same approach is used in this work. The probabilistic analysis is made with the help of software SARA, which integrates program tools ATENA and FREET [6]. The variability of basic properties is described by probability distribution functions and its parameters (mean, standard deviation, etc.). The full probabilistic analysis of the resistance is performed by a numerical method such as Latin hypercube sampling method. Resulting array of resistance values is approximated by a distribution function of global resistance, and describes the random properties of the resistance. Finally, for a required reliability index , or probability of failure Pf, a value of the design resistance Rd shall be calculated..
2.2 ECOV method – estimate of coefficient of variation
ECOV method proposed by Cervenka [5] is based on the idea, that the random distribution of
resistance due to material, which is described by the coefficient of variation mV can be estimated
from mean mR and characteristic values kR of resistance. The underlying assumption is that
random distribution of resistance is according to the lognormal distribution, which is typical for the
structural resistance. Considering these assumptions the coefficient of variation mV can be
expressed as:
1ln
1.65m
mk
RV
R
(1)
Then the global safety factor R of resistance can be calculated as:
2 2exp( ),R R R R m RdV V V V
(2)
where R is the sensitivity factor for resistance (as defined by FORM) and is the reliability
index. RdV is the model uncertainty. The above procedure enables to estimate the safety of
resistance in a rational way, based on the principles of reliability accepted by the codes. Appropriate code provisions can be used to identify these parameters For instance in the case of
Eurocode EN 1990, typical values are 3.8 (50 years) and 0.8R , which corresponds
to the failure probability Pf =0.001. The global resistance factor is then:
exp(3.04 )R RV
(3)
Wrocław, Poland, 2014
3
and the design resistance is calculated as:
/d m RR R
(4)
The main task in this method, is the determination of the mean and characteristic values of
resistance ,m kR R . They can be calculated by two separate nonlinear analyses using mean and
characteristic values of the input material parameters, respectively.
The method is very general and reliability index and distribution type can be
changed if required. It can capture different types of failure and the sensitivity to a random variation of the material parameters is automatically included.
2.3 Method based on EN1992-2
Eurocode for bridges introduced a concept for global safety verification based on nonlinear analysis. In this approach, the design resistance is calculated from
( , ...) /d ym cm RR R f f
(5)
Where ,ym cmf f are mean values of material parameters of steel reinforcement and
concrete, 1.1ym ykf f and 0.843cm ckf f . The concrete mean value is reduced to
account for the higher variability of concrete property. This method is described in more details in
Bertagnoli et al. (2004). The global factor of resistance is then 1, 27R . The evaluation of the
resistance function is done by a single nonlinear analysis assuming the material parameters according to the above rules. However, in this method a unique relation of safety factor to a resistance variability is not captured.
2.4 Partial safety factors (PSF)
This approach is the natural extension of the standard partial safety factor method, which is used in the most design codes. In this method, the design condition is formulated as
d dE R (6)
The design action ( , , , ,..)d G Q PE E F is a function of the representative load F, which
is multiplied by the partial safety factors , , ,..G Q P for permanent loads, live loads, pre-
stressing, etc. The resistance ( )d dR R f is calculated by a nonlinear analysis using design
values of the material parameters /d k Mf f , where kf are characteristic values and M
partial safety factors of materials.
The verification of safety by condition (6) in the standard design practice is applied to cross sections and actions that are obtained by a linear analysis. It is well known that this concept is not consistent, since different methods are used for the calculation of actions (linear analysis) on one side, and for the resistance of cross sections (nonlinear) on the other. Furthermore, only local safety check is exercised and a global safety assessment is not performed, and is unknown.
Wrocław, Poland, 2014
4
The action dE in condition (6) is considered on the global level (for example live load
intensity) and the resistance dR is an ultimate load intensity obtained by a nonlinear analysis, in
which design values of material parameters df are used.
3. NON-LINEAR ANALYSIS
The presented examples are analysed with program ATENA [7] for non-linear analysis of concrete structures. ATENA is capable of a realistic simulation of concrete behaviour in the entire loading range with ductile as well as brittle failure modes as shown for instance in [4]. It is based on the finite element method and non-linear material models for concrete, reinforcement and their interaction. The tensile behaviour of concrete is described by smeared cracks, crack band and fracture energy and the compressive behaviour of concrete by a plasticity model with hardening and softening. The constitutive model is described in detail by Cervenka, Pappanikolaou [3]. In the presented examples the reinforcement is modelled by truss elements embedded in two- or three-dimensional isoparametric concrete elements. Nonlinear solution is performed incrementally with equilibrium iterations in each load step.
4. VALIDATION CASE STUDY
The validity of the presented safety formats was investigated on a wide range of structures including laboratory test, in situ test of real structures, and practical design cases. The details of this study can be found in Cervenka V. [5], [6], where the calculated examples are described in more detail. The summary of results is shown in Tab. 1. This table shows the resistance for the four presented methods and 8 examples are listed and compared. To simplify the comparison the results are normalized with respect to the resistance obtained by the PSF method. It should be noted that the study does not reflect the model uncertainty in a consistent way. The methods PSF and EN1992-2 include a model uncertainty, while in the ECOV and full probabilistic analysis no
model uncertainty was considered, i.e. 0RdV . By comparison of the results an evaluation of
the model uncertainty can be made in directly. This can explain the average results of ECOV method being slightly higher than the other two methods.
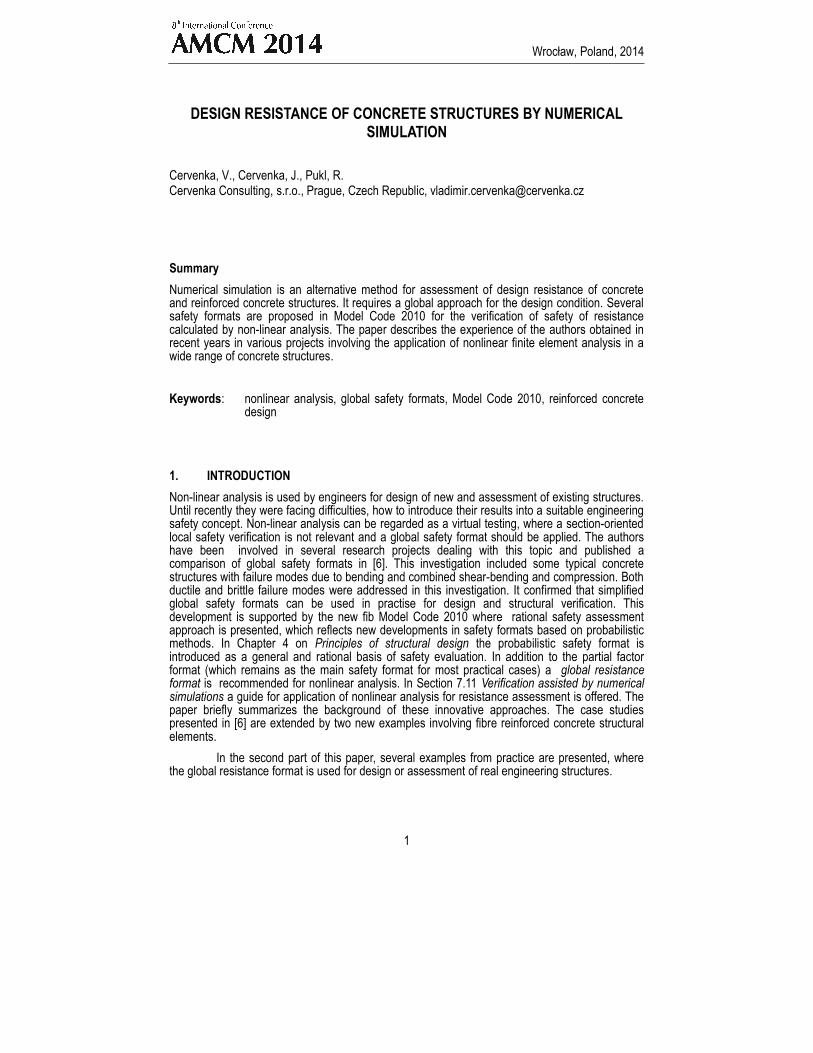
The examples 7 and 8 are new problems that have not been published before. The example 7 is a four point bending beam (see Fig. 1) made of concrete C55/67 with fibres of length 60 mm and diameter 0.8 mm in amount of 40 kg/m3. The mean material parameters were first calibrated by a probabilistic inverse analysis (Pukl, Sajdlova, [12]) and then the global safety formats described above were used to calculated the corresponding design resistances.
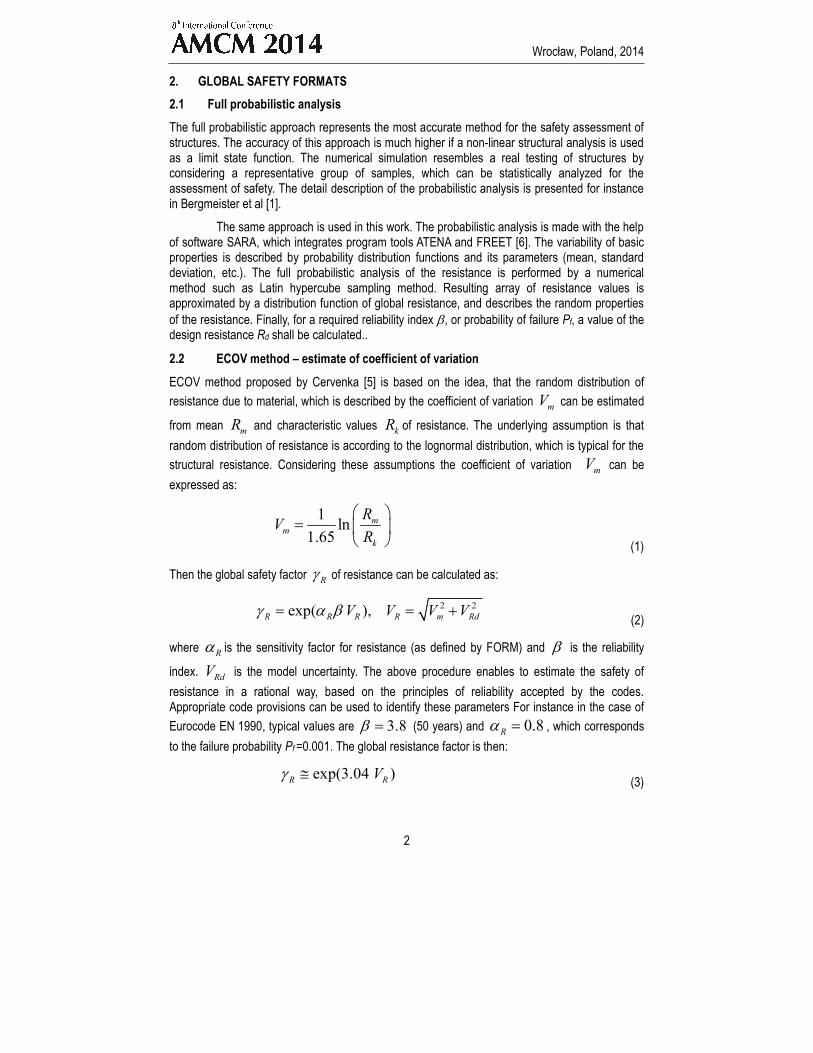
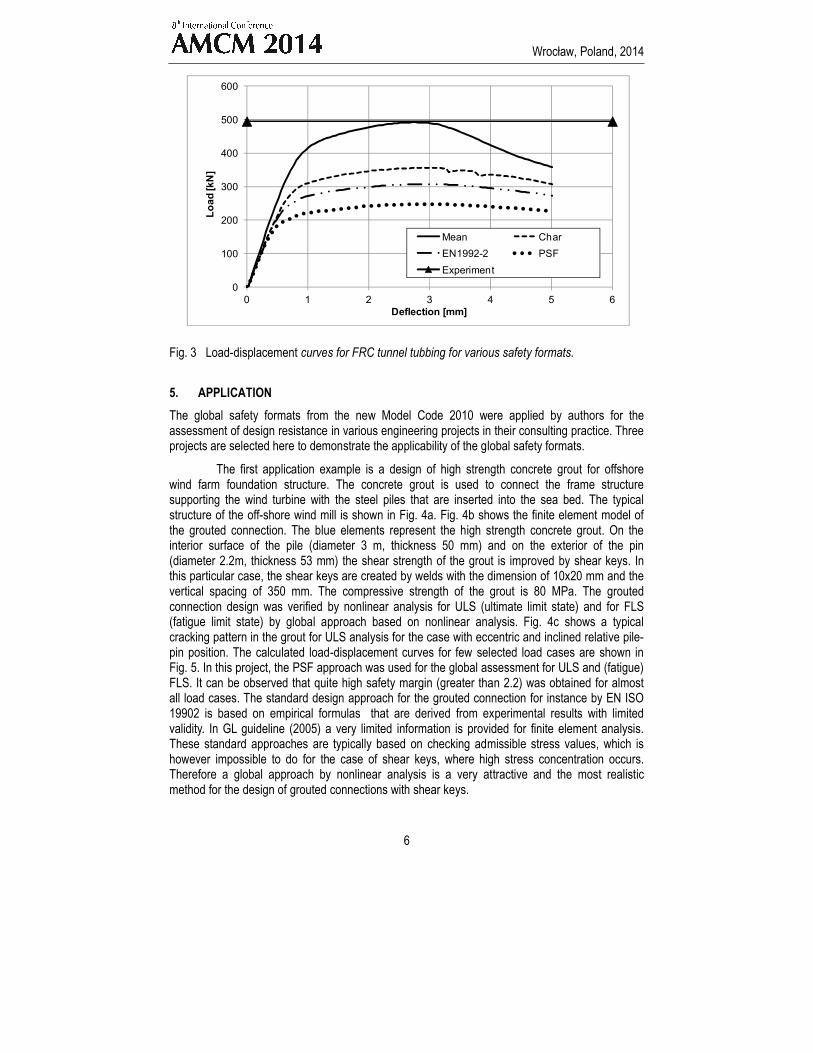
The example 8 represents a tunnel lining segment (see Fig. 2a) installed by TBM (tunnel boring machine) during tunnel excavation. Full size laboratory tests of both RC and SFRC segments have been performed (Pukl et al.[11]) in the Klokner Institute of CTU in order to check their resistance under various loading conditions. This experimental and analytical program was part of a real engineering project in Prague, Czech Republic (Stehlik, Cyron [13]). The used numerical model was first validated by experimental data for a loading scenario simulating the action of the TBM machine during the installation and assembly of segments (see Fig. 2b,c,d). After that the global safety formats were applied to calculate a design resistance. For example 7 and 8, the full probabilistic analysis is not yet presented since it is part of a still running research project.
Wrocław, Poland, 2014
5
Tab. 1 Case study of safety formats, Rd is normalized with respect to PSF Rd/RdPSF
PSF Probabilistic ECOV EN 1992-2 Example 1 - bending 1.00 0.96 1.00 0.95 Example 2 - deep shear beam 1.00 0.98 1.02 0.98 Example 3 - bridge pier, geom. nonlinear.
1.00 1.02 1.06 0.98
Example 4 - bridge frame 1.00 1.01 0.97 0.93 Example 5 - shear beam w/o ties 1.00 0.97 0.95 0.99 Example 6 - shear beam w. ties 1.00 1.23 1.28 1.01 Example 7 - FRC bending 1.00 --- 1.06 1.00 Example 8 - FRC tubbing 1.00 --- 1.07 0.98 Average 1.00 1.03 1.05 0.98
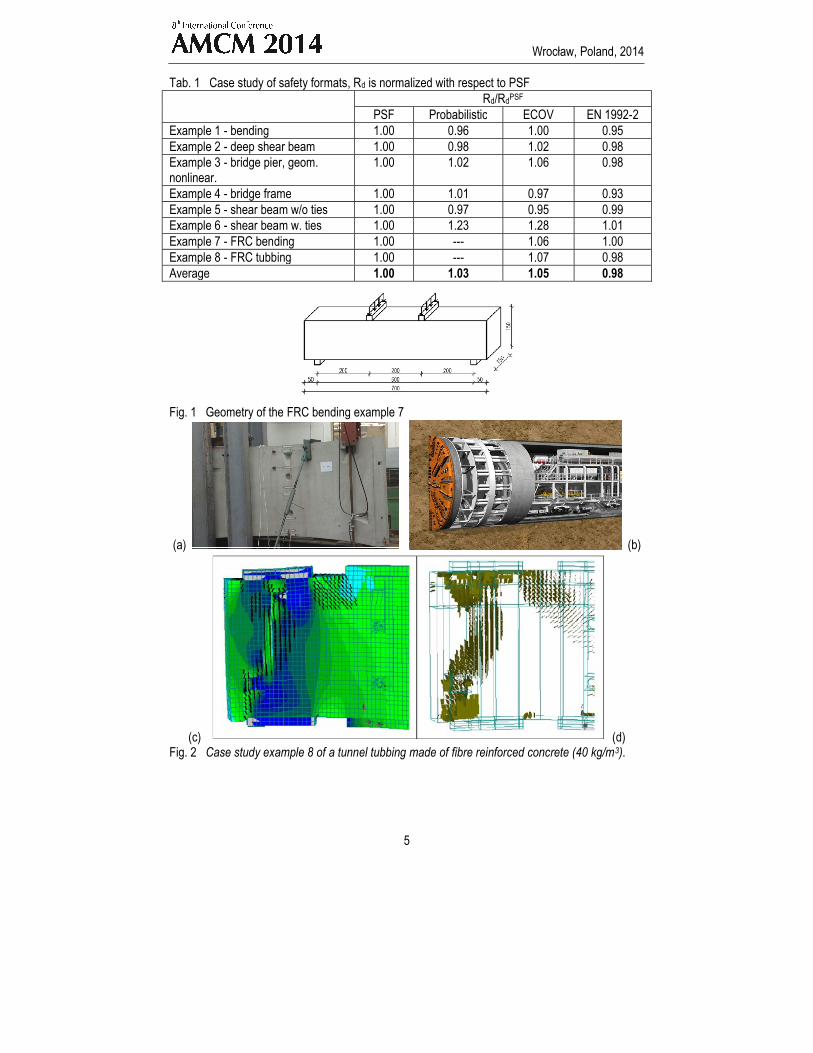
Fig. 1 Geometry of the FRC bending example 7
(a) (b)
(c) (d) Fig. 2 Case study example 8 of a tunnel tubbing made of fibre reinforced concrete (40 kg/m3).
Wrocław, Poland, 2014
6
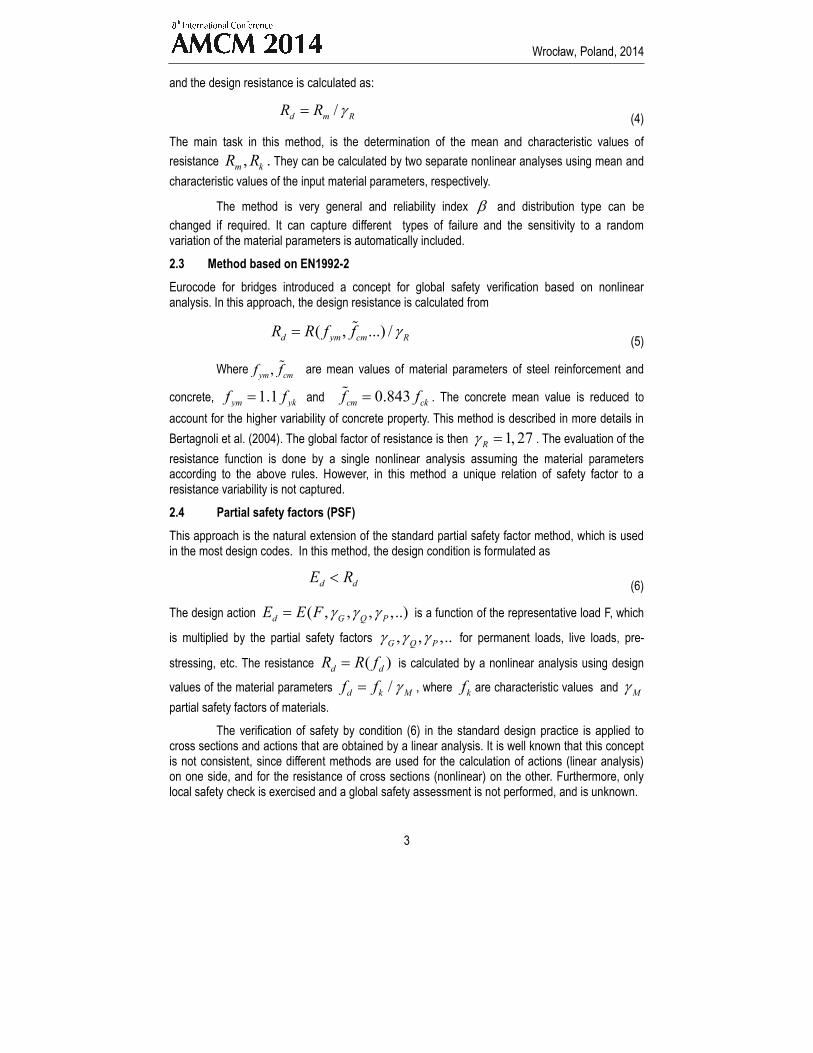
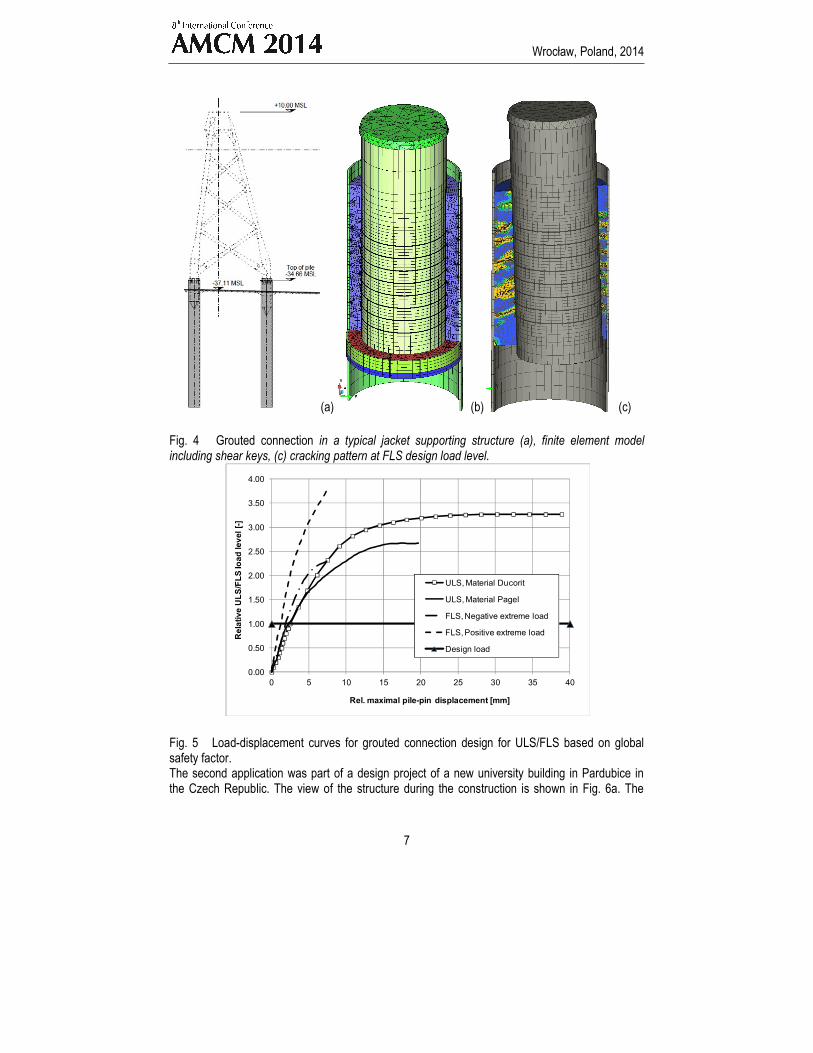
Fig. 3 Load-displacement curves for FRC tunnel tubbing for various safety formats.
5. APPLICATION
The global safety formats from the new Model Code 2010 were applied by authors for the assessment of design resistance in various engineering projects in their consulting practice. Three projects are selected here to demonstrate the applicability of the global safety formats.
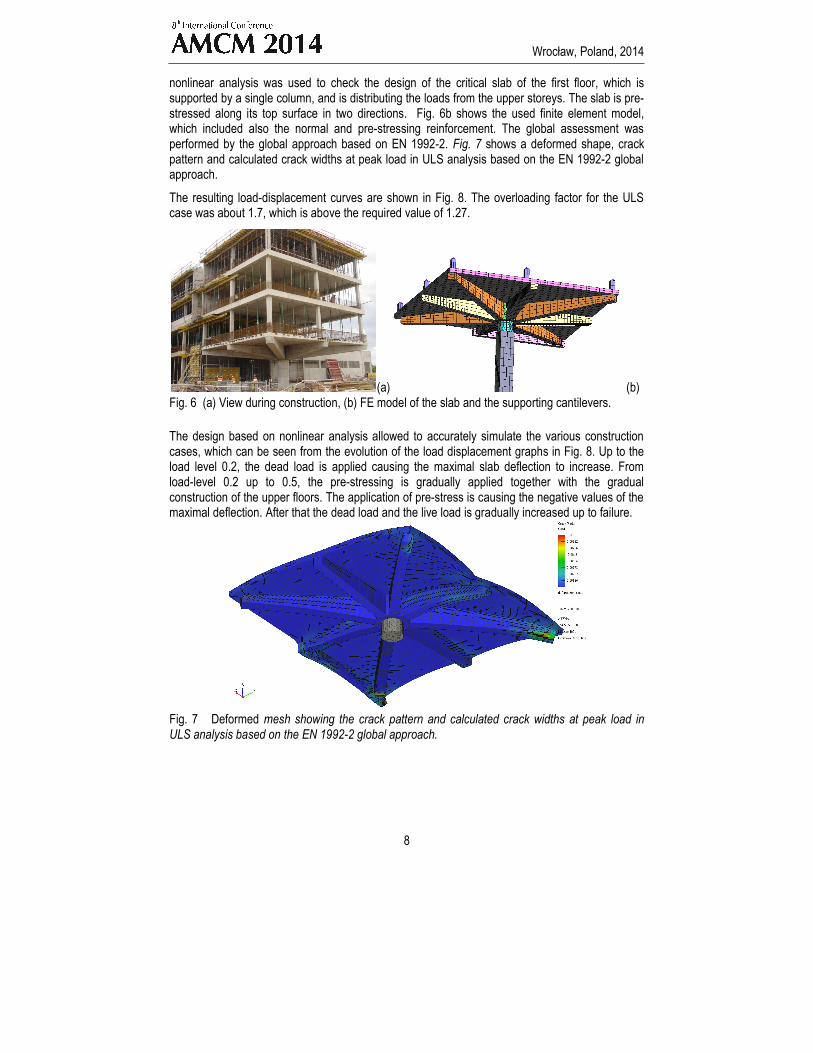
The first application example is a design of high strength concrete grout for offshore wind farm foundation structure. The concrete grout is used to connect the frame structure supporting the wind turbine with the steel piles that are inserted into the sea bed. The typical structure of the off-shore wind mill is shown in Fig. 4a. Fig. 4b shows the finite element model of the grouted connection. The blue elements represent the high strength concrete grout. On the interior surface of the pile (diameter 3 m, thickness 50 mm) and on the exterior of the pin (diameter 2.2m, thickness 53 mm) the shear strength of the grout is improved by shear keys. In this particular case, the shear keys are created by welds with the dimension of 10x20 mm and the vertical spacing of 350 mm. The compressive strength of the grout is 80 MPa. The grouted connection design was verified by nonlinear analysis for ULS (ultimate limit state) and for FLS (fatigue limit state) by global approach based on nonlinear analysis. Fig. 4c shows a typical cracking pattern in the grout for ULS analysis for the case with eccentric and inclined relative pile-pin position. The calculated load-displacement curves for few selected load cases are shown in Fig. 5. In this project, the PSF approach was used for the global assessment for ULS and (fatigue) FLS. It can be observed that quite high safety margin (greater than 2.2) was obtained for almost all load cases. The standard design approach for the grouted connection for instance by EN ISO 19902 is based on empirical formulas that are derived from experimental results with limited validity. In GL guideline (2005) a very limited information is provided for finite element analysis. These standard approaches are typically based on checking admissible stress values, which is however impossible to do for the case of shear keys, where high stress concentration occurs. Therefore a global approach by nonlinear analysis is a very attractive and the most realistic method for the design of grouted connections with shear keys.
0
100
200
300
400
500
600
0 1 2 3 4 5 6
Lo
ad
[kN
]
Deflection [mm]
Mean Char
EN1992-2 PSF
Experiment
Wrocław, Poland, 2014
7
(a) (b) (c) Fig. 4 Grouted connection in a typical jacket supporting structure (a), finite element model including shear keys, (c) cracking pattern at FLS design load level.
Fig. 5 Load-displacement curves for grouted connection design for ULS/FLS based on global safety factor. The second application was part of a design project of a new university building in Pardubice in the Czech Republic. The view of the structure during the construction is shown in Fig. 6a. The
0.00
0.50
1.00
1.50
2.00
2.50
3.00
3.50
4.00
0 5 10 15 20 25 30 35 40
Rel
ati
ve U
LS
/FL
S lo
ad
lev
el [
-]
Rel. maximal pile-pin displacement [mm]
ULS, Material Ducorit
ULS, Material Pagel
FLS, Negative extreme load
FLS, Positive extreme load
Design load
Wrocław, Poland, 2014
8
nonlinear analysis was used to check the design of the critical slab of the first floor, which is supported by a single column, and is distributing the loads from the upper storeys. The slab is pre-stressed along its top surface in two directions. Fig. 6b shows the used finite element model, which included also the normal and pre-stressing reinforcement. The global assessment was performed by the global approach based on EN 1992-2. Fig. 7 shows a deformed shape, crack pattern and calculated crack widths at peak load in ULS analysis based on the EN 1992-2 global approach.
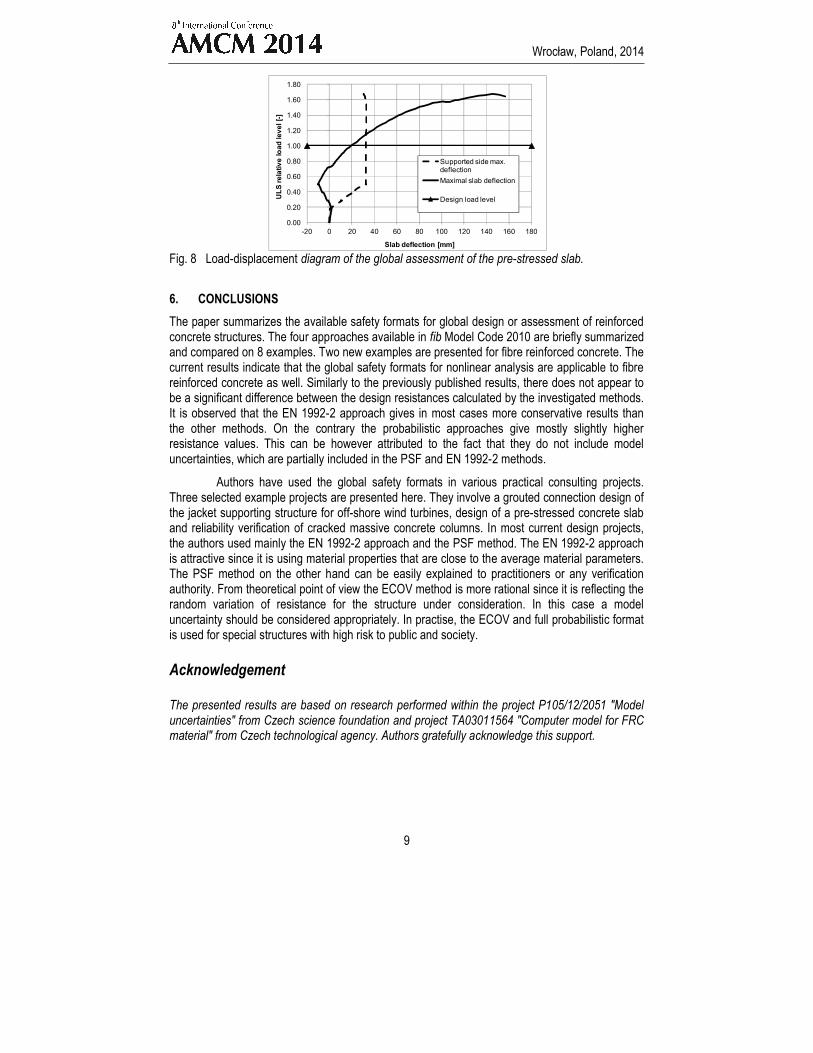
The resulting load-displacement curves are shown in Fig. 8. The overloading factor for the ULS case was about 1.7, which is above the required value of 1.27.
(a) (b) Fig. 6 (a) View during construction, (b) FE model of the slab and the supporting cantilevers. The design based on nonlinear analysis allowed to accurately simulate the various construction cases, which can be seen from the evolution of the load displacement graphs in Fig. 8. Up to the load level 0.2, the dead load is applied causing the maximal slab deflection to increase. From load-level 0.2 up to 0.5, the pre-stressing is gradually applied together with the gradual construction of the upper floors. The application of pre-stress is causing the negative values of the maximal deflection. After that the dead load and the live load is gradually increased up to failure.
Fig. 7 Deformed mesh showing the crack pattern and calculated crack widths at peak load in ULS analysis based on the EN 1992-2 global approach.
Wrocław, Poland, 2014
9
Fig. 8 Load-displacement diagram of the global assessment of the pre-stressed slab.
6. CONCLUSIONS
The paper summarizes the available safety formats for global design or assessment of reinforced concrete structures. The four approaches available in fib Model Code 2010 are briefly summarized and compared on 8 examples. Two new examples are presented for fibre reinforced concrete. The current results indicate that the global safety formats for nonlinear analysis are applicable to fibre reinforced concrete as well. Similarly to the previously published results, there does not appear to be a significant difference between the design resistances calculated by the investigated methods. It is observed that the EN 1992-2 approach gives in most cases more conservative results than the other methods. On the contrary the probabilistic approaches give mostly slightly higher resistance values. This can be however attributed to the fact that they do not include model uncertainties, which are partially included in the PSF and EN 1992-2 methods.
Authors have used the global safety formats in various practical consulting projects. Three selected example projects are presented here. They involve a grouted connection design of the jacket supporting structure for off-shore wind turbines, design of a pre-stressed concrete slab and reliability verification of cracked massive concrete columns. In most current design projects, the authors used mainly the EN 1992-2 approach and the PSF method. The EN 1992-2 approach is attractive since it is using material properties that are close to the average material parameters. The PSF method on the other hand can be easily explained to practitioners or any verification authority. From theoretical point of view the ECOV method is more rational since it is reflecting the random variation of resistance for the structure under consideration. In this case a model uncertainty should be considered appropriately. In practise, the ECOV and full probabilistic format is used for special structures with high risk to public and society. Acknowledgement The presented results are based on research performed within the project P105/12/2051 "Model uncertainties" from Czech science foundation and project TA03011564 "Computer model for FRC material" from Czech technological agency. Authors gratefully acknowledge this support.
0.00
0.20
0.40
0.60
0.80
1.00
1.20
1.40
1.60
1.80
-20 0 20 40 60 80 100 120 140 160 180
UL
S r
ela
tive
load
lev
el [
-]
Slab deflection [mm]
Supported side max. deflection
Maximal slab deflection
Design load level
Wrocław, Poland, 2014
10
REFERENCES
[1] Bergmeister, K., Novák, D., Pukl, R., Červenka, V., (2009), Structural assessment and reliability analysis for existing engineering structures, theoretical background, Structure and Infrastructure Engineering, Vol. 5, Issue 4, August 2009, pp. 267-275.
[2] Bertagnoli, G., Giordano L., Mancini, G., (2004), Safety format for the nonlinear analysis of concrete structures, STUDIES AND RESEARCHES –V.25, Politech. di Milano, Italy.
[3] Cervenka, J., Pappanikolaou, V., (2008), Three dimensional combined fracture-plastic material model for concrete. Int. J. of Plasticity, Vol. 24, 12, ISSN 0749-6419, pp. 2192-2220, doi:10.1016/j.ijplas.2008.01.004.
[4] Cervenka, V., (2000), Simulating a response, Concrete Engineering International, Vol. 4, No. 4, pp. 45-49.
[5] Cervenka, V., (2008), Global Safety Format for Nonlinear Calculation of Reinforced Concrete. Beton- und Stahlbetonbau 103, Special Edition, Ernst&Sohn. pp. 37-42.
[6] Cervenka, V., (2013), Reliability-based non-linear analysis according to fib Model Code 2010, Structural Concrete, Journal of the fib, Vol. 14, March 2013, ISSN 1464-4177, pp. 19-28, DOI: 10.1002/suco.201200022.
[7] Cervenka V, Cervenka J, Jendele L., (2013) ATENA Program Documentation, Part 1 Theory, Prague, Cervenka Consulting, www.cervenka.cz.
[8] GL Guidelene, (2005), Guideline for the Certification of Offshore Wind Turbines, Germanischer Lloyd WindEnergie GmbH, edition 2005
[9] Jendele, L., Smilauer, V., Cervenka, J., (2013), Multiscale Hydro-Thermo-Mechanical Model for Early-Age and Mature Concrete Structures, Advances in Engineering Software, Elsevier, Online June 2013, ttp://dx.doi.org/10.1016/j.advengsoft.2013.05.002.
[10] Hilar, M., Vitek, J., Pukl, R., (2012), Laboratory Testing and Numerical Modelling of SFRC Tunnel, Proc. EETC, Budapest, Hungary, 18. - 21. 09. 2012
[11] Pukl, R., Havlásek, P., Vítek, P., Vítek, J.L., Vokáč, M., Bouška, P., Hilar, M., (2013), Numerical and experimental investigation of structural members made from RC and SFRC, fib Symposium, Tel Aviv 2013, pp. 241-244.
[12] Pukl, R., Sajdlová, T., Lehký, D., Novák, D., (2013), Multi-level optimization of input parameters for modelling of fibre reinforced concrete, fib Symposium, Tel Aviv 2013, pp. 135-138.
[13] Stehlik, E., Cyron D., (2012), Prague Metro’s return to TBMs. Tunnels & Tunnelling International, August 2012.