Embed Size (px)
Citation preview

8/7/2019 AMBUJA FINAL REPORT
http://slidepdf.com/reader/full/ambuja-final-report 1/37
STUDY OF A PROJECT MONITORINGSYSTEM IN AMBUJA REALTY, IN
KOLKATA
S005
ARIJIT DAS
ESHITASADHUKHAN
JHUMJHUM GUHA
RAHUL MITRA
TITHI SAHOO
8/7/2019 AMBUJA FINAL REPORT
http://slidepdf.com/reader/full/ambuja-final-report 2/37
ACKNOWLEDGEMENT
This project study is the outcome of a lot of contribution and motivation of Tapos Roy at IIPM, KOLKATA. We sincerely acknowledge and thank allthose people who are instrumental in supporting, assisting and guiding mein preparing this report.
We are highly thankful to my mentor who has guided me all through mytenure of Project Trimester.
Last but not the least, we are hugely indebted to all, my colleagues, friends,
parent and relatives who have supplemented my study and work with theirpriceless inputs.

8/7/2019 AMBUJA FINAL REPORT
http://slidepdf.com/reader/full/ambuja-final-report 3/37
CERTFICATE OF APPROVAL
The following report titled “Study of a project monitoring system in
Ambuja Realty, in Kolkata” is hereby approved as a certified study in
management carried out and presented in a manner satisfactory to warrant its
acceptance as a prerequisite for the award of MBA for which it has been submitted.
It is understood that by this approval the undersigned do not necessarily endorse
or approve any statement made, opinion expressed or conclusion drawn thereinbut approve the Project Report only for the purpose it is submitted.
Name Signature
Faculty Examiner Tapos Roy ___________________

8/7/2019 AMBUJA FINAL REPORT
http://slidepdf.com/reader/full/ambuja-final-report 4/37
DECLARATION
We are, ARIJIT DAS,ESHITASADHUKHAN, JHUMJHUM GUHA,RAHUL MITRA,TITHI SAHOO, are bonafide students of IIPM KOLKATA, herebydeclare that this Project titled “Study of a project monitoring system inAmbuja Realty, in Kolkata” submitted by me to IIPM KOLKATA is in partialfulfillment of requirements of MBA carried out by me under the guidance of Tapos Roy. The information provided here are true to the best of myknowledge and belief.
Signature
Place: KOLKATA
Date: 24/12/2010

8/7/2019 AMBUJA FINAL REPORT
http://slidepdf.com/reader/full/ambuja-final-report 5/37
CONTENT
SL NO. TOPIC
1PROJECT TITLE
2PROJECT DEFINATION
3ABOUT THE COMPANY
4THEORITICAL ASPECT OF THE PROJECT
5MEASUREMENT OF THE PROBLEM
6 CAUSE OF PROBLEM
7
DATA REQUIRED FOR SOLVE THOSE PROBLEMS
8 USE OF THE MS PROJECT
9 DATA COLLECTION AND INTERPRETATION
10 CONCLUSION
11 BIBLIOGRAPHY

8/7/2019 AMBUJA FINAL REPORT
http://slidepdf.com/reader/full/ambuja-final-report 6/37
PROJECT TITLE
Study of a project monitoring system in Ambuja
Realty, in Kolkata. Of their integrated commercial
building projects with a particular reference to the
planning of Service Functions scheduling, usingMS Project software.

8/7/2019 AMBUJA FINAL REPORT
http://slidepdf.com/reader/full/ambuja-final-report 7/37
PROJECT DEFINATION
Project Planning of Service facilities has both the features of a large
independent project along with the constraint of a dependant activity
function, which carries all the features of planning in an environment
of uncertainty in the areas of integration with the main project.
In a large Project, planning of Civil and Service works are itself
complicated and are largely independent functions within their own
with single commands. They have their own nature of complications of delays and tools for crashing with cost optimization to stick to target
time schedules.
Service functions suffer from an additional inherent contradictions of
keeping close tabs of the other major independent Civil functions to
plan its schedules and to avoid late procurement and/or holding up of
project for late starting of installation and commissioning work .
The above multi-dimensional requirement of the Service Function
planning needs more intense planning and integration system. The
project aims at mapping of the existing system and attempts to suggestimprovements.
OBJECTIVE OF THE PROJECT:
1. To map the existing planning system
2. Suggest improvements
PROCESS APPROACH
To be developed under the guidance of Ambuja Realty management
using MS Project tools and optimisation models.

8/7/2019 AMBUJA FINAL REPORT
http://slidepdf.com/reader/full/ambuja-final-report 8/37
ABOUT THE COMPANY
HISTORY
The Kolkata-based Ambuja Realty ,on of the city’s most well known
&respected group has been an integral part of the business scene for
over a century.
The Company was incorporated in the year 1993 to meet the housing
demand in West Bengal over all levels of the society.
Ambuja Realty is now a joint venture between WBHB and AmbujaHousing and Urban Infrastructure Company Ltd. (Consequent upon
the divestment of GACL's Stake) both enjoying equal equity
participation.
Currently, the Ambuja Realty group is being led by Shri Harshvardha
n Neotia under the guidance of group patriarchs Shri Suresh Neotia
and late Sri Vinod Neotia.
VISION
We believe a strong, stable and secure home is the answer to many
problems we face today. Our dream is to built homes, not just for a selected
few but for everyone. Affordable homes built on strong foundations, to bring
you closer to nature, to happiness and to yourself.
MISSION
To make the difference to the way people live
FOUR VERTICLES
REAL ESTATE
HOSPITALITY
HEALTHCARE
EDUCATION

8/7/2019 AMBUJA FINAL REPORT
http://slidepdf.com/reader/full/ambuja-final-report 9/37
REAL ESTATE
RESIDENTIAL
• Udayan, Kolkata
• Ulhas, Barddhaman
• Urvashi, Durgapur
• Uttorayon, Siliguri(upcoming)
• Upovan, Shantiniketan(upcoming)
• Dream city, Amritsar(upcoming)
RETAIL
• City Centre Salt Lake, Kolkata
• City Centre New Town, Kolkata
• City Centre Siliguri (upcoming)
• City Centre Haldia(upcoming)
• Swabhumi Kolkata
OFFICE SPACE
• Ambuja IT Park I, Kolkata(upcoming)
• Ambuja IT Park II, Kolkata (upcoming)
• Ambuja IT Park Nagpur(upcoming)

8/7/2019 AMBUJA FINAL REPORT
http://slidepdf.com/reader/full/ambuja-final-report 10/37
HOSPITALITY
RESORTS AND HOTELS
• Shyamolima, Raichak, Kolkata
• The Ffort Raichak, kolkata
• Ganga Kutir, Raichak, Kolkata
• Swissotel, City Centre New Town ,Kolkata
• Hotel , City Centre, Siliguri (Upcoming)
FOOD & BEVERAGE
• The Conclave, Kolkata
• Afraa Resturant and lounge ,Kolkata
• Tea Junctions, Kolkata
HEALTH CARE
• Bhagirathi Neotia Women and Child Care Centre, Kolkata
• Upcoming Hospital in Siliguri
• Upcoming hospital in Kolkata
EDUCATION
• Institute of Technology and Marine Engineering, 24 Parganas South,
West Bengal

8/7/2019 AMBUJA FINAL REPORT
http://slidepdf.com/reader/full/ambuja-final-report 11/37
AWARDS AND RECOGNITIONS
The prestigious Times Food Award to Afraa in the Best Mediterranean
restaurant category for its excellent cuisine and amb
Most Admired Shopping Centre at Images Shopping Centre Award (ICSA) for
City Centre Salt Lake 2008 & 2009.
Suresh Kumar Neotia being conferred the Padmabhusan by the Hon'ble
President of India, Smt Pratibha Patil in 2008.

8/7/2019 AMBUJA FINAL REPORT
http://slidepdf.com/reader/full/ambuja-final-report 12/37
THEORITICAL ASPECT OF THE
PROJECT
PROJECT MANAGEMENT TOOLS
PERT
CPM
CPM DEFINITION
The critical path method (CPM) is a mathematically based algorithm for
scheduling a set of project activities. It is an important tool for effective
project management.
CRITICAL PATH
A sequence of activities is called a 'path,' and the longest-path in the
diagram is the critical path. It is 'critical' because all activities on it must be
completed in the designated time, otherwise the whole project will be
delayed. Also called critical path analysis or critical path methodology.
SUB CRITICAL PATH
A project can have several, parallel, near critical paths. An additional
parallel path through the network with the total durations shorter than the
critical path is called a sub-critical or non-critical path.
CPM FEATURES
CPM helps us to identify the critical activities of the project and thereby the
duration of the project. We carry out the forward-pass and the backward-
pass to compute the project duration.
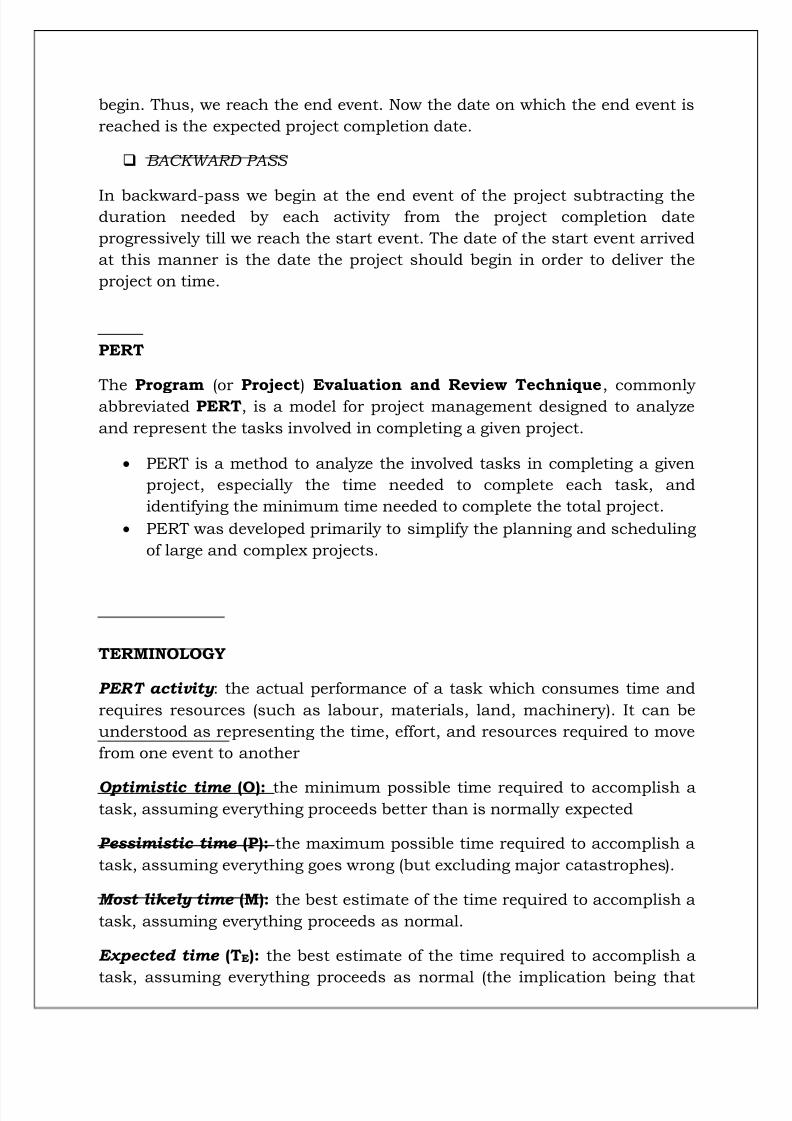
FORWARD PASS
In forward-pass we begin at the start event of the project and add theduration needed by each activity to the date on which the start event would
8/7/2019 AMBUJA FINAL REPORT
http://slidepdf.com/reader/full/ambuja-final-report 13/37

8/7/2019 AMBUJA FINAL REPORT
http://slidepdf.com/reader/full/ambuja-final-report 14/37
the expected time is the average time the task would require if the task were
repeated on a number of occasions over an extended period of time).
ADVANTAGES
PERT chart explicitly defines and makes visible dependencies
PERT facilitates identification of the critical path and makes this
visible
PERT facilitates identification of early start, late start, and slack for
each activity,
PERT provides for potentially reduced project duration due to better
understanding of dependencies leading to improved overlapping of
activities and tasks where feasible.
The large amount of project data can be organized & presented in
diagram for use in decision making.
DISADVANTAGES
There can be potentially hundreds or thousands of activities andindividual dependency relationships
The network charts tend to be large and unwieldy requiring several
pages to print and requiring special size paper
The lack of a timeframe on most PERT/CPM charts makes it harder to
show status although colours can help (e.g., specific colour for
completed nodes)
When the PERT/CPM charts become unwieldy, they are no longerused to manage the project.
DIFFERENCE BETWEEN PERT AND CPM
Both Pert and CPM tools lead to the same end: a critical path and critical
activities with slack time equal to zero.
The differences between these tools come from how they treat the activity
time.

8/7/2019 AMBUJA FINAL REPORT
http://slidepdf.com/reader/full/ambuja-final-report 15/37
PERT treats activity time as a random variable whereas CPM requires
a single deterministic time value for each activity.
Another difference is that PERT focuses exclusively on the time
variable whereas CPM includes the analysis of the Time/Cost Trade-
off.
NODES AND ACTIVITY
In the network diagram shown below, for the problem we considered before,
each node (circle) represents an activity and is labelled with the activity
number and the associated completion time (shown in brackets after the
activity number).
Use of nodes and arrows
Arrow- An arrow leads from tail to head directionally
Indicate ACTIVITY, a time consuming effort that is required to
perform a part of the work.
Node- A node is represented by a circle
Indicate EVENT, a point in time where one or more activities start
and/or finish.
Activity on Node
- A completion of an activity is represented by a node
Activity on Arrow
- An arrow represents a task, while a node is the completion of a task
- Arrows represent order of events

8/7/2019 AMBUJA FINAL REPORT
http://slidepdf.com/reader/full/ambuja-final-report 16/37
PERT
CPM
In constructing the network we draw a node for each activity

8/7/2019 AMBUJA FINAL REPORT
http://slidepdf.com/reader/full/ambuja-final-report 17/37
Add an arrow from (activity) node i to (activity) node j if activity i must be
finished before activity j can start (activity i precedes activity j). Note here
that all arcs have arrows attached to them (indicating the direction the
project is flowing in).
Crashing: Reducing project time by expending additional resources.
Crash time: An amount of time an activity is reduced.
Crash cost: Cost of reducing activity time.
NORMAL
ACTIVITY DESCRIPTION COST($) DURATION(WEEKS)
1-2 Product design 300 3
2-3 Market research 30 3
2-4 Productionanalysis
420 7
2-5 Product model 720 9
3-5 Sales brochure 250 5
4-5 Cost analysis 100 3
5-6 Product testing 320 6
6-7 Sales training 400 4
6-8 Pricing 780 13
7-8 Project report 1000 10

8/7/2019 AMBUJA FINAL REPORT
http://slidepdf.com/reader/full/ambuja-final-report 18/37

8/7/2019 AMBUJA FINAL REPORT
http://slidepdf.com/reader/full/ambuja-final-report 19/37

8/7/2019 AMBUJA FINAL REPORT
http://slidepdf.com/reader/full/ambuja-final-report 20/37

8/7/2019 AMBUJA FINAL REPORT
http://slidepdf.com/reader/full/ambuja-final-report 21/37

8/7/2019 AMBUJA FINAL REPORT
http://slidepdf.com/reader/full/ambuja-final-report 22/37
CALCULATION:
Let, Indirect cost = $ 50 per week.
Total cost = Direct cost + Indirect cost for 33 weeks
= 4320 + (50*33)
= 4320 + 1650
= $ 5970
TOTAL FLOAT:
Activities Total Float (Lj - Ei) - tij
1-2 (3-0)-3 = 0
2-3 (8-3)-3 = 2
2-4 (10-3)-7 =0
2-5 (13-3)-9 = 1
3-5 (13-6)-5 = 2
4-5 (13-10)-3 = 0
5-6 (19-13)-6 = 0
6-7 (23-19)-4 = 0
6-8 (33-19)-13 = 1
7-8 (33-23)-10 = 0

8/7/2019 AMBUJA FINAL REPORT
http://slidepdf.com/reader/full/ambuja-final-report 23/37
CRASH COST SLOP:
Critical Path is = 1-2-4-5-6-7-8
Activities Crash Cost / Week($) [( crash cost – normal cost)/(normal time- crash time)]
1-2 (400-300)/(3-2) = 100
2-4 (580-420)/(7-5) = 20
4-5 (130-100)/(3-2) = 30
5-6 (410-320)/(6-4) = 45
6-7 (470-400)/(4-3) = 70
7-8 (1200-1000)/(10-9) = 200

8/7/2019 AMBUJA FINAL REPORT
http://slidepdf.com/reader/full/ambuja-final-report 24/37
CRASH COST SLOP:
Critical Path is = 1-2-4-5-6-7-8
Activities Crash Cost / Week($) [( crash cost – normal cost)/(normal time- crash time)]
1-2 (400-300)/(3-2) = 100
2-4 (580-420)/(7-5) = 20
4-5 (130-100)/(3-2) = 30
5-6 (410-320)/(6-4) = 45
6-7 (470-400)/(4-3) = 70
7-8 (1200-1000)/(10-9) = 200
CONCLUSION:
• PERT is Probabilistic tool.
• CPM is Deterministic tool.

8/7/2019 AMBUJA FINAL REPORT
http://slidepdf.com/reader/full/ambuja-final-report 25/37
MEASUREMENT OF THE PROBLEM
Increase the time duration of Project.
Increase the project cost which is not supporting the Visionof Ambuja Realty.
Dependent variables like service is being neglected in
Ambuja Realty.
EXAMPLE:
Before connecting the Cable line Company has installedTransformer for 4B but building is not yet completed .So,
Company is blocking its capital. In this way many item of the
service department has been blocked.

8/7/2019 AMBUJA FINAL REPORT
http://slidepdf.com/reader/full/ambuja-final-report 26/37
CAUSES of PROBLEMS
Fish-bone diagram

8/7/2019 AMBUJA FINAL REPORT
http://slidepdf.com/reader/full/ambuja-final-report 27/37

8/7/2019 AMBUJA FINAL REPORT
http://slidepdf.com/reader/full/ambuja-final-report 28/37
Lack of planning
Lack of co-ordination
Fund allocation
Wrong progress management
Fund resources
Forecasting error
It can be done by statistical method
It can be done based on the past experience
It can be done based on the heuristic method
It can be done based on the mathematical through
simulation
Problems with the resource levelling
Equipments
Lack of planning
Forecasting error
Sensitivity of communication gap

8/7/2019 AMBUJA FINAL REPORT
http://slidepdf.com/reader/full/ambuja-final-report 29/37
DATA REQUIRED FOR SOLVE THOSE
PROBLEMS
The terms "dependent variable" and "independent variable" are used in
similar but subtly different ways in mathematics and statistics as part of the
standard terminology in those subjects. They are used to distinguish
between two types of quantities being considered, separating them into
those available at the start of a process and those being created by it, where
the latter (dependent variables) are dependent on the former (independent
variables).
I. Dependent Variable
Statistical models normally specify how one set of variables,
called dependent variables.
A dependent variable is exactly what it sounds like. It is
something that depends on other factors.
Eg:
Finish Work
Servicing Work
Electrical
Internal Electrical
External Electrical
Electrical Higher Side
DG Set
VCB
Transformer
PHE (Public Health Engineering)
Internal Plumbing

8/7/2019 AMBUJA FINAL REPORT
http://slidepdf.com/reader/full/ambuja-final-report 30/37
External Plumbing
HVAC
Lower Side
Higher Side
Lift
Fire Fighting
Final Finishing Work
II. Independent Variable
Functionally depend on another set of variables,
called independent variables.
An independent variable is exactly what it sounds like. It is
a variable that stands alone and isn't changed by the other
variables you are trying to measure.
Eg: Super Structure

8/7/2019 AMBUJA FINAL REPORT
http://slidepdf.com/reader/full/ambuja-final-report 31/37
USE OF THE MS PROJECT
We have used MSP version 2007
Microsoft Project's purpose and functionality is best described by
the definition of a project: A project is a unique undertaking that
has a clearly defined start and finish, and requires the
management of time, resources, cost and quality.
Project management is defined as a broad set of skills to properly
initiate, plan, execute, control and close a project. The primary
skills are scoping (i.e., describing and agreeing on project objectives
and requirements), scheduling, and estimating. Added to these
core skills are managing risk and uncertainty, managing quality,
communicating, managing ourselves, and collaborating with
others, including suppliers of goods and services and everyone elsewho works on or is affected by the project.
MS Project has been designed to assist project managers in the
development of plans, to assign resources to tasks, to track
progress, to manage budgets and to analyse workloads. As a
comparison, let's look at the difference between production and
project management.
With production management, the objective is to achieve a
succession of consistent products. With project management theend result is less clearly defined and the certainty around its

8/7/2019 AMBUJA FINAL REPORT
http://slidepdf.com/reader/full/ambuja-final-report 32/37
achievement not assured, thereby turning it into a bit of an art
form. In some ways the dividing line between projects and
operational activities, such as production management, is not
clear; often an operational activity is a series of small projects.
However, what is clear is that a healthy project has a finite endthat is reached either when the project objectives have been met or
when the project is cancelled.

8/7/2019 AMBUJA FINAL REPORT
http://slidepdf.com/reader/full/ambuja-final-report 33/37

8/7/2019 AMBUJA FINAL REPORT
http://slidepdf.com/reader/full/ambuja-final-report 34/37
4B
Variable Work / Equipment Startdate
StartTime
FinishDate
FinishTime
Duration(days)
Independence BLOCK- 4B 15-06-2010
08:00 10-06-2011
17:00 361
Independence SUPER-STRUCTURE: 15-06-2010
08:00 06-04-2011
17:00 296
Dependence FINISHING WORK: 15-08-2010
08:00 10-06-2011
17:00 300
Dependence SERVICING WORK: 26-08-2010
08:00 02-06-2011
17:00 281
Dependence Electrical: 26-08-2010
08:00 31-05-2011
17:00 279
Dependence InternalElectrical
28-09-2010
08:00 13-04-2011
17:00 198
Dependence External
Electrical
26-08-
2010
08:00 31-05-
2011
17:00 279
Dependence ElectricalHigherSide
08-11-2010
08:00 31-05-2011
17:00 205
Dependence DG Set 08-11-2010
08:00 21-05-2011
17:00 195
Dependence VCB 02-01-2011
08:00 31-05-2011
17:00 150
DependenceTransformer
08-11-2010
08:00 21-05-2011
17:00 195
Dependence PHE 23-09-2010
08:00 31-05-2011
17:00 251
Dependence InternalPlumbing
23-09-2010
08:00 13-04-2011
17:00 203
Dependence ExternalPlumbing
18-12-2010
08:00 31-05-2011
17:00 165
Dependence HVAC 20-09-2010
08:00 31-05-2011
17:00 254
Dependence LowerSide
20-09-2010
08:00 14-04-2011
17:00 207
Dependence HigherSide
23-12-2010
08:00 31-05-2011
17:00 160
Dependence Lift 08-12-
2010
08:00 02-06-
2011
17:00 177
Dependence Fire Fighting 29-09-2010
08:00 19-04-2011
17:00 203
Dependence FINAL FINISHING WORK 22-04-2011
08:00 10-06-2011
17:00 50

8/7/2019 AMBUJA FINAL REPORT
http://slidepdf.com/reader/full/ambuja-final-report 35/37
4A 4B
Variable Work / Equipment Duration(Days)
Duration (days)
(4B-4A)Days
Comparison of Duration
Independence
BLOCK 358 361 3 0.84%
Independence
SUPER-STRUCTURE: 283 296 13 4.59%
Dependence FINISHING WORK: 284 300 16 5.63%
Dependence SERVICING WORK: 273 281 8 2.93%
Dependence Electrical: 273 279 6 2.20%
Dependence InternalElectrical
177 198 21 11.86%
Dependence ExternalElectrical
266 279 13 4.89%
Dependence ElectricalHigher Side
220 205 -15 -6.82%
Dependence DG Set 195 195 0 0.00%
Dependence VCB 165 150 -15 -9.09%
Dependence Transformer
195 195 0 0.00%
Dependence PHE 245 251 6 2.45%
Dependence InternalPlumbing
182 203 21 11.54%
Dependence ExternalPlumbing
180 165 -15 -8.33%
Dependence HVAC 248 254 6 2.42%
Dependence Lower Side 186 207 21 11.29%Dependence Higher Side 160 160 0 0.00%
Dependence Lift 190 177 -13 -6.84%
Dependence Fire Fighting 182 203 21 11.54%
Dependence FINAL FINISHING WORK 60 50 -10 -16.67%
ANALYSIS
Duration taken for 4A and 4B.After comparing between 4A(358) and 4B(361)
there is no so much difference. The difference is 3(0.84%) it meansestimation of 4B is almost accurate.
8/7/2019 AMBUJA FINAL REPORT
http://slidepdf.com/reader/full/ambuja-final-report 36/37
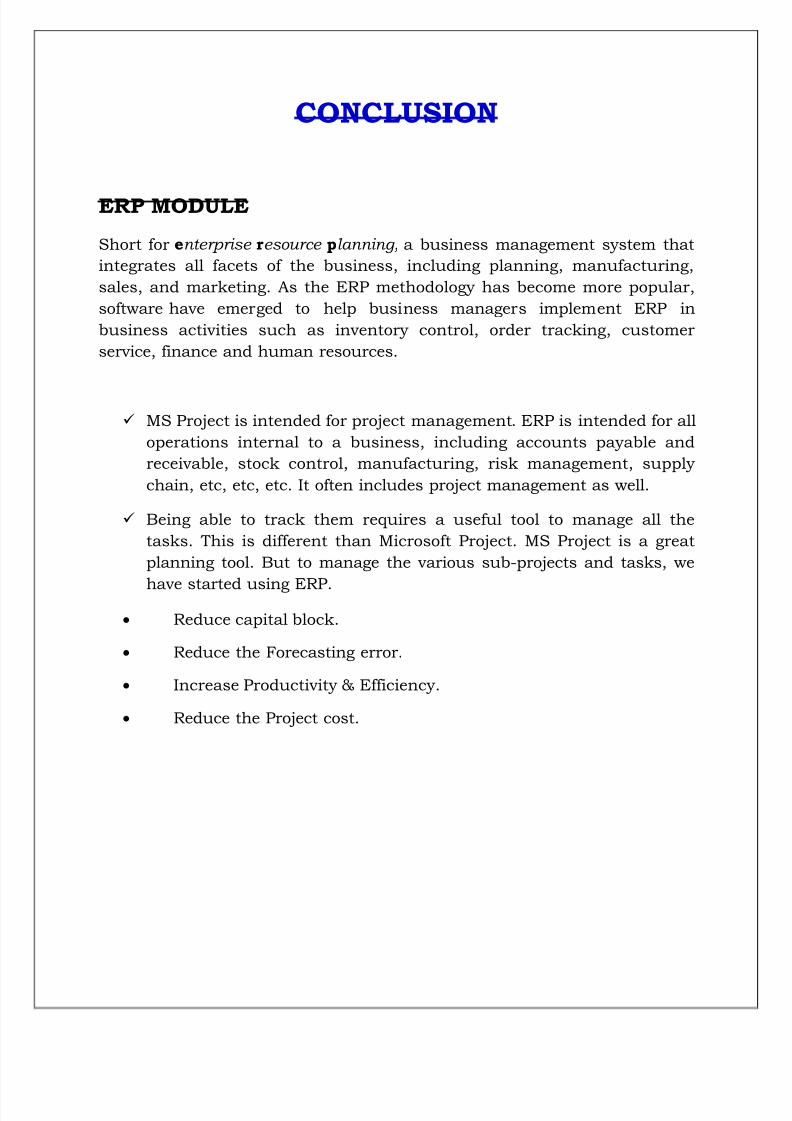
CONCLUSION
ERP MODULE
Short for enterprise resource planning, a business management system that
integrates all facets of the business, including planning, manufacturing,
sales, and marketing. As the ERP methodology has become more popular,
software have emerged to help business managers implement ERP in
business activities such as inventory control, order tracking, customer
service, finance and human resources.
MS Project is intended for project management. ERP is intended for all
operations internal to a business, including accounts payable and
receivable, stock control, manufacturing, risk management, supply
chain, etc, etc, etc. It often includes project management as well.
Being able to track them requires a useful tool to manage all the
tasks. This is different than Microsoft Project. MS Project is a great
planning tool. But to manage the various sub-projects and tasks, we
have started using ERP.
Reduce capital block.
Reduce the Forecasting error.
Increase Productivity & Efficiency.
Reduce the Project cost.

8/7/2019 AMBUJA FINAL REPORT
http://slidepdf.com/reader/full/ambuja-final-report 37/37
BIBLIOGRAPHY
www.ambuja.com
http://en.wikipedia.org
http://pom-mn313pm.tripod.com
http://www.netmba.com
http://www.envisionsoftware.com