Embed Size (px)
Citation preview
AMBO UNIVERSITY SCHOOL OF GRADUATE STUDIES
COLLEGE OF NATURAL AND COMPUTATIONAL SCIENCE DEPARTMENT OF BIOLOGY, ENVIRONMENTAL SCIENCE
PROGRAM
ASSESSMENT OF EFFECT OF MANAGEMENT PRACTICES AND AGRO-ECOLOGY ON WATER PRODUCTIVITY OF MAJOR CROPS IN MEJA WATERSHED, JELDU DISTRICT, OROMIA REGION, ETHIOPIA
M.Sc. THESIS
By:
ADDISU ASFAW DEBELA
DECEMBER, 2012 AMBO
ASSESSMENT OF EFFECT OF MANAGEMENT PRACTICES AND AGRO-ECOLOGY ON WATER PRODUCTIVITY OF MAJOR CROPS IN MEJA WATERSHED, JELDU DISTRICT, OROMIA REGION, ETHIOPIA
By:
Addisu Asfaw Debela
A Thesis Submitted to the School of Graduate Studies of Ambo University
in Partial Fulfillment of the Requirements for the Degree of Masters of
Science in Environmental Science
December, 2012 Ambo

AMBO UNIVERSITY
SCHOOL OF GRADUATE STUDIES As Thesis research advisor, I hereby certify that I have read and evaluated this Thesis
entitled: ASSESSMENT OF EFFECT OF MANAGEMENT PRACTICES AND AGRO-
ECOLOGY ON WATER PRODUCTIVITY OF MAJOR CROPS IN MEJA
WATERSHED, JELDU DISTRICT, OROMIA REGION, ETHIOPIA prepared under my
guidance by: Addisu Asfaw Debela. I recommend that it can be submitted as fulfilling the
Thesis requirement.
---------------------------------------------- ------------------------ ------------------------ Name of Major Advisor Signature Date ---------------------------------------------- ------------------------ -----------------------
Name of Co- Advisor Signature Date
As members of the Board of Examiners of the M.Sc. Thesis Open Defense Examination,
we certify that we have read and evaluated the Thesis prepared by Addisu Asfaw Debela
and examined the candidate. We recommended that the Thesis be accepted as fulfilling the
Thesis requirement for the Degree of Master of Science in Environmental Science.
---------------------------------------------- ----------------------- ------------------------ Name of Chairperson Signature Date
---------------------------------------------- ------------------------ ------------------------ Name of Internal Examiner Signature Date ---------------------------------------------- ------------------------ ------------------------ Name of External Examiner Signature Date ---------------------------------------------- ------------------------ ------------------------ Name of PG Coordinator Signature Date

Submitted by:
--------------------------------------------- ------------------------ ------------------------ PG Candidate Signature Date Approved by: ---------------------------------------------- ------------------------ ------------------------ Name of Major Advisor Signature Date ---------------------------------------------- ------------------------ ------------------------ Name of Co-Advisor Signature Date ---------------------------------------------- ------------------------ ------------------------ Name of Head of Department Signature Date
---------------------------------------------- ------------------------ ------------------------ Name of College/Institute Dean Signature Date ---------------------------------------------- ------------------------ ------------------------ Name of Director, S/G/Studies Signature Date

STATEMENT OF THE AUTHOR First, I declare that this thesis is my bona-fide work and that all sources of materials used
for this thesis have been duly acknowledged. This thesis has been submitted in partial
fulfillment for the Degree of Masters of Science, in Environmental Science at Ambo
University and is deposited at the University Library to be made available to borrowers
(users) under rules of the Library. I solemnly declare that this thesis is not submitted to any
other institution anywhere for the award of any academic Degree, Diploma, or certificate.
Brief quotations from this thesis are allowed without special permission provided that
accurate acknowledgement of source is made. Request for permission for extended
quotation from or reproduction of this manuscript in whole or in part may be granted by
the college of Natural and Computational Science and/or the Department of Biology or
the School of Graduate Studies when judgment for the proposed use of the material. In all
other instances, however, permission must be obtained from the author.
Name: Addisu Asfaw Debela Signature: __________________.
Place: Ambo University
Ambo
Date of Submission: ___________________.
ii
ACKNOWLEDGEMENTS Above all, I owe to God Almighty for all of his Blessings throughout my life. I would like
to extend my heartfelt thanks to my advisors, Dr. Teklu Erkossa (Irrigation Engineer and
Senior Researcher of IWMI) and Prof. M.I Zuberi (Professor of Environmental Science,
Ambo University) for their sincere advice and guidance in the preparation of this thesis. I
want to express my sincere gratitude to Mr. Habtamu Ashagre (M.Sc.in plant science) for
his valuable guidance and advice during the time of study. I want to extend my earnest
thanks to Mr. Esayas Kaba, instructor of GIS at Bahirdar University for his intimate follow
up and guidance during field data collection using a handheld GPS. I am indeed indebted
to my GIS course instructor, Mr. Tibebu Nigusie for his dedicated response, valuable
guidance and support in producing map layers of land use and crop types of the study
watershed. I would like to address my sincere thanks to IWMI working on Nile Basin
Development Challenge (NBDC) of the CGIAR Challenge Program for Water and Food
for immense provisions rendered to me (research topic, fund and advisory support) which
help me to successfully complete my thesis research work. I am also indeed grateful for the
arrangement of the first and remarkable opportunity for me to go to the Republic of South
Africa to attend the Third International Forum on Water and Food (IFWF3). I am also
grateful to the staff of IWMI especially Charlotte MacAlister (PhD), Kinde Getnet (PhD)
and Amare H/Silasie (PhD) for their constructive comments and encouragements. I want to
express my sincere thanks to Madda Welabu College and all the staff members for their
remarkable financial and material support. I am indebted to my colleagues, friends and
family especially, Marta Abera, Kiya, Asfaw Debela, Ketema Asfaw, Wubalem Abera,
Emeshaw Diro (brother), Lelisa Habtamu, Negassa Bane, Bamlaku Desalegn and all my
relatives and staff members who in diverse ways encouraged and supported me throughout
my work. I would like to express my special thanks and honor to Evan. Nigussie Hundessa
for his immense financial support to successfully complete my study. Finally, several
people and organizations assisted me during my research work. In fact, it is not possible to
mention all of them in a few sentences. Generally, however, I would like to thank all
people who had assisted me in one way or another during my research work. May God
Bless you all!

iii
BIOGRAPHY OF THE AUTHOR
The Author was born in Ambo, West Shewa zone of Oromia region, on May 5, 1981. He
completed his elementary and High School education in Addis Ketema Primary and Ambo
Comprehensive Senior Secondary Schools, respectively. He joined the then Alemaya
University in September 2000 and Graduated with B.Ed in Geography in 2003. He was
employed by Ministry of Education in Gelemso Senior Secondary School in July 2003 as a
teacher. In October 2005, he was employed in Madda Welabu (Private) College, Ambo,
Ethiopia as instructor and Academic vice dean. In December 2006, he was transferred to
Ambo Micro Business College and employed as Ambo Campus Dean. In 2009, he was re-
employed in Medda Welabu College as academic vice dean with agreement to get
educational opportunity.

iv
TABLE OF CONTENTS
ACKNOWLEDGEMENTS .............................................................................. ii
TABLE OF CONTENTS ................................................................................. iv
LIST OF TABLES ......................................................................................... viii
LIST OF FIGURES .......................................................................................... ix
LIST OF APPENDICES ................................................................................... x
LIST OF ACRONYMS AND ABREVIATIONS ........................................... xi
ABSTRACT .................................................................................................... xii
1. INTRODUCTION ......................................................................................... 1
1.1 Background and Justification .................................................................. 1
1.2 Statement of the Problem ......................................................................... 3
1.3 Significance of the Study ......................................................................... 4
1.4 Objectives of the Study ............................................................................ 4
1.4.1 General Objective .............................................................................. 4
1.4.2 Specific Objectives ............................................................................ 4
1.5 Scope of the Study…………………………………………………...... 5
2. LITERATURE REVIEW ............................................................................. 6
2.1 Concept and Definitions of Watershed .................................................... 6
2.1.1 Characteristics of Watershed ............................................................. 6
2.1.2 Watershed Management .................................................................... 7
2.2 Water Productivity: Concept and Definitions ......................................... 8
2.2.1 Crops Water Productivity .................................................................. 9
2.2.2 The World’s Cereal Crops Water Productivity Status .................... 10
2.2.3 Water Productivity in Ethiopia: Potentials for Improvement ......... 11
v
2.2.4 The Need for Improved Crop Water Productivity .......................... 12
2.2.5 Factors Affecting Crop Water Productivity .................................... 14
2.4 Crop Water Requirement ....................................................................... 15
2.4.1 Determination of Crop Water Requirement .................................... 15
2.4.1.1 Reference Crop Evapotranspiration ............................................. 16
2.4.1.2 Effective Rainfall …………………………………………….17
2.4.1.3Irrigation Requirement ………………………………………..18
3. MATERIALS AND METHODS ................................................................ 20
3.1 Descriptions of the Study Area .............................................................. 20
3.1.1 Location ........................................................................................... 20
3.1.2 Climate …………………………………………………………..21
3.1.3 Geology and Soil ............................................................................. 21
3.1.4 Farming Systems, Crops Grown and Input Utilization ................... 21
3.1.5 Land Use Land Cover Conditions ................................................... 21
3.1.6 Vegetation and Water Resources .................................................... 22
3.1.7 Socioeconomic Conditions .............................................................. 22
3.2 Study Design ………………………………………………………… 23
3.2.1 Sources of Data and Data Collection Method ................................. 23
3.2.2 Reconnaissance Survey ................................................................... 23
3.2.2 Household Survey ........................................................................... 23
3.2.3 Sampling Representative Crop Fields ............................................. 24
3.2.4 Monitoring the Crop Fields and Data Recording ............................ 25
3.2.5 Estimating Aboveground Biomass and Grain Yield ....................... 25
3.2.5.1 Determination of Crop Dry Matter ........................................... 26
3.2.5.2 Local Price Estimation of Straw and Stover yields .................. 26
3.2.6 Determination of Soil Water Characteristics .................................. 26
3.2.7 Simulating Crop Water Requirements and Water Use ................... 27

vi
3.2.8 Mapping Land Use and Crop Types ............................................... 29
3.3 Determination of Different Parameters ................................................. 29
3.3.1 Crop Productivity ............................................................................ 29
3.3.2 Actual Crop Water Use/ Consumptive Water Use .......................... 30
3.3.3 Determination of Crop Water Productivity ..................................... 30
3.3.3.1 Physical Crop Water Productivity ............................................ 30
3.3.3.2 Economic Crop Water Productivity .......................................... 31
3.3.4 Data Analysis .................................................................................. 31
4. RESULTS AND DISCUSSION ................................................................. 33
4.1 Field Observations, Household Survey and Monitoring Results .......... 33
4.1.1 The Major Crop Types and Cropping Systems ............................... 33
4.1.2 The Crop Management and Agronomic Practices .......................... 35
4.1.2.1 Crop Rotation ………………………………………………...35
4.1.2.1.1 Crop Rotation Pattern in the Upper Zone .............................. 36
4.1.2.1.2 Crop Rotation Pattern in the Middle Zone ............................ 37
4.1.2.1.3 Crop Rotation Pattern in the Lower Zone ............................. 37
4.1.2.2 Tillage, Fertilizer and Seeding Rates ........................................ 38
4.1.2.3 Application of Compost ……………………………………...40
4.1.2.4 Major Crop Types, Cultivar and Variety .................................. 41
4.1.2.5 Rainwater Management Practices ............................................. 45
4.1.2.6 Weed Control ………………………………………………...46
4.1.2.7 Lengths of Crop Growing Period (LGP) .................................. 46
4.1.2.8 Methods of Harvesting ……………………………………...47
4.1.3 Crop Productivity Status ................................................................. 48
4.2 Crop Water Requirement ....................................................................... 51
4.2.1 Magnitude of Water Consumed: The Denominator ........................ 51
vii
4.3 Crop Water Productivity Status ............................................................. 52
4.3.1 Physical Crop Water Productivity ................................................... 52
4.3.2 Economic Crop Water Productivity ................................................ 55
4.4 Effects of Crop Management Practices on Water Productivity ............ 57
4.4.1 Effects on Physical and Economical Crop Water Productivity ...... 58
5. CONCLUSIONS AND RECOMMEDDATIONS ..................................... 60
5.1 Conclusions ………………………………………………………….60
5.2 Recommendations …………………………………………………….61
REFERENCES ................................................................................................ 62
APPENDICES ................................................................................................. 69
viii
LIST OF TABLES
Table 1: Approximate range of values of seasonal crop water need ........................ 16
Table 2: Precipitation (p) and effective Rainfall or Effective Precipitation (Pe) in
mm/month ................................................................................................................. 18
Table 3: Area coverage of major crops in the local agro-ecology of Jeldu District. 24
Table 4: Tillage frequency, fertilizer and seeding rates in the upper zone. ............. 38
Table 5: Tillage frequency, fertilizer and seeding rates in the middle zone. ........... 39
Table 6: Tillage frequency, fertilizer and seeding rates in the lower zone. ............. 40
Table 7: Proportion of compost application per crop fields (%) for different agro-
ecology ...................................................................................................................... 41
Table 8: Average LGP (days from planting to maturity) in the three local agro-
ecological zones. ....................................................................................................... 47
Table 9: Average crop productivity (kg/ha) status in the upper zone ...................... 49
Table 10: Average crop productivity (kg/ha) in the middle zone ............................ 49
Table 11: Average crop productivity (kg/ha) status in the lower zone. ................... 50
Table 12: Average grain and tuber yield (100 kg/ha) across agro-ecology. ............ 51
Table 13: Average amount of water consumed (m3) by each crop across agro-
ecology ...................................................................................................................... 52
Table 14: The average physical crops water productivity of each crop across agro
ecology ...................................................................................................................... 53
Table 15: The average physical crops water productivity of each crop across agro
ecology ...................................................................................................................... 54
Table 16: Total average ECWP of BM (Birr/m3) of major crops across agro-
ecology……………………………………………………………………………..56
ix
LIST OF FIGURES Figure 1: World Water Productivity of Total Cereals, excluding Rice, in 1995 ..... 11
Figure 2: General overview of rainfall partitioning in farming systems in the semi-
arid tropics of ............................................................................................................ 17
Figure 3: Map of the Study District and Meja watershed ........................................ 20
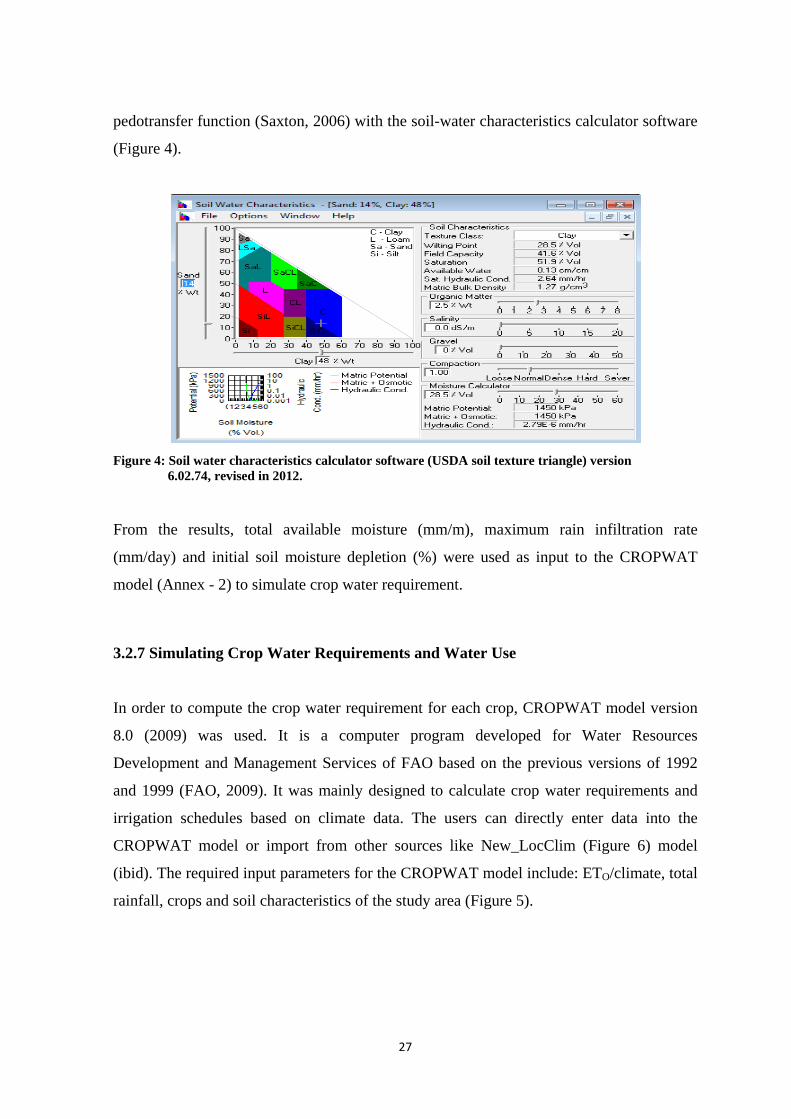
Figure 4: Soil water characteristics calculator software (USDA soil texture triangle)
version ...................................................................................................................... 27
Figure 5: The FAO CROPWAT model Version 8.0, 2009. ..................................... 28
Figure 6: The New_LocClim (local climate estimator) mode versions 1.10, 2006. 28
Figure 7: Map layers of land use and crop types of Meja watershed ....................... 33
Figure 8: The uses of animal dung for household energy sources, in Chilanko KA.41
Figure 9: Malt barley sampled from the upper zone, Chilanko KA ......................... 42
Figure 10: Five years’ average crops area coverage (%) of the district (2006-10). . 43
Figure 11: A commercially improved Potato variety locally called “Gudane”
sampled from Chilanko KA. ..................................................................................... 44
Figure 12: Area coverage of Teff in the lower zone (Gora Lalisa FA), October,
2011. ......................................................................................................................... 44
Figure 13: Sampled teff crop in the lower zone (a) and sorghum in the middle zone
(b) .............................................................................................................................. 45
Figure 14: Farmers harvesting potato with oxen plough and collecting with hand
using family .............................................................................................................. 48
Figure 15: Traditional harvesting method of teff (I) in ‘Goral Lalisa’ and barley (II)48
Figure 16: The total average biomass WP (kg/m3) of the study area. ...................... 54
Figure 17: The total average biomass WP (Birr/m3) of each crop in the study area. 57

x
LIST OF APPENDICES
Annex 1: Table of crop water requirement simulated by the CROPWAT model. .. 69
Annex 2: Table of soil water characteristics of the 45 sampled crop fields simulated
by soil-water characteristics calculator model. ........................................................ 71
Annex 3: Table of soil water characteristics of the 45 sampled crop fields simulated
by soil-water characteristics calculator model. ........................................................ 73
Annex 4: Figure of land use land cover map of Meja watershed for the year 2011 74
Annex 5: Table of data codes used for SPSS entry. ................................................. 74
Annex 6: Table of crop area statistics of the study watershed. ................................ 75
Annex 7: Table crop water productivity with respect to consumptive water use and
effective precipitation. .............................................................................................. 76
Annex 8: Table of crop characteristics used as in put for CROPWAT model in the
determination of CWR with respect to crop type and agro - ecology. ..................... 78
Annex 9: Table of ANOVA of mean biomass WP with respect to local agro-ecology80
Annex 10: Table of one-way ANOVA to test significance of mean biomass WP
difference .................................................................................................................. 80
Annex 11: Table of local market values of grain yield in 2011/12. ......................... 80
Annex 12: Table of price estimate of straw and Stover yield (Birr/kg). .................. 81
Annex 13: Table of ANOVA of mean economic CWP (Birr/m3) across agro-
ecologies ................................................................................................................... 81
Annex 14: Table of one – way ANOVA to test significance of mean difference. ... 81
Annex 15: Table of Pearson’s correlation coefficient indicating the relationship
between four management practices and CWP across the three zones. ................... 82
Annex 16: Data Collection Formats ......................................................................... 83

xi
LIST OF ACRONYMS AND ABREVIATIONS BM Biomass
BMY Biomass Yield
CPWF Challenge Program on Water and Food
CWP Crop Water Productivity
ECWP Economic Crop Water Productivity
EIAR Ethiopian Institute of Agricultural Research
ETB Ethiopian Birr
ETC Crop Evapotranspiration
FAO Food and Agricultural Organizations
FDRE Federal Democratic Republic of Ethiopia
GIS Geographic Information System
GPS Global Positioning System
GY Grain Yield
HI Harvest Index
ILRI International Livestock Research Institute
IR Irrigation Requirement
IRRI International Rice Research Institute
IWMI International Water Management Institute
JDOA Jeldu District Office of Agriculture
MoARD Ministry of Agriculture and Rural Development
NBDC Nile Basin Development Challenge
RS Remote Sensing
SSA Sub Saharan Africa
SY Straw Yield
TECWP Total Economic Crop Water Productivity
USDA United States Department of Agriculture
USD United States Dollar
WP Water Productivity
xii
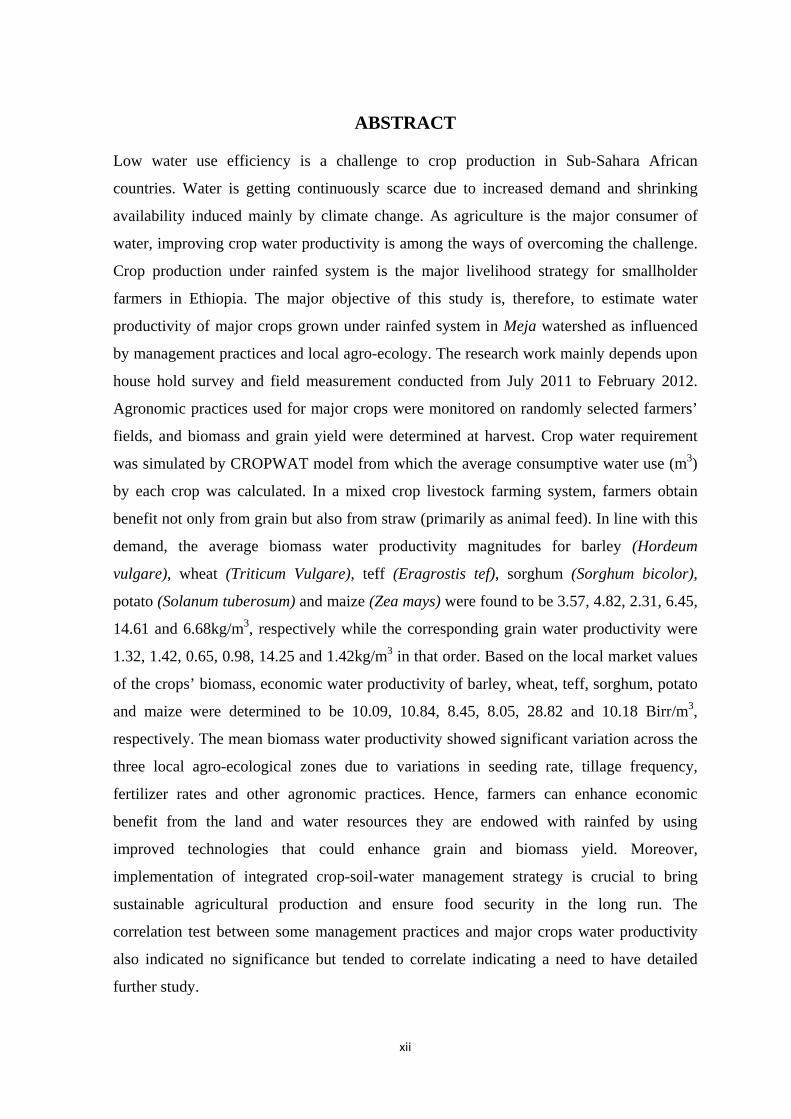
ABSTRACT
Low water use efficiency is a challenge to crop production in Sub-Sahara African
countries. Water is getting continuously scarce due to increased demand and shrinking
availability induced mainly by climate change. As agriculture is the major consumer of
water, improving crop water productivity is among the ways of overcoming the challenge.
Crop production under rainfed system is the major livelihood strategy for smallholder
farmers in Ethiopia. The major objective of this study is, therefore, to estimate water
productivity of major crops grown under rainfed system in Meja watershed as influenced
by management practices and local agro-ecology. The research work mainly depends upon
house hold survey and field measurement conducted from July 2011 to February 2012.
Agronomic practices used for major crops were monitored on randomly selected farmers’
fields, and biomass and grain yield were determined at harvest. Crop water requirement
was simulated by CROPWAT model from which the average consumptive water use (m3)
by each crop was calculated. In a mixed crop livestock farming system, farmers obtain
benefit not only from grain but also from straw (primarily as animal feed). In line with this
demand, the average biomass water productivity magnitudes for barley (Hordeum
vulgare), wheat (Triticum Vulgare), teff (Eragrostis tef), sorghum (Sorghum bicolor),
potato (Solanum tuberosum) and maize (Zea mays) were found to be 3.57, 4.82, 2.31, 6.45,
14.61 and 6.68kg/m3, respectively while the corresponding grain water productivity were
1.32, 1.42, 0.65, 0.98, 14.25 and 1.42kg/m3 in that order. Based on the local market values
of the crops’ biomass, economic water productivity of barley, wheat, teff, sorghum, potato
and maize were determined to be 10.09, 10.84, 8.45, 8.05, 28.82 and 10.18 Birr/m3,
respectively. The mean biomass water productivity showed significant variation across the
three local agro-ecological zones due to variations in seeding rate, tillage frequency,
fertilizer rates and other agronomic practices. Hence, farmers can enhance economic
benefit from the land and water resources they are endowed with rainfed by using
improved technologies that could enhance grain and biomass yield. Moreover,
implementation of integrated crop-soil-water management strategy is crucial to bring
sustainable agricultural production and ensure food security in the long run. The
correlation test between some management practices and major crops water productivity
also indicated no significance but tended to correlate indicating a need to have detailed
further study.

1
1. INTRODUCTION
1.1 Background and Justification Globally, rainfed agriculture is very important as it constitutes 80% of the world’s
agricultural lands and generates 58% of the world’s staple food (SIWI, 2001 in Singh et al.
2011). According to Singh et al. 2011, most food for poor communities in developing
countries is produced in rainfed areas. For instance, in Sub-Saharan Africa (SSA) over
95% of the farm land is under rain fed. In Ethiopia, about 94% of the total 74.3 million
hectare of arable land is rainfed (MARD, 2009).
As water is one of the most critical inputs to agriculture, rainwater is an essential resource
to rainfed agriculture (Molden et al. 2003). In regions characterized by erratic rainfall,
rainfed agriculture is subjected to inherent water related risks, which make farmers less
likely to invest in production enhancing inputs (Singh et al. 2011). In these areas, rainfall is
the most prominent random parameter beyond farmers’ control. Hence, it is both a critical
input and a primary source of risk and uncertainty for agricultural production (Rockström
et al. 2009). On the other hand, agricultural water use is facing competition for water from
industry, domestic uses, aquatic ecosystems and environmental services. Thus, water
available for agricultural sector is expected to be reduced in the future despite the
increasing pressure for more food production (Kijne et al. 2003). Yet, the rain fed
agriculture practiced by most small holder farmers in developing countries is characterized
by poor water management and low water use efficiency. The current rainwater use
efficiency for crop production ranges between 30% and 45%, and annually 300 to 800 mm
of seasonal rainfall is lost as surface runoff or deep drainage (Wani et al. 2003). In SSA,
less than 30% of rainfall is used as productive transpiration by crops. On severely degraded
land, this proportion can be as small as 5% (Rockström and Steiner, 2003)
Current irrigation water withdrawals are also causing stress in many of the world’s major
river basins (Molle et al. 2007). The world is therefore, facing a water crisis with little
scope for further expansion of large-scale irrigation (Singh et al. 2011).
2
Thus, the best solution to alleviate these problems (water scarcity and low water use
efficiency) lies on improving water management in rainfed agriculture not only to secure
the water required for food production but also to build resilience for coping with the
future water related risks and uncertainties (Molden et al. 2007; Rockström et al. 2010).
Crop failures were commonly blamed on “drought’’. This might also be prevented in many
cases through better farm-level water management (Singh et al., 2011). It was also
predicted that there will be further decline in rainfall and amplification of extreme events
(IPCC, 2007). Thus, the current and future state-of-affairs denote that increasing food
demand due to increasing world population can be satisfied with more efficient use of the
available water resources (Singh et al. 2011). One of the best mechanisms to attain this
objective is improving crop water use efficiency or crop water productivity especially of
rainfed (Cai et al. 2010). The Comprehensive Assessment of Water Management in
Agriculture also pointed out that there is a large and unexploited potential for upgrading
rain fed agriculture (Molden et al. 2007). An attempt was made by some experts to
estimate water productivity (WP) status of major cereal crops and their future potentials for
improvement. The result of WP investigation made by Cai and Rosegrant (2003) indicated
that the average WP of cereal crops (except rice) in developing countries was lower than
0.56 kg m-3 as compared to an average of 1.0 kg m-3 for developed countries in 1995. More
specifically, WP of cereal crops in SSA was the lowest in the world ranging from 0.1 to
0.3kg m-3. It varied from 1.0–1.7 kg m-3 in China, the USA and Brazil; and 1.7–2.4 kg m-3
in Western European countries. This crop water productivity variation is attributed mainly
to variations in non-water related factors such as environmental, agronomic, social and
economic conditions of different localities (Kijne et al. 2003). Land degradation, poor soil
fertility, soil salinity, lack of improved varieties, low rate of fertilizers used, poor weed
management, shortages of labor, insecure land ownership, limited access to capital for
investment, limited skill and abilities are among the determinant factors for low crop water
productivity (Mulugeta, 2006; Singh et el. 2011). These are the potential problem area
where interventions are required to improve crop water productivity in rainfed agriculture.
By overcoming the limitations emanating from the ‘none water factors’, agricultural water
productivity of small- holder farmers in developing countries like Ethiopia can be
increased.
3
The Ethiopian Institutes of Agricultural Research (EIAR, 2004) suggested that water
productivity improvements in crops, livestock and fishery can effectively address food
insecurity and poverty. Ethiopian agriculture is small scale, subsistence-oriented dependent
on rainfall and, characterized by low productivity. It is facing water shortages that will
complicate the national efforts to attain agricultural transformation (EIAR, 2004). Thus,
analysis of crop water productivity based on landscape positions and management
practices at watershed level is essential to address the problem of water scarcity and food
insecurity. Such studies help to examine the current state of crop water productivity and
identify the principal factors which contribute to crop water productivity and suggest
appropriate technological interventions at each agro-ecological zone for improvement in
crop water use efficiency. Efficient on-farm rainwater management system recharges
ground water and improves water productivity. According to Wani et al. (2001) efficient
use of rainwater can be achieved by implementing appropriate crop and land management
techniques. Restoration of degraded land and implementation of integrated crops, soil and
water management interventions can contribute to the improvement of crop productivity.
1.2 Statement of the Problem Underdevelopment, rapid population increase, land degradation, climate uncertainty and
water scarcity are the major bottlenecks to achieving higher agricultural production and
improved rural livelihoods in developing countries like Ethiopia (Singh et al. 2011). Meja
watershed, being part of the Blue Nile (Abay) Basin, is predominantly characterized by
subsistence, low yielding and rainfed agriculture. The cultivated land in the area is highly
prone to sheet and rill erosion due to lack of appropriate soil and water conservation
practices, deterioration of forest cover in the hilly areas and increasing human and
livestock population pressure (Birhanu Ayana, 2011). As a result, big and active gullies
are formed which decreased ground water infiltration, increased surface run-offs and soil
nutrient depletion. Marginal lands and steep slopes are being cultivated that could also
aggravate soil erosion, land degradation and reduce crop water use efficiency. Thus, in
order to satisfy the needs of the growing populations in the area and restore productivity of
the natural landscapes, land degradation should be reversed, rainwater should be properly
managed and productivity should be improved. In line with this need, the study was
4
designed to assess how management practices and local agro-ecology could affect crop
water productivity of major crops in the study area. Such studies are very rare in the
country.
1.3 Significance of the Study Limited studies have been conducted to understand the influence of management practices
and local agro-ecology in Meja watershed and the Abay River Basin. This study attempted
to reveal the current status of crop-water productivity, identify determinant factors
affecting crop-water productivity and give directions for future improvement of water use
efficiency. Thus, the result of this study is very much significant for the local community,
development agents, agricultural experts, researchers (in the areas of agronomy, field crop,
horticultural crop and soil and natural resource conservation) policy makers and other
stakeholders in the area and beyond.
1.4 Objectives of the Study
1.4.1 General Objective The general objective of the study was to estimate water productivity of major crops based
on management practices and local agro-ecological zones in the watershed.
1.4.2 Specific Objectives The specific objectives of the study include:
1. To identify the cropping systems and existing crops management
practices in the study area and relate to crop water productivity.
2. To produce map layers of land use and crop types of the study watershed.
3. To estimate biomass and grain yields of major crops in each local agro-
ecology and,
4. To simulate crop water requirements and calculate consumptive water use
(m3) of the major crops.
5
1.5 Scope of the Study The study was limited to Meja watershed which incorporates parts of Ento Dalle, Sariti,
Tullu Gurra, Chilanko, Bicho, Tullu Gurjji, Edensa Gelan, Kolu Gelan and Chobi Sirba
Kebele Administrations (KAs) and part of Gojo town. The watershed has been stratified
into two local agro-ecological zones (upper and middle). However, Gora Lalisa Farmers’
Association was purposely added from outside of the watershed as lowland so as to make
samples representative of the district’s agro-ecologies. The dominant crops cultivated in
the study district across the three landscape positions were barley (Hordeum Vulgera),
potato (Solanum tuberosum), wheat (Triticum vulgare.), teff (Eragrostis tef), sorghum
(Sorghum bicolor) and maize (Zea mays). Minor crops include, faba bean (Vicia faba L.),
field pea (Pisum sativum L.) flax (Linum usitatissimum), and niger seed (Guizotia
abyssinica). Therefore, the study was restricted to the assessment of water productivity of
the major crops in their respective local agro-ecological zones based on management
practices.

6
2. LITERATURE REVIEW
2.1 Concept and Definitions of Watershed A watershed is defined as a geographic area where runoff resulting from drops of rain will
be collected and drained through a common confluence point. The confluence point is a
single body of water, such as a lake, river or simply a watershed outlet (Seleshi Bekele et
al. 2009). A watershed can be small as a basin that drains to a tiny creek, or as large as the
Nile River Basin (ibid). Hence, it comprises of a catchment area (recharge zone), a
command area (transition zone) and a delta area (discharge zone). The top most portion of
the watershed is known as the “ridge” and a line joining the ridge portions along the
boundary of the watershed is called a “ridgeline”. A watershed is a logical unit for
planning optimal development of its soil, water and biomass resources (Calling, 2004).
2.1.1 Characteristics of Watershed
A watershed can be characterized by its size and shape, topography, relief and soil.
According to Calling (2004) size of a watershed ranges from less than 100 ha to that of
greater than 50,000 ha. A watershed with areas ranging from 1 - 100 ha, 100 - 1,000 ha,
1,000 - 10,000 ha, 10,000 ha - 50,000 ha and above 50,000 ha are called mini watershed,
micro watershed, milli watershed, sub-watershed and macro watershed, respectively. A
watershed could be described as fan shaped (near circular) or fen shaped (elongated).
Hydrologically, the shape of the watershed is important because it controls the time taken
for the runoff to concentrate at the outlet. Watersheds may also be categorized as hill or
flat watersheds, humid or arid watersheds, red soil watershed or black soil watershed based
on criteria like soil, slope and climate. Depending on the land use pattern, watershed could
be classified as highland watersheds, tribal settlements and watersheds in areas of settled
cultivation (ibid).

7
2.1.2 Watershed Management Watershed management is defined as the process of formulating and carrying out a course
of action involving the manipulation of resources in a watershed to provide goods and
services without adversely affecting the soil and water base. Usually, watershed
management must consider the social, economic and institutional factors operating within
and outside the watershed area (Seleshi Bekele et al. 2009).
The task of watershed management includes the treatment of land by using the most
suitable biological and engineering measures in such a manner that the management work
must be economical and socially acceptable. The various factors affecting watershed
management are watershed characteristics (shape and size, topography, relief and soils);
climatic characteristics (precipitation, and amount and intensity of rainfall); watershed
operation; land use pattern (vegetative cover, density and state i.e, type and quality); social
status of inhabitants; and water resources and their capabilities (Seleshi Bekele et al.
2009).
Watershed management involves the judicious use of natural resource with active
participation of institutions, organizations, in harmony with the ecosystem. The three main
components in watershed management are land management, water management and
biomass management (Calling, 2004).
Water management: Water characteristics like inflows (precipitation, surface water
inflow, ground water inflow) water use (evaporation, evapotranspiration, irrigation,
drinking water) outflows (surface water outflow, ground water out flow) storage (surface
storage, ground water storage, root zone storage) are the principal factors to be taken care
of in sustainable water management (Calling, 2004). The broad interventions for water
management are: Rainwater harvesting, ground water recharge, maintenance of water
balance, preventing water pollution, economic use of water. Rainwater harvesting forms
the major component of water management (ibid).
Land management: Land characteristics like terrain, slope, and formation, depth and
texture, moisture and infiltration rate and soil capability are the major determinants of land
management activities in a watershed. The broad category of land management
8
interventions can be as follows: structural measures, vegetative measures, production
measures and protection measures (Calling, 2004).
Biomass management: The major intervention areas for biomass management are: eco-
preservation, biomass regeneration, forest management and conservation, plant protection
and social forestry, increased productivity of animals, income and employment generation
activities, coordination of health and sanitation programs, better living standards for
people, eco-friendly life style of people and formation of a learning community (Calling,
2004).
2.2 Water Productivity: Concept and Definitions Water is one of the most critical inputs to agriculture. Currently however, the existing
water resource has become scarcer due to fluctuation in local to global climatic conditions,
increasing water demand with its low use efficiency (high wastage and deterioration in its
quality). Hence, the concept of water productivity emerges with the view to improve water
use efficiency (increase its consumptive water use) in agriculture especially in crop
production. The concept was first presented by David Molden et al. 2003, as a robust
measure of the ability of agricultural systems to convert water into food. Principally, it was
designed to evaluate the function of irrigation systems as the amount of ‘crop per drop’.
Recently, however, extending this concept to include other types of livelihood support,
such as mixed cropping, pasture, fisheries or forests has become reasonable (Steduto et al.
2007). In line with this, the Comprehensive Assessment of Water Management in
Agriculture defined water productivity broadly as the ratio of the net benefits from crop,
forestry, fishery, livestock, and mixed agricultural systems to the amount of water required
to produce those benefits. In its broadest sense it reflects the objectives of producing more
food, income, livelihoods, and ecological benefits at less social and environmental cost per
unit of water used, where water use means either water delivered to a use or depleted by a
use. Simply, it means gaining more benefits with less water) (Steduto et al. 2007). Water
productivity can be either physical or economical. Physical water productivity is the ratio
of the mass of agricultural output (in kg ha-1 or ton ha-1) to the amount of water used in m3,
and economic productivity is the value derived per unit of water used (economic return or

9
nutrition, any other economic and social benefits). Water productivity can be measured for
crops as crop water productivity and for livestock as livestock water productivity (Steduto
et al. 2007) while the two can be integrated to generate system water productivity.
2.2.1 Crops Water Productivity Crop water productivity is defined as crop yield per cubic meter of water consumption,
including ‘green’ water (effective rainfall) for rain-fed areas and both ‘green’ water and
‘blue’ water (diverted water from water systems) for irrigated areas. Definitions of crop
water productivity differ based on the background of the researcher or stakeholder. From
all other options available; however, obtaining more kilograms per unit of transpiration is
an important means of expressing crop productivity with respect to water (Molden et al.
2003).
There are different options to assess crop water productivity in rainfed agriculture.
RockstrÖm and Barron (2007) pointed out three kinds of considerations of crop water
productivity (WP) assessment. These are water productivity with respect to rainfall
(usually effective rainfall), evapotranspiration and transpiration. Each of them can be
computed using the following formulae:
1. WPR , Where WPR refers to water
productivity with respect to rainfall.
It refers to the amount of dry matter or marketable yield produced per unit of rainfall
received by the crop or cropping system. This is also known as rainfall use efficiency
(RUE) (Singh et al. 2011).
2. WPE , Where WPE refers to water productivity
with respect to evapotranspiration, and
Water productivity with respect to evapotranspiration is defined as the amount of dry
matter or marketable yield produced per unit of evapotranspiration (ET) by the crop, where
ET is the sum of soil evaporation and transpiration by the crop during the season (Singh et
al. 2011).

10
3. WPT , Where WPT implies water productivity
with respect to transpiration.
Water productivity with respect to transpiration is the amount of dry matter or marketable
yield produced per unit of water taken up by plants. This is also known as transpiration
efficiency or transpiration ratio (Singh et al. 2011). As mentioned earlier, this method is
more appropriate to express crop productivity with respect to water. Singh et al. (2011)
tried to summarize several other considerations of expressing crop water productivity from
different literatures. According to Cai and Rosegrant (2003) water productivity varies from region to region and
from field to field, depending on many factors, such as crop and climate patterns and field
water management, land and infrastructure, and input including labor, fertilizer and
machinery.
For a comparative study of water productivity of different crops or cropping systems in
response to various management practices, equivalent yields of different crops or net
income per unit of ET, amount of irrigation, rainfall or rainfall plus irrigation received by
the crop or cropping system may be considered (Singh et al. 2011).
2.2.2 The World’s Cereal Crops Water Productivity Status The research works that have been conducted worldwide so far, to assess the crops water
productivity indicated the status of worlds’ cereal crops water productivity. These research
works have been carried out by grouping cereal crops in to two categories. These are rice
and other cereal crops (except rice). According to Cai and Rosegrant (2003), it was found
that the water productivity (WP) of rice ranged from 0.15 to 0.60 kg m-3, while that of
other cereals ranged from 0.2 to 2.4 kg m-3 in 1995. Since rice usually consumes more
water than other crops, the WP of rice is significantly lower than that of other cereals.
Figure 1 shows the WP of other cereals excluding rice. For both rice and other cereals, WP
in sub-Saharan Africa is the lowest in the world. The WP of rice varied from 0.10–0.25 kg
m-3 in this region, with an average yield of 1.4 t ha-1 and water consumption (WC) ha-1 is
close to 9500 m3. For other cereals in sub-Saharan Africa, the average yield is 2.4t ha-1, the
11
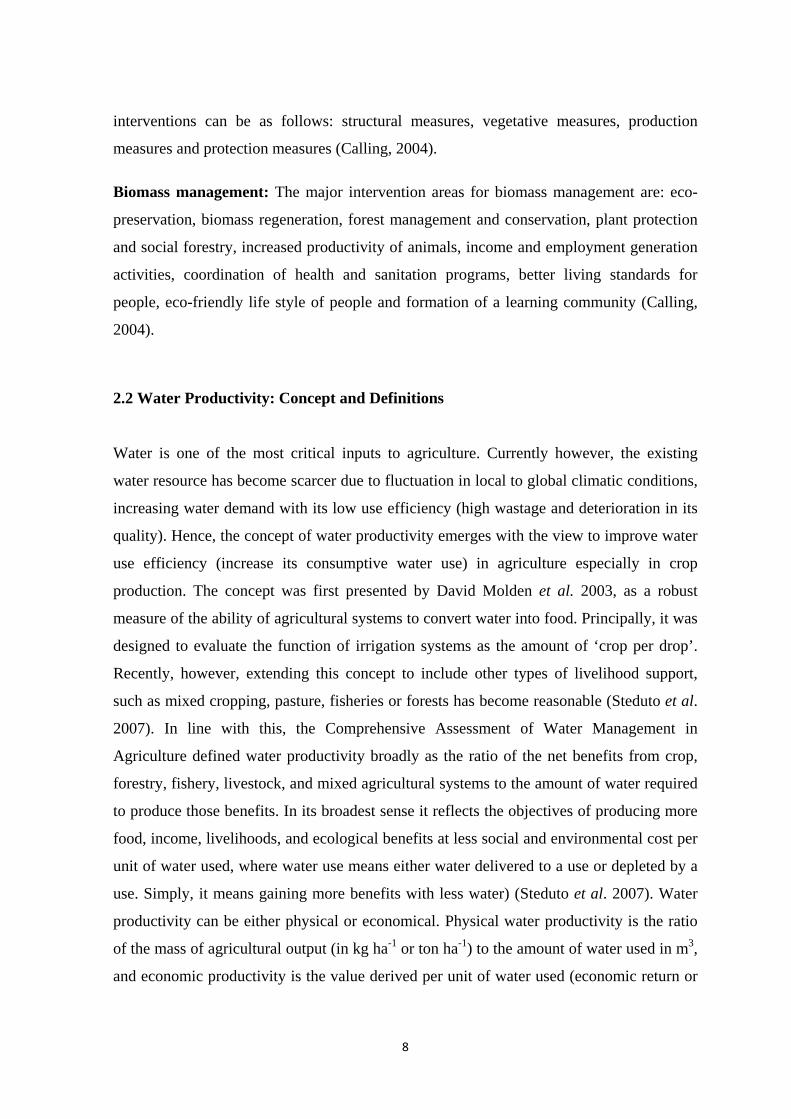
WC is 7700 m3 ha-1 and the average WP is 0.3 kg m-3 (ranging from 0.1 to 0.6 kg m-3) (Cai
and Rosegrant, 2003).
Source: Cai and Rosegrant (2003). Figure 1: World Water Productivity of Total Cereals, excluding Rice, in 1995 It should be noted that, because of the level of aggregation, the values shown on the above
maps do not show the variation of WP within individual countries. WP within individual
countries like Ethiopia requires further study that should begin from watershed level and
scaled up to basin level and finally to country level.
2.2.3 Water Productivity in Ethiopia: Potentials for Improvement The performance of agriculture in Ethiopia is highly affected by natural and anthropogenic
factors. Increasing human and livestock population pressure resulted in land degradation,
deforestation, over cultivation, overgrazing and desertification. These factors being
associated with climate change impacts are highly reducing soil fertility and crop
productivity (FAO, 1984). The Ethiopian highland studies revealed that the Ethiopian
highlands, which cover 44% of the country’s total land area, are seriously threatened by
soil and biological degradation. Some 27 million ha representing approximately 50% of the
highlands are already significantly degraded. Of this area 14 million ha are badly eroded
and if the present trend of soil degradation continues, per capita income in the highlands
obtained from agriculture will fall by 30% in 20 years time (Bekele and Holden, 2000;

12
FAO, 1984). Fifty four percent of the remaining highlands are also highly susceptible to
erosion. These evidences indicated that there are poor soil and water management practices
all over the country.
Ethiopian agriculture is facing water shortages that will complicate the national efforts to
attain agricultural transformation. According to Bekele and Holden (2000) agriculture is
the predominant user (75% – 80%) of the available fresh water resource in many parts of
the world. Ethiopian agriculture is also the largest water consuming economic activity
(EIAR, 2004). Thus, researchers and development partners often acknowledge that
increasing crop water productivity is a key researchable area to mitigate water scarcity.
Improvements to agricultural water productivity especially in crop, livestock, and
aquaculture help meet rising demands for food. Water productivity improvements can
effectively address food insecurity and poverty alleviation (EIAR, 2004). According to
EIAR (2004) Ethiopia has tremendous potential to improve water productivity through
improved and known water management practices. Management practices that can increase
agricultural yields also improve water productivity such as the choice of crop varieties,
fertilizer, and pest and weed management, timely operations and post-harvest management.
Integrated water and land management at the watershed scale is the key to improving water
productivity and enabling sustainable water resource management (ibid).
2.2.4 The Need for Improved Crop Water Productivity Fifty years ago the world had fewer than half as many people as it has today. They were
not wealthy, consumed fewer calories and thus required less water to produce their food.
The pressure they inflicted on environment was lower (Steduto et al. 2007). Recently,
however the world population has been increasing rapidly with increasing demand for food
and water. The ever-growing demand for food and feed in the world due to rapid increase
in population and urbanization necessitates increased food production more than ever
before. Among the important inputs for production are land and water, which are reaching
scarce levels due to competing uses and degradation of their quality (Teklu Erkossa et al.
2010). In SSA, the bulk of increased food production came from the expansion of
13
agricultural land. Now there is limited new land that can be placed under agriculture as
compared to the last three to four decades (McCalla, 1994; Young, 1999).
In SSA more than 95% of agricultural land is rainfed which will remain the dominant
source of food production in the near future (Singh et al. 2011; Parr et al. 1990). However,
yields from rain fed agriculture are often low, generally being around 1 t ha-1 in semi-arid
tropical agro-ecosystems (Rockstro¨m, 2001). Studies indicated that the suboptimal
performance of rainfed agriculture is related to management problems rather than low
physical potential (Agarwal and Narain, 1997; Benites et al. 1998; Rockstro¨m and
Falkenmark, 2000). Currently, there is increasing pressure in SSA to increase agricultural
productivity substantially, without the option of expanding agricultural land and with
limited amount of fresh water. This necessitates the generation of integrated land, water
and crop management technologies that can enhance the productivity of rainfed agriculture
(Teklu Erkossa et al. 2010). Water productivity improvement helps to get better net
socioeconomic and environmental benefits through the use of water in agriculture,
including fisheries, livestock, crops, agro forestry, and mixed systems. Generally, there are
important reasons to improve agricultural water productivity throughout the world (Steduto
et al. 2007):
To meet the rising demand for food from a growing, wealthier, and increasingly
urbanized population, in light of water scarcity.
To respond to pressures to reallocate water from agriculture to cities and to ensure
that water is available for environmental uses.
To contribute to poverty reduction and economic growth.
For the rural poor more productive use of water can mean better nutrition for families,
more income, productive employment, and greater equity. Targeting high water
productivity can reduce investment costs by reducing the amount of water that has to be
withdrawn. Globally, the additional amount of water needed to support agriculture directly
will depend on the gains in water productivity. With no gains in water productivity current
average annual agricultural evapotranspiration of 7,130 cubic kilometers could nearly
double in the next 50 years (Steduto et al. 2007). With appropriate practices in livestock,
aquaculture, rainfed, and irrigated systems the increase could be held down to 20% – 30%.
Increases in withdrawals for irrigation, now at 2,664 cubic kilometers, could range from 0

14
– 55% depending on investments in increasing water productivity and on how much rain
fed and irrigated agriculture expand (Steduto et al. 2007).
2.2.5 Factors Affecting Crop Water Productivity Crop water productivity is a function of several factors. According to Kijne et al. (2000)
differences in environmental, agronomic, social and economic conditions of different
localities can always bring variation in agricultural productivity. Improved crop varieties
increase yields together with the reduction in crop-growth duration. Drought escape and
increasing drought tolerance have been identified as important strategies for increase water
productivity. For instance, the modern ‘IRRI varieties’ of rice developed as part of the
Green Revolution have about a threefold increase in water productivity compared with the
traditional varieties (Tuong, 1999). Water evaporation and transpiration from weeds also
influence water productivity through increasing non-beneficial water depletion. Thus, plant
breeding for early shading will contribute to reducing evaporation while timely weed
control reduces transpiration from weeds (Mulugeta, 2006).
According to Tuong (1999) and Rockstrom et al. (2003), there is an almost linear relation
between yield and water productivity per unit water transpired. Hence, integrated crop-and
resources–management practices that increase yield will effectively increase water
productivity (WP). Improved nutrient application methods (using appropriate rate) can also
enhance crop water productivity. Agricultural WP is also highly correlated with land
degradation which is the depletion of soil quality. Generally, highly degraded lands result
in lower productivity, although the impacts vary across production conditions and
technologies employed. Lower productivity can be either due to decreasing yields or
increased production costs associated with decreased input efficiency. Many cultural
practices, such as row spacing, the use of mulches and plant residues have the potential to
increase WP through their effects on partitioning evapotranspiration between evaporation
and transpiration (Mulugeta, 2006).
15
2.4 Crop Water Requirement
All field crops need soil, water, air and sunshine to grow. The soil gives stability to the
plants, stores water and nutrients. Without water, crops can not grow at the same time too
much water is not good for many crops (Seleshi Bekele et.al, 2009). Optimum amount of
water is requierd for helthy growth of crops. Crop water needs are the sum of crop
transpiration (T) and soil evaporation (E) (Blaney and Criddle, 1950; Doorenbos and
Pruitt, 1975). The plant roots extract water from the soil to live and grow. Almost all of
this water doesnot remain in the plant, but escapes to the atmosphere as vepour through the
plant's leaves and stem, the process called transpiration.
2.4.1 Determination of Crop Water Requirement The crop water need mainly depends on three major factors:
1. The climate: in sunny hot climate crops need more water per day than in a cloudy
and cool climate.
2. The crop type: crops like rice or sugar cane need more water than crops like bean
and wheat.
3. The crop growth stages: Grown crops need more water than crops that have just
been planted (Seleshi Bekele et al. 2009). Thus, during the initial and development
stages crops need more water than the late season.

16
Table 1: Approximate range of values of seasonal crop water need
Crop
Crop Water Need (mm/total growing period)
Alfalfa 800-1600 Banana 1200-2200 Barley/oat/wheat 450-650 Bean 300-500 Cabbage 350-500 Citrus 900-1200 Cotton 700-1300 Maize 500-800 Melon 400-600 Onion 350-550 Peanut 500-700 Pea 350-500 Pepper 600-900 Potato 500-700 Rice (paddy) 450-700 Sorghum/millet 450-650 Soybean 450-700 Sugar beet 550-750 Sugar Cane 1500-2500 Sun Flower 600-1000 Tomato 400-800
Source: Sileshi Bekele et al. (2009)
2.4.1.1 Reference Crop Evapotranspiration
Evapotranspiration (ET) comprises the simultaneous movement of water from the soil and
vegetation surfaces into the atmosphere through evaporation (E) and transpiration (T).
Reference crop evapotranspiration ETo is the evapotranspiration from a reference crop with the
specific characteristics of grass, fully covering the soil and not short of water and represents
the evaporative demand of the atmosphere at a specific location and the time of the year
independently of crop type, crop development and management practices, and soil factors
(Allen et al. 1998). The only factors affecting ET0 are climatic parameters. Consequently, ETo
is a climatic parameter and can be computed from weather data (Kassam and Smith, 2001).
Relating ET to a specific surface provides a reference to which ET from other crop surfaces
can be related. It obviates the need to define a separate ET level for each crop and stage of
growth. ETo values measured or calculated at different locations or in different seasons are
comparable as they refer to the ET from the same reference surface.
17
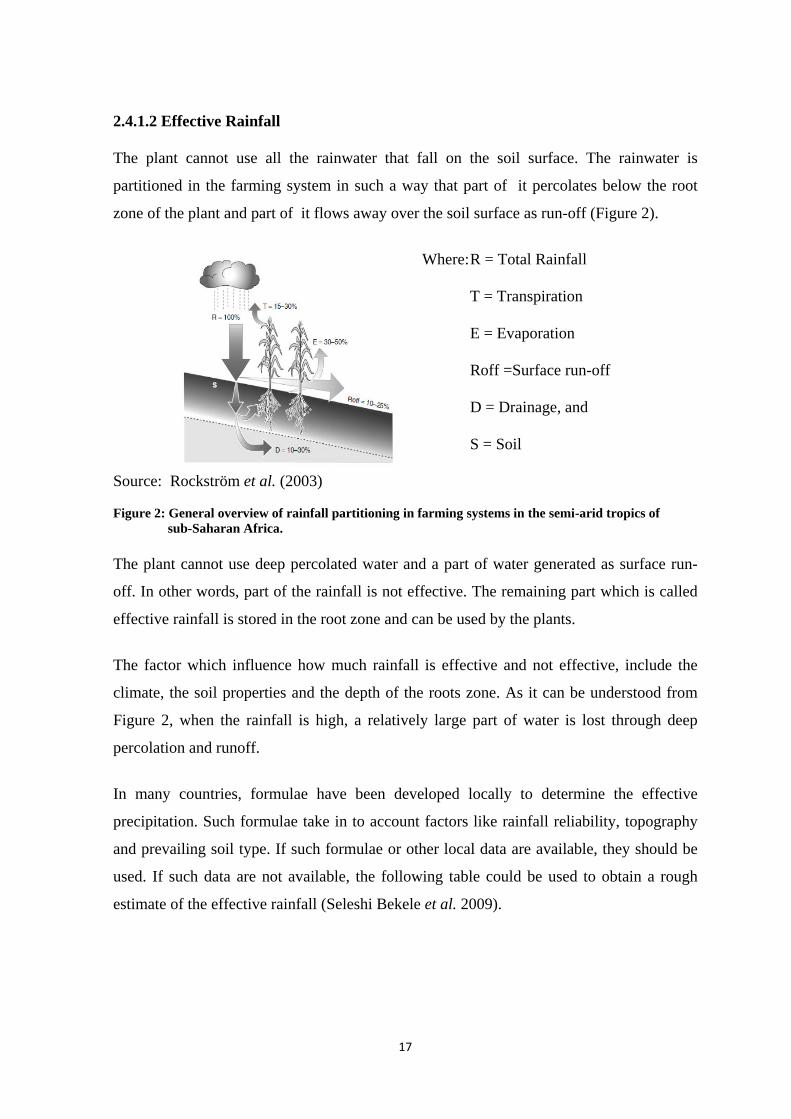
2.4.1.2 Effective Rainfall
The plant cannot use all the rainwater that fall on the soil surface. The rainwater is
partitioned in the farming system in such a way that part of it percolates below the root
zone of the plant and part of it flows away over the soil surface as run-off (Figure 2).
Where: R = Total Rainfall
T = Transpiration
E = Evaporation
Roff =Surface run-off
D = Drainage, and
S = Soil
Source: Rockström et al. (2003) Figure 2: General overview of rainfall partitioning in farming systems in the semi-arid tropics of
sub-Saharan Africa.
The plant cannot use deep percolated water and a part of water generated as surface run-
off. In other words, part of the rainfall is not effective. The remaining part which is called
effective rainfall is stored in the root zone and can be used by the plants.
The factor which influence how much rainfall is effective and not effective, include the
climate, the soil properties and the depth of the roots zone. As it can be understood from
Figure 2, when the rainfall is high, a relatively large part of water is lost through deep
percolation and runoff.
In many countries, formulae have been developed locally to determine the effective
precipitation. Such formulae take in to account factors like rainfall reliability, topography
and prevailing soil type. If such formulae or other local data are available, they should be
used. If such data are not available, the following table could be used to obtain a rough
estimate of the effective rainfall (Seleshi Bekele et al. 2009).
18
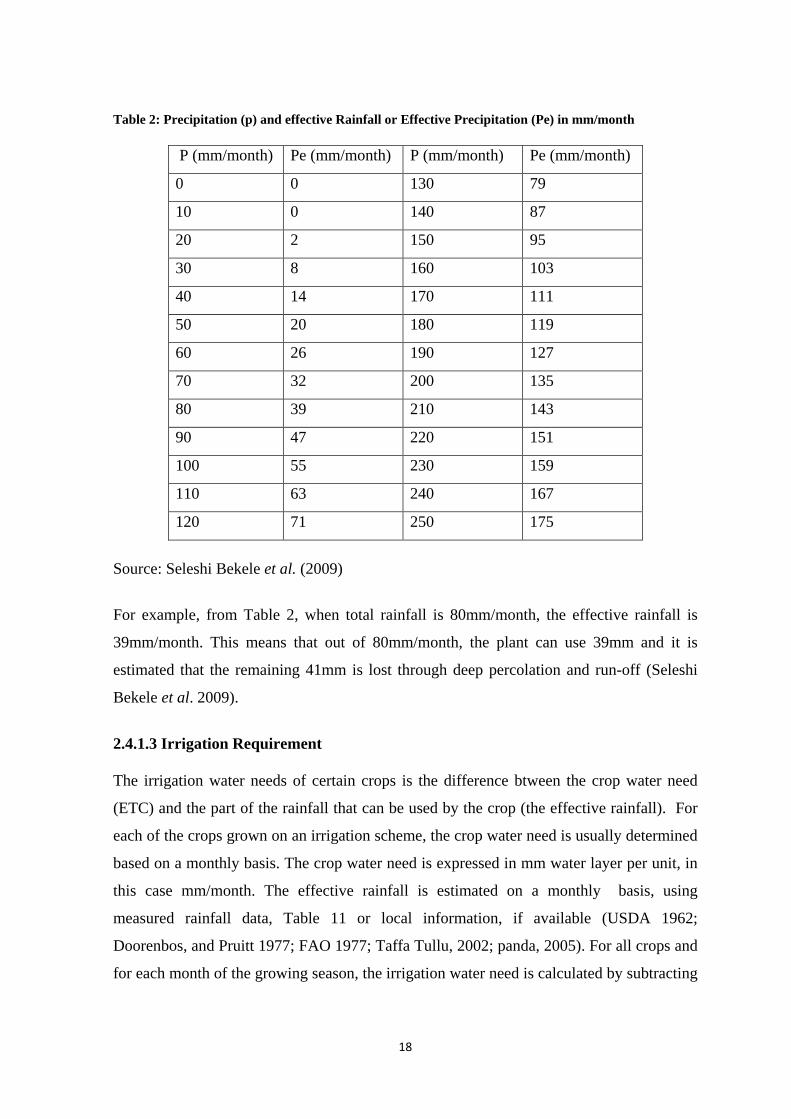
Table 2: Precipitation (p) and effective Rainfall or Effective Precipitation (Pe) in mm/month
P (mm/month) Pe (mm/month) P (mm/month) Pe (mm/month)
0 0 130 79
10 0 140 87
20 2 150 95
30 8 160 103
40 14 170 111
50 20 180 119
60 26 190 127
70 32 200 135
80 39 210 143
90 47 220 151
100 55 230 159
110 63 240 167
120 71 250 175
Source: Seleshi Bekele et al. (2009)
For example, from Table 2, when total rainfall is 80mm/month, the effective rainfall is
39mm/month. This means that out of 80mm/month, the plant can use 39mm and it is
estimated that the remaining 41mm is lost through deep percolation and run-off (Seleshi
Bekele et al. 2009).
2.4.1.3 Irrigation Requirement
The irrigation water needs of certain crops is the difference btween the crop water need
(ETC) and the part of the rainfall that can be used by the crop (the effective rainfall). For
each of the crops grown on an irrigation scheme, the crop water need is usually determined
based on a monthly basis. The crop water need is expressed in mm water layer per unit, in
this case mm/month. The effective rainfall is estimated on a monthly basis, using
measured rainfall data, Table 11 or local information, if available (USDA 1962;
Doorenbos, and Pruitt 1977; FAO 1977; Taffa Tullu, 2002; panda, 2005). For all crops and
for each month of the growing season, the irrigation water need is calculated by subtracting

19
the effective rainfall from the crop water need. Crop evapotranspiration (ETC) is also
called potential crop water need. Thus, in such areas, there is no need for supplemental
irrigation in the rain fed system and water is not a limiting factor for agricultural
production. Contrary to this, when the difference between crop water need and effective
rainfall is negative, there is no sufficient amount of rainfall to fulfill the crop water need.
Thus, there is rainwater scarcity and supplemental irrigation is required and hence, water is
a limiting factors for crop production (Seleshi Bakele et al. 2009).
20
3. MATERIALS AND METHODS
3.1 Descriptions of the Study Area
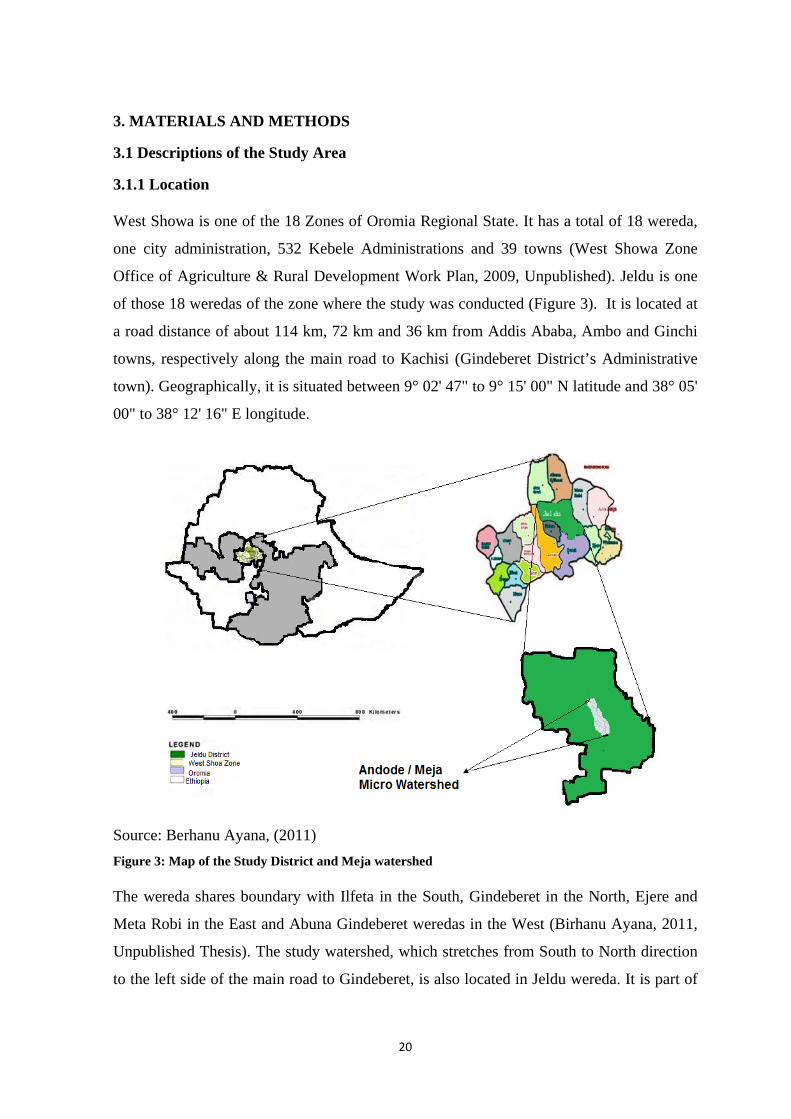
3.1.1 Location West Showa is one of the 18 Zones of Oromia Regional State. It has a total of 18 wereda,
one city administration, 532 Kebele Administrations and 39 towns (West Showa Zone
Office of Agriculture & Rural Development Work Plan, 2009, Unpublished). Jeldu is one
of those 18 weredas of the zone where the study was conducted (Figure 3). It is located at
a road distance of about 114 km, 72 km and 36 km from Addis Ababa, Ambo and Ginchi
towns, respectively along the main road to Kachisi (Gindeberet District’s Administrative
town). Geographically, it is situated between 9° 02' 47" to 9° 15' 00" N latitude and 38° 05'
00" to 38° 12' 16" E longitude.
Source: Berhanu Ayana, (2011) Figure 3: Map of the Study District and Meja watershed The wereda shares boundary with Ilfeta in the South, Gindeberet in the North, Ejere and
Meta Robi in the East and Abuna Gindeberet weredas in the West (Birhanu Ayana, 2011,
Unpublished Thesis). The study watershed, which stretches from South to North direction
to the left side of the main road to Gindeberet, is also located in Jeldu wereda. It is part of

21
the upper Blue Nile Basin and estimated to have an area of 92.6 Km2. Its altitude ranges
from 2,440 m - 3,200 m a.s.l (Zemadim et al. 2010).
3.1.2 Climate The wereda has a total area of 139,389 ha with variable agro ecology. It is characterized by
having undulating topographic feature. The altitude of the wereda ranges from 1800m to
3200m a.s.l which is predominantly highland. The area receives bimodal rainfall pattern
with short rainy season from March to April and main rainy season from June to
September. The mean annual rainfall varies from 1800 to 2200mm. The mean minimum
and maximum annual temperature ranges from 17oC to 22oC (JDOA, 2010, unpublished
report)
3.1.3 Geology and Soil
The geological history of the country indicates that central high lands of the Ethiopia were
primarily formed from the oldest pre-Cambrian rocks known as basement complex rocks
(Solomon Nigusie, 2006). The pre-Cambrian rock is overlaid by other rocks during the
subsequent geological processes of Mesozoic and Cenozoic eras. Hence, all soil types are
principally formed from these parent rocks.
3.1.4 Farming Systems, Crops Grown and Input Utilization Mixed crop-livestock farming system is the most common livelihood strategy in the study
area. Barley is the dominant crop cultivated followed by wheat, potato and enset (false
banana). Farmers used UREA, DAP, compost, farmyard manure, improved seeds, pesticide
and herbicides to threat soil fertility problem and enhance crop yield. Cattle, sheep and
equines were the dominant livestock species reared by farmers (Birhanu Ayana, 2011).
Small scale irrigation through traditional diversion of the major river is also common along
the dawn stream regions.
3.1.5 Land Use Land Cover Conditions
Arable land comprised 43.4%, grazing land 15.3%, plantation forest 3.9% and others
(barren degraded lands, buildings, grave yards, roads, etc) constitute 37.4% (ILRI, 2010,
Unpublished Survey Report). According to Birhanu Ayana (2011), farmland constituted
22
70.37%, grazing land 3.43%, plantation forest 24.26% and riverine forest/vegetation 1.94%
in 2010.
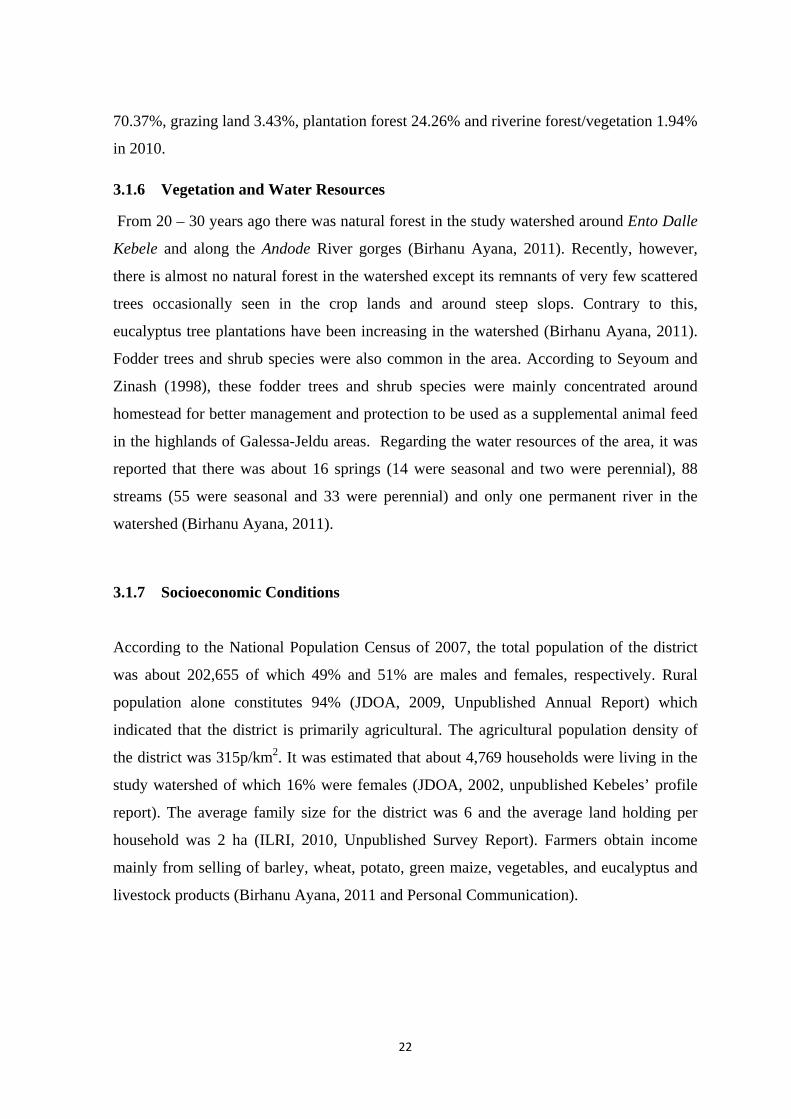
3.1.6 Vegetation and Water Resources
From 20 – 30 years ago there was natural forest in the study watershed around Ento Dalle
Kebele and along the Andode River gorges (Birhanu Ayana, 2011). Recently, however,
there is almost no natural forest in the watershed except its remnants of very few scattered
trees occasionally seen in the crop lands and around steep slops. Contrary to this,
eucalyptus tree plantations have been increasing in the watershed (Birhanu Ayana, 2011).
Fodder trees and shrub species were also common in the area. According to Seyoum and
Zinash (1998), these fodder trees and shrub species were mainly concentrated around
homestead for better management and protection to be used as a supplemental animal feed
in the highlands of Galessa-Jeldu areas. Regarding the water resources of the area, it was
reported that there was about 16 springs (14 were seasonal and two were perennial), 88
streams (55 were seasonal and 33 were perennial) and only one permanent river in the
watershed (Birhanu Ayana, 2011).
3.1.7 Socioeconomic Conditions
According to the National Population Census of 2007, the total population of the district
was about 202,655 of which 49% and 51% are males and females, respectively. Rural
population alone constitutes 94% (JDOA, 2009, Unpublished Annual Report) which
indicated that the district is primarily agricultural. The agricultural population density of
the district was 315p/km2. It was estimated that about 4,769 households were living in the
study watershed of which 16% were females (JDOA, 2002, unpublished Kebeles’ profile
report). The average family size for the district was 6 and the average land holding per
household was 2 ha (ILRI, 2010, Unpublished Survey Report). Farmers obtain income
mainly from selling of barley, wheat, potato, green maize, vegetables, and eucalyptus and
livestock products (Birhanu Ayana, 2011 and Personal Communication).
23
3.2 Study Design
3.2.1 Sources of Data and Data Collection Method Both primary and secondary data were required for the study. The primary data were
collected from the beginning of July 2011 to the end of February, 2012 through
preliminary household survey, field observation, field measurement, key informant
interview, personal communication and focus group discussion using semi-structured
questionnaires. Secondary data were collected from the district offices of agriculture and
office trade and industry.
3.2.2 Reconnaissance Survey The collection of secondary data from the district offices was the first task that was made
during the first week of July, 2011 in order to get base line information about agricultural
activities and related aspects of the district in general. Following this, a reconnaissance
survey was conducted within the same week in order to understand the site conditions and
to identify sampling sites. The study was basically conducted to identify major crops
(covering more than 70% of total arable land) cultivated by small holder farmers in
different landscape positions of Meja watershed under varying agronomic and management
practices.
3.2.2 Household Survey Preliminary household survey was made using semi-structured questionnaire to understand
the farming systems, crops management and agronomic practices implemented by the
smallholder farmers in the area during the second and third weeks of July, 2011. A total of
45 households (15 from each local landscape positions) were randomly selected for this
purpose and interviewed in person. Group discussion was also arranged with randomly
selected individuals of 10 – 15 model farmers, who best implemented improved crop
management practices and obtained better yield, during their time of meeting with
development agents.
24
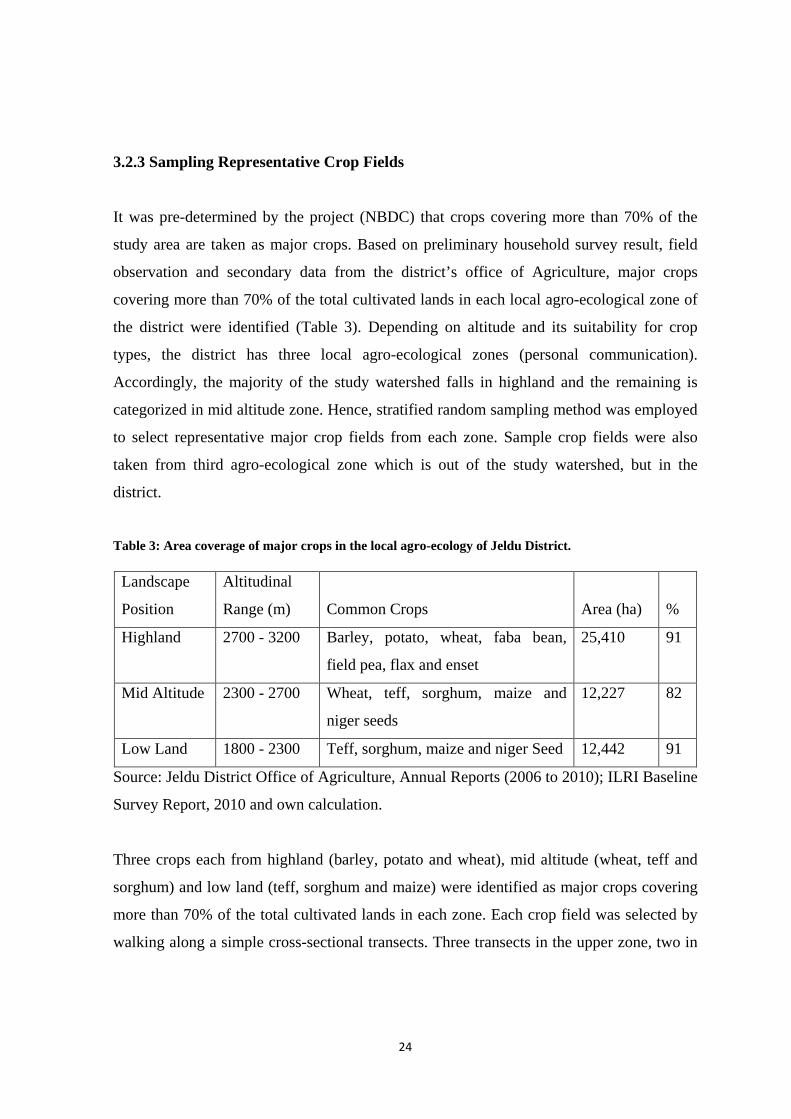
3.2.3 Sampling Representative Crop Fields It was pre-determined by the project (NBDC) that crops covering more than 70% of the
study area are taken as major crops. Based on preliminary household survey result, field
observation and secondary data from the district’s office of Agriculture, major crops
covering more than 70% of the total cultivated lands in each local agro-ecological zone of
the district were identified (Table 3). Depending on altitude and its suitability for crop
types, the district has three local agro-ecological zones (personal communication).
Accordingly, the majority of the study watershed falls in highland and the remaining is
categorized in mid altitude zone. Hence, stratified random sampling method was employed
to select representative major crop fields from each zone. Sample crop fields were also
taken from third agro-ecological zone which is out of the study watershed, but in the
district.
Table 3: Area coverage of major crops in the local agro-ecology of Jeldu District.
Landscape
Position
Altitudinal
Range (m)
Common Crops
Area (ha)
%
Highland 2700 - 3200 Barley, potato, wheat, faba bean,
field pea, flax and enset
25,410 91
Mid Altitude 2300 - 2700 Wheat, teff, sorghum, maize and
niger seeds
12,227 82
Low Land 1800 - 2300 Teff, sorghum, maize and niger Seed 12,442 91
Source: Jeldu District Office of Agriculture, Annual Reports (2006 to 2010); ILRI Baseline
Survey Report, 2010 and own calculation.
Three crops each from highland (barley, potato and wheat), mid altitude (wheat, teff and
sorghum) and low land (teff, sorghum and maize) were identified as major crops covering
more than 70% of the total cultivated lands in each zone. Each crop field was selected by
walking along a simple cross-sectional transects. Three transects in the upper zone, two in
25
each of the mid altitude and lower zone were made to select a total of 45 crop fields with
five replication of each crop.
3.2.4 Monitoring the Crop Fields and Data Recording The sampled crop fields were continuously monitored in 10 - 20 days intervals and detailed
data on crop management and agronomic practices including tillage frequency, planting
dates, seeding rates, types and rates of fertilizer applied, methods of sowing, method of
weeding, canopy cover estimates, date to flowering, date of maturity and harvesting date
were recorded.
3.2.5 Estimating Aboveground Biomass and Grain Yield Above ground biomass and grain yield were estimated using quadrate sampling technique
at the time of harvesting. The average of three quadrates was taken from each crop fields
so as to minimize sampling errors. For large grain cereals like maize and sorghum, 3 x 4 x
5 (right angle triangle) using measuring tape was applied instead of a metallic one meter
square quadrate. During the time of harvesting, above ground biomass within the quadrate
was harvested, total fresh weight was measured using a spring balance before threshing.
After threshing, the weight of the grain yield obtained from each quadrate was measured.
The average weight of grain and straw yields (fresh biomass) from the three quadrates was
taken as a representative sample for the entire field. In addition to this, the average plant
population density of large cereal crops (maize and sorghum) and potato was estimated by
counting the number of plants in the a quadrate while that of small cereals (wheat, barley
and teff) was estimated by counting the number of plants in a quarter of a quadrate (i. e.,
50 cm by 50 cm) during the time of harvesting. For the former crops it was easy to count
the plant population within the quadrate due to its big size and small numbers, for the later
crops (small cereals) however, it was very difficult to count the number of plants within a
quadrate due to its dense population, time taking, and tediousness.
26
3.2.5.1 Determination of Crop Dry Matter Representative samples of grain and straw collected from the field were brought to
laboratory and forced to dry in the oven at 65oC for 24 hours. It was primarily intended to
adjust the moisture content of the grain yield to 12% moisture (agronomic standard for
grain storage). However, it also helps to know whether the crop was harvested wet or dried
and to determine HI by dividing dry grain to dry biomass yields.
3.2.5.2 Local Price Estimation of Straw and Stover yields In order to determine above ground BMWP of each crop, it was necessary to estimate the
local market price of straw and stover. To attain this objective, an informal local market
survey was conducted during the time of harvesting. Personal discussion with
beneficiaries (buyers) in the open market, measuring weight of straw by using sacks and
taking price estimate was made for teff straw. Based on the result of teff, the price of wheat
and barley was made. In case of sorghum and maize, personal discussion was made with
sampled HHs and price estimate was made. According to the idea of the local farmers,
market price of straw and stover in the study area were governed by environmental benefit
(its use to maintain soil fertility) and economical benefit (building house, household energy
source, animal feed) and value gained by the sellers in the study area.
3.2.6 Determination of Soil Water Characteristics Surface soil samples (0 – 15 cm) were collected from the study watershed by IWMI. The
samples were collected from the study watershed across three cross-sectional transects
beginning from around the outlet and upward to the highland areas (Annex- 3) for the
purpose of its chemical analysis. The analysis was done in National soil laboratory, Addis
Ababa. Soil texture obtained from this data set was used for this study. Based on their
geographic coordinate points, the nearest point or average of the nearest points to the
sampled crop fields were considered to determine soil water characteristics using a
27
pedotransfer function (Saxton, 2006) with the soil-water characteristics calculator software
(Figure 4).
Figure 4: Soil water characteristics calculator software (USDA soil texture triangle) version
6.02.74, revised in 2012. From the results, total available moisture (mm/m), maximum rain infiltration rate
(mm/day) and initial soil moisture depletion (%) were used as input to the CROPWAT
model (Annex - 2) to simulate crop water requirement.
3.2.7 Simulating Crop Water Requirements and Water Use In order to compute the crop water requirement for each crop, CROPWAT model version
8.0 (2009) was used. It is a computer program developed for Water Resources
Development and Management Services of FAO based on the previous versions of 1992
and 1999 (FAO, 2009). It was mainly designed to calculate crop water requirements and
irrigation schedules based on climate data. The users can directly enter data into the
CROPWAT model or import from other sources like New_LocClim (Figure 6) model
(ibid). The required input parameters for the CROPWAT model include: ETO/climate, total
rainfall, crops and soil characteristics of the study area (Figure 5).
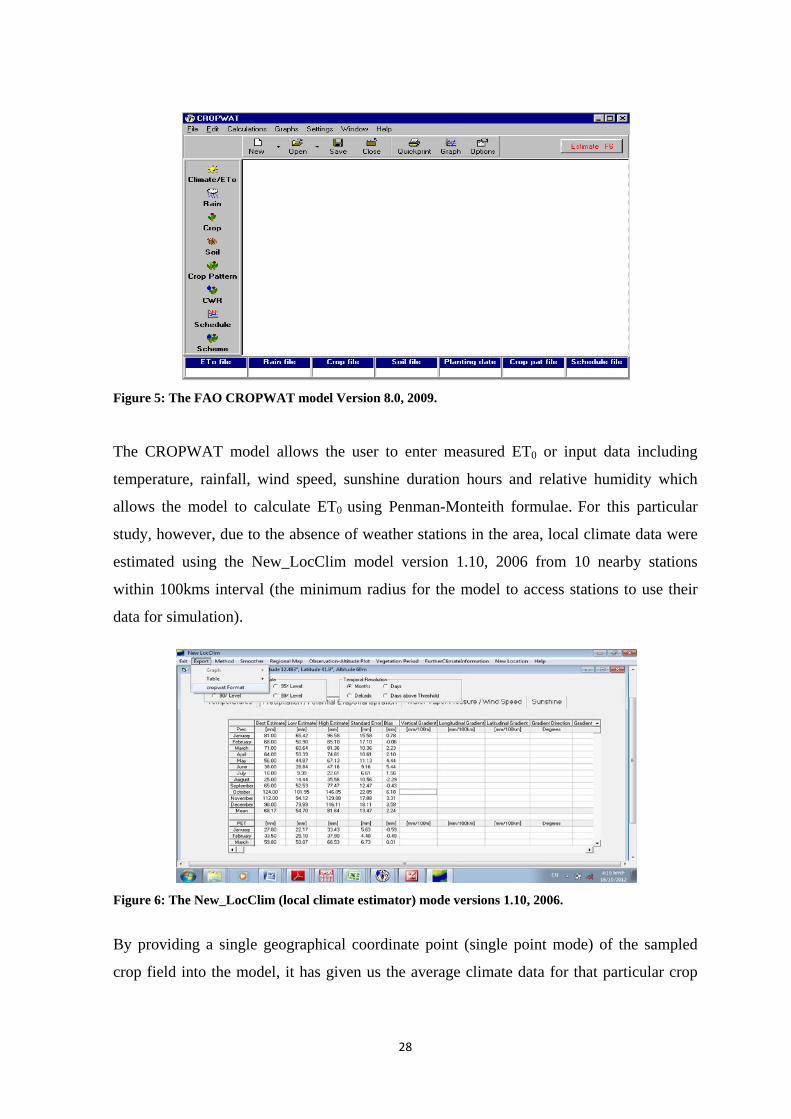
28
Figure 5: The FAO CROPWAT model Version 8.0, 2009. The CROPWAT model allows the user to enter measured ET0 or input data including
temperature, rainfall, wind speed, sunshine duration hours and relative humidity which
allows the model to calculate ET0 using Penman-Monteith formulae. For this particular
study, however, due to the absence of weather stations in the area, local climate data were
estimated using the New_LocClim model version 1.10, 2006 from 10 nearby stations
within 100kms interval (the minimum radius for the model to access stations to use their
data for simulation).
Figure 6: The New_LocClim (local climate estimator) mode versions 1.10, 2006.
By providing a single geographical coordinate point (single point mode) of the sampled
crop field into the model, it has given us the average climate data for that particular crop
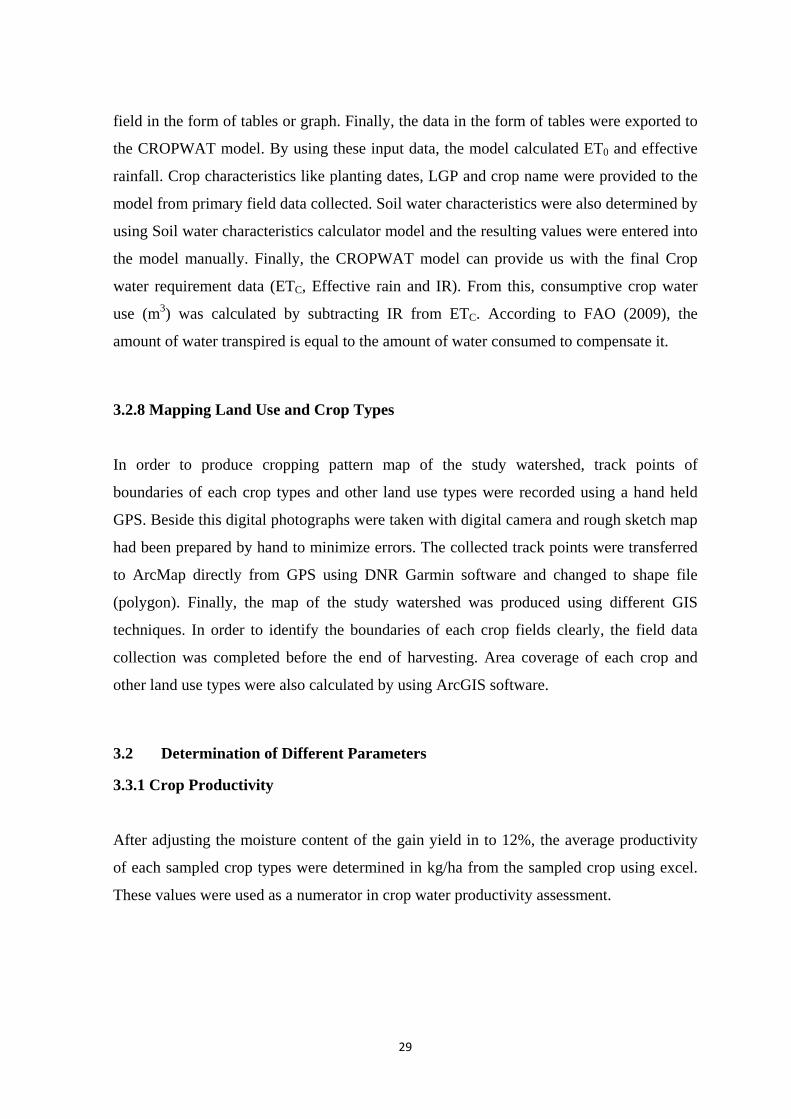
29
field in the form of tables or graph. Finally, the data in the form of tables were exported to
the CROPWAT model. By using these input data, the model calculated ET0 and effective
rainfall. Crop characteristics like planting dates, LGP and crop name were provided to the
model from primary field data collected. Soil water characteristics were also determined by
using Soil water characteristics calculator model and the resulting values were entered into
the model manually. Finally, the CROPWAT model can provide us with the final Crop
water requirement data (ETC, Effective rain and IR). From this, consumptive crop water
use (m3) was calculated by subtracting IR from ETC. According to FAO (2009), the
amount of water transpired is equal to the amount of water consumed to compensate it.
3.2.8 Mapping Land Use and Crop Types In order to produce cropping pattern map of the study watershed, track points of
boundaries of each crop types and other land use types were recorded using a hand held
GPS. Beside this digital photographs were taken with digital camera and rough sketch map
had been prepared by hand to minimize errors. The collected track points were transferred
to ArcMap directly from GPS using DNR Garmin software and changed to shape file
(polygon). Finally, the map of the study watershed was produced using different GIS
techniques. In order to identify the boundaries of each crop fields clearly, the field data
collection was completed before the end of harvesting. Area coverage of each crop and
other land use types were also calculated by using ArcGIS software.
3.2 Determination of Different Parameters
3.3.1 Crop Productivity After adjusting the moisture content of the gain yield in to 12%, the average productivity
of each sampled crop types were determined in kg/ha from the sampled crop using excel.
These values were used as a numerator in crop water productivity assessment.
30
3.3.2 Actual Crop Water Use/ Consumptive Water Use
Rainfed crops use infiltrated rainfall that forms soil moisture in the root zone. This
accounts for most of the crop water consumption in agriculture (Singh et al. 2011). Hence,
consumptive crop water use by each crop was determined using the following formula:
♣ CW = ETC – IR, where CW refers to the amount of water consumed by the crop,
ETC represents potential crop evapotranspiration (m3) and IR represents irrigation
requirement (m3).
Both IR and ETC were determined by the CROPWAT model. The model determined ETC
as a product of kC and ET0.
3.3.3 Determination of Crop Water Productivity
In the study, both physical and economic water productivity with respect to consumptive
crop water use were determined for further analysis. The procedures employed for each of
them were described below.
3.3.3.1 Physical Crop Water Productivity
Physical crop water productivity is the ratio of the mass of agricultural output (in kg ha-1 or
ton ha-1) to the amount of water used in m3 (Steduto et al. 2007). The following formula
was used to calculate physical crop water productivity:
♣ WP of GY or TY = Grain Yield or Tuber Yield (kg/ha) ÷[ETC – IR (m3)] = GY or
TY (kg/ha) ÷ CW (m3).
♣ WP of SY = Straw Yield (kg/ha) ÷ [ETC – IR(m3)]=SY(kg/ha)÷CW (m3)
Where WP, GY, TY, SY refer to Water productivity, grain yield, tuber yield and straw
yield, respectively.
31
3.3.3.2 Economic Crop Water Productivity
Economic crop water productivity refers to the economic value derived per unit of water
used (economic return or nutrition, any other economic and social benefits). In agronomic
context it refers to the economic return in Ethiopian Birr (ETB)/m3 or USD/m3 (Steduto et
al. 2007). Similarly, the economic WP of each sampled crop was analyzed by using the
following formula:
♣ EWP of Grain (ETB/m3) = GY (ETB) ÷ CW (m3) . . . . . . . . . . . . . . (a)
♣ EWP of Straw (ETB/m3) = SY (ETB) ÷ CW (m3) . . . . . . . . . . . . . . (b)
♣ TEWP of above ground biomass (ETB/m3) = a + b . . . . . . . . . . . . . (c)
Where EWP denotes economic water productivity and TEWP represents total economic
water productivity.
3.3.4 Data Analysis
i. Comparison of Means: In order to test whether there is significant difference between mean biomass water
productivity (BMWP) of the major crops among the three agro-ecological zones,
comparison of means was employed. The null hypotheses for such a test would be: HO: x1
= x2 = x3 = … = xk where x1 to xk represent sample means of the 1 to k groups (Storck., et
al., 1991), and the most appropriate statistical technique to test such hypothesis is the
analysis of variance (Norusis, 1987). Analysis of variance is used to examine the degree of
variability in the mean biomass water productivity results. Based on the variability, some
conclusions about the means were drawn. Again, the one_way analysis of variance
(multiple comparisons) was also used to justify the differences among mean biomass water
productivity magnitudes of the major crops with respect to each local agro-ecology. The F-
statistics used is:
F =Betweengroups means square
Withingroup means square
F =∑(ni (Xj−X)2
k−1
∑∑( Xij − Xj)2/ N − k
32
ii. Pearson’s Correlation:
Among several factors that could affect crop water productivity in the study watershed,
minor factors like UREA and DAP application rates, seeding rate and tillage frequency
were considered to test their degree of association with biomass water productivity of the
major crops. The Pearson’s correlation analysis was employed to verify the existence of
relationships between the selected four crops management practices and biomass water
productivity of the major crops across the three local agro-ecological zones by using SAS
software version 9.2 (2008). From the values of the calculated correlation coefficients and
level of significance, the possible effects of the four management practices on BMWP of
each crops was presumed.
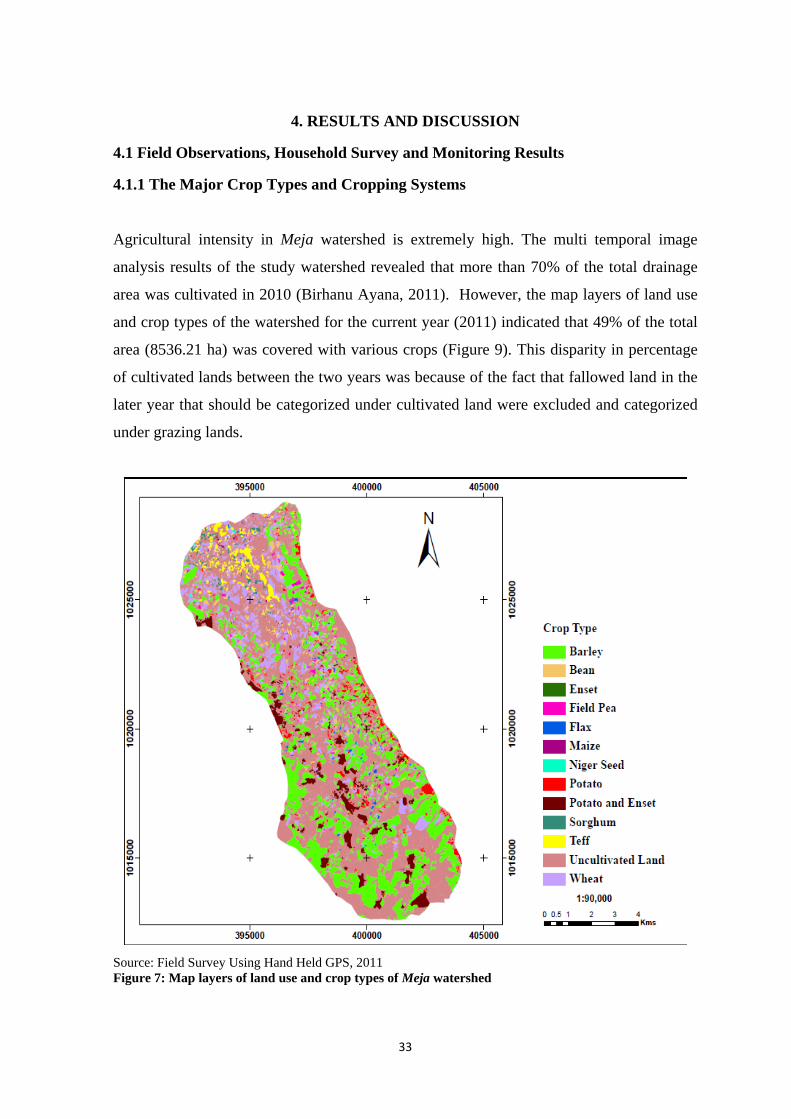
33
4. RESULTS AND DISCUSSION
4.1 Field Observations, Household Survey and Monitoring Results
4.1.1 The Major Crop Types and Cropping Systems Agricultural intensity in Meja watershed is extremely high. The multi temporal image
analysis results of the study watershed revealed that more than 70% of the total drainage
area was cultivated in 2010 (Birhanu Ayana, 2011). However, the map layers of land use
and crop types of the watershed for the current year (2011) indicated that 49% of the total
area (8536.21 ha) was covered with various crops (Figure 9). This disparity in percentage
of cultivated lands between the two years was because of the fact that fallowed land in the
later year that should be categorized under cultivated land were excluded and categorized
under grazing lands.
Source: Field Survey Using Hand Held GPS, 2011 Figure 7: Map layers of land use and crop types of Meja watershed
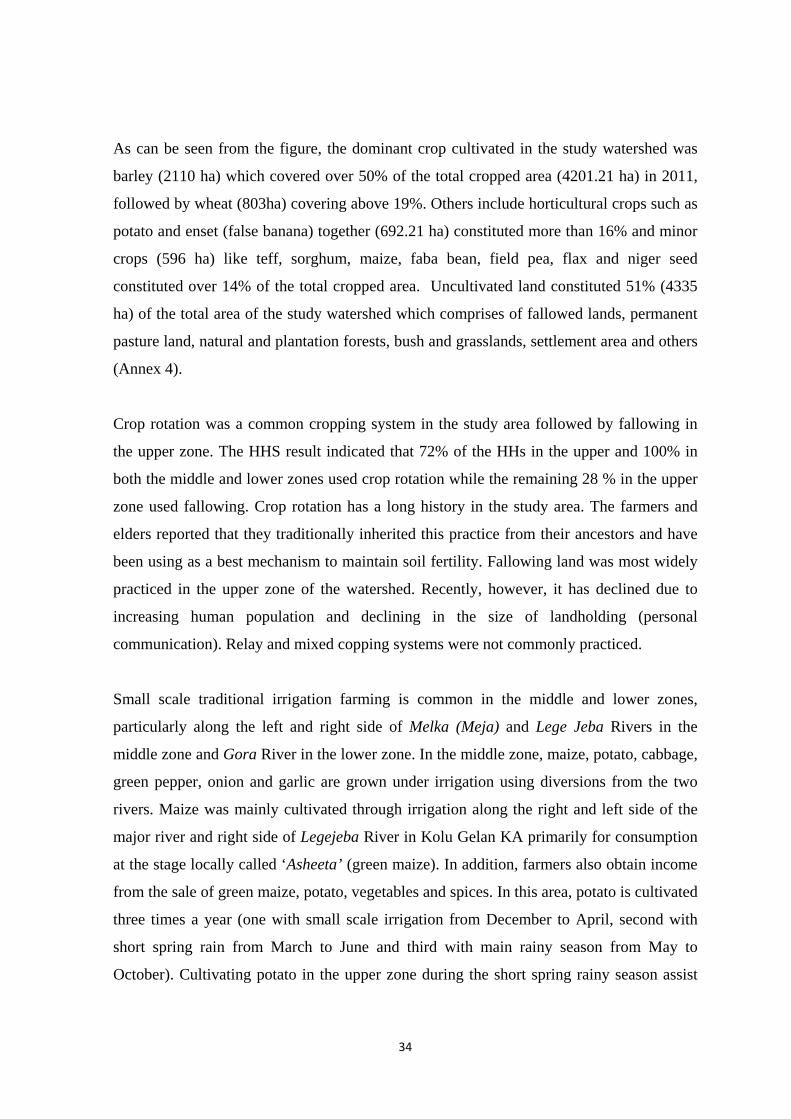
34
As can be seen from the figure, the dominant crop cultivated in the study watershed was
barley (2110 ha) which covered over 50% of the total cropped area (4201.21 ha) in 2011,
followed by wheat (803ha) covering above 19%. Others include horticultural crops such as
potato and enset (false banana) together (692.21 ha) constituted more than 16% and minor
crops (596 ha) like teff, sorghum, maize, faba bean, field pea, flax and niger seed
constituted over 14% of the total cropped area. Uncultivated land constituted 51% (4335
ha) of the total area of the study watershed which comprises of fallowed lands, permanent
pasture land, natural and plantation forests, bush and grasslands, settlement area and others
(Annex 4).
Crop rotation was a common cropping system in the study area followed by fallowing in
the upper zone. The HHS result indicated that 72% of the HHs in the upper and 100% in
both the middle and lower zones used crop rotation while the remaining 28 % in the upper
zone used fallowing. Crop rotation has a long history in the study area. The farmers and
elders reported that they traditionally inherited this practice from their ancestors and have
been using as a best mechanism to maintain soil fertility. Fallowing land was most widely
practiced in the upper zone of the watershed. Recently, however, it has declined due to
increasing human population and declining in the size of landholding (personal
communication). Relay and mixed copping systems were not commonly practiced.
Small scale traditional irrigation farming is common in the middle and lower zones,
particularly along the left and right side of Melka (Meja) and Lege Jeba Rivers in the
middle zone and Gora River in the lower zone. In the middle zone, maize, potato, cabbage,
green pepper, onion and garlic are grown under irrigation using diversions from the two
rivers. Maize was mainly cultivated through irrigation along the right and left side of the
major river and right side of Legejeba River in Kolu Gelan KA primarily for consumption
at the stage locally called ‘Asheeta’ (green maize). In addition, farmers also obtain income
from the sale of green maize, potato, vegetables and spices. In this area, potato is cultivated
three times a year (one with small scale irrigation from December to April, second with
short spring rain from March to June and third with main rainy season from May to
October). Cultivating potato in the upper zone during the short spring rainy season assist

35
the farmers to overcome the problem of food shortage during the main cropping season
(life savior), when they used almost all of their stocks for seeds.
Traditional diversion for irrigation is common also in Gora Lalisa KA along Gora River.
Maize, onion, garlic, cabbage, green pepper and tomato are the major crops grown in the
schemes. Maize is usually cultivated twice a year. In the year 2011, large area of land was
covered by irrigated maize.
There were two teff cropping systems in this area. One was the cultivation of teff within
the normal planting period in July. The second was cultivation of teff immediately after
harvesting maize in August. This type of teff cropping system involves planting after only
one tillage operation on a farm land with moist and soften soils. Because of the late plating,
it requires supplemental irrigation in the rainfed system. Normally, after mid-September
shortage of rainfall is expected. Hence, farmers started applying the river water to irrigate
this teff crop land in September till it reached its physiological maturity. Apart from this,
when the fertility level of the soil is poor, the local farmers cultivated chick pea after
harvesting maize instead of teff. They also applied irrigation water to moist the soil before
cultivating chick pea so as to assist its germination. Small scale sugarcane plantation
through irrigation was also observed in the area.
4.1.2 The Crop Management and Agronomic Practices
4.1.2.1 Crop Rotation An important aspect of studying the crop rotation pattern was to determine which crop is
changed to the other on a given plot of land at a certain time interval(s). This helps us
forecast the impact of precursor crop(s) on soil quality and the productivity of the current
crop. Crop rotation practice is essential in sustainable agriculture (Crookston, 1984). The
properly implemented rotation system will have several benefits for crop production. Crop
rotation was practiced mainly for the purpose of disease control, improve soil tilth, reduce
soil erosion and control serious weeds (Santos et al. 1993; Ball, 1992; Derksen et al. 1993;
Blackshw et al. 1994). Length of the rotation pattern depends on the fertility level of the
36
soil (personal communication). That means, the more fertile the soil is the longer the
rotation pattern and vice versa. The crop rotation cycle varies across agro-ecology which
determines the type of crops to be cultivated. According to Hailu and Van Luer (1996),
barley mainly grows from 1,950 m to 3,000m asl in Ethiopia. Potato is best suited above
1800m. Similarly, wheat grows from 1,800 to 2,900 m asl in East Africa (FAO, 1986).
4.1.2.1.1 Crop Rotation Pattern in the Upper Zone
In the upper zone of the study watershed barley, potato and wheat were the dominant crops
that covered 68%, 17% and 8%, respectively of the total cultivated land of the sampled
HHs in the year 2011(Table 4). A field observation by the investigator in 2011 confirmed
that the major part of the cropped land in the upper zone was covered by barley but, seems
to be followed by wheat than potato. According to the average of the five consecutive
years’ report of the district’s office of Agriculture, the area covered with wheat was almost
comparable to barley, but recently started declining in area coverage due to frequent frost
damage. Recent study in the watershed (Birhanu Ayana, 2011) and experience of the local
farmers indicated that barley-wheat rotation was a common cropping system in the upper
zone of the watershed and all the highland areas of the district in general mixed with bean,
peas, potato and flax in between the system. However, HHS result revealed that the
rotation pattern is changing. In the year 2010, the major portion of cultivated land of the
sampled HHs was fallowed (28%) followed by potato (27%) and barley (26%). However,
in 2011, barley alone coved 68% of the total cultivated land. Similarly, in the coming year
(2012) 46.76% of those cultivated land was expected to be fallowed. The same pattern
repeats itself a year after next year (2013) and so on. From this, it can be concluded that
Barley=>Fallow=>Barley is the dominant cropping system in the upper zone. Thus,
farmers used rotation of legumes with cereal crops randomly. However, when cereal crops
rotated with legumes, it maintains soil fertility with the addition of nitrogen in to the soil
and could significantly increase yield (Santos et al. 1993; Hesternman et al. 1987; Baldock
et al. 1981). Therefore, crop rotation system used by the local farmers here was not
appropriate and needs to be changed.
37
4.1.2.1.2 Crop Rotation Pattern in the Middle Zone
Wheat, teff and sorghum were the dominant crops which together covered 86% of the total
cultivated land of the sampled HHs in the year 2011. In 2011, wheat covered 39% of the
cultivated land of the sampled HHs. In 2010, teff covered 48% of those cultivated land. In
the year 2012, wheat is expected to cover 54% of the crop lands. From this, it can be
concluded that in the middle zone of the watershed, wheat is rotated with teff every year
and most probably the total area that was covered with wheat in the year 2012 will be
changed to teff in the year 2013 and vice versa. Thus, the pattern could be Wheat => Teff
=> Wheat which needs change.
4.1.2.1.3 Crop Rotation Pattern in the Lower Zone
According to the local classification system, Gora Lalisa KA is categorized under the
lower agro-ecological zone of the district with its altitude ranging from about 1950 to
2300m asl. Teff, sorghum and maize were major crops which together constituted 95% of
the total cultivated land of the sampled HHs in the year 2011. Tef is the dominant crop
covering 61% of the total cultivated land of the sampled HHs. In the next year (2012) 58%
of the same crop lands are expected to be covered with sorghum. Similarly, in the year
2010, 58.16% of these lands were under sorghum. From this, it can be concluded that Teff
=> Sorghum/Maize rotation every year was a common cropping system using legumes in
the system. Unpublished survey report made by ILRI in 2010 also agreed with this result.
However, farmers and development agents reported a frequent failure of sorghum in recent
years due to unreliability of spring rainfall, which was the case during the year 2011 as all
the farmers interviewed gave reported. Usually, teff or legumes like check pea and grass
pea rotated in between maize and sorghum. Because of the above problem, most farmers
were forced to grow tef instead of sorghum during the main cropping season.
Consequently, it was estimated that teff covered more than 70% of the cultivated land in
year 2011. This led to repetitive cultivation of teff on the same plot each year. Farmers fear
that such trend may lead to prevalence of diseases, nutrient depletion, wide spread weed
infestation and declining yield.

38
4.1.2.2 Tillage, Fertilizer and Seeding Rates Proper tillage practices increase infiltration, reduce soil evaporation, enhanced root
penetration and extraction of water and nutrients from the soil profile leading to increased
productivity and high water use efficiency (Singh et al. 2011). However, more aggressive
and frequent tillage also damages the soil texture, macro porosity and reduces rainwater
infiltration in to the soil through the effect on hydraulic conductivity (Hatfield et al. 2001).
The frequency of tillage in the study area was high which depend on the type of the
previous land use and crop types to be cultivated. For example, when the land to be
cultivated was fallowed for one or more years, it requires more frequent tillage. Farmers
often till the fallow land once before the end of the rainy season and keep it fallow to
repeat the tillage next season when the rain starts. When the precursor crop was potato, less
frequent tillage would be done regardless of the crop type to be grown because the farmers
applied deep tillage to harvest potato tubers and the field remains tilled up to the onset of
next rainy season (Figure 14). Table 4 shows tillage frequency, fertilizers rate and seeding
rate applied on major crop fields monitored in the upper zone.
Table 4: Tillage frequency, fertilizer and seeding rates in the upper zone.
Management Practice
Crop Types
Barley Wheat Potato
Tillage Frequency 3.80 3.60 3.80
Fertilizers rate:
DAP (kg/ha)
UREA (kg/ha)
84
85
321
0 15 177
Seeding Rates (kg/ha) 218 162 2645
Source: HHS and Field observation, 2011.
Most of barley, wheat and potato fields monitored were cultivated 3 to 4 times before
planting. Barley and wheat were sown by hand broadcast method approximately at average
rate 218kg/ha and 162 kg/ha, respectively. Fertilizers were applied to the crops field at an
average rate of DAP 84kg/ha in case of barley; DAP 85kg/ha, UREA 15kg/ha and DAP
92kg/ha, UREA 59kg/ha (Table 5) for wheat both in the upper and middle zones,
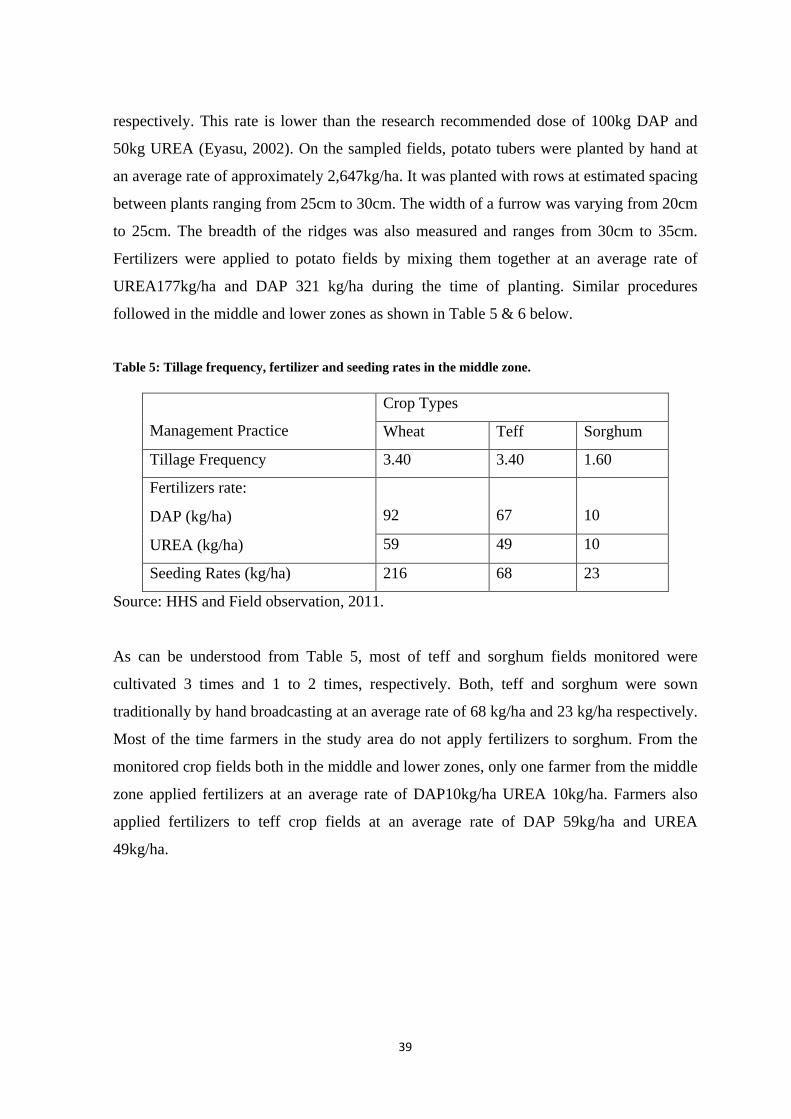
39
respectively. This rate is lower than the research recommended dose of 100kg DAP and
50kg UREA (Eyasu, 2002). On the sampled fields, potato tubers were planted by hand at
an average rate of approximately 2,647kg/ha. It was planted with rows at estimated spacing
between plants ranging from 25cm to 30cm. The width of a furrow was varying from 20cm
to 25cm. The breadth of the ridges was also measured and ranges from 30cm to 35cm.
Fertilizers were applied to potato fields by mixing them together at an average rate of
UREA177kg/ha and DAP 321 kg/ha during the time of planting. Similar procedures
followed in the middle and lower zones as shown in Table 5 & 6 below.
Table 5: Tillage frequency, fertilizer and seeding rates in the middle zone.
Management Practice
Crop Types
Wheat Teff Sorghum
Tillage Frequency 3.40 3.40 1.60
Fertilizers rate:
DAP (kg/ha)
UREA (kg/ha)
92
67
10
59 49 10
Seeding Rates (kg/ha) 216 68 23
Source: HHS and Field observation, 2011.
As can be understood from Table 5, most of teff and sorghum fields monitored were
cultivated 3 times and 1 to 2 times, respectively. Both, teff and sorghum were sown
traditionally by hand broadcasting at an average rate of 68 kg/ha and 23 kg/ha respectively.
Most of the time farmers in the study area do not apply fertilizers to sorghum. From the
monitored crop fields both in the middle and lower zones, only one farmer from the middle
zone applied fertilizers at an average rate of DAP10kg/ha UREA 10kg/ha. Farmers also
applied fertilizers to teff crop fields at an average rate of DAP 59kg/ha and UREA
49kg/ha.
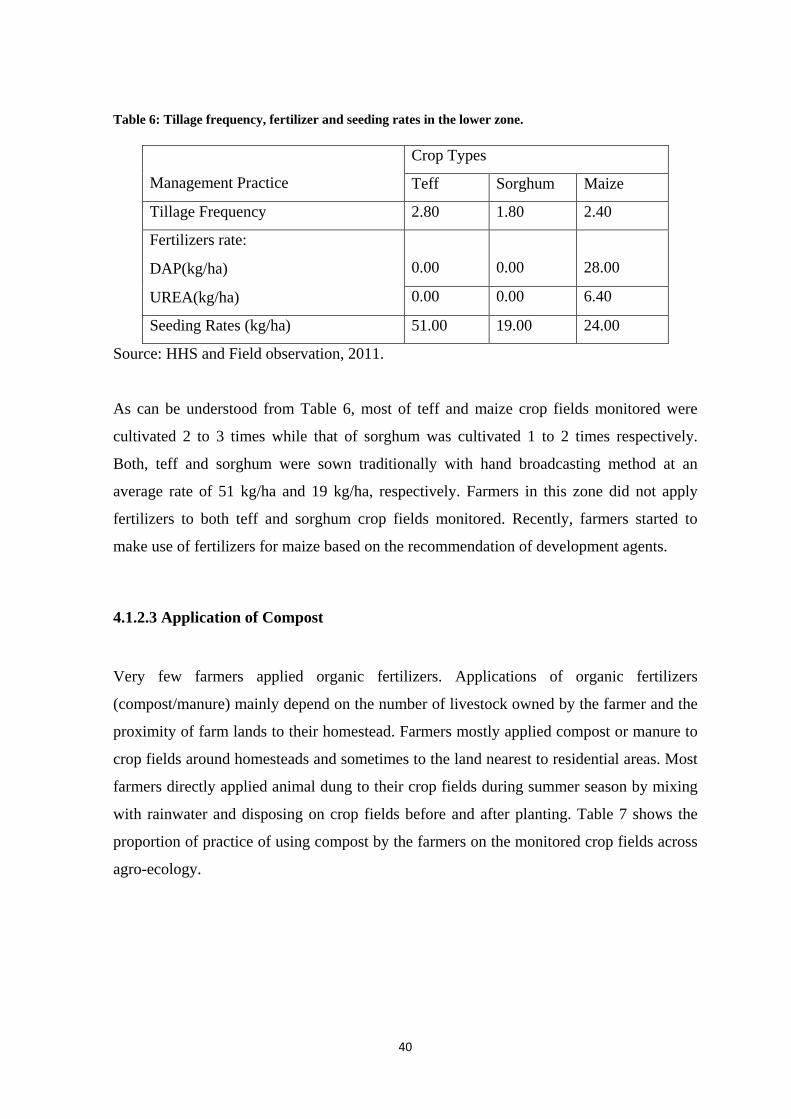
40
Table 6: Tillage frequency, fertilizer and seeding rates in the lower zone.
Management Practice
Crop Types
Teff Sorghum Maize
Tillage Frequency 2.80 1.80 2.40
Fertilizers rate:
DAP(kg/ha)
UREA(kg/ha)
0.00
0.00
28.00
0.00 0.00 6.40
Seeding Rates (kg/ha) 51.00 19.00 24.00
Source: HHS and Field observation, 2011.
As can be understood from Table 6, most of teff and maize crop fields monitored were
cultivated 2 to 3 times while that of sorghum was cultivated 1 to 2 times respectively.
Both, teff and sorghum were sown traditionally with hand broadcasting method at an
average rate of 51 kg/ha and 19 kg/ha, respectively. Farmers in this zone did not apply
fertilizers to both teff and sorghum crop fields monitored. Recently, farmers started to
make use of fertilizers for maize based on the recommendation of development agents.
4.1.2.3 Application of Compost Very few farmers applied organic fertilizers. Applications of organic fertilizers
(compost/manure) mainly depend on the number of livestock owned by the farmer and the
proximity of farm lands to their homestead. Farmers mostly applied compost or manure to
crop fields around homesteads and sometimes to the land nearest to residential areas. Most
farmers directly applied animal dung to their crop fields during summer season by mixing
with rainwater and disposing on crop fields before and after planting. Table 7 shows the
proportion of practice of using compost by the farmers on the monitored crop fields across
agro-ecology.

41
Table 7: Proportion of compost application per crop fields (%) for different agro-ecology
Agro-
ecology
Application of compost per crop types (%)
Barley wheat potato teff sorghum maize
Upper - 20% 40% - - -
Middle - 20% - 0% 0% -
Lower - - - 0% 0% 40%
Source: HHS, 2011.
The Table demonstrated that the practice of using compost was very low in the study area.
Farmers applied on 20% of wheat crop fields monitored both in the upper and middle
zones where as on 40% of sampled potato and maize crops fields in the upper and lower
zones, respectively. Generally, only on 13% of the total sampled crop fields that compost
was applied by the farmers. Some of the possible reasons include the use of animal dung
for household energy (Figure 8) and distant location of farm lands from residential area
and lack of awareness (Berhanu Ayana, 2011).
Figure 8: The uses of animal dung for household energy sources, in Chilanko KA.
4.1.2.4 Major Crop Types, Cultivar and Variety
Barley was the leading crop cultivated by most farmers in the district (Figure 10) and on
the upper zone of the study watershed (Table 2) approximately above an altitude of 2700m.
Three cultivars were commonly cultivated in the area. These were namely malt barley
single and double, locally called ‘garbuu biiraa naxalaa and dirribii’, black barley single
and double locally called ballami naxalaa and dirribii and ‘senef kolo’. Malt barley and

42
ballami are improved varieties while senef kollo is a local variety. All of them required
almost comparable management systems. Malt barley was the most widely cultivated
cultivar in the district in general and in study watershed in particular (Figure 9).
Figure 9: Malt barley sampled from the upper zone, Chilanko KA Farmers prefer malt barley because it is more productive, has higher market demand and
suitable to make ‘Enjera’.
Wheat was the second cereal crop cultivated by the local farmers next to barley in the
upper and lower zones of the study district (Figure 10) above an altitude of about 2300m. It
was a dominant crop cultivated followed by teff in the middle zone of the watershed. Here,
about 39% of the sampled HHs’ land was allocated to wheat in the year 2011. The past five
consecutive year’s reports by the district office of agriculture indicated that wheat
remained the second cultivated in the district in terms of area coverage (Figure 10).

43
Source: Jeldu District Office of Agriculture Annual Reports, Unpublished, 2006 – 10. Figure 10: Five years’ average crops area coverage (%) of the district (2006-10). Recently however, cultivation of wheat is diminishing in the upper part of the district due
to the frequent frost damage. Both improved and local varieties were cultivated by the
local farmers mostly in the middle zone of the watershed. The most widely cultivated
wheat cultivars in the study watershed include galema, digalu, dashen, roma/selato, and
dejameta. Among these, galema and dashen were the most common in the watershed.
Roma/selato was cultivated mostly in the middle zone of the watershed. Only few model
farmers are trying digalu which was newly introduced to the area. During the time of this
particular research work, it was observed that potato was the second major crop covering
extensive area of land in the upper zone of the study watershed next to barley. It was best
cultivated above an altitude of 2500masl. There were more than three improved potato
varieties in the study area (Gudane, Jalane, Menagesha). Gudane was the most widely
cultivated one for its high productivity, disease resistance and good taste (Figure 11). The
farmers could get high quantity (50 to 60 ton/ha) of tuber from small plot of land. Chilanko
KA was a well known and leading producer of potato in the study area. Others include
Edensa Gelan, Kolu Gelan, Tullu Bultuma and Tullu Gurra KAs which were also known
for their high potato production.
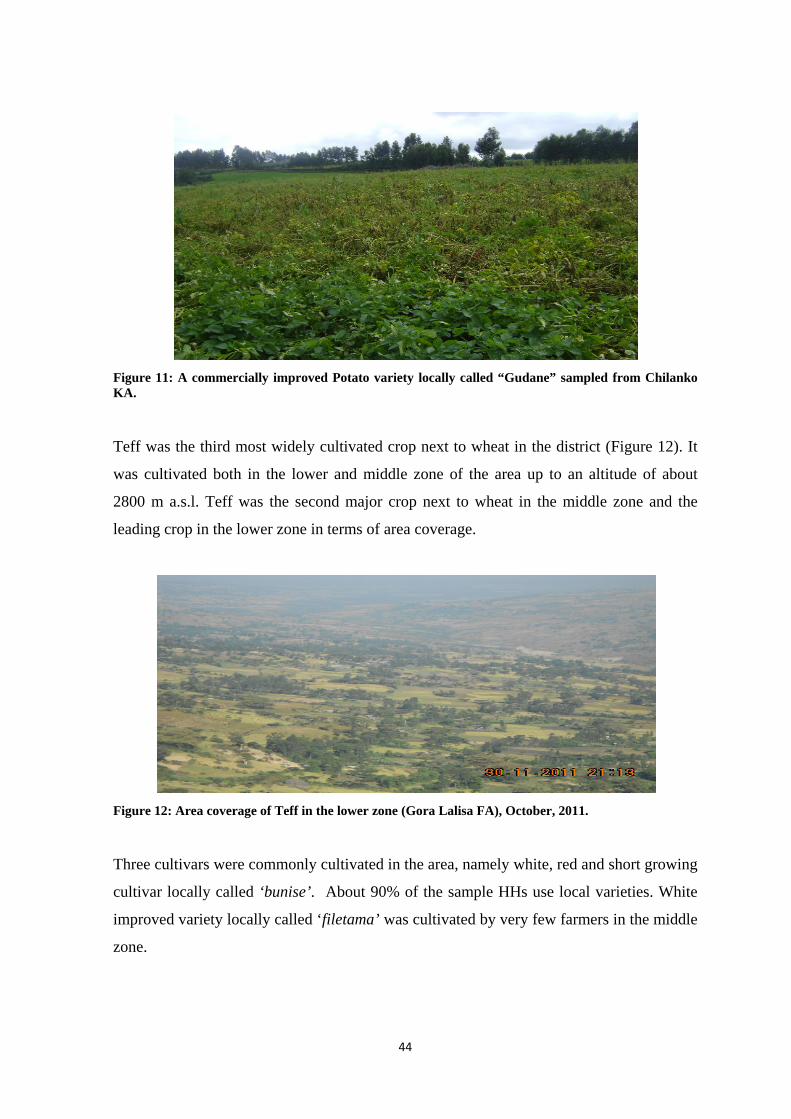
44
Figure 11: A commercially improved Potato variety locally called “Gudane” sampled from Chilanko KA. Teff was the third most widely cultivated crop next to wheat in the district (Figure 12). It
was cultivated both in the lower and middle zone of the area up to an altitude of about
2800 m a.s.l. Teff was the second major crop next to wheat in the middle zone and the
leading crop in the lower zone in terms of area coverage.
Figure 12: Area coverage of Teff in the lower zone (Gora Lalisa FA), October, 2011. Three cultivars were commonly cultivated in the area, namely white, red and short growing
cultivar locally called ‘bunise’. About 90% of the sample HHs use local varieties. White
improved variety locally called ‘filetama’ was cultivated by very few farmers in the middle
zone.
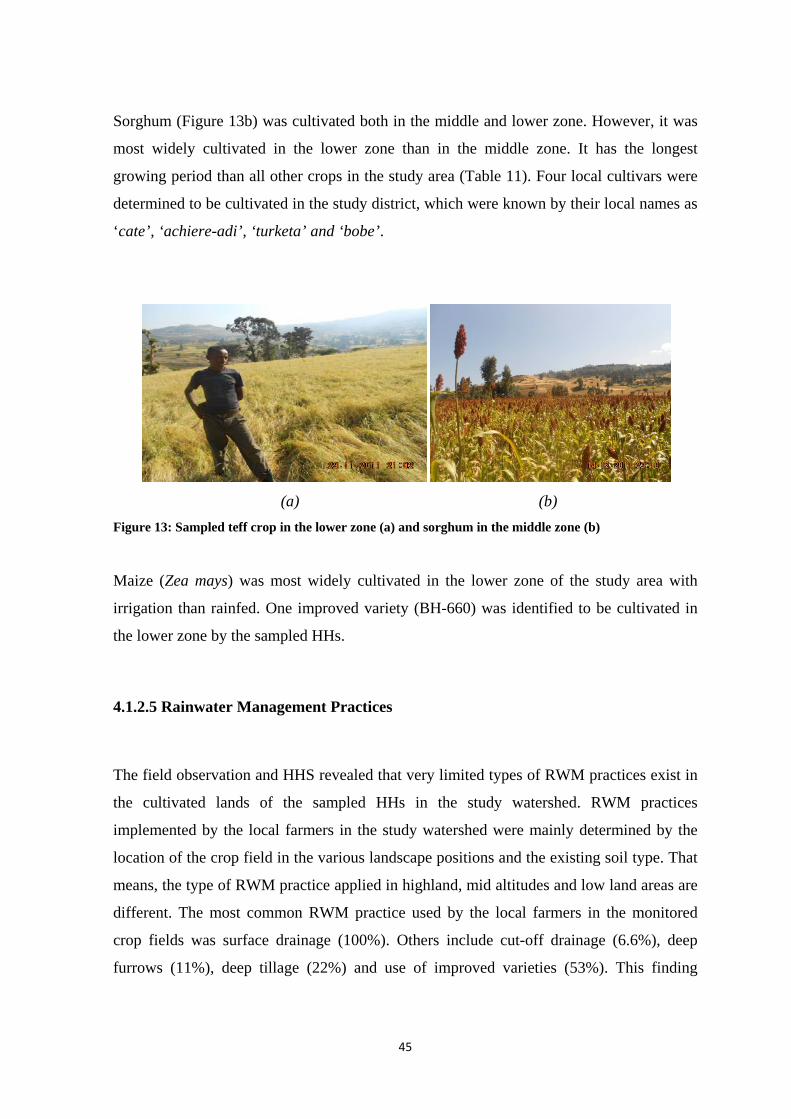
45
Sorghum (Figure 13b) was cultivated both in the middle and lower zone. However, it was
most widely cultivated in the lower zone than in the middle zone. It has the longest
growing period than all other crops in the study area (Table 11). Four local cultivars were
determined to be cultivated in the study district, which were known by their local names as
‘cate’, ‘achiere-adi’, ‘turketa’ and ‘bobe’.
(a) (b) Figure 13: Sampled teff crop in the lower zone (a) and sorghum in the middle zone (b) Maize (Zea mays) was most widely cultivated in the lower zone of the study area with
irrigation than rainfed. One improved variety (BH-660) was identified to be cultivated in
the lower zone by the sampled HHs.
4.1.2.5 Rainwater Management Practices
The field observation and HHS revealed that very limited types of RWM practices exist in
the cultivated lands of the sampled HHs in the study watershed. RWM practices
implemented by the local farmers in the study watershed were mainly determined by the
location of the crop field in the various landscape positions and the existing soil type. That
means, the type of RWM practice applied in highland, mid altitudes and low land areas are
different. The most common RWM practice used by the local farmers in the monitored
crop fields was surface drainage (100%). Others include cut-off drainage (6.6%), deep
furrows (11%), deep tillage (22%) and use of improved varieties (53%). This finding
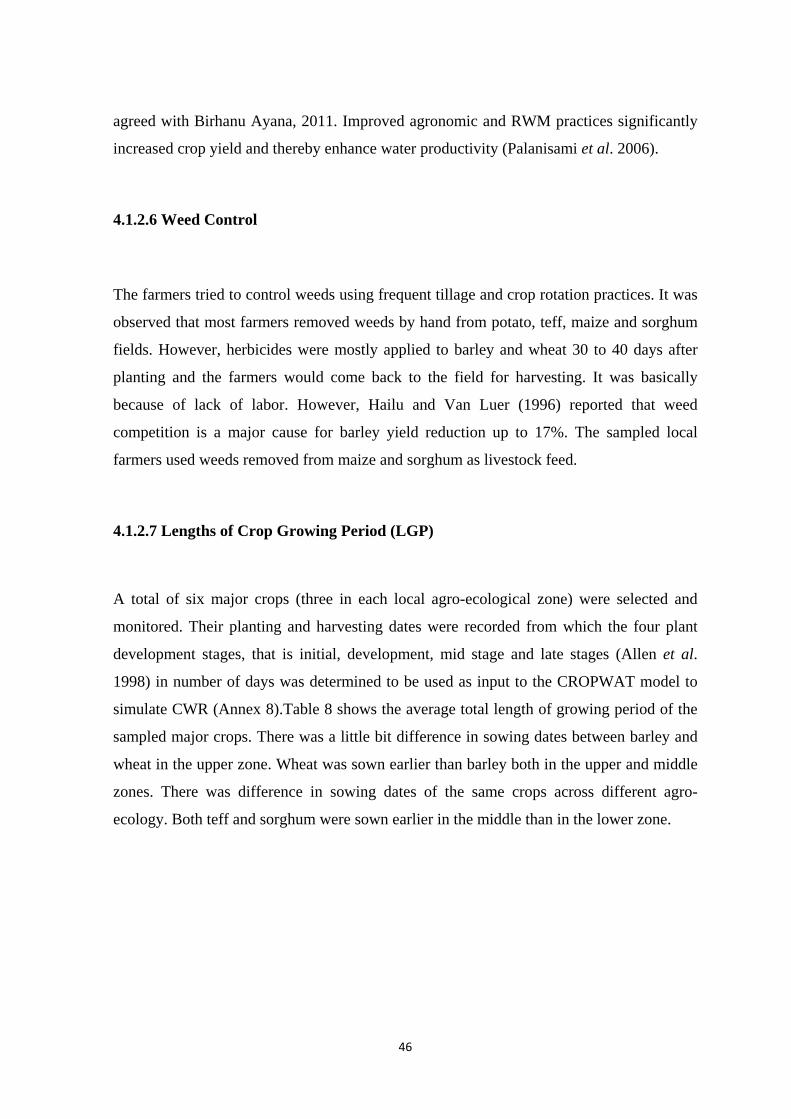
46
agreed with Birhanu Ayana, 2011. Improved agronomic and RWM practices significantly
increased crop yield and thereby enhance water productivity (Palanisami et al. 2006).
4.1.2.6 Weed Control
The farmers tried to control weeds using frequent tillage and crop rotation practices. It was
observed that most farmers removed weeds by hand from potato, teff, maize and sorghum
fields. However, herbicides were mostly applied to barley and wheat 30 to 40 days after
planting and the farmers would come back to the field for harvesting. It was basically
because of lack of labor. However, Hailu and Van Luer (1996) reported that weed
competition is a major cause for barley yield reduction up to 17%. The sampled local
farmers used weeds removed from maize and sorghum as livestock feed.
4.1.2.7 Lengths of Crop Growing Period (LGP)
A total of six major crops (three in each local agro-ecological zone) were selected and
monitored. Their planting and harvesting dates were recorded from which the four plant
development stages, that is initial, development, mid stage and late stages (Allen et al.
1998) in number of days was determined to be used as input to the CROPWAT model to
simulate CWR (Annex 8).Table 8 shows the average total length of growing period of the
sampled major crops. There was a little bit difference in sowing dates between barley and
wheat in the upper zone. Wheat was sown earlier than barley both in the upper and middle
zones. There was difference in sowing dates of the same crops across different agro-
ecology. Both teff and sorghum were sown earlier in the middle than in the lower zone.

47
Table 8: Average LGP (days from planting to maturity) in the three local agro-ecological zones.
Crop Type
The Average LGP in each local agro-ecology
Upper Zone Middle Zone Lower Zone Average
Barley 159 - - 159
Wheat 165 155 - 160
Teff - 152 133 143
Sorghum - 271 242 257
Maize - - 173 173
Potato 163 - - 163
Average 162 193 183 176
Source: Field Measurement, 2011
As can be seen from the above table, the average LGP (number of days from planting to
maturity) for wheat in the upper zone was 165 days and 155 days in the middle zone. For
barley, it was 159 days. Similarly, it was 152 days and 271 days for teff and sorghum in
the middle zone, respectively. The LGP in the lower zone was 133, 242 and 173 days for
teff, sorghum and maize, respectively. As we move down across the local agro-ecology,
crops mature faster than moving to the upper due to moisture stress in the lower zone. For
instance, wheat matures earlier in the middle zone than in the upper zone. Similarly, teff
and sorghum were also matured earlier in the lower zone than in the middle zone.
4.1.2.8 Methods of Harvesting All sampled crops were harvested traditionally by hand mostly using family labor and
social cooperation system locally called ‘Dabo’. In the upper zone, farmers mostly used
hired labor for potato harvesting in addition to family labor (Figure 14).
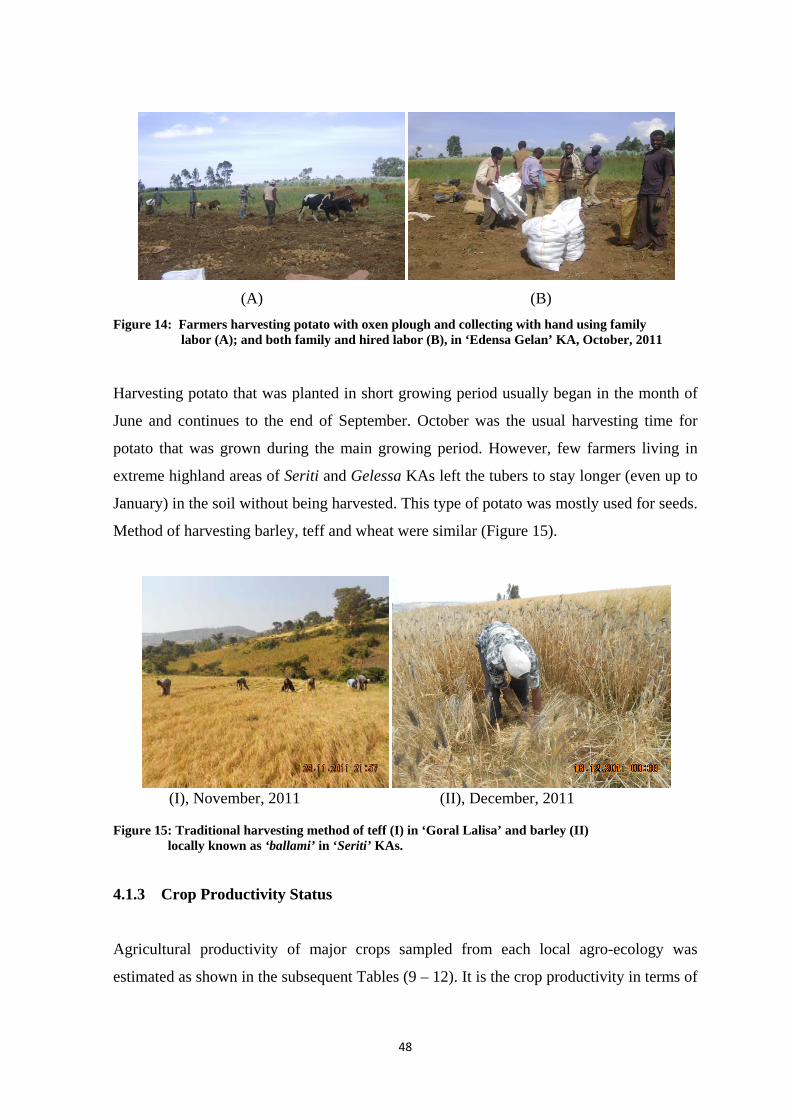
48
(A) (B)
Figure 14: Farmers harvesting potato with oxen plough and collecting with hand using family labor (A); and both family and hired labor (B), in ‘Edensa Gelan’ KA, October, 2011
Harvesting potato that was planted in short growing period usually began in the month of
June and continues to the end of September. October was the usual harvesting time for
potato that was grown during the main growing period. However, few farmers living in
extreme highland areas of Seriti and Gelessa KAs left the tubers to stay longer (even up to
January) in the soil without being harvested. This type of potato was mostly used for seeds.
Method of harvesting barley, teff and wheat were similar (Figure 15).
(I), November, 2011 (II), December, 2011
Figure 15: Traditional harvesting method of teff (I) in ‘Goral Lalisa’ and barley (II)
locally known as ‘ballami’ in ‘Seriti’ KAs.
4.1.3 Crop Productivity Status Agricultural productivity of major crops sampled from each local agro-ecology was
estimated as shown in the subsequent Tables (9 – 12). It is the crop productivity in terms of
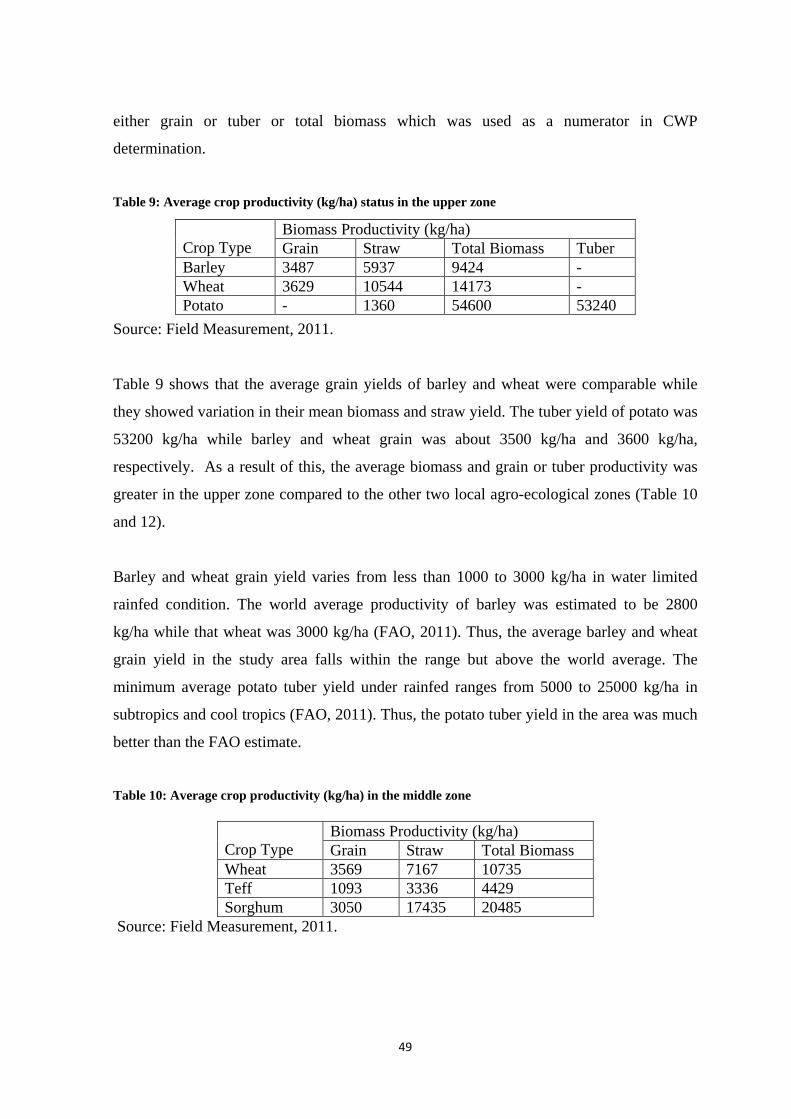
49
either grain or tuber or total biomass which was used as a numerator in CWP
determination.
Table 9: Average crop productivity (kg/ha) status in the upper zone Source: Field Measurement, 2011. Table 9 shows that the average grain yields of barley and wheat were comparable while
they showed variation in their mean biomass and straw yield. The tuber yield of potato was
53200 kg/ha while barley and wheat grain was about 3500 kg/ha and 3600 kg/ha,
respectively. As a result of this, the average biomass and grain or tuber productivity was
greater in the upper zone compared to the other two local agro-ecological zones (Table 10
and 12).
Barley and wheat grain yield varies from less than 1000 to 3000 kg/ha in water limited
rainfed condition. The world average productivity of barley was estimated to be 2800
kg/ha while that wheat was 3000 kg/ha (FAO, 2011). Thus, the average barley and wheat
grain yield in the study area falls within the range but above the world average. The
minimum average potato tuber yield under rainfed ranges from 5000 to 25000 kg/ha in
subtropics and cool tropics (FAO, 2011). Thus, the potato tuber yield in the area was much
better than the FAO estimate.
Table 10: Average crop productivity (kg/ha) in the middle zone
Crop Type
Biomass Productivity (kg/ha) Grain Straw Total Biomass
Wheat 3569 7167 10735 Teff 1093 3336 4429 Sorghum 3050 17435 20485
Source: Field Measurement, 2011.
Crop Type
Biomass Productivity (kg/ha) Grain Straw Total Biomass Tuber
Barley 3487 5937 9424 - Wheat 3629 10544 14173 - Potato - 1360 54600 53240
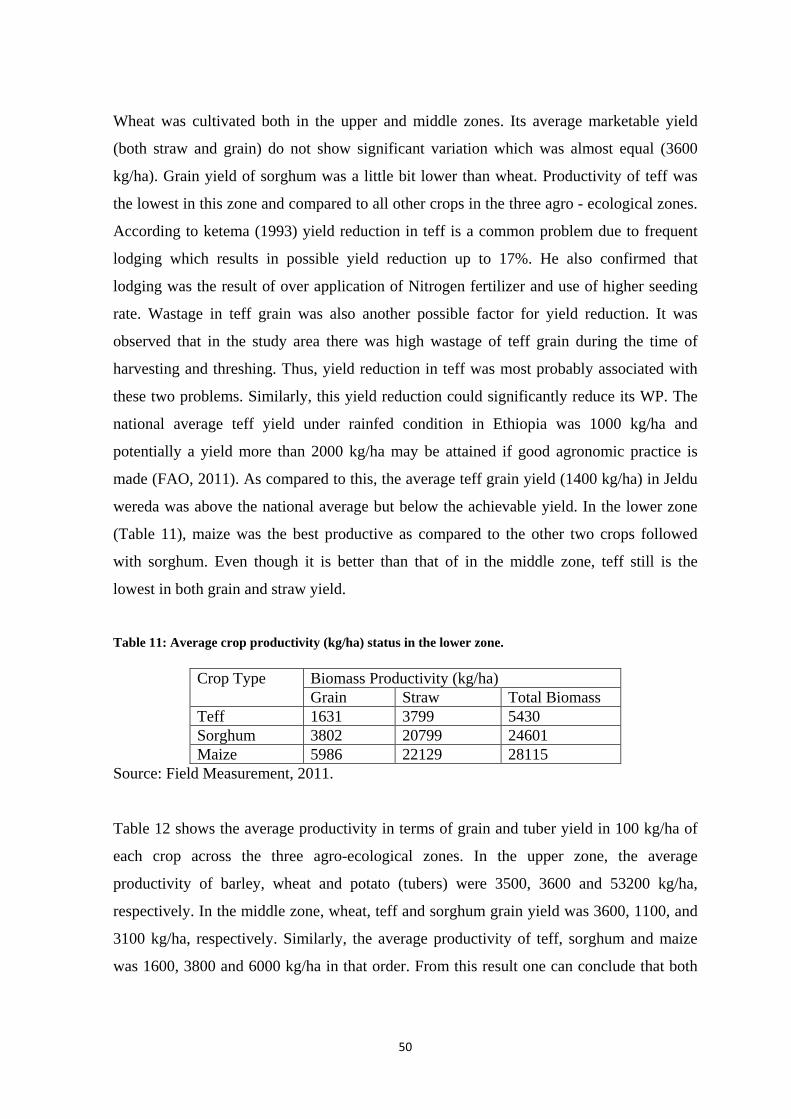
50
Wheat was cultivated both in the upper and middle zones. Its average marketable yield
(both straw and grain) do not show significant variation which was almost equal (3600
kg/ha). Grain yield of sorghum was a little bit lower than wheat. Productivity of teff was
the lowest in this zone and compared to all other crops in the three agro - ecological zones.
According to ketema (1993) yield reduction in teff is a common problem due to frequent
lodging which results in possible yield reduction up to 17%. He also confirmed that
lodging was the result of over application of Nitrogen fertilizer and use of higher seeding
rate. Wastage in teff grain was also another possible factor for yield reduction. It was
observed that in the study area there was high wastage of teff grain during the time of
harvesting and threshing. Thus, yield reduction in teff was most probably associated with
these two problems. Similarly, this yield reduction could significantly reduce its WP. The
national average teff yield under rainfed condition in Ethiopia was 1000 kg/ha and
potentially a yield more than 2000 kg/ha may be attained if good agronomic practice is
made (FAO, 2011). As compared to this, the average teff grain yield (1400 kg/ha) in Jeldu
wereda was above the national average but below the achievable yield. In the lower zone
(Table 11), maize was the best productive as compared to the other two crops followed
with sorghum. Even though it is better than that of in the middle zone, teff still is the
lowest in both grain and straw yield.
Table 11: Average crop productivity (kg/ha) status in the lower zone.
Crop Type Biomass Productivity (kg/ha) Grain Straw Total Biomass
Teff 1631 3799 5430 Sorghum 3802 20799 24601 Maize 5986 22129 28115
Source: Field Measurement, 2011.
Table 12 shows the average productivity in terms of grain and tuber yield in 100 kg/ha of
each crop across the three agro-ecological zones. In the upper zone, the average
productivity of barley, wheat and potato (tubers) were 3500, 3600 and 53200 kg/ha,
respectively. In the middle zone, wheat, teff and sorghum grain yield was 3600, 1100, and
3100 kg/ha, respectively. Similarly, the average productivity of teff, sorghum and maize
was 1600, 3800 and 6000 kg/ha in that order. From this result one can conclude that both

51
barley and wheat had given almost comparable grain yield in upper and lower zones.
Productivity of teff and sorghum were better in the lower zone than in the middle zone.
Table 12: Average grain and tuber yield (100 kg/ha) across agro-ecology.
Crop Type
Productivity in terms of Grain and tuber yield (100kg/ha)
Upper Zone Middle Zone Lower Zone Average
Barley 35.00 - - 35.00
Wheat 36.00 36.00 - 36.00
Teff - 11.00 16.00 14.00
Sorghum - 31.00 38.00 35.00
Maize - - 60.00 60.00
Potato 532.00 - - 532.00
Average 201.00 26.00 38.00 119.00
Source: Field Survey, 2011
4.2 Crop Water Requirement According to Seleshi Bekele et al. (2009) when the amount of water that can be stored in
the root zone and gradually be used by a crop every day is 1mm in 1m2 areas, the amount
of water required by the plants every day in one ha of land is equal to 10m3. This was used
as a conversion factor for CWR value from mm to m3 and utilized in determination of both
physical and economic crop water productivity in the subsequent sections of this particular
study.
4.2.1 Magnitude of Water Consumed: The Denominator
Rainfed crops used infiltrated rainfall that forms soil moisture in the root zone. This
accounts for most of the crop water consumption in agriculture (Singh et al. 2009). Table
13 shows the average amount of water consumed by each crop in the three local agro-
ecological zones simulated by the CROPWAT model.
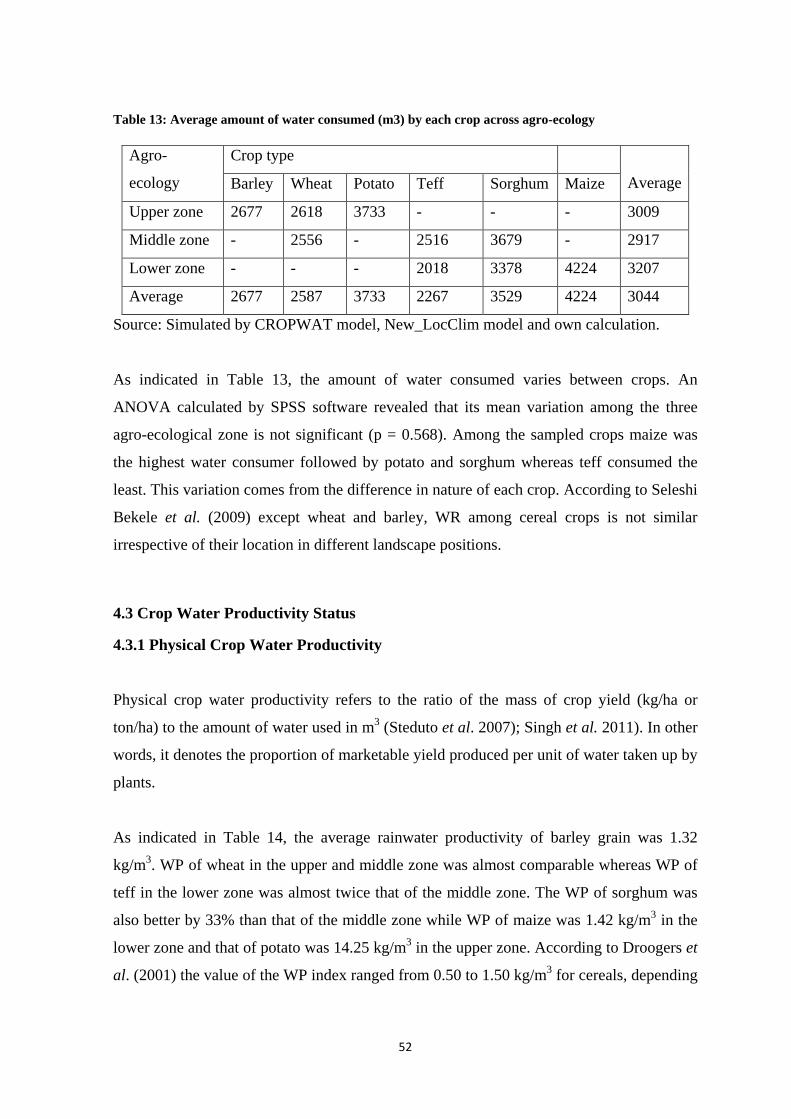
52
Table 13: Average amount of water consumed (m3) by each crop across agro-ecology
Agro-
ecology
Crop type
Average Barley Wheat Potato Teff Sorghum Maize
Upper zone 2677 2618 3733 - - - 3009
Middle zone - 2556 - 2516 3679 - 2917
Lower zone - - - 2018 3378 4224 3207
Average 2677 2587 3733 2267 3529 4224 3044
Source: Simulated by CROPWAT model, New_LocClim model and own calculation.
As indicated in Table 13, the amount of water consumed varies between crops. An
ANOVA calculated by SPSS software revealed that its mean variation among the three
agro-ecological zone is not significant (p = 0.568). Among the sampled crops maize was
the highest water consumer followed by potato and sorghum whereas teff consumed the
least. This variation comes from the difference in nature of each crop. According to Seleshi
Bekele et al. (2009) except wheat and barley, WR among cereal crops is not similar
irrespective of their location in different landscape positions.
4.3 Crop Water Productivity Status
4.3.1 Physical Crop Water Productivity Physical crop water productivity refers to the ratio of the mass of crop yield (kg/ha or
ton/ha) to the amount of water used in m3 (Steduto et al. 2007); Singh et al. 2011). In other
words, it denotes the proportion of marketable yield produced per unit of water taken up by
plants.
As indicated in Table 14, the average rainwater productivity of barley grain was 1.32
kg/m3. WP of wheat in the upper and middle zone was almost comparable whereas WP of
teff in the lower zone was almost twice that of the middle zone. The WP of sorghum was
also better by 33% than that of the middle zone while WP of maize was 1.42 kg/m3 in the
lower zone and that of potato was 14.25 kg/m3 in the upper zone. According to Droogers et
al. (2001) the value of the WP index ranged from 0.50 to 1.50 kg/m3 for cereals, depending
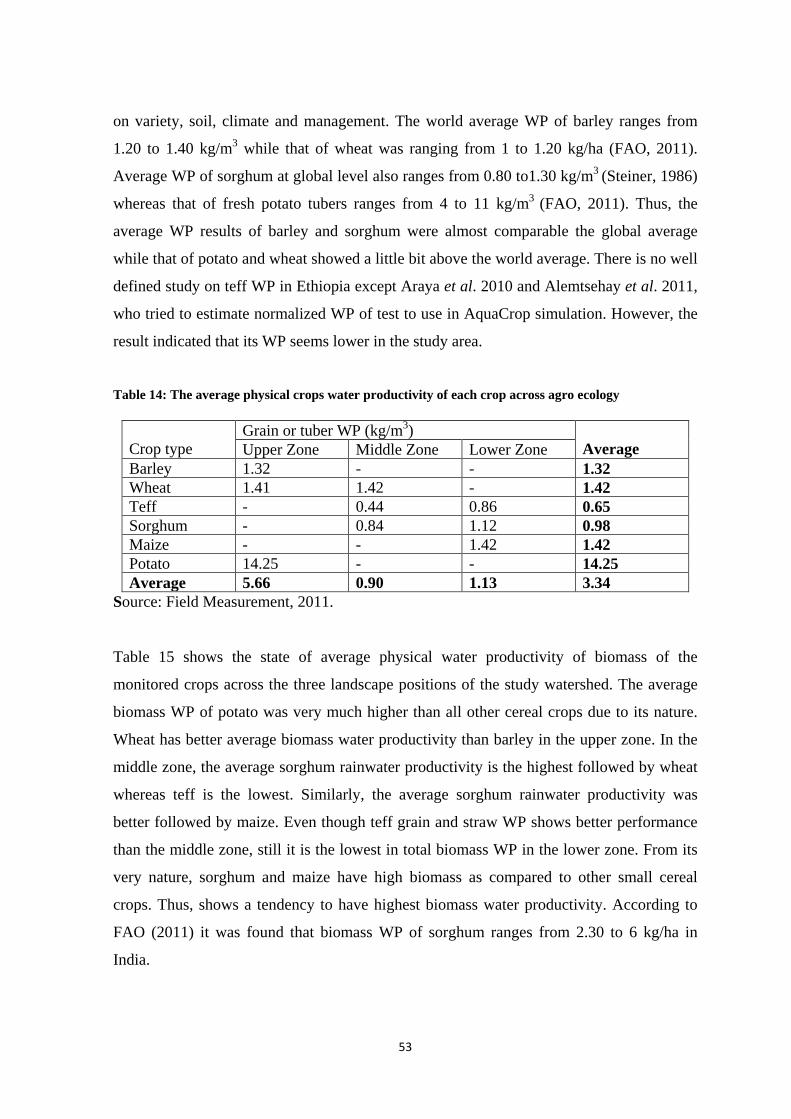
53
on variety, soil, climate and management. The world average WP of barley ranges from
1.20 to 1.40 kg/m3 while that of wheat was ranging from 1 to 1.20 kg/ha (FAO, 2011).
Average WP of sorghum at global level also ranges from 0.80 to1.30 kg/m3 (Steiner, 1986)
whereas that of fresh potato tubers ranges from 4 to 11 kg/m3 (FAO, 2011). Thus, the
average WP results of barley and sorghum were almost comparable the global average
while that of potato and wheat showed a little bit above the world average. There is no well
defined study on teff WP in Ethiopia except Araya et al. 2010 and Alemtsehay et al. 2011,
who tried to estimate normalized WP of test to use in AquaCrop simulation. However, the
result indicated that its WP seems lower in the study area.
Table 14: The average physical crops water productivity of each crop across agro ecology
Crop type
Grain or tuber WP (kg/m3) Average Upper Zone Middle Zone Lower Zone
Barley 1.32 - - 1.32 Wheat 1.41 1.42 - 1.42 Teff - 0.44 0.86 0.65 Sorghum - 0.84 1.12 0.98 Maize - - 1.42 1.42 Potato 14.25 - - 14.25 Average 5.66 0.90 1.13 3.34
Source: Field Measurement, 2011. Table 15 shows the state of average physical water productivity of biomass of the
monitored crops across the three landscape positions of the study watershed. The average
biomass WP of potato was very much higher than all other cereal crops due to its nature.
Wheat has better average biomass water productivity than barley in the upper zone. In the
middle zone, the average sorghum rainwater productivity is the highest followed by wheat
whereas teff is the lowest. Similarly, the average sorghum rainwater productivity was
better followed by maize. Even though teff grain and straw WP shows better performance
than the middle zone, still it is the lowest in total biomass WP in the lower zone. From its
very nature, sorghum and maize have high biomass as compared to other small cereal
crops. Thus, shows a tendency to have highest biomass water productivity. According to
FAO (2011) it was found that biomass WP of sorghum ranges from 2.30 to 6 kg/ha in
India.
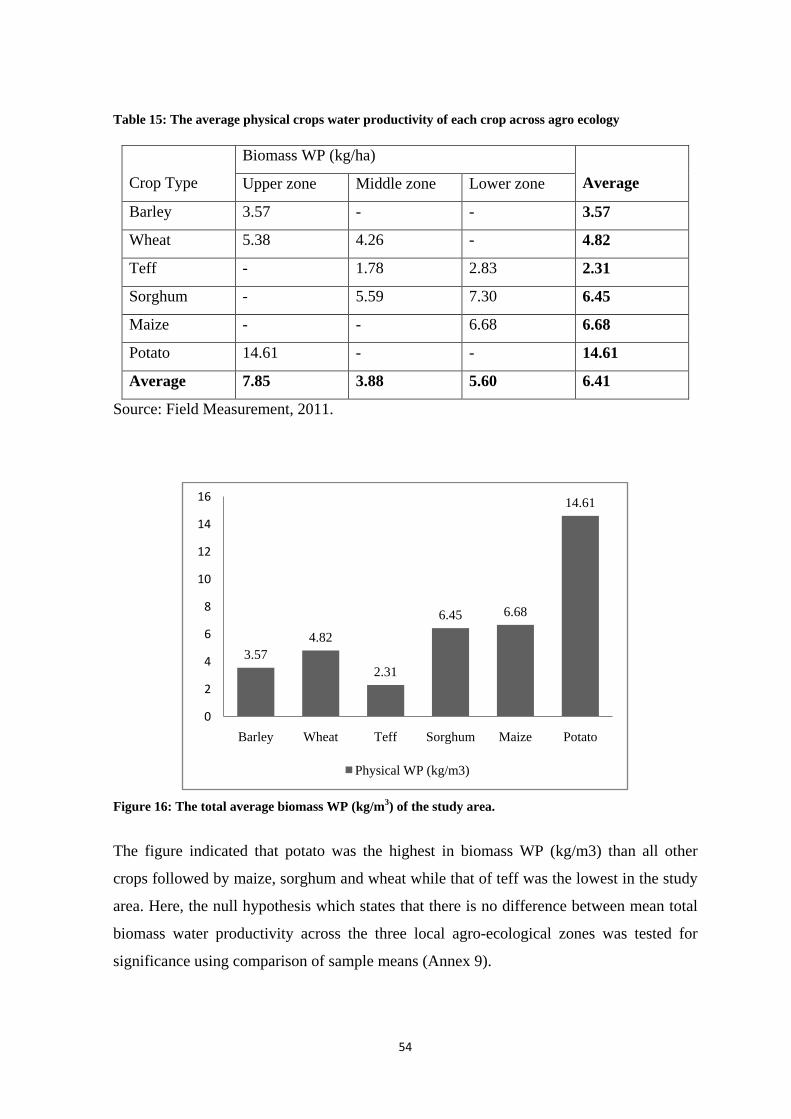
54
Table 15: The average physical crops water productivity of each crop across agro ecology
Crop Type
Biomass WP (kg/ha)
Average Upper zone Middle zone Lower zone
Barley 3.57 - - 3.57
Wheat 5.38 4.26 - 4.82
Teff - 1.78 2.83 2.31
Sorghum - 5.59 7.30 6.45
Maize - - 6.68 6.68
Potato 14.61 - - 14.61
Average 7.85 3.88 5.60 6.41
Source: Field Measurement, 2011.
Figure 16: The total average biomass WP (kg/m3) of the study area.
The figure indicated that potato was the highest in biomass WP (kg/m3) than all other
crops followed by maize, sorghum and wheat while that of teff was the lowest in the study
area. Here, the null hypothesis which states that there is no difference between mean total
biomass water productivity across the three local agro-ecological zones was tested for
significance using comparison of sample means (Annex 9).
3.574.82
2.31
6.45 6.68
14.61
0
2
4
6
8
10
12
14
16
Barley Wheat Teff Sorghum Maize Potato
Physical WP (kg/m3)
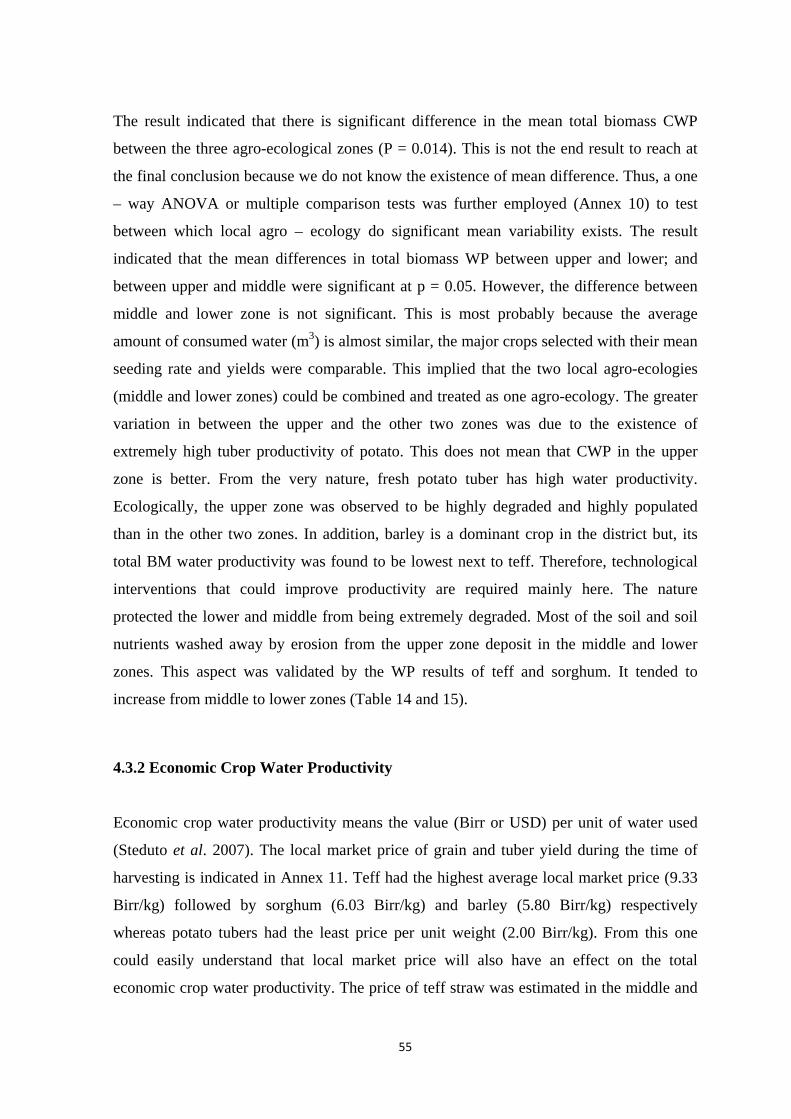
55
The result indicated that there is significant difference in the mean total biomass CWP
between the three agro-ecological zones (P = 0.014). This is not the end result to reach at
the final conclusion because we do not know the existence of mean difference. Thus, a one
– way ANOVA or multiple comparison tests was further employed (Annex 10) to test
between which local agro – ecology do significant mean variability exists. The result
indicated that the mean differences in total biomass WP between upper and lower; and
between upper and middle were significant at p = 0.05. However, the difference between
middle and lower zone is not significant. This is most probably because the average
amount of consumed water (m3) is almost similar, the major crops selected with their mean
seeding rate and yields were comparable. This implied that the two local agro-ecologies
(middle and lower zones) could be combined and treated as one agro-ecology. The greater
variation in between the upper and the other two zones was due to the existence of
extremely high tuber productivity of potato. This does not mean that CWP in the upper
zone is better. From the very nature, fresh potato tuber has high water productivity.
Ecologically, the upper zone was observed to be highly degraded and highly populated
than in the other two zones. In addition, barley is a dominant crop in the district but, its
total BM water productivity was found to be lowest next to teff. Therefore, technological
interventions that could improve productivity are required mainly here. The nature
protected the lower and middle from being extremely degraded. Most of the soil and soil
nutrients washed away by erosion from the upper zone deposit in the middle and lower
zones. This aspect was validated by the WP results of teff and sorghum. It tended to
increase from middle to lower zones (Table 14 and 15).
4.3.2 Economic Crop Water Productivity Economic crop water productivity means the value (Birr or USD) per unit of water used
(Steduto et al. 2007). The local market price of grain and tuber yield during the time of
harvesting is indicated in Annex 11. Teff had the highest average local market price (9.33
Birr/kg) followed by sorghum (6.03 Birr/kg) and barley (5.80 Birr/kg) respectively
whereas potato tubers had the least price per unit weight (2.00 Birr/kg). From this one
could easily understand that local market price will also have an effect on the total
economic crop water productivity. The price of teff straw was estimated in the middle and
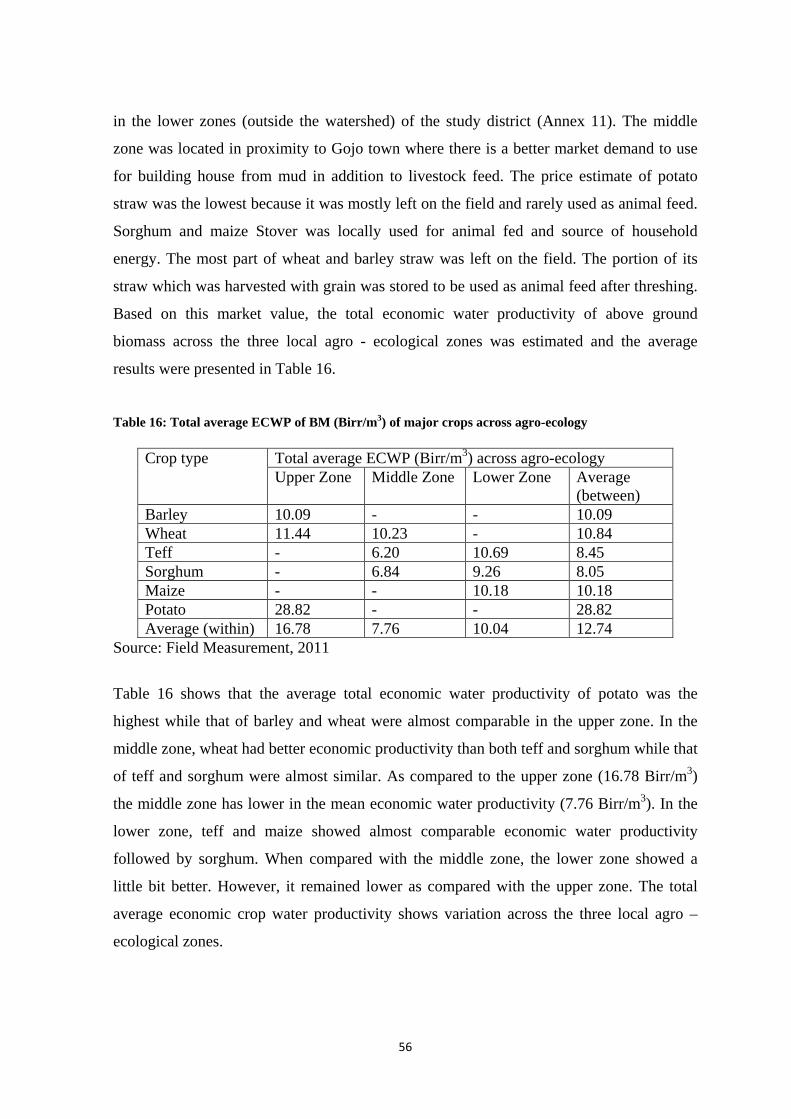
56
in the lower zones (outside the watershed) of the study district (Annex 11). The middle
zone was located in proximity to Gojo town where there is a better market demand to use
for building house from mud in addition to livestock feed. The price estimate of potato
straw was the lowest because it was mostly left on the field and rarely used as animal feed.
Sorghum and maize Stover was locally used for animal fed and source of household
energy. The most part of wheat and barley straw was left on the field. The portion of its
straw which was harvested with grain was stored to be used as animal feed after threshing.
Based on this market value, the total economic water productivity of above ground
biomass across the three local agro - ecological zones was estimated and the average
results were presented in Table 16.
Table 16: Total average ECWP of BM (Birr/m3) of major crops across agro-ecology
Crop type Total average ECWP (Birr/m3) across agro-ecology Upper Zone Middle Zone Lower Zone Average
(between) Barley 10.09 - - 10.09 Wheat 11.44 10.23 - 10.84 Teff - 6.20 10.69 8.45 Sorghum - 6.84 9.26 8.05 Maize - - 10.18 10.18 Potato 28.82 - - 28.82 Average (within) 16.78 7.76 10.04 12.74
Source: Field Measurement, 2011
Table 16 shows that the average total economic water productivity of potato was the
highest while that of barley and wheat were almost comparable in the upper zone. In the
middle zone, wheat had better economic productivity than both teff and sorghum while that
of teff and sorghum were almost similar. As compared to the upper zone (16.78 Birr/m3)
the middle zone has lower in the mean economic water productivity (7.76 Birr/m3). In the
lower zone, teff and maize showed almost comparable economic water productivity
followed by sorghum. When compared with the middle zone, the lower zone showed a
little bit better. However, it remained lower as compared with the upper zone. The total
average economic crop water productivity shows variation across the three local agro –
ecological zones.
57
Figure 17: The total average biomass WP (Birr/m3) of each crop in the study area.
The figure clearly shows that the total average economic water productivity of potato was
the highest in the study area followed by wheat, maize and barley. Thus, potato is the most
appropriate crop in economic water productivity than all others crops in the upper zone of
the study watershed.
In order to test for the significance of variation in the mean ECWP among the three local
agro-ecological zones, comparison of means was employed (Annex 13). The ANOVA test
result indicated that the variation was significant (P = 0.001). Hence, there is significant
mean difference in ECWP between the three local agro – ecological zones. Finally, one –
way ANOVA test was employed to check in between which local agro – ecological zones
that there exists significant variation (Annex 14).
4.4 Effects of Crop Management Practices on Water Productivity Crop water productivity is a function of several factors from which crops management
practices is one. Farmers applied either UREA or DAP or both to the monitored crop fields
except on most sorghum crop fields in the middle and lower zones as well as teff in the
lower zone. Wheat grow both in the upper and middle zones; both teff and sorghum also
grow in the middle and lower zones of the study area with the limitation of potato and
10.09 10.848.45 8.05
10.18
28.82
0
5
10
15
20
25
30
35
Barley Wheat Teff Sorghum Maize Potato
EWP (Birr/m3)
58
barley mainly to the upper and maize to the lower zones, respectively. Here under, the
relationships between the four management practices and BMWP of the major crops is
treated.
4.4.1 Effects on Physical and Economical Crop Water Productivity
As mentioned earlier, the aspects like physical and economic crop water productivity in a
system depend on many factors and the management practices prevailing in the watershed
is one. The crop management practices differ with major crops like potato, barley, wheat,
teff, sorghum and maize and these different practices contribute to the productivity
parameters differently. We consider the four management practices like rate of UREA and
DAP application, seeding rate and tillage frequency and investigated relationship with
biomass WP. The Pearson’s correlation coefficient calculated for the four crop
management practices and corresponding WP of major crops showed no significant
relationship (Annex 15). However, the rate of application of UREA and DAP as well as
tillage frequency tended to positively correlate while seeding rate tended to negatively
correlate with potato biomass water productivity (BMWP). The relationship of these
management practices on wheat BMWP was different between the upper and middle zones
of the study watershed. In the upper zone, the Pearson’s correlation coefficient indicated
that UREA application and seeding rates tended to negatively correlate whereas rate of
application of DAP and tillage frequency tended to positively correlate with wheat BMWP.
To the contrary, in the middle zone, UREA and DAP application rates tended to negatively
correlate whereas seeding rate and tillage frequency tended to positively correlate with its
BMWP. In case of barley, seeding rate tended to negatively correlate while rate of
application of DAP and tillage frequency tended to positively correlate with its BMWP.
For teff, rate of application of UREA and DAP as well as tillage frequency tended to
negatively correlate whereas seeding rate tended to positively correlate with its BMWP in
the middle zone. In the lower zone, the effect of only seeding rate and tillage frequency
were tasted and the result indicated that seeding rate tended to positively correlate while
tillage frequency tended to negatively correlate with its BMWP. Usually farmers didn’t
apply inorganic fertilizers to sorghum crop fields in the study area. Only on one former’s
crop field that both UREA and DAP were applied in the middle zone. Thus, in this zone,
59
rate of application of both UREA and DAP as well as tillage frequency tended to positively
correlate while seeding rate tended to negatively correlate with its BMWP. In the lower
zone, both seeding rate and tillage frequency tended to negatively correlate with sorghum
BMWP. In case of maize, rates of application of UREA and DAP as well as tillage
frequency tended to positively correlate while seeding rate tended to negatively correlate
with its BMWP.
Generally, the absence of clear relationship of the four management practices on BMWP of
major crops in the study watershed may be because, the management practices included
here couldn’t represent the actual variation in the management regime and BMWP. The
other possible reason is that the management practices in this study couldn’t be separately
considered for statistical analysis. However, the results of several studies indicated that any
management practices used to enhance crop yield significantly increased crop WP (Toung,
1999; Rockstrom et al. 2003; Mulugeta, 2006; Molden et al. 2003; Kijne et al. 2003;
EIAR, 2004). Therefore, a more detailed further study concentrating on this aspect is
highly required.
The effects of those management practices treated under physical crop water productivity
were also treated with similar procedures for economic crop water productivity and
obtained almost similar results (Annex 15). In other words, the Pearson’s correlation
coefficients calculated to define the relationship between the four management practices
and economic BMWP showed a similar relationship trend with that of physical BMWP.
Thus, the effect of the four management practices on physical and economic BMWP is
similar and the concluding remark given under physical BMWP also works for economic
BMWP.

60
5. CONCLUSIONS AND RECOMMEDDATIONS
5.1 Conclusions The study revealed that crop rotation was a major cropping system in all agro-ecological
zones. It was practiced on 91% of monitored crop fields (45). Barley => Fallow => Barley,
Wheat => Teff => Wheat and Teff => Sorghum/Maize were the common rotation pattern
in the upper, middle and lower zones, respectively which are not scientifically
recommended. Relay cropping and intercropping systems were not commonly practiced in
the area. Barley was the dominant crop in the watershed which covered over 50% of the
cropped land in the year 2011 alone. Small scale irrigation farming downstream along the
major river was also common. Farmers applied very limited types of rainwater
management practices and surface drainage was the common rainwater management
system (100%) in the area. But, very few farmers also used cut-off drainage (6.6%) in hilly
areas, deep furrows (11%), deep tillage (22%) and improved varieties (53%). Compost was
applied by only 13% of the sampled households in the study area. Rate of application of
inorganic fertilizers (UREA and DAP), frequent tillage, seeding rate, crop diversification
and others were common crop management practices implemented in the area. Traditional
method of sowing (88%) and harvesting (100%) were mostly practiced. Farmers used to
control weeds through frequent tillage, crop rotation, removing with hand and application
of herbicides. Potato was the leading in average biomass yield in the upper zone followed
with maize in the lower zone and sorghum in the middle zone. From cereal cops, maize
was the first in average grain yield followed by wheat, barley and sorghum. Maize was the
leading in the amount of water consumed followed by potato and sorghum. Potato has the
highest average biomass water productivity in kg/m3 followed by sorghum and maize. Teff
grain was the leading in local market price followed by sorghum and barley
correspondingly. There was no significant variation in economic crop water productivity
among cereal crops. There was significant difference between the upper and middle as well
as the upper and lower landscape positions in both total mean physical and economic water
productivity. Potato was the most essential crop than all the other crops both in physical
and economic water productivity in the upper zone. The effect of rate of UREA and DAP
application, seeding rate and tillage frequency on biomass water productivity of major
crops was tested for significance. Though they are very important scientifically to increase

61
crop water productivity, Pearson’s correlation coefficient showed that there is no
significant effect on both physical and economic biomass water productivity which may be
because, the management practices included here couldn’t represent the actual variation in
the management regime and biomass water productivity as well as they couldn’t be
separately considered for statistical analysis. Thus, a more detailed further study
concentrating on this aspect is highly required so as to design appropriate means of
technological interventions in the rainfed crop production system that could enhance crop
water productivity and improve livelihood of the rural community in the study watershed.
5.2 Recommendations Based on the findings of the study the following recommendations were forwarded:
Building the capacity of the local farmers through giving short term trainings in the
area of implementing improved crop rotation system that could better maintain soil
fertility and improve crop yield. Particularly, giving them direction to use legumes
like faba bean, field pea, chickpea, niger seeds, etc in between rotation systems in
their respective local agro-ecology.
There is a need to give technical and material support to the farmers who are using
the river water for small scale irrigation farming to sustainably and equitably use
the water between upstream downstream regions without affecting the river
ecosystem.
Assisting the local farmers in providing them training and awareness creation to use
diversified and appropriate rainwater management practice across the three
landscape positions like soil bund, soil fertility enhancement, appropriate planting
date, appropriate plant population, new crop varieties, surface drainage, terraces,
stone bunds, and supplemental irrigation in the rainfed systems in the study area.
Given the high current and potential productivity of potato in the upper part of the
watershed and poor market linkage, all local and regional actors need to facilitate
the development of value chain for this essential product.
So as to make a proper intervention to enhance crop water productivity and
improve livelihood of the rural community in the study watershed, a more detailed
further study concentrating on the effect of crop management practice is required.
62
REFERENCES Allen, R. G., L. Pereira, D. Rase and M. Smith. 1998. Crop Evapotranspiration: Guideline
for Computing Crop Water Requirement. Irrigation and drainage Paper No. 56.
Food and Agricultural Organization of the UN, Rome, Italy.
Agarwal, A. and S. Narain. 1997. Dying Wisdom. Centre for Science and Environment,
Thomson Press: Faridabad.
Araya, A., S. D. Keesstra, and L. Stroosnijder. 2010. Simulating yield response to water of
Teff (Eragrostis tef) with FAO's AquaCrop model. Field Crops Research 116:196–
204.
Baldock, J.D., R.L. Higgs, W.H. Paulson, J.A. Jackobs, and W.D.Shrader. 1981. Legume
and Mineral N Effects on Crop Yields in Several Crop Sequences in the Upper
Mississippi Valley. Agron. J., 73:885 – 890.
Ball, D.A. 1992. Weed Seed Bank Response to Tillage, Herbicides, and Crop Rotation
Sequence. Weed Sci. 40:654 – 659.
Bekele S. and S.T Holden. 2000. Policy instruments for sustainable land management: the
case of highland smallholders in Ethiopia, Agricultural University of Norway,
Department of Economics and Social Sciences, Norway
Benites, J., E. Chuma, R. Fowle, et al. (eds). 1998. Conservation Tillage for Sustainable
Agriculture. Proceedings from an International Workshop, Harare, 22–27 June. Part
1. Workshop Report. Deutsche Gesellschaft, GTZ: Eschborn, Germany; pp.59.
Berhanu Gebremedihin, Adane Hirpha and Kahsay Berhe. 2009. Feed Marketing in
Ethiopia:Result of Rapid Market appraisal. Improving Productivity and Market
Success (IPMS) of Ethiopian farmers. Project Working Paper 15. ILRI, Nairobi
Kenya; pp.64.
Birhanu Ayana. 2011. Assessment of Rainwater Management Practice for Sustainable
Development and Improvement of Rural Livelihood in Andode/Mej Watershed,
Jeldu District, Oromia Region, Ethiopia. M.Sc. Thesiss, Ambo University, Faculty
of Natural and computational Science, Deparment of Biology, Ambo, Ethiopia.
Blackshaw, R.E., F.O. Larney, C.W. Lindwall, and G.C. Kozub. 1994. Crop Rotation
and Tillage Effects on Weed Population on Semi-arid Canadian Prairies. Weed
Tech., 8:231- 237.
Blaney, H.F. and W.D. Criddle. 1950. Detrmining Water Requirements in Irrigated areas
63
from Climatological and irrigation data. US Department of Agriculture, SCS,
Washington, DC, USA. pp 96.
Cai, X., and M. Rosegrant. 2003. World water productivity: Current Situations and Future
options. In: Water Productivity in Agriculture: Limits and Opportunities for
improvement, eds. Kijne, J.W., Barker, R. and Molden, D. Comprehensive
Assessment of Water Management in Agriculture Series 1, UK, London: CABI
Publishing, International Water Management Institute.
Cai, X., B. R. Sharma, M. A.Matin, D. Sharma, S. Gunasinghe. 2010. An assessment of
crop waterproductivity in the Indus and Ganges river basins: Current status and
scope for improvement. Colombo, Sri Lanka: International Water Management
Institute. pp.30; (IWMI Research Report 140). doi: 10.5337/2010.232
Calling, K. 2004.Watershed Management. Accessed on October 19.2010. On
http://www.kerala.gov.in/keralcalljuly04/p1719.pdf.
Crookston, R.K. 1984. The Rotation Effect: What Causes it to Boost Yields? Crops Soils
Magazine, 36:12 – 14.
Daniel Kassahun. 2007. Rain Water Harvesting in Ethiopia. Capturing the Realities and
exploring opportunities. FSS Working Paper No. 1. Forum for Social Studies,
Addis Ababa, Ethiopia.
Darcon, S., R. V. Hill, and A. Zeitin. 2009. In Search of a Strategy: Rethinking
Agriculture-led Growth in Ethiopia, Synthesis Paper Prepared as Part of a Study on
Agriculture and Growth in Ethiopia, University of Oxford, UK.
Derksen, D.A., G.P. Lafond, A.G. Thomas, H.A. Loeppky and C.J. Swanton. 1993.
Impact of Agronomic Practices on Weed Communities: Tillage Systems. Weed
Sci., 41: 409 – 417.
Doorenbos, J. and W.O. Pruitt. 1975. Crop Water Requirement .FAO, Irrigation and
Draiange paper No. 24. FAO of the UN, Rome, Italy.
Doorenbos, J. and W.O. Pruitt. 1975. Crop Water Requirement .FAO, Irrigation and
Draiange paper No. 24 (Revised). FAO of the UN, Rome, Italy.
Droogers, P., D. Seckler and I. Makin. 2001. Estimating the Potential of Rainfed
Agriculture. Working Paper 20. Colombo, Sri Lanka: International Water
Management Institute (IWMI).
EIAR. 2004. Combining Confidence and Research in Improving Water productivity.
64
Accessed online on Nov. 28/2011 at http://www.eiar.gov.et/on-the-news/184-
combining-confidence-and-research-in-improving-
Eyasu Elias. 2002. Farmers’ Perceptions of soil fertility change and management.
SOS Sahel and Institute for Sustainable Development, Addis Ababa, Ethiopia.
FAO. 1977. Crop Water Requirements. FAO, Rome, Italy.
FAO. 1984. Ethiopian highlands reclamation study (EHRS). Final Report, Vols. 1–2,
Rome.
FAO. 2002. World Agriculture: Towards 2015/2030. Summary Report. Rome.
FAO.2009. CROPWAT Model Version 8.0. Freely accessible online at
http://www.fao.org/nr/water/infores_databases_cropwat.html.
FAO. 2011. FAOSTAT online database, available at link http://faostat.fao.org/.
Accessed on December 2011.
Hailu, G., Van Leur, J. (eds.) (1996). Barley Research in Ethiopia. Past Work and Future
Prospects. Proceedings of the First Barley Research Review Workshop, 16-19
october 1993, Addis Abeba. IAR/ICARDA, Addis Abeba, Ethiopia.
Hatfield, J.L., T.J. Sauer, and J.H. Prueger. 2001. Managing soils to achieve greater water
use efficiency: a review. Agronomy Journal 93(2):271–280.
Hesternman, O.B., M.P. Russelle, C.C. Sheaffer, and G.H. Heichel. 1987. Nitrogen
Utilization from Fertilizer and Legume Residues in Legume-Corn Rotations.
Agron. J., 79: 726 – 731.
IPCC. 2007. Climate change–impacts, adaptation and vulnerability. Technical Summary of
Working Group II. In Fourth Assessment Report of Inter-governmental Panel on
Climate Change, ed. M.L. Parry, O.F. Canziani, J.P. Paultikof et al., 23–78.
Cambridge, UK: Cambridge University Press.
Kassam, A. and M. Smith, 2001. FAO Mthodologies on Crop Water Use and Crop Water
Productivity. Expert Meeting on Crop Water Productivity, Rome, 3 to 5 December
2001, Paper No CWP-07.
Ketema, S. 1993. Tef (Erasgrostis tef): breeding, genetic resources, agronomy, utilization
and role in Ethiopian agriculture. IAR, Addis Abeba, Ethiopia, pp.102.
Kijne, J., T. Tuong, J. Bennet, B. Bouman, T. Oweis. 2003. Ensuring food security via
Improvement in Crop Water Productivity. Challenge Program on water and Food
Background Paper 1. CGIAR. Accessible online at www.waterforfood.org
65
Kijne J. W., T.P.Tuong, J.Bennett, B.Bouman and T.Oweis . 2000. Ensuring food Security
via improvement in crop water productivity, challenge program on water and food
Background paper 1.
Mandefro Nigusie. 2005. Statistical Procedures for Designed Experiments. Esearch
Manual, Ethiopian Agricultural Research Organization (EARO). Addis Ababa,
Ethiopia.
McCalla, A.F. 1994. Agriculture and Food Needs to 2025: Why We Should be Concerned?
Consultative Group on International Agricultural Research (CGIAR): Washington,
DC, USA.
MARD. 2009. Agricultural Investment Potential of Ethiopia. Review rt. March, 2009,
Addis Ababa.
Molden, D., H. Murry-Rust, R. Sakthivadivel, and I. Makin. 2003. A Water-Productivity
Frame Work for Understanding and Action. In: Water Productivity in Agriculture:
Limits and Opportunities for Improvement, eds. J.W., Kijne, R. Barker and D.
Molden; Comprehensive Assessment of Water Management in Agriculture Series
1, UK; London: CABI Publishing; and International Water Management Institute
(IWMI), Colombo, Sir Lanka.
Molden, D., K. Frenken, R. Barker et al. 2007. Trends in water and agricultural
development. In: Water for food, water for life: a comprehensive assessment of
water management in agriculture, ed. D. Molden, 57–89. London, UK: Earthscan;
and Colombo, Sri Lanka: International Water Management Institute (IWMI).
Molle, F., P. Wester, P. Hirsch et al. 2007. River basin development and management. In:
Water for food, water for life. a comprehensive assessment of water management in
agriculture, ed. D. Molden, 585–625. London, UK: Earthscan; and Colombo, Sri
Lanka: InternationalWater Management Institute.
Mulugeta Tullu. 2006. Estmation of Livestock, Domestic Uses and Crop Water
Productivities of SG - 2000 Water Harvesting Pilot Projects in Ethiopia. M.Sc.
Thesis, Wagningen University, The Netherlands.
Norusis, M.J. 1987. The SPSS Guide to Data Analysis for SPSSx with additional
Instructions for SPSS/ PC+ Chicago.
Palanisami, K., S. Senthilvel, C.R. Ranganathan, T. Ramesh. 2006. Water Productivity at
66
Different Scales under Canal, Tank and Well Irrigation Systems. Center for
Agricultural and Rural Development Studies (CARDS), Tamil Nadu Agricultural
University, Coimbatore 641 003.
Panda, S.C. 2005.Principles and Practices of Water Management. Agrobios, India, pp. 345.
Parr, J.F., B.A. Stewart, S.B. Hornick, R.P. Singh. 1990. Improving the sustainability of
dry land farming systems: a global perspective. In: Advances in Soil Science, vol.
13, Dryland Agriculture Strategies for Sustainability.
Rockström, J. 2001. Green water security for the food makers of tomorrow: windows
of opportunity in drought-prone savannahs. Water Science and Technology 43(4):
71–78.
Rockström, J. and M. Falkenmark. 2000. Semiarid crop production from a hydrological
perspective –gap between potential and actual yields. Critical Reviews of Plant
Science 19(4): 319–346.
Rockström, J. and J. Barron. 2007. Water productivity in rainfed systems: Overview of
Challenges and Analysis of Opportunities in Water Scarcity Prone Savannahs.
Irrigation Science 25: 299–311.
Rockström, J., P. Kaumbutho, J. Mwalley et al. 2009. Conservation farming strategies in
East and Southern Africa: Yields and rain water productivity from on-farm action
research. Soilsand Tillage Research 103:23–32.
Rockström, J., and K. Steiner. 2003. Conservation farming–a strategy for improved
agricultural and water productivity among small-holder farmers in drought prone
environments. In: Water conservation technologies for sustainable dryland
agriculture in sub-Saharan Africa, ed. D. Beukes, M. De Villiers, S. Mkhize et al.
Proceedings of the International Water Conservation Technologies Workshop,
Blomfontein, South Africa, April 8–11.
Rockström, J., L. Karlberg, S.P. Wani et al. 2010. Managing water in rainfed agriculture –
The need for a paradigm shift. Agricultural Water Management 97:543–550.
Santos, H.P., R.P. Zentner, F. Selles, and I. Ambrosi. 1993. Effects of Crop Rotation on
Yields, Soil Chemical Characteristics, and Economic Returns of Zero-till Barley in
Southern Brazil. Soil Till. Res., 28:141- 158.
Saxton, K.E. 2006. Soil Water Characteristics Calculator Software (on line).
Available at http://hydrolab.arsusda.gov/soilwater/Index.html, Accessed
67
on 19, April, 2012.
Seleshi Bekele, L. Philippe, and Tafa Tullu, 2009. Training Material on Agricultural Water
Management. IWMI (International Water Management Institute), Addis Ababa,
Ethiopia, ILRI (International Livestock Research Institute), Nairobi, Kenya and
Adama University, Adama, Ethioipia.
Seyoum, B. and Zinash, S. (1989). The composition of Ethiopian feeds. Institute of
Agricultural Research Report No 6, Addis Ababa, Ethiopia.
Singh, P., S.P. Wani, P. Pthak, K. L. Sahrawat and A. K. Singh. 2011. Increasing Crop
Water Productivity and Water Use Efficiency in Rainfed Agricultura. In: Integrated
Watershed Management in Rainfed Agriculture, eds. Suhas P. Wani, J. Rockestrom
and K. L. Sahrawat, a Balkeman Book, CRC Press, ICRISAT, India, pp. 315 – 348.
Solomon Nigusie. 2006. Intermediate Geography for Preparatory Level. Supplementary
Students’ Reference Book. Ed. Tesfaye Ejigu, Mega Distribution P.L.C.,
Commercial Printing Enterprise, Addis Ababa, 2006.
Steduto, P., J.W. Kijne, M.A. Hanjira, P.S. Bindraba. 2007. Pathways for Increasing
Agricutural Water Productivity. In: Water Productivity in Agriculture: Limits and
Opportunities for Improvement, eds. J.W., Kijne, R. Barker and D. Molden;
Comprehensive Assessment of Water Management in Agriculture Series 1, UK;
London: CABI Publishing; and International Water Management Institute (IWMI),
Colombo, Sir Lanka.
Steiner, J. L. 1986. Dryland grain sorghum water use, light interception, and growth
responses to planting geometry.Agronomy Journal 78:720-726.
Storck, H., Bezabih Emana, Berhanu Adenew et al. 1991. Farming systems and Farm
Management Practices os Small Holders in Hararghe Highlands – A baseline
Survey. Farming systems and resource economics in the tropics, Vol. 11.
Wissenschaftsverlag Vuak, Kiel, FRG.
SIWI. 2001. Water harvesting for upgrading of rainfed agriculture. Policy analysis and
research needs. SIWI Report II. Stockholm, Sweden: Stockholm International
Water Institute.
Tafa Tullu. 2002. Soil and Water Conservation for Sustainable Agriculture. Mega
Publishing Enterprise, Addis Ababa, Ethiopia. Pp.150.
Teklu Erkosa, Michael Menkir and Getnet D. Betrie. 2010. Effects of Bed Width and
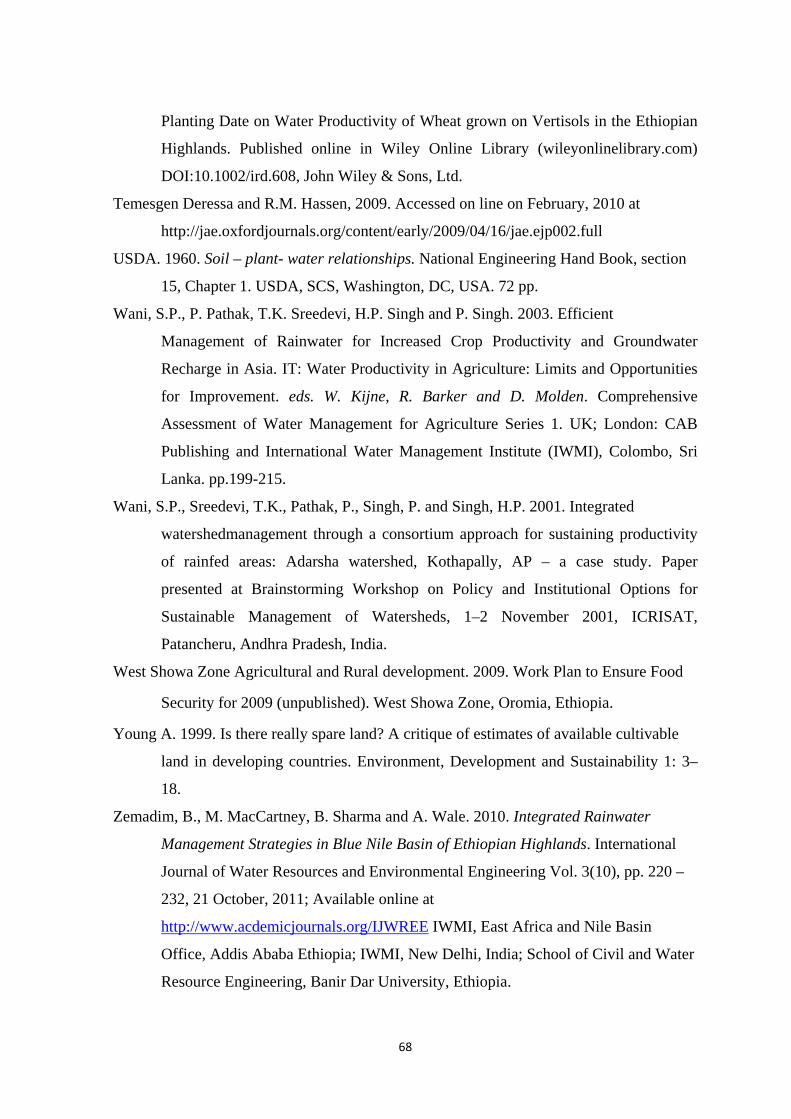
68
Planting Date on Water Productivity of Wheat grown on Vertisols in the Ethiopian
Highlands. Published online in Wiley Online Library (wileyonlinelibrary.com)
DOI:10.1002/ird.608, John Wiley & Sons, Ltd.
Temesgen Deressa and R.M. Hassen, 2009. Accessed on line on February, 2010 at
http://jae.oxfordjournals.org/content/early/2009/04/16/jae.ejp002.full
USDA. 1960. Soil – plant- water relationships. National Engineering Hand Book, section
15, Chapter 1. USDA, SCS, Washington, DC, USA. 72 pp.
Wani, S.P., P. Pathak, T.K. Sreedevi, H.P. Singh and P. Singh. 2003. Efficient
Management of Rainwater for Increased Crop Productivity and Groundwater
Recharge in Asia. IT: Water Productivity in Agriculture: Limits and Opportunities
for Improvement. eds. W. Kijne, R. Barker and D. Molden. Comprehensive
Assessment of Water Management for Agriculture Series 1. UK; London: CAB
Publishing and International Water Management Institute (IWMI), Colombo, Sri
Lanka. pp.199-215.
Wani, S.P., Sreedevi, T.K., Pathak, P., Singh, P. and Singh, H.P. 2001. Integrated
watershedmanagement through a consortium approach for sustaining productivity
of rainfed areas: Adarsha watershed, Kothapally, AP – a case study. Paper
presented at Brainstorming Workshop on Policy and Institutional Options for
Sustainable Management of Watersheds, 1–2 November 2001, ICRISAT,
Patancheru, Andhra Pradesh, India.
West Showa Zone Agricultural and Rural development. 2009. Work Plan to Ensure Food
Security for 2009 (unpublished). West Showa Zone, Oromia, Ethiopia.
Young A. 1999. Is there really spare land? A critique of estimates of available cultivable
land in developing countries. Environment, Development and Sustainability 1: 3–
18.
Zemadim, B., M. MacCartney, B. Sharma and A. Wale. 2010. Integrated Rainwater
Management Strategies in Blue Nile Basin of Ethiopian Highlands. International
Journal of Water Resources and Environmental Engineering Vol. 3(10), pp. 220 –
232, 21 October, 2011; Available online at
http://www.acdemicjournals.org/IJWREE IWMI, East Africa and Nile Basin
Office, Addis Ababa Ethiopia; IWMI, New Delhi, India; School of Civil and Water
Resource Engineering, Banir Dar University, Ethiopia.
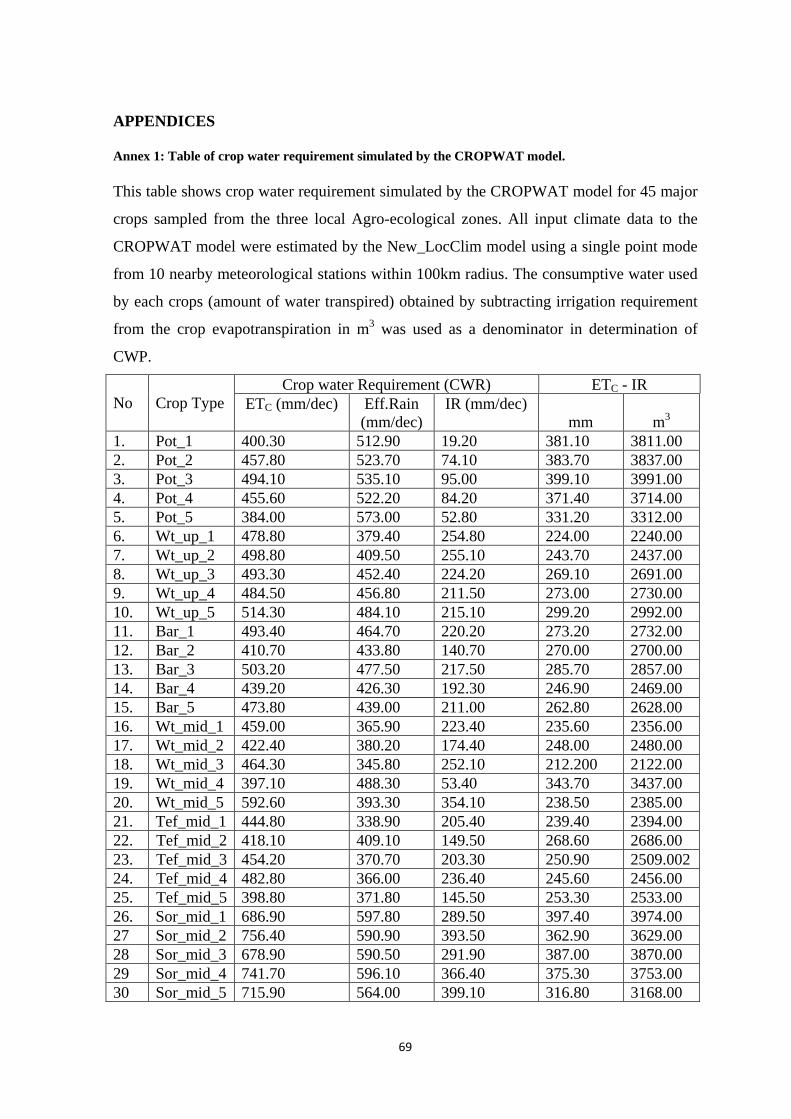
69
APPENDICES Annex 1: Table of crop water requirement simulated by the CROPWAT model. This table shows crop water requirement simulated by the CROPWAT model for 45 major
crops sampled from the three local Agro-ecological zones. All input climate data to the
CROPWAT model were estimated by the New_LocClim model using a single point mode
from 10 nearby meteorological stations within 100km radius. The consumptive water used
by each crops (amount of water transpired) obtained by subtracting irrigation requirement
from the crop evapotranspiration in m3 was used as a denominator in determination of
CWP.
No
Crop Type
Crop water Requirement (CWR) ETC - IR ETC (mm/dec) Eff.Rain
(mm/dec) IR (mm/dec)
mm
m3 1. Pot_1 400.30 512.90 19.20 381.10 3811.00 2. Pot_2 457.80 523.70 74.10 383.70 3837.00 3. Pot_3 494.10 535.10 95.00 399.10 3991.00 4. Pot_4 455.60 522.20 84.20 371.40 3714.00 5. Pot_5 384.00 573.00 52.80 331.20 3312.00 6. Wt_up_1 478.80 379.40 254.80 224.00 2240.00 7. Wt_up_2 498.80 409.50 255.10 243.70 2437.00 8. Wt_up_3 493.30 452.40 224.20 269.10 2691.00 9. Wt_up_4 484.50 456.80 211.50 273.00 2730.00 10. Wt_up_5 514.30 484.10 215.10 299.20 2992.00 11. Bar_1 493.40 464.70 220.20 273.20 2732.00 12. Bar_2 410.70 433.80 140.70 270.00 2700.00 13. Bar_3 503.20 477.50 217.50 285.70 2857.00 14. Bar_4 439.20 426.30 192.30 246.90 2469.00 15. Bar_5 473.80 439.00 211.00 262.80 2628.00 16. Wt_mid_1 459.00 365.90 223.40 235.60 2356.00 17. Wt_mid_2 422.40 380.20 174.40 248.00 2480.00 18. Wt_mid_3 464.30 345.80 252.10 212.200 2122.00 19. Wt_mid_4 397.10 488.30 53.40 343.70 3437.00 20. Wt_mid_5 592.60 393.30 354.10 238.50 2385.00 21. Tef_mid_1 444.80 338.90 205.40 239.40 2394.00 22. Tef_mid_2 418.10 409.10 149.50 268.60 2686.00 23. Tef_mid_3 454.20 370.70 203.30 250.90 2509.002 24. Tef_mid_4 482.80 366.00 236.40 245.60 2456.00 25. Tef_mid_5 398.80 371.80 145.50 253.30 2533.00 26. Sor_mid_1 686.90 597.80 289.50 397.40 3974.00 27 Sor_mid_2 756.40 590.90 393.50 362.90 3629.00 28 Sor_mid_3 678.90 590.50 291.90 387.00 3870.00 29 Sor_mid_4 741.70 596.10 366.40 375.30 3753.00 30 Sor_mid_5 715.90 564.00 399.10 316.80 3168.00
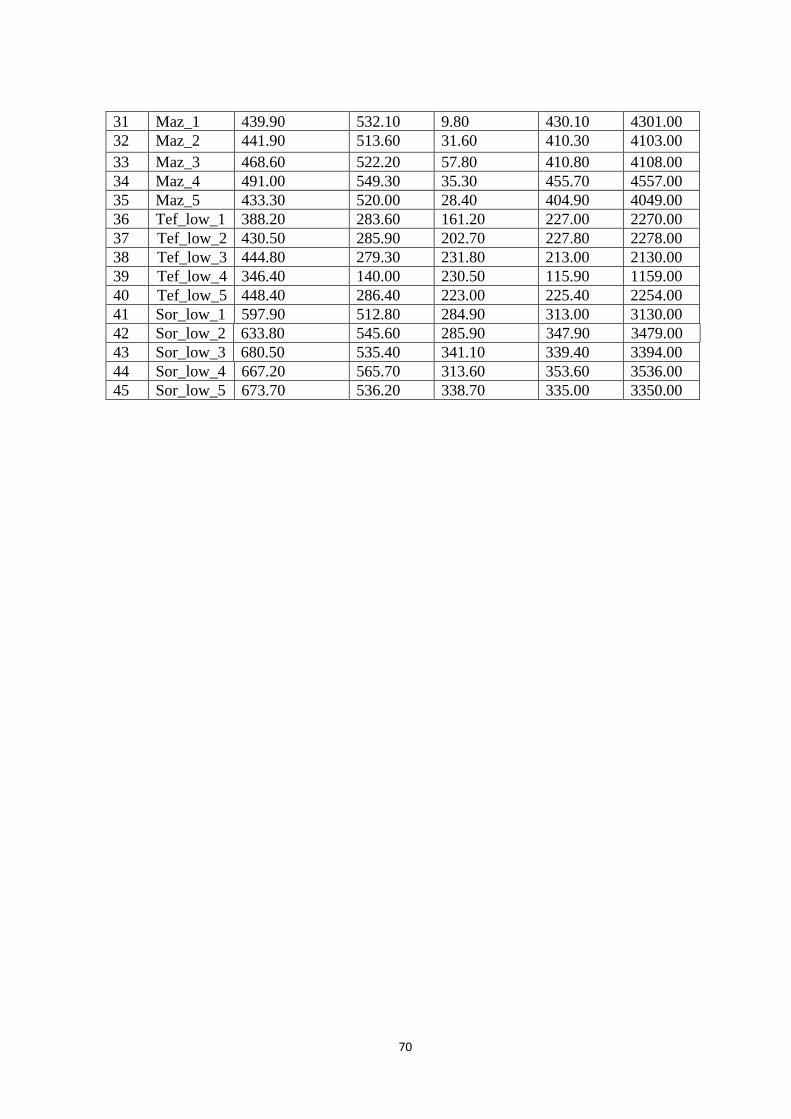
70
31 Maz_1 439.90 532.10 9.80 430.10 4301.00 32 Maz_2 441.90 513.60 31.60 410.30 4103.00 33 Maz_3 468.60 522.20 57.80 410.80 4108.00 34 Maz_4 491.00 549.30 35.30 455.70 4557.00 35 Maz_5 433.30 520.00 28.40 404.90 4049.00 36 Tef_low_1 388.20 283.60 161.20 227.00 2270.00 37 Tef_low_2 430.50 285.90 202.70 227.80 2278.00 38 Tef_low_3 444.80 279.30 231.80 213.00 2130.00 39 Tef_low_4 346.40 140.00 230.50 115.90 1159.00 40 Tef_low_5 448.40 286.40 223.00 225.40 2254.00 41 Sor_low_1 597.90 512.80 284.90 313.00 3130.00 42 Sor_low_2 633.80 545.60 285.90 347.90 3479.00 43 Sor_low_3 680.50 535.40 341.10 339.40 3394.00 44 Sor_low_4 667.20 565.70 313.60 353.60 3536.00 45 Sor_low_5 673.70 536.20 338.70 335.00 3350.00

71
Annex 2: Table of soil water characteristics of the 45 sampled crop fields simulated by soil-water characteristics calculator model. It was simulated using National Laboratory analysis result of soil texture as input which
was obtained from IWMI. The first three results of soil water characteristics were used as
input to the CROPWAT model in determination of CWR.
Agro-Ecology
Crop Field
Soil Name
Soil-Water-Characteristics TAM
(mm/m) MRIR
(mm/day) ISMD (%)
IASM (mm/m)
Upper Zone
Pot_1 Clay 130.00 63.00 29.00 92.30 Pot_2 Clay 130.00 63.00 29.00 92.30 Pot_3 Clay 120.00 49.00 30.00 84.00 Pot_4 Clay 130.00 48.00 28.00 93.60 Pot_5 Clay 110.00 72.00 33.00 73.70 Wt_up_1 Clay 130.00 63.00 29.00 92.30 Wt_up_2 Clay 130.00 63.00 29.00 92.30 Wt_up_3 Clay 110.00 72.00 33.00 73.70 Wt_up_4 Silty Clay 130.00 53.00 30.00 91.00 Wt_up_5 Clay 130.00 60.00 28.00 93.60 Bar_1 Clay 110.00 72.00 32.90 73.70 Bar_2 Clay 130.00 48.00 28.00 93.60 Bar_3 Clay 110.00 72.00 33.00 73.70 Bar_4 Clay 130.00 63.00 29.00 92.30 Bar_5 Clay 130.00 63.00 29.00 92.30
Middle Zone
Wt_mid_1 Caly 130.00 48.00 28.00 93.60 Wt_mid_2 Silty Clay 130.00 71.00 30.00 91.00 Wt_mid_3 Clay 130.00 67.00 30.00 91.00 Wt_mid_4 Silty Caly 130.00 71.00 30.00 91.00 Wt_mid_5 Caly 120.00 59.00 32.00 81.60 Tef_mid_1 Silty Caly 130.00 53.00 30.00 91.00 Tef_mid_2 Clay 120.00 59.00 32.00 81.60 Tef_mid_3 Clay 120.00 59.00 32.00 81.60 Tef_mid_4 Silty Caly 130.00 53.00 30.00 91.00 Tef_mid_5 Silty Caly 130.00 71.00 30.00 91.00 Sor-mid_1 Clay 120.00 49.00 30.00 84.00 Sor-mid_2 Silty Clay 130.00 71.00 30.00 91.00 Sor-mid_3 Silty Clay 130.00 53.00 30.00 91.00 Sor-mid_4 Clay 120.00 59.00 32.00 81.60 Sor-mid_5 Clay 130.00 48.00 28.00 93.60
Lower Zone
Maz_2 Clay Loam 140.00 109.00 21.00 110.60 Maz_3 Clay Loam 140.00 109.00 21.00 110.60 Maz_4 Clay Loam 140.00 109.00 21.00 110.60 Maz_5 Clay Loam 140.00 109.00 21.00 110.60 Tef_low_1 Clay Loam 140.00 109.00 21.00 110.60 Tef_low_2 Clay Loam 140.00 109.00 21.00 110.60 Tef_low_3 Clay Loam 140.00 109.00 21.00 110.60
72
Tef_low_4 Clay Loam 140.00 109.00 21.00 110.60 (Continued)
Tef_low_5 Clay Loam 140.00 109.00 21.00 110.60 Sor_low_1 Clay Loam 140.00 109.00 21.00 110.60 Sor_low_2 Clay Loam 140.00 109.00 21.00 110.60 Sor_low_3 Clay Loam 140.00 109.00 21.00 110.60 Sor_low_4 Clay 120.00 62.00 32.00 81.60 Sor_low_5 Clay Loam 140.00 109.00 21.00 110.60
TAM = Total Available Moisture; MRIR = Maximum Rain Infiltration Rate; ISMD =
Initial Soil Moisture Depletion; IASM = Initial Available Soil Moisture; Pot_1 to Pot_5 =
the five sampled potato fields; Wt_up_1 to 5 = the five sampled wheat crop field taken
from the upper zone of the watershed; Bar_1 to 5 = the five sampled barley crop fields;
Wt_mid_1 to 5 = the five sampled wheat fields from the middle zone; Tef_mid_1 to 5 =
five Sampled teff fields from the middle zone of the watershed; Sor_mid_1 to 5 = five
sampled sorghum fields selected from the middle zone; Maz_1 to 5 = five sampled maize
fields selected from outside of the watershed (lower zone); tef_low_1 to 5 = the five
sampled teff crop fields from outside of the watershed and Sor_low_1 to 5 = the five
sampled sorghum crop fields from outside of the watershed.
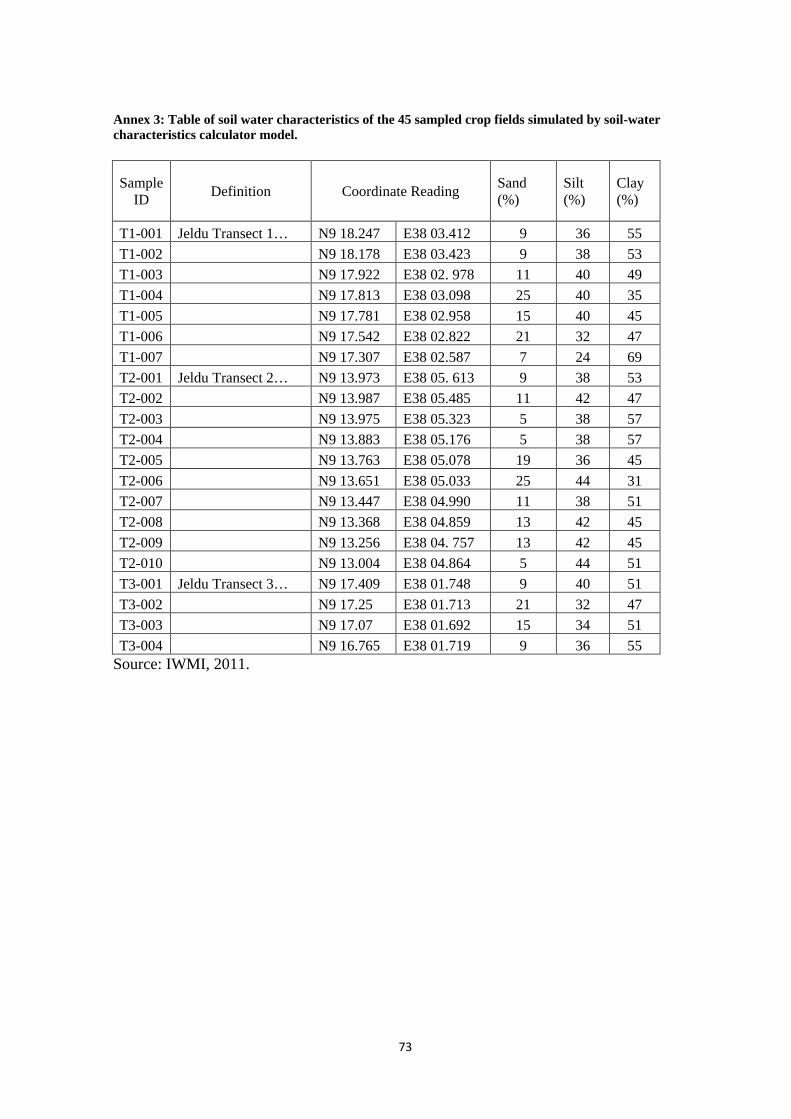
73
Annex 3: Table of soil water characteristics of the 45 sampled crop fields simulated by soil-water characteristics calculator model.
Sample ID Definition Coordinate Reading Sand
(%) Silt (%)
Clay (%)
T1-001 Jeldu Transect 1… N9 18.247 E38 03.412 9 36 55 T1-002 N9 18.178 E38 03.423 9 38 53 T1-003 N9 17.922 E38 02. 978 11 40 49 T1-004 N9 17.813 E38 03.098 25 40 35 T1-005 N9 17.781 E38 02.958 15 40 45 T1-006 N9 17.542 E38 02.822 21 32 47 T1-007 N9 17.307 E38 02.587 7 24 69 T2-001 Jeldu Transect 2… N9 13.973 E38 05. 613 9 38 53 T2-002 N9 13.987 E38 05.485 11 42 47 T2-003 N9 13.975 E38 05.323 5 38 57 T2-004 N9 13.883 E38 05.176 5 38 57 T2-005 N9 13.763 E38 05.078 19 36 45 T2-006 N9 13.651 E38 05.033 25 44 31 T2-007 N9 13.447 E38 04.990 11 38 51 T2-008 N9 13.368 E38 04.859 13 42 45 T2-009 N9 13.256 E38 04. 757 13 42 45 T2-010 N9 13.004 E38 04.864 5 44 51 T3-001 Jeldu Transect 3… N9 17.409 E38 01.748 9 40 51 T3-002 N9 17.25 E38 01.713 21 32 47 T3-003 N9 17.07 E38 01.692 15 34 51 T3-004 N9 16.765 E38 01.719 9 36 55
Source: IWMI, 2011.

74
Annex 4: Figure of land use land cover map of Meja watershed for the year 2011
Source: Field Survey, 2011. Annex 5: Table of data codes used for SPSS entry.
Variable Name Codes Agro-Ecology 1= Upper Zone; 2= Middle zone; 3= Lower Zone. Crop Types
1 = Barley; 2 = Potato; 3 = Wheat; 4 = Teff; 5 = Sorghum; 6 = Maize
Crop Variety 1 = Improved Variety (IV); 2 = Local Variety (LV) Compost Applied 1 = Yes; 2 = No Precursor Crop 1 = Fallow; 2 = Legume; 3 = None legume but same; 4 = None
legume but different Method of sowing 1 = Broadcast; 2 = Rows Application of FYM 1 = Applied; 2 = Not applied

75
Annex 6: Table of crop area statistics of the study watershed.
Crop Type Area coverage (ha)
% age share
Barley 2110 25 Wheat 803 9 Potato and Enset 692.21 8 Teff 205 2.4 Bean 154 2 Field Pea 83 0.97 Sorghum 81 0.95 Flax 57 0.67 Maize 12 0.14 Niger Seed 4 0.05 Uncultivated Land
4335 51
Total Area 8536.21 100
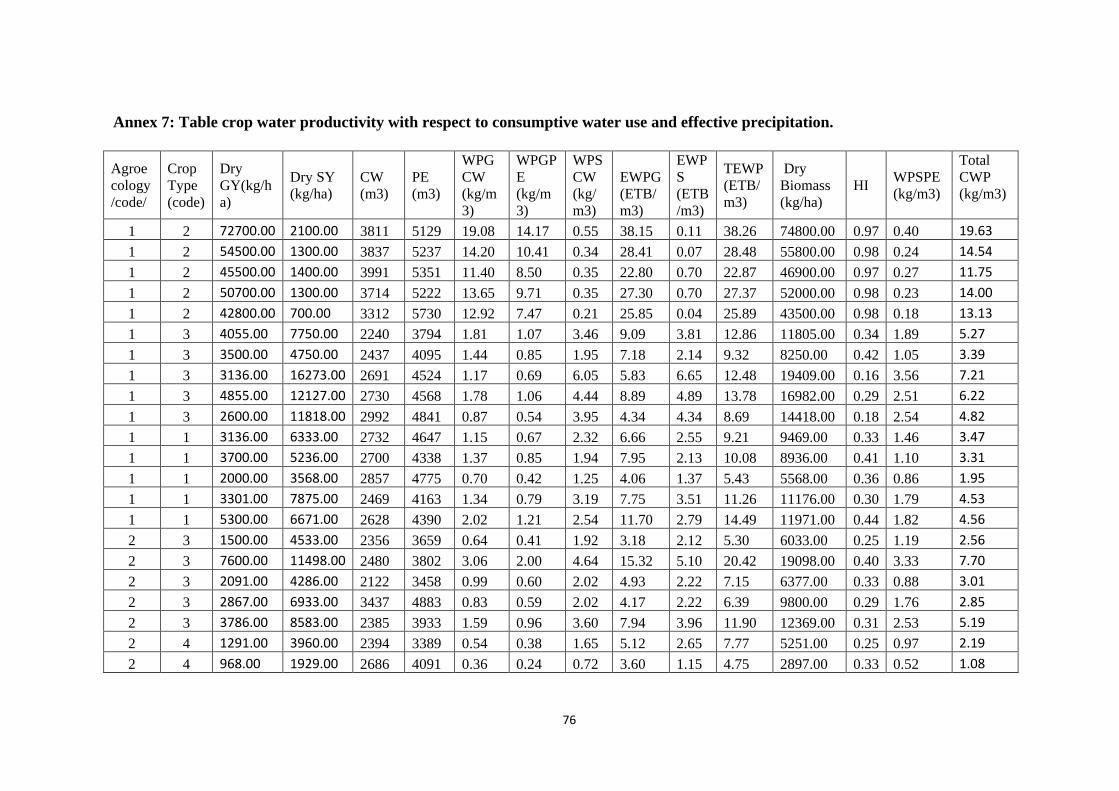
76
Annex 7: Table crop water productivity with respect to consumptive water use and effective precipitation.
Agroecology/code/
Crop Type (code)
Dry GY(kg/ha)
Dry SY (kg/ha)
CW (m3)
PE (m3)
WPGCW (kg/m3)
WPGPE (kg/m3)
WPSCW (kg/m3)
EWPG (ETB/m3)
EWPS (ETB/m3)
TEWP (ETB/m3)
Dry Biomass (kg/ha)
HI WPSPE (kg/m3)
Total CWP (kg/m3)
1 2 72700.00 2100.00 3811 5129 19.08 14.17 0.55 38.15 0.11 38.26 74800.00 0.97 0.40 19.63 1 2 54500.00 1300.00 3837 5237 14.20 10.41 0.34 28.41 0.07 28.48 55800.00 0.98 0.24 14.54 1 2 45500.00 1400.00 3991 5351 11.40 8.50 0.35 22.80 0.70 22.87 46900.00 0.97 0.27 11.75 1 2 50700.00 1300.00 3714 5222 13.65 9.71 0.35 27.30 0.70 27.37 52000.00 0.98 0.23 14.00 1 2 42800.00 700.00 3312 5730 12.92 7.47 0.21 25.85 0.04 25.89 43500.00 0.98 0.18 13.13 1 3 4055.00 7750.00 2240 3794 1.81 1.07 3.46 9.09 3.81 12.86 11805.00 0.34 1.89 5.27 1 3 3500.00 4750.00 2437 4095 1.44 0.85 1.95 7.18 2.14 9.32 8250.00 0.42 1.05 3.39 1 3 3136.00 16273.00 2691 4524 1.17 0.69 6.05 5.83 6.65 12.48 19409.00 0.16 3.56 7.21 1 3 4855.00 12127.00 2730 4568 1.78 1.06 4.44 8.89 4.89 13.78 16982.00 0.29 2.51 6.22 1 3 2600.00 11818.00 2992 4841 0.87 0.54 3.95 4.34 4.34 8.69 14418.00 0.18 2.54 4.82 1 1 3136.00 6333.00 2732 4647 1.15 0.67 2.32 6.66 2.55 9.21 9469.00 0.33 1.46 3.47 1 1 3700.00 5236.00 2700 4338 1.37 0.85 1.94 7.95 2.13 10.08 8936.00 0.41 1.10 3.31 1 1 2000.00 3568.00 2857 4775 0.70 0.42 1.25 4.06 1.37 5.43 5568.00 0.36 0.86 1.95 1 1 3301.00 7875.00 2469 4163 1.34 0.79 3.19 7.75 3.51 11.26 11176.00 0.30 1.79 4.53 1 1 5300.00 6671.00 2628 4390 2.02 1.21 2.54 11.70 2.79 14.49 11971.00 0.44 1.82 4.56 2 3 1500.00 4533.00 2356 3659 0.64 0.41 1.92 3.18 2.12 5.30 6033.00 0.25 1.19 2.56 2 3 7600.00 11498.00 2480 3802 3.06 2.00 4.64 15.32 5.10 20.42 19098.00 0.40 3.33 7.70 2 3 2091.00 4286.00 2122 3458 0.99 0.60 2.02 4.93 2.22 7.15 6377.00 0.33 0.88 3.01 2 3 2867.00 6933.00 3437 4883 0.83 0.59 2.02 4.17 2.22 6.39 9800.00 0.29 1.76 2.85 2 3 3786.00 8583.00 2385 3933 1.59 0.96 3.60 7.94 3.96 11.90 12369.00 0.31 2.53 5.19 2 4 1291.00 3960.00 2394 3389 0.54 0.38 1.65 5.12 2.65 7.77 5251.00 0.25 0.97 2.19 2 4 968.00 1929.00 2686 4091 0.36 0.24 0.72 3.60 1.15 4.75 2897.00 0.33 0.52 1.08
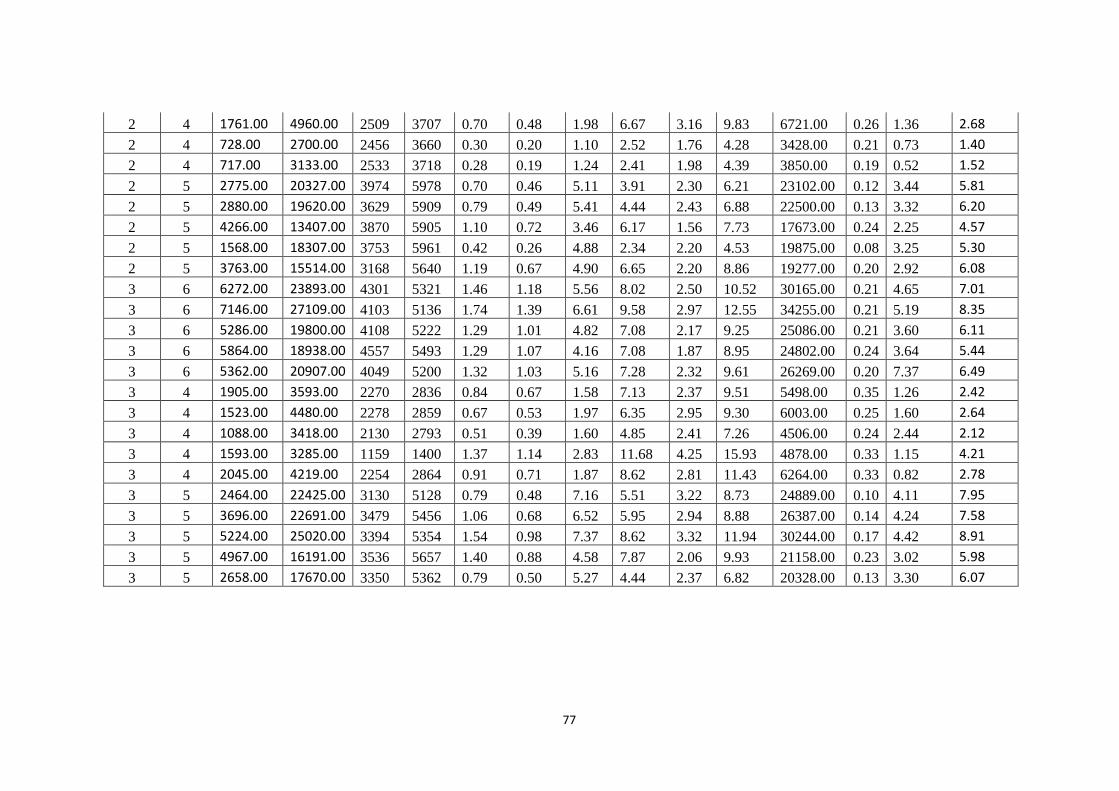
77
2 4 1761.00 4960.00 2509 3707 0.70 0.48 1.98 6.67 3.16 9.83 6721.00 0.26 1.36 2.68 2 4 728.00 2700.00 2456 3660 0.30 0.20 1.10 2.52 1.76 4.28 3428.00 0.21 0.73 1.40 2 4 717.00 3133.00 2533 3718 0.28 0.19 1.24 2.41 1.98 4.39 3850.00 0.19 0.52 1.52 2 5 2775.00 20327.00 3974 5978 0.70 0.46 5.11 3.91 2.30 6.21 23102.00 0.12 3.44 5.81 2 5 2880.00 19620.00 3629 5909 0.79 0.49 5.41 4.44 2.43 6.88 22500.00 0.13 3.32 6.20 2 5 4266.00 13407.00 3870 5905 1.10 0.72 3.46 6.17 1.56 7.73 17673.00 0.24 2.25 4.57 2 5 1568.00 18307.00 3753 5961 0.42 0.26 4.88 2.34 2.20 4.53 19875.00 0.08 3.25 5.30 2 5 3763.00 15514.00 3168 5640 1.19 0.67 4.90 6.65 2.20 8.86 19277.00 0.20 2.92 6.08 3 6 6272.00 23893.00 4301 5321 1.46 1.18 5.56 8.02 2.50 10.52 30165.00 0.21 4.65 7.01 3 6 7146.00 27109.00 4103 5136 1.74 1.39 6.61 9.58 2.97 12.55 34255.00 0.21 5.19 8.35 3 6 5286.00 19800.00 4108 5222 1.29 1.01 4.82 7.08 2.17 9.25 25086.00 0.21 3.60 6.11 3 6 5864.00 18938.00 4557 5493 1.29 1.07 4.16 7.08 1.87 8.95 24802.00 0.24 3.64 5.44 3 6 5362.00 20907.00 4049 5200 1.32 1.03 5.16 7.28 2.32 9.61 26269.00 0.20 7.37 6.49 3 4 1905.00 3593.00 2270 2836 0.84 0.67 1.58 7.13 2.37 9.51 5498.00 0.35 1.26 2.42 3 4 1523.00 4480.00 2278 2859 0.67 0.53 1.97 6.35 2.95 9.30 6003.00 0.25 1.60 2.64 3 4 1088.00 3418.00 2130 2793 0.51 0.39 1.60 4.85 2.41 7.26 4506.00 0.24 2.44 2.12 3 4 1593.00 3285.00 1159 1400 1.37 1.14 2.83 11.68 4.25 15.93 4878.00 0.33 1.15 4.21 3 4 2045.00 4219.00 2254 2864 0.91 0.71 1.87 8.62 2.81 11.43 6264.00 0.33 0.82 2.78 3 5 2464.00 22425.00 3130 5128 0.79 0.48 7.16 5.51 3.22 8.73 24889.00 0.10 4.11 7.95 3 5 3696.00 22691.00 3479 5456 1.06 0.68 6.52 5.95 2.94 8.88 26387.00 0.14 4.24 7.58 3 5 5224.00 25020.00 3394 5354 1.54 0.98 7.37 8.62 3.32 11.94 30244.00 0.17 4.42 8.91 3 5 4967.00 16191.00 3536 5657 1.40 0.88 4.58 7.87 2.06 9.93 21158.00 0.23 3.02 5.98 3 5 2658.00 17670.00 3350 5362 0.79 0.50 5.27 4.44 2.37 6.82 20328.00 0.13 3.30 6.07
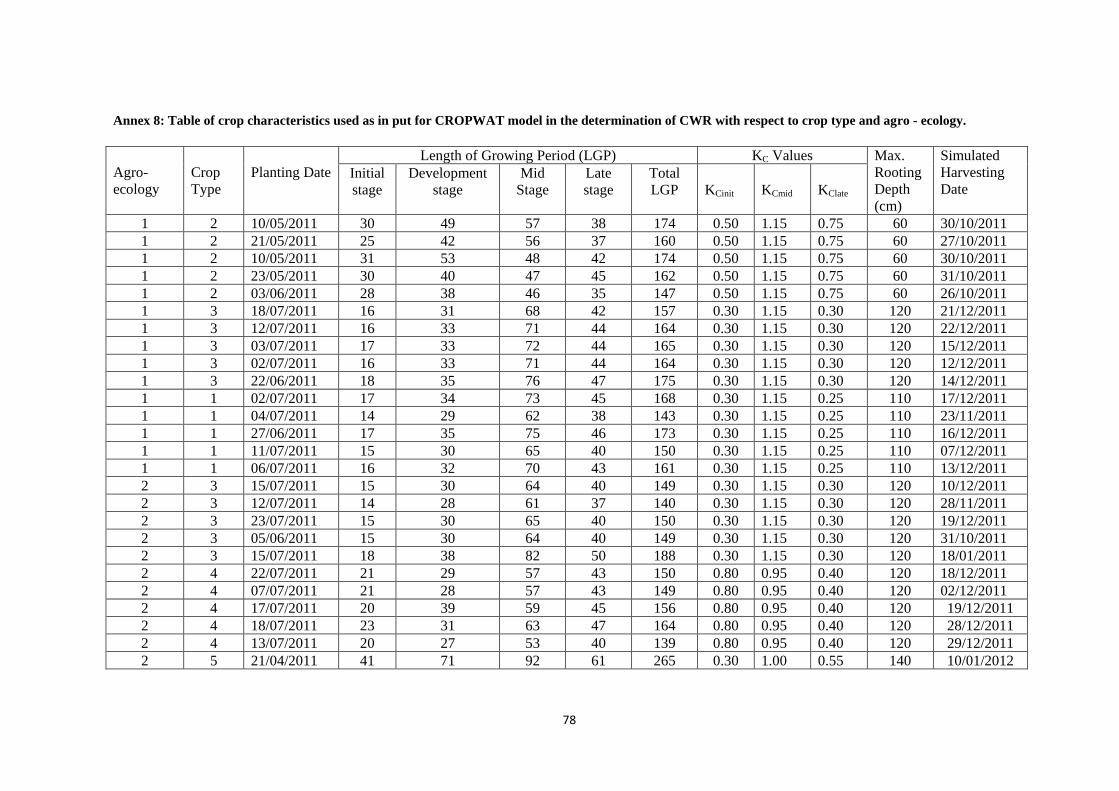
78
Annex 8: Table of crop characteristics used as in put for CROPWAT model in the determination of CWR with respect to crop type and agro - ecology. Agro-ecology
Crop Type
Planting Date
Length of Growing Period (LGP) KC Values Max. Rooting Depth (cm)
Simulated Harvesting Date
Initial stage
Development stage
Mid Stage
Late stage
Total LGP
KCinit
KCmid
KClate
1 2 10/05/2011 30 49 57 38 174 0.50 1.15 0.75 60 30/10/2011 1 2 21/05/2011 25 42 56 37 160 0.50 1.15 0.75 60 27/10/2011 1 2 10/05/2011 31 53 48 42 174 0.50 1.15 0.75 60 30/10/2011 1 2 23/05/2011 30 40 47 45 162 0.50 1.15 0.75 60 31/10/2011 1 2 03/06/2011 28 38 46 35 147 0.50 1.15 0.75 60 26/10/2011 1 3 18/07/2011 16 31 68 42 157 0.30 1.15 0.30 120 21/12/2011 1 3 12/07/2011 16 33 71 44 164 0.30 1.15 0.30 120 22/12/2011 1 3 03/07/2011 17 33 72 44 165 0.30 1.15 0.30 120 15/12/2011 1 3 02/07/2011 16 33 71 44 164 0.30 1.15 0.30 120 12/12/2011 1 3 22/06/2011 18 35 76 47 175 0.30 1.15 0.30 120 14/12/2011 1 1 02/07/2011 17 34 73 45 168 0.30 1.15 0.25 110 17/12/2011 1 1 04/07/2011 14 29 62 38 143 0.30 1.15 0.25 110 23/11/2011 1 1 27/06/2011 17 35 75 46 173 0.30 1.15 0.25 110 16/12/2011 1 1 11/07/2011 15 30 65 40 150 0.30 1.15 0.25 110 07/12/2011 1 1 06/07/2011 16 32 70 43 161 0.30 1.15 0.25 110 13/12/2011 2 3 15/07/2011 15 30 64 40 149 0.30 1.15 0.30 120 10/12/2011 2 3 12/07/2011 14 28 61 37 140 0.30 1.15 0.30 120 28/11/2011 2 3 23/07/2011 15 30 65 40 150 0.30 1.15 0.30 120 19/12/2011 2 3 05/06/2011 15 30 64 40 149 0.30 1.15 0.30 120 31/10/2011 2 3 15/07/2011 18 38 82 50 188 0.30 1.15 0.30 120 18/01/2011 2 4 22/07/2011 21 29 57 43 150 0.80 0.95 0.40 120 18/12/2011 2 4 07/07/2011 21 28 57 43 149 0.80 0.95 0.40 120 02/12/2011 2 4 17/07/2011 20 39 59 45 156 0.80 0.95 0.40 120 19/12/2011 2 4 18/07/2011 23 31 63 47 164 0.80 0.95 0.40 120 28/12/2011 2 4 13/07/2011 20 27 53 40 139 0.80 0.95 0.40 120 29/12/2011 2 5 21/04/2011 41 71 92 61 265 0.30 1.00 0.55 140 10/01/2012

79
2 5 05/05/2011 44 76 98 65 283 0.30 1.00 0.55 140 11/02/2011 2 5 26/04/2011 40 71 91 61 262 0.30 1.00 0.55 140 13/02/2011 2 5 03/05/2011 43 76 97 65 281 0.30 1.00 0.55 140 07/02/2011 3 5 23/05/2011 41 71 92 61 265 0.30 1.00 0.55 140 11/02/2011 3 6 18/04/2011 28 47 56 37 168 0.30 1.20 0.35 100 02/10/2011 3 6 03/05/2011 28 47 56 37 168 0.30 1.20 0.35 100 17/10/2011 3 6 02/05/2011 30 49 59 39 177 0.30 1.20 0.35 100 25/10/2011 3 6 18/04/2011 31 51 62 41 185 0.30 1.20 0.35 100 19/10/2011 3 6 06/04/2011 28 46 56 37 167 0.30 1.20 0.35 100 19/10/2011 3 4 25/07/2011 18 24 49 37 128 0.80 0.95 0.40 120 29/11/2011 3 4 25/07/2011 20 27 53 40 139 0.80 0.95 0.40 120 11/12/2011 3 4 28/07/2011 20 27 55 41 143 0.80 0.95 0.40 120 17/12/2011 3 4 30/08/2011 15 21 41 31 108 0.80 0.95 0.40 120 15/12/2011 3 4 27/07/2011 21 28 55 41 145 0.80 0.95 0.40 120 18/12/2011 3 5 23/05/2011 34 60 77 50 222 0.30 1.00 0.55 140 29/12/2011 3 5 08/05/2011 37 64 82 55 237 0.30 1.00 0.55 140 31/12/2011 3 5 12/05/2011 38 67 86 58 249 0.30 1.00 0.55 140 15/01/2012 3 5 05/05/2011 40 69 89 59 257 0.30 1.00 0.55 140 16/01/2012 3 5 13/05/2011 38 66 85 56 244 0.30 1.00 0.55 140 14/01/2012
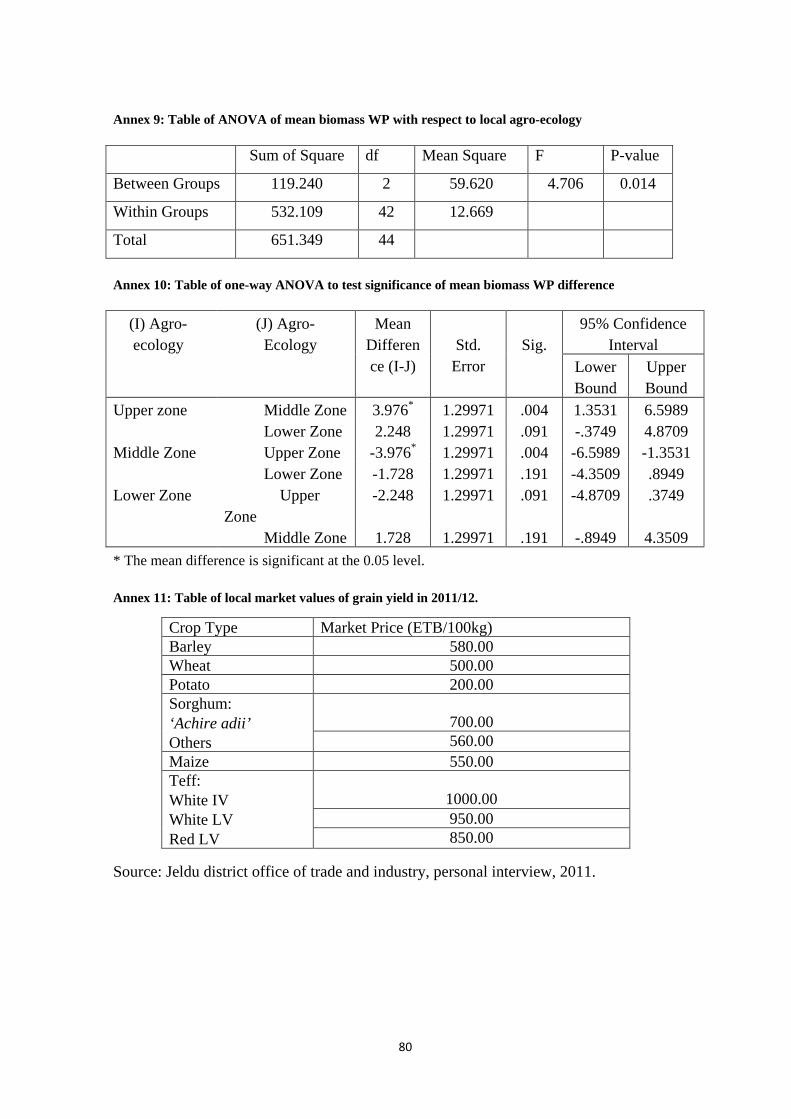
80
Annex 9: Table of ANOVA of mean biomass WP with respect to local agro-ecology Sum of Square df Mean Square F P-value
Between Groups 119.240 2 59.620 4.706 0.014
Within Groups 532.109 42 12.669
Total 651.349 44
Annex 10: Table of one-way ANOVA to test significance of mean biomass WP difference (I) Agro- ecology
(J) Agro- Ecology
Mean Difference (I-J)
Std.
Error
Sig.
95% Confidence Interval
Lower Bound
Upper Bound
Upper zone Middle Zone 3.976* 1.29971 .004 1.3531 6.5989 Lower Zone 2.248 1.29971 .091 -.3749 4.8709
Middle Zone Upper Zone -3.976* 1.29971 .004 -6.5989 -1.3531 Lower Zone -1.728 1.29971 .191 -4.3509 .8949
Lower Zone Upper Zone
-2.248 1.29971 .091 -4.8709 .3749
Middle Zone 1.728 1.29971 .191 -.8949 4.3509 * The mean difference is significant at the 0.05 level.
Annex 11: Table of local market values of grain yield in 2011/12. Source: Jeldu district office of trade and industry, personal interview, 2011.
Crop Type Market Price (ETB/100kg) Barley 580.00 Wheat 500.00 Potato 200.00 Sorghum:
‘Achire adii’ Others
700.00 560.00
Maize 550.00 Teff:
White IV White LV Red LV
1000.00 950.00 850.00
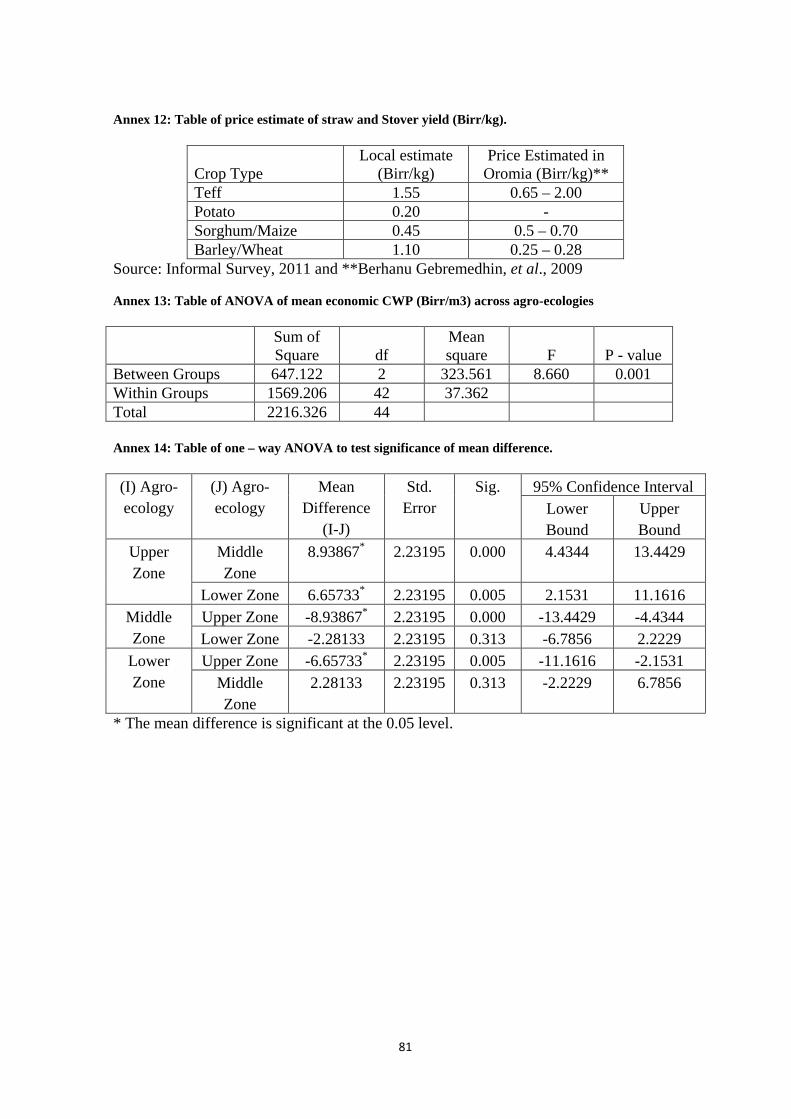
81
Annex 12: Table of price estimate of straw and Stover yield (Birr/kg).
Crop Type
Local estimate (Birr/kg)
Price Estimated in Oromia (Birr/kg)**
Teff 1.55 0.65 – 2.00 Potato 0.20 - Sorghum/Maize 0.45 0.5 – 0.70 Barley/Wheat 1.10 0.25 – 0.28
Source: Informal Survey, 2011 and **Berhanu Gebremedhin, et al., 2009 Annex 13: Table of ANOVA of mean economic CWP (Birr/m3) across agro-ecologies Sum of
Square
df Mean square
F
P - value
Between Groups 647.122 2 323.561 8.660 0.001 Within Groups 1569.206 42 37.362 Total 2216.326 44 Annex 14: Table of one – way ANOVA to test significance of mean difference. (I) Agro-ecology
(J) Agro-ecology
Mean Difference
(I-J)
Std. Error
Sig. 95% Confidence Interval Lower Bound
Upper Bound
Upper Zone
Middle Zone
8.93867* 2.23195 0.000 4.4344 13.4429
Lower Zone 6.65733* 2.23195 0.005 2.1531 11.1616 Middle Zone
Upper Zone -8.93867* 2.23195 0.000 -13.4429 -4.4344 Lower Zone -2.28133 2.23195 0.313 -6.7856 2.2229
Lower Zone
Upper Zone -6.65733* 2.23195 0.005 -11.1616 -2.1531 Middle Zone
2.28133 2.23195 0.313 -2.2229 6.7856
* The mean difference is significant at the 0.05 level.
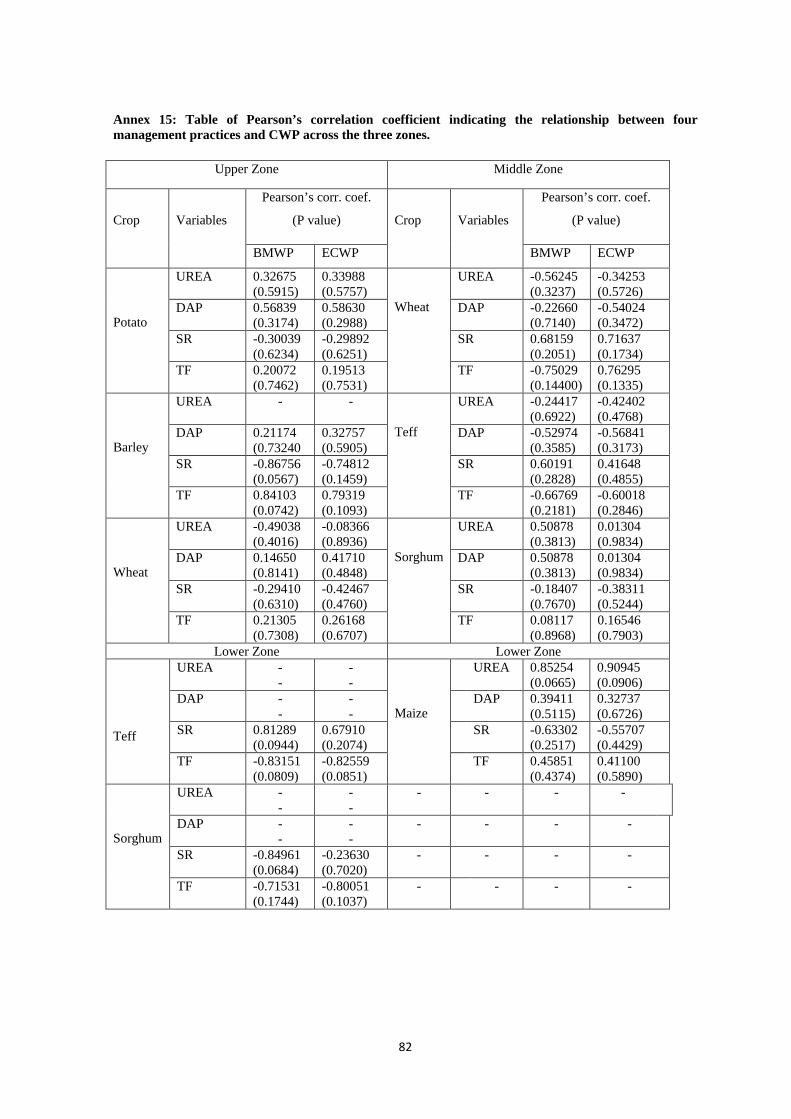
82
Annex 15: Table of Pearson’s correlation coefficient indicating the relationship between four management practices and CWP across the three zones.
Upper Zone Middle Zone
Crop
Variables
Pearson’s corr. coef.
(P value)
Crop
Variables
Pearson’s corr. coef.
(P value)
BMWP ECWP BMWP ECWP
Potato
UREA 0.32675 (0.5915)
0.33988 (0.5757)
Wheat
UREA -0.56245 (0.3237)
-0.34253 (0.5726)
DAP 0.56839 (0.3174)
0.58630 (0.2988)
DAP -0.22660 (0.7140)
-0.54024 (0.3472)
SR -0.30039 (0.6234)
-0.29892 (0.6251)
SR 0.68159 (0.2051)
0.71637 (0.1734)
TF 0.20072 (0.7462)
0.19513 (0.7531)
TF -0.75029 (0.14400)
0.76295 (0.1335)
Barley
UREA - - Teff
UREA -0.24417 (0.6922)
-0.42402 (0.4768)
DAP 0.21174 (0.73240
0.32757 (0.5905)
DAP -0.52974 (0.3585)
-0.56841 (0.3173)
SR -0.86756 (0.0567)
-0.74812 (0.1459)
SR 0.60191 (0.2828)
0.41648 (0.4855)
TF 0.84103 (0.0742)
0.79319 (0.1093)
TF -0.66769 (0.2181)
-0.60018 (0.2846)
Wheat
UREA -0.49038 (0.4016)
-0.08366 (0.8936)
Sorghum
UREA 0.50878 (0.3813)
0.01304 (0.9834)
DAP 0.14650 (0.8141)
0.41710 (0.4848)
DAP 0.50878 (0.3813)
0.01304 (0.9834)
SR -0.29410 (0.6310)
-0.42467 (0.4760)
SR -0.18407 (0.7670)
-0.38311 (0.5244)
TF 0.21305 (0.7308)
0.26168 (0.6707)
TF 0.08117 (0.8968)
0.16546 (0.7903)
Lower Zone Lower Zone
Teff
UREA - -
- -
Maize
UREA 0.85254 (0.0665)
0.90945 (0.0906)
DAP - -
- -
DAP 0.39411 (0.5115)
0.32737 (0.6726)
SR 0.81289 (0.0944)
0.67910 (0.2074)
SR -0.63302 (0.2517)
-0.55707 (0.4429)
TF -0.83151 (0.0809)
-0.82559 (0.0851)
TF 0.45851 (0.4374)
0.41100 (0.5890)
Sorghum
UREA - -
- -
- - - -
DAP - -
- -
- - - -
SR -0.84961 (0.0684)
-0.23630 (0.7020)
- - - -
TF -0.71531 (0.1744)
-0.80051 (0.1037)
- - - -
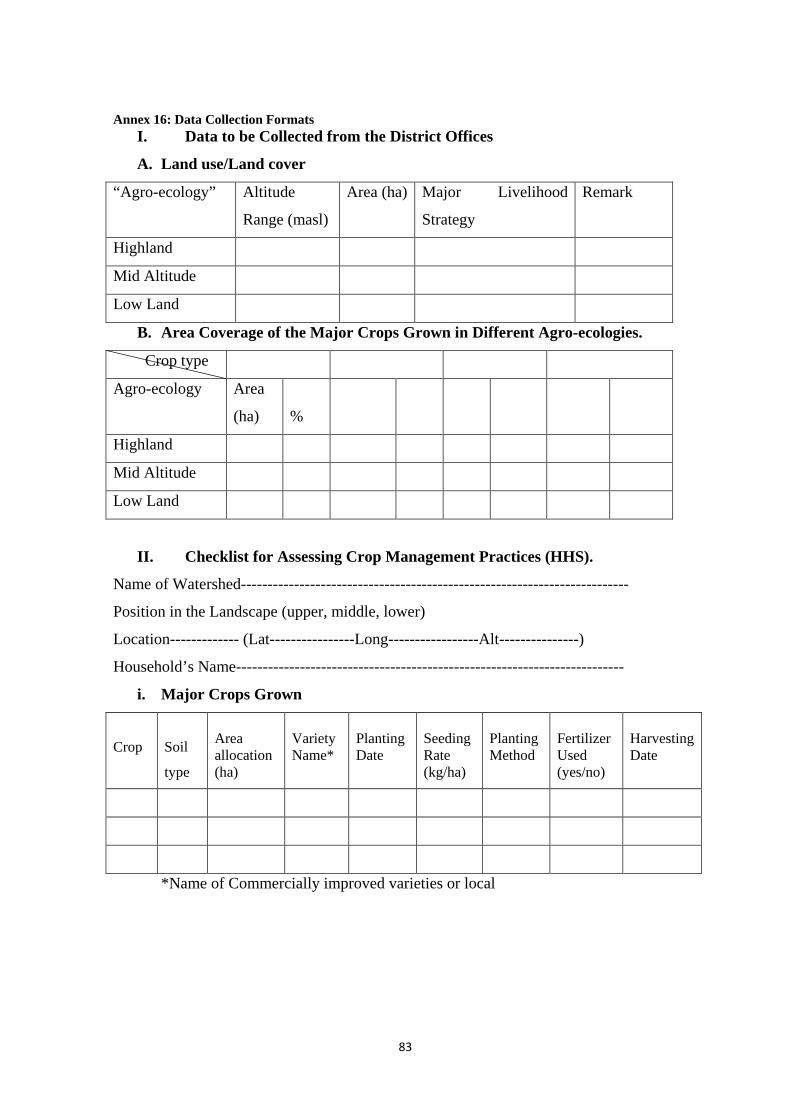
83
Annex 16: Data Collection Formats I. Data to be Collected from the District Offices
A. Land use/Land cover
“Agro-ecology” Altitude
Range (masl)
Area (ha) Major Livelihood
Strategy
Remark
Highland
Mid Altitude
Low Land
B. Area Coverage of the Major Crops Grown in Different Agro-ecologies.
Crop type
Agro-ecology Area
(ha)
%
Highland
Mid Altitude
Low Land
II. Checklist for Assessing Crop Management Practices (HHS).
Name of Watershed-------------------------------------------------------------------------
Position in the Landscape (upper, middle, lower)
Location------------- (Lat----------------Long-----------------Alt---------------)
Household’s Name-------------------------------------------------------------------------
i. Major Crops Grown
Crop
Soil
type
Area allocation (ha)
Variety Name*
Planting Date
Seeding Rate (kg/ha)
Planting Method
Fertilizer Used (yes/no)
Harvesting Date
*Name of Commercially improved varieties or local

84
ii. Input Used for the Major Crops
Crop
Type and Quality of fertilizer Applied (kg/ha)
Major
Constraints
Perceived
Biomass
(kg/ha)
Grain
(kg/ha)
UREA
DAP
Compost/
manure
Rate Date Rate Date Rate Date
…etc
iii. Common Cropping Systems
a. Crop Rotation Practiced (yes/no). If ‘yes’ show patterns.
Pattern 1
Pattern 2
Pattern 3
Pattern 4
Pattern 5
b. Relay Cropping Practiced (yes/no). If ‘yes’ show Sequence.
Options Crop 1 Crop 2 Crop 3 Crop 4
1
2
3
4
5
c. Mixed Cropping
Major Crop
Secondary Crops
1 3 3
…etc

85
iv. Water Management
a. Identify water related constraints with respect to the major crop fields and
suggested solutions.
Crop Major Constraints Suggested Solutions
…etc
b. Opinion about some suggested rainwater management alternatives.
Rainwater Mgt. Practices Pros Cons
RWH ponds
Terraces
Soil bund
Stone bund
Surface drainage
Grass strip
Soil fertility enhancement
New crop species
New Crop varieties
Appropriate planting date
Appropriate plant population
Land use change
Supplemental irrigation in the
rainfed system
III. Data Record Sheet for the Focused Crop Monitoring
Monitor 5 to 10 plots each of the top 3 or 4 crops that cover at least 70% of the area.
Name of household head______________________________________________
Landscape position (upper, middle, lower)
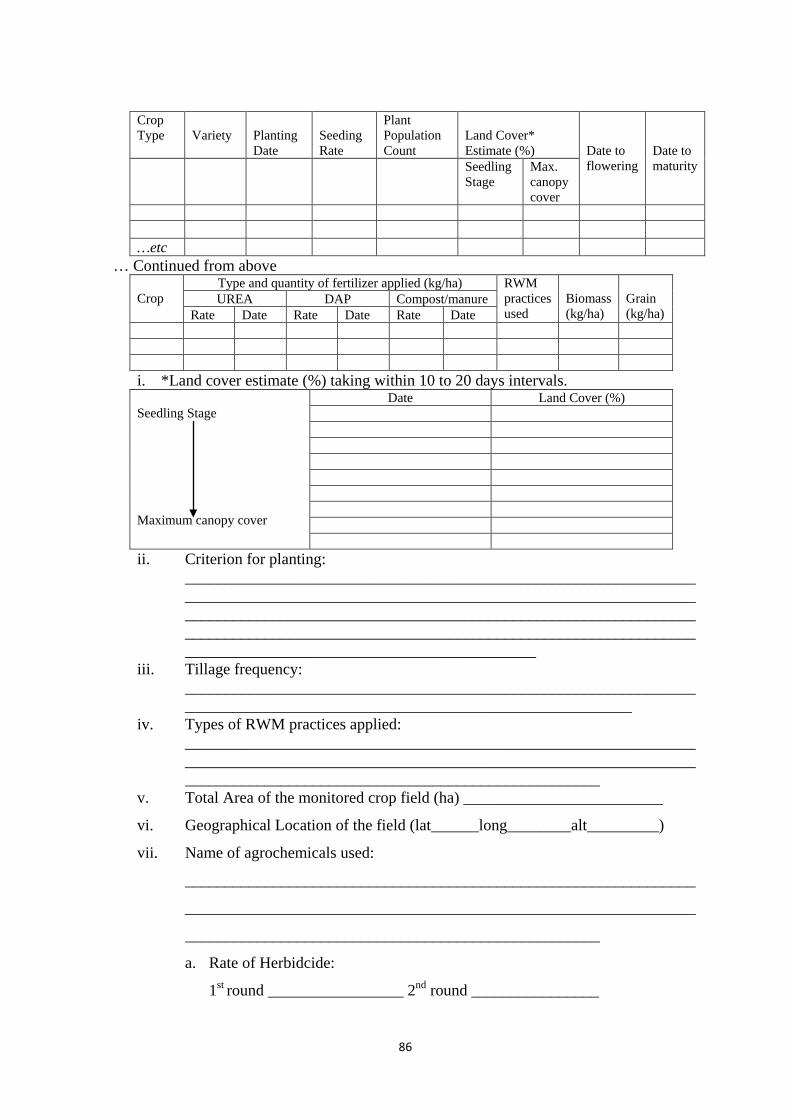
86
Crop Type
Variety
Planting Date
Seeding Rate
Plant Population Count
Land Cover* Estimate (%)
Date to flowering
Date to maturity Seedling
Stage Max. canopy cover
…etc
… Continued from above Crop
Type and quantity of fertilizer applied (kg/ha) RWM practices used
Biomass (kg/ha)
Grain (kg/ha)
UREA DAP Compost/manure Rate Date Rate Date Rate Date
i. *Land cover estimate (%) taking within 10 to 20 days intervals. Seedling Stage Maximum canopy cover
Date Land Cover (%)
ii. Criterion for planting: ____________________________________________________________________________________________________________________________________________________________________________________________________________________________________________________________________________________________________________
iii. Tillage frequency: ________________________________________________________________________________________________________________________
iv. Types of RWM practices applied: ____________________________________________________________________________________________________________________________________________________________________________________
v. Total Area of the monitored crop field (ha) _________________________
vi. Geographical Location of the field (lat______long________alt_________)
vii. Name of agrochemicals used:
________________________________________________________________
________________________________________________________________
____________________________________________________
a. Rate of Herbidcide:
1st round _________________ 2nd round ________________

87
b. Rate of insecticide applied:
1st round__________________ 2nd round_________________
3rd round___________________
viii. Cost of production:
a. Labor power (in number of persons) involved from land preparation to
thrashing:
1st round tillage______________ 2nd round tillage _______________
3rd round tillage______________ 4th round tillage _______________
Planting________________ Weeding ___________________
Chemical Application_______________ Harvesting ______________
Thrashing__________________ Others __________________
b. Labor cost (birr/person/day)__________________________________
c. Fertilizer cost (birr/100kg): UREA________________ DAP________
d. Seed cost (birr/kg)_____________________________
IV. Checklists Used for Group Discussion
i. Which crop did you mainly cultivate on you farmland? (Put them in
their order of importance).
ii. What types of farm inputs you mainly used?
(UREA/DAP/Compost/FYM/Agrochemicals/improved seeds?)
iii. What type(s) of constraint(s) you mainly face in crop production?
(poor soil fertility/shortage of farm inputs/water scarcity/insecure
land ownership/others)
iv. Could you get enough supply of improved crop varieties?
Commercial fertilizers?
v. What types of cropping systems you commonly practiced? (Crop
rotation/mixed cropping/relay cropping)
vi. Have you faced a water related constraints in relation to cultivation
of major crops?
vii. If your answer for Q #5 is ‘yes’, what do you suggest as a solution?