Embed Size (px)
Citation preview

Ambition 2016 – driving sustainable growth
Amsterdam, The Netherlands | 16 November 2011
Wout Dekker, CEO

Disclaimer
The information contained herein shall not constitute or form any part of any offer or invitation to subscribe for, underwrite or otherwise acquire, or any solicitation of any offer to purchase or subscribe for, securities including in the United States, Australia, Canada or Japan.
The information contained herein is not for publication or distribution into the United States, Australia, Canada or Japan. Neither this announcement nor any copy of it may be taken or distributed or published, directly or indirectly, in the United States, Australia, Canada or Japan.
The material set forth herein is for informational purposes only and is not intended, and should not be construed, as an offer of securities for sale into the United States or any other jurisdiction. Securities may not be offered or sold in the United States absent registration under the U.S. Securities Act of 1933, as amended (the “Securities Act”) or an exemption from registration. The securities of the company described herein have not been and will not be so registered. There will be no public offer of securities in the United States, Australia, Canada or Japan.
This presentation contains forward-looking statements. Forward-looking statements are statements that are not based on historical fact, including statements about our beliefs and expectations. Any statement in this presentation that expresses or implies our intentions, beliefs, expectations or predictions (and the assumptions underlying them) is a forward-looking statement. Such statements are based on plans, estimates and projections as currently available to the management of Nutreco. Forward-looking statements therefore speak only as of the date they are made and we assume no obligation to publicly update any of them in the light of new information or future events.
Forward-looking statements involve inherent risks and uncertainties. A number of significant factors could therefore cause actual future results to differ materially from those expressed or implied in any forward-looking statement. Such factors include but are not limited to conditions on the markets in Europe, the United States and elsewhere from which we derive a substantial portion of our revenue, potential defaults on the part of borrowers or trading counterparties, the implementation of our restructuring programme including the envisaged reduction in headcount and the reliability of our risk management policies, procedures and methods. For more information on these and other factors, please refer to our annual report. The forward-looking statements contained in this presentation are made as of the date hereof and the companies assume no obligation to update any forward-looking statement contained in this announcement.
| 2

Agenda
Introduction
Nutreco
Ambition 2016 – driving sustainable growth
Ambition 2016 – Animal Nutrition
Ambition 2016 – Aquaculture
Ambition 2016 – Finance
Summary
| 3

Strategic partnership with ForFarmers – sale of Hendrix
Profile Hendrix
• Hendrix UTD is the number 2 in the Dutch market with a market share of 13%
• EUR 830 mio Revenue (2010)
• 690 employees
• 10 production facilities (Netherlands, Belgium and Germany) with a capacity of 2.5 million tonnes per year
Strategic partnership
• Long term strategic partnership including premix, farm minerals and feed specialties
ForFarmers – Hendrix combination
• Market share of ± 20% in Netherlands & Belgium and strong position in Germany
| 4

Agenda
Introduction
Nutreco
Ambition 2016 – driving sustainable growth
Ambition 2016 – Animal Nutrition
Ambition 2016 – Aquaculture
Ambition 2016 – Finance
Summary
| 5

Who we are
• Revenue in 2010 of EUR 4.9 billion
• Over 120 production and processing plants in 30 countries
• Multinational workforce of approximately 10,000 employees
| 6
Nutrition, Ecology, Economy
Since 1994

Where we come from
| 7
2004
Initial
Public
Offering
Animal Nutrition
& Fish feed
Private Equity
Formation
Part of
BP Nutrition
Since 1899
Family
Businesses
Since 1931
Since 1937
Since 1968
1994 1975 1997 2011
Since 1954
Since 1937
Driving
Sustainable
Growth
Rebalancing
for Growth
Closer to the
Consumer

Mission and vision
| 8
Mission In a world with limited natural resources
and a growing population, Nutreco plays a leading role in developing and supplying
the most efficient and sustainable nutritional solutions
Vision
Nutreco has the ambition to become the global leader in animal nutrition and fish
feed that delivers innovative and sustainable nutritional solutions

Nutreco – the essential link in the feed-to-food chain
| 9
Protein producers Animal & Fish feed producers Plant growers & Vitamin producers
Food security
Limited natural resources
Price volatility
Impact biodiversity
Biofuel vs. food
Government policies
Carbon footprint
Global food demand will double
1bn underfed vs. 1.5bn overweight
Agflation
Food safety
Animal health
Stru
gglin
g Su
pp
lies Su
rging D
em
and
High-quality feed solutions •assured feed-to-food safety • feed efficiency • sustainable
industry value chain • innovation • changing diet patterns • reduce pressure on natural
resources • reduce livestock CO2 emissions • animal health
• Nutrition know-how
• Global presence
• Innovation & Technology
• Feed-to-Food Safety and Quality
• Sustainability
Nutritional knowledge & Feed-to-Food safety
Innovation & Technology
Fish MeatPlant
GrowersBiofuel
producers

Surging demand for animal protein
| 10
Growing middle class
Growing Population
Demographical forecasts towards 2030 - 2050
Urbanization
Converging diets
Changes in demographics lead to a surge in animal protein, especially in emerging
markets
7 to 9 billion 50% to 70%
400mio to 1.2bn 40 kg to 52 kg
2050 2050
2030 2030

Balancing societal objectives – essential to produce more food in a sustainable way
| 11
Source: FAO 2009- Livestock in the balance
Livelihood
Human Health
Enviro
nm
en
t
Foo
d Se
curity
Low development (e.g. African countries)
Rapid industrialization (e.g. China, Brazil)
Post-industrial (e.g. USA, Germany)

Our challenge – doubling production while halving footprint
| 12
Cooperate Communicate Innovate

Executive Board
| 13
Executive Board
CEO
Wout Dekker
COO
Animal Nutrition
Jerry Vergeer
CFO
Gosse Boon
COO
Aquaculture
Knut Nesse

Nutreco expects to achieve its ambition to double 2006 EBITA* in 2011
EUR 115 mio
EUR 230 mio
2006 2011 Outlook
| 14
Organic growth
Acquisitions
Sloten BASF Premix Maple Leaf Animal Nutrition Cargill Iberia Fri-Ribe Tomboy
Volume growth Product mix Innovation Cost discipline Central procurement
* EBITA of current business excluding exceptional items

EBITA development since 1997
| 15
59 60
73
85
119 117
92 98
112 117
159
182 175
223 230
0.0
50.0
100.0
150.0
200.0
250.0EBITA before exceptionals (mio EUR)

Nutreco vs. AEX since IPO in 1997
| 16
Nutreco TSR since 1997: 375%
0
10
20
30
40
50
60
0
200
400
600
800
1,000
1,200
1997 1998 1999 2000 2001 2002 2003 2004 2005 2006 2007 2008 2009 2010 2011
AEX
All-time low salmon
Acquisition Tomboy
Acquisition Shihai
Acquisition Hydro Seafood
Super dividend Share buyback
Acquisition Cargill Feed Iberia
Nutreco (€)
Capital remittance
Acquisition BASF Animal Nutrition
Acquisition Maple Leaf Animal Nutrition
"Rebalancing for Growth"

Agenda
Introduction
Nutreco
Ambition 2016 – driving sustainable growth
Ambition 2016 – Animal Nutrition
Ambition 2016 – Aquaculture
Ambition 2016 – Finance
Summary
| 17

Ambition 2016 – driving sustainable growth
| 18
Focus on Ambition 2016
driving sustainable growth
1. Higher margin portfolio of Nutritional Solutions
2. Segments Premix & feed specialties and Fish feed
3. Growth geographies Brazil, Russia, China and South East Asia

Ambition 2016 will create value for our stakeholders
| 19

Our sustainability ambitions
• Sustainable sourcing
• Flexible use of ingredients
• Assuring feed-to-food safety and
quality
• Reducing environmental impact of
operations
• Cherishing our workforce
• Enabling people through engagement
• Improving farm performance
• Increasing human & animal health
• Development of sustainable feed solutions
| 20

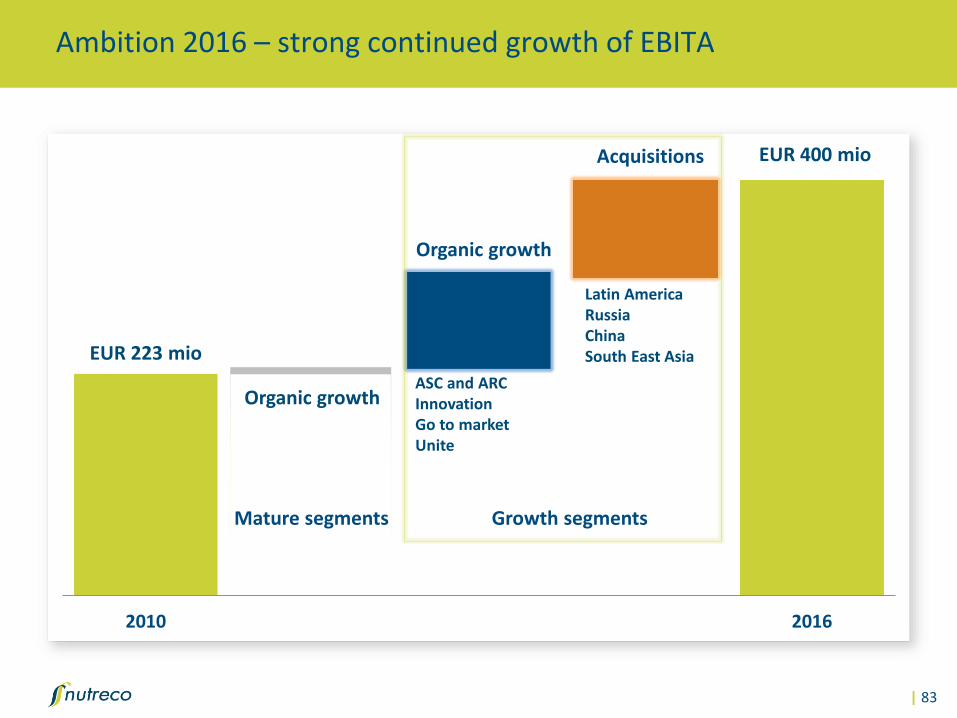
Ambition 2016 – strong continued growth of EBITA
| 21
2010 2016
Organic growth
Acquisitions
Mature segments
ASC and ARC Innovation Go to market Unite
Latin America Russia China South East Asia
Organic growth
EUR 400 mio
EUR 223 mio
Growth segments

Agenda
Introduction
Nutreco
Ambition 2016 – driving sustainable growth
Ambition 2016 – Animal Nutrition
Ambition 2016 – Aquaculture
Ambition 2016 – Finance
Summary
| 22

Ambition 2016 ̶ driving sustainable growth Animal Nutrition
Amsterdam, The Netherlands | 16 November 2011
Jerry Vergeer, COO Animal Nutrition

Agenda
Introduction
Ambition 2016 – driving sustainable growth
Growth enablers
• Focused Animal Nutrition Division with new top team
• Application and Solution Centres
• R&D and innovation
• Go to market
Growth geographies
Summary
| 24

Animal Nutrition Division 2011
| 25
• 7,700 employees
• Turnover € 3.6 billion
• Sales in more than 100 countries
• 80 Production locations
• 7 R&D centres and 2 ASCs
Global Brands

Agenda
Introduction
Ambition 2016 – driving sustainable growth
Growth enablers
• Focused Animal Nutrition Division with new top team
• Application and Solution Centres
• R&D and innovation
• Go to market
Growth geographies
Summary
| 26

Ambition 2016 – driving sustainable growth
| 27
Focus on Ambition 2016
driving sustainable growth
1. Higher margin portfolio of Nutritional Solutions
2. Segments Premix & feed specialties and Fish feed
3. Growth geographies Brazil, Russia, China and South East Asia

Ambition 2016 – driving sustainable growth
• Build a meaningful position in growth geographies, while securing our presence in mature segments
• Focus on high margin Nutritional Solutions
• More than half of our Revenue will come from Premix and feed specialties in 2016
| 28
Revenue per segment 2010
29%
11%
33%
27% 50%
10 %
15%
25%
Premix & feed specialties Animal Nutrition Canada Compound feed Europe Meat & Other
Revenue per segment 2016
Segment evolution

Agenda
Introduction
Ambition 2016 – driving sustainable growth
Growth enablers
• Focused Animal Nutrition Division with new top team
• Application and Solution Centres
• R&D and innovation
• Go to market
Growth geographies
Summary
| 29

One focused Animal Nutrition Division with new top team
| 30
COO Animal Nutrition
Business Units
Finance Director Animal Nutrition
R&D Director Animal Nutrition
Application & Solution Centre ASC-Europe Application & Solution Centre ASC-North America
Procurement Director Animal Nutrition
ASC Director Animal Nutrition

Essential link between R&D and the business
Application and Solution Centres (ASCs) ̶ Centres of excellence
Linking • Global R&D network of 7 research centres • Innovation and customer needs • Nutritional, technical and commercial skills Delivering • Portfolio of nutritional solutions (models, products and services) • Technical support and training • Marketing, communication and branding
Resulting in
• Innovative and sustainable nutritional solutions
| 31
Translating customer needs into innovative nutritional solutions

ASC ̶ linking innovation and customer needs
| 32

ASC ̶ geographical reach
| 33
More than 1,200 experts in local technical and sales teams serving our Customers
ASC ̶ North America (27 experts) ASC ̶ Europe (31 experts)
More than 100 R&D experts

ASC ̶ ambition 2016
| 34
ASC - North America ASC - Europe
ASC - Latin America
ASC - Asia

R&D ̶ intelligence inside
• 7 research centres in 3 countries
• ISO 9001, GMP+, HACCP
• More than 100 experts
• Qualified experts:
Animal Nutrition Veterinarian Immunology Molecular biology
Biochemistry Feed technology Food technology Food microbiology
Ruminant RC (NL) Calf RC (NL) Swine RC (NL) Ingredient RC (NL)
Agresearch (CA) Poultry and Rabbit RC (ES) Food RC (ES)
| 35

Business demands Science Solution Focus
Science Focus Areas
Business demands
Science Solution Focus
Young Animal Vitality &
Performance Young Animal Feeds
Better & Stable Gut Health
Gut Health Ingredients/ Programs
Reduce Transition Problems
Transition Feeds
& Programs
Reduce Human Health Risks
Zoonoses & Toxin Control
Optimize Feed Value
Predictable Performance Animal Modeling
Higher Performance & Efficiency
Sustainable Production Reduce Footprint
Strategy and customer needs are translated into science solutions
| 36
Q F
Quantitative
Nutrition Functional
Nutrition
Feed Evaluation & Least Cost Formulation (LCF)
Efficiency Additives

Innovation ̶ models and services
• Newton bundles all Nutreco’s knowledge around nutrition, ingredients, ration optimisation and farm management
• Our customers achieve optimal performance and predictable results
• NIRLINE allows accurate real time determination of the nutritional value of raw materials
• Our raw material databases are updated based on latest research conducted in our research centres
| 37

Innovations ̶ products
• Fysal® Fit-4 poultry combats Salmonella in feed
• EU legislation important drive for Salmonella control
• Developed in cooperation with large integrators and proven in practice
| 38
• CalFix patented technology, trains calcium metabolism and reduces risk for milk fever
• Milk fever adds high costs to dairy production
• The complete transition diet for dairy cow diets

Our value proposition
| 39
Innovative and sustainable nutritional solutions

This partnership will benefit all stakeholders
Strategic partnership with ForFarmers
• Our customers
• Access to added value nutritional solutions delivering predictable results
• Sustainable future with a reliable partner in the feed-to-food chain
• ForFarmers
• Market leading position in compound feed in Netherlands, Belgium and Germany
• Access to ASC- Europe and our R&D, innovation and application capabilities
• Nutreco
• Access to a larger customer base in the Netherlands, Belgium and Germany
• Strategic partnership including premix, farm minerals and feed specialties
| 40

Improve the commercialization of our value proposition
Go to market
• How
• Maximize value by matching our nutritional solutions to customer segments and needs
• Objectives
• Identify and analyze the most attractive market and product segments
• Define how can we improve the way we serve our customers
• Outline the financial impact of the recommendations
• Define a phased implementation plan
• Select and prioritize improvement initiatives
| 41

Agenda
Introduction
Ambition 2016 – driving sustainable growth
Growth enablers
• Focused Animal Nutrition Division with new top team
• Application and Solution Centres
• R&D and innovation
• Go to market
Growth geographies
Summary
| 42

Growth geographies
| 43
Russia
Moving from import to own production
• Investment (20 million) in agricultural Voronezh region, 350km from Moscow
• Integrated feed factory to serve the whole spectrum of animals
• Expected to be operational in 2012 (Q2)
Brazil
Build a platform for future growth
• 5 Production plants, 6 sales offices
• 400 employees
• Outpace market growth
• M&A
• Organic growth
China
Organic growth next to targeted acquisitions
• 2 plants in Beijing and Hunan
• Farm minerals, premixes and feed specialties
• 700 employees
• Organic growth
• M&A

Agenda
Introduction
Ambition 2016 – driving sustainable growth
Growth enablers
• Focused Animal Nutrition Division with new top team
• Application and Solution Centres
• R&D and innovation
• Go to market
Growth geographies
Summary
| 44

Summary
• One Animal Nutrition Division
• Application and Solution Centres (ASCs) for Europe (in the Netherlands) and for North America (in Canada)
• Link Business Units and customer needs through “Go to market” strategies
• Build a meaningful position in growth geographies, while securing our presence in mature segments
• More than half of EBITA of Premix and feed specialties will come from growth geographies in 2016
• Focus on high margin Nutritional Solutions
• More than half of our Revenue will come from of Premix and feed specialties in 2016
• EBITA margin ambition of Premix and feed specialties will overtime outperform current guidance of 7%
| 45

Agenda
Introduction
Nutreco
Ambition 2016 – driving sustainable growth
Ambition 2016 – Animal Nutrition
Ambition 2016 – Aquaculture
Ambition 2016 – Finance
Summary
| 46

Ambition 2016 – driving sustainable growth Aquaculture
Amsterdam, The Netherlands | 16 November 2011
Knut Nesse, Chief Operating Officer Aquaculture

Agenda
Introduction
Ambition 2016 – driving sustainable growth
Growth enablers
• Skretting global brand
• Innovation
• Skretting ARC
Growth geographies
• Existing markets
• Newly acquired markets
• New markets
Summary
| 48

The blue revolution towards 2020
| 49
Global production of sea food (1950 – 2025) (thousand tonnes)

Newly acquired markets
Existing markets
Source: Skretting, Roland Berger and Prof. R. Tveteraas and Prof. F. Asche
Notes:
1) Farmed fish with a corresponding fish feed value of > 500 Eur/ton
2) Farmed fish with a corresponding fish feed value of < 500 Eur/ton
5 %
5 %
Low value white-fish
2)
Norway
1,5Mt 0,4Mt 1,3Mt 0,1Mt
0,4Mt 4,3Mt
0,4Mt 0,1Mt 2,4Mt
0,5Mt 7,5Mt 0,7Mt
3,3Mt 3,3B
4,7Mt 3,2B
3,1Mt 2,5B
8,7Mt 2,9B
1,5Mt 0,8Mt 2,3Mt 14,2Mt 0,1Mt 0,9Mt Sum
Geography 19,8Mt 11,9B
Annual growth volume
3 %
10 %
6,5 %
0,2Mt
Volume
Europe
Volume
America
Volume
Asia
Volume
Australia
Volume
Africa
Volume
Sum species
Volume Turnover
Estimated Volume (million tonnes) and Turnover, (billions) ex Carp
Potential market for Skretting specified on geography and species
| 50
Salmonid
Shrimp
High value white-fish
1)

Agenda
Introduction
Ambition 2016 – driving sustainable growth
Growth enablers
• Skretting global brand
• Innovation
• Skretting ARC
Growth geographies
• Existing markets
• Newly acquired markets
• New markets
Summary
| 51

Ambition 2016 – driving sustainable growth
| 52
Focus on Ambition 2016
driving sustainable growth
1. Higher margin portfolio of Nutritional Solutions
2. Segments Premix & feed specialties and Fish feed
3. Growth geographies Brazil, Russia, China and South East Asia

Ambition 2016 – driving sustainable growth
| 53
• Double sales volume from 1.3 million tonnes in 2010 to 2.7 million tonnes in 2016
• EBITA margin guidance will increase to 7%
• Global leader in fish feed
• Species:
• Maintain number one position in feed for salmonids and grow in line with the market (5% CAGR)
• Increase share of feed for non-salmon from 28% in 2010 to 45% in 2016
Salmonid 72%
Non-salmonid
28%
Salmonid 55%
Non-salmonid
45%
0
1,000
2,000
3,000
2007-2009 2010 2016
Volume (kt)

Agenda
Introduction
Ambition 2016 – driving sustainable growth
Growth enablers
• Skretting global brand
• Innovation
• Skretting ARC
Growth geographies
• Existing markets
• Newly acquired markets
• New markets
Summary
| 54

Skretting – globally feeding your passion for fish
| 55
Skretting delivers outstanding nutrition and services to fish farmers worldwide for the sustainable production of healthy and delicious fish
• 2,350 employees • Production: 1.5 million tonnes • No. 1 in salmon feed with approx. 36% market share • Sales in >40 countries • Production in 14 countries • Licence production in 2 countries

Feed-to-food safety Innovation and R&D Focus on sustainability
Skretting – the global brand for fish feed
| 56

Feed-to-food safety and quality
• Certified quality
• Ingredient assessment and
management
• Monitoring
• Risk management
• Tracking and tracing
| 57

Passionately committed to sustainability
• Our commitment for improving
the sustainability of aquaculture
• Guiding principles:
• Sustainable raw materials
• Efficient use of raw materials
• Responsible producer
| 58
More info on www.skretting.com

Innovation – MicroBalanceTM, a revolutionary fish feed concept
• Our MicroBalanceTM concept reduces the level of fishmeal in fish diets compared to present practice
• MicroBalanceTM is currently used in salmon, trout and a few marine species. We are working on extending the technology to more species and diets
• MicroBalanceTM delivers full performance, healthy fish and increased raw material flexibility
| 59

Source: Skretting ARC
Kg fish protein produced versus fish protein used in feed
0.00
0.50
1.00
1.50
2.00
2.50
3.00
3.50
4.00
1990 1995 2000 2005 2008 2009 2010 Potential
Kg
Maintain leadership position in feed for salmonids
| 60
Thanks to MicroBalanceTM, salmon producers became net fish protein producers in 2010

Innovation – Protec an innovative health diet
• Protec is proactive nutrition
(preventing health problems)
• Good fish health is vital to all fish
farming operations
• Industrial fish farming needs
innovative solutions to ensure
good fish health
| 61

Skretting ARC – curiosity drives our research
• Centre of excellence in Stavanger
• Research projects integrated in business needs and defined by the businesses
• Established 1989
• 60 man years, 25 researchers
• 15 nationalities
• Focus on nutrition, feed technology and health
• Collaborations with over 40 research institutions worldwide
• Establishment of Skretting ARC-Asia in China in 2012
| 62

Agenda
Introduction
Ambition 2016 – driving sustainable growth
Growth enablers
• Skretting global brand
• Innovation
• Skretting ARC
Growth geographies
• Existing markets
• Newly acquired markets
• New markets
Summary
| 63

Double our feed volumes by 2016
• Increase from 1.3 million tonnes (2010) to 1.8 million tonnes (2016) in existing markets
• Increase from 50 thousand tonnes (2010) to 600 thousand tonnes in newly acquired markets
• New volumes of 300 thousand tonnes in new markets
• Key growth driver is feed for non-salmonid species, increasing from 28% in 2010 to 45% in 2016
• Feed for salmonids will grow in line with the market (5% CAGR)
| 64
1,800

Existing markets – investments to support growth
| 65
Norway
New production capacity
• Investing EUR 66 million to upgrade fish feed plant in Averøy, Norway
• Enable Skretting to meet future market demand for high quality feed for salmonids and to maintain its market leader position in Norway
• The Norwegian fish feed market has grown with an average of 8% a year from 2006 to 2010
Australia
Production capacity doubled
in 2011
• Invested EUR 20 million to double production capacity in Tasmania to 120 thousand tonnes per year
• Enable Skretting to meet future market needs for outstanding nutrition for salmon, trout, barramundi and tuna in Australia and New Zealand
• Annual growth in the fish market in Australia and New Zealand has been 10% since 2001
Chile
Market recovering and back
at historical peak level
• Fish feed plant in Paragua re-opened in September 2011
• New regulations on fish farming approved by Senate
• An increase in stocking of smolts
• Farmed volumes now closing in on historic high levels

Skretting Vietnam – integrated in Skretting Group
• Third largest aquaculture producing country in the world
• Government proactively supports development and welcomes foreign investment
• One of the world’s largest producers of shrimp and the largest producer of pangasius
• Long way to go with regard to aquaculture R&D and welcomes foreign experience
• Vietnamese aquaculture has a strong export focus
| 66

China – the world’s number 1 aquaculture feed market
• The fish feed market in China is estimated 8.6 million tonnes (excluding carp)
• The last 5 years this market has grown by more than 10% per year
• Growth is supported by Chinese authorities and strong domestic demand for seafood
| 67

Skretting China – aquisition completed October 2011
• Shihai a reputable and profitable fish and shrimp feed company in China
• Shihai supplies a growing market and produced approximately 100 thousand tonnes of fish and shrimp feed in 2010
• Commissioned a new feed plant with a capacity of approximately 150 thousand tonnes
• Shihai has approximately 5% of the high end fish feed market in the south of China and has shown an annual growth rate of approximately 23% during the last five year
| 68

Brazil – future potential for growth in new farmed species
• Brazil has the world’s biggest resources of fresh water
• Joint venture Fri - Ribe
• Number 1 feed supplier for shrimp with more than 20% market share
• Number 2 feed supplier for tilapia with more than 10% market share
• Tambaqui, an interesting new farmed specie – about 15% of the total Brazilian fish feed market
• Production capacity will increase by 50% in 2012
| 69

New markets in growth geographies
Capitalizing on knowledge and systems
• Asia and Africa will have significant growth in population
• Buying power of people in Asia and Latin America will increase
• Increased buying power will lead to increased consumption of seafood
• World’s resources of fresh water are limited – main growth in aquaculture will be in marine species
• Proximity of farming operations to populations with high buying power will be an advantage
Skretting will expand in:
• South East Asia
• Latin America
• North Africa
| 70

Agenda
Introduction
Ambition 2016 – driving sustainable growth
Growth enablers
• Skretting global brand
• Innovation
• Skretting ARC
Growth geographies
• Existing markets
• Newly acquired markets
• New markets
Summary
| 71

• Driving the blue revolution in fish feed
• Growth strategy
• Double sales volume
• EBITA margin guidance of 7%
• Maintain number 1 position in feed for salmonids
• Feed for non-salmonids
• Growth strategy based on
• Delivering our brand values, products and systems globally
• Product innovations
• Organic growth
• Entering new markets
• Global leader in fish feed
Summary
| 72

Agenda
Introduction
Nutreco
Ambition 2016 – driving sustainable growth
Ambition 2016 – Animal Nutrition
Ambition 2016 – Aquaculture
Ambition 2016 – Finance
Summary
| 73

Ambition 2016 – driving sustainable growth
Amsterdam, The Netherlands | 16 November 2011
Gosse Boon - Chief Financial Officer

Agenda
Performance 2006 - 2011
Ambition 2011 - 2016
Growth segments
M&A and Unite
Summary
| 75

Nutreco expects to achieve its ambition to double 2006 EBITA* in 2011
EUR 115 mio
EUR 230 mio
2006 2011 Outlook
| 76
Organic growth
Acquisitions
Sloten BASF Premix Maple Leaf Animal Nutrition Cargill Iberia Fri-Ribe Tomboy
Volume growth Product mix Innovation Cost discipline Central procurement
* EBITA of current business excluding exceptional items

Overview of key terminology
Growth geographies
Latin America (e.g. Brazil)
Russia
China and South East Asia (e.g. Vietnam)
| 77
Growth segments Mature segments
Premix and feed specialties Compound feed Europe
Fish feed Meat and other
Animal Nutrition Canada
Current business Continuing operations
Nutreco’s portfolio of activities Nutreco’s portfolio of activities
including Hendrix excluding Hendrix

Company Country Type Year
Growth geographies
Growth segments
Latin America, Russia, China and
South East Asia
Premix and feed
specialties
Fish feed Salmonid
Fish feed Non-salmonid
Sloten World Acquisition 2006
BASF Premix World Acquisition 2007
Maple Leaf Animal Nutrition Canada Acquisition 2007
Trouw Indonesia Capex 2009
Trouw/Skretting Italy Capex 2009
Skretting Turkey Capex 2009
Fri Ribe Brazil Acquisition 2009
Selko NL Capex 2010
Silver Cup USA Capex 2010
Tomboy Vietnam Acquisition 2010
Skretting Australia Capex 2010
Skretting Norway Capex 2011
Techkorm Russia Capex 2011
Shihai China Acquisition 2011
Acquisitions & investments geared towards growth segments
| 78

EBITA profile shifted towards growth segments
| 79
EBITA (mio EUR) per segment development
EBITA (%) per segment 2010 EBITA (%) per segment 2006
31%
39%
9%
10%
11%
Fish feed
Premix and feed specialties
Animal Nutrition Canada
Compound feed Europe
Meat and other
Growth segments
117 159 182 175 223

EBITA margin (%) EBITA (mio EUR)
ROACE (%) Leverage
Solid financial performance within a strict financial framework
| 80
* Net cash position of EUR 237 mio
*
15
21 19 17
20
0%
10%
20%
30%
2006 2007 2008 2009 2010
EBIT
A /
AC
E
117 159
182 175
223
0
100
200
300
2006 2007 2008 2009 2010
EBIT
A
3.9 4.0 3.7
3.9
4.5
3%
4%
5%
2006 2007 2008 2009 2010
EBIT
A /
Re
ven
ue
1.44 1.58
0.98 0.74
0
1
2
3
2006 2007 2008 2009 2010
Ne
t d
ebt
/ EB
ITD
A
Guidance

Current business portfolio and current guidance
| 81
FY 2010 results (mio EUR) Revenue EBITA EBITA margin % ROACE %
Growth
Premix and feed specialties 1,046 77 7.3 29
Fish feed 1,333 94 7.1 31
Animal Nutrition Canada 400 23 5.7 9
Mature Compound feed Europe 1,200 25 2.1 23
Meat and other 961 27 2.8 14
Corporate -23
Nutreco total 4,940 223 4.5 20
Current guidance Organic growth (volume) % EBITA margin %
Growth
Premix and feed specialties 4 7
Fish feed 5 6
Animal Nutrition Canada 1-2 6
Mature Compound feed Europe 1-2 2-3
Meat and other 1-2 2-3

Agenda
Performance 2006 - 2011
Ambition 2011 - 2016
Growth segments
M&A and Unite
Summary
| 82
Ambition 2016 – strong continued growth of EBITA
| 83
2010 2016
Organic growth
Acquisitions
Mature segments
ASC and ARC Innovation Go to market Unite
Latin America Russia China South East Asia
Organic growth
EUR 400 mio
EUR 223 mio
Growth segments

Agenda
Performance 2006 - 2011
Ambition 2011 - 2016
Growth segments
M&A and Unite
Summary
| 84

2016 EBITA share (%) from growth geographies will exceed 50%
Growth enablers
Premix and feed specialties
| 85 * Excluding one-off benefit of EUR 20 mio in 2008
• Application Solution Centres & innovation
• Go to market
• Capital expenditure in growth geographies
• M&A in growth geographies
• Unite
2016 EBITA margin (%) will exceed current guidance of 7%
*
5.1 5.2
6.0
7.0 7.3
>7.0
2006 2007 2008 2009 2010 2016

2016 revenue share (%) from non-salmonid will increase to 45%
2016 EBITA margin (%) equal to updated guidance of 7%
Growth enablers
Fish feed
| 86
• Skretting global brand
• Aquaculture Research Centre & innovation
• Go to market
• Capital expenditure in existing markets
• M&A in feed for non-salmonids
• Unite

Agenda
Performance 2006 - 2011
Ambition 2011 - 2016
Growth segments
M&A and Unite
Summary
| 87

Where
M&A process
Our proven M&A approach will be accelerated
| 88
Financial requirements
Growth geographies
Growth segments
Latin America (e.g. Brazil), Russia, China and South East Asia (e.g. Vietnam)
Premix and feed specialties, Fish feed and Animal Nutrition Canada
Minimum rate of return >> Country specific WACC
EPS Accretive
ROACE > 15% as of year three
• Increase the number of candidates in M&A pipeline (scouting)
• Ensure sufficient transaction capacity (deal-making)
• Increase readiness of organization to integrate (integration teams)

Unite - Foundation for better business performance
| 89
Programme
• Optimise and harmonise business processes, information and Enterprise Resource Planning (ERP) throughout Nutreco
• Resulting in a solid foundation for continuous improvement to business performance, matching Nutreco’s growth strategy
Benefits
• Create greater business process consistency and reduction of complexity
• Enabling cost leadership by establishing/ sharing of best practices and harmonising Nutreco’s ERP (M3) foundation
• Increase organisational speed by enabling faster integration of acquisitions as well as faster business process improvements in the existing Nutreco organisation
• Enhance knowledge sharing and improve decision making through better management information
• Further improve procurement capabilities and performance through a common approach and supporting solution

Agenda
Performance 2006 - 2011
Ambition 2011 - 2016
Growth segments
M&A and Unite
Summary
| 90

Ambition 2016 “in turbulent times”
| 91
Risks
Geopolitical Prolonged financial crisis
Unavailability of raw materials
Macro-economic Global economic slow-down for several years
Strategic Unavailability of fairly priced acquisition targets
Operational Volume impact due to animal diseases
Margin protection and volatility of raw material commodities
Financial Credit risk

Financial framework
Profitability ambition
Ambition 2016
| 92
Net debt / EBITDA < 3
Net debt / Equity ratio < 1
Interest coverage > 5
Dividend payout ratio 35% - 45%
EPS + 10% average per annum
EBITA EUR 400 mio
EBITA margin 5% - 6%
ROACE > 15%

Summary
• Looking back on 2006 - 2011
• Nutreco expects to achieve its ambition to double 2006 EBITA in 2011 to at least EUR 230 mio
• Growth in top and bottom line from both organic growth and acquisitions
• Investments and profitability shifted towards growth segments
• Looking forward towards 2011 – 2016
• Similar shift expected going forward, with focus on:
• Growth geographies: Latin America, Russia, China and South East Asia
• Growth segments: Premix and feed specialties, Fish feed and Animal Nutrition Canada
• M&A and Unite
• Accelerated M&A approach and capabilities
• Unite - Foundation for better business performance
• Profitability ambition
• EBITA of EUR 400 mio in 2016 within a solid financial framework
| 93

Agenda
Introduction
Nutreco
Ambition 2016 – driving sustainable growth
Ambition 2016 – Animal Nutrition
Ambition 2016 – Aquaculture
Ambition 2016 – Finance
Summary
| 94

Summary (1)
• Update 2011
• Outlook of 2011 EBITA of at least EUR 230 million
• Intended sale of Hendrix compound feed operations to ForFarmers. Long-term strategic partnership with ForFarmers
• Second phase of investment in extra production capacity of the fish feed plant in Averøy Norway, totalling EUR 66 million
• Ambition 2016
• Increase EBITA to EUR 400 million in 2016
• Establishment of 4 Application and Solution Centres (ASCs) for Animal Nutrition
• More than half of EBITA of Premix and feed specialties will come from growth geographies in 2016
• Further growth in markets for non-salmonid species to a share of 45% of fish feed revenues in 2016
• EBITA margin guidance for Fish feed increased from 6% to 7% and EBITA margin for Premix and feed specialties will over time outperform current guidance of 7%, resulting in an overall EBITA margin improvement to 5-6%
• Nutreco’s solid balance sheet accommodates this growth strategy
| 95

Summary (2)
• Focus on
• Higher margin portfolio of Nutritional Solutions
• Segments Premix & feed specialties and Fish feed
• Growth geographies Brazil, Russia, China and South East Asia
• Robust portfolio
• Balanced growth from organic growth and acquisitions
• Essential link the feed-to-food value chain
• Innovative and sustainable nutritional solutions
| 96

| 97