Embed Size (px)
Citation preview

Ambit Capital and / or its affiliates do and seek to do business including investment banking with companies covered in its research reports. As a result, investors should be aware that Ambit Capital may have a conflict of interest that could affect the objectivity of this report. Investors should not consider this report as the only factor in making their investment decision.
Please refer to the Disclaimers at the end of this Report.
AMBIT RESULTS INSIGHTS
29 October 2016
RESULTS
Results Update
Nestle (SELL)
Maggi maintains share; non-Maggi sales flat QoQ
Marico (BUY)
Lessons learnt…2H expected to be better
Colgate (SEEL)
Market-share loss continues
Shriram City Union Finance (BUY)
Another quarter of earnings pick-up
Please refer to our website for complete coverage universe
http://research.ambitcapital.com

AMBIT RESULTS INSIGHTS
Ambit Capital Pvt Ltd 29 October 2016
Nestle Maggi maintains share; non-Maggi sales flat QoQ Nestle’s 3QCY16 sales grew 4% QoQ to Rs23.6bn while adj. PAT rose 2% QoQ to Rs2.7bn. Based on Nestle parent’s commentary, in their recent earnings call, Maggi Noodles sales are now at ~80% of pre-crisis levels. We believe Maggi Noodles should achieve pre-crisis sales volumes by mid-CY17. Our calculations suggest that sales of Maggi Noodles increased ~23% QoQ. However, parent’s commentary suggests market share remained flat QoQ. Non-Maggi Noodles portfolio is expected to have remained flat QoQ despite several new product launches. Given Nestle’s inability to grow its non-Maggi portfolio and flat market share for Maggi QoQ, we remain cautious at current steep valuations of ~44x CY17E EPS. We have reduced our estimates for CY16/17E by ~3% due to tapered growth expectations for non-Maggi portfolio. Reiterate SELL with TP of Rs6,100 (12% downside, implying 39x CY17E EPS, 16%/18% sales/PAT CAGR over CY15-19E).
Result review: Maggi market share and non-Maggi portfolio sales flat QoQ
Nestle’s 3QCY16 sales grew 4% QoQ to Rs23.6bn. We believe Maggi Noodles sales are currently at ~80% of pre-crisis levels. The existing non-Maggi Noodles portfolio is expected to have reported flat sales YoY. Gross and EBITDA margin were flat QoQ resulting in EBITDA of Rs4.5bn, +4% QoQ. PAT grew only 2% QoQ to Rs2.7bn due to higher tax expense.
Normalisation of Maggi Noodles sales by mid-CY17, CY16 volumes to be only ~85% of CY14 levels
Based on Nestle parent’s commentary in their 3QCY16 earnings call, Maggi Noodles volume reached 75-80% of pre-crisis level during 3QCY16 vs ~65% in 2QCY16. Also, Maggi Noodles market share remained unchanged QoQ at ~58%. Hence, our calculations suggest that Maggi Noodles sales grew ~23% QoQ while the non-maggi portfolio sales were almost flat despite several new launches over the last two quarters.
Nestle – genetic re-engineering?
In recent Nestle meeting, management suggested that the firm is working towards re-engineering its DNA in order to make it more agile and also to shake out areas of inefficiency in its operational processes:
New product launches: Nestle launched 25 new products over the past three months, the highest ever run-rate of new launches in the history of the company.
Exhibit 1: Intensity of new launches has been highest in 2016 over the past decade
Source: Company, Ambit Capital research; excluding re-launch and re-packaging of existing products
0
5
10
15
20
25
30
2006 2007 2008 2009 2010 2011 2012 2013 2014 2015 2016
SELL Result Update Stock Information Bloomberg Code: NEST IN
CMP (Rs): 6,980
TP (Rs): 6,100
Mcap (Rs bn/US$ bn): 674/10.1
3M ADV (Rs mn/US$ mn): 248/3.7
Stock Performance (%)
1M 3M 12M YTD
Absolute 8 (3) 10 20
Rel. to Sensex 10 (3) 7 13
Source: Bloomberg, Ambit Capital research
Ambit Estimates (Rs bn)
CY15 CY16E CY17E
Revenues 81 95 114
EBITDA 15 18 25
EPS (Rs) 110.4 114.2 157.4
Source: Ambit Capital research
Research Analysts
Rakshit Ranjan, CFA Rakshit.ranjan@ ambit.co Tel: +91 22 3043 3201
Ritesh Vaidya, CFA [email protected] Tel: +91 22 3043 3246
Dhiraj Mistry, CFA [email protected] Tel: +91 22 3043 3264

AMBIT RESULTS INSIGHTS
Ambit Capital Pvt Ltd 29 October 2016
Changing the softer aspects of its business: Over the past 12 months, Nestle has implemented the following changes in the organisation: a) change in the culture of the organisation such that ‘making a mistake and asking for a pardon is better than not attempting at all’; b) recalibrating the distribution including splitting of salesmen and prioritising certain parts of the distribution channel; c) enhancing the merchandising teams to increase focus on ‘point of sale’; d) changes to the frontline sales teams’ incentive structures to include targets around getting new launches on retailer shelves, product activation initiatives and merchandising; and e) simplifying the organisational structure so that there are not too many layers between the strategic team at the top and the execution team at the ground level.
Where do we go from here?
We believe Nestle is clearly attempting a turnaround in the DNA of the organisation and is taking steps in the right direction. However, we believe such a critical change in the organisational structure and work culture is not easy to achieve and also takes time to get absorbed in the firm’s systems and processes. Our channel checks suggest that Nestle’s continuous price increases over the last 5 years have led to consumer attrition in categories like baby foods to home-made remedies or lower priced innovative products from competitors and weak macro demand. The company will also have to moderate its price increases in order to drive volume growth. We assume 16% sales CAGR over CY15-19 led by recovery in sales of Maggi noodles and ~12% sales CAGR in its non-Maggi Noodles portfolio.
Nestle remains a high-quality franchise due to: (a) superior working capital management vs peers, (b) lack of any capital misallocation risk unlike domestic peers, and (c) dominant presence in the cash-generative baby foods segment. Hence, the company deserves sector-leading valuations. We have reduced our CY16/17 estimates by ~3% due to tapered growth expectations for non-Maggi portfolio. However, at current valuation of 44x CY17E EPS, we see limited upside. Reiterate SELL with TP of Rs6,100 (12% downside, implying 39x CY17E EPS, 16%/18% sales/PAT CAGR over CY15-19E).
Exhibit 2: Quarterly snapshot (Rs mn)
3Q CY16 2Q CY16 3Q CY15 1QCY16E YoY QoQ Deviation from Ambit Estimates
Net Sales 23,635 22,717 17,424 20,989 35.6% 4% 13%
Total revenues 23,635 22,717 17,424 20,989 35.6% 4% 13%
Raw materials 9,860 9,495 7,429 8,739 32.7% 4% 13%
Gross Profit 13,775 13,222 9,995 12,251 37.8% 4% 12%
Gross Margin 58.3% 58.2% 57.4% 58.4% 92 8 (8)
Employee cost 2,704 2,627 2,298 2,831 17.7% 3% -4%
Other expenditure 6,595 6,306 5,024 6,115 31.3% 5% 8%
Total expenditure 9,300 8,933 7,321 8,945 27.0% 4% 4%
EBITDA 4,476 4,289 2,674 3,305 67.4% 4% 35%
EBITDA margin 18.9% 18.9% 15.3% 15.7% 359 6 319
Other income 374 366 272 350 37.4% 2% 7%
Depreciation 882 889 906 900 -2.6% -1% -2%
PBIT 3,967 3,765 2,041 2,755 94.4% 5% 44%
Interest 1 1 0 - 200.0% PBT 3,967 3,765 2,041 2,755 94.4% 5% 44%
Tax 1,273 1,136 553 832 130.0% 12% 53%
PAT 2,694 2,628 1,487 1,924 81.1% 2% 40%
Exception costs - (320) (245) - Net Profit 2,694 2,308 1,242 1,924 40%
Adj. EPS 27.9 27.3 15.4 20.0 81.1% 2% 40%
As % of Sales Employee cost 11.4% 11.6% 13.2% 13.5% -174 -12 -204
Other expenditure 27.9% 27.8% 28.8% 29.1% -93 14 -123
Source: Company, Ambit Capital research

AMBIT RESULTS INSIGHTS
Ambit Capital Pvt Ltd 29 October 2016
Balance sheet
Year to March (Rs mn) CY14 CY15 CY16E CY17E CY18E
Net Worth 28,372 28,178 30,730 35,189 40,762
Total Debt 196 177 - - -
Deferred Tax Liability 2,227 1,729 1,729 1,729 1,729
Current Liabilities 27,400 30,720 35,942 32,265 36,578
Total Liabilities 58,195 60,805 68,402 69,183 79,069
Fixed Assets 34,214 31,286 28,494 25,348 21,812
Investments 8,118 13,249 13,249 13,249 13,249
Current Assets 15,863 16,269 26,658 30,586 44,008
Total Assets 58,195 60,805 68,402 69,183 79,069
Source: Company, Ambit Capital research
Income statement
Year to March (Rs mn) CY14 CY15 CY16E CY17E CY18E
Net Income 98,063 81,233 95,043 114,336 129,620
% Growth 8% -17% 17% 20% 13%
Gross Profit 52,823 46,544 55,380 66,965 76,306
EBITDA 19,832 15,029 18,491 24,874 29,236
PBIT 17,816 13,178 16,439 22,650 26,839
PBT 17,674 13,145 16,436 22,650 26,839
PAT 11,777 10,641 11,012 15,175 17,982
EPS 122.1 110.4 114.2 157.4 186.5
EPS Growth 7% -10% 3% 38% 18%
Source: Company, Ambit Capital research
Cash flow statement
Year to March (Rs mn) CY14 CY15 CY16E CY17E CY18E
EBIT 17,816 13,178 16,439 22,650 26,839
Depreciation 3,375 3,473 3,542 3,896 4,286
Others (5,966) (3,034) (5,427) (7,474) (8,857)
Change in working capital 1,088 3,451 3,478 (4,129) 2,512
Cash flow from operations 16,313 17,066 18,033 14,942 24,780
Cash flow from investments (557) (5,676) (750) (750) (750)
Cash flow from financing (18,792) (10,853) (8,638) (10,717) (12,409)
Change in cash (3,035) 537 8,645 3,476 11,622
Free cash flow 15,364 16,522 17,283 14,192 24,030
Source: Company, Ambit Capital research
Ratio analysis / Valuation parameters
Year to March (Rs mn) CY14 CY15 CY16E CY17E CY18E
Gross margin (%) 53.9% 57.3% 58.3% 58.6% 58.9%
EBITDA margin (%) 20.2% 18.5% 19.5% 21.8% 22.6%
Net profit margin (%) 12.0% 13.1% 11.6% 13.3% 13.9%
Net debt: equity (x) (0.2) (0.2) (0.4) (0.5) (0.7)
RoCE (%) 34.6% 35.0% 35.2% 43.7% 45.3%
RoE (%) 45.2% 37.6% 37.4% 46.0% 47.4%
P/E (x) 57.0 63.1 60.9 44.2 37.3
Price/Sales (x) 6.8 8.3 7.1 5.9 5.2
EV/EBITDA (x) 33.6 44.3 35.6 26.3 22.0
Source: Company, Ambit Capital research
AMBIT RESULTS INSIGHTS
Ambit Capital Pvt Ltd 29 October 2016
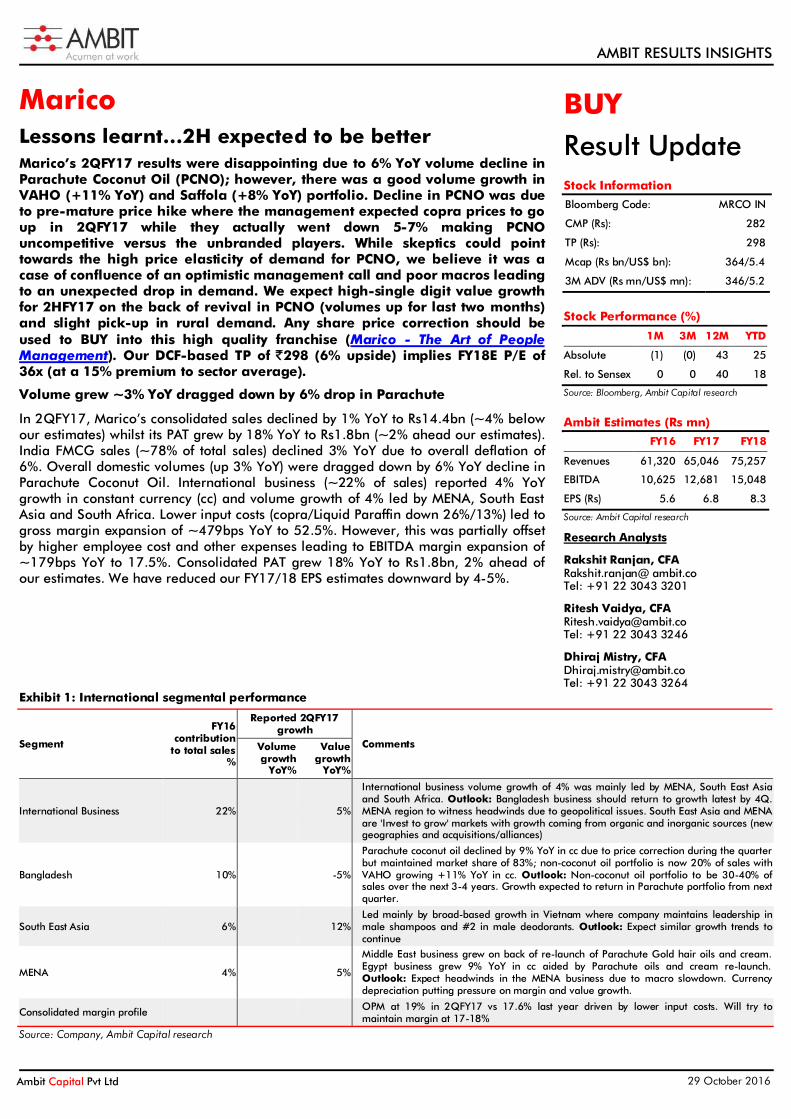
Marico Lessons learnt…2H expected to be better Marico’s 2QFY17 results were disappointing due to 6% YoY volume decline in Parachute Coconut Oil (PCNO); however, there was a good volume growth in VAHO (+11% YoY) and Saffola (+8% YoY) portfolio. Decline in PCNO was due to pre-mature price hike where the management expected copra prices to go up in 2QFY17 while they actually went down 5-7% making PCNO uncompetitive versus the unbranded players. While skeptics could point towards the high price elasticity of demand for PCNO, we believe it was a case of confluence of an optimistic management call and poor macros leading to an unexpected drop in demand. We expect high-single digit value growth for 2HFY17 on the back of revival in PCNO (volumes up for last two months) and slight pick-up in rural demand. Any share price correction should be used to BUY into this high quality franchise (Marico - The Art of People Management). Our DCF-based TP of `298 (6% upside) implies FY18E P/E of 36x (at a 15% premium to sector average).
Volume grew ~3% YoY dragged down by 6% drop in Parachute
In 2QFY17, Marico’s consolidated sales declined by 1% YoY to Rs14.4bn (~4% below our estimates) whilst its PAT grew by 18% YoY to Rs1.8bn (~2% ahead our estimates). India FMCG sales (~78% of total sales) declined 3% YoY due to overall deflation of 6%. Overall domestic volumes (up 3% YoY) were dragged down by 6% YoY decline in Parachute Coconut Oil. International business (~22% of sales) reported 4% YoY growth in constant currency (cc) and volume growth of 4% led by MENA, South East Asia and South Africa. Lower input costs (copra/Liquid Paraffin down 26%/13%) led to gross margin expansion of ~479bps YoY to 52.5%. However, this was partially offset by higher employee cost and other expenses leading to EBITDA margin expansion of ~179bps YoY to 17.5%. Consolidated PAT grew 18% YoY to Rs1.8bn, 2% ahead of our estimates. We have reduced our FY17/18 EPS estimates downward by 4-5%.
Exhibit 1: International segmental performance
Segment
FY16 contribution
to total sales %
Reported 2QFY17 growth
Comments Volume growth
YoY%
Value growth
YoY%
International Business 22%
5%
International business volume growth of 4% was mainly led by MENA, South East Asia and South Africa. Outlook: Bangladesh business should return to growth latest by 4Q. MENA region to witness headwinds due to geopolitical issues. South East Asia and MENA are 'Invest to grow' markets with growth coming from organic and inorganic sources (new geographies and acquisitions/alliances)
Bangladesh 10%
-5%
Parachute coconut oil declined by 9% YoY in cc due to price correction during the quarter but maintained market share of 83%; non-coconut oil portfolio is now 20% of sales with VAHO growing +11% YoY in cc. Outlook: Non-coconut oil portfolio to be 30-40% of sales over the next 3-4 years. Growth expected to return in Parachute portfolio from next quarter.
South East Asia 6%
12% Led mainly by broad-based growth in Vietnam where company maintains leadership in male shampoos and #2 in male deodorants. Outlook: Expect similar growth trends to continue
MENA 4%
5%
Middle East business grew on back of re-launch of Parachute Gold hair oils and cream. Egypt business grew 9% YoY in cc aided by Parachute oils and cream re-launch. Outlook: Expect headwinds in the MENA business due to macro slowdown. Currency depreciation putting pressure on margin and value growth.
Consolidated margin profile
OPM at 19% in 2QFY17 vs 17.6% last year driven by lower input costs. Will try to maintain margin at 17-18%
Source: Company, Ambit Capital research
BUY Result Update Stock Information Bloomberg Code: MRCO IN
CMP (Rs): 282
TP (Rs): 298
Mcap (Rs bn/US$ bn): 364/5.4
3M ADV (Rs mn/US$ mn): 346/5.2
Stock Performance (%)
1M 3M 12M YTD
Absolute (1) (0) 43 25
Rel. to Sensex 0 0 40 18
Source: Bloomberg, Ambit Capital research
Ambit Estimates (Rs mn)
FY16 FY17 FY18
Revenues 61,320 65,046 75,257
EBITDA 10,625 12,681 15,048
EPS (Rs) 5.6 6.8 8.3
Source: Ambit Capital research
Research Analysts
Rakshit Ranjan, CFA Rakshit.ranjan@ ambit.co Tel: +91 22 3043 3201
Ritesh Vaidya, CFA [email protected] Tel: +91 22 3043 3246
Dhiraj Mistry, CFA [email protected] Tel: +91 22 3043 3264

AMBIT RESULTS INSIGHTS
Ambit Capital Pvt Ltd 29 October 2016
Exhibit 2: Domestic segmental performance
Segment
FY16 contribution
to total sales %
Reported 2QFY17 growth
Comments Volume growth
YoY%
Value growth
YoY%
India Business 78% 3% -3%
Volume growth was impacted by 6% volume decline in PCNO. Remainder of the portfolio delivered steady performance Outlook: Expect ~6-8% volume growth in 2HFY17 on back of PCNO revival and moderate pick-up in rural demand; 2HFY17 is expected to witness a pickup in rural demand due to good monsoon and government stimulus. Value growth should return from 4QFY17 as price cuts in PCNO are annualized.
Parachute Coconut Oil (Rigid packs) 27% -6% -19%
Marico took a 5-6% price hike in Jul’16 expecting copra prices to trend up in 2QFY17. However, the ~5% drop in Jun’16 led to increase in price premium for PCNO over unbranded players and hence the sharp volume drop. Outlook: PCNO sales have picked up from Sep’16, copra prices have started increasing. Expect +ve volume growth in 3QFY17 and value growth in 4Q as price cuts will be annualized.
Value Added Hair Oils (VAHO) 20% 11% 11%
Increased volume/value share by 128/63bps YoY to 32%/25% in VAHO. Nihar Shanti Amla increased volume share to 38%. Performance of new launches - Nihar Naturals Sarson Kesh Tel and Parachute Advansed Ayurvedic Gold Hair oil has been below management’s expectations. Low price sachet and spout packs of Parachute Jasmine and Nihar Shanti Amla have been doing well. Outlook: Will use new product launches (anti-hair fall hair oil) for driving category volumes and focus on driving premiumisation; expect 11-13% YoY volume growth in the medium term.
Saffola 14% 8% 10%
Increased market share by 3.1bps YoY to 64%; sales at both premium end and entry level doing well. Saffola Oats growth considerably slowed down due to Maggi Noodles revival. Outlook: Will launch innovative products in both edible oils and Oats to drive growth. Expect double-digit volume growth in the near term.
Youth Portfolio 4%
29%
Hair gels portfolio continues to do well post its relaunch 4QFY15; Seeing promising signs in deodorants and Livon hair gain. The portfolio is currently split as 40%/35%/25% across Hair Gels/Serums/Deos. Outlook: Will do investments in youth portfolio and deliver 15-20% YoY value growth in near term.
Source: Company, Ambit Capital research
Parachute volume growth to correct from 3QFY17
Decline in PCNO was due to the pre-mature price hike where the management expected copra prices to go up in 2QFY17 while the prices actually went down 5-7% making PCNO uncompetitive versus the unbranded players. Copra prices have increased by ~7% since Jul’16 which should lead to price hike by Parachute’s competitors. PCNO sales have already been growing YoY since Sep’16. We expect overall sales to have high single-digit value growth for 2HFY17 on the back of revival in PCNO and slight pick-up in rural demand.
Genesis built around quality of talent, Board, and loyal distributors
Marico has maintained leadership in its core categories through: (a) a unique work culture (entrenched in values such as empowerment, meritocracy, innovation, openness and integrity) which has enabled the firm to attract and retain high quality talent; (b) a high quality Board which is truly ‘independent’ in helping drive strategic decision-making; and (c) a strong focus on building supportive relationships with its distributors. This has helped Marico deliver: a) 17%/19% sales/EPS CAGR over FY01-15; b) most consistent organic growth amongst Indian FMCG companies since 1995; and c) Innovation-led growth of six brands to >Rs10bn overall sales with two brands having sales of Rs2bn+. Please refer to (Coffee Can legends note on Marico) for a detailed discussion on this theme.
Focus on key transformational areas driving the next leg of growth
Over the last two years, Marico has implemented several transformational changes including: (a) shift in control from a promoter-led management team to professionals; (b) changes to the incentive structure of the management team with a greater focus on long-term growth drivers; (c) capital deployment focused on organic growth and dividend payouts; and (d) IT-led distribution changes such as automated order system which should further enhance Marico’s trade equity.

AMBIT RESULTS INSIGHTS
Ambit Capital Pvt Ltd 29 October 2016
VAHO, Saffola and Bangladesh to lead future business growth
Over FY16-20E, we expect the domestic business to deliver 18% revenue CAGR led by: (a) Increasing value share in VAHO (~23% CAGR, market share increase of ~330bps) helped by new launches; and (b) Saffola (~19% CAGR) through increased urban penetration. Focus on non-coconut oil growth in Bangladesh (14% CAGR) and organic growth in the rest of the international business should lead to ~15% CAGR in FY16-20E in the overseas business as well.
High quality franchise; deserves to trade at a premium to its Indian FMCG peers
Marico’s genesis highlighted above should allow it to replicate its historical success in the future as well. As a result, we expect the firm to trade at a premium to other Indian FMCG players like Dabur and GCPL, as well as MNCs like GSK Consumer and Colgate. We have reduced our estimate for FY17-18 by 4-5% following 2QFY17 results. We expect Marico to deliver FY16-20 sales/EPS CAGR of 15%/23% with its RoCE improving from 33% to ~41% over the same period. Our DCF-based TP of `298 (6% upside) implies FY18E P/E of 36x.
Exhibit 3: Quarterly snapshot (Rs mn)
in Rs. Mn 2QFY17 2QFY16 1QFY17 YoY QoQ Ambit estimates Divergence
Net sales 14,428 14,536 17,543 -1% -18% 14,966 -4%
COGS 6,847 7,595 8,419 -10% -19% 7,080 -3%
Gross profit 7,581 6,941 9,123 9% -17% 7,886 -4%
Gross margin 52.5% 47.7% 52.0% 479 53 52.7% (15)
Employee cost 1,049 845 1,052 24% 0% 904 16%
A&P 1,889 1,909 2,091 -1% -10% 2,185 -14%
Other expenditure 2,112 1,898 2,241 11% -6% 2,095 1%
Total expenditure 5,050 4,652 5,384 9% -6% 5,185 -3%
EBITDA 2,531 2,289 3,740 11% -32% 2,701 -6%
EBITDA margin 17.5% 15.7% 21.3% 179 (378) 18.1% (51)
Other income 247 174 275 42% -10% 150 65%
Depreciation & Amort 209 221 208 -5% 1% 220 -5%
EBIT 2,568 2,243 3,807 15% -33% 2,631 -2%
Interest 21 37 54 -44% -61% 40 -49%
PBT before MI 2,548 2,206 3,753 15% -32% 2,591 -2%
Minority interest (2) - (2) -! -24% (2) -20%
PBT after MI 2,549 2,206 3,756 16% -32% 2,593 -2%
Tax 740 676 1,072 9% -31% 819 -10%
PAT 1,809 1,530 2,683 18% -33% 1,774 2%
% of Sales Employee cost 7.3% 5.8% 6.0% 146 127 6.0% 123
A&P 13.1% 13.1% 11.9% (4) 117 14.6% (150)
Other expenditure 14.6% 13.1% 12.8% 158 186 14.0% 64
Source: Company, Ambit Capital research
AMBIT RESULTS INSIGHTS
Ambit Capital Pvt Ltd 29 October 2016
Balance sheet
Year to March (Rs mn) FY15 FY16 FY17E FY18E FY19E
Net Worth 18,248 20,968 25,140 30,377 36,229
Total Debt 3,342 1,532 - - -
Others 215 142 260 379 497
Current Liabilities 9,448 11,588 13,366 15,464 18,377
Total Liabilities 31,253 34,231 38,767 46,219 55,103
Fixed Assets 10,790 10,805 10,924 11,048 11,185
Investments 2,838 4,164 4,164 4,164 4,164
Current Assets 17,625 19,262 23,679 31,007 39,754
Total Assets 31,253 34,231 38,767 46,219 55,103
Source: Company, Ambit Capital research
Income statement
Year to March (Rs mn) FY15 FY16 FY17E FY18E FY19E
Net Income 57,330 61,320 65,046 75,257 89,434
% Growth 22% 7% 6% 16% 19%
Gross Profit 26,139 30,706 33,821 39,431 47,127
EBITDA 8,701 10,625 12,681 15,048 18,150
PBIT 8,446 10,540 12,520 15,260 18,937
PBT 8,102 10,219 12,333 15,141 18,818
PAT 5,735 7,248 8,722 10,716 13,327
EPS 4.4 5.6 6.8 8.3 10.3
EPS Growth 18% 26% 20% 23% 24%
Source: Company, Ambit Capital research
Cash flow statement
Year to March (Rs mn) FY15 FY16 FY17E FY18E FY19E
EBIT 8,446 10,540 12,520 15,260 18,937
Depreciation 843 1,018 981 976 963
Others (2,950) (3,366) (3,680) (4,425) (5,492)
Change in working capital (2,898) 1,551 (770) (839) (1,165)
Cash flow from operations 3,441 9,744 9,052 10,971 13,243
Cash flow from investments (2,446) (2,360) (1,100) (1,100) (1,100)
Cash flow from financing (3,010) (6,337) (6,082) (5,480) (7,475)
Change in cash (2,015) 1,048 1,870 4,391 4,668
Free cash flow 3,077 8,798 7,952 9,871 12,143
Source: Company, Ambit Capital research
Ratio analysis / Valuation parameters
Year to March (Rs mn) FY15 FY16 FY17E FY18E FY19E
Gross margin (%) 45.6% 50.1% 52.0% 52.4% 52.7%
EBITDA margin (%) 15.2% 17.3% 19.5% 20.0% 20.3%
Net profit margin (%) 10.0% 11.8% 13.4% 14.2% 14.9%
Net debt: equity (x) 0.1 (0.1) (0.2) (0.3) (0.4)
RoCE (%) 28.7% 33.3% 36.5% 38.2% 39.5%
RoE (%) 36.0% 37.0% 37.8% 38.6% 40.0%
P/E (x) 63.4 50.2 41.7 33.9 27.3
Price/Sales (x) 6.3 5.9 5.6 4.8 4.1
EV/EBITDA (x) 42.0 34.1 28.3 23.6 19.3
Source: Company, Ambit Capital research

AMBIT RESULTS INSIGHTS
Ambit Capital Pvt Ltd 29 October 2016
Colgate Market-share loss continues Colgate’s volume growth for 2QFY17 came in at ~4% YoY (1% below our estimate), much slower than Dabur’s oral care portfolio growth rate (+11% YoY). Total sales grew +10% YoY to Rs12bn (1% below of estimates) while PAT came in at Rs1.8bn, +16% YoY (12% ahead of our estimate) due to lower tax expense. EBITDA margin contracted by 40bps YoY due to aggressive A&P spends and higher employee cost. For Jul-Sep’16, Colgate lost volume market share of 80bps QoQ in the toothpaste category (from 56.1% to 55.3%). Recent new launches in natural and other premium categories are yet to arrest the market-share loss for Colgate. Moreover, increasing rural penetration from Patanjali can be a threat to Colgate’s rural growth prospects. Given Colgate’s vulnerability to local competition leading to prolonged period of market share loss we believe current valuations of 34x FY18E EPS (10% premium to sector average) is unjustified. SELL with a TP of Rs900 (8% downside, 30x FY18E EPS).
Result overview: Sales 1% below our est, PAT ahead due to lower tax rate
For 2QFY17, Colgate reported sales of Rs12.0bn, +10% YoY (1% below of our estimate) with domestic volume growth of +4% YoY (1% below our estimate) for 2QFY17. Gross margin expanded by ~70bps YoY to 55.3% due to lower input cost. Rise in A&P spend and employee cost by 150bps and ~80bps as a percentage of sales respectively, led to EBITDA margin contraction of ~40bps YoY to 22.8%. PAT at Rs1.8bn (12% above our estimate) grew 16% YoY due to lower tax rate (~28% in 2QFY17 vs ~34% in 2QFY16).
Lost market share despite new product launches and increase in A&P
According to our analysis, Colgate seems to have lost market share by 80bps QoQ from 56.1% in Apr-Jun’16 to 55.3% in Jul-Sep’16. Despite new product launches and higher A&P spends supporting these launches, the company lost market share. The company launched Cibaca Vedshakti based on the naturals platform at ~30% discount to Dabur Red and Patanjali’s Dant Kanti. However, we believe consumers have switched to natural toothpastes not because of the price but for taste and/or ingredient. Company’s other launches of ‘Colgate Sensitive Clove’ with natural ingredient, ‘Colgate Kids’ with animal cartoons and ‘Maxfresh Power Freeze’ haven’t been able to arrest its market-share loss as yet.
Exhibit 1: Colgate seems to have lost market share by 80bps in 2QFY17
Source: Ambit Capital research
51.0
53.0
55.0
57.0
59.0
Jul-
Sep'
11
Oct
-Dec
'11
Jan-
Mar
'12
Apr
-Jun
'12
Jul-
Sep'
12
Oct
-Dec
'12
Jan-
Mar
'13
Apr
-Jun
'13
Jul-
Sep'
13
Oct
-Dec
'13
Jan-
Mar
'14
Apr
-Jun
'14
Jul-
Sep'
14
Oct
-Dec
'14
Jan-
Mar
'15
Apr
-Jun
'15
Jul-
Sep'
15
Oct
-Dec
'15
Jan-
Mar
'16
Apr
-Jun
'16
Jul-
Sep'
16
Colgate Toothpaste Volume share (%)
SELL Result Update Stock Information Bloomberg Code: CLGT IN
CMP (Rs): 973
TP (Rs): 900
Mcap (Rs bn/US$ bn): 265/4.0
3M ADV (Rs mn/US$ mn): 323/4.8
Stock Performance (%)
1M 3M 12M YTD
Absolute (0) 4 (1) 0
Rel. to Sensex 1 5 (4) (7)
Source: Bloomberg, Ambit Capital research
Ambit Estimates (Rs mn)
FY16 FY17 FY18
Revenues 41,623 47,019 54,406
EBITDA 9,313 10,674 12,513
EPS (Rs) 22.3 24.9 28.9
Source: Bloomberg, Ambit Capital research
Research Analysts
Rakshit Ranjan, CFA Rakshit.ranjan@ ambit.co Tel: +91 22 3043 3201
Ritesh Vaidya, CFA [email protected] Tel: +91 22 3043 3246
Dhiraj Mistry, CFA [email protected] Tel: +91 22 3043 3264
AMBIT RESULTS INSIGHTS
Ambit Capital Pvt Ltd 29 October 2016
Where do we go from here?
Best placed to benefit from the increase in rural demand
Rural per capita toothpaste consumption of only ~85gm vs ~280gm in urban areas and a penetration level of 74% indicate that rural toothpaste volumes can grow at ~7% over the next five years at least. We believe Colgate will be one of the biggest beneficiaries of DBT-induced rural demand pick-up. Colgate is likely to gain market share and deliver 10% volume CAGR over FY17-FY20 in rural India due to its: (a) wider rural distribution reach vs Dabur, Patanjali and other regional players; (b) initiatives to increase oral care awareness and strengthen relationships with dentists; and (c) strong brand equity for Colgate Dental Cream.
Macro headwinds in urban around premiumisation and penetration
With 92% penetration and urban per capita consumption of 280gm (~10% higher than the average for China and the Philippines), we expect only 5% volume CAGR for the urban toothpaste industry over FY17-FY20E. Toothpaste premiumisation in India will be a weak growth driver vs other personal care categories. Unlike the aspiration/celebrity-driven trends in other categories, premiumisation in oral care has largely been driven by utility, like herbal (Dabur Red, Meswak, Patanjali), habit-based (Active Salt), freshness-based (Maxfresh) or therapeutic products recommended by doctors (Sensitive). This explains the failure of Colgate’s Total and Pepsodent’s Expert to drive premiumisation over the past two decades.
Headwinds from increased competition; SELL (~8% downside)
Given the benefit that we believe will accrue to Colgate due to pick-up in rural demand, we expect 15%/17% sales/EPS CAGR over FY16-FY20E. Increasing rural penetration from Patanjali can be a threat to Colgate’s rural growth prospects. However, given Colgate’s vulnerability to local competition leading to prolonged period of market share loss we believe current valuations of 34x FY18E EPS (10% premium to sector average) is unjustified. SELL with a TP of Rs900 (8% downside, 30x FY18E EPS).

AMBIT RESULTS INSIGHTS
Ambit Capital Pvt Ltd 29 October 2016
Exhibit 2: Quarterly snapshot (Rs mn)
2QFY17 1QFY17 2QFY16 YoY QoQ Ambit YoY growth estimates
Deviation from Ambit Estimates
Gross sales 11,949 11,415 10,885 10% 5% Total revenues 12,032 11,491 10,952 10% 5% 11% -1%
Raw materials 5,376 5,182 4,961 8% 4% Gross Profit 6,656 6,309 5,991 11% 5% Gross Margin 55.7% 55.3% 55.0% 67 43 Employee cost 731 739 581 26% -1% Advertising & Publicity 1,280 1,556 998 28% -18% Other expenditure 1,898 1,901 1,869 2% 0% Total expenditure 3,909 4,197 3,448 13% -7% EBITDA 2,748 2,113 2,543 8% 30% 5% 3%
EBITDA margin 22.8% 18.4% 23.2% (38) 445 Other income 113 101 107 5% 12% Depreciation 333 316 269 24% 5% PBIT 2,527 1,897 2,380 6% 33% Interest - - - NA NA PBT 2,527 1,897 2,380 6% 33% Tax 714 640 812 -12% 12% PAT 1,813 1,257 1,569 16% 44% 4% 12%
EPS 6.7 4.6 5.8 16% 44% As % of sales Excise cost 12.3% 0.0% 12.0% 29 1,227 Employee cost 6.1% 6.4% 5.3% 77 (36) Advertising & Publicity 10.6% 13.5% 9.1% 152 (291) Other expenditure 15.8% 16.5% 17.1% (129) (77) Source: Company, Ambit Capital research

AMBIT RESULTS INSIGHTS
Ambit Capital Pvt Ltd 29 October 2016
Balance sheet
Year to March (Rs mn) FY15 FY16 FY17E FY18E FY19E
Net Worth 7,703 10,195 11,888 13,856 16,239
Total Debt - - - - -
Deferred Tax liability 26 217 217 217 217
Current Liabilities 9,290 9,025 10,195 11,796 13,647
Total Liabilities 17,019 19,437 22,300 25,869 30,103
Fixed Assets 9,228 10,865 13,548 13,667 13,689
Investments 371 301 301 301 301
Current Assets 7,420 8,270 8,450 11,900 16,112
Total Assets 17,019 19,437 22,300 25,869 30,103
Source: Company, Ambit Capital research
Income statement
Year to March (Rs mn) FY15 FY16 FY17E FY18E FY19E
Net Income 39,819 41,623 47,019 54,406 62,939
% Growth 11% 5% 13% 16% 16%
Gross Profit 25,142 26,670 30,252 35,059 40,621
EBITDA 8,222 9,313 10,674 12,513 14,696
PBIT 7,804 8,595 9,816 11,747 14,229
PBT 7,804 8,595 9,816 11,747 14,229
PAT 5,590 6,079 6,773 7,870 9,533
EPS 20.6 22.3 24.9 28.9 35.1
EPS Growth 18% 9% 11% 16% 21%
Source: Company, Ambit Capital research
Cash flow statement
Year to March (Rs mn) FY15 FY16 FY17E FY18E FY19E
EBIT 7,804 8,595 9,816 11,747 14,229
Depreciation 750 1,114 1,283 1,381 1,478
Others (2,010) (2,325) (3,043) (3,876) (4,696)
Change in working capital 20 (777) 846 704 814
Cash flow from operations 6,564 6,607 8,902 9,955 11,825 Cash flow from investments (3,004) (2,682) (3,966) (1,500) (1,500)
Cash flow from financing (3,885) (3,587) (5,080) (5,903) (7,150)
Change in cash (325) 339 (144) 2,553 3,175
Free cash flow 3,560 3,856 4,936 8,455 10,325
Source: Company, Ambit Capital research
Ratio analysis / Valuation parameters
Year to March (Rs mn) FY15 FY16 FY17E FY18E FY19E
Gross margin (%) 63.1% 64.1% 64.3% 64.4% 64.5%
EBITDA margin (%) 20.6% 22.4% 22.7% 23.0% 23.4%
Net profit margin (%) 14.0% 14.6% 14.4% 14.5% 15.1%
Net debt: equity (x) (0.3) (0.3) (0.2) (0.4) (0.5)
RoCE (%) 82.5% 67.0% 60.2% 60.1% 62.5%
RoE (%) 81.6% 67.9% 61.3% 61.1% 63.4%
P/E (x) 55.7 47.3 43.5 39.1 33.6
Price/Sales (x) 7.4 6.6 6.4 5.6 4.9
EV/EBITDA (x) 39.4 31.9 28.1 24.5 20.7
Source: Company, Ambit Capital research
AMBIT RESULTS INSIGHTS
Ambit Capital Pvt Ltd 29 October 2016
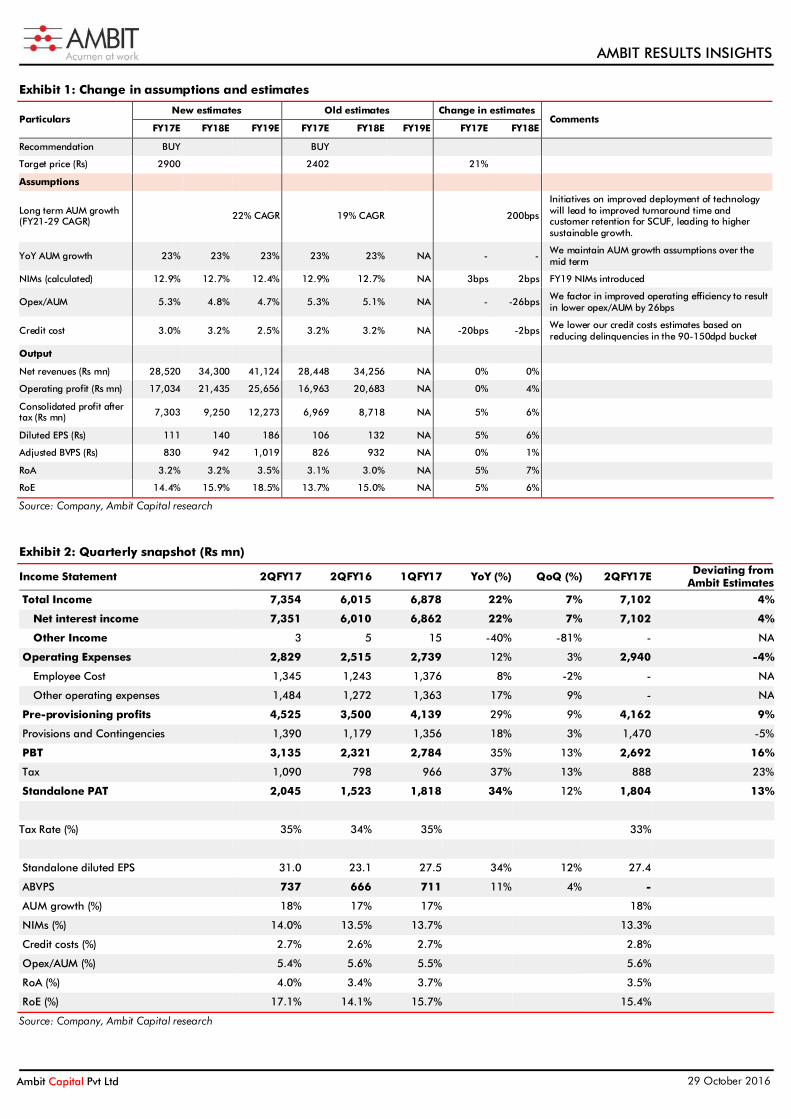
Shriram City Union Finance Another quarter of earnings pick-up SCUF’s PAT growth at 34% YoY was ~13% above our/consensus expectations, primarily due to significant improvement in operating efficiency (opex/AUM down by 24bps YoY). Other key trends also remained strong with improving AUM growth (up 18% YoY), expanding NIMs (up ~55bps YoY) and better asset quality (NPAs down by ~10bps). With momentum in earnings growth continuing for last six quarters, the earnings trajectory of SCUF is finally turning around. We upgrade our TP by 20% (to Rs2,900, implying 3.1x FY18E P/B and 21x FY18E P/E), due to: i) Higher and faster-than-expected asset quality and operating efficiency driving 5%/7% upgrades in FY17/18E PAT; and ii) Upgrading of our long-term growth estimate from 19% CAGR over FY21-29E to 21% CAGR. SCUF’s valuation discount to its peers (~20% on FY17/18E PB) should narrow down as investors starts appreciating higher sustainability in SCUF’s earnings growth due to collateralised lending and strong positioning in high-entry barrier segments.
Results overview: SCUF reported PAT of Rs2.04bn (up 34% YoY), ~13% above our and consensus expectations. Earnings surprise was primarily due to higher-than-expected improvement in operating costs (down 24bps YoY) versus our expectations of flat opex/AUM. Other operating trends remain strong with improving AUM growth (up 18% YoY), expanding NIMs (up ~55bps YoY), and improving asset quality (NPAs down by ~10bps).
Multiple levers aid growth: AUM growth continued its momentum, at 18% YoY, led by growth in SME loans (up 24% YoY) and two-wheeler loans (up 26% YoY). Disbursements continued to grow at 20%+ levels, which was driven across product classes. Growth of SME loans was aided by increase in ticket sizes and growth in non-south geographies. SCUF continues to gain market share in two-wheeler financing as disbursement growth of 27% YoY is significantly higher than the industry sales growth of 21% YoY. We expect SCUF to deliver 23% AUM CAGR over FY16-19E as the momentum in above mentioned drivers continues to unfold.
Asset quality continues to improve: SCUF’s credit costs were flat YoY at ~266bps even as its asset quality improved. Multiple metrics point to SCUF’s improving asset quality: i) Gross NPAs on 180dpd basis improved by 10bps to 3.2% in 2QFY17 (5.0% on 150dpd basis); ii) Sequential growth in NPA has also come off – NPAs have been flat QoQ, much lower than 8-10% run-rate historically observed; iii) Delinquencies (net additions + write-offs) as a percentage of AUM have also declined – down ~50bps YoY to 2.3%; and iv) NPAs in 90dpd basis have also come-off to ~8% versus ~9% a year ago. Whilst SCUF will migrate to 90dpd NPA recognition by FY18, we estimate its credit costs to decline by 90bps to 2.5% over FY16-19E due to improving asset quality and lowering coverage ratio.
Margin improvement driven by decline in cost of funds: SCUF’s NIMs improved by ~33bps YoY as ~10bps YoY increase in yields was supported by ~62bps YoY decline in cost of funds. Such huge decline in cost of funds were driven by change in liability mix as declining share of relatively expensive retail borrowings (down from 30% in 2Q16 to 25% in 2Q17) was substituted by relatively cheaper market borrowings (up from 12% in 2Q16 to 14% in 2Q17) and bank loans (up from 51% in 2Q16 to 54% in 2Q17). Interest reversals were ~Rs96mn as per our estimate impacting yields by ~18bps. We expect SCUF’s spreads to remain steady at ~10.7% over FY16-19E primarily as declining funding costs will offset the impact of interest income reversals on migration to 90dpd NPA provisioning norms and marginal compression in yields due to lower share of gold loan going forward. However, increasing leverage should result in NIMs declining by 60bps YoY by FY19E even as spreads remain stable.
Operating efficiencies have improved: SCUF’s operating efficiencies improved by ~22bps YoY to 5.4% of AUM; primarily driven by employee count remaining steady. The management highlights that various initiatives are being undertaken to improve
BUY Result Update Stock Information Bloomberg Code: SCUF IN
CMP (Rs): 2,499
TP (Rs): 2,900
Mcap (Rs bn/US$ bn): 153/2.3
3M ADV (Rs mn/US$ mn): 82.2/1.2
Stock Performance (%)
1M 3M 12M YTD
Absolute 4 23 25 46
Rel. to Sensex 5 24 22 39
Source: Bloomberg, Ambit Capital research
Ambit Estimates (Rs bn)
FY17E FY18E FY19E
Net Revenues 28.5 34.3 41.1
C. PAT 7.3 9.3 12.3
EPS (Rs) 111 140 186
Source: Bloomberg, Ambit Capital research
Research Analysts
Aadesh Mehta, CFA [email protected] Tel: +91 22 3043 3239
Pankaj Agarwal, CFA [email protected] Tel: +91 22 3043 3206

AMBIT RESULTS INSIGHTS
Ambit Capital Pvt Ltd 29 October 2016
the operating efficiencies, such as: i) technology upgrades in the middle and back-office to reduce the turnaround time and improvement in employee efficiency; ii) improved use of analytics to increase cross-sell and repeat business; iii) man-force rationalisation as per the performance. Consequently, they are guiding for operating costs growth to remain lower than the loan book growth. We expect SCUF to demonstrate improvement of ~100bps in opex/AUM over FY16-19E due to improving operating efficiencies.
Profitability in housing improves: SCUF’s housing finance subsidiary posted reasonable PAT growth of 26% YoY despite AUM growing by 75% YoY. This was driven by higher operating costs (up 100bps to 6.3%). Asset quality in this business improved with Gross NPA reducing by 47bps QoQ to 3.5%.
Where do we go from here?
Upgrades on back of improving trends: SCUF continues to demonstrate improving trends across all the key metrics; AUM growth is improving (18%), NIM is expanding (up ~55bps), asset quality is getting better (gross NPAs down ~10bps) and operating efficiencies are also improving (opex/AUM down 22bps). Such improving trends lead to upgrades across key metrics of credit costs, margins and operating costs: i) SCUF’s superior positioning to lower funding costs and resilient yields have led to marginal upgrade in our NIM estimates; ii) delinquencies in 90dpd-150dpd bucket have come-off from the earlier levels, implying lower provisioning on 90dpd migration, thus marginally lowering our credit costs estimates; and iii) clarity on strategy to improve operating efficiency has led to reduction in our operating cost estimates. This has led to upgrades in FY17/18E PAT by 5/7%. Moreover, initiatives on improved deployment of technology will lead to improved turnaround time and customer retention for SCUF and thus we also upgrade our FY21-29 growth assumptions from 19% CAGR to 21% CAGR. Overall these upgrades led to increase in target price by 20% (from Rs2,402 to Rs2,900).
Earnings turning around, reiterate high conviction BUY: With momentum in earnings growth picking up since past 6 quarters, the earnings trajectory of SCUF is finally turning around. Improving earnings momentum also validates our conviction that SCUF should deliver 30% EPS CAGR over FY16-19E driven by 23% AUM CAGR and RoAs improving by 60bps. AUM growth should improve to 23% CAGR driven by increasing ticket sizes and duration in SME loans and market share gain in 2-wheeler financing. RoAs should improve as decline in NIMs (down ~70bps) is offset by improving operating efficiency (down ~100bps) and credit costs (down ~90bps). In fact SCUF’s RoEs have improved to ~16% in 1HFY17 (versus 14% in 1HFY16). Our upgraded target price of Rs2,900 implies 3.1x FY18E P/B and 21x FY18E P/E. The stock currently trades at 2.7x 1-year forward P/B and 18x 1-year forward P/E, a meaningful 20% discount to its peer group due to marginally lower earnings growth (28% CAGR for SCUF versus 31% CAGR for peers). However, we believe the valuations will rerate as the street starts appreciating the higher sustainability in SCUF’s earnings growth due to: i) its collateralised lending book; and ii) strong competitive advantages in high-entry barrier segments (click here for our note dated 24th Feb 2015).
AMBIT RESULTS INSIGHTS
Ambit Capital Pvt Ltd 29 October 2016
Exhibit 1: Change in assumptions and estimates
Particulars New estimates Old estimates Change in estimates
Comments FY17E FY18E FY19E FY17E FY18E FY19E FY17E FY18E
Recommendation BUY
BUY
Target price (Rs) 2900
2402
21%
Assumptions
Long term AUM growth (FY21-29 CAGR)
22% CAGR 19% CAGR 200bps
Initiatives on improved deployment of technology will lead to improved turnaround time and customer retention for SCUF, leading to higher sustainable growth.
YoY AUM growth 23% 23% 23% 23% 23% NA - - We maintain AUM growth assumptions over the mid term
NIMs (calculated) 12.9% 12.7% 12.4% 12.9% 12.7% NA 3bps 2bps FY19 NIMs introduced
Opex/AUM 5.3% 4.8% 4.7% 5.3% 5.1% NA - -26bps We factor in improved operating efficiency to result in lower opex/AUM by 26bps
Credit cost 3.0% 3.2% 2.5% 3.2% 3.2% NA -20bps -2bps We lower our credit costs estimates based on reducing delinquencies in the 90-150dpd bucket
Output
Net revenues (Rs mn) 28,520 34,300 41,124 28,448 34,256 NA 0% 0%
Operating profit (Rs mn) 17,034 21,435 25,656 16,963 20,683 NA 0% 4%
Consolidated profit after tax (Rs mn) 7,303 9,250 12,273 6,969 8,718 NA 5% 6%
Diluted EPS (Rs) 111 140 186 106 132 NA 5% 6%
Adjusted BVPS (Rs) 830 942 1,019 826 932 NA 0% 1%
RoA 3.2% 3.2% 3.5% 3.1% 3.0% NA 5% 7%
RoE 14.4% 15.9% 18.5% 13.7% 15.0% NA 5% 6%
Source: Company, Ambit Capital research
Exhibit 2: Quarterly snapshot (Rs mn)
Income Statement 2QFY17 2QFY16 1QFY17 YoY (%) QoQ (%) 2QFY17E Deviating from Ambit Estimates
Total Income 7,354 6,015 6,878 22% 7% 7,102 4%
Net interest income 7,351 6,010 6,862 22% 7% 7,102 4%
Other Income 3 5 15 -40% -81% - NA
Operating Expenses 2,829 2,515 2,739 12% 3% 2,940 -4%
Employee Cost 1,345 1,243 1,376 8% -2% - NA
Other operating expenses 1,484 1,272 1,363 17% 9% - NA
Pre-provisioning profits 4,525 3,500 4,139 29% 9% 4,162 9%
Provisions and Contingencies 1,390 1,179 1,356 18% 3% 1,470 -5%
PBT 3,135 2,321 2,784 35% 13% 2,692 16%
Tax 1,090 798 966 37% 13% 888 23%
Standalone PAT 2,045 1,523 1,818 34% 12% 1,804 13%
Tax Rate (%) 35% 34% 35% 33%
Standalone diluted EPS 31.0 23.1 27.5 34% 12% 27.4 ABVPS 737 666 711 11% 4% - AUM growth (%) 18% 17% 17% 18% NIMs (%) 14.0% 13.5% 13.7% 13.3% Credit costs (%) 2.7% 2.6% 2.7% 2.8% Opex/AUM (%) 5.4% 5.6% 5.5% 5.6% RoA (%) 4.0% 3.4% 3.7% 3.5% RoE (%) 17.1% 14.1% 15.7% 15.4% Source: Company, Ambit Capital research

AMBIT RESULTS INSIGHTS
Ambit Capital Pvt Ltd 29 October 2016
Exhibit 3: Relative valuation snapshot
Mcap Price Reco. TP Up/ (Down)
P/B P/E EPS CAGR ROA ROE
US$bn Rs
Rs FY17E FY18E FY17E FY18E FY16-18E FY17E FY18E FY17E FY18E
Bajaj Finance 9.2 1,144 SELL 485 -58% 6.9 5.8 38.2 31.1 23% 3.2% 2.9% 20.0% 20.2%
Manappuram 1.3 101 NA NA NA 2.8 2.4 15.1 12.1 56% 4.2% 4.5% 18.4% 21.0%
Muthoot Finance 2.1 358 NA NA NA 2.2 2.0 13.7 11.5 29% 3.8% 3.7% 17.4% 18.0%
Bharat Financial Inclusion (SKS) 1.8 877 NA NA NA 5.0 3.7 18.3 16.5 49% 6.0% 4.9% 32.5% 25.5%
Capital First 1.0 734 NA NA NA 3.5 3.0 27.5 19.4 45% 1.5% 1.7% 13.4% 16.8%
Equitas Holdings 0.9 176 BUY 220 25% 2.6 2.3 29.2 22.7 12% 2.3% 2.0% 11.2% 10.8%
Ujjivan Financial 0.8 439 BUY 500 14% 2.9 2.6 23.8 22.7 5% 3.1% 2.2% 14.7% 12.2%
Average
3.7 3.1 23.7 19.4 31% 3.4% 3.1% 18.3% 17.8%
Shriram City Union Finance 2.3 2,499 BUY 2,900 16% 3.0 2.7 22.6 17.8 28% 3.1% 3.0% 13.7% 15.0%
Premium/Discount -19% -15% -5% -8% -11% -11% -3% -25% -15%
Source: Ambit Capital research, Bloomberg

AMBIT RESULTS INSIGHTS
Ambit Capital Pvt Ltd 29 October 2016
Balance sheet (Rs mn)
FY15 FY16 FY17E FY18E FY19E
Net interest income 21,391 24,441 28,308 34,088 40,913
Interest Income 34,822 38,349 44,651 54,007 64,961
Interest Expense 13,432 13,908 16,343 19,918 24,049
Fee based and other income 494 212 212 212 212
Total Income 21,885 24,653 28,520 34,300 41,124
Total expenses 8,936 10,421 11,486 12,865 15,468
Operating and other expenses 4,820 5,289 6,031 6,968 8,392
Employee Cost 4,116 5,132 5,454 5,896 7,076
Pre provision profit 12,949 14,232 17,034 21,435 25,656
Provisions 4,538 6,163 6,612 8,451 8,365
Profit before tax 8,411 8,068 10,423 12,984 17,291
Tax 2,830 2,771 3,439 4,285 5,706
Standalone PAT 5,581 5,298 6,983 8,699 11,585
Consolidated PAT 5,737 5,521 7,303 9,250 12,273
Source: Company, Ambit Capital research
Income statement (Rs mn)
FY15 FY16 FY17E FY18E FY19E
Networth 41,844 45,914 51,360 58,145 67,181
Borrowings 133,732 149,606 189,121 237,324 295,821
On-book 124,020 144,084 181,903 225,507 281,309
Off-book 9,712 5,523 7,218 11,817 14,512
Total liabilities 175,577 195,520 240,481 295,470 363,002
Fixed assets 8,403 849 976 1,123 1,291
Investments 15,093 7,923 7,923 7,923 7,923
Loans and Advances 167,174 195,758 240,592 295,434 362,798
On-book 157,462 190,236 233,374 283,617 348,286
Off-book 9,712 5,523 7,218 11,817 14,512
Net current assets -15,093 -9,011 -9,011 -9,011 -9,011
Total assets 175,577 195,520 240,481 295,470 363,002
Source: Company, Ambit Capital research
Key ratios
FY15 FY16 FY17E FY18E FY19E
AUM growth (%) 14.0 17.1 22.9 22.8 22.8
Dil Consol EPS growth (%) (3.9) (6.7) 31.8 24.6 33.2
Net interest margin (NIM) (%) 13.1 13.1 12.9 12.7 12.4
Cost to income (%) 40.8 42.3 40.3 37.5 37.6
Opex (% of AAUM) 5.7 5.7 5.3 4.8 4.7
Gross NPAs (%) 3.1 5.2 7.2 9.6 9.0
Credit costs (% of AAUM) 2.9 3.4 3.0 3.2 2.5
Provision Coverage (%) 78.2 69.7 61.0 55.0 60.0
Capital adequacy (%) 28.6 26.6 25.8 24.1 22.9
Tier-1 (%) 24.3 23.8 21.8 20.1 18.9
Leverage (x) 4.6 4.2 4.5 4.9 5.3
Source: Company, Ambit Capital research
AMBIT RESULTS INSIGHTS
Ambit Capital Pvt Ltd 29 October 2016
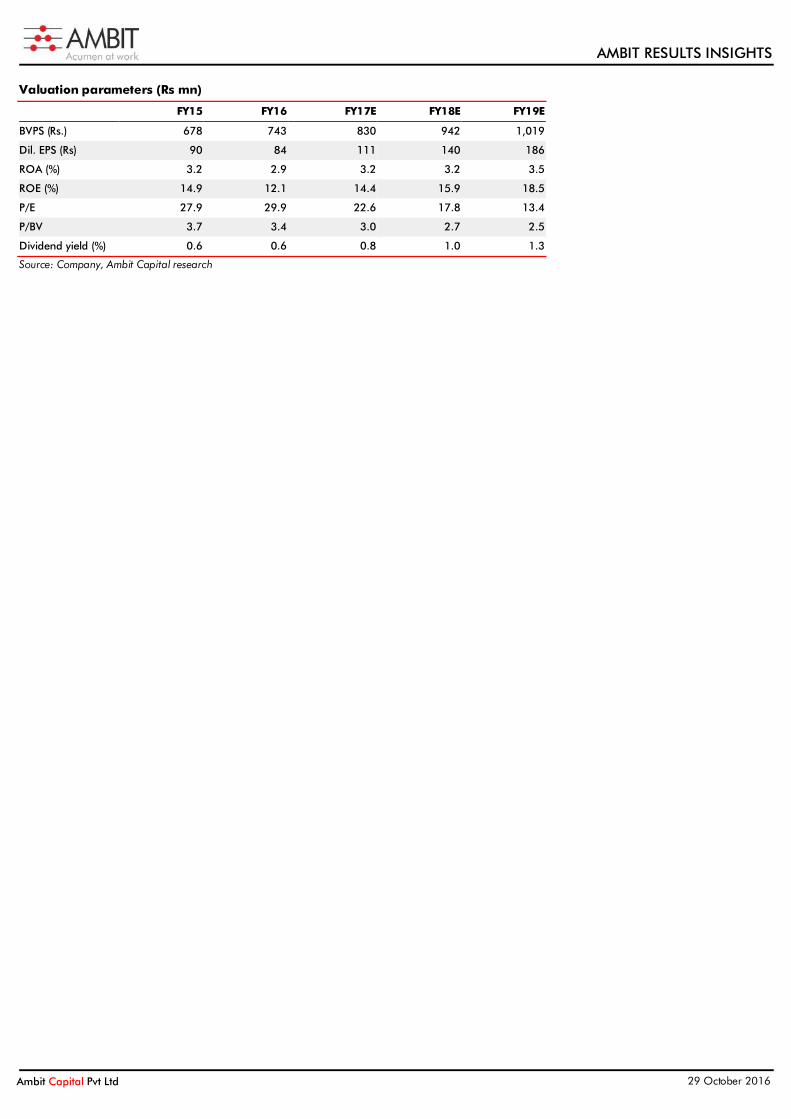
Valuation parameters (Rs mn)
FY15 FY16 FY17E FY18E FY19E
BVPS (Rs.) 678 743 830 942 1,019
Dil. EPS (Rs) 90 84 111 140 186
ROA (%) 3.2 2.9 3.2 3.2 3.5
ROE (%) 14.9 12.1 14.4 15.9 18.5
P/E 27.9 29.9 22.6 17.8 13.4
P/BV 3.7 3.4 3.0 2.7 2.5
Dividend yield (%) 0.6 0.6 0.8 1.0 1.3
Source: Company, Ambit Capital research
AMBIT RESULTS INSIGHTS
Ambit Capital Pvt Ltd 29 October 2016
Institutional Equities Team Saurabh Mukherjea, CFA CEO, Institutional Equities (022) 30433174 [email protected]
Research Analysts
Name Industry Sectors Desk-Phone E-mail
Nitin Bhasin - Head of Research E&C / Infra / Cement / Industrials (022) 30433241 [email protected] Aadesh Mehta, CFA Banking / Financial Services (022) 30433239 [email protected] Abhishek Ranganathan, CFA Retail (022) 30433085 [email protected] Achint Bhagat, CFA Cement / Home Building (022) 30433178 [email protected] Anuj Bansal Mid-caps (022) 30433122 [email protected] Aditi Singh Economy / Strategy (022) 30433284 [email protected] Ashvin Shetty, CFA Automobile (022) 30433285 [email protected] Bhargav Buddhadev Power Utilities / Capital Goods (022) 30433252 [email protected] Deepesh Agarwal, CFA Power Utilities / Capital Goods (022) 30433275 [email protected] Dhiraj Mistry, CFA Consumer (022) 30433264 [email protected] Gaurav Khandelwal, CFA Automobile (022) 30433132 [email protected] Girisha Saraf Mid-caps / Small-caps (022) 30433211 [email protected] Karan Khanna, CFA Strategy (022) 30433251 [email protected] Mayank Porwal Retail (022) 30433214 [email protected] Pankaj Agarwal, CFA Banking / Financial Services (022) 30433206 [email protected] Paresh Dave, CFA Healthcare (022) 30433212 [email protected] Parita Ashar, CFA Metals & Mining / Aviation (022) 30433223 [email protected] Prashant Mittal, CFA Strategy / Derivatives (022) 30433218 [email protected] Rahil Shah Banking / Financial Services (022) 30433217 [email protected] Rakshit Ranjan, CFA Consumer (022) 30433201 [email protected] Ravi Singh Banking / Financial Services (022) 30433181 [email protected] Ritesh Gupta, CFA Oil & Gas / Chemicals / Agri Inputs (022) 30433242 [email protected] Ritesh Vaidya, CFA Consumer (022) 30433246 [email protected] Ritika Mankar Mukherjee, CFA Economy / Strategy (022) 30433175 [email protected] Ritu Modi Automobile (022) 30433292 [email protected] Sagar Rastogi Technology (022) 30433291 [email protected] Sudheer Guntupalli Technology (022) 30433203 [email protected] Sumit Shekhar Economy / Strategy (022) 30433229 [email protected] Utsav Mehta, CFA E&C / Industrials (022) 30433209 [email protected] Vivekanand Subbaraman, CFA Media (022) 30433261 [email protected]
Sales
Name Regions Desk-Phone E-mail
Sarojini Ramachandran - Head of Sales UK +44 (0) 20 7886 2740 [email protected] Dharmen Shah India / Asia (022) 30433289 [email protected] Dipti Mehta India / USA (022) 30433053 [email protected] Hitakshi Mehra India (022) 30433204 [email protected] Krishnan V India / Asia (022) 30433295 [email protected] Nityam Shah, CFA USA / Europe (022) 30433259 [email protected] Parees Purohit, CFA UK / USA (022) 30433169 [email protected] Praveena Pattabiraman India / Asia (022) 30433268 [email protected] Punitraj Mehra, CFA India / Asia (022) 30433198 [email protected] Shaleen Silori India (022) 30433256 [email protected]
Singapore
Pramod Gubbi, CFA – Director Singapore +65 8606 6476 [email protected] Shashank Abhisheik Singapore +65 6536 1935 [email protected]
USA / Canada
Ravilochan Pola - CEO Americas +1(646) 361 3107 [email protected]
Production
Sajid Merchant Production (022) 30433247 [email protected] Sharoz G Hussain Production (022) 30433183 [email protected] Jestin George Editor (022) 30433272 [email protected] Richard Mugutmal Editor (022) 30433273 [email protected] Nikhil Pillai Database (022) 30433265 [email protected]
AMBIT RESULTS INSIGHTS
Ambit Capital Pvt Ltd 29 October 2016
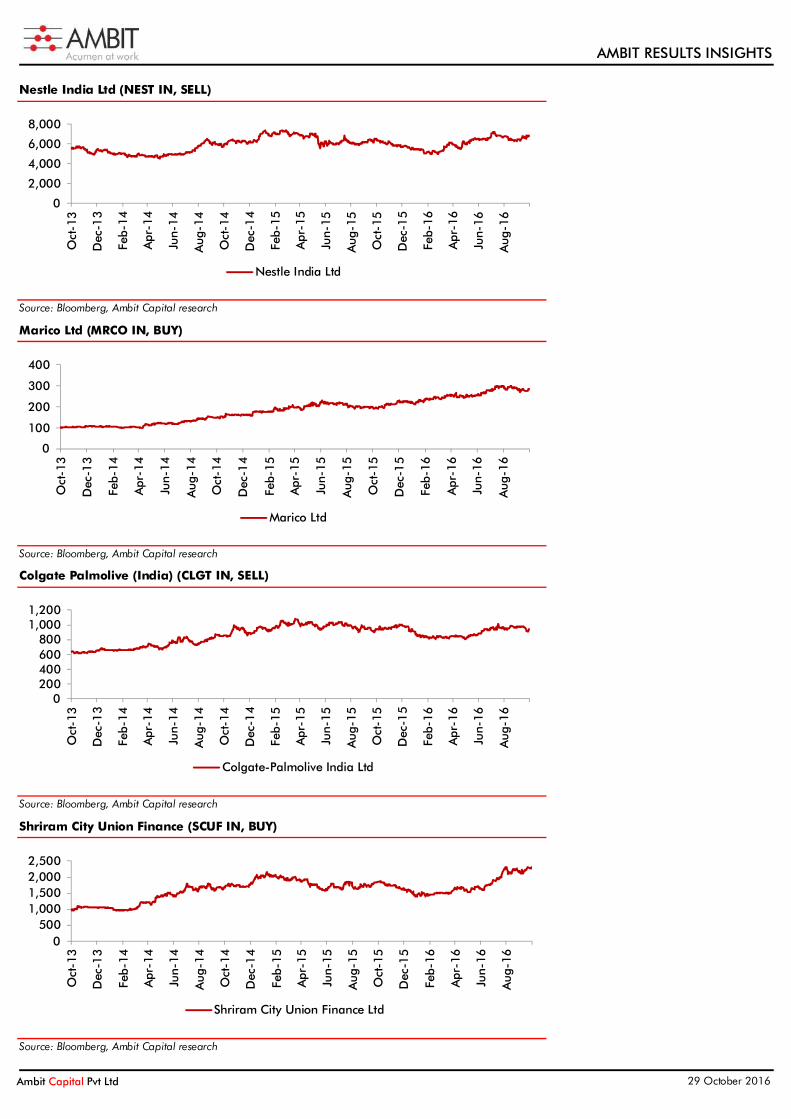
Nestle India Ltd (NEST IN, SELL)
Source: Bloomberg, Ambit Capital research
Marico Ltd (MRCO IN, BUY)
Source: Bloomberg, Ambit Capital research
Colgate Palmolive (India) (CLGT IN, SELL)
Source: Bloomberg, Ambit Capital research
Shriram City Union Finance (SCUF IN, BUY)
Source: Bloomberg, Ambit Capital research
0
2,000
4,000
6,000
8,000
Oct
-13
Dec
-13
Feb-
14
Apr
-14
Jun-
14
Aug
-14
Oct
-14
Dec
-14
Feb-
15
Apr
-15
Jun-
15
Aug
-15
Oct
-15
Dec
-15
Feb-
16
Apr
-16
Jun-
16
Aug
-16
Nestle India Ltd
0
100
200
300
400
Oct
-13
Dec
-13
Feb-
14
Apr
-14
Jun-
14
Aug
-14
Oct
-14
Dec
-14
Feb-
15
Apr
-15
Jun-
15
Aug
-15
Oct
-15
Dec
-15
Feb-
16
Apr
-16
Jun-
16
Aug
-16
Marico Ltd
0200400600800
1,0001,200
Oct
-13
Dec
-13
Feb-
14
Apr
-14
Jun-
14
Aug
-14
Oct
-14
Dec
-14
Feb-
15
Apr
-15
Jun-
15
Aug
-15
Oct
-15
Dec
-15
Feb-
16
Apr
-16
Jun-
16
Aug
-16
Colgate-Palmolive India Ltd
0500
1,0001,5002,0002,500
Oct
-13
Dec
-13
Feb-
14
Apr
-14
Jun-
14
Aug
-14
Oct
-14
Dec
-14
Feb-
15
Apr
-15
Jun-
15
Aug
-15
Oct
-15
Dec
-15
Feb-
16
Apr
-16
Jun-
16
Aug
-16
Shriram City Union Finance Ltd

AMBIT RESULTS INSIGHTS
Ambit Capital Pvt Ltd 29 October 2016
Explanation of Investment Rating
Investment Rating Expected return (over 12-month)
BUY >10%
SELL <10%
NO STANCE We have forward looking estimates for the stock but we refrain from assigning valuation and recommendation
UNDER REVIEW We will revisit our recommendation, valuation and estimates on the stock following recent events
NOT RATED We do not have any forward looking estimates, valuation or recommendation for the stock POSITIVE We have a positive view on the sector and most of stocks under our coverage in the sector are BUYs
NEGATIVE We have a negative view on the sector and most of stocks under our coverage in the sector are SELLs
Disclaimer This report or any portion hereof may not be reprinted, sold or redistributed without the written consent of Ambit Capital. AMBIT Capital Research is disseminated and available primarily electronically, and, in some cases, in printed form.
Additional information on recommended securities is available on request.
Disclaimer
1. AMBIT Capital Private Limited (“AMBIT Capital”) and its affiliates are a full service, integrated investment banking, investment advisory and brokerage group. AMBIT Capital is a Stock Broker, Portfolio Manager and Depository Participant registered with Securities and Exchange Board of India Limited (SEBI) and is regulated by SEBI
2. AMBIT Capital makes best endeavours to ensure that the research analyst(s) use current, reliable, comprehensive information and obtain such information from sources which the analyst(s) believes to be reliable. However, such information has not been independently verified by AMBIT Capital and/or the analyst(s) and no representation or warranty, express or implied, is made as to the accuracy or completeness of any information obtained from third parties. The information, opinions, views expressed in this Research Report are those of the research analyst as at the date of this Research Report which are subject to change and do not represent to be an authority on the subject. AMBIT Capital may or may not subscribe to any and/ or all the views expressed herein.
3. This Research Report should be read and relied upon at the sole discretion and risk of the recipient. If you are dissatisfied with the contents of this complimentary Research Report or with the terms of this Disclaimer, your sole and exclusive remedy is to stop using this Research Report and AMBIT Capital or its affiliates shall not be responsible and/ or liable for any direct/consequential loss howsoever directly or indirectly, from any use of this Research Report.
4. If this Research Report is received by any client of AMBIT Capital or its affiliate, the relationship of AMBIT Capital/its affiliate with such client will continue to be governed by the terms and conditions in place between AMBIT Capital/ such affiliate and the client.
5. This Research Report is issued for information only and the 'Buy', 'Sell', or ‘Other Recommendation’ made in this Research Report such should not be construed as an investment advice to any recipient to acquire, subscribe, purchase, sell, dispose of, retain any securities and should not be intended or treated as a substitute for necessary review or validation or any professional advice. Recipients should consider this Research Report as only a single factor in making any investment decisions. This Research Report is not an offer to sell or the solicitation of an offer to purchase or subscribe for any investment or as an official endorsement of any investment.
6. This Research Report is being supplied to you solely for your information and may not be reproduced, redistributed or passed on, directly or indirectly, to any other person or published, copied in whole or in part, for any purpose. Neither this Research Report nor any copy of it may be taken or transmitted or distributed, directly or indirectly within India or into any other country including United States (to US Persons), Canada or Japan or to any resident thereof. The distribution of this Research Report in other jurisdictions may be strictly restricted and/ or prohibited by law or contract, and persons into whose possession this Research Report comes should inform themselves about such restriction and/ or prohibition, and observe any such restrictions and/ or prohibition.
7. Ambit Capital Private Limited is registered as a Research Entity under the SEBI (Research Analysts) Regulations, 2014. SEBI Reg.No.- INH000000313.
Conflict of Interests
8. In the normal course of AMBIT Capital’s business circumstances may arise that could result in the interests of AMBIT Capital conflicting with the interests of clients or one client’s interests conflicting with the interest of another client. AMBIT Capital makes best efforts to ensure that conflicts are identified and managed and that clients’ interests are protected. AMBIT Capital has policies and procedures in place to control the flow and use of non-public, price sensitive information and employees’ personal account trading. Where appropriate and reasonably achievable, AMBIT Capital segregates the activities of staff working in areas where conflicts of interest may arise. However, clients/potential clients of AMBIT Capital should be aware of these possible conflicts of interests and should make informed decisions in relation to AMBIT Capital’s services.
9. AMBIT Capital and/or its affiliates may from time to time have or solicit investment banking, investment advisory and other business relationships with companies covered in this Research Report and may receive compensation for the same.
Additional Disclaimer for U.S. Persons
10. The research report is solely a product of AMBIT Capital 11. AMBIT Capital is the employer of the research analyst(s) who has prepared the research report 12. Any subsequent transactions in securities discussed in the research reports should be effected through Enclave Capital LLC. (“Enclave”). 13. Enclave does not accept or receive any compensation of any kind for the dissemination of the AMBIT Capital research reports. 14. The research analyst(s) preparing the email / Research Report/ attachment is resident outside the United States and is/are not associated persons of any U.S. regulated broker-dealer and that
therefore the analyst(s) is/are not subject to supervision by a U.S. broker-dealer, and is/are not required to satisfy the regulatory licensing requirements of FINRA or required to otherwise comply with U.S. rules or regulations regarding, among other things, communications with a subject company, public appearances and trading securities held by a research analyst account.
15. This report is prepared, approved, published and distributed by the Ambit Capital located outside of the United States (a non-US Group Company”). This report is distributed in the U.S.by Enclave Capital LLC, a U.S. registered broker dealer, on behalf of Ambit Capital only to major U.S. institutional investors (as defined in Rule 15a-6 under the U.S. Securities Exchange Act of 1934 (the “Exchange Act”)) pursuant to the exemption in Rule 15a-6 and any transaction effected by a U.S. customer in the securities described in this report must be effected through Enclave Capital LLC (19 West 44th Street, suite 1700, New York, NY 10036). In order to receive any additional information about or to effect a transaction in any security or financial instrument mentioned herein, please contact a registered representative of Enclave Capital LLC., by phone at 646 361 3107.
16. As of the publication of this report Enclave Capital LLC, does not make a market in the subject securities. 17. This document does not constitute an offer of, or an invitation by or on behalf of Ambit Capital or its affiliates or any other company to any person, to buy or sell any security. The information
contained herein has been obtained from published information and other sources, which Ambit Capital or its Affiliates consider to be reliable. None of Ambit Capital accepts any liability or responsibility whatsoever for the accuracy or completeness of any such information. All estimates, expressions of opinion and other subjective judgments contained herein are made as of the date of this document. Emerging securities markets may be subject to risks significantly higher than more established markets. In particular, the political and economic environment, company practices and market prices and volumes may be subject to significant variations. The ability to assess such risks may also be limited due to significantly lower information quantity and quality. By accepting this document, you agree to be bound by all the foregoing provisions.
Additional Disclaimer for Canadian Persons 18. AMBIT Capital is not registered in the Province of Ontario and /or Province of Québec to trade in securities and/or to provide advice with respect to securities.
19. AMBIT Capital's head office or principal place of business is located in India. 20. All or substantially all of AMBIT Capital's assets may be situated outside of Canada. 21. It may be difficult for enforcing legal rights against AMBIT Capital because of the above. 22. Name and address of AMBIT Capital's agent for service of process in the Province of Ontario is: Torys LLP, 79 Wellington St. W., 30th Floor, Box 270, TD South Tower, Toronto, Ontario M5K 1N2
Canada. 23. Name and address of AMBIT Capital's agent for service of process in the Province of Montréal is Torys Law Firm LLP, 1 Place Ville Marie, Suite 1919 Montréal, Québec H3B 2C3 Canada.
Additional Disclaimer for Singapore Persons
24. This Report is prepared and distributed by Ambit Capital Private Limited and distributed as per the approved arrangement under Paragraph 9 of Third Schedule of Securities and Futures Act (CAP 289) and Paragraph 11 of the First Schedule to the Financial Advisors Act (CAP 110) provided to Ambit Singapore Pte. Limited by Monetary Authority of Singapore.
25. This Report is only available to persons in Singapore who are institutional investors (as defined in section 4A of the Securities and Futures Act (Cap. 289) of Singapore (the “SFA”).” Accordingly, if a Singapore Person is not or ceases to be such an institutional investor, such Singapore Person must immediately discontinue any use of this Report and inform Ambit Singapore Pte. Limited.

AMBIT RESULTS INSIGHTS
Ambit Capital Pvt Ltd 29 October 2016
Additional Disclaimer for UK Persons
26. All of the recommendations and views about the securities and companies in this report accurately reflect the personal views of the research analyst named on the cover. No part of this research analyst’s compensation was, is, or will be directly or indirectly related to the specific recommendations or views expressed by the research analyst in this research report. This report may not be reproduced, redistributed or copied in whole or in part for any purpose.
27. This report is a marketing communication and has been prepared by Ambit Capital Pvt Ltd of Mumbai, India (“Ambit”) and has been approved in the UK by Ambit Capital (UK) Limited (“ACUK”) solely for the purposes of section 21 of the Financial Services and Markets Act 2000. Ambit is regulated by the Securities and Exchange Board of India and is registered as a Research Entity under the SEBI (Research Analysts) Regulations, 2014. ACUK is regulated by the UK Financial Services Authority and has registered office at C/o Panmure Gordon & Co PL, One New Change, London, EC4M9AF.
28. In the UK, this report is directed at and is for distribution only to persons who (i) fall within Article 19(1) (persons who have professional experience in matters relating to investments) or Article 49(2)(a) to (d) (high net worth companies, unincorporated associations etc) of the Financial Services and Markets Act 2000 (Financial Promotions) Order 2005 (as amended) or (ii) are professional customers or eligible counterparties of ACUK (all such persons together being referred to as "relevant persons"). This report must not be acted on or relied upon by persons in the UK who are not relevant persons.
29. Neither Ambit nor ACUK is a US registered broker-dealer. Transactions undertaken in the US in any security mentioned herein must be effected through a US-registered broker-dealer, in conformity with SEC Rule 15a-6.
30. Neither this report nor any copy or part thereof may be distributed in any other jurisdictions where its distribution may be restricted by law and persons into whose possession this report comes should inform themselves about, and observe, any such restrictions. Distribution of this report in any such other jurisdictions may constitute a violation of UK or US securities laws, or the law of any such other jurisdictions.
31. This report does not constitute an offer or solicitation to buy or sell any securities referred to herein. It should not be so construed, nor should it or any part of it form the basis of, or be relied on in connection with, any contract or commitment whatsoever. The information in this report, or on which this report is based, has been obtained from publicly available sources that Ambit believes to be reliable and accurate. However, it has not been prepared in accordance with legal requirements designed to promote the independence of investment research. It has also not been independently verified and no representation or warranty, express or implied, is made as to the accuracy or completeness of any information obtained from third parties.
32. The information or opinions are provided as at the date of this report and are subject to change without notice. The information and opinions provided in this report take no account of the investors’ individual circumstances and should not be taken as specific advice on the merits of any investment decision. Investors should consider this report as only a single factor in making any investment decisions. Further information is available upon request. No member or employee of Ambit or ACUK accepts any liability whatsoever for any direct or consequential loss howsoever arising, directly or indirectly, from any use of this report or its contents.
33. The value of any investment made at your discretion based on this Report, or income therefrom, maybe affected by changes in economic, financial and/or political factors and may go down as well as go up and you may not get back the original amount invested. Some securities and/or investments involve substantial risk and are not suitable for all investors.
34. Ambit and its affiliates and their respective officers directors and employees may hold positions in any securities mentioned in this Report (or in any related investment) and may from time to time add to or dispose of any such securities (or investment). Ambit and ACUK may from time to time render advisory and other services to companies referred to in this Report and may receive compensation for the same.
35. Ambit and its affiliates may act as a market maker or risk arbitrator or liquidity provider or may have assumed an underwriting commitment in the securities of companies discussed in this Report (or in related investments) or may sell them or buy them from clients on a principal to principal basis or may be involved in proprietary trading and may also perform or seek to perform investment banking or underwriting services for or relating to those companies.
36. Ambit and ACUK may sell or buy any securities or make any investment which may be contrary to or inconsistent with this Report and are not subject to any prohibition on dealing. By accepting this report you agree to be bound by the foregoing limitations. In the normal course of Ambit and its affiliates’ business, circumstances may arise that could result in the interests of Ambit conflicting with the interests of clients or one client’s interests conflicting with the interest of another client. Ambit makes best efforts to ensure that conflicts are identified, managed and clients’ interests are protected. However, clients/potential clients of Ambit should be aware of these possible conflicts of interests and should make informed decisions in relation to Ambit services.
Disclosures 37. The analyst (s) has/have not served as an officer, director or employee of the subject company.
38. There is no material disciplinary action that has been taken by any regulatory authority impacting equity research analysis activities. 39. All market data included in this report are dated as at the previous stock market closing day from the date of this report.
Analyst Certification Each of the analysts identified in this report certifies, with respect to the companies or securities that the individual analyses, that (1) the views expressed in this report reflect his or her personal views about all of the subject companies and securities and (2) no part of his or her compensation was, is or will be directly or indirectly dependent on the specific recommendations or views expressed in this report. © Copyright 2015 AMBIT Capital Private Limited. All rights reserved.
Ambit Capital Pvt. Ltd. Ambit House, 3rd Floor. 449, Senapati Bapat Marg, Lower Parel, Mumbai 400 013, India. Phone: +91-22-3043 3000 | Fax: +91-22-3043 3100 CIN: U74140MH1997PTC107598 www.ambitcapital.com


![Untitled-1 [] · CHOCOMILO; Bouillon - MAGGI CUBE, MAGGI CHICKEN, MAGGI CRAYFISH, MAGGI MIX'PY; and table water ... and marketing company](https://img.pdfslide.us/doc/110x75/5aedc9577f8b9a6625906f43/untitled-1-bouillon-maggi-cube-maggi-chicken-maggi-crayfish-maggi-mixpy.jpg)