Embed Size (px)
Citation preview
®
Opening Slide
AAPA Port Property Management and Railing SeminarOctober 24, 2006
Anthony A. ChiarelloSenior Vice PresidentAMB Property Corporation
© 2005 AMB Property Corporation 2
Top 20 world Ports
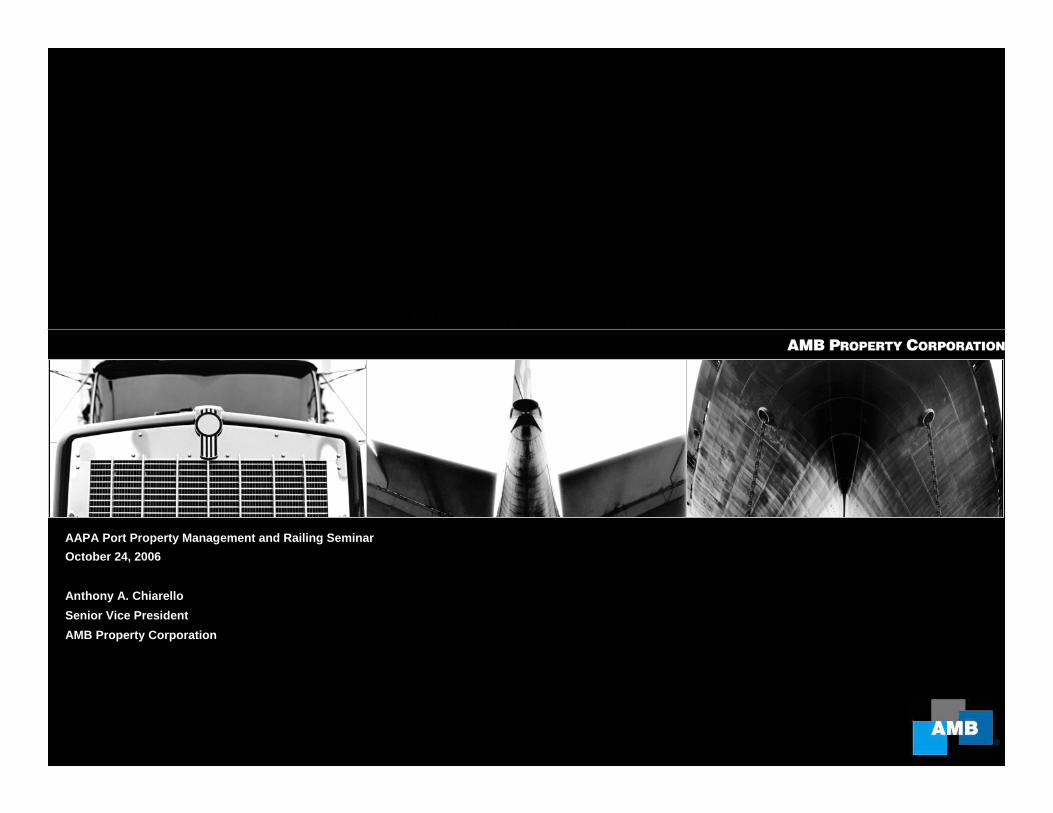
Top 20 Worldwide Ports
3-Shanghai 14.5
2-Singapore 20.6
1-Hong Kong 21.9
8-Rotterdam 8.2
4-Shenzen 13.6
6-Busan 11.4
7-Kaohsiung 9.7
5-Port LA/LB 13.1
10-Dubai 6.4
9-Hamburg 7.0
12-Port Klang 5.2
11-Antwerp 6.0
13-Qingdao 5.114-New York/New Jersey 4.4
15-Tanjung Pelepas 4.0
16-Ningbo 4.0
17-Tianjin 3.8
18-Laem Chabang 3.6
Macro Drivers and Trends
World Port TotalRanking Name TEU
1 Hong Kong 21,932,0002 Singapore 20,600,0003 Shanghai 14,557,2004 Shenzhen 13,650,0005 Los Angeles/ Long Beach 13,101,2926 Busan 11,430,0007 Kaohsiung 9,710,0008 Rotterdam 8,200,0009 Hamburg 7,003,47910 Dubai 6,428,88311 Antwerp 6,063,74613 Port Klang 5,243,59314 Qingdao 5,139,70015 New York/New Jersey 4,478,48016 Tanjung Pelepas 4,020,42117 Ningbo 4,005,50018 Tianjin 3,814,00019 Laem Chabang 3,624,00020 Tokyo 3,580,000
Transshipment
© 2005 AMB Property Corporation 3
China Share of ImportsMacro Drivers and Trends
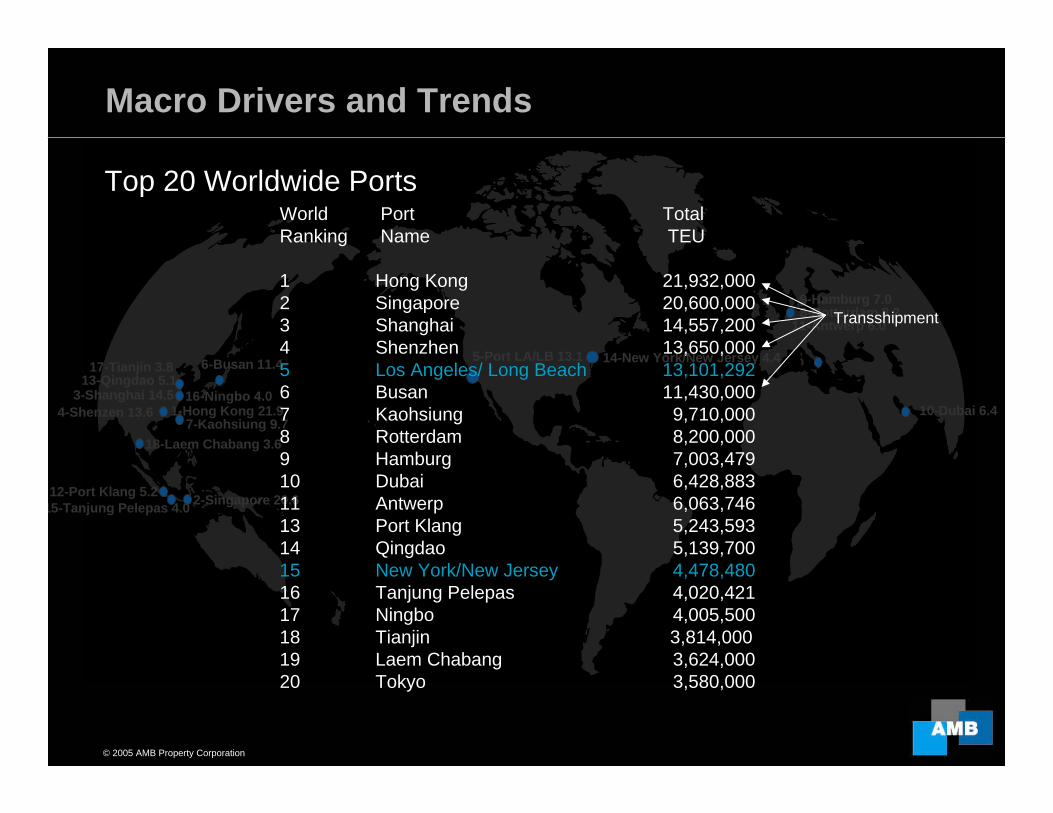
Source: PIERS Trade Horizons
1995
China31%
Others69%
Others50%
China50%
2004
Others34%
China66%
2000
China Share of Transpacific Import Volume (by TEU)
© 2005 AMB Property Corporation 4
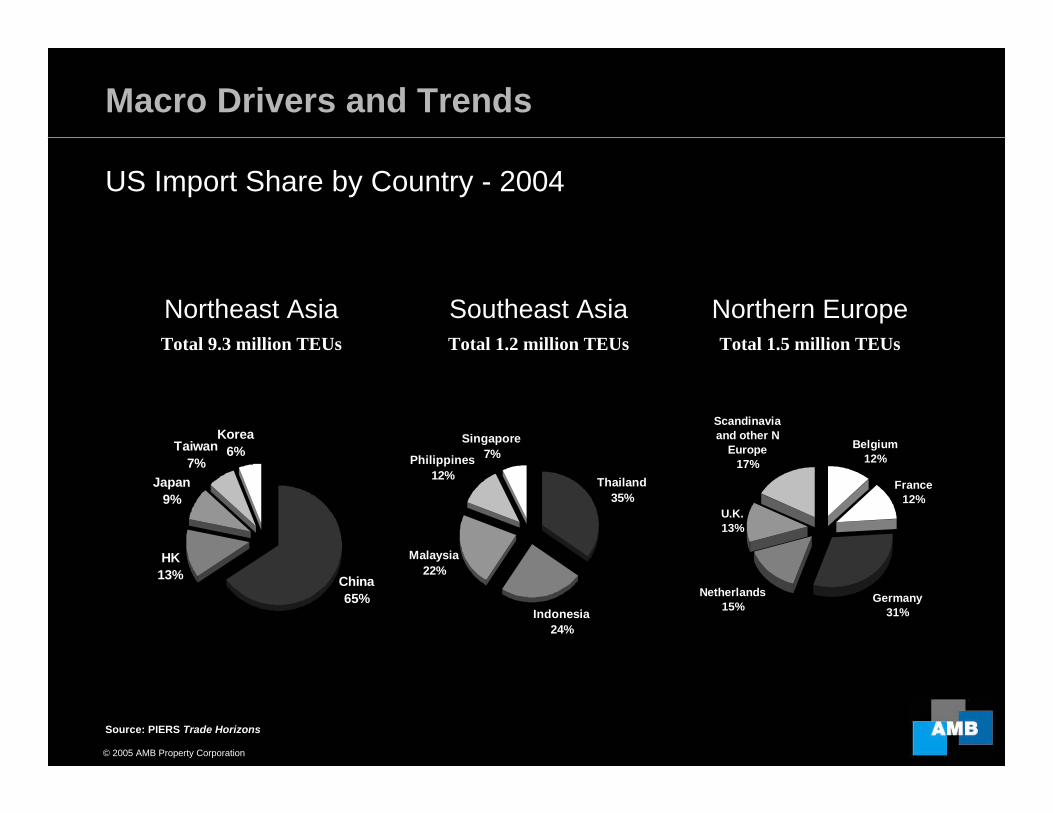
US Import Share
Source: PIERS Trade Horizons
Total 9.3 million TEUs
Macro Drivers and Trends
China 65%
HK13%
Japan9%
Taiwan7%
Korea6%
Thailand35%
Indonesia24%
Malaysia22%
Philippines12%
Singapore7%
US Import Share by Country - 2004
Southeast AsiaTotal 1.2 million TEUs
Northern EuropeTotal 1.5 million TEUs
Belgium12%
France12%
Germany31%
Netherlands15%
U.K.13%
Scandinavia and other N
Europe 17%
Northeast Asia
© 2005 AMB Property Corporation 5
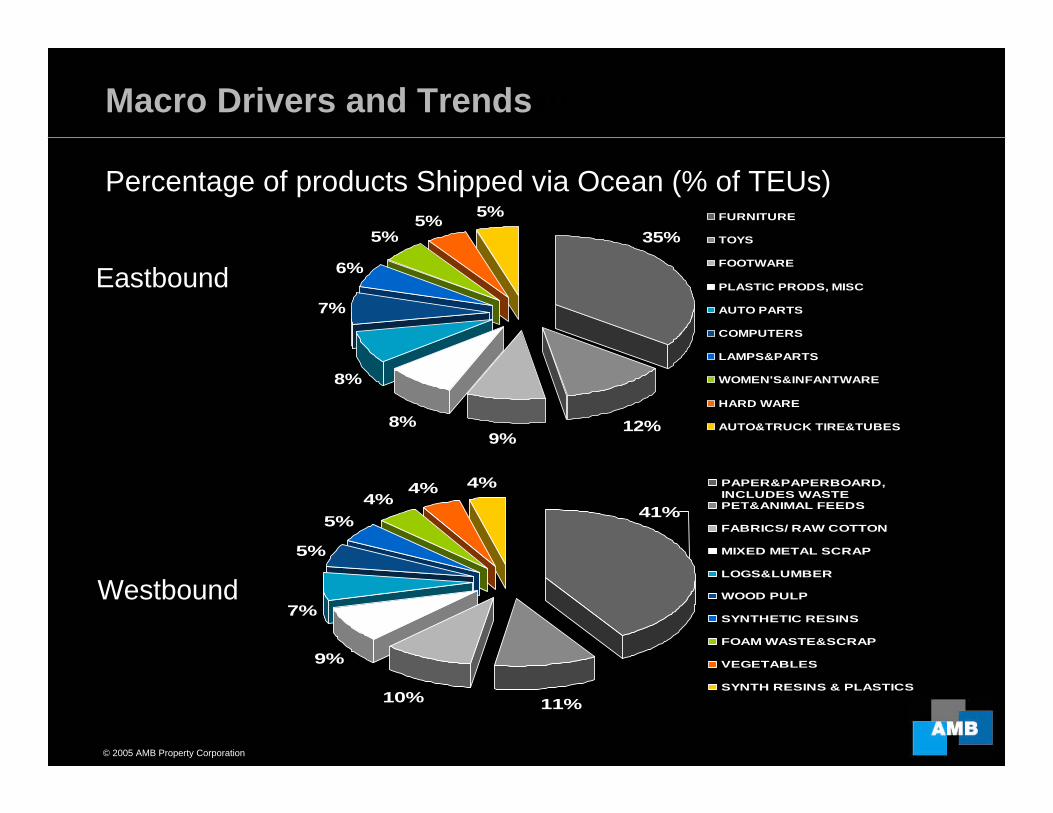
Products shipped via OceanMacro Drivers and Trends
Percentage of products Shipped via Ocean (% of TEUs)
11%10%
9%
7%
5%
5%4%
4% 4%
41%
PAPER&PAPERBOARD,INCLUDES WASTE PET&ANIMAL FEEDS
FABRICS/ RAW COTTON
MIXED METAL SCRAP
LOGS&LUMBER
WOOD PULP
SYNTHETIC RESINS
FOAM WASTE&SCRAP
VEGETABLES
SYNTH RESINS & PLASTICS
12%9%
8%
8%
7%
6%
5%5% 5%
35%FURNITURE
TOYS
FOOTWARE
PLASTIC PRODS, MISC
AUTO PARTS
COMPUTERS
LAMPS&PARTS
WOMEN'S&INFANTWARE
HARD WARE
AUTO&TRUCK TIRE&TUBES
Eastbound
Westbound
© 2005 AMB Property Corporation 6
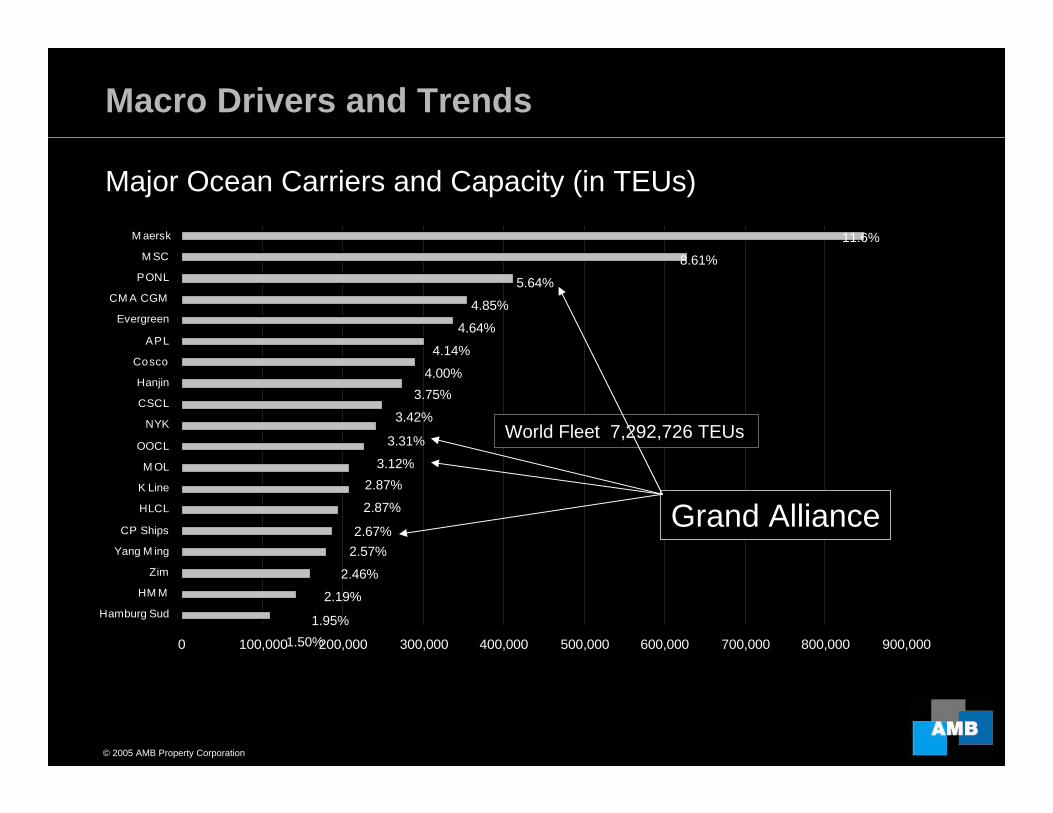
Major Ocean CarriersMacro Drivers and Trends
Major Ocean Carriers and Capacity (in TEUs)
0 100,000 200,000 300,000 400,000 500,000 600,000 700,000 800,000 900,000
Hamburg Sud
HM M
Zim
Yang M ing
CP Ships
HLCL
K Line
M OL
OOCL
NYK
CSCL
Hanjin
Cosco
APL
Evergreen
CM A CGM
PONL
M SC
M aersk
World Fleet 7,292,726 TEUs
11.6%
3.42%
5.64%
3.12%
4.64%
4.00%
2.57%
2.87%
2.19%
1.50%
4.14%
4.85%
8.61%
3.75%
1.95%
3.31%
2.87%
2.67%
2.46%
Grand Alliance
© 2005 AMB Property Corporation 7
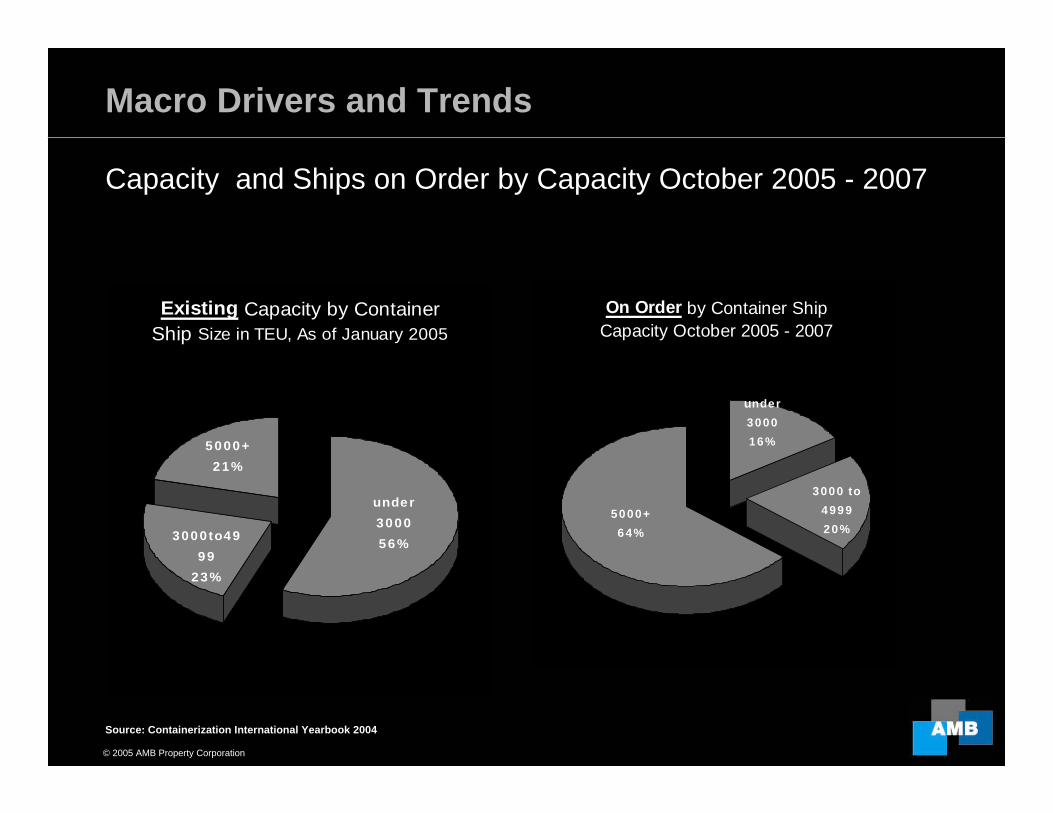
Capacity and Orders
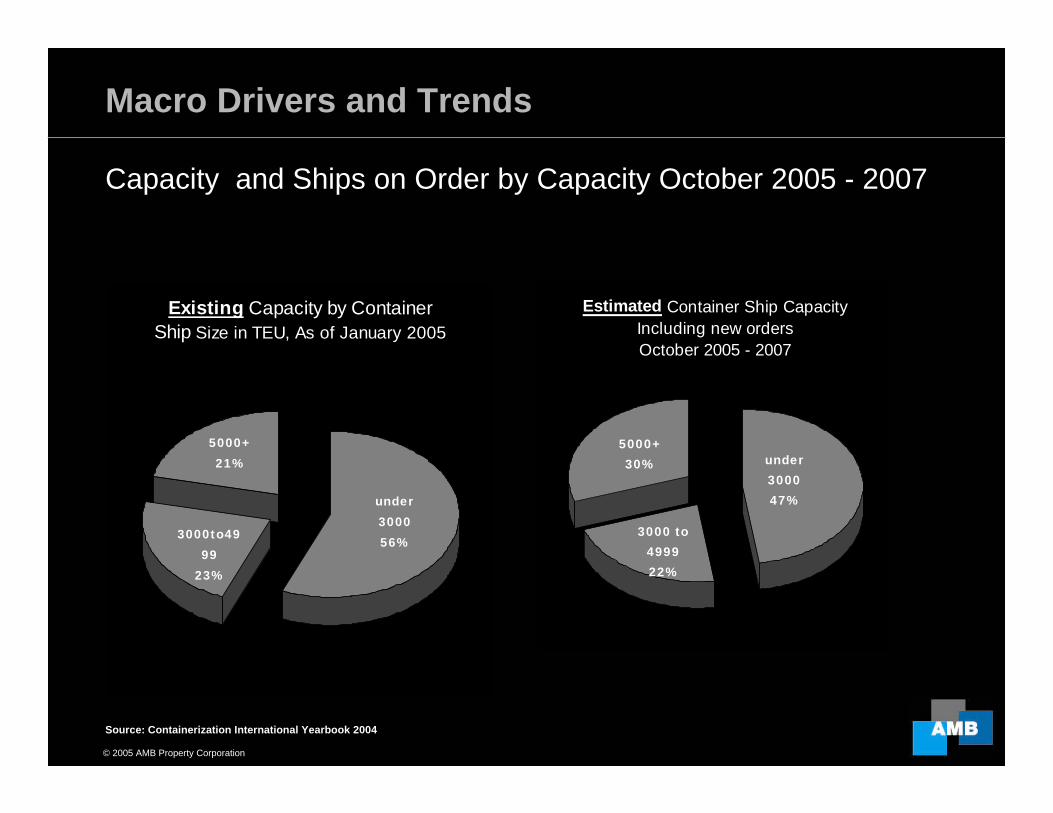
Capacity and Ships on Order by Capacity October 2005 - 2007
Macro Drivers and Trends
Existing Capacity by Container Ship Size in TEU, As of January 2005
3000to4999
23%
under 300056%
5000+21%
On Order by Container Ship Capacity October 2005 - 2007
3000 to 499920%
under 300016%
5000+64%
Source: Containerization International Yearbook 2004
© 2005 AMB Property Corporation 8
Capacity and Orders
Capacity and Ships on Order by Capacity October 2005 - 2007
Macro Drivers and Trends
Estimated Container Ship Capacity Including new orders October 2005 - 2007
3000 to 499922%
under 300047%
5000+30%
Existing Capacity by Container Ship Size in TEU, As of January 2005
3000to4999
23%
under 300056%
5000+21%
Source: Containerization International Yearbook 2004
© 2005 AMB Property Corporation 9
Impact of Larger ShipsMacro Drivers and Trends
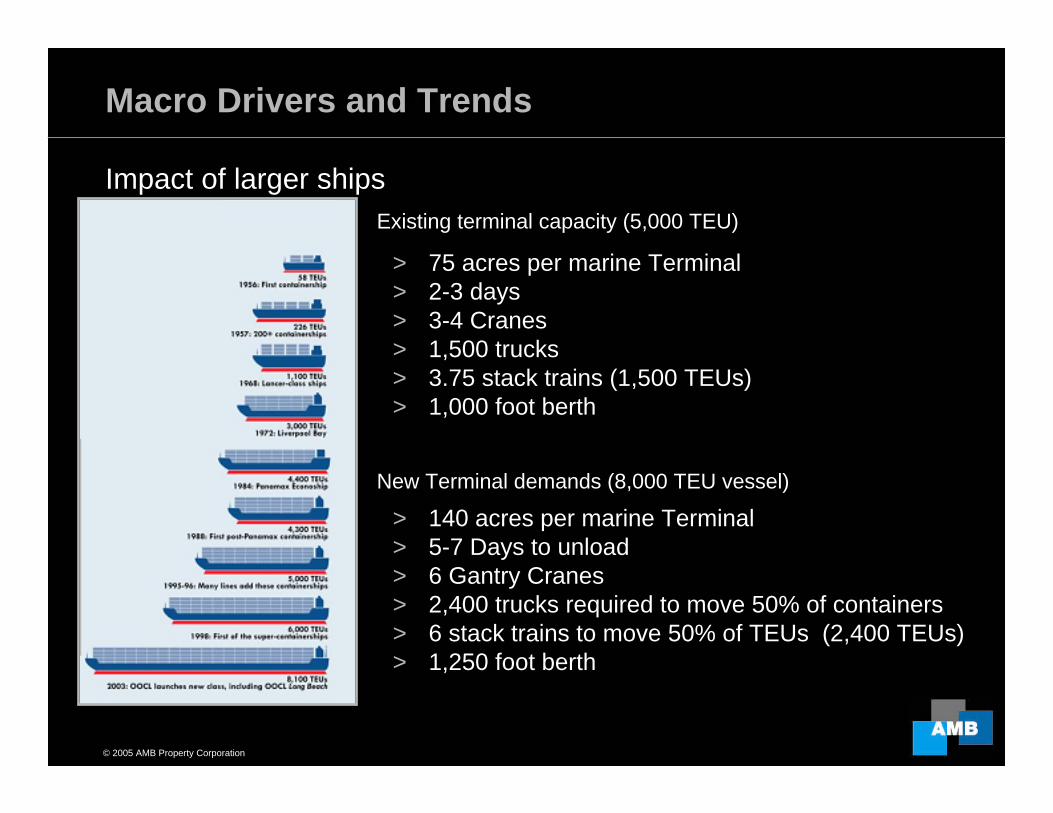
Impact of larger ships
> 75 acres per marine Terminal> 2-3 days> 3-4 Cranes> 1,500 trucks> 3.75 stack trains (1,500 TEUs)> 1,000 foot berth
New Terminal demands (8,000 TEU vessel)
Existing terminal capacity (5,000 TEU)
> 140 acres per marine Terminal> 5-7 Days to unload> 6 Gantry Cranes> 2,400 trucks required to move 50% of containers> 6 stack trains to move 50% of TEUs (2,400 TEUs)> 1,250 foot berth
© 2005 AMB Property Corporation 10
NA Import Traffic
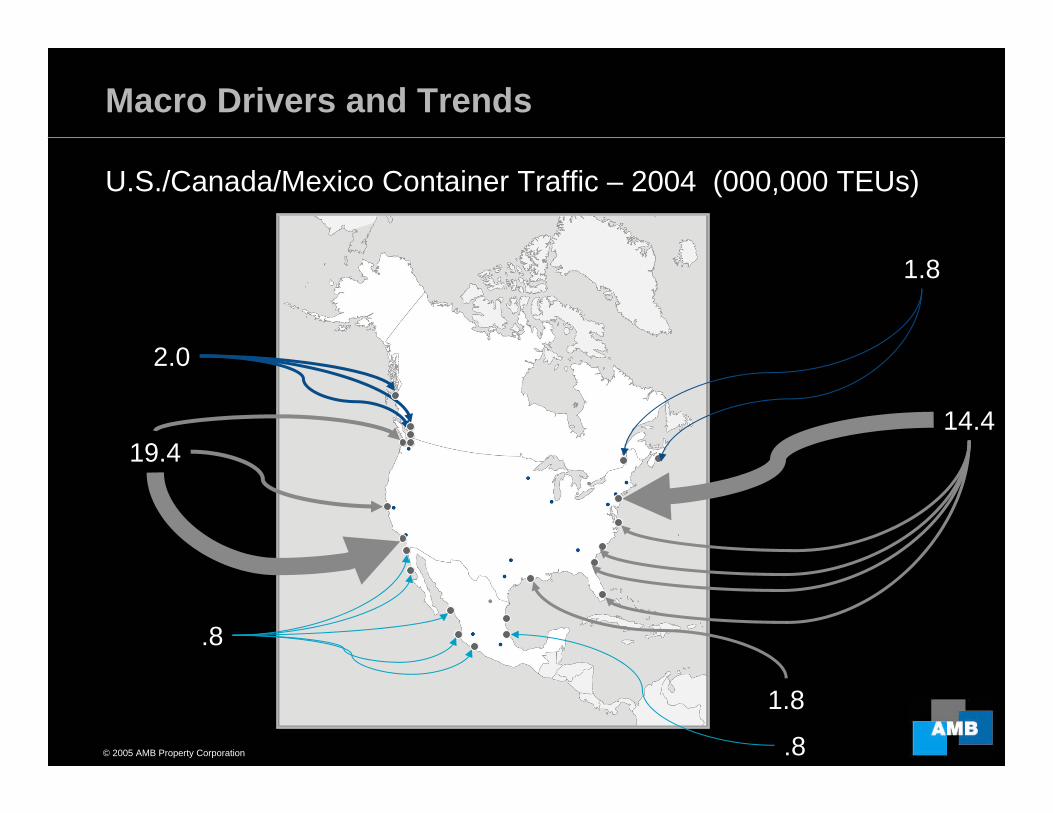
19.414.4
1.8
2.0
1.8
U.S./Canada/Mexico Container Traffic – 2004 (000,000 TEUs)
.8
.8
Macro Drivers and Trends
© 2005 AMB Property Corporation 11
Canada Import Traffic
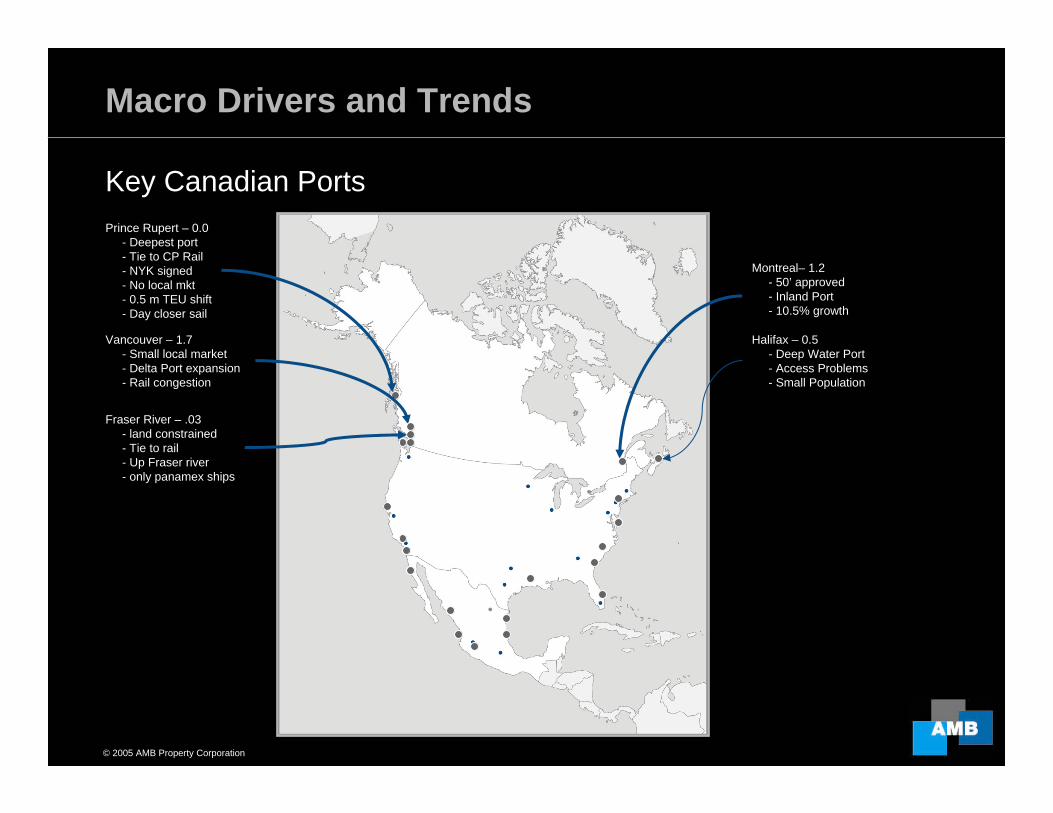
Key Canadian Ports
Macro Drivers and Trends
Montreal– 1.2- 50’ approved- Inland Port- 10.5% growth
Halifax – 0.5- Deep Water Port- Access Problems- Small Population
Vancouver – 1.7- Small local market- Delta Port expansion- Rail congestion
Fraser River – .03- land constrained- Tie to rail- Up Fraser river- only panamex ships
Prince Rupert – 0.0- Deepest port- Tie to CP Rail- NYK signed- No local mkt- 0.5 m TEU shift- Day closer sail
© 2005 AMB Property Corporation 12
US Import Traffic
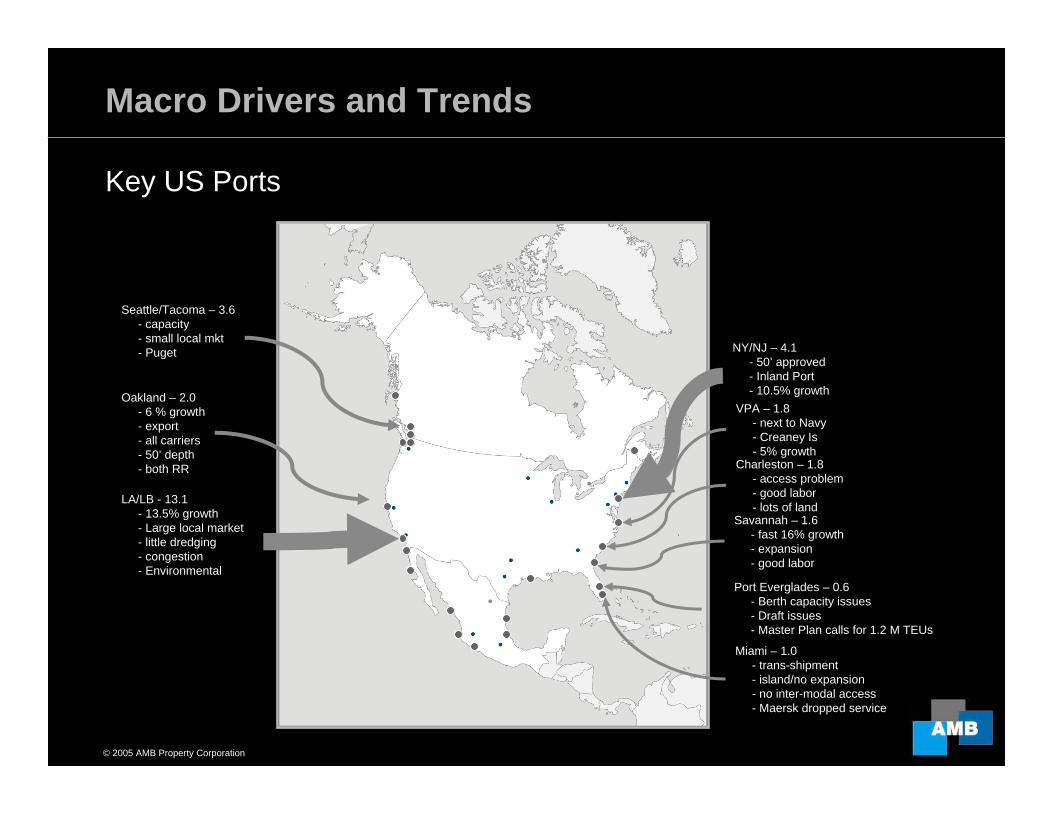
Key US Ports
Macro Drivers and Trends
NY/NJ – 4.1- 50’ approved- Inland Port- 10.5% growth
VPA – 1.8- next to Navy- Creaney Is- 5% growth
Charleston – 1.8- access problem- good labor- lots of land
Savannah – 1.6- fast 16% growth - expansion- good labor
Miami – 1.0- trans-shipment- island/no expansion- no inter-modal access- Maersk dropped service
LA/LB - 13.1- 13.5% growth- Large local market- little dredging- congestion- Environmental
Oakland – 2.0- 6 % growth- export- all carriers- 50’ depth- both RR
Seattle/Tacoma – 3.6- capacity- small local mkt- Puget
Port Everglades – 0.6- Berth capacity issues - Draft issues- Master Plan calls for 1.2 M TEUs
© 2005 AMB Property Corporation 13
Mexico Import Traffic
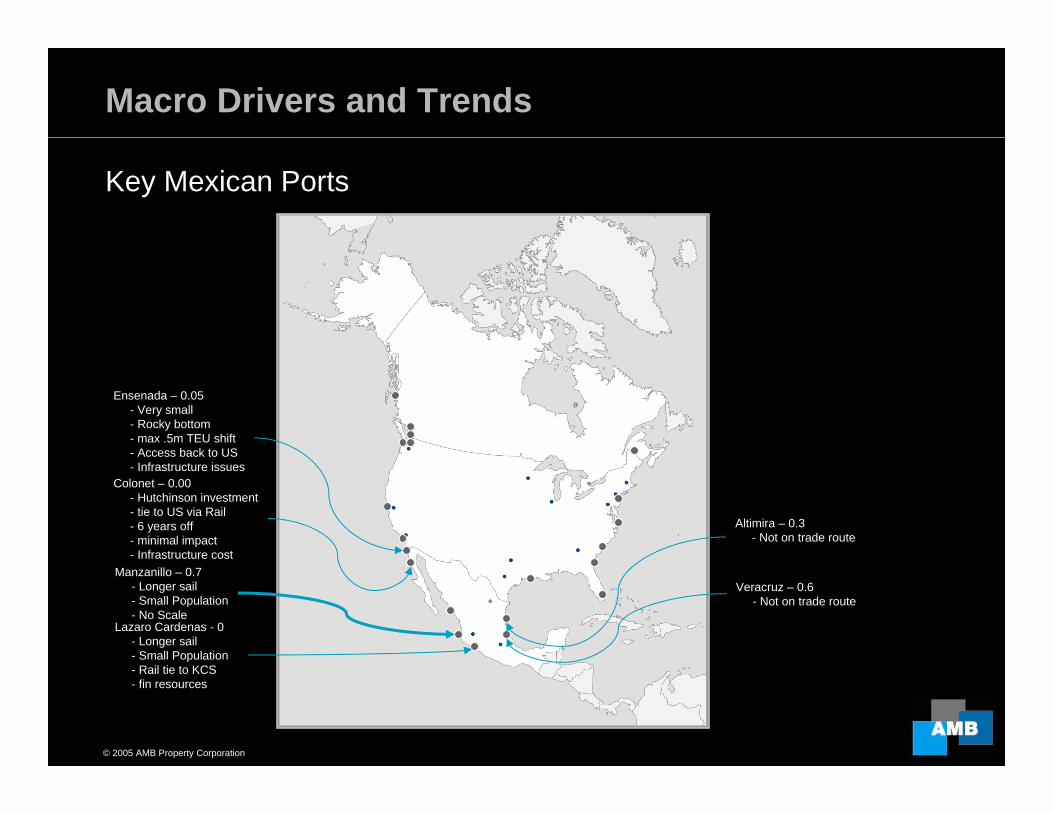
Key Mexican Ports
Macro Drivers and Trends
Altimira – 0.3- Not on trade route
Veracruz – 0.6- Not on trade route
Lazaro Cardenas - 0- Longer sail- Small Population- Rail tie to KCS- fin resources
Manzanillo – 0.7- Longer sail- Small Population- No Scale
Ensenada – 0.05- Very small- Rocky bottom- max .5m TEU shift- Access back to US- Infrastructure issues
Colonet – 0.00- Hutchinson investment- tie to US via Rail- 6 years off- minimal impact- Infrastructure cost
© 2005 AMB Property Corporation 14
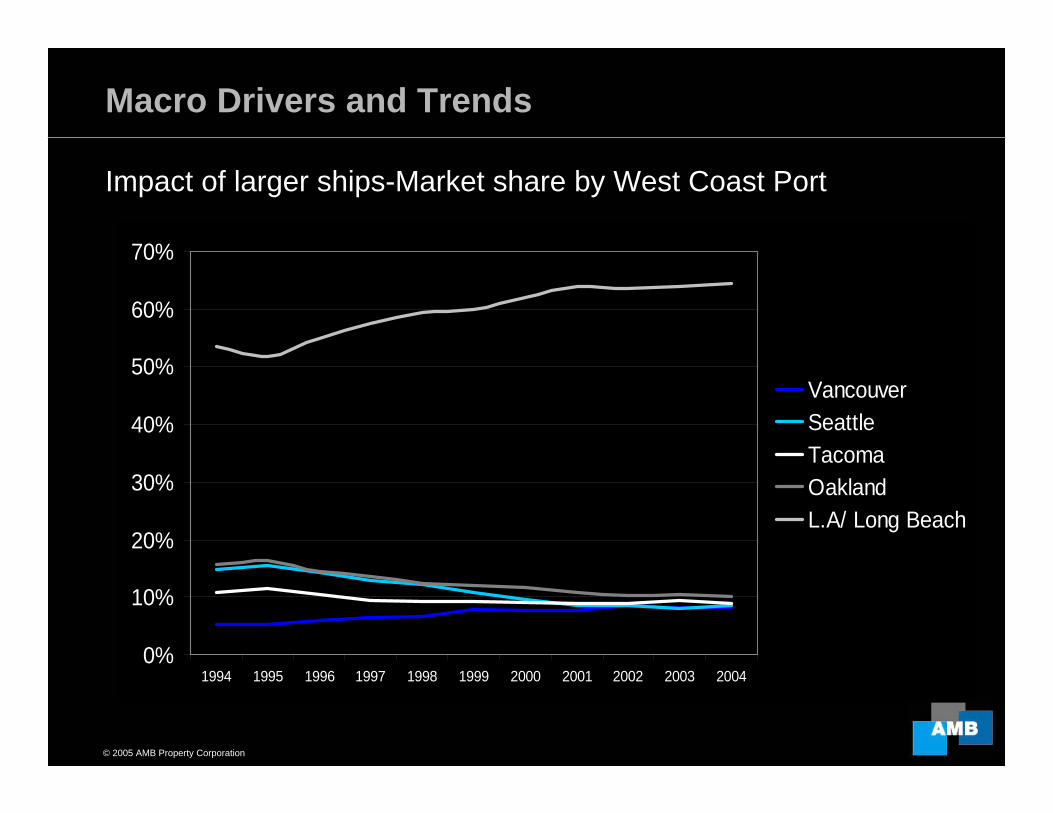
West Coast Market ShareMacro Drivers and Trends
Impact of larger ships-Market share by West Coast Port
0%
10%
20%
30%
40%
50%
60%
70%
1994 1995 1996 1997 1998 1999 2000 2001 2002 2003 2004
VancouverSeattleTacomaOaklandL.A/ Long Beach
© 2005 AMB Property Corporation 15
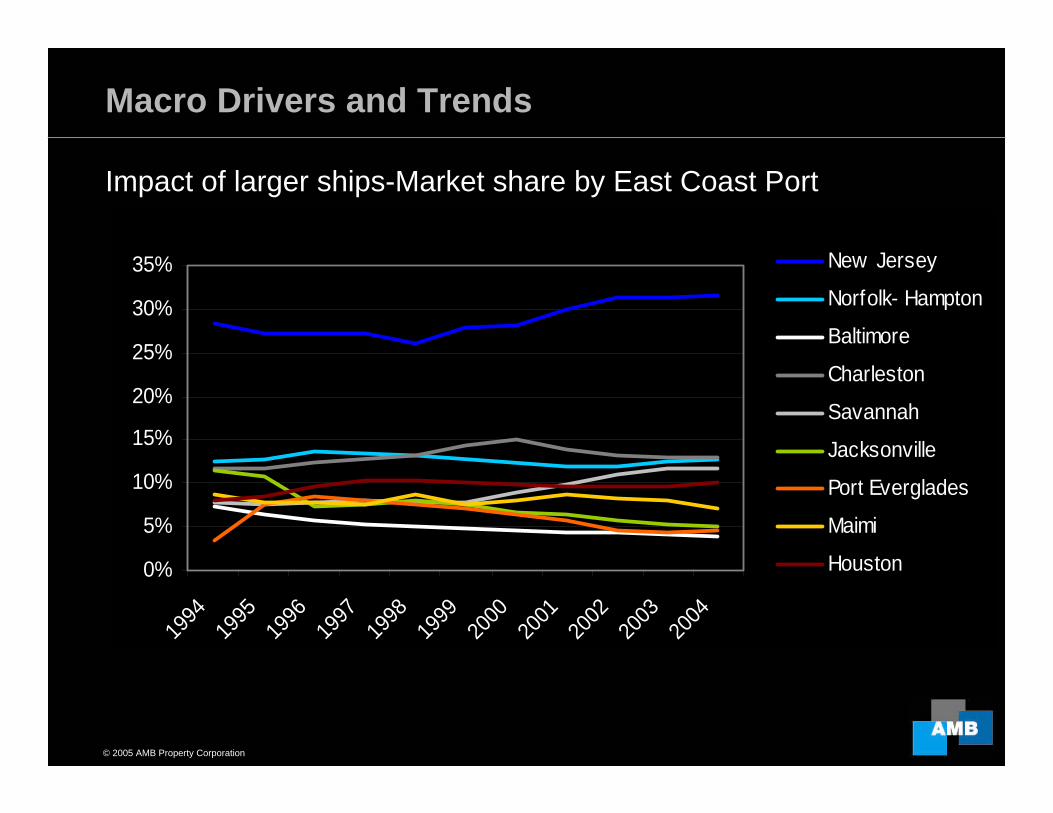
East Coast Market ShareMacro Drivers and Trends
Impact of larger ships-Market share by East Coast Port
0%
5%
10%
15%
20%
25%
30%
35%
1994
1995
1996
1997
1998
1999
2000
2001
2002
2003
2004
New Jersey
Norfolk- Hampton
Baltimore
Charleston
Savannah
Jacksonville
Port Everglades
Maimi
Houston
© 2005 AMB Property Corporation 16
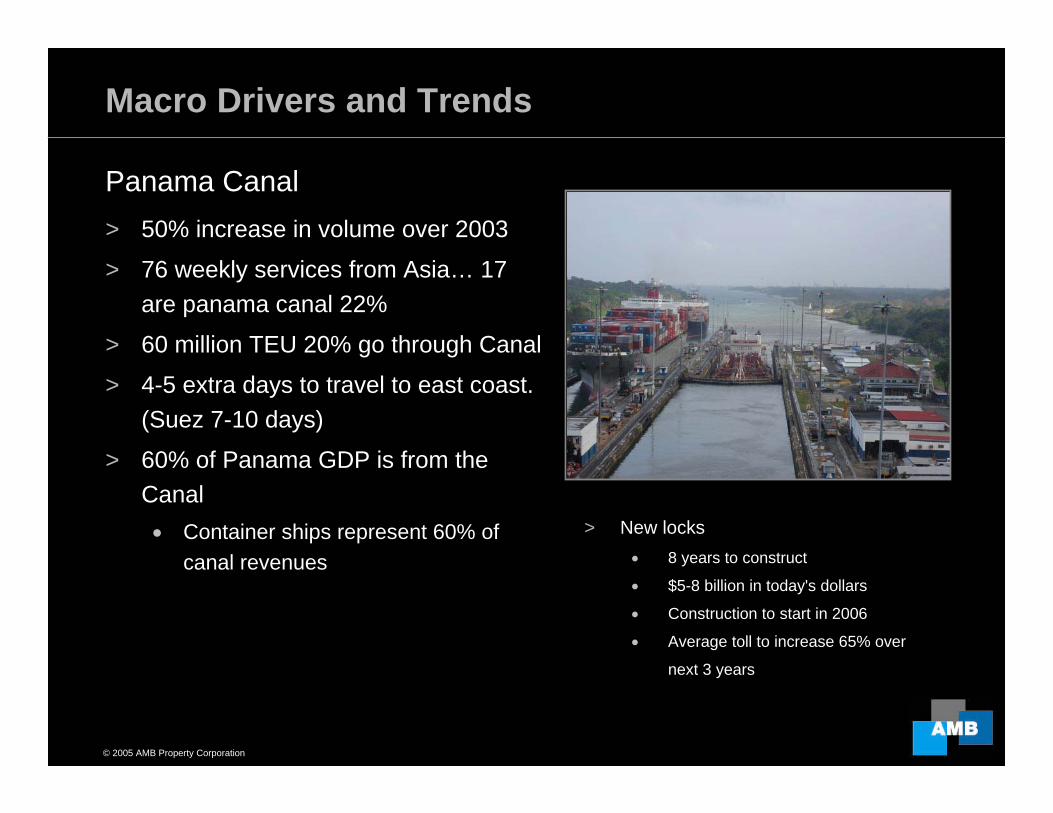
Panama Canal
> 50% increase in volume over 2003
> 76 weekly services from Asia… 17 are panama canal 22%
> 60 million TEU 20% go through Canal
> 4-5 extra days to travel to east coast. (Suez 7-10 days)
> 60% of Panama GDP is from the Canal• Container ships represent 60% of
canal revenues
Panama Canal
> New locks • 8 years to construct
• $5-8 billion in today's dollars
• Construction to start in 2006
• Average toll to increase 65% over
next 3 years
Macro Drivers and Trends
© 2005 AMB Property Corporation 17
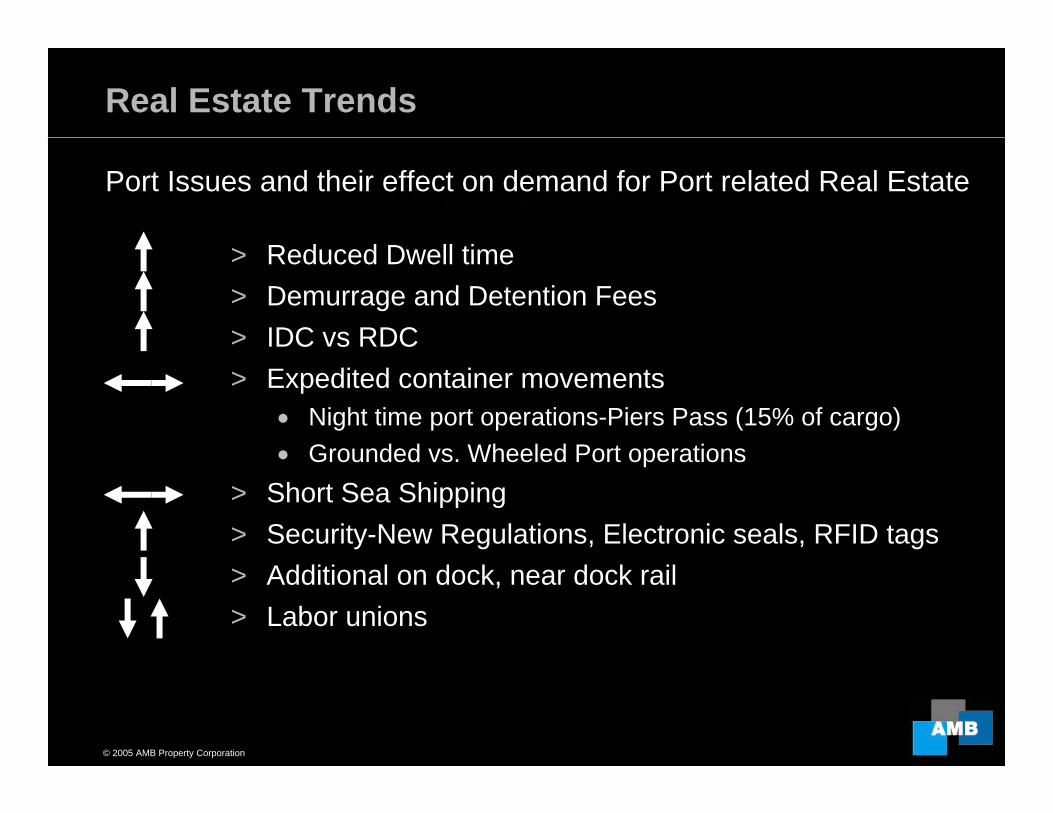
Port Issues effecting Real Estate> Reduced Dwell time> Demurrage and Detention Fees> IDC vs RDC> Expedited container movements
• Night time port operations-Piers Pass (15% of cargo)• Grounded vs. Wheeled Port operations
> Short Sea Shipping> Security-New Regulations, Electronic seals, RFID tags > Additional on dock, near dock rail> Labor unions
Port Issues and their effect on demand for Port related Real Estate
Real Estate Trends
© 2005 AMB Property Corporation 18
Real Estate OpportunitiesReal Estate Opportunities
>Transloading facilities
>Merchant Build markets
>Container staging lots
>Two Story Design in supply constrained markets
Real Estate Opportunities
© 2005 AMB Property Corporation 19
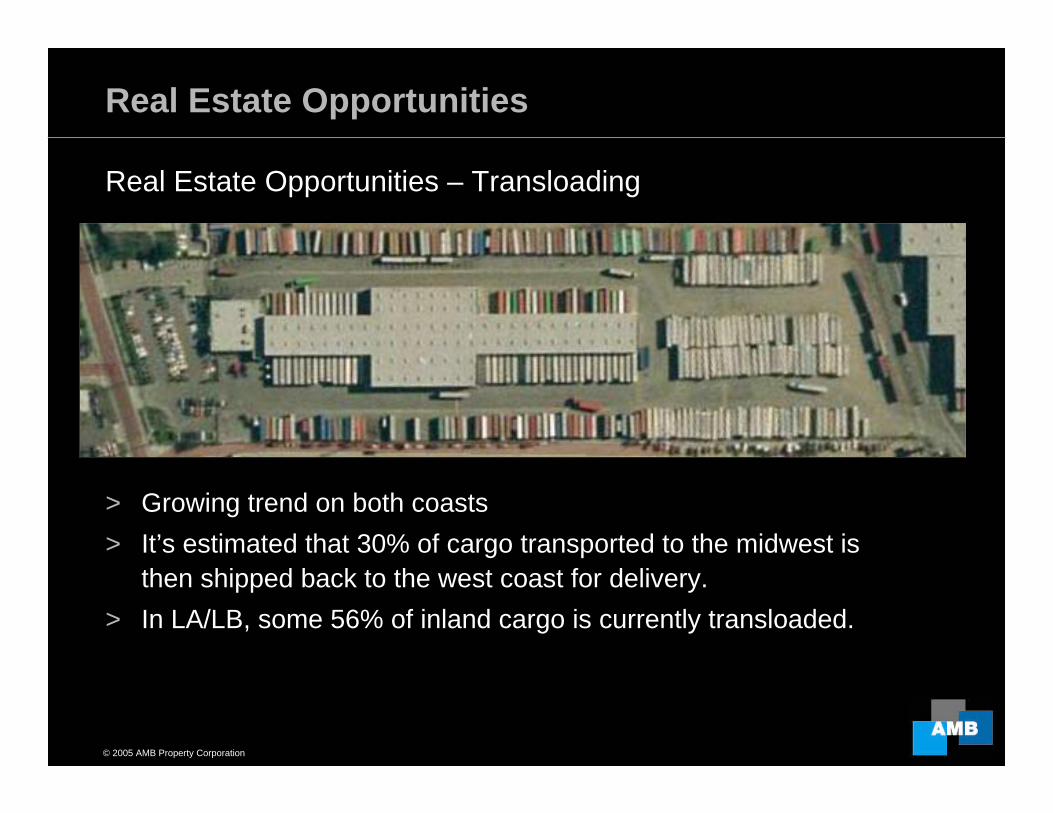
Transloading NYK BuildingReal Estate Opportunities – Transloading
Real Estate Opportunities
> Growing trend on both coasts> It’s estimated that 30% of cargo transported to the midwest is
then shipped back to the west coast for delivery.> In LA/LB, some 56% of inland cargo is currently transloaded.
© 2005 AMB Property Corporation 20
Merchant build Markets> Houston> Savannah
Real Estate Opportunities– Merchant build Markets
Characteristics:> Large Y-o-Y containerized cargo growth> Lots of cheap land> Low construction cost> Low Population base (except Houston)> Good infrastructure access
Real Estate Opportunities
© 2005 AMB Property Corporation 21
Summary
> Trade growth shows little sign of slowdown> Vessel dimensions continue to impact trade dynamics, including
infrastructure pressures> New supply trends will continue to evolve, in order to deal with
growth in trade> Global sourcing will continue to evaluate new markets, although
China seems well positioned for the short to medium term> Real estate dynamics at both origin and destination, will continue to
play a key role in many supply chain evaluations> Flexibility will be key for quite sometime into the future
®
THANK YOU
© 2005 AMB Property Corporation
END
This document contains forward-looking statements such as the size, completion and total investment in development projects which are made pursuant to the safe-harbor provisions of Section 21E of the Securities Exchange Act of 1934. Forward-looking statements involve numerous risks and uncertainties and should not be relied upon as predictions of future events. The events or circumstances reflected in our forward-looking statements might not occur. We assume no obligation to update or supplement forward-looking statements. For further information on factors that could impact AMB and the statements contained herein, reference should be made to AMB’s filings with the Securities and Exchange Commission, including AMB’s annual report on Form 10-Q for the year ended June 30, 2004.