Embed Size (px)
DESCRIPTION
Vitamina C y carotenos
Citation preview

Plasma carotenoids, vitamin C, tocopherols, and retinol and the risk ofbreast cancer in the European Prospective Investigation into Cancerand Nutrition cohort1,2
Marije F Bakker,3* Petra HM Peeters,3,5 Veronique M Klaasen,3,6 H Bas Bueno-de-Mesquita,4,5,7,8 Eugene HJM Jansen,7
Martine M Ros,7 Noémie Travier,9 Anja Olsen,10 Anne Tjønneland,10 Kim Overvad,11 Sabina Rinaldi,12 Isabelle Romieu,12
Paul Brennan,12 Marie-Christine Boutron-Ruault,13,14,15 Florence Perquier,13,14,15 Claire Cadeau,13,14,15 Heiner Boeing,16
Krasimira Aleksandrova,16 Rudolf Kaaks,17 Tilman Kuhn,17 Antonia Trichopoulou,18,19 Pagona Lagiou,18,20,21
Dimitrios Trichopoulos,19,20,21 Paolo Vineis,5,22 Vittorio Krogh,23 Salvatore Panico,24 Giovanna Masala,25
Rosario Tumino,26 Elisabete Weiderpass,27,28,29,30 Guri Skeie,27 Eiliv Lund,27 J Ramón Quirós,31 Eva Ardanaz,32,33
Carmen Navarro,34,35,36 Pilar Amiano,34,37 María-José Sánchez,34,38 Genevieve Buckland,9 Ulrika Ericson,39
Emily Sonestedt,39 Matthias Johansson,12,40 Malin Sund,41 Ruth C Travis,42 Timothy J Key,42 Kay-Tee Khaw,43
Nick Wareham,44 Elio Riboli,5 and Carla H van Gils3
3Julius Center for Health Sciences and Primary Care and 4Department of Gastroenterology and Hepatology, University Medical Center Utrecht, Utrecht,
Netherlands; 5Department of Epidemiology and Biostatistics, School of Public Health, Faculty of Medicine, Imperial College London, London, United
Kingdom; 6Division of Human Nutrition, Wageningen University, Wageningen, Netherlands; 7National Institute for Public Health and the Environment,
Bilthoven, Netherlands; 8Department of Social & Preventive Medicine, Faculty of Medicine, University of Malaya, Kuala Lumpur, Malaysia; 9Unit of
Nutrition, Environment and Cancer, Catalan Institute of Oncology (ICO-IDIBELL), Barcelona, Spain; 10Danish Cancer Society Research Center, Copenhagen,
Denmark; 11Section for Epidemiology, Department of Public Health, Aarhus University, Aarhus, Denmark; 12International Agency for Research on Cancer,
Lyon, France; 13Inserm, Centre for Research in Epidemiology and Population Health, U1018, Nutrition, Hormones and Women’s Health Team, Villejuif,
France; 14University Paris-Sud, UMRS 1018, Villejuif, France; 15IGR, Villejuif, France; 16Department of Epidemiology, German Institute of Human Nutrition
Potsdam-Rehbrucke, Nuthetal, Germany; 17German Cancer Research Center (DKFZ), Division of Cancer Epidemiology, Heidelberg, Germany; 18WHO
Collaborating Center for Food and Nutrition Policies, Department of Hygiene, Epidemiology and Medical Statistics, University of Athens Medical School,
Athens, Greece; 19Hellenic Health Foundation, Athens, Greece; 20Department of Epidemiology, Harvard School of Public Health, Boston, MA; 21Bureau of
Epidemiologic Research, Academy of Athens, Athens, Greece; 22Human Genetic Foundation (HuGeF), Turin, Italy; 23Epidemiology and Prevention Unit,
Fondazione IRCCS Istituto Nazionale dei Tumori, Milan, Italy; 24Dipartimento Di Medicina Clinica e Chirurgia, Federico II University, Naples, Italy;25Molecular and Nutritional Epidemiology Unit, Cancer Research and Prevention Institute–ISPO, Florence, Italy; 26Cancer Registry and Histopathology
Unit, “Civic M.P.Arezzo” Hospital, ASP Ragusa, Italy; 27Department of Community Medicine, Faculty of Health Sciences, University of Tromsø, The Arctic
University of Norway, Tromsø, Norway; 28Department of Research, Cancer Registry of Norway, Institute of Population-Based Cancer Research, Oslo,
Norway; 29Department of Medical Epidemiology and Biostatistics, Karolinska Institutet, Stockholm, Sweden; 30Genetic Epidemiology Group, Folkhalsan
Research Center, Helsinki, Finland; 31Public Health Directorate, Asturias, Spain; 32Navarre Public Health Institute, Pamplona, Spain; 33CIBER de Epidemi-
ology and Public Health (CIPERESP), Spain; 34Consortium for Biomedical Research in Epidemiology and public Health (CIBER de Epidemiología y SaludPublica), Madrid, Spain; 35Department of Epidemiology, Murcia Regional Health Council, Murcia, Spain; 36Department of Health and Social Sciences,
Universidad de Murcia, Murcia, Spain; 37Public Health Division of Gipuzkoa, BioDonostia Research Institute, Health Department of Basque Region, San
Sebastian, Spain; 38Andalusian School of Public Health, Granada, Spain; 39Department of Clinical Sciences, Lund University, Malmo, Sweden; 40Department
of Biobank Research and 41Department of Surgery, Umea University, Umea, Sweden; 42Cancer Epidemiology Unit, University of Oxford, Oxford, United
Kingdom; 43University of Cambridge, Cambridge, United Kingdom; and 44MRC Epidemiology Unit, University of Cambridge, Cambridge, United Kingdom
ABSTRACTBackground: Carotenoids and vitamin C are thought to be associ-ated with reduced cancer risk because of their antioxidative capacity.Objective: This study evaluated the associations of plasma carot-enoid, retinol, tocopherol, and vitamin C concentrations and risk ofbreast cancer.Design: In a nested case-control study within the European Pro-spective Investigation into Cancer and Nutrition cohort, 1502 femaleincident breast cancer cases were included, with an oversamplingof premenopausal (n = 582) and estrogen receptor–negative (ER2)cases (n = 462). Controls (n = 1502) were individually matchedto cases by using incidence density sampling. Prediagnostic sam-ples were analyzed for a-carotene, b-carotene, lycopene, lutein,zeaxanthin, b-cryptoxanthin, retinol, a-tocopherol, g-tocopherol, and
vitamin C. Breast cancer risk was computed according to hormonereceptor status and age at diagnosis (proxy for menopausal status)by using conditional logistic regression and was further stratified bysmoking status, alcohol consumption, and body mass index (BMI).All statistical tests were 2-sided.Results: In quintile 5 compared with quintile 1, a-carotene (OR:0.61; 95% CI: 0.39, 0.98) and b-carotene (OR: 0.41; 95% CI: 0.26,0.65) were inversely associated with risk of ER2 breast tumors. Theother analytes were not statistically associated with ER2 breast can-cer. For estrogen receptor–positive (ER+) tumors, no statistically sig-nificant associations were found. The test for heterogeneity betweenER2 and ER+ tumors was statistically significant only for b-carotene(P-heterogeneity = 0.03). A higher risk of breast cancer was found forretinol in relation to ER2/progesterone receptor–negative tumors
Am J Clin Nutr doi: 10.3945/ajcn.114.101659. Printed in USA. � 2016 American Society for Nutrition 1 of 11
AJCN. First published ahead of print January 20, 2016 as doi: 10.3945/ajcn.114.101659.
Copyright (C) 2016 by the American Society for Nutrition

(OR: 2.37; 95% CI: 1.20, 4.67; P-heterogeneity with ER+/progester-one receptor positive = 0.06). We observed no statistically significantinteraction between smoking, alcohol, or BMI and all investigatedplasma analytes (based on tertile distribution).Conclusion: Our results indicate that higher concentrations of plasmab-carotene and a-carotene are associated with lower breast cancer riskof ER2 tumors. Am J Clin Nutr doi: 10.3945/ajcn.114.101659.
Keywords: breast cancer, EPIC, antioxidants, carotenoids, plasma
INTRODUCTION
Vegetables and fruit contain many putatively cancer-protectivesubstances. For breast cancer, a recent meta-analysis of 15prospective studies showed that high intake of fruit and of fruitand vegetables combined is associated with a weak breast cancerrisk reduction. For vegetables only, no reduction in risk was found(1). Because of measurement errors inherent to dietary ques-tionnaires that were used in most of these studies (2), protectiveeffects may have been underestimated or small effects couldhave been missed. Even small effects can have a large impact onpublic health, leading to preventive dietary recommendations ona population scale.
Blood concentrations of carotenoids and vitamin C are goodbiomarkers of vegetable and fruit consumption and provide betterestimates of the concentration actually available to cells than die-tary questionnaires (3–6). Besides, carotenoids and vitamin C arethought to have cancer-protective capacities themselves (7–10).Recently, blood concentrations of 6 carotenoids were studied inrelation to breast cancer risk in a meta-analysis of 15 prospectivestudies (11). Higher concentrations of total carotenoids, a-carotene,b-carotene, and lutein were found to be statistically significantlyassociated with lower breast cancer risk. Another pooled analysis of8 prospective studies, examining circulating carotenoids, found
similar results and, in addition, statistically significant inverseassociations for lycopene (12). Blood concentrations of vitaminC have been studied in only one nested case-control study oflimited size (13), with no suggestion for a protective association.
Several prospective studies suggested that fruit and vegetableconsumption and dietary carotenoid intake are more stronglyrelated to estrogen receptor–negative (ER2)45 than to estro-gen receptor–positive (ER+) breast cancer (14–18) and morestrongly to premenopausal than to postmenopausal breast can-cer (1, 19). The pooled analysis mentioned above (12) showedthat inverse associations between b-carotene concentrations andbreast cancer risk were statistically significantly stronger forER2 than for ER+ breast cancer.
The aim of our study was to evaluate prediagnostic plasmaconcentrations of carotenoids and vitamin C in relation to sub-sequent risk of incident breast cancer in the European ProspectiveInvestigation into Cancer and Nutrition (EPIC) cohort. We alsoincluded tocopherol and retinol as was done in comparablestudies (6, 20–25). The unique features of this investigation areits large sample size, allowing oversampling of premenopausaland ER2 breast cancer cases, and its long duration of follow-up,together with the fact that it includes participants from northernto southern Europe, spanning a wide range of vegetables andfruit consumption and related plasma biomarkers.
METHODS
EPIC cohort
EPIC is an ongoing multicenter, prospective cohort studyprimarily designed to investigate the relation between nutri-tion and cancer. The total EPIC cohort consists of 521,468 par-ticipants recruited from 23 centers in 10 European countries:Denmark, France, Germany, Greece, Italy, the Netherlands,Norway, Spain, Sweden, and the United Kingdom. Enrollmenttook place between 1992 and 1998. Further details have beendescribed previously (26).
Study participants
Eligible cases were all first primary incident, histologicallyconfirmed (invasive) breast cancer cases identified by follow-upbased on population cancer registries in most countries. ForFrance, Germany, and Greece, a combination of methods wasused, including health insurance records, cancer and pathologyregistries, and active follow-up through study participants andtheir next of kin.
Details on case and control selection have been describedpreviously (27). In short, of all breast cancer cases (n = 5458)diagnosed before 2005, 1502 cases (invasive breast cancer withblood samples available) and 1502 controls were selected. Ourstudy was designed to include an oversampling of premeno-pausal and ER2 breast cancer cases. Age at diagnosis was usedas a proxy for menopausal status at the time of breast cancerdiagnosis (#50 compared with .50 y of age at diagnosis for
1Supported by Wereld Kanker Onderzoek Fonds (WCRF NL grant num-ber WCRF 2006/13); Europe Against Cancer Program of the EuropeanCommission; Deutsche Krebshilfe, Deutsches Krebsforschungszentrum;German Federal Ministry of Education and Research; Danish Cancer Society;Health Research Fund of the Spanish Ministry of Health (ISCIII RETICCRD06/0020), Spanish Regional Governments of Andalucia, Asturia, BasqueCountry, Murcia (No. 6236), and Navarra; Catalan Institute of Oncology,Red de Centros RCESP, C03/09, Spain; Cancer Research UK; Medical ResearchCouncil, United Kingdom; Stroke Association, United Kingdom; British HeartFoundation; Department of Health, United Kingdom; Food Standards Agency,United Kingdom; Wellcome Trust, United Kingdom; Helenic Health Founda-tion; Italian Association for Research on Cancer; Italian National ResearchCouncil, Fondazione-Istituto Banco, Napoli, Italy; Dutch Ministry of PublicHealth, Welfare and Sports; Dutch Prevention Funds; LK Research Funds; DutchZON (Zorg Onderzoek Nederland); World Cancer Research Fund; SwedishCancer Society; Swedish Scientific Council; Regional Government of Skane,Sweden; European Research Council; French League against Cancer; NationalInstitute for Health and Medical Research, France; Mutuelle Générale del’Education Nationale, France; 3M Co, France; Gustave Roussy Institute, France;and General Councils of France. The funder and sponsors did not have any inputinto study design, study conduct, data collection, analysis, or interpretation, nordid they influence the preparation, review, or approval of the manuscript.
2Supplemental Tables 1–3 are available from the “Online Supporting Mate-rial” link in the online posting of the article and from the same link in the onlinetable of contents at http://ajcn.nutrition.org.*To whom correspondence should be addressed. E-mail: m.f.bakker-8@
umcutrecht.nl.Received October 22, 2014. Accepted for publication November 30, 2015.doi: 10.3945/ajcn.114.101659.
45Abbreviations used: EPIC, European Prospective Investigation into
Cancer and Nutrition; ER2, estrogen receptor negative; ER+, estrogen re-
ceptor positive; PR2, progesterone receptor negative; PR+, progesterone
receptor positive.
2 of 11 BAKKER ET AL.
pre- and postmenopausal, respectively). All premenopausalcases (#50 y, n = 582) that were identified at the time of the study(irrespective of their ER2 status) were selected. From thepostmenopausal cases (.50 y), all ER2 cases (n = 462) and anapproximately equal sample from ER+ cases (n = 458) wereselected. The ER+ cases were characterized by the same dis-tribution of country and year of diagnosis as the ER2 cases,whereas apart from these criteria, their selection was random.Controls were selected by using an incidence density samplingdesign and further matched by study center, age (within 1 y),menopausal status at recruitment, use of exogenous hormones,phase of menstrual cycle, fasting status at blood collection, andtime of blood collection (61 h) (27).
All participants gave written informed consent. The study wasapproved by the local ethics committees in the participatingcenters and by the International Agency for Research on Cancerethical review committee.
Laboratory assays
Details on laboratory analysis have been described earlier (28).In brief, each batch contained 80 plasma samples, 2 3 39 formatched case-control pairs, which were analyzed in the samebatch and in random order to minimize errors from batch-to-batch variations, and 2 quality control (laboratory) samples.Laboratory technicians were blinded to the case-control statusof all samples. For this study, plasma samples were used thathad not been thawed previously. Intrabatch and interbatchCVs were 2.8% and 8.7% for vitamin C, 9.1% and 13.2% fora-carotene, 5.6% and 10.9% for b-carotene, 3.7% and 9.1% forb-cryptoxanthin, 6.7% and 13.9% for lutein, 9.9% and 11.3%for lycopene, 11.3% and 21.9% for zeaxanthin, 2.7% and 6.9%for retinol, 2.5% and 8.2% for a-tocopherol, and 2.5% and6.8% for g-tocopherol, respectively.
Carotenoids, retinol, and tocopherols
Plasma samples (200 mL) were analyzed for a-carotene,b-carotene, b-cryptoxanthin, lutein, lycopene, zeaxanthin, reti-nol, a-tocopherol, and g-tocopherol. The National Institute forPublic Health and the Environment (Bilthoven, Netherlands)conducted the analysis. This analysis was done by using HPLC(using an HPLC column, 250 3 4.6 mm, ChromSpher 5 mmC18; Varian Assoc.), following a method based on that ofSteghens et al. (29).
Vitamin C
Plasma vitamin C was measured with a colorimetric assay onan LX20-Pro autoanalyzer (Beckman-Coulter).
Statistical analysis
Descriptives of all analytes were compared between cases andcontrols. Differences in means 6 SDs were tested by usingpaired t tests, and if variables were not normally distributed,they were log-transformed and geometric means were calcu-lated. Spearman’s rank correlation coefficient was used to assessthe correlation between all individual analytes.
ORs and 95% CIs for ER+ and ER2 breast cancer in relationto plasma concentrations of all analytes were calculated with
conditional logistic regression models, stratified by case-controlset. Analyses were based on the quintile distribution among thecontrols (lowest quintile as reference category). Tests for lineartrend across quintiles were performed by using median values ofeach quintile.
The final models were, in addition to conditioning on matchingfactors, adjusted for BMI (in kg/m2), height, age at menarche, ageat first full-term pregnancy, oral contraceptive pill use, hormonetherapy use, smoking status, alcohol intake, total energy, saturatedfatty acids, educational level, and season of blood collection (seeTable 2 for units and categories), using indicator variables formissing data. Age at menopause (for postmenopausal women),physical activity [based on Cambridge Physical Activity Index(30)], and geographic region (northern/middle/southern Europe)were evaluated but not included in the final model because theydid not change the relation with breast cancer risk and the first 2variables were missing for several centers.
Analyses were also stratified by the combination of both re-ceptors [ER+/progesterone receptor positive (PR+) comparedwith ER2/progesterone receptor negative (PR2)]. When furtherstratifying by age at diagnosis as a proxy for menopausal status,only strata with cases .50 y at diagnosis were large enough todraw conclusions on.
We assessed heterogeneity between the subtypes defined byreceptor status by using a log-likelihood ratio test to compareconditional logistic regression models with and without in-teraction terms for subtype outcome (ER2 compared with ER+and ER2/PR2 compared with ER+/PR+). Interaction termswere created by multiplying each subtype with the linear trendover the quintile score of analyte concentrations (31).
Partial Pearson correlation coefficients (adjusted for age, BMI,and season of blood collection) were used to assess the corre-lation between all analytes and fruit and vegetable intake.
To diminish the influence of possible changes in food patternsor metabolic changes due to preclinical disease, we performedsensitivity analyses excluding cases whose blood samples werecollected within 2 y before cancer diagnosis.
Finally, we examined the modifying effect of smoking sta-tus (never/past compared with current), alcohol consumption(continuous, g/d), and BMI (continuous) on the relations be-tween plasma analyte concentrations on breast cancer risk,because a protective effect of high plasma antioxidant con-centrations could be hypothesized to be stronger in women withhigh amounts of oxidative stress, caused by smoking and alcoholconsumption (19, 32–35), and lower BMI might have strongerprotective effects (12). The analyses were performed with con-ditional logistic regression analyses by using interaction termswith all individual analytes (tertile distribution).
Two-sided P values ,0.05 were considered statistically signifi-cant. All analyses were performed by using SPSS 20 (SPSS Inc.)and SAS 9.2 (SAS Institute).
RESULTS
Baseline characteristics of cases and controls and their plasmaconcentrations of carotenoids, retinol, tocopherols, and vitamin Care shown in Tables 1 and 2, respectively. In breast cancer cases,time between blood donation and diagnosis was 4.1 y, on av-erage. Most characteristics were equally distributed, which ispartly due to the matching procedure. Because of failure of the
PLASMA ANTIOXIDANTS AND RISK OF BREAST CANCER 3 of 11

laboratory method or not enough sample available, there were5 cases and 1 control with missing values on vitamin C, 28 casesand 22 controls on a-tocopherol and g-tocopherol, and 30 casesand 22 controls on all other analytes with missing values.
Spearman correlation coefficients between individual analytesare shown in Supplemental Table 1. The highest correlationwas observed between a-carotene and b-carotene (r = 0.69).Spearman correlations for plasma vitamin C, b-carotene, retinol,and the sum of a- and g-tocopherol with their dietary counter-parts (vitamin C, b-carotene, and vitamins A and E) were low(0.13, 0.22, 0.14, and 20.18, respectively; data not shown).
The breast cancer risk associated with plasma concentrationsof all analytes is shown in Table 3 for ER2 and for ER+ breastcancer. Risk of ER2 breast cancer was 39–59% lower forwomen in the highest quintile (quintile 5) compared with lowest
quintile (quintile 1) in the adjusted analysis for plasma concentra-tions of a-carotene (OR: 0.61; 95% CI: 0.39, 0.98; P-trend = 0.02)and b-carotene (OR: 0.41; 95% CI: 0.26, 0.65; P-trend = 0.002).Results for retinol (OR: 1.65; 95% CI: 0.97, 2.81) showed a higherrisk of ER2 breast cancer that was borderline statistically signifi-cant (P-trend = 0.08). The other analytes were not statisticallyassociated with ER2 breast cancer. For ER+ tumors, no statis-tically significant associations were found, but the test for het-erogeneity between ER2 and ER+ tumors was only statisticallysignificant for b-carotene (P-heterogeneity = 0.03).
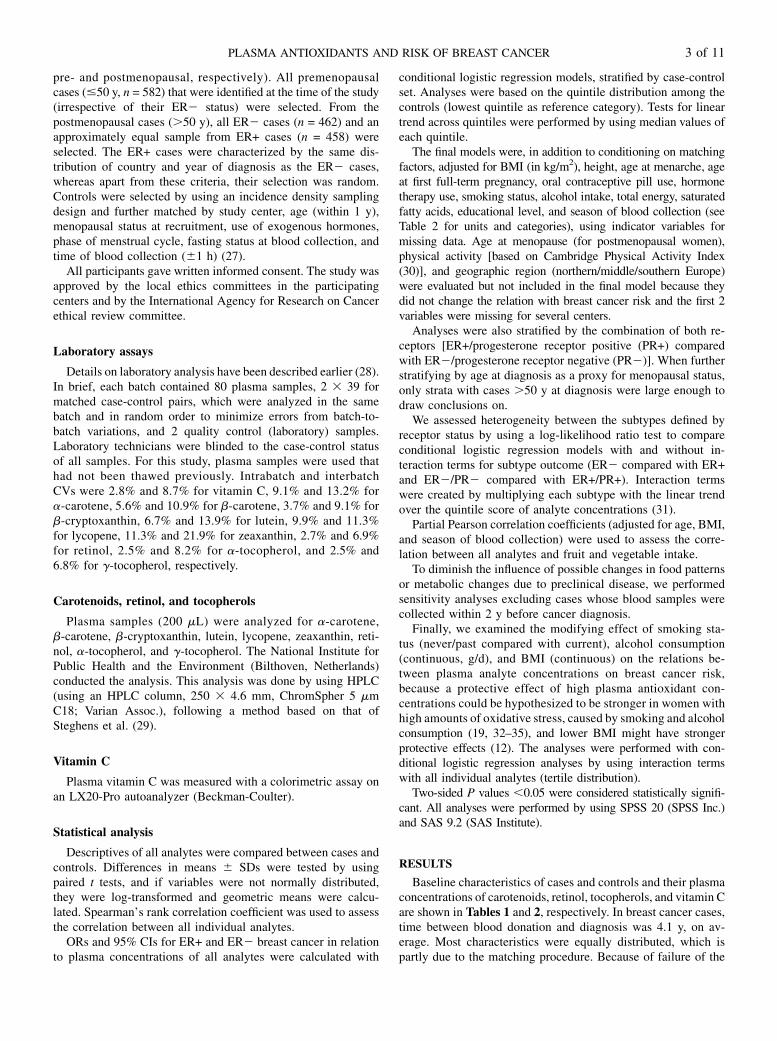
Separate analyses by ER/PR status (Figure 1) indicateda protective effect of vitamin C in relation to ER+/PR+ breastcancer (OR: 0.64; 95% CI: 0.35, 1.17; P-trend = 0.04). In re-lation to ER2/PR2, a similar effect was observed, but herethe P-trend was not statistically significant (P-trend = 0.16,
TABLE 1
Baseline characteristics of breast cancer cases and controls at recruitment1
Cases (n = 1502) Controls (n = 1502)
Age, y 49.98 6 8.582 50.00 6 8.59
BMI, kg/m2 24.86 6 4.14 24.80 6 4.06
Height, cm 162.34 6 6.49 162.09 6 6.46
Age at menarche, y 13.03 6 1.53 13.05 6 1.55
Age at first-time pregnancy, y 25.23 6 4.37 24.69 6 4.32
Alcohol consumption, g/d 4.21 (0.84, 13.20)3 4.12 (0.66, 12.23)
Saturated fatty acids, g/d 29.99 6 11.50 29.31 6 11.47
Energy, kcal/d 1974 6 548 1934 6 543
Storage time blood samples, y 12.68 6 1.70 12.70 6 1.68
Time from blood draw to diagnosis, y 4.07 6 2.70
Menopausal status at recruitment, %
Postmenopausal (natural or surgical) 41.9 42.1
Premenopausal 42.7 42.4
Perimenopausal 15.4 15.5
Use of exogenous hormones, %
Oral contraceptive use
Never 38.5 38.1
Past 56.9 57.3
Current 4.6 4.6
HT use
Never 71.8 71.3
Past 7.4 7.1
Current 20.8 21.6
Smoking status, %
Never 53.8 53.9
Past 24.4 23.2
Current 21.8 22.9
Parous women, % 85.7 86.9
Physically active (based on CPAI), % 42.1 41.4
Secondary school or university degree, % 49.0 47.1
Specific case characteristics, n
#50 y at diagnosis 582
ER+/ER2 183/75
PR+/PR2 172/72
ER+PR+/ER2PR2 145/47
.50 y at diagnosis 920
ER+/ER2 458/462
PR+/PR2 282/358
ER+PR+/ER2PR2 233/307
1CPAI, Cambridge Physical Activity Index [incorporating occupational and nonoccupational physical activity; see
Wareham et al. (30)]; ER2, estrogen receptor negative; ER+, estrogen receptor positive; HT, hormone replacement therapy;
PR2, progesterone receptor negative; PR+, progesterone receptor positive.2Mean 6 SD (all such values).3Median; 25th, 75th percentiles in parentheses (all such values).
4 of 11 BAKKER ET AL.

P-heterogeneity = 0.64). For ER2/PR2, there was an inverseassociation for b-carotene (OR: 0.45; 95% CI: 0.26, 0.80;P-trend = 0.02) and a borderline statistically significant associationfor a-carotene (OR: 0.64; 95% CI: 0.36, 1.13; P-trend = 0.09). Nostatistically significant associations were observed for b- anda-carotene in relation to ER+/PR+ breast cancer. The tests forheterogeneity were not statistically significant (P-heterogeneity =0.20 and P-heterogeneity = 0.28). Positive associations in relationto ER2/PR2 but not ER+/PR+ breast cancer were seen forzeaxanthin (OR: 2.34; 95% CI: 1.04, 5.23; P-trend = 0.06) andretinol (OR: 2.37; 95% CI: 1.20, 4.67; P-trend = 0.02). P valuesfor heterogeneity were 0.03 and 0.06, respectively. Sensitivityanalyses of receptor-specific tumor subtypes that were restricted towomen diagnosed .50 y of age gave comparable results to thoseof Table 3 and Figure 1 (results not shown).
Partial Pearson correlation coefficients between individualanalyte concentrations and fruit and vegetable intakes are shown inSupplemental Table 2. a-Carotene is most strongly related withroot vegetables (r = 0.25), b-carotene with total and root vegeta-bles (both r = 0.14), vitamin C with total and root vegetables (bothr = 0.07), and zeaxanthin with leafy vegetables (r = 0.24). Retinolis inversely correlated with leafy vegetables (r = 20.20).
Sensitivity analyses were conducted excluding 341 caseswhose blood samples were collected within 2 y before cancerdiagnosis. Results were quite similar to the analysis includingthese cases. For ER2 breast cancer, in quintile 5 comparedwith quintile 1, this was a-carotene (OR: 0.73; 95% CI: 0.44,1.22; P-trend = 0.14), b-carotene (OR: 0.48; 95% CI: 0.28,0.81; P-trend = 0.03), and retinol (OR: 1.69; 95% CI: 0.93,3.10; P-trend = 0.13).
Interaction terms for smoking status, alcohol consumption, orBMI (Supplemental Table 3) were for all analytes (based ona tertile distribution) not statistically significant.
DISCUSSION
To our knowledge, this is the largest nested case-control studyto date of plasma carotenoids as well as retinol, tocopherols,
and vitamin C in relation to hormone receptor–specific breastcancer risk.
For ER2 breast cancers, statistically significant associationswere found for plasma a-carotene and b-carotene, leading toa 39–59% reduction in breast cancer risk.
Our results are largely in agreement with those of the pooledanalysis of 8 prospective studies (12). Their risk estimates forER2 breast cancer (highest compared with lowest quintile)were OR = 0.61 for a-carotene and OR = 0.52 for b-carotene;ours were OR = 0.61 and OR = 0.41, respectively. Anotherpooled analysis of 18 prospective studies on dietary carotenoidintake also showed inverse associations of a-carotene, b-carotene,and lutein/zeaxanthin intake being primarily present in relationto ER2 but not to ER+ breast cancer (18). This was also thecase for vegetable consumption in a recently published largepooled analysis (36). Two recent nested case-control studies oncarotenoids and breast cancer subtypes did not observe het-erogeneity between ER2 and ER+ tumors, but the number ofER2 breast cancers was much lower (n = 56 and n = 292,respectively) than in our study (37, 38). The inverse associa-tions found for ER2 breast cancer support the idea that the effectof antioxidants could be easier to detect in less hormone-dependentbreast cancers, whereas for more hormone-dependent breast can-cers, this effect might be “overshadowed” by the strong influenceof hormonal factors (39).
Unexpectedly, we observed higher risk ER2/PR2 breastcancer for women in the upper quintiles of zeaxanthin and retinolconcentrations. These positive associations were not present inrelation to ER+/PR+ breast cancer. Other nested case-controlstudies did not observe this relation (6, 20–25), although somedescribe a positive nonsignificant association with retinol (21, 22,40). However, none was able to distinguish between receptor-specific breast cancer subtypes. The increased ER2/PR2 breastcancer risk in relation to higher concentrations of retinol could bedue to the fact that retinol, in contrast to carotenoids and vitaminC, is merely derived from animal sources, although we have noreason to think this would pertain to ER2/PR2 breast canceronly. We do not have an explanation for the increased risk ofER2/PR2 breast cancer for women with high zeaxanthin con-centrations. This has not been found in other studies or in relationto other cancers and could also be a chance finding.
We did not observe modification of the carotenoid–breastcancer associations by smoking, alcohol consumption, or BMI,as some earlier studies did (6, 12, 22, 25). For example, someother studies showed stronger effects of high carotenoid con-centrations in current smokers (12). One explanation might bethat the antioxidative effect of vitamin C is not visible in smokersbecause there is an overload of oxidative stress caused by smoking(also depleting vitamin C concentrations).
Our study has some limitations and strengths that deservefurther discussion to help interpret our findings. We only havea single measurement of biomarkers available, and changes inlong-term exposure and also day-to-day variation may have di-luted the results. Daily variation was taken into account in part bymatching on time of blood collection, fasting status, and adjustingfor season. Moreover, repeatability studies on these biomarkersin blood samples collected up to 11 (vitamin C) to 15 y (retinol,a- and b-carotene) suggest that single measurements are rea-sonable estimators and representative to use as a predictor andsuitable for assessment as risk factors (40–42). The (higher as
TABLE 2
Concentrations of vitamin C, carotenoids, retinol, and tocopherols of breast
cancer cases and controls at recruitment1
Analytes Cases (n = 1502) Controls (n = 1502)
Vitamin C, mmol/L 41.3 (40.4, 42.2) 42.7 (41.8, 43.5)
a-Carotene, nmol/L 99.5 (95.6, 104) 103 (99.1, 108)
b-Carotene, nmol/L 565 (545, 586) 606 (585, 628)
b-Cryptoxanthin, nmol/L 312 (298, 326) 320 (307, 333)
Zeaxanthin, nmol/L 270 (261, 279) 274 (265, 282)
Lutein, nmol/L 52.0 (49.9, 54.2) 50.8 (48.7, 52.9)
Lycopene, nmol/L 326 (311, 342) 343 (328, 358)
Sum of carotenoids, nmol/L 1851 (1679, 1906) 1937 (1886, 1989)
Retinol, mmol/L 1.78 (1.75, 1.81) 1.76 (1.73, 1.78)
a-Tocopherol, mmol/L 23.2 (22.7, 23.4) 23.3 (22.9, 23.6)
g-Tocopherol, mmol/L 4.15 (3.98, 4.32) 4.05 (3.88, 4.22)
1Values are means with 95% CIs in parentheses and are based on geo-
metric mean values. Because of failure of the laboratory method or not
enough sample available, there were 5 cases and 1 control with missing
values for vitamin C, 28 cases and 22 controls with missing values for
a-tocopherol and g-tocopherol, and 30 cases and 22 controls with missing
values for all other analytes.
PLASMA ANTIOXIDANTS AND RISK OF BREAST CANCER 5 of 11

TABLE3
Breastcancer
ORs(95%
CIs)accordingto
quintilesofplasm
aanalytesforER2
andER+breastcancers1
Plasm
aanalyte/ERstatus
Cases/controls,n
Q1
Q2
Q3
Q4
Q5
P-trend
P-heterogeneity
(ER2
compared
withER+)
Vitam
inC,mmol/L
ER2 Median2
19.80
34.21
43.12
51.37
63.58
Model
1535/535
1.00(reference)
1.00(0.67,1.48)
0.62(0.40,0.94)
0.89(0.60,1.32)
0.71(0.47,1.08)
0.11
Model
2535/535
1.00(reference)
0.99(0.65,1.50)
0.63(0.40,0.98)
0.88(0.58,1.34)
0.71(0.45,1.11)
0.12
ER+ Median2
19.95
34.70
43.45
51.55
64.32
Model
1639/638
1.00(reference)
0.80(0.56,1.13)
0.79(0.55,1.13)
0.78(0.54,1.13)
0.77(0.53,1.14)
0.19
Model
2639/638
1.00(reference)
0.81(0.56,1.18)
0.80(0.54,1.18)
0.74(0.50,1.10)
0.76(0.50,1.16)
0.17
0.86
a-Carotene,
nmol/L
ER2 Median2
38.33
72.31
106.86
153.49
279.56
Model
1515/514
1.00(reference)
1.11(0.78,1.58)
0.74(0.51,1.08)
0.82(0.55,1.22)
0.67(0.44,1.01)
0.03
Model
2515/514
1.00(reference)
1.08(0.74,1.57)
0.73(0.49,1.09)
0.81(0.53,1.24)
0.61(0.39,0.98)
0.02
ER+ Median2
36.10
71.44
103.45
146.86
266.43
Model
1636/632
1.00(reference)
0.95(0.65,1.40)
0.83(0.57,1.21)
1.16(0.80,1.69)
0.76(0.51,1.14)
0.23
Model
2636/632
1.00(reference)
1.00(0.67,1.50)
0.79(0.52,1.19)
1.22(0.81,1.83)
0.77(0.49,1.19)
0.28
0.26
b-Carotene,
nmol/L
ER2 Median2
253.18
419.88
603.82
879.73
1426.18
Model
1515/514
1.00(reference)
0.47(0.32,0.70)
0.71(0.48,1.05)
0.56(0.37,0.83)
0.46(0.31,0.70)
0.002
Model
2515/514
1.00(reference)
0.42(0.28,0.64)
0.66(0.44,1.00)
0.51(0.33,0.79)
0.41(0.26,0.65)
0.002
ER+ Median2
249.33
413.04
589.96
847.86
1373.03
Model
1636/632
1.00(reference)
0.97(0.66,1.43)
1.10(0.76,1.59)
1.03(0.70,1.50)
0.94(0.64,1.39)
0.70
Model
2636/632
1.00(reference)
0.95(0.63,1.42)
1.06(0.71,1.57)
1.00(0.66,1.51)
1.02(0.66,1.57)
0.91
0.03
Lycopene,
nmol/L
ER2 Median2
113.42
260.73
374.96
510.26
742.08
Model
1515/514
1.00(reference)
0.74(0.53,1.03)
0.84(0.57,1.24)
0.60(0.38,0.93)
1.04(0.57,1.89)
0.30
Model
2515/514
1.00(reference)
0.71(0.50,1.02)
0.83(0.54,1.27)
0.59(0.36,0.95)
1.07(0.56,2.03)
0.38
ER+ Median2
108.91
259.04
367.25
510.26
748.86
Model
1636/632
1.00(reference)
0.92(0.62,1.37)
1.05(0.70,1.56)
1.43(0.95,2.15)
0.93(0.58,1.47)
0.72
Model
2636/632
1.00(reference)
0.81(0.53,1.25)
0.94(0.61,1.44)
1.37(0.88,2.11)
0.90(0.55,1.48)
0.61
0.26
Lutein,nmol/L
ER2 Median2
125.35
202.25
270.62
372.56
616.13
Model
1515/514
1.00(reference)
1.04(0.75,1.45)
0.86(0.59,1.25)
1.27(0.81,2.01)
1.35(0.78,2.33)
0.23
Model
2515/514
1.00(reference)
1.03(0.73,1.45)
0.82(0.55,1.22)
1.23(0.76,2.01)
1.19(0.66,2.13)
0.48
(Continued)
6 of 11 BAKKER ET AL.

TABLE
3(C
ontinued
)
Plasm
aanalyte/ERstatus
Cases/controls,n
Q1
Q2
Q3
Q4
Q5
P-trend
P-heterogeneity
(ER2
compared
withER+)
ER+ Median2
125.35
203.44
276.81
381.31
633.22
Model
1636/632
1.00(reference)
0.66(0.43,1.01)
0.69(0.45,1.07)
0.61(0.39,0.95)
0.59(0.36,0.97)
0.14
Model
2636/632
1.00(reference)
0.71(0.45,1.12)
0.67(0.43,1.07)
0.60(0.37,0.97)
0.59(0.35,1.00)
0.15
0.11
Zeaxanthin,nmol/L
ER2 Median2
14.00
32.62
54.70
87.61
143.01
Model
1515/514
1.00(reference)
1.27(0.92,1.74)
1.29(0.89,1.88)
1.34(0.81,2.21)
1.34(0.75,2.38)
0.23
Model
2515/514
1.00(reference)
1.26(0.90,1.77)
1.18(0.79,1.75)
1.21(0.70,2.07)
1.29(0.69,2.42)
0.45
ER+ Median2
14.00
33.16
56.68
89.53
146.43
Model
1636/632
1.00(reference)
1.07(0.69,1.65)
1.00(0.63,1.59)
0.92(0.56,1.51)
0.99(0.59,1.64)
0.88
Model
2636/632
1.00(reference)
1.06(0.67,1.70)
0.95(0.58,1.57)
0.83(0.49,1.41)
0.84(0.49,1.45)
0.42
0.33
b-Cryptoxanthin,nmol/L
ER2 Median2
118.54
231.17
356.35
551.03
983.98
Model
1515/514
1.00(reference)
1.00(0.71,1.42)
0.70(0.48,1.05)
0.78(0.53,1.14)
0.91(0.59,1.42)
0.44
Model
2515/514
1.00(reference)
0.94(0.65,1.37)
0.68(0.45,1.03)
0.70(0.46,1.07)
0.84(0.51,1.37)
0.29
ER+ Median2
123.52
237.65
374.72
564.78
1005.58
Model
1636/632
1.00(reference)
0.62(0.43,0.88)
0.79(0.54,1.14)
0.82(0.58,1.17)
0.77(0.52,1.13)
0.79
Model
2636/632
1.00(reference)
0.58(0.40,0.85)
0.74(0.49,1.11)
0.73(0.49,1.09)
0.70(0.45,1.10)
0.68
0.66
Sum
ofcarotenoids,nmol/L
ER2 Median2
987.08
1516.71
1986.50
2560.23
3716.75
Model
1515/514
1.00(reference)
0.55(0.39,0.79)
0.70(0.47,1.04)
0.70(0.46,1.06)
0.71(0.44,1.15)
0.27
Model
2515/514
1.00(reference)
0.51(0.35,0.75)
0.70(0.46,1.06)
0.65(0.41,1.03)
0.64(0.37,1.09)
0.23
ER+ Median2
979.60
1525.42
1978.02
2545.21
3707.60
Model
1636/632
1.00(reference)
0.90(0.60,1.34)
0.97(0.65,1.46)
1.08(0.72,1.63)
0.86(0.56,1.30)
0.55
Model
2636/632
1.00(reference)
0.85(0.55,1.31)
0.92(0.59,1.45)
1.00(0.64,1.58)
0.85(0.53,1.37)
0.66
0.61
Retinol,mmol/L
ER2 Median2
1.20
1.50
1.75
2.05
2.55
Model
1515/514
1.00(reference)
1.12(0.70,1.80)
1.59(0.98,2.58)
1.28(0.79,2.07)
1.55(0.94,2.55)
0.13
Model
2515/514
1.00(reference)
1.05(0.64,1.73)
1.67(1.01,2.77)
1.35(0.81,2.25)
1.65(0.97,2.81)
0.08
ER+ Median2
1.18
1.48
1.73
2.04
2.52
Model
1636/632
1.00(reference)
1.09(0.75,1.59)
0.89(0.61,1.29)
1.18(0.79,1.75)
1.01(0.65,1.56)
0.89
Model
2636/632
1.00(reference)
1.10(0.74,1.63)
0.92(0.62,1.37)
1.15(0.76,1.75)
1.02(0.64,1.63)
0.92
0.32
a-Tocopherol,mmol/L
ER2 Median2
16.29
19.93
23.15
26.58
33.66
Model
1517/516
1.00(reference)
1.33(0.70,2.52)
0.92(0.49,1.74)
1.00(0.54,1.82)
1.07(0.59,1.96)
0.99
Model
2517/516
1.00(reference)
1.26(0.64,2.50)
0.78(0.40,1.54)
0.85(0.44,1.63)
0.88(0.46,1.68)
0.51
(Continued)
PLASMA ANTIOXIDANTS AND RISK OF BREAST CANCER 7 of 11

TABLE
3(C
ontinued
)
Plasm
aanalyte/ERstatus
Cases/controls,n
Q1
Q2
Q3
Q4
Q5
P-trend
P-heterogeneity
(ER2
compared
withER+)
ER+ Median2
16.01
19.73
23.12
26.41
33.45
Model
1636/632
1.00(reference)
1.06(0.75,1.49)
1.06(0.73,1.56)
0.73(0.49,1.10)
0.86(0.56,1.33)
0.27
Model
2636/632
1.00(reference)
1.04(0.73,1.49)
1.04(0.70,1.56)
0.77(0.50,1.18)
0.88(0.56,1.40)
0.40
0.62
g-Tocopherol,mmol/L
ER2 Median2
1.49
3.40
4.30
6.42
10.27
Model
1517/516
1.00(reference)
0.97(0.68,1.39)
1.06(0.71,1.57)
1.15(0.75,1.75)
1.41(0.83,2.38)
0.17
Model
2517/516
1.00(reference)
1.00(0.69,1.45)
1.14(0.75,1.74)
1.16(0.74,1.82)
1.54(0.87,2.71)
0.13
ER+ Median2
1.43
2.96
4.15
6.14
10.19
Model
1636/632
1.00(reference)
1.17(0.72,1.91)
0.99(0.62,1.59)
1.09(0.67,1.78)
0.93(0.56,1.54)
0.42
Model
2636/632
1.00(reference)
1.18(0.70,1.97)
1.01(0.61,1.68)
1.08(0.64,1.82)
0.91(0.53,1.58)
0.38
0.12
1Rangesofallquintiles,based
oncontrols,forallanalytesareas
follow
s:vitam
inC:Q1(2.50–28.5),Q2(28.5–39.4),Q3(39.4–46.4),Q4(46.4–56.1),Q5(56.1–145.30);a-carotene:Q1(14.00–56.95),Q2
(56.95–88.31),
Q3(88.31–124.03),
Q4(124.03–198.07),Q5(198.07–1520.25);
b-carotene:
Q1(24.87–348.94),
Q2(348.94–497.32),Q3(497.32–718.63),Q4(718.63–1066.96),
Q5(1066.96–7698.56);
lycopene:
Q1(14.00–192.07),Q2(192.07–314.62),Q3(314.62–431.27),Q4(431.27–596.49),Q5(465.62–1529.68);zeaxanthin:Q1(14.00–21.00),Q2(21.00–43.20),Q3(43.20–69.13),Q4(69.13–107.19),
Q5(107.19–440.69);b-cryptoxanthin:Q1(17.00–176.09),Q2(176.09–286.20),Q3(286.20–444.89),Q4(444.89–709.18),Q5(709.18–5476.30);sum
ofcarotenoids:
Q1(277.42–1268.75),Q2(1268.75–
1730.40),Q3(1730.40–2331.07),Q4(2231.07–2982.65),Q5(2982.65–9134.24);retinol:Q1(0.32–1.37),Q2(1.37–1.63),Q3(1.63–1.90),Q4(1.90–2.25),Q5(2.25–6.70);a-tocopherol:Q1(8.93–18.29),Q2
(18.29–21.54),
Q3(21.54–24.84),
Q4(24.84–29.34),
Q5(29.34–84.65);
g-tocopherol:Q1(0.07–2.33),Q2(2.33–3.59),Q3(3.59–5.15),Q4(5.15–7.87),Q5(7.87–28.95).
Model1:conditional
logistic
regressionmodeladjusted
formatchingfactors[studycenter,age(w
ithin1y),menopausalstatusatrecruitment,use
ofexogenoushorm
ones,phaseofmenstrualcycle,fastingstatusatbloodcollection,and
time
ofbloodcollection(6
1h)].Model
2:conditionallogisticregressionmodel
also
adjustingforBMI(continuous),height(continuous),ageat
menarche(,
12,12–14,.14y,
missing),ageat
firstfull-term
pregnancy
(nulliparous,
#20,.20and#25,.25and#30,.30y,
missing),oralcontraceptive
use
(ever/never/m
issing,forpremenopausalwomen),horm
onetherapyuse
(ever/never/m
issing,
forpost-
menopausalwomen),sm
okingstatus(never,past,current,missing),alcoholconsumption(g/d),educational
level(none,
primaryschool,technical/professional
school,secondaryschool,university
degree,
missing),intakeofsaturatedfattyacids(g/d),energyintake(kcal/d),andseasonofbloodcollection(w
inter,spring,summer,fall).ER+,estrogen
receptorpositive;ER2,estrogen
receptornegative;Q,quintile.
2Medianvaluewithin
quintile,based
oncontrols.
8 of 11 BAKKER ET AL.
well as lower) differences in plasma concentrations of the in-vestigated carotenoids compared with other studies investigatingplasma analytes (20–25) might be related to laboratory differ-ences, because in a study investigating another sample of theEPIC population but using different laboratory techniques,lower concentrations of plasma carotenoids were observed ingeneral (3).
Because carotenoids are fat soluble, their concentrations inplasmamay be influenced by type and amount of fat consumed.Wedid not measure and were therefore not able to adjust for plasmalipid concentration, which may have led to underestimation of thecarotenoid associations. However, it should be noted that in nestedcase-control studies that did have this information available, ad-justment did not materially alter the results (20, 43).
Although our findings support the hypothesis that high con-centrations of several carotenoids and vitamin C may protectagainst the development of hormone receptor–specific breastcancer, this does not necessarily mean that it helps to take dietarysupplements (44). The consumption of carotenoid- and vitamin-rich food such as carrots as a dietary counterpart for a-carotene,carrots and leafy vegetables for b-carotene, and citrus fruits forvitamin C might lead to a possible lower (hormone receptor–specific) breast cancer risk. In general, effects of fruit and vege-table intake appear to be weak and largely confined to ER2 breast
cancer (36), but measurement errors inherent to dietary ques-tionnaires may have diluted these effects. Also, we cannot ex-clude that other underlying lifestyle behaviors, genetic factors, orthe availability of other bioactive compounds might be correlatedwith the biomarkers under study, leading to residual confounding(33, 45). Other substances present in the same foods as vitamin Cand carotenoids might be responsible for the beneficial effects too.The inverse association attributed to these vitamin concentrationsmay also be produced by a combination of bioactive compoundsworking synergistically together.
An important strength of this study is the inclusion of par-ticipants from 10 different countries with a large variation inconsumption patterns. All plasma analytes were measured in thesame laboratory and in samples collected well before breastcancer diagnosis, avoiding the potential modifying effect ofcancer treatment and changes in lifestyle or dietary habits afterthe diagnosis of cancer. Further strengths of this study includelarge sample size, long follow-up time, and oversampling ofER2 and PR2 breast cancer subtypes, making it possible toevaluate these relatively infrequent but harmful breast cancersubtypes.
In conclusion, women with higher plasma concentrations ofb-carotene and a-carotene are at lower breast cancer risk ofER2 breast cancer.
FIGURE 1 ER/PR positive (n = 378) and ER/PR negative (n = 354) breast cancer ORs according to quintiles of plasma analytes. Stratified analysis basedon conditional logistic regression analysis with linear trend tests across quintiles using median values of each quintile. P-heterogeneity across subtypes usinga log-likelihood ratio test (with or without interaction terms). Diamonds represent ORs; lines represent 95% CIs. Lowest quintile represents reference category.ER2, estrogen receptor negative; ER+, estrogen receptor positive; PR2, progesterone receptor negative; PR+, progesterone receptor positive.
PLASMA ANTIOXIDANTS AND RISK OF BREAST CANCER 9 of 11
The authors’ responsibilities were as follows—MFB, PHMP, VMK, HBBdM,
ER, and CHvG: designed the research; PHMP, HBBdM, EHJMJ, MMR, AT,
KO, IR, HB, RK, AT, PV, SP, RT, JRQ, PA, M-JS, TJK, K-TK, and ER: collected
data; MFB, PHMP, and CHvG: analyzed the data and wrote the manuscript;
MFB, PHMP, NT, and CHvG: performed the statistical analysis; and all authors:
revised the manuscript and read and approved the final manuscript. No authors
declared a conflict of interest related to the study.
REFERENCES1. Aune D, Chan DS, Vieira AR, Rosenblatt DA, Vieira R, Greenwood
DC, Norat T. Fruits, vegetables and breast cancer risk: a systematicreview and meta-analysis of prospective studies. Breast Cancer ResTreat 2012;134:479–93.
2. Natarajan L, Flatt SW, Sun X, Gamst AC, Major JM, Rock CL, Al-DelaimyW, Thomson CA, Newman VA, Pierce JP, et al. Validity and systematicerror in measuring carotenoid consumption with dietary self-report in-struments. Am J Epidemiol 2006;163:770–8.
3. Al-Delaimy WK, Ferrari P, Slimani N, Pala V, Johansson I, Nilsson S,Mattisson I, Wirfalt E, Galasso R, Palli D, et al. Plasma carotenoids asbiomarkers of intake of fruits and vegetables: individual-level corre-lations in the European Prospective Investigation into Cancer andNutrition (EPIC). Eur J Clin Nutr 2005;59:1387–96.
4. Block G, Norkus E, Hudes M, Mandel S, Helzlsouer K. Which plasmaantioxidants are most related to fruit and vegetable consumption? Am JEpidemiol 2001;154:1113–8.
5. Fowke JH, Chung FL, Jin F, Qi D, Cai Q, Conaway C, Cheng JR, ShuXO, Gao YT, Zheng W. Urinary isothiocyanate levels, brassica, andhuman breast cancer. Cancer Res 2003;63:3980–6.
6. Tamimi RM, Hankinson SE, Campos H, Spiegelman D, Zhang S, ColditzGA, Willett WC, Hunter DJ. Plasma carotenoids, retinol, and tocopherolsand risk of breast cancer. Am J Epidemiol 2005;161:153–60.
7. IARC Working Group on the Evaluation of Cancer Preventive Agents.IARC handbooks of cancer prevention. Vol. 2. Lyon (France): Carot-enoids; 1998.
8. Kelley DS, Bendich A. Essential nutrients and immunologic functions.Am J Clin Nutr 1996;63:994S–6S.
9. Niki E. Action of ascorbic acid as a scavenger of active and stableoxygen radicals. Am J Clin Nutr 1991;54:1119S–24S.
10. Steinmetz KA, Potter JD. Vegetables, fruit, and cancer: II. Mecha-nisms. Cancer Causes Control 1991;2:427–42.
11. Aune D, Chan DS, Vieira AR, Navarro Rosenblatt DA, Vieira R,Greenwood DC, Norat T. Dietary compared with blood concen-trations of carotenoids and breast cancer risk: a systematic reviewand meta-analysis of prospective studies. Am J Clin Nutr 2012;96:356–73.
12. Eliassen AH, Hendrickson SJ, Brinton LA, Buring JE, Campos H, DaiQ, Dorgan JF, Franke AA, Gao YT, Goodman MT, et al. Circulatingcarotenoids and risk of breast cancer: pooled analysis of eight pro-spective studies. J Natl Cancer Inst 2012;104:1905–16.
13. Wu K, Helzlsouer KJ, Alberg AJ, Comstock GW, Norkus EP, HoffmanSC. A prospective study of plasma ascorbic acid concentrations andbreast cancer (United States). Cancer Causes Control 2000;11:279–83.
14. Baglietto L, Krishnan K, Severi G, Hodge A, Brinkman M, EnglishDR, McLean C, Hopper JL, Giles GG. Dietary patterns and risk ofbreast cancer. Br J Cancer 2011;104:524–31.
15. Boggs DA, Palmer JR, Wise LA, Spiegelman D, Stampfer MJ, Adams-Campbell LL, Rosenberg L. Fruit and vegetable intake in relation torisk of breast cancer in the Black Women’s Health Study. Am J Epi-demiol 2010;172:1268–79.
16. Fung TT, Hu FB, McCullough ML, Newby PK, Willett WC, HolmesMD. Diet quality is associated with the risk of estrogen receptor–negative breast cancer in postmenopausal women. J Nutr 2006;136:466–72.
17. Olsen A, Tjonneland A, Thomsen BL, Loft S, Stripp C, Overvad K,Moller S, Olsen JH. Fruits and vegetables intake differentially affectsestrogen receptor negative and positive breast cancer incidence rates.J Nutr 2003;133:2342–7.
18. Zhang X, Spiegelman D, Baglietto L, Bernstein L, Boggs DA, van denBrandt PA, Buring JE, Gapstur SM, Giles GG, Giovannucci E, et al.Carotenoid intakes and risk of breast cancer defined by estrogen re-ceptor and progesterone receptor status: a pooled analysis of 18 pro-spective cohort studies. Am J Clin Nutr 2012;95:713–25.
19. Zhang S, Hunter DJ, Forman MR, Rosner BA, Speizer FE, Colditz GA,Manson JE, Hankinson SE, Willett WC. Dietary carotenoids and vi-tamins A, C, and E and risk of breast cancer. J Natl Cancer Inst 1999;91:547–56.
20. Hultén K, Van Kappel AL, Winkvist A, Kaaks R, Hallmans G, LennerP, Riboli E. Carotenoids, alpha-tocopherols, and retinol in plasma andbreast cancer risk in northern Sweden. Cancer Causes Control 2001;12:529–37.
21. Dorjgochoo T, Gao YT, Chow WH, Shu XO, Li H, Yang G, Cai Q,Rothman N, Cai H, Franke AA, et al. Plasma carotenoids, tocopherols,retinol and breast cancer risk: results from the Shanghai Women HealthStudy (SWHS). Breast Cancer Res Treat 2009;117:381–9.
22. Epplein M, Shvetsov YB, Wilkens LR, Franke AA, Cooney RV, LeMarchand L, Henderson BE, Kolonel LN, Goodman MT. Plasma ca-rotenoids, retinol, and tocopherols and postmenopausal breast cancerrisk in the Multiethnic Cohort Study: a nested case-control study.Breast Cancer Res 2009;11:R49.
23. Kabat GC, Kim M, Adams-Campbell LL, Caan BJ, Chlebowski RT,Neuhouser ML, Shikany JM, Rohan TE, Investigators WHI. Longitu-dinal study of serum carotenoid, retinol, and tocopherol concentrationsin relation to breast cancer risk among postmenopausal women. Am JClin Nutr 2009;90:162–9.
24. Maillard V, Kuriki K, Lefebvre B, Boutron-Ruault MC, Lenoir GM,Joulin V, Clavel-Chapelon F, Chajes V. Serum carotenoid, tocopheroland retinol concentrations and breast cancer risk in the E3N-EPICstudy. Int J Cancer 2010;127:1188–96.
25. Dorgan JF, Sowell A, Swanson CA, Potischman N, Miller R, SchusslerN, Stephenson HE Jr. Relationships of serum carotenoids, retinol,alpha-tocopherol, and selenium with breast cancer risk: results froma prospective study in Columbia, Missouri (United States). CancerCauses Control 1998;9:89–97.
26. Riboli E, Hunt KJ, Slimani N, Ferrari P, Norat T, Charrondiere UR,Hémon B, Casagrande C, Vignat J, Overvad K, et al. European Pro-spective Investigation into Cancer and Nutrition (EPIC): study pop-ulations and data collection. Public Health Nutr 2002;5:1113–24.
27. Kuhn T, Kaaks R, Becker S, Eomois PP, Clavel-Chapelon F, KvaskoffM, Dossus L, Tjonneland A, Olsen A, Overvad K, et al. Plasma 25-hydroxyvitamin D and the risk of breast cancer in the European pro-spective investigation into cancer and nutrition: a nested case-controlstudy. Int J Cancer 2013;133:1689–700.
28. Ros MM, Bueno-de-Mesquita HB, Kampman E, Aben KK, BuchnerFL, Jansen EH, van Gils CH, Egevad L, Overvad K, Tjonneland A,et al. Plasma carotenoids and vitamin C concentrations and risk ofurothelial cell carcinoma in the European Prospective Investigationinto Cancer and Nutrition. Am J Clin Nutr 2012;96:902–10.
29. Steghens JP, Van Kappel AL, Riboli E, Collombel C. Simultaneousmeasurement of seven carotenoids, retinol and alpha-tocopherol inserum by high-performance liquid chromatography. J Chromatogr BBiomed Sci Appl 1997;694:71–81.
30. Wareham NJ, Jakes RW, Rennie KL, Schuit J, Mitchell J, Hennings S,Day NE. Validity and repeatability of a simple index derived from theshort physical activity questionnaire used in the European ProspectiveInvestigation into Cancer and Nutrition (EPIC) study. Public HealthNutr 2003;6:407–13.
31. James RE, Lukanova A, Dossus L, Becker S, Rinaldi S, Tjonneland A,Olsen A, Overvad K, Mesrine S, Engel P, et al. Postmenopausal serumsex steroids and risk of hormone receptor–positive and –negative breastcancer: a nested case-control study. Cancer Prev Res (Phila) 2011;4:1626–35.
32. Brooks PJ. DNA damage, DNA repair, and alcohol toxicity—a review.Alcohol Clin Exp Res 1997;21:1073–82.
33. Key TJ. Fruit and vegetables and cancer risk. Br J Cancer 2011;104:6–11.
34. Lachance PA, Nakat Z, Jeong WS. Antioxidants: an integrative ap-proach. Nutrition 2001;17:835–8.
35. Nagel G, Linseisen J, Van Gils CH, Peeters PHM, Boutron-Ruault MC,Clavel-Chapelon F, Romieu I, Tjonneland A, Olsen A, Roswall N,et al. Dietary beta-carotene, vitamin C and E intake and breast cancerrisk in the European Prospective Investigation into Cancer and Nutri-tion (EPIC). Breast Cancer Res Treat 2010;119:753–65.
36. Jung S, Spiegelman D, Baglietto L, Bernstein L, Boggs DA, van denBrandt PA, Buring JE, Cerhan JR, Gaudet MM, Giles GG, et al. Fruitand vegetable intake and risk of breast cancer by hormone receptorstatus. J Natl Cancer Inst 2013;105:219–36.
10 of 11 BAKKER ET AL.

37. Wang Y, Gapstur SM, Gaudet MM, Furtado JD, Campos H, McCulloughML. Plasma carotenoids and breast cancer risk in the Cancer PreventionStudy II Nutrition Cohort. Cancer Causes Control 2015;26:1233–44.
38. Eliassen AH, Liao X, Rosner B, Tamimi M, Tworoger SS, HankinsonSE. Plasma carotenoids and risk of breast cancer over 20 y of follow-up. Am J Clin Nutr 2015;101:1197–205.
39. Buckland G, Travier N, Cottet V, González CA, Luján-Barroso L,Agudo A, Trichopoulou A, Lagiou P, Trichopoulos D, Peeters PHM,et al. Adherence to the Mediterranean diet and risk of breast cancer inthe European Prospective Investigation into Cancer and Nutrition co-hort study. Int J Cancer 2013;132:2918–27.
40. Toniolo P, Van Kappel AL, Akhmedkhanov A, Ferrari P, Kato I, ShoreRE, Riboli E. Serum carotenoids and breast cancer. Am J Epidemiol2001;153:1142–7.
41. Comstock GW, Alberg AJ, Helzlsouer KJ. Reported effects of long-termfreezer storage on concentrations of retinol, beta-carotene, and alpha-tocopherol in serum or plasma summarized. Clin Chem 1993;39:1075–8.
42. Jenab M, Bingham S, Ferrari P, Friesen MD, Al-Delaimy WK, Luben R,Wareham N, Khaw KT, Riboli E. Long-term cryoconservation andstability of vitamin C in serum samples of the European prospectiveinvestigation into cancer and nutrition. Cancer Epidemiol BiomarkersPrev 2005;14:1837–40.
43. Jenab M, Riboli E, Ferrari P, Friesen M, Sabate J, Norat T, Slimani N,Tjonneland A, Olsen A, Overvad K, et al. Plasma and dietary carot-enoid, retinol and tocopherol levels and the risk of gastric adenocar-cinomas in the European Prospective Investigation into Cancer andNutrition. Br J Cancer 2006;95:406–15.
44. Druesne-Pecollo N, Latino-Martel P, Norat T, Barrandon E, Bertrais S,Galan P, Hercberg S. Beta-carotene supplementation and cancer risk:a systematic review and metaanalysis of randomized controlled trials.Int J Cancer 2010;127:172–84.
45. Jenab M, Slimani N, Bictash M, Ferrari P, Bingham SA. Biomarkers innutritional epidemiology: applications, needs and new horizons. HumGenet 2009;125:507–25.
PLASMA ANTIOXIDANTS AND RISK OF BREAST CANCER 11 of 11