Embed Size (px)
Citation preview
POLITECNICO DI MILANO
DEPARTMENT OF CIVIL AND ENVIRONMENTAL ENGINEERING
DOCTORAL PROGRAMME IN ENVIRONMENTAL AND
INFRASTRACTURE ENGINEERING
ALUMINIUM RECOVERY
FROM MSWI BOTTOM ASH
Doctoral Dissertation of:
Laura Biganzoli
Supervisor:
Prof. Mario Grosso
Tutor:
Prof. Stefano Cernuschi
The Chair of the Doctoral Program:
Prof. Ferdinando Sansò
2012- XXV Cycle


A Marco, compagno di vita,
e alla nostra principessa che porto in grembo.

Ringrazio innanzitutto Mario per la grande fiducia che mi ha
sempre dimostrato e per gli utili suggerimenti che mi ha dato
sull’impostazione del lavoro.
Ringrazio poi Lucia, Simone, Alida e Federica, che mi hanno
sopportato in questi anni, e ovviamente Giovanna, che ha
condiviso con me questo percorso.
Ringrazio poi CiAl e EAA per il supporto economico, e non
solo, senza il quale tale lavoro non sarebbe esistito. Un
ringrazio particolare va anche al Prof. Buekens, per il
puntuale lavoro di revisione effettuato su gran parte del mio
lavoro, e al Dott. Pruvost, per tutte le informazioni e
suggerimenti che mi ha fornito.
Un particolare ringraziamento a Alessandro, Alessandra e
Amed di Carlo Vedani Metalli.
Infine, il ringrazio più grande alla mia famiglia e a tutti i miei
amici.

i
ABSTRACT
Recovering aluminium and other non-ferrous metals from
waste incineration bottom ash has become a common practice
in the last decades. The concentration of these metals in the
bottom ash can be higher than that in the ore, making their
recovery advantageous from an economical point of view. In
addition, significant environmental benefits are associated to
their recycling, and their separation is crucial in view of the
recovery of the inert fraction of the bottom ash.
Despite metals recovery is a common practice, the correct
design of the treatment plant is a hard task, since it requires to
know how much aluminium is in the ash and what are its main
characteristics, in terms of dimensional classification of the
lumps and of their quality, expressed by the oxidation level
and the presence of other non-ferrous metals.
During this research project, three areas regarding aluminium
recovery from the bottom ash were explored:
The aluminium behaviour in waste-to-energy furnaces.
Aluminium mass balance in waste-to-energy (WTE)
plants was experimentally investigated, allowing to
estimate the actual amount of aluminium present in the
bottom ash in the metallic form, i.e. its recoverable
form;
The recovery of aluminium from the bottom ash fine
fraction (< 5 mm);
The perspective for aluminium recovery from bottom
ash in Italy in the next 10-20 years.
The estimation of the aluminium mass balance in the furnace of
ii
waste-to-energy plants and of its partitioning in the residues of
the combustion process is fundamental to assess the actual
amount of aluminium that can be recovered from the bottom
ash. In fact, current technologies are able to recover only the
aluminium fragments bigger than 1 mm. In addition, during the
combustion process, the scraps contained in the waste undergo
degradation and oxidation processes that determine a loss of
their recoverable mass from the bottom ash. Thus, the
knowledge of the oxidation level of the aluminium in the
combustion residues is another necessary information.
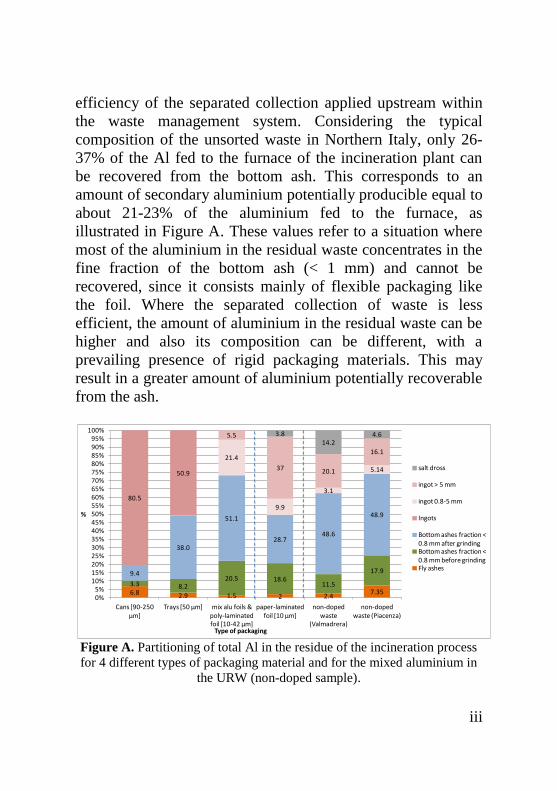
The extent of the fragmentation and oxidation processes that
take place during combustion is strictly related to the structure
and the mechanical properties of the material. The
experimental investigation conducted within the research
project in two full-scale WTE plants shows that the recovery of
aluminium from the incineration residues increases
proportionally to aluminium thickness in the tested Al input
raw materials, as illustrated in Figure A. About 81% of the
aluminium in the cans can be recovered from the bottom ash
and then recycled as secondary aluminium, but this amount
decreases to 51% when trays are considered, 27% for a mix of
aluminium and poly-laminated foils and 47% for paper-
laminated foils. Foils (Al thickness 10-42 μm) and trays (50
μm) are characterised by lower aluminium recovery yields if
compared with beverage cans (90-250 μm), due to a stronger
fragmentation on the combustion grate and thus the formation
of smaller lumps that are lost within the fine fractions. These
values also suggest that the paper used in the paper-laminated
foil improves the mechanical strength of the aluminium foil. In the residual waste, aluminium can be present as packaging
or as other materials (like pots, for instance). The amount of
aluminium recoverable from the bottom ash is therefore
influenced by the waste composition and, thus, by the
iii
efficiency of the separated collection applied upstream within
the waste management system. Considering the typical
composition of the unsorted waste in Northern Italy, only 26-
37% of the Al fed to the furnace of the incineration plant can
be recovered from the bottom ash. This corresponds to an
amount of secondary aluminium potentially producible equal to
about 21-23% of the aluminium fed to the furnace, as
illustrated in Figure A. These values refer to a situation where
most of the aluminium in the residual waste concentrates in the
fine fraction of the bottom ash (< 1 mm) and cannot be
recovered, since it consists mainly of flexible packaging like
the foil. Where the separated collection of waste is less
efficient, the amount of aluminium in the residual waste can be
higher and also its composition can be different, with a
prevailing presence of rigid packaging materials. This may
result in a greater amount of aluminium potentially recoverable
from the ash.
Figure A. Partitioning of total Al in the residue of the incineration process
for 4 different types of packaging material and for the mixed aluminium in
the URW (non-doped sample).
6.8 2.9 1.5 2 2.47.35
3.3 8.220.5 18.6
11.5
17.99.4
38.0
51.1
28.748.6
48.9
80.5
50.9
21.4
9.9
3.1
5.14
5.5
37 20.1
16.1
3.814.2
4.6
0%5%
10%15%20%25%30%35%40%45%50%55%60%65%70%75%80%85%90%95%
100%
Cans [90-250 μm]
Trays [50 μm] mix alu foils & poly-laminated foil [10-42 μm]
paper-laminated foil [10 μm]
non-doped waste
(Valmadrera)
non-doped waste (Piacenza)
%
Type of packaging
salt dross
ingot > 5 mm
ingot 0.8-5 mm
Ingots
Bottom ashes fraction < 0.8 mm after grindingBottom ashes fraction < 0.8 mm before grindingFly ashes
iv
Aluminium recovery from the bottom ash is particularly
difficult when the lumps produced during the combustion
process are smaller than 5 mm. In fact, the standard Eddy
current separators (ECS) for non-ferrous metals recovery
usually installed in the plants, have a good separation
efficiency only for lumps bigger than 4-5 mm. The analysis of
the bottom ash < 4 mm sampled in a Swedish WTE bottom ash
treatment plant showed that only 3% of the total aluminium in
the ash, corresponding to about 21% of the metallic aluminium,
can be potentially recovered from the ash and recycled as
secondary aluminium. Despite the modest amount of
aluminium in the fine fraction, improving metal recovery from
such a fraction, by including a grinding stage and advanced
ECS in the plant layout, is economical advantageous. In fact,
aluminium recovery yield can increase by about 200% with a
corresponding direct enhancement of revenues of about 2
Euros per ton of treated bottom ash.
Based on the recovery efficiency previously reported, a
forecasting model was developed for evaluating the amount of
aluminium scraps potentially recoverable. The model, applied
for estimating the situation expected for Italy in the years 2015
and 2020, results in prospected recoveries of about 16,300-
24,900 tonnes of aluminium in 2015, with an increase to
19,300-34,600 tonnes in 2020. This corresponds to an amount
of secondary aluminium potentially producible included
between 11,300-17,300 tonnes in 2015 and 13,400-24,000
tonnes in 2020. Considering that the bottom ash treatment
plants currently installed in Italy have a capacity less than half
of what will be needed in the future, a good opportunity of
development is present in our Country.
Extended applications of recovery options should, thus, be
considered as a viable opportunity for enhancing materials

v
recycling from waste to energy in our Country, with positive
contributions in the improvement of sustainability related
issues in the waste management sector.

vi
vii
SOMMARIO
Il recupero dell’alluminio e dei rottami non-ferrosi dalle scorie
di incenerimento dei rifiuti è diventata una pratica diffusa negli
ultimi anni. La concentrazione di tali metalli nelle scorie può,
infatti, essere superiore a quella in natura, rendendone
economicamente vantaggioso il recupero. Bisogna, inoltre,
pensare ai benefici ambientali associati al riciclo di questi
metalli e ai vantaggi tecnici della loro separazione in vista del
successivo recupero della frazione inerte delle scorie.
Sebbene il recupero dei metalli dalle scorie sia una pratica
diffusa, la corretta configurazione dell’impianto di trattamento
è piuttosto complessa. Molte informazioni sono infatti
necessarie, quali l’effettiva quantità di alluminio nelle scorie e
le sue principali caratteristiche, in termini di classificazione
granulometrica e qualità. In particolare è necessario conoscere
il livello di ossidazione dei rottami recuperabili e la presenza di
altri metalli non-ferrosi oltre all’alluminio.
Il lavoro svolto nell’ambito del progetto di ricerca ha indagato
tre aspetti fondamentali del recupero dell’alluminio dalle scorie
di incenerimento di rifiuti:
Il comportamento dell’alluminio nei forni degli
impianti di incenerimento di rifiuti urbani. E’ stato
valutato il bilancio di massa dell’alluminio, col fine di
definire la quantità di alluminio presente nelle scorie in
forma metallica e perciò recuperabile e riciclabile;
Il recupero dell’alluminio dalla frazione fine delle
scorie (< 5 mm);
I quantitativi di alluminio potenzialmente recuperabili
dalla scorie italiane in un arco temporale di 10-20 anni.
viii
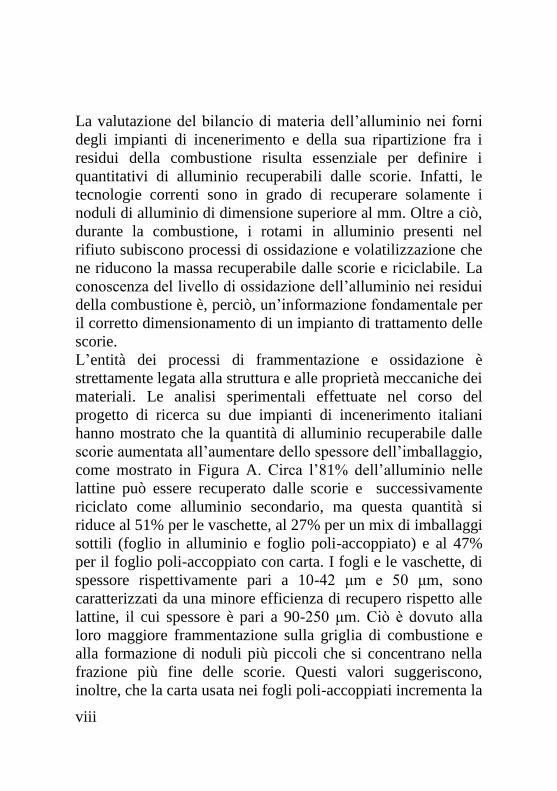
La valutazione del bilancio di materia dell’alluminio nei forni
degli impianti di incenerimento e della sua ripartizione fra i
residui della combustione risulta essenziale per definire i
quantitativi di alluminio recuperabili dalle scorie. Infatti, le
tecnologie correnti sono in grado di recuperare solamente i
noduli di alluminio di dimensione superiore al mm. Oltre a ciò,
durante la combustione, i rotami in alluminio presenti nel
rifiuto subiscono processi di ossidazione e volatilizzazione che
ne riducono la massa recuperabile dalle scorie e riciclabile. La
conoscenza del livello di ossidazione dell’alluminio nei residui
della combustione è, perciò, un’informazione fondamentale per
il corretto dimensionamento di un impianto di trattamento delle
scorie.
L’entità dei processi di frammentazione e ossidazione è
strettamente legata alla struttura e alle proprietà meccaniche dei
materiali. Le analisi sperimentali effettuate nel corso del
progetto di ricerca su due impianti di incenerimento italiani
hanno mostrato che la quantità di alluminio recuperabile dalle
scorie aumentata all’aumentare dello spessore dell’imballaggio,
come mostrato in Figura A. Circa l’81% dell’alluminio nelle
lattine può essere recuperato dalle scorie e successivamente
riciclato come alluminio secondario, ma questa quantità si
riduce al 51% per le vaschette, al 27% per un mix di imballaggi
sottili (foglio in alluminio e foglio poli-accoppiato) e al 47%
per il foglio poli-accoppiato con carta. I fogli e le vaschette, di
spessore rispettivamente pari a 10-42 μm e 50 μm, sono
caratterizzati da una minore efficienza di recupero rispetto alle
lattine, il cui spessore è pari a 90-250 μm. Ciò è dovuto alla
loro maggiore frammentazione sulla griglia di combustione e
alla formazione di noduli più piccoli che si concentrano nella
frazione più fine delle scorie. Questi valori suggeriscono,
inoltre, che la carta usata nei fogli poli-accoppiati incrementa la
ix
resistenza meccanica del foglio in alluminio.
Nel rifiuto indifferenziato, l’alluminio può essere presente sia
come imballaggio che sottoforma di altri oggetti, come
caffettiere e pentole. La quantità di alluminio recuperabile dalle
scorie è, perciò, influenzata dalla composizione del rifiuto e,
quindi, dall’efficienza della raccolta differenziata.
Considerando la tipica composizione del rifiuto indifferenziato
nel nord Italia, circa il 26-37% dell’alluminio alimentato ai
forni degli impianti di incenerimento può essere estratto dalle
scorie. Ciò corrisponde a una quantità di alluminio secondario
producibile pari a circa il 21-23% dell’alluminio alimentato al
forno, come illustrato in Figura A. Questi valori si riferiscono
ad una situazione dove, a fronte di un’efficiente raccolta
differenziata dei rifiuti urbani, la maggior parte dell’alluminio
è presente nel rifiuto indifferenziato come imballaggio sottile e
quindi si concentra nella frazione fine delle scorie (< 1 mm).
Quando la raccolta differenziata è meno efficiente, come in
altre regioni italiane, la quantità di alluminio nel rifiuto può
essere maggiore e anche le caratteristiche possono essere
diverse, con una prevalente presenza degli imballaggi rigidi. In
una tale situazione, i quantitativi di alluminio recuperabili dalle
scorie potrebbero essere superiori.
x
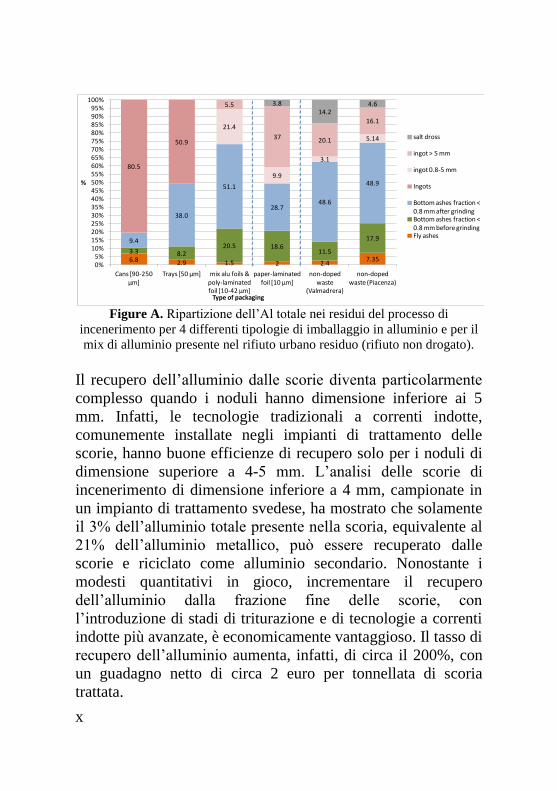
Figure A. Ripartizione dell’Al totale nei residui del processo di
incenerimento per 4 differenti tipologie di imballaggio in alluminio e per il
mix di alluminio presente nel rifiuto urbano residuo (rifiuto non drogato).
Il recupero dell’alluminio dalle scorie diventa particolarmente
complesso quando i noduli hanno dimensione inferiore ai 5
mm. Infatti, le tecnologie tradizionali a correnti indotte,
comunemente installate negli impianti di trattamento delle
scorie, hanno buone efficienze di recupero solo per i noduli di
dimensione superiore a 4-5 mm. L’analisi delle scorie di
incenerimento di dimensione inferiore a 4 mm, campionate in
un impianto di trattamento svedese, ha mostrato che solamente
il 3% dell’alluminio totale presente nella scoria, equivalente al
21% dell’alluminio metallico, può essere recuperato dalle
scorie e riciclato come alluminio secondario. Nonostante i
modesti quantitativi in gioco, incrementare il recupero
dell’alluminio dalla frazione fine delle scorie, con
l’introduzione di stadi di triturazione e di tecnologie a correnti
indotte più avanzate, è economicamente vantaggioso. Il tasso di
recupero dell’alluminio aumenta, infatti, di circa il 200%, con
un guadagno netto di circa 2 euro per tonnellata di scoria
trattata.
6.8 2.9 1.5 2 2.47.35
3.3 8.220.5 18.6
11.5
17.99.4
38.0
51.1
28.748.6
48.9
80.5
50.9
21.4
9.9
3.1
5.14
5.5
37 20.1
16.1
3.814.2
4.6
0%5%
10%15%20%25%30%35%40%45%50%55%60%65%70%75%80%85%90%95%
100%
Cans [90-250 μm]
Trays [50 μm] mix alu foils & poly-laminated foil [10-42 μm]
paper-laminated foil [10 μm]
non-doped waste
(Valmadrera)
non-doped waste (Piacenza)
%
Type of packaging
salt dross
ingot > 5 mm
ingot 0.8-5 mm
Ingots
Bottom ashes fraction < 0.8 mm after grindingBottom ashes fraction < 0.8 mm before grindingFly ashes
xi
Basandosi sui tassi di recupero prima riportati, è stato
sviluppato un modello previsionale per valutare i quantitativi di
alluminio potenzialmente recuperabili dalle scorie in Italia al
2015 e al 2020. I risultati mostrano che circa 16,300-24,900
tonnellate di alluminio potranno essere recuperate nel 2015 e
questa quantità potrà aumentare a 19,300-34,600 tonnellate nel
2020. Ciò corrisponde ad un quantitativo di alluminio
secondario potenzialmente producibile incluso tra 11,300 e
17,300 tonnellate nel 2015 e 13,400-24,000 tonnellate nel
2020. La capacità di trattamento delle scorie attualmente
presente sul nostro territorio risulta, però, essere meno della
metà di quella necessaria in futuro per poter trattare tutte le
scorie di incenerimento prodotte. Il trattamento delle scorie
appare, dunque, un settore con un’elevata possibilità di
sviluppo.
Estendere le opzioni di trattamento e recupero a tutte le scorie
di incenerimento prodotte nel nostro paese può, dunque, essere
considerata come un’ottima opportunità per incrementare il
recupero e il riciclaggio di materiali nell’ambito del trattamento
energetico dei rifiuti, con ripercussioni positive sulla
sostenibilità del settore rifiuti.

xiii
LIST OF CONTENTS
1.INTRODUCTION ................................................................. 1
1.1. SCOPE OF THE WORK ........................................... 1 1.2. CONTENT OF THE THESIS .................................... 6
2. INTRODUCTION TO METALS RECOVERY FROM
BOTTOM ASH ......................................................................... 9 2.1. BOTTOM ASH TREATMENTS ............................... 9
2.2. NON–FERROUS METALS RECOVERY .............. 15 2.3. ALUMINIUM OXIDATION PROCESS IN THE
INCINERATION FURNACE ............................................ 23 3. POTENTIAL ALUMINIUM RECOVERY FROM
BOTTOM ASH IN ITALY ..................................................... 33 3.1. MODEL DEFINITION ............................................ 35 3.2. RESULTS ................................................................. 49
4. ALUMINIUM OXIDATION IN THE FURNACE OF
WTE PLANTS ........................................................................ 61 4.1. MATERIALS AND METHODS ............................. 62 4.2. RESULTS ................................................................. 77
4.2.2. Behaviour of the aluminium packaging materials 77
4.2.3. Non-doped waste................................................... 94
5. RECOVERY OF ALUMINIUM FROM THE BOTTOM
ASH FINE FRACTION ........................................................ 101
5.1. MATERIALS AND METHODS ........................... 102
5.2. RESULTS ............................................................... 108 5.2.1. Aluminium recovery ....................................... 108
5.2.2. H2 production from the bottom ash ................. 113
xiv
5.2.3. Economic and environmental considerations . 115
6. CONCLUSIONS ........................................................... 119 6.1. FURTHER RESEARCH ........................................ 123
REFERENCES...................................................................... 125 ANNEX I .............................................................................. 135
I.1. Bottom ash .............................................................. 135
I.2. Fly ash ..................................................................... 149 I.3.Bottom ash quenching water ................................... 154
I.4. Mass balance ........................................................... 155

1
1.INTRODUCTION
1.1. SCOPE OF THE WORK
About 4,600,000 tonnes of municipal waste have been
incinerated in Italy in 2009, with the production of about
1,200,000 tonnes of bottom ash (ISPRA, 2011). The growing
cost of landfilling and the need for reducing the exploitation of
natural resources have promoted in the last few years in Europe
a fervent research activity on bottom ash treatments aimed at
the recovery of metals and at the reuse of the inert fraction,
essentially in the cement and concrete industry, as well as in
road construction.
These considered treatments are physical, chemical or thermal
ones, such as:
Physical separation of the fine (more polluted) fraction
with screens or drums;
Extraction of metals through magnetic and eddy current
separators;
Washing with water or chemical solvents to remove
soluble heavy metals and salts;
Ageing process to promote the transformation of
bottom ash constituents into more thermodynamically
stable forms;
Addition of Al (III) or Fe (III) salts and cements or
other bonding agents to reduce the metal mobility
through leaching;
Vitrification or sintering to immobilize heavy metals
2
into an amorphous glassy phase.
Whatever treatment is used, the recovery of ferrous and non-
ferrous metals is an essential step, for both the environmental
advantage of metal scraps recycling and the reduction of the
negative effects that metals have in some applications
including road construction and concrete production (Pecqueur
et al., 2001; Muller et al., 2006). Furthermore, the sale of metal
scraps represents a significant source of income for bottom ash
treatment plants.
However, metals recovery from the bottom ash, and especially
the recovery of the non-ferrous fraction, is not an easy task.
Achieving a good efficiency of metals separation from the ash
needs a proper design of the bottom ash treatment plant, that
can become expensive when designed for the recovery of the
scraps < 4-5 mm.
A first question can thus rise:
Considering that the separated collection is well
established in Italy and in the EU Countries, and it will
further improve in the future, will be the amount of
aluminium that ends up in the residual waste and is
routed to incineration sufficient to justify such an
investment in the next 10-20 years?
The answer to this question is yes. The problem was tackled in
the research project for what concerns the Italian situation, by
developing a forecasting model aimed at evaluating the amount
of aluminium scraps potentially recoverable in Italy in the
years 2015 and 2020. The results show that about 16,300-
24,900 tonnes of aluminium might be recovered in Italy in
2015 and this amount will increase at 19,300-34,600 tonnes in
2020. Considering that the bottom ash treatment plants
currently installed in Italy have a capacity less than a half of
3
what will be needed in the future, a good opportunity of
development is present in our Country.
However the problems of metals recovery is much more
complex. Among the number of aspects that need to be
analysed, two are the main issues about aluminium recovery
from the bottom ash:
How much aluminium is present in the bottom ash in its
metallic form, i.e. in its recoverable form?
How is it possible to improve aluminium recovery from
the fine fraction (< 5 mm) of the bottom ash?
The aim of the research project was to answer the above two
questions.
During the combustion process, the scraps contained in the
waste undergo degradation and oxidation processes that
determine a loss of their recoverable mass from bottom ash.
The thinner fraction might volatilise in the furnace, then leave
the waste entrained by the flue gas and subsequently
concentrate on the surface of fly ash, both as metallic
aluminium and aluminium oxide (alumina – Al2O3). The
remaining fraction of aluminium, despite remaining in the
waste, will certainly undergo surface oxidation: a thin scale of
more or less protective oxide is formed on the surface of these
scraps, as a consequence of the reactions with oxidizing
compounds contained in the combustion flue gas, such as O2,
SO2, HCl, and molten salts which collect over the metal
surface. In this last case, even if we do not measure a reduction
of the scrap mass, its recycling potential is lowered because the
oxide cannot be recovered in the melting furnace. Such
oxidation can be further enhanced when bottom ash is
4
quenched in water after its discharge from the grate (which is
the case for the majority of waste incineration plants currently
operating in Europe). In fact, the strong thermal shock can
break down the oxidation layer, facilitating a further
degradation of the scraps. The result of all the processes
previously described is a loss of the potentially recoverable
aluminium mass, compared to what is fed to the process with
the municipal waste.
The actual oxidation level and partitioning of the metal scraps
in the incineration furnaces are not yet well known. According
to the CEN standard on energy recovery (EN 13431:2004), thin
gauge aluminium foil (up to 50 µm thick) shall be considered
recoverable in the form of energy, meaning that it is subjected
to full oxidation. However, detailed quantitative experimental
estimates are not available. Some data about the oxidation
levels of flexible and rigid aluminium packaging are reported
by Pruvost (2009), but they refer to experiments carried out in
1993 and described in a confidential report. Also Hu et al.
(2011) reported the oxidation level of aluminium scraps after
their incineration and the influence of combustion conditions
on metallic aluminium losses during the incineration process,
but they refer to laboratory tests.
During the research project, the behaviour of aluminium in the
incineration furnace was investigated to evaluate its
partitioning, both as total Al and metallic Al, in the residues of
the combustion process and to assess the amount of aluminium
potentially recoverable from the bottom ash. The study was
carried out on two Italian incineration plants that treat residual
waste. Besides investigating the behaviour of the mixed Al in
the residual waste (baseline situation), five different aluminium
packaging materials were also studied: beverage cans, trays,
spray cans, aluminium foil and aluminium poly-laminated foil.
The choice of studying aluminium packaging behaviour was
5
based on two considerations: aluminium packaging items are
the principal component of aluminium in the waste; in addition
their fate in the furnace has important implications for the
management of this material, in term of material and energy
recovery.
A non negligible amount of aluminium can be found in the
bottom ash fraction below 5 mm. The recovery of such fine
fraction is possible only when advanced treatment technologies
are applied to the bottom ash, including sieving and grinding
stages. In fact, standard eddy current separators (ECS) show an
average recovery rate of 30%, which drops from almost 100%
for particles larger than 20 mm to virtually zero for particle
size between 5 and 12 mm, depending on the number of
screening steps and on the plant layout and complexity
(Berkhout et al., 2011). On the contrary, advanced systems
such as wet ECS, magnetic separator and backward operating
ECS (Zhang et al., 1999; Settimo et al., 2004; Fraunholcz et al.,
2002), included within advanced bottom ash treatment plants
comprising several stages of sieving and crushing, might allow
to reach higher recovery rates. Muchova and Rem (2007) and
Manders (2008) report that some advanced technologies can
allow Al recovery rates up to 70%.
This aspect was investigated in the research project by
evaluating the amount of Al recoverable from the bottom ash
fraction < 4 mm. The investigation was carried out in Sweden,
at the Department of Water Resources Engineering of Lund
University, and due to the difficulty of recovering the small
particles, the alternative to recover H2 from the bottom ash was
also investigated. In fact, metallic Al in the bottom ash can
react with water releasing H2 gas. In normal conditions, during
bottom ash storage, H2 production can pose a safety problem
(Mizutani et al., 1999). On the contrary, when the reaction is
6
promoted in a controlled environment, the recovered H2
represents a resource, since it can be used as a clean fuel.
1.2. CONTENT OF THE THESIS
The thesis is divided in 6 chapters:
- Chapter 1 briefly defines the topic and the aim of the
research project;
- Chapter 2 gives a short introduction to bottom ash
treatments for metals recovery, including some
information on the oxidation processes that the
aluminium scraps undergo in the furnace;
- Chapter 3 deals with the Italian situation about
aluminium recovery from the bottom ash, explaining
the forecasting model used to estimate the amount of
aluminium potentially recoverable from the ash in the
years 2015 and 2020;
- Chapter 4 reports the results of the experimental tests
carried out on selected aluminium packaging materials
to investigate their behaviour in the furnace of waste-to-
energy plants;
- Chapter 5 investigates the recovery of aluminium from
the fine fraction of the bottom ash (< 4 mm);
- Chapter 6 shows the overall outcome of the thesis and
gives suggestions and recommendations for further
research.
The research presented in this thesis is partially summarised in
5 papers:
- Grosso, M., Biganzoli, L., Rigamonti, L. (2011). A
7
quantitative estimate of potential aluminium recovery
from incineration bottom ashes. Resources,
conservation and recycling 55, 1178-1184
- Biganzoli, L., Gorla, L., Nessi. S., Grosso, M. (2012).
Volatilisation and oxidation of aluminium scraps fed
into incineration furnaces. Waste Management 32,
2266-2272
- Biganzoli, L., Ilyas, A., van Praagh, M., Persson, K.,
Grosso, M. (2013). Aluminium recovery vs. hydrogen
production as resource recovery options for fine MSWI
bottom ash fraction. Waste Management. DOI:
10.1016/j.wasman.2013.01.037
- Biganzoli, L., Grosso, M., Forte, F. (2013). Aluminium
mass balance in waste incineration and recovery
potential from the bottom ash: a case study. Waste and
Biomass Valorization. DOI: 10.1007/s12649-013-9208-
0
- Biganzoli, L., Grosso, M. (2012). Aluminium recovery
from waste incineration bottom ash and its oxidation
level. Waste Management and Research (submitted)
In addition, the following publications were produced during
the PhD study:
- Biganzoli, L., Grosso, M., Giuliano, M., Campolunghi,
M. (2012). Chemical and sewage sludge co-incineration
in a full-scale MSW incinerator: toxic trace element
mass balance. Waste Management and Research 30,
1081-1088
- Grosso, M., Biganzoli, L., Rigamonti, L., Cernuschi, S.,
Giugliano, M., Poluzzi, V., Biancolini, V. (2012).
Experimental evaluation of PCDD/Fs and PCBs release
and mass balance of a WTE plant. Chemosphere 86,
293-299

9
2. INTRODUCTION TO METALS RECOVERY
FROM BOTTOM ASH
2.1. BOTTOM ASH TREATMENTS
Bottom ash is the main residue, in quantitative terms, of MSW
incineration. Its production depends on the inert content of
incinerated waste and on the type of furnace technology and
bottom ash extraction system. For grate furnaces, two bottom
ash extraction systems can be applied: wet and dry. In the wet
system, bottom ash is quenched in a water bath after its
discharge from the furnace. This is the most popular
technology, used in most of the European incineration plants.
However it has the disadvantage of increasing the moisture of
the bottom ash and thus its mass. The average production of
bottom ash is, in fact, 15-25% in mass of the incinerated waste
for the wet extraction system and 12-20% for the dry one.
The composition of the bottom ash is similar to that of the
gravel, especially of the igneous rocks like granites and basalts,
with the silicates and the alumina-silicates of Ca, Mg and Fe
which are the main constituents, as reported in Table 2.1.
Usually silicates and oxides constitute the coarse fraction
whereas sulphates, carbonates and most of the heavy metals are
the main components of the fine fraction (Marchese et al.,

10
2005). Moreover, bottom ash has a pozzolanic behaviour,
typical of the amorphous or partially crystalline materials. All
these factors make it suitable in principle to be used as a
construction material.
However, compared to natural gravel, bottom ash has a more
heterogeneous size distribution and, above all, it has a higher
concentration of metals, as reported in Table 2.2. This requires
some treatments to increase its mechanical properties, in view
of the recovery of the inert material, as well as to improve its
environmental properties, preventing the negative
environmental impacts that a direct reuse of the raw bottom ash
can cause due to its high content of heavy metals and polluting
agents.
These treatments include physical, chemical or thermal
processes.
Table 2.1. Principal mineral compounds in bottom ash. Value are expressed
as % of the bottom ash mass (ADEME, 2008).
Al2O3 CaO Fe2O3 K2O MgO MnO N2O P2O5 SiO2
8.66± 6.25
17.68± 15.37
8.68± 2.84
1.08± 0.78
2.52± 2.10
0.12± 0.08
4.73± 2.84
1.26± 0.88
48.40± 41.13
Table 2.2. Concentration of heavy metals in bottom ash according to the
literature (Biganzoli, 2008).
Metal
(μg g-1)
As Cd Cr Hg Ni Pb Sb Zn
1.4-
114
0.25-
11
0.5-
1800 0.06-0.9
28-
800 194-5000 10-147.5
300-
8890
Physical separation
Physical separation includes size classification and separation
of specific materials, like metals, from the bulk stream of the
bottom ash.
Size classification is a fundamental step in a bottom ash
treatment plant and allows to isolate the more contaminated
fine fractions, upgrading the quality of the residual stream. In
11
addition, this treatment is preparatory for metals separation,
improving the efficiency of the ferrous and non-ferrous scraps
recovery.
Size classification can be performed through both dry and wet
processes. Dry separation operates with standard drums or flat
deck screens with a typical mesh size of 20-50 mm and 2-10
mm. Wet separation can be performed through dense medium
separation or attrition washing. Compared to dry separation,
the presence of water allows the extraction of soluble
constituents, improving the bottom ash quality, but it generates
more fine material to be disposed off and requires the
subsequent water treatment (Polettini et al., 2007).
Ferrous and non-ferrous scraps can be separated from the
bottom ash by using magnets and eddy-current separators.
Their recovery is an essential step of the bottom ash treatment
process, both for the environmental advantage of metal scraps
recycling and for the reduction of the negative effects of metals
like Al, Fe and Zn which can result in swelling and expansion
in some applications like road construction and concrete
production (Baun et al., 2007; Polettini et al., 2007).
Ferrous and non ferrous metals are present in the bottom ash in
a range of 7-15% and 1-2%, respectively (Sabbas et al., 2003;
Baun et al., 2007). Non ferrous metals consist of aluminium,
for more than 60%, and copper, brass and precious metals,
such as gold, in minor quantity.
The recovery rates of ferrous and non ferrous metals from the
bottom ash is equal to about 60-80% and 25-35% of their
amount in the waste, respectively. More detailed information
about non-ferrous metals recovery is reported in Chapter 2.2.
Chemical separation
After the physical separation, bottom ash can be treated to
remove salts and heavy metals.

12
Washing with water is a common and simple treatment to be
performed after a dry size classification. This treatment allows
to remove the soluble components like chloride, sodium and
sulphate. The removal efficiency of sulphate is, however,
usually insufficient to comply with the leaching level required
by the regulation. To improve sulphate solubilisation, NaHCO3
or CO2 can be used in the washing solution, improving the
precipitation of Ca as carbonate in place of sulphate forms
(Polettini et al., 2007).
For what concerns heavy metals, the efficiency of the process
is usually low, since fresh bottom ash is an alkaline material
and the pH of the resulting fresh bottom ash/water suspension
is typically included between 9.5 and 12, corresponding to the
range of minimum solubility for most metal species. A certain
metal extraction capability may be observed towards Cu and to
some extent Cr and Pb, but always inadequate to reduce
leaching below regulatory limits. To improve metals leaching,
CO2 can be added during water washing, with positive effects
on Cu, Ni and Zn (Polettini et al., 2007; Ragaglia, 2004;
Polettini et al., 2005).
Chemical extraction can reach a better performance when
inorganic acids (like hydrochloric, nitric or sulphuric acid),
chelating agents (like nitrilotriacetate (NTA), ethylendiamine-
tetraacetate (EDTA), diethylentriaminepentaacetate (DTPA)),
and saponins are used in substitution of the water. The
extraction process usually involves one to three extraction
steps, followed by one to three distilled water washing steps to
remove the excess of the chemical agents used for the
treatment.
13
Chemical stabilisation
The aim of these treatments is to promote the formation of low-
solubility minerals, thermodynamically and geochemically
stable.
A first stabilisation can be performed through the natural
weathering: bottom ash is stockpiled under atmospheric
conditions for 3-12 months, eventually irrigated with water.
Reactions of hydrolysis, dissolution/precipitation,
neutralisation, redox, carbonation, surface complexation,
surface precipitation, adsorption1 take place when the ash
comes in contact with the atmospheric agents (water, oxygen
and CO2) and promote the mineralogical transformation of the
ash and the decrease of pH from 11-12 to 8-10. This modifies
the leaching-controlling mechanisms, altering the release of the
principal ions and trace elements from bottom ash, thus
reducing the leaching phenomena during the ash recovery or
disposal. The main alterations of the composition and of the
leaching and geotechnical properties take place within five
months, when the pH decreases, the organic matter is degraded,
the chlorates are washed and the carbonates precipitate.
The acceleration of the process can be achieved by flushing the
bottom ash with a gas stream enriched in CO2. This process is
called accelerated carbonation. It can be performed under dry
1 The main weathering reactions are:
Carbonation: CO2 (gas) + Ca(OH)2 CaCO3 + H2O (Eq. 2.1)
Sulphate destabilization: CaSO4 Ca2+
+ SO42-
(Eq. 2.2)
CaSO4*H2O Ca2+
+ SO42-
+ H2O (Eq. 2.3)
Formation of hydrocalcite (Ca2Al(OH)6[Clx(OH)x]*3H2O) (Eq. 2.4)
Formation of ettringite (Ca6Al(SO4)3(OH)12*26H2O) (Eq. 2.5)
14
conditions, injecting the CO2 flux through the bottom ash
stockpiles, or wet conditions, working on a slurry solution of
bottom ash and water. In the first case, the time needed to
stabilise the ash is in the order of about one month and the
modifications of the physical and chemical characteristics of
the ash are similar to those of the natural weathering. The time
is further shortened when the ash is mixed with water.
However, in this case, the results can significantly change
according to the applied L/S ratio. When a high L/S ratio (5-20
on weight) is used, the treatment is more similar to a chemical
washing of the ash, promoting the release of the metals, than to
a weathering process (Rendek et al., 2006; Fernandez-Bertos et
al., 2004; Costa et al., 2007).
A true chemical stabilisation can be achieved with the addition
of species capable of increasing the sorption properties of the
material, with positive effects of metals immobilisation. Al(III)
and Fe(III) salts promote Cu and Cr and Sb oxides
immobilisation through the precipitation of Al and Fe
(hydr)oxides, but they do not have any effect on Ni, Zn, Ca, Na
and Mn (Comans et al., 2000; Polettini et al., 2005). Soluble
phosphates induce the surface sorption of metals onto
phosphate phases and their precipitation as apatites (Crannel et
al., 2000; Ragaglia, 2004).
Blending with cement or other binders is also a process that
can be applied to the bottom ash, in order to reduce the
leaching of heavy metals. Bottom ash has in fact a pozzolanic
behaviour, making it suitable to be used in concrete production
or as a construction material.
Thermal treatments
The principal thermal treatments applied to the bottom ash are
sintering and vitrification. Their aim is to reduce the volume of
the residues and to improve their characteristics in term of

15
mechanical strength, porosity, water adsorption, chemical
stability and leaching of contaminants (Polettini et al., 2007).
Vitrification is performed at 1000-1500°C; the bottom ash is
melted and a homogenous liquid phase is generated, which is
rapidly cooled producing an amorphous glassy phase. Sintering
is conducted at a temperature of about 900°C, below the
melting point of the main bottom ash constituents. The
contaminants are bounded into a low porosity and high
resistance solid phase. In both treatments, a particular attention
must be reserved to the high volatile metals (Hg, As, Cd, Zn)
and some organic compounds like the PAH, which can
volatilise at temperatures from 800°C to 1300°C (Kuo et al.,
2003).
The high energy consumption and thus the high costs have
limited the applicability of these technologies in Europe.
However, the vitrification and the sintering of the bottom ash
can be achieved contextually to the waste treatment in other
waste-to-energy technologies than incineration, like in
gasification and in pyrolysis, reducing the overall costs of
waste and bottom ash treatment.
2.2. NON–FERROUS METALS RECOVERY
The treatments applied to the bottom ash to make its reuse
possible and safe from an environmental point of view include
in all cases the removal of the metal scraps. While ferrous
metals separation has a longer tradition, in recent years the
recovery of the non-ferrous fraction has also become a quite
common practice (Astrup et al., 2007), fostered by the avoided
problems of swelling and expansion that metals, especially
aluminium, cause when bottom ash is reused in concrete
production or in road construction (Pecqueur et al., 2001;
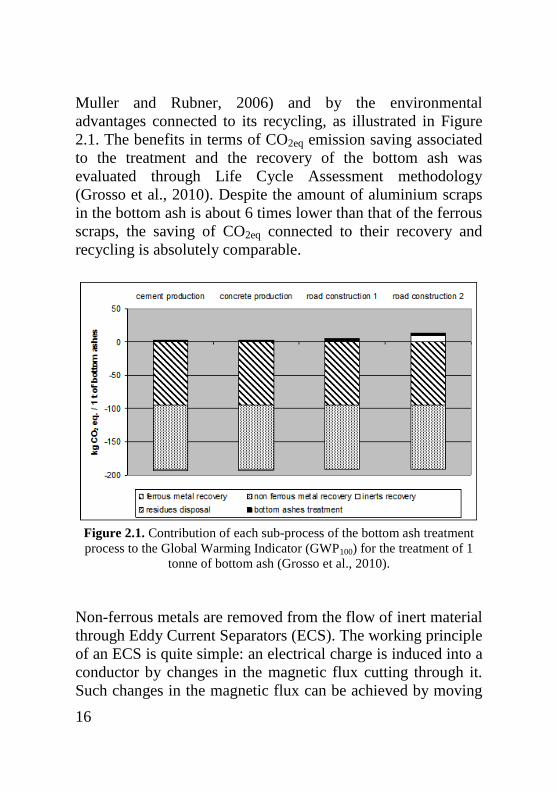
16
Muller and Rubner, 2006) and by the environmental
advantages connected to its recycling, as illustrated in Figure
2.1. The benefits in terms of CO2eq emission saving associated
to the treatment and the recovery of the bottom ash was
evaluated through Life Cycle Assessment methodology
(Grosso et al., 2010). Despite the amount of aluminium scraps
in the bottom ash is about 6 times lower than that of the ferrous
scraps, the saving of CO2eq connected to their recovery and
recycling is absolutely comparable.
Figure 2.1. Contribution of each sub-process of the bottom ash treatment
process to the Global Warming Indicator (GWP100) for the treatment of 1
tonne of bottom ash (Grosso et al., 2010).
Non-ferrous metals are removed from the flow of inert material
through Eddy Current Separators (ECS). The working principle
of an ECS is quite simple: an electrical charge is induced into a
conductor by changes in the magnetic flux cutting through it.
Such changes in the magnetic flux can be achieved by moving
17
permanent magnets past a conductor. The effect of these
currents is to induce a secondary magnetic field around the
particle; this field reacts with the magnetic field of the rotor,
resulting in a combined driving and repelling force that literally
ejects the conducting particle from the product stream. In most
of the ECS systems, a high speed magnetic rotor is fitted within
a non-metallic drum which travels much more slowly than the
rotor so as to produce flux variations at the surface of the drum;
the drum also acts as the head pulley of the conveyor carrying
the product to be separated. When the conducting particles (any
metallic objects) are carried by the conveyor over the drum, the
magnetic field passing through the particles induces currents
into them. Since these particles are of random shapes, it is
difficult for the induced current to flow within them in an
orderly manner and the currents therefore tend to swirl around
within the particles, hence eddy current. Non-ferrous metals, in
contact with the magnetic field, are rejected with a force that is
proportional to the ratio between their conductivity and their
specific weight and pushed away with different trajectories
from those of the inert material, whose stream is collected
separately.
The ECS machine requires a proper calibration, performed on
the basis of the size of the material to be separated. Higher
yields are obtained with pieces sizes included between 5 mm
and 15 cm, and for material flows below 15 tonnes h-1
(Maglio,
2003). For these reasons, the first stage of size classification is
essential in order to obtain different material flows of similar
size, with a magnetic separator and an ECS sequentially
located on each stream.
The recovery efficiencies of non-ferrous scraps from the
bottom ash, as reported by different authors, are compiled in
Table 2.3. On average, standard ECS show a 30% recovery
efficiency with respect to the aluminium fed into the furnace of
18
the WTE plant, which corresponds on average to 1% of the
bottom ash mass. However, some advanced technologies such
as wet eddy current separators (WECS), Magnus ECS,
backward operating ECS (Zhang et al., 1999; Settimo et al.,
2004; Fraunholcz et al., 2002), included within advanced
bottom ash treatment plants comprising several stages of
sieving and crushing, can reach higher recovery rates by
improving the selective separation of small non-ferrous metal
particles below 2-5 mm (De Vries et al., 2009).
The working principle of these devices is here briefly
described. Backward operating ECS is a standard separator
whose magnetic drum rotated in the “backward” or
counterclockwise manner. Zhang et al. (1999) showed that, if it
is difficult to separate small metal particles from the non-metal
stream when the magnetic drum rotates in the “forward” mode,
the yield improves drastically when it rotates in the opposite
direction. The Magnus ECS working is based on the “Magnus
effect”: a spinning particle moving through a fluid experiences
a force perpendicular both to its direction of motion and to the
axis of rotation, as illustrated in Figure 2.2 (Fraunholcz et al.,
2002). This effect can be used to recover small non-ferrous
metal particles from the bulk stream (both wet and dry). The
Magnus separation process consists of passing a feed stream to
a fast-spinning magnet in order to create a selective rotation of
the non-ferrous particles so as to deflect away from the stream
by the Magnus effect. Since this force derives from the fluid
around the particles, it is not necessary to feed the material in a
monolayer (Settimo et al., 2004). In a wet ECS, the water
allows to glue all the particles to the belt surface. For small
particles, this adhesive force is of the same order of magnitude
as gravity. Without the action of the rotor, therefore, virtually
all particles would stick to the belt and end up in the non-metal
fraction. However, the rotating magnetic field makes the metal

19
particles (both the ferrous and the non ferrous particles) spin,
with the effect that the water bonds between these particles and
the belt are broken. If the magnetic attraction on the ferrous
particles is sufficiently large, these will remain in the surface of
the belt, but the non-ferrous metal particles will be liberated at
some point and follow more or less the same path of a
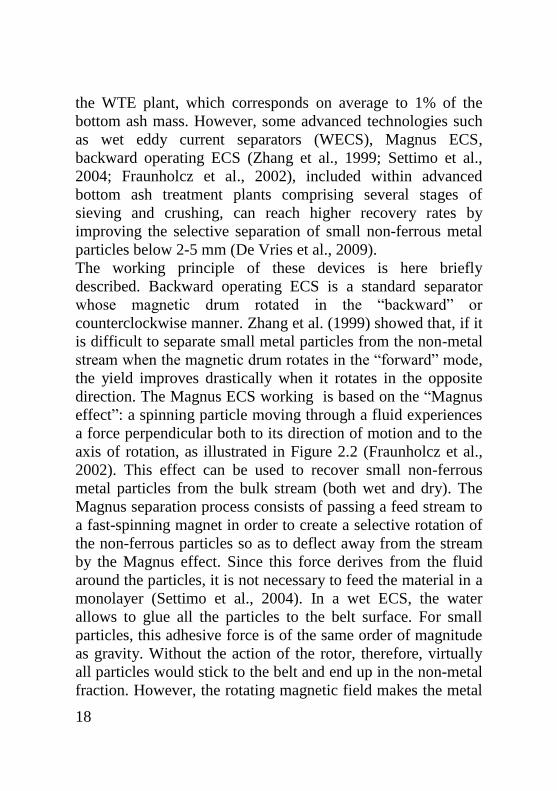
traditional ECS, as illustrated in Figure 2.3. On the contrary,
the adhesive force is strong enough to keep most of the non-
metal particles glued to the belt surface. Since the force
necessary to break the adhesive forces is small, poorly
conductive and heavy non-ferrous particles are also recovered
(Settimo et al., 2004).
Figure 2.2. Force diagram for a particle that rotated at an angular velocity
Ω while settling with a linear velocity V with respect to a fluid. FL is the lift
force and FD is the drag force (Fraunholcz et al., 2002).
20
Figure 2.3. Wet magnetic separation with a counter-rotating magnet rotor.
Non-metals end up in compartments I, II and III; ferrous metals in
compartments I and II (Settimo et al., 2004).
From an economical point of view, the higher investment
required for advanced bottom ash treatment plants, primarily
due to the introduction of a grinding stage and the presence of
one eddy current for each size stream, is justified by the
increase of aluminium recovery, as reported by Kohaupt
(2011). For small incineration plants, which cannot afford such
an investment, a good option might be the collaboration with a
centralised bottom ash treatment plant, which serves several
incineration plants, or with mobile treatment plants.
However, the recovery efficiency of aluminium scraps does not
only depend on the ECS technologies or the bottom ash
treatment layout. It is strictly related to the type of aluminium
material that is present in the waste, if it is mainly present as
packaging or not and which type of packaging item. Where the
aluminium source separation level implemented in the
upstream management system is modest, the unsorted waste
can contain a significant amount of rigid aluminium packaging
items (like cans and spray cans), whose recovery from the

21
bottom ash is quite easy, as illustrated in Chapter 4 of this
thesis. On the contrary, where an effective separated collection
is implemented also for the metals, most of the aluminium in
the unsorted waste is present as flexible packaging (foil and
poly-laminated foil), whose recovery is complex with standard
technologies. Data reported in Table 2.3 should, thus, be
interpreted according to the waste collection system
implemented in the country of analysis at the time of the paper
publication. In addition, the procedure used for the evaluation
of the ECS efficiency is not always clearly explained and
sometimes these values refer to the total of non-ferrous metals,
without considering the sole aluminium fraction and its
pureness. This makes quite complex the correct interpretation
of the data in Table 2.3 and their comparison.
22
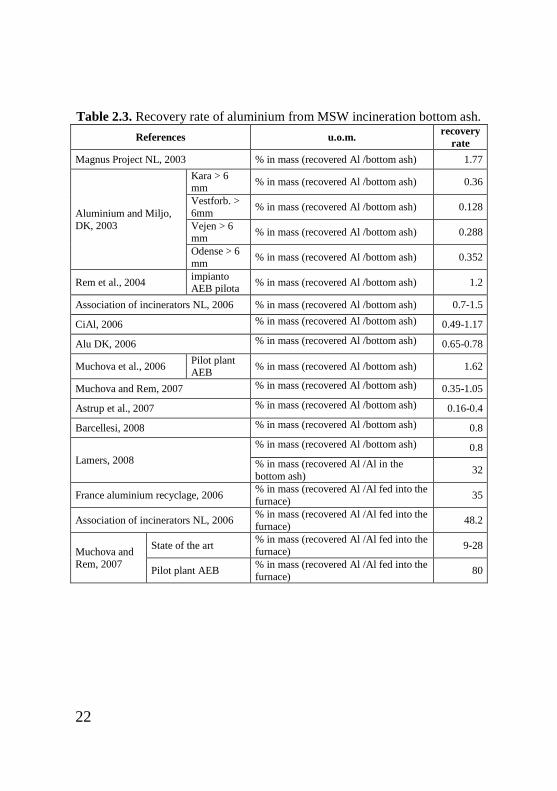
Table 2.3. Recovery rate of aluminium from MSW incineration bottom ash.
References u.o.m. recovery
rate
Magnus Project NL, 2003 % in mass (recovered Al /bottom ash) 1.77
Aluminium and Miljo,
DK, 2003
Kara > 6 mm
% in mass (recovered Al /bottom ash) 0.36
Vestforb. >
6mm % in mass (recovered Al /bottom ash) 0.128
Vejen > 6 mm
% in mass (recovered Al /bottom ash) 0.288
Odense > 6
mm % in mass (recovered Al /bottom ash) 0.352
Rem et al., 2004 impianto AEB pilota
% in mass (recovered Al /bottom ash) 1.2
Association of incinerators NL, 2006 % in mass (recovered Al /bottom ash) 0.7-1.5
CiAl, 2006 % in mass (recovered Al /bottom ash) 0.49-1.17
Alu DK, 2006 % in mass (recovered Al /bottom ash) 0.65-0.78
Muchova et al., 2006 Pilot plant AEB
% in mass (recovered Al /bottom ash) 1.62
Muchova and Rem, 2007 % in mass (recovered Al /bottom ash) 0.35-1.05
Astrup et al., 2007 % in mass (recovered Al /bottom ash) 0.16-0.4
Barcellesi, 2008 % in mass (recovered Al /bottom ash) 0.8
Lamers, 2008
% in mass (recovered Al /bottom ash) 0.8
% in mass (recovered Al /Al in the
bottom ash) 32
France aluminium recyclage, 2006 % in mass (recovered Al /Al fed into the
furnace) 35
Association of incinerators NL, 2006 % in mass (recovered Al /Al fed into the
furnace) 48.2
Muchova and
Rem, 2007
State of the art % in mass (recovered Al /Al fed into the
furnace) 9-28
Pilot plant AEB % in mass (recovered Al /Al fed into the
furnace) 80
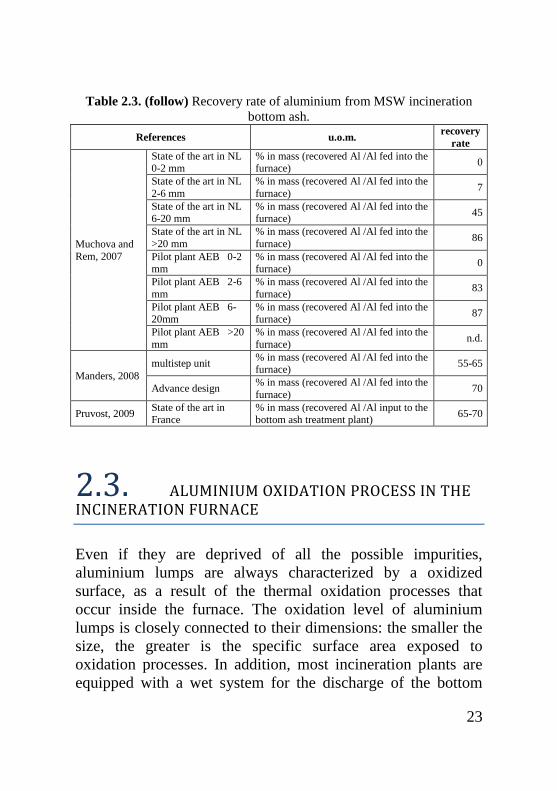
23
Table 2.3. (follow) Recovery rate of aluminium from MSW incineration
bottom ash.
References u.o.m. recovery
rate
Muchova and
Rem, 2007
State of the art in NL 0-2 mm
% in mass (recovered Al /Al fed into the furnace)
0
State of the art in NL
2-6 mm
% in mass (recovered Al /Al fed into the
furnace) 7
State of the art in NL 6-20 mm
% in mass (recovered Al /Al fed into the furnace)
45
State of the art in NL
>20 mm
% in mass (recovered Al /Al fed into the
furnace) 86
Pilot plant AEB 0-2 mm
% in mass (recovered Al /Al fed into the furnace)
0
Pilot plant AEB 2-6
mm
% in mass (recovered Al /Al fed into the
furnace) 83
Pilot plant AEB 6-20mm
% in mass (recovered Al /Al fed into the furnace)
87
Pilot plant AEB >20
mm
% in mass (recovered Al /Al fed into the
furnace) n.d.
Manders, 2008
multistep unit % in mass (recovered Al /Al fed into the furnace)
55-65
Advance design % in mass (recovered Al /Al fed into the
furnace) 70
Pruvost, 2009 State of the art in
France
% in mass (recovered Al /Al input to the
bottom ash treatment plant) 65-70
2.3. ALUMINIUM OXIDATION PROCESS IN THE INCINERATION FURNACE
Even if they are deprived of all the possible impurities,
aluminium lumps are always characterized by a oxidized
surface, as a result of the thermal oxidation processes that
occur inside the furnace. The oxidation level of aluminium
lumps is closely connected to their dimensions: the smaller the
size, the greater is the specific surface area exposed to
oxidation processes. In addition, most incineration plants are
equipped with a wet system for the discharge of the bottom
24
ash, meaning that the bottom ash is quenched in a water bath.
The contact with water during the quenching of the bottom ash
causes the oxide scale to break up very easily because of the
strong thermal shock, thus exposing the underlying layer of
metallic aluminium to further oxidation and significantly
lowering its potential recovery, similarly to what happens to
ferrous scraps (Lopez-Delgado et al., 2003). The presence of
aluminium oxide in the scraps promotes the formation of foams
during the melting process because the oxide is characterized
by a lower density than aluminium. As it happens in the
production of secondary aluminium, foams are removed but,
along with them, part of the molten aluminium is inevitably
lost. For this reason, aluminium lumps resulting from bottom
ash treatments are fed in small percentages to the saline
furnaces for the production of secondary aluminium, excluding
the finest material in order to avoid dramatic drops in terms of
recovery yields.
The present chapter describes the oxidation processes that
involve the aluminium scraps in the incinerator furnaces.
Aluminium corrosion in high-temperature oxidizing
atmospheres
Alumina (Al2O3) is the only thermodynamically stable solid
oxide of aluminium. The oxide can exist in various forms: the
most common forms are the γ and the α phases, but also δ-
Al2O3 has been identified in scales formed at 900°C. The γ is
the stable phase at temperatures below 900-950°C and it turns
into the α phase when it is heated to high temperatures (above
900-1000°C), at which the α phase, called corundum, is the
thermodynamically stable modification. The reverse
transformation, however, does not take place on cooling.
Although Al2O3 is the only stable solid oxide of aluminium, the
vapour species at high temperatures comprise Al2O and AlO.
25
The α-alumina is characterized by a low concentration of
electronic and ionic defects and, as a consequence, the
transport of the reactants forming the oxide (metal cations and
oxygen anions) through the scale is very slow. Probably this is
related to the fact that this oxide has a large band gap (950-
1050 kJ/mol) and high lattice energy.
With regard to the oxide scale growth, Al2O3 scales have
constant ionic conductivity in the pressure range 1-10-15
atm of
O2, while electronic conductivity predominates at lower
oxygen pressures. This suggests that part of the oxide growth is
governed by electron transport. However, the growth of
alumina scales is more complicated and the transport of the
reactants in all probability takes place along grain boundaries.
Inward oxygen transport seems to be the principal mechanism
for scale growth, however the wrinkling and convolutions of
alumina scales suggest that oxide formation takes place also
within the scales and that some outward diffusion of
aluminium occurs. Furthermore, it is important to notice that
diffusion in poly-crystalline samples is appreciably higher than
that in single-crystal specimens.
During the initial stage of oxidation, aluminium develops a
transient, metastable scale (γ and δ alumina), which grows
more rapidly than α-Al2O3. The metastable alumina species
have lower density than α-Al2O3 and their transformation in α-
Al2O3 is accompanied by a 13% reduction in volume (Young,
2008).
Thanks to the formation of Al2O3 protective scale, aluminium
is generally used in alloy with other elements such as
chromium and silicon, to reduce the effects of corrosion
process. Alumina scales generally provide better oxidation
resistance and lower oxidation levels than chromia scales,
especially at high temperatures. Instead, for temperatures
below 800°C the aluminium-forming alloys are more

26
susceptible to corrosion than the chromia-forming ones. This
can be explained by considering that the transient scales
forming on alumina-forming alloys contain a larger proportion
of spinel phase than chromia-forming alloys and, moreover,
that the alumina formed in this range of temperature does not
consist of the highly protective α-Al2O3, but rather of the less
protective γ-Al2O3. Alumina does not suffer from oxidative
evaporation and alumina-forming alloys can be used at higher
temperatures than chromia-forming alloy, from an oxidation
point of view. Furthermore, the capacity of alumina to delay
sulphidation is better than that of chromia, but the duration of
the protective period also depends on the adhesion and
mechanical integrity of the scales and the nature of the
sulphidizing environment. In presence of molten Na2SO4,
alumina may dissolve through both acid and basic mechanisms,
following the reactions:
Al2O3 + 3SO3 = 2Al3+
+ 3SO42-
(Eq. 2.6)
Al2O3 + O2-
= 2AlO2-
(Eq. 2.7)
However, Al2O3 is very stable towards basic fluxing and,
moreover, for combustion gases at high temperatures, even
those containing up to several percentages of SO2, the SO3
level probably never becomes sufficiently high for acid fluxing
to constitute an important problem.
Corrosion of aluminium is also affected by the morphology and
composition of the item/scrap (Soler et al., 2007). The
concentration of alloying elements modifies the oxidation
behaviour of the item/scrap. Certain elements strengthen the
protective properties of the oxide film by forming mixed
oxides, while others, on the contrary, promote aluminium
oxidation. Tenorio and Espinosa (2000) compared the
oxidation behaviour of two aluminium alloys used for beverage
cans. Lid is made up of the alloy AA5182, which is composed
27
for 4-5% of Mg, for 0.2-0.3% of Mn, for 0.2% of Si and for
0.35% of Fe, whereas the body of the can is made up of the
alloy AA3004, composed for 0.8-1.3% of Mg, for 1-1.5 % of
Mn, for 0.3% of Si and for 0.7% of Fe. Up to temperatures of
700°C, the oxidation kinetic of the lid material is greater than
that of the body alloy due to the higher concentration of Mg,
which has a greater affinity with oxygen than aluminium.
However, for temperatures higher than 750-800°C, the
oxidation kinetic of the body changes and becomes linear. This
suggests a loss of the initial protective characteristics.
Aluminium corrosion in aqueous solutions
The fundamental reaction of aluminium corrosion in aqueous
media (Vargel, 2004) is the following:
Al + 3H2O Al(OH)3 +3/2H2 (Eq. 2.8)
Aluminium corrosion results in the formation of Al(OH)3,
which is insoluble in water and precipitates as a white gel, and
in the production of hydrogen gas. The corrosion reaction
determines the rapid passivation of aluminium, which is
recovered with an Al(OH)3 layer (Stockburger et al., 1991).
The corrosion process is more aggressive in the presence of
alkaline solutions. High pH values, in fact, can reduce
aluminium surface passivation, enhancing aluminium
corrosion. For example, in the presence of NaOH the reactions
involving aluminium are:
2Al + 6H2O + 2NaOH 2NaAl(OH)4 + 3H2 (Eq. 2.9)
NaAl(OH)4 NaOH + Al(OH)3 (Eq. 2.10)
Initially, the hydrogen generation reaction consumes sodium
hydroxide, but when the aluminate concentration exceeds the
saturation limit, the aluminate undergoes a decomposition
reaction that produces a crystalline precipitate of aluminium

28
hydroxide with the regeneration of the alkali. The presence of
OH- ions promotes the dissolution of the oxide layer according
to the reaction:
Al(OH)3 + OH- ↔ Al(OH)
-4 (Eq. 2.11)
and thus facilitates the reaction between exposed Al and water
and improves the corrosion rate (Soler et al., 2009).
The production of hydrogen can lead to another mechanism of
corrosion, named stress corrosion. This type of corrosion
results from the combined action of a mechanical stress and a
corrosive environment. The formation of an Al(OH)3 layer on
the aluminium surface traps water molecules that continue to
react with the metal to produce hydrogen (Ishii et al., 2007),
which remains under the passive layer until the pressure of the
gas is able to break it. In the presence of cracks, the oxide film
does not protect aluminium, so it reacts with water and releases
new hydrogen, which concentrates at grain boundaries and
promotes intercrystalline dechoesion.
Aluminium scraps corrosion in WTE plants
Aluminium packaging and other aluminium items contained in
the waste fed to WTE plants undergo oxidation processes in the
furnace (representing a typical high temperature oxidizing
environment).
Moreover, the amount of aluminium that is not transported by
the flue gas with fly ash concentrates in bottom ash and, when
it is quenched in water, can undergo a further corrosion
process. The strong thermal shock can lead to the breakdown
of the oxide layer, facilitating a further degradation of the
scraps. In addition, the high pH values of the quenching water
promote the dissolution of the alumina protective scale. At high
pH values, a uniform corrosion of aluminium surface takes
place because the dissolution rate of the oxide film is greater
29
than its rate of formation. This type of corrosion develops as
pits of very small diameter, in the order of a micrometer, and
results in a uniform and continuous decrease in thickness over
the entire surface area of the metal.
The type of bottom ash discharge method adopted by the WTE
plant, wet or dry, therefore can strongly influence the oxidation
rate of aluminium scraps recoverable from bottom ash and thus
their recycling efficiency. Lopez-Delgado et al. (2003)
observed that the oxidation level of ferrous scraps recovered
from bottom ash is lower when they are not quenched in water,
as in the case of fluidized bed combustion furnaces. This can
be extended with a certain probability to non-ferrous scraps.
Laboratory tests carried out by Buekens in 1993 (Pruvost,
2011) show that the oxidation level of aluminium differs from
one type of packaging to the other. On average, when the item
is exposed to a reducing atmosphere at 500°C for about 30
minutes and then to an oxidizing atmosphere for 30 minutes at
500°C and for other 30 minutes at 1100°C, the oxidation level
is included between 2% and 20%. When the item is exposed
for one hour at 800°C with shredding every 10 minutes, it is
included between 0.5% and 40%, as reported in Table 2.4.
Full-scale tests, carried out on an incineration plant equipped
with a dry extractor for bottom ash, showed that 84% of the
flexible laminates and 60% of rigid packaging can be
recovered from the bottom ash with an oxidation level of about
60% and 26% respectively, as illustrated in Table 2.5.
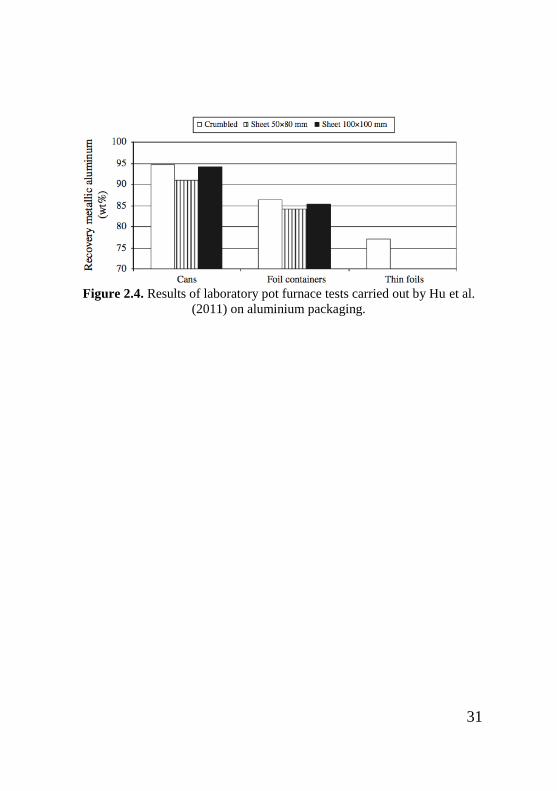
Controlled laboratory pot furnace tests, carried out by Hu et al.
(2011) using household waste with different aluminium
packaging types (thin foils, foil containers and beverage cans),
produced metallic aluminium recovery yields between 77 wt.%
and 93 wt.% (Figure 2.4), which varied as a function of the
type of packaging. In addition, the type of aluminium
30
packaging affects the resulting size distribution, while the input
shape (crumbled or sheet) has only a moderate influence.
Furthermore, the oven tests showed that physical, thermal and
chemical factors might promote metallic aluminium losses by
enhancing the oxidation processes in the furnace. The main
influencing factors were, in decreasing order, the packaging
type, combustion temperature, residence time and salt
contamination.
Table 2.4. Results of laboratory tests carried out by Buekens (1993) on
aluminium packaging (Pruvost, 2011).
Material % Al
½ h 500°C
reducing atmosphere
½ h 500°C and ½ h
1100°C oxidizing
atmosphere
1h 800°C shredding
every 10 min
Oxidation
%
Thickness
oxide µm
Oxidation
%
Thickness
oxide µm
Yoghurt lid Al 37 µm 93.9 19.4 10.8 8.2 4.6
Cheese pack Al 37 µm
PE/EVA 30µm 77.1 13.3 7.4 0.6 0.3
Blister Al 30µm PE 30 µm 74.6 11.2 5.1 10.6 4.8
Biscuit pack Al 7-9 µm
Paper 40 µm 28.4 23.6 2.9 42 5.2
Sachet Al 30µ m LDPE 30
µm Paper 40 µm 54 3.9 1.8 4.4 2
Household foil Al 7-9 µm 100 n.a. n.a. 7.8 0.9
Table 2.5. Results of full-scale tests carried out by Buekens (1993) on
aluminium packaging (Pruvost, 2011).
Residues
Flexible packaging
(Al 7μm-Paper-PE)
Rigid packaging
(aerosol containers)
Partitioning % Oxidation % Partitioning % Oxidation %
Bottom ash
84 60 61 26
Fines under the grate 10 21 39 2
Fly ash 6 13 0 -
31
Figure 2.4. Results of laboratory pot furnace tests carried out by Hu et al.
(2011) on aluminium packaging.

33
3. POTENTIAL ALUMINIUM RECOVERY FROM BOTTOM ASH IN
ITALY
In 2007 in Italy, only 20% of the produced bottom ash was
treated and 421 t of aluminium were recovered. Most of the
plants installed in our Country are aimed at recovering the
bottom ash inert fraction for concrete production. Some new
plants were built in the last years to recover the bottom ash in
road construction, but due to problems in their authorisation
they are still not operating.
From a legislative point of view, the recovery of bottom ash is
regulated by the D.M. n. 186 of the 5th
of April 2006 about the
recovery of hazardous waste in simplified regime. The law
allows to use the bottom ash for clinker production, being
understood that the produced clinker must comply with all the
environmental and quality characteristics necessary for the
“UE label” and defined by the UNI EN 12620:2003, UNI
8520-1: 2005 and UNI 8520-2:2005.
The potential for material recovery from the bottom ash in Italy
is thus interesting, due to the lack of plants compared to other
European Countries, like the Netherlands, Denmark, France
and Germany, where more than 70% of the bottom ash is
recovered and reutilised (Crillensen and Skaarup, 2006).
For what concerns the recovery of the metal fraction, even if
metal scraps in the residual waste (URW) are expected to
34
decrease according to a framework where overall source
separation levels are increasing, as requested for example by
the EU Directive on waste (2008/98/EC), the amount of metals
potentially recoverable from the bottom ash will probably
increase in the next ten years in our Country. Italy has, in fact,
an interesting growing potential for waste incineration. Only
12.1% of the waste was incinerated in 2009, with 49 plants
operating (ISPRA, 2011). According to the regional waste
management plans, the number of plants operating in our
Country should increase in the next ten years, with 25 new
plants and lines to be installed. These plans seem quite
ambitious and it is difficult to believe that all the planned
plants will actually be built as for 2020. In any case, even if
only a part of the planned plants will be actually operating until
2020, the amount of bottom ash, and hence metals, available
for recovery will surely increase.
A quantitative estimate of the aluminium potentially
recoverable from the bottom ash and then recyclable as
secondary aluminium in Italy in 2015 and 2020 is presented in
this chapter. The model used for the evaluation is described in
Grosso et al. (2011) and more in details in CiAl (2011), where
the historical data from 2000 to 2007 were considered for the
evaluation. In this chapter the updated version of the study will
be presented, where the input data were updated at 2009 where
possible. In addition, the results of the research about
aluminium oxidation, presented in Chapter 4, were introduced
in the evaluation.
35
3.1. MODEL DEFINITION
The amount of aluminium scraps which can be recovered and
recycled from bottom ash has been evaluated through a model
specifically developed for this purpose. In the definition of the
model, the influence of different parameters related to the
aluminium packaging production and to the whole waste
management system was taken into account.
The model is primarily based on the following four parameters:
amount of commercialized aluminium packaging;
gross MSW production;
overall separated collection level;
capacity of waste-to-energy plants.
Other minor variables are included, as summarised in Table
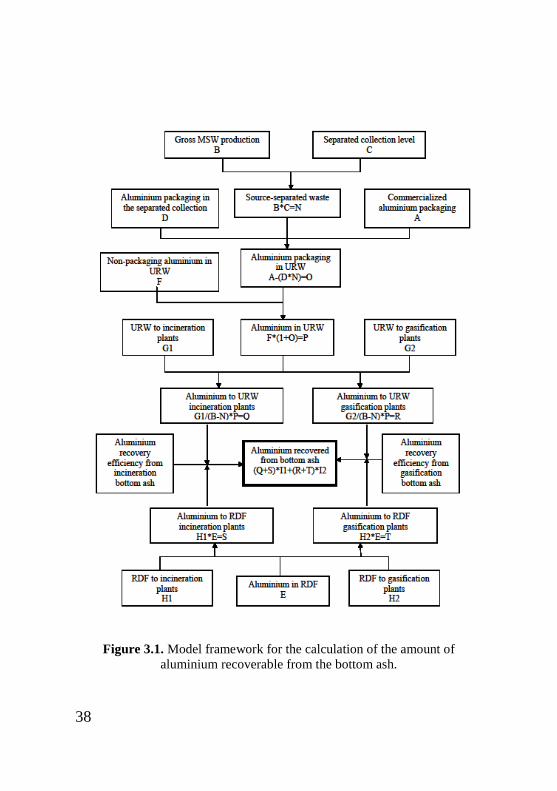
3.1. The model framework is illustrated in Figure 3.1: first of
all, the waste collected with the separated collection and the
aluminium packaging available on the market have been
evaluated; then, knowing the amount of aluminium packaging
in the separated collection and the quantity of non packaging
aluminium in the URW, we have estimated the amount of
aluminium in the residual waste. This aluminium is fed in part
to incineration plants and in part to gasification plants, together
with the URW. By considering also the aluminium content of
the Refuse Derived Fuel (RDF), it is possible to evaluate the
aluminium in the bottom ash produced during the combustion
of URW and RDF and therefore the amount of aluminium
recoverable and recyclable from the bottom ash.
The proposed model was applied to the Italian situation with a
time perspective of about 10 years.
For each variable, one or more evolution scenarios were
defined to estimate its values in years 2015 and 2020. The
36
number of scenarios applied to each variable is reported in
Table 3.1, whereas a brief description of each scenario is given
below. The values which have been predicted for the model
variables for 2015 and 2020 are summarized in Table 3.1 and
compared with their value in 2009.
37
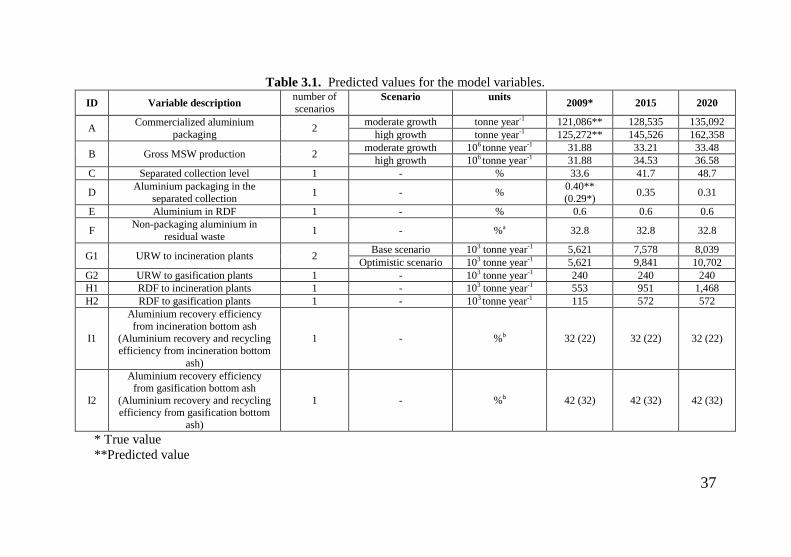
Table 3.1. Predicted values for the model variables.
ID Variable description number of
scenarios Scenario units
2009* 2015 2020
A Commercialized aluminium
packaging 2
moderate growth tonne year-1 121,086** 128,535 135,092
high growth tonne year-1 125,272** 145,526 162,358
B Gross MSW production 2 moderate growth 106 tonne year-1 31.88 33.21 33.48
high growth 106 tonne year-1 31.88 34.53 36.58
C Separated collection level 1 - % 33.6 41.7 48.7
D Aluminium packaging in the
separated collection 1 - %
0.40**
(0.29*) 0.35 0.31
E Aluminium in RDF 1 - % 0.6 0.6 0.6
F Non-packaging aluminium in
residual waste 1 - %a 32.8 32.8 32.8
G1 URW to incineration plants 2 Base scenario 103 tonne year-1 5,621 7,578 8,039
Optimistic scenario 103 tonne year-1 5,621 9,841 10,702
G2 URW to gasification plants 1 - 103 tonne year-1 240 240 240
H1 RDF to incineration plants 1 - 103 tonne year-1 553 951 1,468
H2 RDF to gasification plants 1 - 103 tonne year-1 115 572 572
I1
Aluminium recovery efficiency
from incineration bottom ash (Aluminium recovery and recycling
efficiency from incineration bottom
ash)
1 - %b 32 (22) 32 (22) 32 (22)
I2
Aluminium recovery efficiency from gasification bottom ash
(Aluminium recovery and recycling efficiency from gasification bottom
ash)
1 - %b 42 (32) 42 (32) 42 (32)
* True value
**Predicted value
38
Figure 3.1. Model framework for the calculation of the amount of
aluminium recoverable from the bottom ash.

39
Commercialized aluminium packaging
The use of aluminium packaging has increased in the last
years, thanks to the properties of this material. The growing
attention towards the environment has promoted the
development of new technologies for packaging production,
reducing their weight and the use of natural resources. For
example, the thickness of beverage cans decreased by 6.9%
from 1997 to 2007 and their weight decreased by 5.58% in the
same period.
Based on these considerations, two scenarios for the evolution
of aluminium packaging available on the market were
considered: a high and a moderate growth scenario.
The former (i.e. high growth scenario) results from the
projection of data of aluminium packaging commercialised in
Italy between 2000 and 2007 and is based on a logarithmic
curve to fit the data. The logarithmic function considers, on the
one hand, the increase in the request of disposable packaging
and, on the other, the reduction of the packaging weight as well
as the possibility of the introduction in Italy of an
environmental tax on those disposable products that are
currently not subjected to any tax (e.g. aluminium foil).
The second scenario (i.e. moderate growth scenario) assumes a
yearly growth rate of 1% for the commercialized aluminium
packaging and it is therefore representative of an economic
situation of low growth and moderate consumption.
The two scenarios are represented in Figure 3.2.
A clarification must be done: when referring to aluminium
packaging we mean not only “true” packaging but also all
similar items which are not formally considered packaging and
then not submitted to the environmental tax, such as the
household foil (aluminium foil and poly-laminated foil).
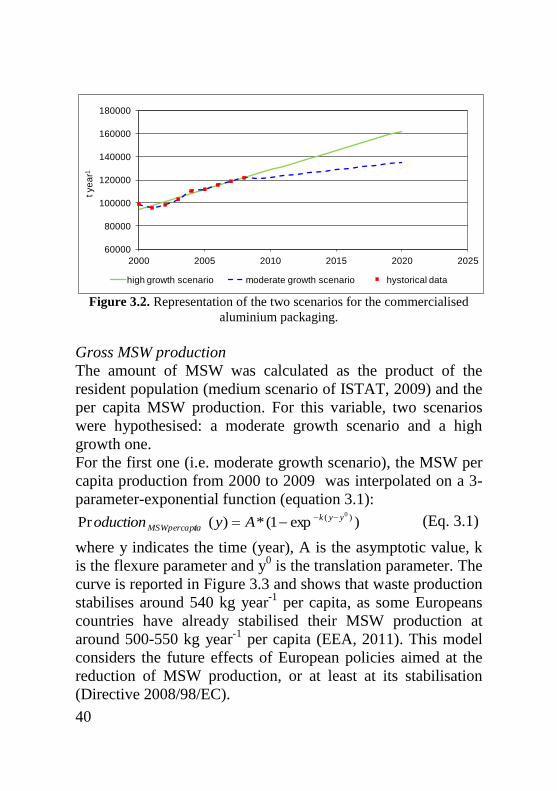
40
Figure 3.2. Representation of the two scenarios for the commercialised
aluminium packaging.
Gross MSW production
The amount of MSW was calculated as the product of the
resident population (medium scenario of ISTAT, 2009) and the
per capita MSW production. For this variable, two scenarios
were hypothesised: a moderate growth scenario and a high
growth one.
For the first one (i.e. moderate growth scenario), the MSW per
capita production from 2000 to 2009 was interpolated on a 3-
parameter-exponential function (equation 3.1):
)exp1(*)(Pr )( 0yyk
taMSWpercapi Ayoduction (Eq. 3.1)
where y indicates the time (year), A is the asymptotic value, k
is the flexure parameter and y0 is the translation parameter. The
curve is reported in Figure 3.3 and shows that waste production
stabilises around 540 kg year-1
per capita, as some Europeans
countries have already stabilised their MSW production at
around 500-550 kg year-1
per capita (EEA, 2011). This model
considers the future effects of European policies aimed at the
reduction of MSW production, or at least at its stabilisation
(Directive 2008/98/EC).
60000
80000
100000
120000
140000
160000
180000
2000 2005 2010 2015 2020 2025
t ye
ar1
high growth scenario moderate growth scenario hystorical data
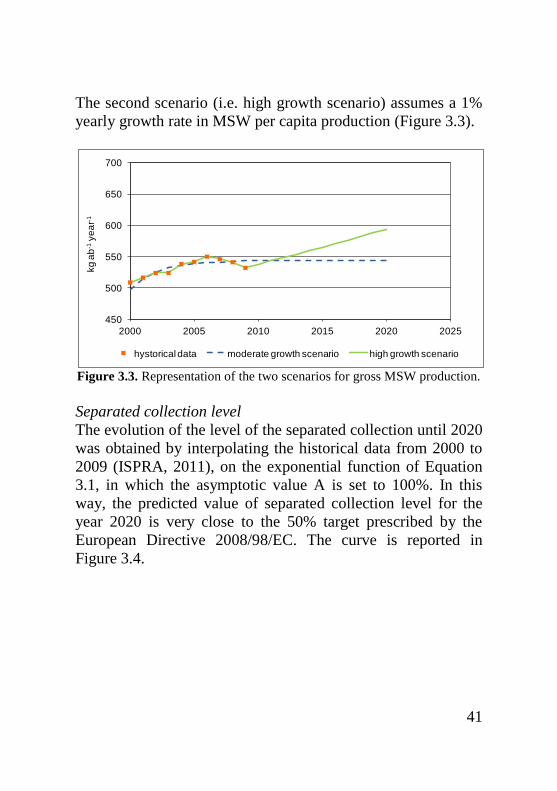
41
The second scenario (i.e. high growth scenario) assumes a 1%
yearly growth rate in MSW per capita production (Figure 3.3).
Figure 3.3. Representation of the two scenarios for gross MSW production.
Separated collection level
The evolution of the level of the separated collection until 2020
was obtained by interpolating the historical data from 2000 to
2009 (ISPRA, 2011), on the exponential function of Equation
3.1, in which the asymptotic value A is set to 100%. In this
way, the predicted value of separated collection level for the
year 2020 is very close to the 50% target prescribed by the
European Directive 2008/98/EC. The curve is reported in
Figure 3.4.
450
500
550
600
650
700
2000 2005 2010 2015 2020 2025
kg
ab
-1ye
ar-1
hystorical data moderate growth scenario high growth scenario
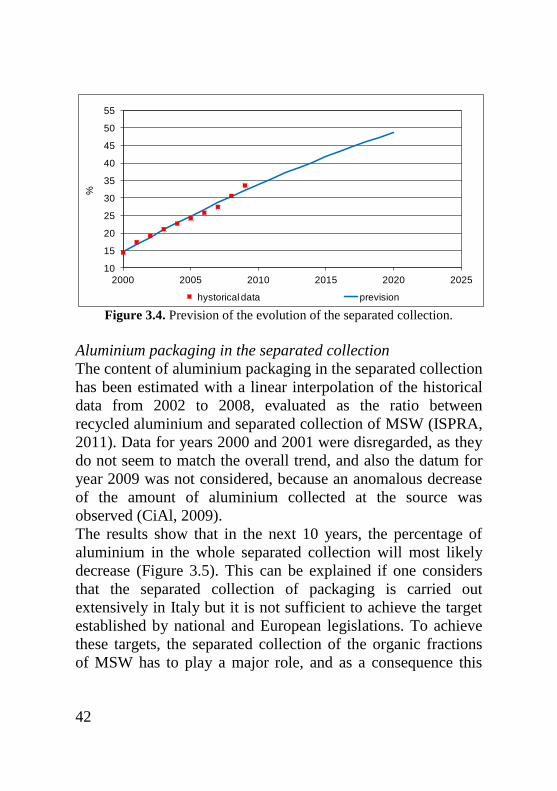
42
Figure 3.4. Prevision of the evolution of the separated collection.
Aluminium packaging in the separated collection
The content of aluminium packaging in the separated collection
has been estimated with a linear interpolation of the historical
data from 2002 to 2008, evaluated as the ratio between
recycled aluminium and separated collection of MSW (ISPRA,
2011). Data for years 2000 and 2001 were disregarded, as they
do not seem to match the overall trend, and also the datum for
year 2009 was not considered, because an anomalous decrease
of the amount of aluminium collected at the source was
observed (CiAl, 2009).
The results show that in the next 10 years, the percentage of
aluminium in the whole separated collection will most likely
decrease (Figure 3.5). This can be explained if one considers
that the separated collection of packaging is carried out
extensively in Italy but it is not sufficient to achieve the target
established by national and European legislations. To achieve
these targets, the separated collection of the organic fractions
of MSW has to play a major role, and as a consequence this
10
15
20
25
30
35
40
45
50
55
2000 2005 2010 2015 2020 2025
%
hystorical data prevision
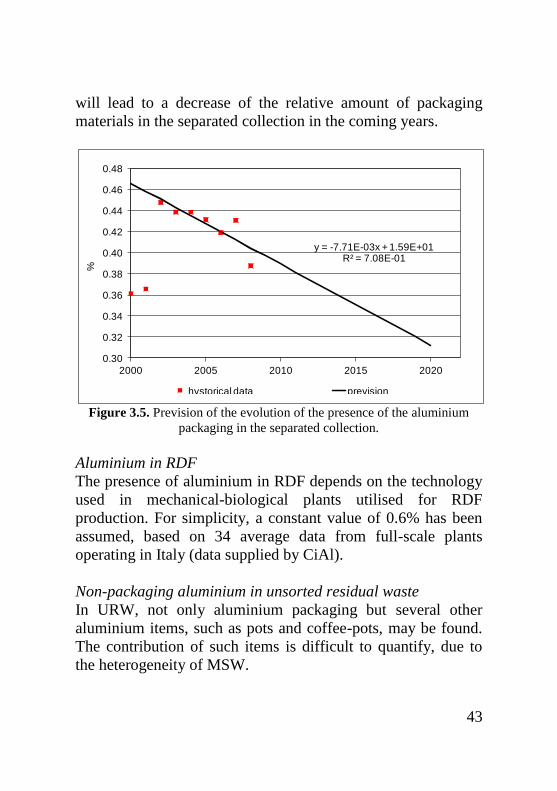
43
will lead to a decrease of the relative amount of packaging
materials in the separated collection in the coming years.
Figure 3.5. Prevision of the evolution of the presence of the aluminium
packaging in the separated collection.
Aluminium in RDF
The presence of aluminium in RDF depends on the technology
used in mechanical-biological plants utilised for RDF
production. For simplicity, a constant value of 0.6% has been
assumed, based on 34 average data from full-scale plants
operating in Italy (data supplied by CiAl).
Non-packaging aluminium in unsorted residual waste
In URW, not only aluminium packaging but several other
aluminium items, such as pots and coffee-pots, may be found.
The contribution of such items is difficult to quantify, due to
the heterogeneity of MSW.
y = -7.71E-03x + 1.59E+01R² = 7.08E-01
0.30
0.32
0.34
0.36
0.38
0.40
0.42
0.44
0.46
0.48
2000 2005 2010 2015 2020
%
hystorical data prevision
44
In this work, a constant ratio of 32.8% of non-packaging
aluminium over aluminium packaging has been assumed, based
on the results obtained in three analyses that were carried out
by the author on the residual waste sent to a waste-to-energy
plant located in Northern Italy in 2009.
Waste-to-energy plants capacity
In 2009, 49 waste-to-energy plants were operating in Italy
(ISPRA, 2011).
The capacity of incineration and gasification plants in 2015 and
2020 was estimated by adding, to the capacity installed in
2009, the capacity of new plants that are likely to be built in
Italy, according to the Regional waste management plans. For
simplicity, the waste-to-energy plants were classified in two
groups: those that treat URW and those that treat RDF.
Two scenarios were considered: a base and an optimistic
scenario.
The base scenario considers only those plants whose entry into
operation by year 2020 is considered quite likely. The list of
these plants is reported in Table 3.2.
The optimistic scenario considers all the plants planned by the
regional waste management plans, also the ones whose
construction is more uncertain. For example, the plants planned
in Sicily, whose building company went bankrupt and for
which Mafia infiltration is suspected; Greve plant, whose
administrative procedure was interrupted by TAR verdict, etc.
The list of these plants is reported in Table 3.3.
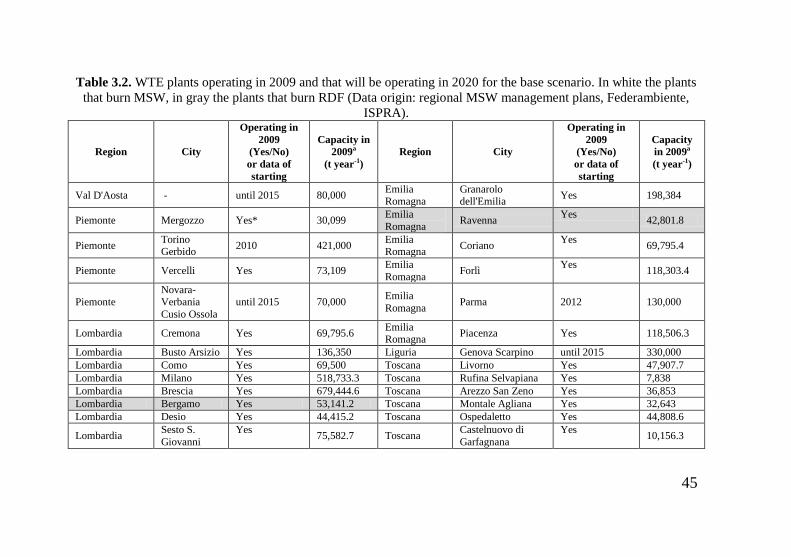
45
Table 3.2. WTE plants operating in 2009 and that will be operating in 2020 for the base scenario. In white the plants
that burn MSW, in gray the plants that burn RDF (Data origin: regional MSW management plans, Federambiente,
ISPRA).
Region City
Operating in
2009
(Yes/No)
or data of
starting
Capacity in
2009a
(t year-1)
Region City
Operating in
2009
(Yes/No)
or data of
starting
Capacity
in 2009a
(t year-1)
Val D'Aosta - until 2015 80,000 Emilia Romagna
Granarolo dell'Emilia
Yes 198,384
Piemonte Mergozzo Yes* 30,099 Emilia
Romagna Ravenna
Yes 42,801.8
Piemonte Torino Gerbido
2010 421,000 Emilia Romagna
Coriano Yes
69,795.4
Piemonte Vercelli Yes 73,109 Emilia
Romagna Forlì
Yes 118,303.4
Piemonte Novara- Verbania
Cusio Ossola
until 2015 70,000 Emilia
Romagna Parma 2012 130,000
Lombardia Cremona Yes 69,795.6 Emilia Romagna
Piacenza Yes 118,506.3
Lombardia Busto Arsizio Yes 136,350 Liguria Genova Scarpino until 2015 330,000
Lombardia Como Yes 69,500 Toscana Livorno Yes 47,907.7
Lombardia Milano Yes 518,733.3 Toscana Rufina Selvapiana Yes 7,838
Lombardia Brescia Yes 679,444.6 Toscana Arezzo San Zeno Yes 36,853
Lombardia Bergamo Yes 53,141.2 Toscana Montale Agliana Yes 32,643
Lombardia Desio Yes 44,415.2 Toscana Ospedaletto Yes 44,808.6
Lombardia Sesto S.
Giovanni
Yes 75,582.7 Toscana
Castelnuovo di
Garfagnana
Yes 10,156.3
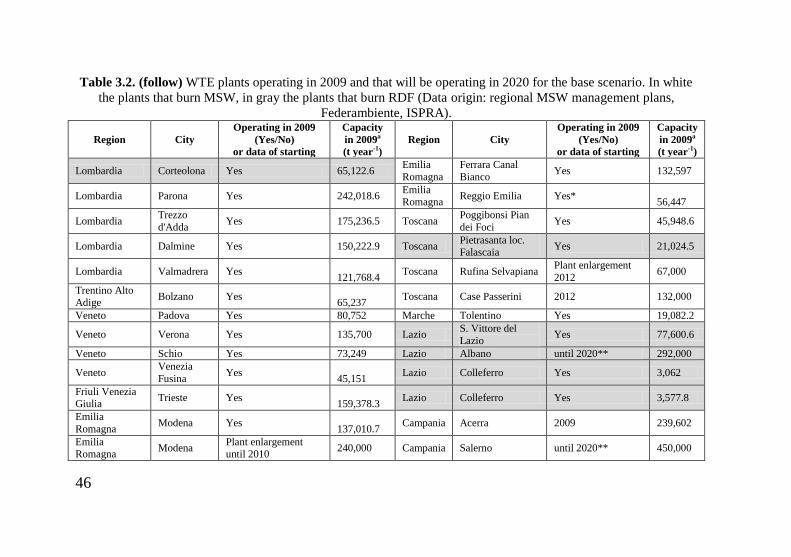
46
Table 3.2. (follow) WTE plants operating in 2009 and that will be operating in 2020 for the base scenario. In white
the plants that burn MSW, in gray the plants that burn RDF (Data origin: regional MSW management plans,
Federambiente, ISPRA).
Region City
Operating in 2009
(Yes/No)
or data of starting
Capacity
in 2009a
(t year-1)
Region City
Operating in 2009
(Yes/No)
or data of starting
Capacity
in 2009a
(t year-1)
Lombardia Corteolona Yes 65,122.6 Emilia
Romagna
Ferrara Canal
Bianco Yes 132,597
Lombardia Parona Yes 242,018.6 Emilia Romagna
Reggio Emilia Yes* 56,447
Lombardia Trezzo
d'Adda Yes 175,236.5 Toscana
Poggibonsi Pian
dei Foci Yes 45,948.6
Lombardia Dalmine Yes 150,222.9 Toscana Pietrasanta loc. Falascaia
Yes 21,024.5
Lombardia Valmadrera Yes 121,768.4
Toscana Rufina Selvapiana Plant enlargement
2012 67,000
Trentino Alto Adige
Bolzano Yes 65,237
Toscana Case Passerini 2012 132,000
Veneto Padova Yes 80,752 Marche Tolentino Yes 19,082.2
Veneto Verona Yes 135,700 Lazio S. Vittore del
Lazio Yes 77,600.6
Veneto Schio Yes 73,249 Lazio Albano until 2020** 292,000
Veneto Venezia
Fusina Yes
45,151 Lazio Colleferro Yes 3,062
Friuli Venezia Giulia
Trieste Yes 159,378.3
Lazio Colleferro Yes 3,577.8
Emilia
Romagna Modena Yes
137,010.7 Campania Acerra 2009 239,602
Emilia Romagna
Modena Plant enlargement until 2010
240,000 Campania Salerno until 2020** 450,000
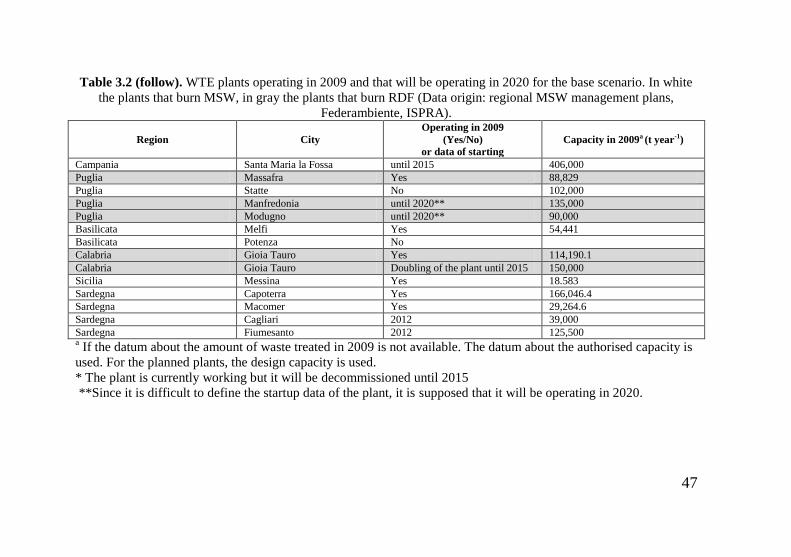
47
Table 3.2 (follow). WTE plants operating in 2009 and that will be operating in 2020 for the base scenario. In white
the plants that burn MSW, in gray the plants that burn RDF (Data origin: regional MSW management plans,
Federambiente, ISPRA).
Region City
Operating in 2009
(Yes/No)
or data of starting
Capacity in 2009a (t year-1)
Campania Santa Maria la Fossa until 2015 406,000
Puglia Massafra Yes 88,829
Puglia Statte No 102,000
Puglia Manfredonia until 2020** 135,000
Puglia Modugno until 2020** 90,000
Basilicata Melfi Yes 54,441
Basilicata Potenza No
Calabria Gioia Tauro Yes 114,190.1
Calabria Gioia Tauro Doubling of the plant until 2015 150,000
Sicilia Messina Yes 18.583
Sardegna Capoterra Yes 166,046.4
Sardegna Macomer Yes 29,264.6
Sardegna Cagliari 2012 39,000
Sardegna Fiumesanto 2012 125,500 a If the datum about the amount of waste treated in 2009 is not available. The datum about the authorised capacity is
used. For the planned plants, the design capacity is used.
* The plant is currently working but it will be decommissioned until 2015
**Since it is difficult to define the startup data of the plant, it is supposed that it will be operating in 2020.
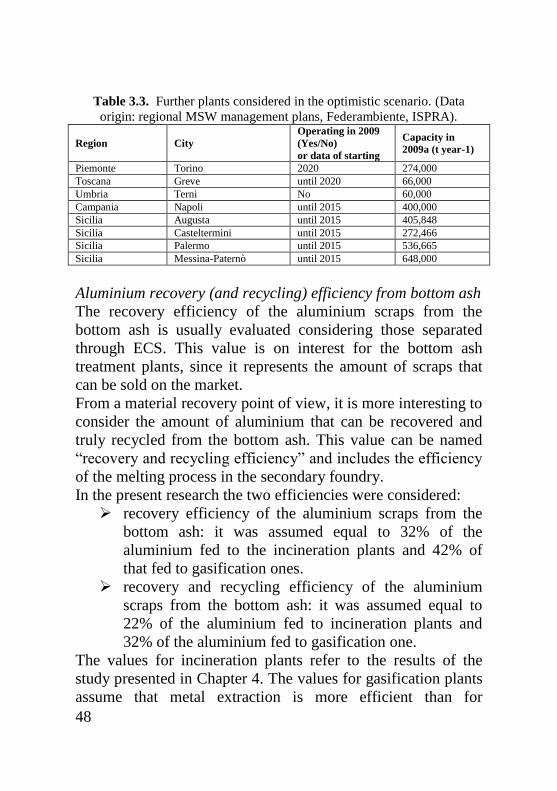
48
Table 3.3. Further plants considered in the optimistic scenario. (Data
origin: regional MSW management plans, Federambiente, ISPRA).
Region City
Operating in 2009
(Yes/No)
or data of starting
Capacity in
2009a (t year-1)
Piemonte Torino 2020 274,000
Toscana Greve until 2020 66,000
Umbria Terni No 60,000
Campania Napoli until 2015 400,000
Sicilia Augusta until 2015 405,848
Sicilia Casteltermini until 2015 272,466
Sicilia Palermo until 2015 536,665
Sicilia Messina-Paternò until 2015 648,000
Aluminium recovery (and recycling) efficiency from bottom ash
The recovery efficiency of the aluminium scraps from the
bottom ash is usually evaluated considering those separated
through ECS. This value is on interest for the bottom ash
treatment plants, since it represents the amount of scraps that
can be sold on the market.
From a material recovery point of view, it is more interesting to
consider the amount of aluminium that can be recovered and
truly recycled from the bottom ash. This value can be named
“recovery and recycling efficiency” and includes the efficiency
of the melting process in the secondary foundry.
In the present research the two efficiencies were considered:
recovery efficiency of the aluminium scraps from the
bottom ash: it was assumed equal to 32% of the
aluminium fed to the incineration plants and 42% of
that fed to gasification ones.
recovery and recycling efficiency of the aluminium
scraps from the bottom ash: it was assumed equal to
22% of the aluminium fed to incineration plants and
32% of the aluminium fed to gasification one.
The values for incineration plants refer to the results of the
study presented in Chapter 4. The values for gasification plants
assume that metal extraction is more efficient than for
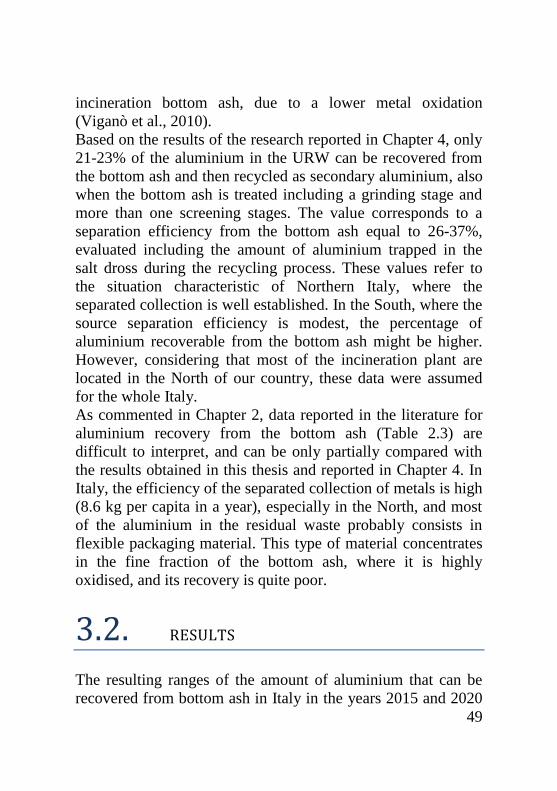
49
incineration bottom ash, due to a lower metal oxidation
(Viganò et al., 2010).
Based on the results of the research reported in Chapter 4, only
21-23% of the aluminium in the URW can be recovered from
the bottom ash and then recycled as secondary aluminium, also
when the bottom ash is treated including a grinding stage and
more than one screening stages. The value corresponds to a
separation efficiency from the bottom ash equal to 26-37%,
evaluated including the amount of aluminium trapped in the
salt dross during the recycling process. These values refer to
the situation characteristic of Northern Italy, where the
separated collection is well established. In the South, where the
source separation efficiency is modest, the percentage of
aluminium recoverable from the bottom ash might be higher.
However, considering that most of the incineration plant are
located in the North of our country, these data were assumed
for the whole Italy.
As commented in Chapter 2, data reported in the literature for
aluminium recovery from the bottom ash (Table 2.3) are
difficult to interpret, and can be only partially compared with
the results obtained in this thesis and reported in Chapter 4. In
Italy, the efficiency of the separated collection of metals is high
(8.6 kg per capita in a year), especially in the North, and most
of the aluminium in the residual waste probably consists in
flexible packaging material. This type of material concentrates
in the fine fraction of the bottom ash, where it is highly
oxidised, and its recovery is quite poor.
3.2. RESULTS
The resulting ranges of the amount of aluminium that can be
recovered from bottom ash in Italy in the years 2015 and 2020
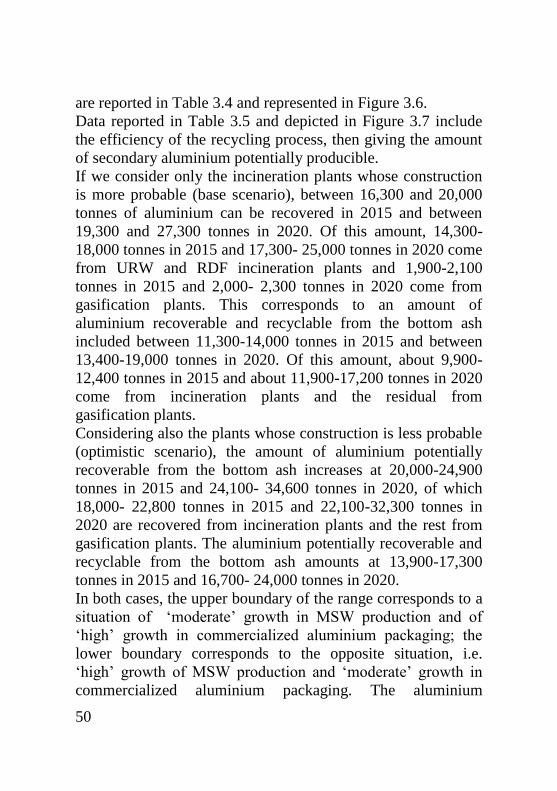
50
are reported in Table 3.4 and represented in Figure 3.6.
Data reported in Table 3.5 and depicted in Figure 3.7 include
the efficiency of the recycling process, then giving the amount
of secondary aluminium potentially producible.
If we consider only the incineration plants whose construction
is more probable (base scenario), between 16,300 and 20,000
tonnes of aluminium can be recovered in 2015 and between
19,300 and 27,300 tonnes in 2020. Of this amount, 14,300-
18,000 tonnes in 2015 and 17,300- 25,000 tonnes in 2020 come
from URW and RDF incineration plants and 1,900-2,100
tonnes in 2015 and 2,000- 2,300 tonnes in 2020 come from
gasification plants. This corresponds to an amount of
aluminium recoverable and recyclable from the bottom ash
included between 11,300-14,000 tonnes in 2015 and between
13,400-19,000 tonnes in 2020. Of this amount, about 9,900-
12,400 tonnes in 2015 and about 11,900-17,200 tonnes in 2020
come from incineration plants and the residual from
gasification plants.
Considering also the plants whose construction is less probable
(optimistic scenario), the amount of aluminium potentially
recoverable from the bottom ash increases at 20,000-24,900
tonnes in 2015 and 24,100- 34,600 tonnes in 2020, of which
18,000- 22,800 tonnes in 2015 and 22,100-32,300 tonnes in
2020 are recovered from incineration plants and the rest from
gasification plants. The aluminium potentially recoverable and
recyclable from the bottom ash amounts at 13,900-17,300
tonnes in 2015 and 16,700- 24,000 tonnes in 2020.
In both cases, the upper boundary of the range corresponds to a
situation of ‘moderate’ growth in MSW production and of
‘high’ growth in commercialized aluminium packaging; the
lower boundary corresponds to the opposite situation, i.e.
‘high’ growth of MSW production and ‘moderate’ growth in
commercialized aluminium packaging. The aluminium
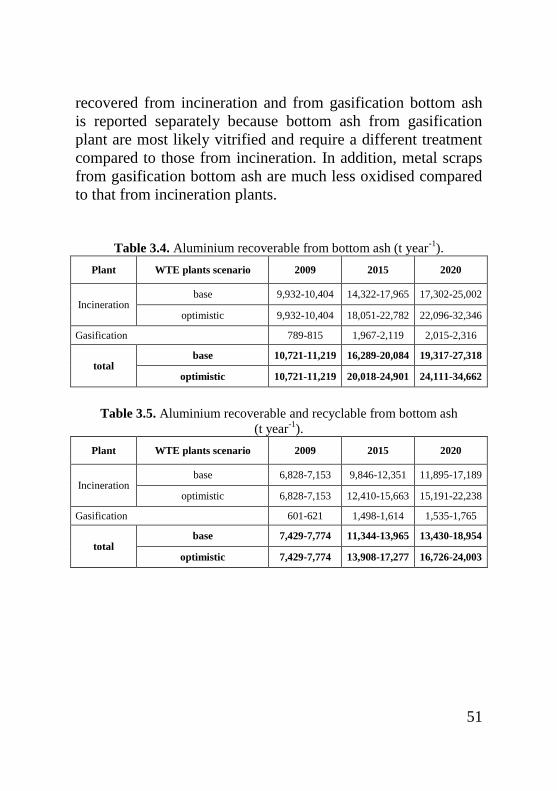
51
recovered from incineration and from gasification bottom ash
is reported separately because bottom ash from gasification
plant are most likely vitrified and require a different treatment
compared to those from incineration. In addition, metal scraps
from gasification bottom ash are much less oxidised compared
to that from incineration plants.
Table 3.4. Aluminium recoverable from bottom ash (t year
-1).
Plant WTE plants scenario 2009 2015 2020
Incineration base 9,932-10,404 14,322-17,965 17,302-25,002
optimistic 9,932-10,404 18,051-22,782 22,096-32,346
Gasification 789-815 1,967-2,119 2,015-2,316
total base 10,721-11,219 16,289-20,084 19,317-27,318
optimistic 10,721-11,219 20,018-24,901 24,111-34,662
Table 3.5. Aluminium recoverable and recyclable from bottom ash
(t year-1
).
Plant WTE plants scenario 2009 2015 2020
Incineration base 6,828-7,153 9,846-12,351 11,895-17,189
optimistic 6,828-7,153 12,410-15,663 15,191-22,238
Gasification 601-621 1,498-1,614 1,535-1,765
total base 7,429-7,774 11,344-13,965 13,430-18,954
optimistic 7,429-7,774 13,908-17,277 16,726-24,003

52
Base WTE plants scenario Optimistic WTE plants scenario
Figure 3.6. Aluminium recoverable from the bottom ash in Italy in 2015 and 2020.
0
5000
10000
15000
20000
25000
30000
2009 2015 2020
t ye
ar-1
0
5000
10000
15000
20000
25000
30000
35000
40000
2009 2015 2020
t ye
ar-1
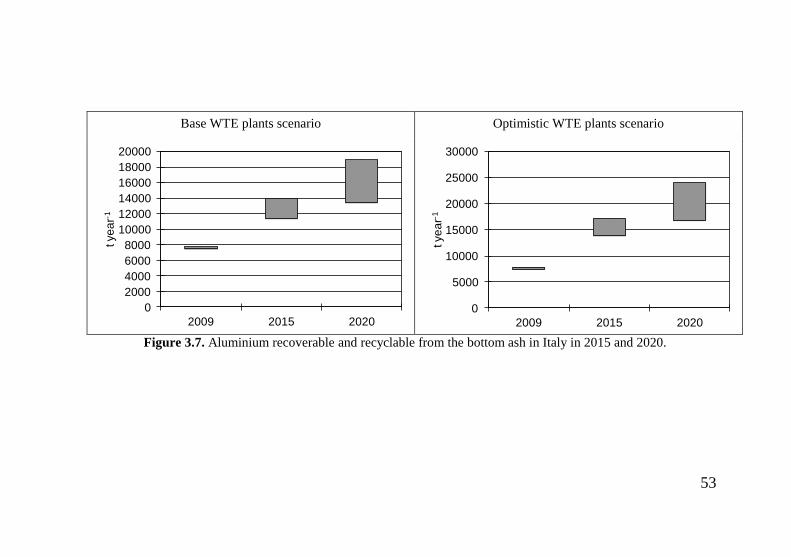
53
Base WTE plants scenario Optimistic WTE plants scenario
Figure 3.7. Aluminium recoverable and recyclable from the bottom ash in Italy in 2015 and 2020.
0
2000
4000
6000
8000
10000
12000
14000
16000
18000
20000
2009 2015 2020
t ye
ar-1
0
5000
10000
15000
20000
25000
30000
2009 2015 2020
t ye
ar-1
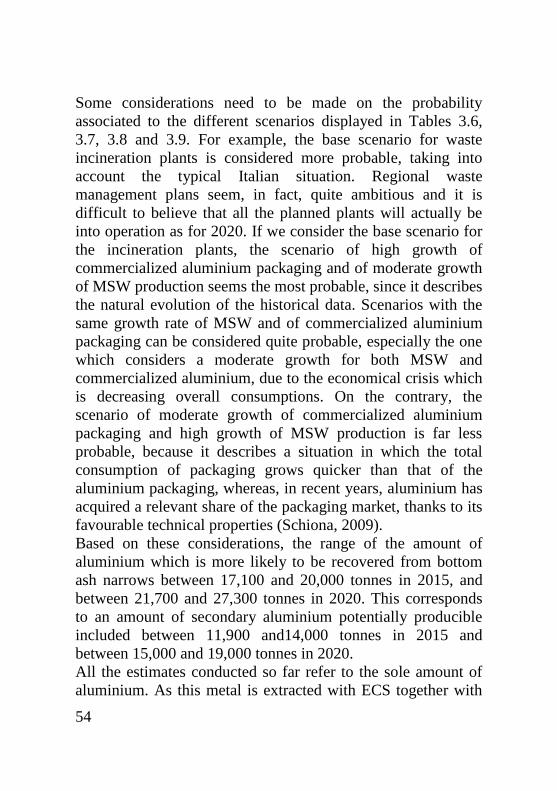
54
Some considerations need to be made on the probability
associated to the different scenarios displayed in Tables 3.6,
3.7, 3.8 and 3.9. For example, the base scenario for waste
incineration plants is considered more probable, taking into
account the typical Italian situation. Regional waste
management plans seem, in fact, quite ambitious and it is
difficult to believe that all the planned plants will actually be
into operation as for 2020. If we consider the base scenario for
the incineration plants, the scenario of high growth of
commercialized aluminium packaging and of moderate growth
of MSW production seems the most probable, since it describes
the natural evolution of the historical data. Scenarios with the
same growth rate of MSW and of commercialized aluminium
packaging can be considered quite probable, especially the one
which considers a moderate growth for both MSW and
commercialized aluminium, due to the economical crisis which
is decreasing overall consumptions. On the contrary, the
scenario of moderate growth of commercialized aluminium
packaging and high growth of MSW production is far less
probable, because it describes a situation in which the total
consumption of packaging grows quicker than that of the
aluminium packaging, whereas, in recent years, aluminium has
acquired a relevant share of the packaging market, thanks to its
favourable technical properties (Schiona, 2009).
Based on these considerations, the range of the amount of
aluminium which is more likely to be recovered from bottom
ash narrows between 17,100 and 20,000 tonnes in 2015, and
between 21,700 and 27,300 tonnes in 2020. This corresponds
to an amount of secondary aluminium potentially producible
included between 11,900 and14,000 tonnes in 2015 and
between 15,000 and 19,000 tonnes in 2020.
All the estimates conducted so far refer to the sole amount of
aluminium. As this metal is extracted with ECS together with

55
other non ferrous metals and assuming a 60% content of
aluminium in the mixture, then the most likely value of non-
ferrous metals recoverable from bottom ash is 28,600-33,500
tonnes in 2015 and 36,000- 45,500 tonnes in 2020. The most
likely amount of non-ferrous metals recoverable and recyclable
from the bottom ash thus narrows between 20,000 and 23,300
tonnes in 2015 and between 25,000 and 31,600 tonnes in 2020.
Bottom ash production in 2015 and 2020, evaluated
considering that bottom ash account on average for 20% of the
URW and 3.5% of RDF, is reported in Table 3.10. The upper
boundary of the range corresponds to the optimistic
incineration scenario; the lower boundary corresponds to the
base incineration scenario.
Table 3.11 reports the bottom ash treatment plants actually
installed in our Country or that will be operating soon
(incomplete list). Despite the lack of information, we can
notice that the plants currently installed or soon available is
insufficient to treat all the bottom ash produced in 2015 and
2020. It is, therefore, evident the possibility to improve metals
recovery from the ash by increasing the treatment capacity
installed in our Country.
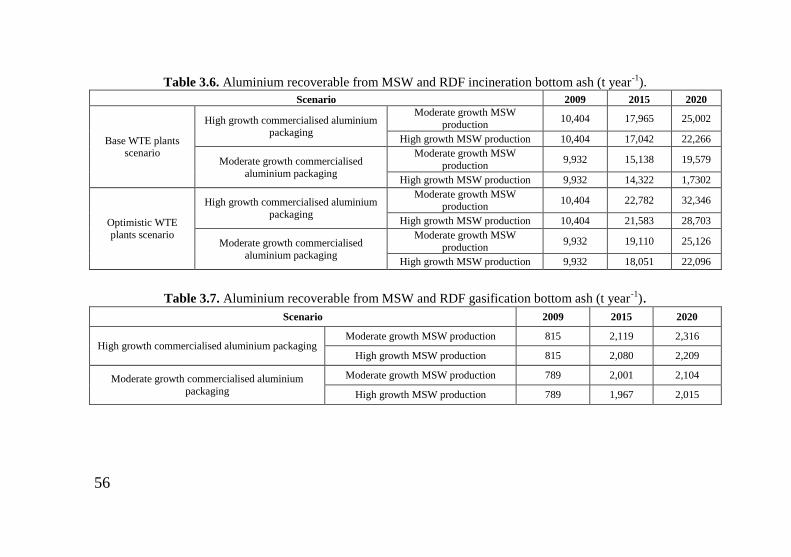
56
Table 3.6. Aluminium recoverable from MSW and RDF incineration bottom ash (t year-1
).
Scenario 2009 2015 2020
Base WTE plants scenario
High growth commercialised aluminium packaging
Moderate growth MSW
production 10,404 17,965 25,002
High growth MSW production 10,404 17,042 22,266
Moderate growth commercialised
aluminium packaging
Moderate growth MSW
production 9,932 15,138 19,579
High growth MSW production 9,932 14,322 1,7302
Optimistic WTE
plants scenario
High growth commercialised aluminium
packaging
Moderate growth MSW production
10,404 22,782 32,346
High growth MSW production 10,404 21,583 28,703
Moderate growth commercialised
aluminium packaging
Moderate growth MSW
production 9,932 19,110 25,126
High growth MSW production 9,932 18,051 22,096
Table 3.7. Aluminium recoverable from MSW and RDF gasification bottom ash (t year-1
). Scenario 2009 2015 2020
High growth commercialised aluminium packaging Moderate growth MSW production 815 2,119 2,316
High growth MSW production 815 2,080 2,209
Moderate growth commercialised aluminium
packaging
Moderate growth MSW production 789 2,001 2,104
High growth MSW production 789 1,967 2,015
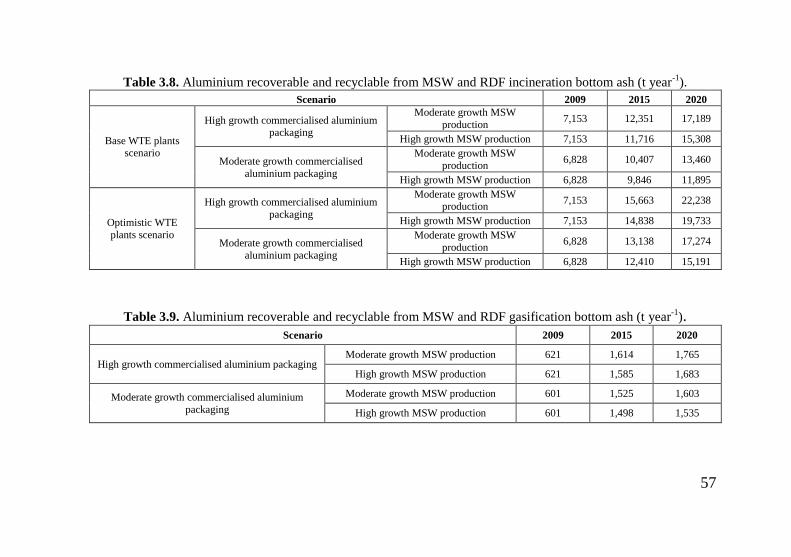
57
Table 3.8. Aluminium recoverable and recyclable from MSW and RDF incineration bottom ash (t year-1
).
Scenario 2009 2015 2020
Base WTE plants scenario
High growth commercialised aluminium packaging
Moderate growth MSW
production 7,153 12,351 17,189
High growth MSW production 7,153 11,716 15,308
Moderate growth commercialised
aluminium packaging
Moderate growth MSW
production 6,828 10,407 13,460
High growth MSW production 6,828 9,846 11,895
Optimistic WTE
plants scenario
High growth commercialised aluminium
packaging
Moderate growth MSW production
7,153 15,663 22,238
High growth MSW production 7,153 14,838 19,733
Moderate growth commercialised
aluminium packaging
Moderate growth MSW
production 6,828 13,138 17,274
High growth MSW production 6,828 12,410 15,191
Table 3.9. Aluminium recoverable and recyclable from MSW and RDF gasification bottom ash (t year-1
). Scenario 2009 2015 2020
High growth commercialised aluminium packaging Moderate growth MSW production 621 1,614 1,765
High growth MSW production 621 1,585 1,683
Moderate growth commercialised aluminium
packaging
Moderate growth MSW production 601 1,525 1,603
High growth MSW production 601 1,498 1,535
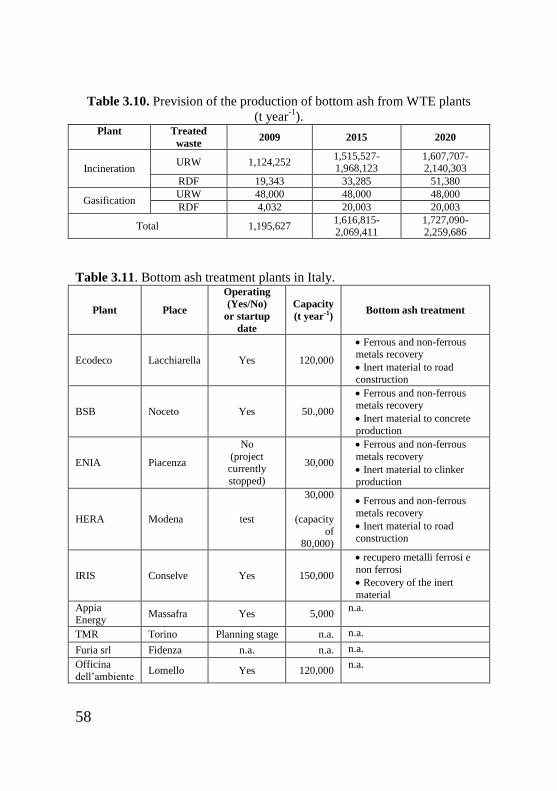
58
Table 3.10. Prevision of the production of bottom ash from WTE plants
(t year-1
). Plant Treated
waste 2009 2015 2020
Incineration URW 1,124,252
1,515,527-1,968,123
1,607,707-2,140,303
RDF 19,343 33,285 51,380
Gasification URW 48,000 48,000 48,000
RDF 4,032 20,003 20,003
Total 1,195,627 1,616,815-2,069,411
1,727,090-2,259,686
Table 3.11. Bottom ash treatment plants in Italy.
Plant Place
Operating
(Yes/No)
or startup
date
Capacity
(t year-1) Bottom ash treatment
Ecodeco Lacchiarella Yes 120,000
Ferrous and non-ferrous metals recovery
Inert material to road construction
BSB Noceto Yes 50.,000
Ferrous and non-ferrous metals recovery
Inert material to concrete
production
ENIA Piacenza
No
(project currently
stopped)
30,000
Ferrous and non-ferrous
metals recovery
Inert material to clinker
production
HERA Modena test
30,000
(capacity
of 80,000)
Ferrous and non-ferrous
metals recovery
Inert material to road
construction
IRIS Conselve Yes 150,000
recupero metalli ferrosi e
non ferrosi
Recovery of the inert
material
Appia Energy
Massafra Yes 5,000 n.a.
TMR Torino Planning stage n.a. n.a.
Furia srl Fidenza n.a. n.a. n.a.
Officina dell’ambiente
Lomello Yes 120,000 n.a.
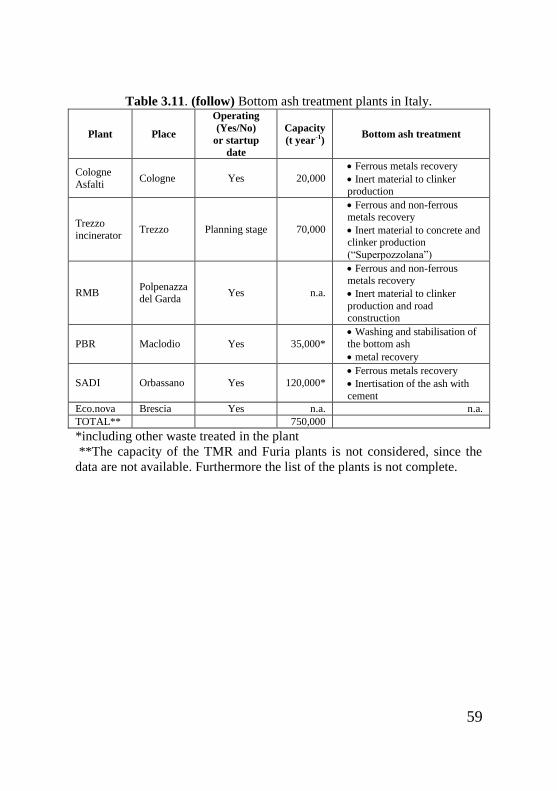
59
Table 3.11. (follow) Bottom ash treatment plants in Italy.
Plant Place
Operating
(Yes/No)
or startup
date
Capacity
(t year-1) Bottom ash treatment
Cologne
Asfalti Cologne Yes 20,000
Ferrous metals recovery
Inert material to clinker production
Trezzo incinerator
Trezzo Planning stage 70,000
Ferrous and non-ferrous metals recovery
Inert material to concrete and clinker production
(“Superpozzolana”)
RMB Polpenazza del Garda
Yes n.a.
Ferrous and non-ferrous metals recovery
Inert material to clinker
production and road construction
PBR Maclodio Yes 35,000* Washing and stabilisation of the bottom ash
metal recovery
SADI Orbassano Yes 120,000* Ferrous metals recovery
Inertisation of the ash with
cement
Eco.nova Brescia Yes n.a. n.a.
TOTAL** 750,000
*including other waste treated in the plant
**The capacity of the TMR and Furia plants is not considered, since the
data are not available. Furthermore the list of the plants is not complete.

61
4. ALUMINIUM OXIDATION IN THE FURNACE OF WTE
PLANTS
Ferrous and non ferrous metal scraps are increasingly
recovered from municipal solid waste incineration bottom ash
and used in the production of secondary steel and aluminium.
However, during the incineration process, metal scraps
contained in the waste undergo oxidation processes, which
determine a loss of their recoverable mass. This chapter
presents the results of a research carried out on two different
incineration plants located in Northern Italy to evaluate the
behaviour of different types of aluminium packaging materials
during standard operation. Their partitioning and oxidation
level in the residues of the incineration process were evaluated,
together with the amount of potentially recoverable aluminium.
At the same time, the partitioning and the oxidation level of the
aluminium naturally presented in the URW were evaluated, in
order to have information not only on some specific packaging
materials but on aluminium in general, including also the non-
packaging aluminium in the waste.
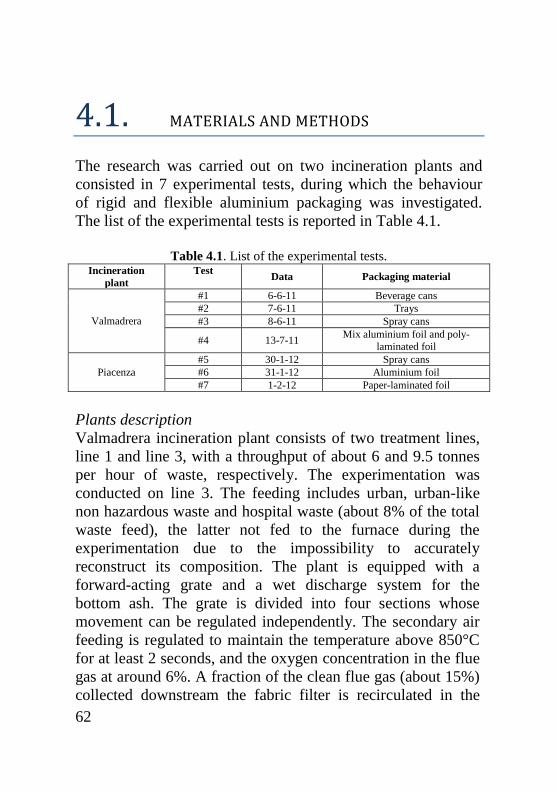
62
4.1. MATERIALS AND METHODS
The research was carried out on two incineration plants and
consisted in 7 experimental tests, during which the behaviour
of rigid and flexible aluminium packaging was investigated.
The list of the experimental tests is reported in Table 4.1.
Table 4.1. List of the experimental tests.
Incineration
plant
Test Data Packaging material
Valmadrera
#1 6-6-11 Beverage cans
#2 7-6-11 Trays
#3 8-6-11 Spray cans
#4 13-7-11 Mix aluminium foil and poly-
laminated foil
Piacenza
#5 30-1-12 Spray cans
#6 31-1-12 Aluminium foil
#7 1-2-12 Paper-laminated foil
Plants description
Valmadrera incineration plant consists of two treatment lines,
line 1 and line 3, with a throughput of about 6 and 9.5 tonnes
per hour of waste, respectively. The experimentation was
conducted on line 3. The feeding includes urban, urban-like
non hazardous waste and hospital waste (about 8% of the total
waste feed), the latter not fed to the furnace during the
experimentation due to the impossibility to accurately
reconstruct its composition. The plant is equipped with a
forward-acting grate and a wet discharge system for the
bottom ash. The grate is divided into four sections whose
movement can be regulated independently. The secondary air
feeding is regulated to maintain the temperature above 850°C
for at least 2 seconds, and the oxygen concentration in the flue
gas at around 6%. A fraction of the clean flue gas (about 15%)
collected downstream the fabric filter is recirculated in the
63
post-combustion chamber, in order to reduce NOx formation
and to increase the steam production. The plant is equipped
with a waste heat boiler for combined heat and power (CHP)
production through a steam turbine. Flue gas treatment
configuration is based on a dry-wet integrated process design
and includes a dry stage for the removal of acid gases and
micro- pollutants with the injection of sodium bicarbonate and
activated carbon; a filtration stage with a fabric filter operating
at 180°C; a catalytic reactor with ammonia injection for the
removal of NOx (SCR) and dioxins and a wet scrubber with
water and soda injection to complete the removal of the acid
gases and the most volatile heavy metals, such as mercury.
Piacenza incineration plant consists of two identical treatment
lines, with a throughput of about 7.5 tonnes per hour of waste
each. All tests were conducted on line 2. The typical feeding
includes urban, urban-like non hazardous waste, sewage sludge
and hospital waste, the latter not fed to the furnace during the
experimentation. The waste bunker has a capacity of 3500 m3
and it is used for urban and urban-like waste, whereas the
hospital waste is directly fed to the hopper of the furnace
through an automated system based on the use of single boxes.
The same system was used to feed the tested aluminium
packaging in the furnace.
The furnaces are equipped with a backward-acting grate
(supplied by Martin GmbH) divided into four sections, whose
movement can be regulated independently. Primary air is fed
from underneath the grate. At the end of the grate, the bottom
ash falls down in a water bath, where it is quenched. The
extraction system is designed to decrease the moisture content
of bottom ash, thanks to its “squeezing” in the discharge slide;
the final moisture content of bottom ash is in fact quite low,
and included between 12 and 18%. The bottom ash is then
64
discharged on a conveyor belt, where a magnet removes the
big ferrous scraps.
The plant is equipped with a waste heat boiler for combined
heat and power (CHP) production through a steam turbine.
Flue gas configuration is based on a dry process design and
includes a first injection of ammonia and of a sorbent
(Depurcal MG®) in the combustion chamber to remove part of
the NOx and acid gases; a high-dust catalytic reactor to
complete the removal of NOx; an electrostatic precipitator
(ESP); the injection of lime and activated carbon to complete
the removal of the acid gases and of the micro-pollutants and a
final stage of filtration with a fabric filter (FF).
Field tests
The characteristics of the tested packaging materials are
reported in Table 4.2. It is important to notice that the beverage
cans and the spray cans used in Piacenza test were post-
consumer and thus they probably contained organic and/or
inorganic impurities, whereas for the other packaging (trays
and foils) pre-consumer materials were used, due to the
technical impossibility to recover a sufficient amount of
selected post-consumer material from the separated collection.
The actual amount of aluminium fed to the furnace was
evaluated considering the alloy composition of each type of
packaging and the structure and composition of poly-laminated
foils.
The packaging materials were mixed with the waste in order to
increase its content of aluminium and the resulting doped waste
was fed to the furnace in about 1-2 hours.
For what concerns Valmadrera plant, during the first three tests
devoted to rigid aluminium packaging items (beverage cans,
spray cans and trays,) about 240 kg of aluminium were mixed
65
with about 8,000 kg of residual waste ready to be incinerated,
whose characteristics are reported in Table 4.3. During the last
test carried out in Valmadrera plant on flexible packaging (a
mix of aluminium foil and poly-laminated foil), the amount of
packaging increased at 979 kg, which were mixed with about
30,000 kg of residual waste. The mixing took place in a
dedicated bunker section, which was previously emptied, and it
was performed with the help of the grab in order to make the
charge homogeneous. This doping operation was carried out
with the aim to increase the aluminium content in the residual
waste from about 0.8% (background) to more than 3.5%.
The preparation of the waste charge was different in Piacenza
plant. Three selected aluminium packaging charges were
prepared, one for each type of packaging. Each charge was
divided into 8-10 sub-charges and fed to the furnace by using
the feeding system usually dedicated to the hospital waste. This
system consisted in individual containers which were filled
with the aluminium packaging and then automatically unloaded
in the feeding hopper. The system was completely automated.
The aluminium charge feeding took about 2 hours and the
boxes were discharged every 10-12 minutes. A good mixing of
the aluminium charge with the waste was guaranteed by
alternating the feeding of the two materials in the feeding
hopper. About 450-650 kg of packaging material was mixed
with 7-14 tons of waste, increasing its aluminium content from
about 1.7% to about 4.5-7.8% as reported in Table 4.4.
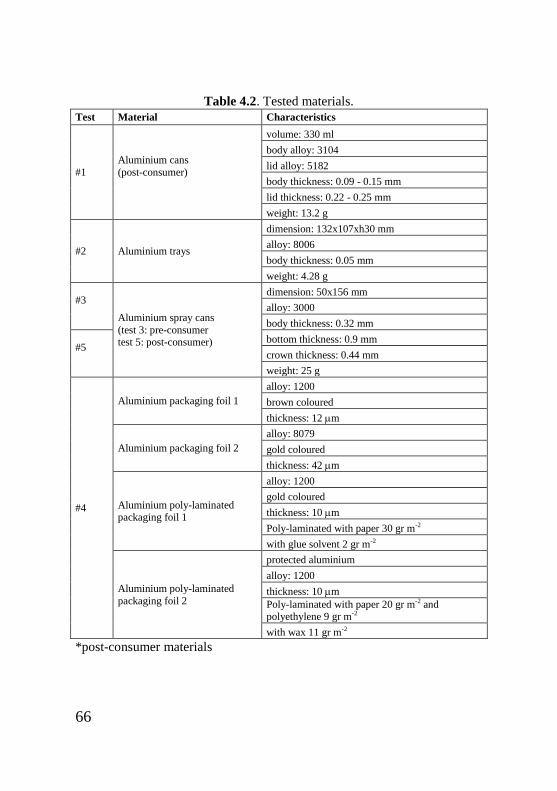
66
Table 4.2. Tested materials.
Test Material Characteristics
#1
Aluminium cans
(post-consumer)
volume: 330 ml
body alloy: 3104
lid alloy: 5182
body thickness: 0.09 - 0.15 mm
lid thickness: 0.22 - 0.25 mm
weight: 13.2 g
#2 Aluminium trays
dimension: 132x107xh30 mm
alloy: 8006
body thickness: 0.05 mm
weight: 4.28 g
#3
Aluminium spray cans
(test 3: pre-consumer test 5: post-consumer)
dimension: 50x156 mm
alloy: 3000
body thickness: 0.32 mm
#5
bottom thickness: 0.9 mm
crown thickness: 0.44 mm
weight: 25 g
#4
Aluminium packaging foil 1
alloy: 1200
brown coloured
thickness: 12 m
Aluminium packaging foil 2
alloy: 8079
gold coloured
thickness: 42 m
Aluminium poly-laminated packaging foil 1
alloy: 1200
gold coloured
thickness: 10 m
Poly-laminated with paper 30 gr m-2
with glue solvent 2 gr m-2
Aluminium poly-laminated
packaging foil 2
protected aluminium
alloy: 1200
thickness: 10 m
Poly-laminated with paper 20 gr m-2 and polyethylene 9 gr m-2
with wax 11 gr m-2
*post-consumer materials
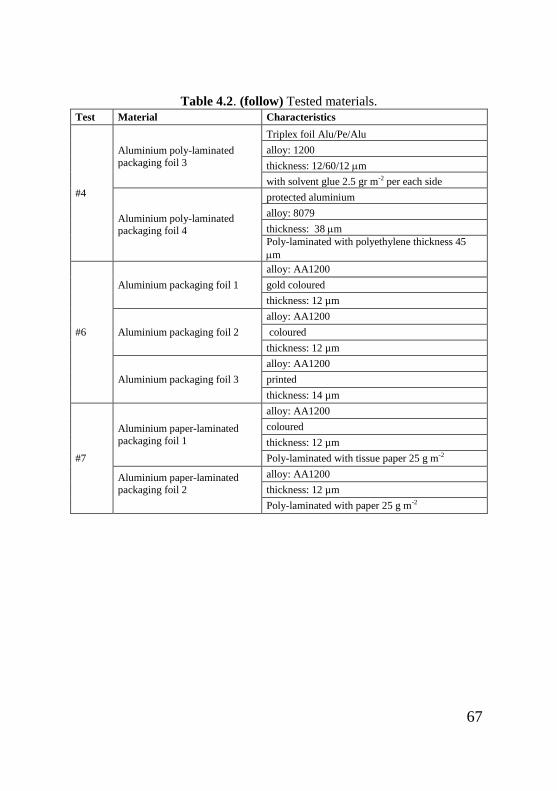
67
Table 4.2. (follow) Tested materials.
Test Material Characteristics
#4
Aluminium poly-laminated
packaging foil 3
Triplex foil Alu/Pe/Alu
alloy: 1200
thickness: 12/60/12 m
with solvent glue 2.5 gr m-2 per each side
Aluminium poly-laminated packaging foil 4
protected aluminium
alloy: 8079
thickness: 38 m
Poly-laminated with polyethylene thickness 45
m
#6
Aluminium packaging foil 1
alloy: AA1200
gold coloured
thickness: 12 µm
Aluminium packaging foil 2
alloy: AA1200
coloured
thickness: 12 µm
Aluminium packaging foil 3
alloy: AA1200
printed
thickness: 14 µm
#7
Aluminium paper-laminated
packaging foil 1
alloy: AA1200
coloured
thickness: 12 µm
Poly-laminated with tissue paper 25 g m-2
Aluminium paper-laminated packaging foil 2
alloy: AA1200
thickness: 12 µm
Poly-laminated with paper 25 g m-2
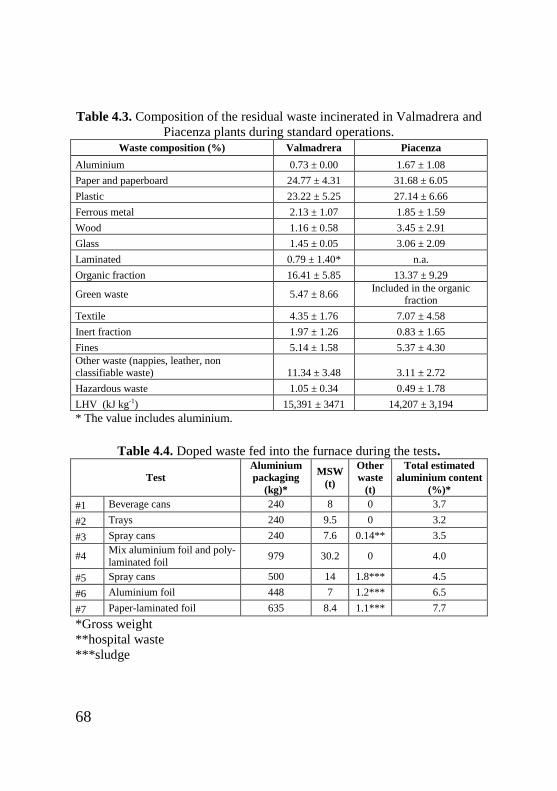
68
Table 4.3. Composition of the residual waste incinerated in Valmadrera and
Piacenza plants during standard operations.
Waste composition (%) Valmadrera Piacenza
Aluminium 0.73 ± 0.00 1.67 ± 1.08
Paper and paperboard 24.77 ± 4.31 31.68 ± 6.05
Plastic 23.22 ± 5.25 27.14 ± 6.66
Ferrous metal 2.13 ± 1.07 1.85 ± 1.59
Wood 1.16 ± 0.58 3.45 ± 2.91
Glass 1.45 ± 0.05 3.06 ± 2.09
Laminated 0.79 ± 1.40* n.a.
Organic fraction 16.41 ± 5.85 13.37 ± 9.29
Green waste 5.47 ± 8.66 Included in the organic
fraction
Textile 4.35 ± 1.76 7.07 ± 4.58
Inert fraction 1.97 ± 1.26 0.83 ± 1.65
Fines 5.14 ± 1.58 5.37 ± 4.30
Other waste (nappies, leather, non classifiable waste) 11.34 ± 3.48 3.11 ± 2.72
Hazardous waste 1.05 ± 0.34 0.49 ± 1.78
LHV (kJ kg-1) 15,391 ± 3471 14,207 ± 3,194
* The value includes aluminium.
Table 4.4. Doped waste fed into the furnace during the tests.
Test
Aluminium
packaging
(kg)*
MSW
(t)
Other
waste
(t)
Total estimated
aluminium content
(%)*
#1 Beverage cans 240 8 0 3.7
#2 Trays 240 9.5 0 3.2
#3 Spray cans 240 7.6 0.14** 3.5
#4 Mix aluminium foil and poly-
laminated foil 979 30.2 0 4.0
#5 Spray cans 500 14 1.8*** 4.5
#6 Aluminium foil 448 7 1.2*** 6.5
#7 Paper-laminated foil 635 8.4 1.1*** 7.7
*Gross weight
**hospital waste
***sludge
69
Bottom and fly ash were sampled every 30 minutes on average,
depending on the operating conditions of the plant, in order to
sample both the bottom and fly ashes resulting from the URW
usually burnt in the plant (blank samples) and those resulting
from the doped waste. Sampling of bottom ash was intensified
when its output started being affected by the doped waste
input. Bottom ash was sampled from the conveyor belt in a
quantity of about 5 kg per sample in the first tests on rigid
packaging and collected in plastic buckets. This amount was
increased to 10-15 kg during the tests devoted to aluminium
flexible packaging and the second test on spray cans, carried
out in Piacenza plant, because, following the preliminary
results of the first tests, this turned out to be a critical aspect.
In Valmadrera plant all the fly ash was sampled together at its
discharge in the big bags and collected in plastic pots of 1 l
each. The boiler was regularly cleaned every 100 minutes; each
cleaning cycle requires about 45 minutes. In Piacenza plant, on
the contrary, boiler ash, ESP ash and FF ash were sampled
separately from the redler transportation system, collecting the
ash from the openings used for the maintenance.
During the tests in Piacenza, some samples of the quenching
water of the bottom ash were taken from the quenching tank.
Aluminium potentially present in the flue gas at the stack was
voluntarily neglected as a previous research study focusing on
the balance of trace elements showed that it is negligible
(Stucchi, 2003).
The mass of the incinerated waste and the resulting residues
generated on average by the plant are summarized in Table 4.5.
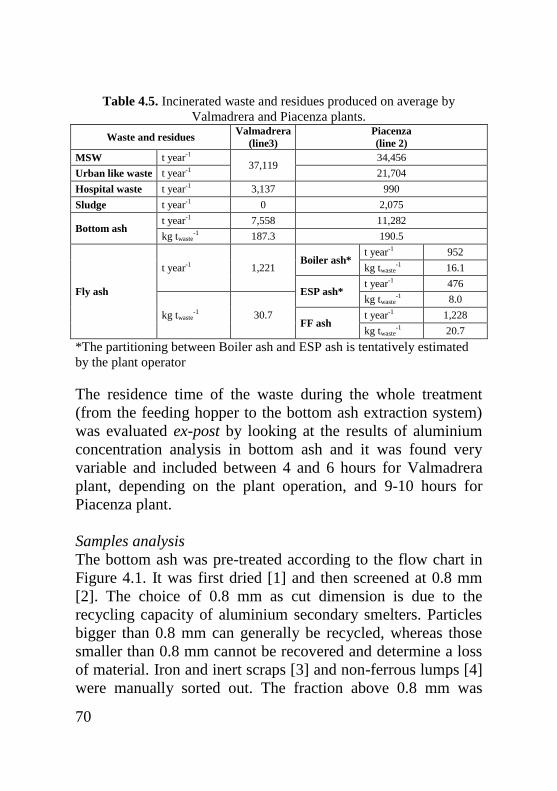
70
Table 4.5. Incinerated waste and residues produced on average by
Valmadrera and Piacenza plants.
Waste and residues Valmadrera
(line3)
Piacenza
(line 2)
MSW t year-1 37,119
34,456
Urban like waste t year-1 21,704
Hospital waste t year-1 3,137 990
Sludge t year-1 0 2,075
Bottom ash t year-1 7,558 11,282
kg twaste-1 187.3 190.5
Fly ash
t year-1 1,221 Boiler ash*
t year-1 952
kg twaste-1 16.1
ESP ash* t year-1 476
kg twaste-1 30.7
kg twaste-1 8.0
FF ash t year-1 1,228
kg twaste-1 20.7
*The partitioning between Boiler ash and ESP ash is tentatively estimated
by the plant operator
The residence time of the waste during the whole treatment
(from the feeding hopper to the bottom ash extraction system)
was evaluated ex-post by looking at the results of aluminium
concentration analysis in bottom ash and it was found very
variable and included between 4 and 6 hours for Valmadrera
plant, depending on the plant operation, and 9-10 hours for
Piacenza plant.
Samples analysis
The bottom ash was pre-treated according to the flow chart in
Figure 4.1. It was first dried [1] and then screened at 0.8 mm
[2]. The choice of 0.8 mm as cut dimension is due to the
recycling capacity of aluminium secondary smelters. Particles
bigger than 0.8 mm can generally be recycled, whereas those
smaller than 0.8 mm cannot be recovered and determine a loss
of material. Iron and inert scraps [3] and non-ferrous lumps [4]
were manually sorted out. The fraction above 0.8 mm was
71
grinded in a grindstone [5] in order to make its laboratory
analysis possible and afterwards it was further screened at 0.8
mm [6]. In this way it was possible to isolate the coarse
fraction (above 0.8 mm) rich of metals which, unlike the inert
material, are not crushed in the grindstone but just flattened.
The two inert fractions below 0.8 mm (before and after the
grinding) were analysed separately. In these fractions
aluminium is present in low amount and the content of metallic
aluminium was detected using caustic soda attack followed by
the measurement of the volume of the produced hydrogen,
while the content of total aluminium was evaluated with X-ray
fluorescence spectroscopy (XRF) [7]. The analysis of the
metallic aluminium using soda attack method is quite usual and
reported in other papers (Hu et al., 2011; Aubert et al., 2004).
The chemical reaction that controls the hydrogen production is
given in Eq. 4.1:
2Al + 2OH- + 2H2O 2AlO2
- + 3H2 (Eq. 4.1)
The fraction above 0.8 mm resulting from the second screening
underwent an iron sorting with magnet [8] and it was then
melted with salt (70% NaCl and 30% KCl) in the crucible [9]
together with the aluminium lumps manually sorted in the
previous steps. The melting process was carried out in a
smelter located in Northern Italy, following the standard
procedure they normally use to evaluate the metallic Al content
in the input scraps. However, the non-ferrous metals recovered
from the bottom ash were melted all together, without a
previous separation of the Al lumps from the other non-ferrous
scraps. As this non-ferrous mix had a lower content of Al
compared to the material usually treated in the smelter, the
efficiency of the melting process performed during our
investigation was lower than the true recycling efficiency of a
melting furnace, where such low quality materials are usually
diluted in a cleaner aluminium charge. The salt dross was
72
analysed with the same procedure as for the inert fraction of
the bottom ash, whereas the recoverable metal ingot was
analysed by an optic emission spectrometer (OES or
quantometer), in order to evaluate its content of Al (all
considered metallic) [10].
Some modifications in the procedure were introduced for the
samples of the test on aluminium flexible packaging in
Valmadrera and the three tests in Piacenza: the fraction above
0.8 mm resulting from the second screening, after iron sorting
with the magnet, was screened again with a 5 mm mesh screen
[11]. The fraction above 5 mm and the aluminium lumps
manually sorted, consisting almost entirely of aluminium and
other non-ferrous metals and representing non-ferrous metals
that can be separated with a traditional Eddy Current Separator
(ECS), were melted together to obtain the metal ingot. The
fraction between 0.8 and 5 mm, representing the material that
can be recovered only with advanced ECS, such as high
frequency ECS, wet backward ECS, Magnus separator
specifically calibrated, was melted separately and its dross
analysed with soda attack and XRF.
Fly ash samples were directly analysed with soda attack and
XRF in order to determine their contents of metallic and total
aluminium, respectively ([7] in Figure 4.1).
The bottom ash quenching water, sampled during the tests in
Piacenza plant, was analysed through inductively coupled
plasma mass spectrometry (IPC-MS) to measure its
concentration of total Al.
The tests in Piacenza saw some differences and improvements
for what concerns samples analysis, compared to those in
Valmadrera.
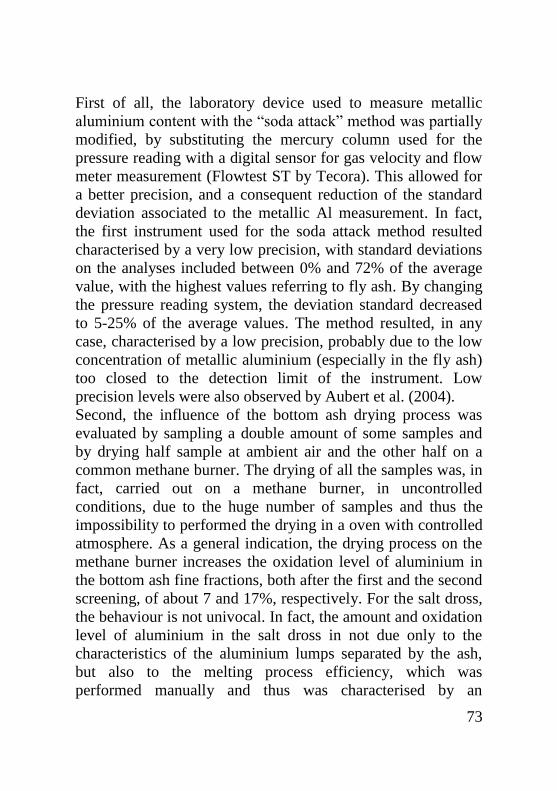
73
First of all, the laboratory device used to measure metallic
aluminium content with the “soda attack” method was partially
modified, by substituting the mercury column used for the
pressure reading with a digital sensor for gas velocity and flow
meter measurement (Flowtest ST by Tecora). This allowed for
a better precision, and a consequent reduction of the standard
deviation associated to the metallic Al measurement. In fact,
the first instrument used for the soda attack method resulted
characterised by a very low precision, with standard deviations
on the analyses included between 0% and 72% of the average
value, with the highest values referring to fly ash. By changing
the pressure reading system, the deviation standard decreased
to 5-25% of the average values. The method resulted, in any
case, characterised by a low precision, probably due to the low
concentration of metallic aluminium (especially in the fly ash)
too closed to the detection limit of the instrument. Low
precision levels were also observed by Aubert et al. (2004).
Second, the influence of the bottom ash drying process was
evaluated by sampling a double amount of some samples and
by drying half sample at ambient air and the other half on a
common methane burner. The drying of all the samples was, in
fact, carried out on a methane burner, in uncontrolled
conditions, due to the huge number of samples and thus the
impossibility to performed the drying in a oven with controlled
atmosphere. As a general indication, the drying process on the
methane burner increases the oxidation level of aluminium in
the bottom ash fine fractions, both after the first and the second
screening, of about 7 and 17%, respectively. For the salt dross,
the behaviour is not univocal. In fact, the amount and oxidation
level of aluminium in the salt dross in not due only to the
characteristics of the aluminium lumps separated by the ash,
but also to the melting process efficiency, which was
performed manually and thus was characterised by an
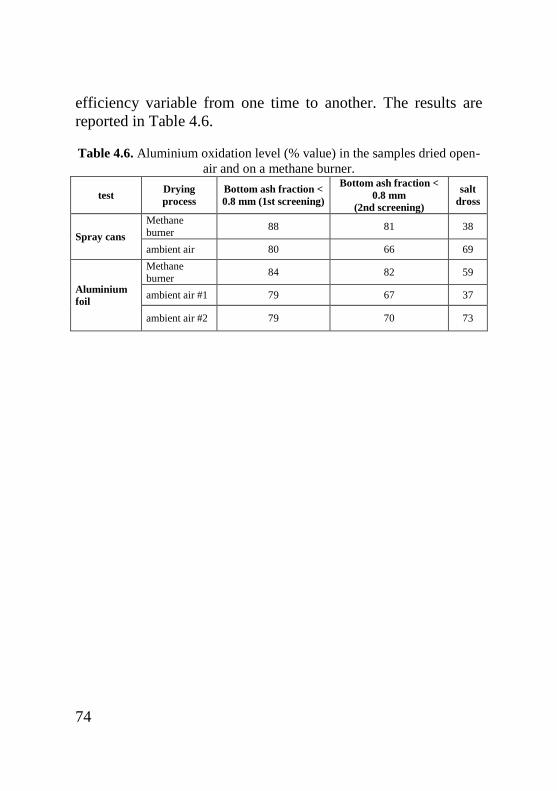
74
efficiency variable from one time to another. The results are
reported in Table 4.6.
Table 4.6. Aluminium oxidation level (% value) in the samples dried open-
air and on a methane burner.
test Drying
process
Bottom ash fraction <
0.8 mm (1st screening)
Bottom ash fraction <
0.8 mm
(2nd screening)
salt
dross
Spray cans
Methane
burner 88 81 38
ambient air 80 66 69
Aluminium
foil
Methane
burner 84 82 59
ambient air #1 79 67 37
ambient air #2 79 70 73

75
XRF: X-ray fluorescence spectroscopy
OES: optic emission spectrometer
Figure 4.1. Samples treatment and analysis.
SCREENING (5 mm)
only for tests 4-5-6-7
[11]
> 0.8 mm
MELTING [9]
IRON SORTING WITH MAGNET
[8]
XRF + SODA ATTACK
[7]
OES [10]
WASTE > 0.8 mm
BOTTOM ASH
DRYING [1]
SCREENING (0.8 mm)
[2]
XRF + SODA ATTACK
[7]
MANUAL SORTING IRON +
INERT SCRAPS [3]
SCREENING (0.8 mm)
[6]
GRINDING [5]
MANUAL SORTING
ALUMINIUM LUMPS
[4]
Iron + Inert
< 0.8 mm
Iron
Ingot Salt dross
XRF + SODA ATTACK
[7]
FLY ASH
Al lumps
<0.8 mm
76
Data processing
Data from the samples analysis were treated in order to exclude
the contribution of the aluminium which is naturally present in
the waste (background concentration) and, thus, to evaluate the
mass balance of the aluminium packaging materials fed
artificially to the furnace of the two incineration plants. First of
all, the average total and metallic aluminium in the residues
resulting from the non-doped waste was evaluated, for each
residue and for each test, by averaging the corresponding
values obtained by the analysis of the samples representative of
the non-doped waste, namely those samples which lay outside
the time period during which the effect of doping is clearly
visible. Then the aluminium content in the residues
representative of the doped waste was estimated by numerical
integration of the concentration curve (aluminium % in the
samples) during the time frame where the growth trend is
located. Finally, the contribution (kgAl kg-1
residue min) of the
aluminium packaging fed to furnace was evaluated as the
difference between the aluminium content in the residues
representative of the doped waste and in that representative of
the background residual waste as it is. The procedure is
graphically represented in Figure 4.2.
The aluminium flow rate in the residues produced by the
incineration process was then calculated by multiplying the
contribution of the packaging in each fraction, evaluated as
previously illustrated, by the corresponding flow rate properly
converted into kg min-1
.
Data referred to the salt dross were considered only for the
tests performed in Piacenza plant. On the contrary, for what
concerns the packaging materials tested in Valmadrera, data on
the salt dross were not included in the mass balance, since they
did not reveal any significant variation between the samples
representative of the non-doped waste and those representative
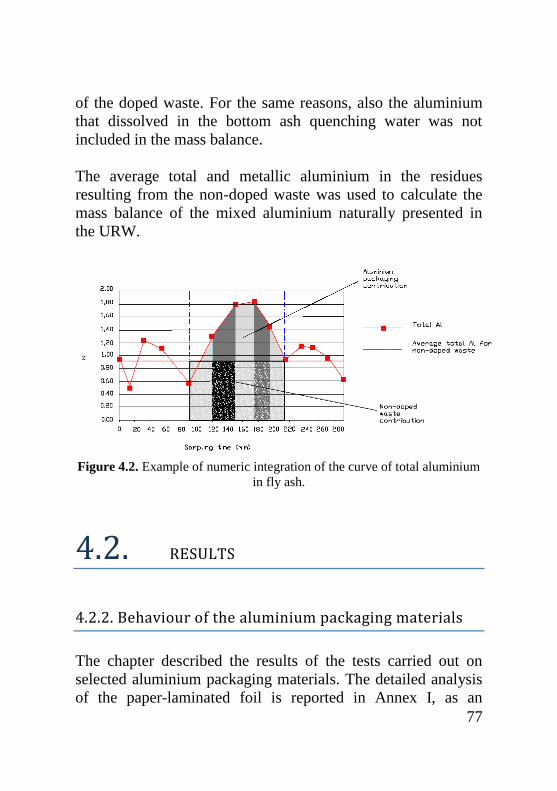
77
of the doped waste. For the same reasons, also the aluminium
that dissolved in the bottom ash quenching water was not
included in the mass balance.
The average total and metallic aluminium in the residues
resulting from the non-doped waste was used to calculate the
mass balance of the mixed aluminium naturally presented in
the URW.
Figure 4.2. Example of numeric integration of the curve of total aluminium
in fly ash.
4.2. RESULTS
4.2.2. Behaviour of the aluminium packaging materials The chapter described the results of the tests carried out on
selected aluminium packaging materials. The detailed analysis
of the paper-laminated foil is reported in Annex I, as an
78
example. The analysis of the other packaging materials was
performed in the same way and, for this reason, it is not
reported in the thesis.
Aluminium flow rate
The results of the tests are graphically represented in Figure
4.3. The Figure illustrates the partitioning of total aluminium in
the residues of the incineration process. It is important to
distinguish between the tests carried out in Valmadrera plant
and that carried out in Piacenza. In fact, the two plants present
some differences, especially for what concerns the grate and
the bottom ash extraction system. In addition the sampling
procedure and the samples analysis present some differences
between the two campaigns. The figure reports also the results
of the non-doped waste, which will be discuss in the next
chapter.
Mass balance was evaluated by neglecting the amount of
aluminium that fell through the grate and stuck on its surfaces.
For Valmadrera tests, also the amount of aluminium that was
not fed into the furnace but lost in the waste bunker was not
considered.
Ingots fraction is representative of the metal actually
recoverable from the bottom ash and, since it is the result of the
melting process, this value includes also the efficiency of the
actual recycling process. On the contrary, the aluminium in the
other residues (fly ash, bottom ash below 0.8 mm before and
after grinding) represents a loss, because it cannot be
recovered. In fact, in both bottom ash fine fractions (below 0.8
mm before and after grinding), aluminium metal fragments are
extremely small in size and their recovery is virtually
impossible using the current ECS technology.
79
The amount of aluminium found in fly ash is below 7% for all
the types of packaging; regardless of the peculiarities of each
packaging or alloy, this amount is in any case negligible.
In contrast, data corresponding to the fine fractions (below 0.8
mm) of bottom ash, both the “true” fine fraction (resulting
from the first screening) and the one obtained after grinding,
are characterized by high variability.
Total aluminium partitioning in the fraction below 0.8 mm
before grinding varies between 3.3% for cans and 20.5% for
the mix of aluminium foils and of poly-laminated foils. This
variability may be related to the characteristics of the
packaging and the alloy, as well as to the operating conditions
of the plant during the tests. More specifically, the highest
contents of aluminium was found for the paper-laminated foil
(18.6%) and the mix of foils (20.5%) and these results might be
explained mainly by the structure of packaging. Compared to
cans, the thickness and the technical strength of the foils are
lower and lumps that form in the furnace are characterized by
very small dimensions: this may facilitate their migration in the
fine fraction of bottom ash.
Total aluminium partitioning in the fraction below 0.8 mm
after grinding varies between 9.4% for cans and 51.1% for the
mix of foils. The value related to cans is very low if compared
to the others (28.7% the paper-laminated foils, 38.0% for trays
and 51.1% the mix of aluminium foils and poly-laminated
foils). For this type of packaging, total aluminium partitioning
in the two fine fractions of bottom ash sums up to 12.7%: it
follows that the loss of recoverable material is very small, as it
is confirmed by the high amount of aluminium recovered as
ingots. Similarly to what happens in the fine fraction before
grinding, the high value found for foils is once again explicable
by the structure of the packaging and the size of aluminium
lumps.

80
Concerning the ingots from the melting process, there are many
differences between the four types of packaging: about 81% of
the aluminium in cans, 51% in trays, 47% in paper-laminated
foils and 27% in the mix of foils was actually recovered from
the bottom ash as ingots.
The relationship between aluminium packaging thickness and
the recoverable amount of aluminium from the incineration
residues is shown in Figure 4.4.
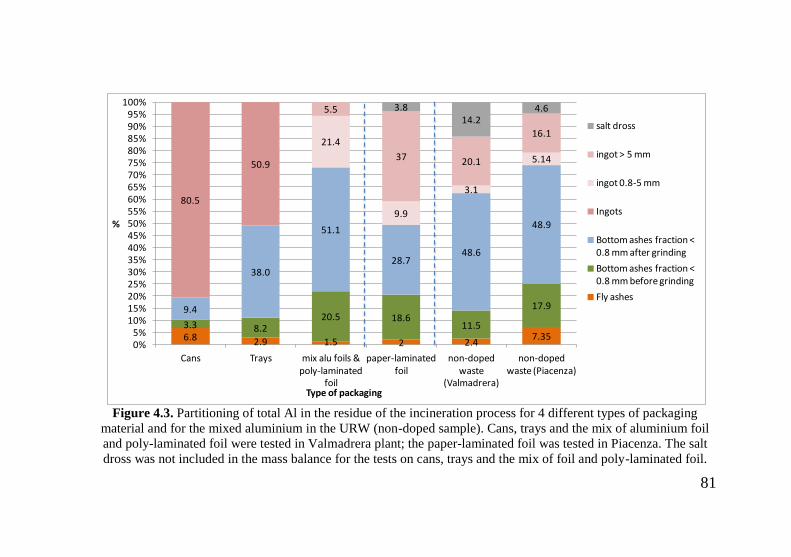
81
Figure 4.3. Partitioning of total Al in the residue of the incineration process for 4 different types of packaging
material and for the mixed aluminium in the URW (non-doped sample). Cans, trays and the mix of aluminium foil
and poly-laminated foil were tested in Valmadrera plant; the paper-laminated foil was tested in Piacenza. The salt
dross was not included in the mass balance for the tests on cans, trays and the mix of foil and poly-laminated foil.
6.8 2.9 1.5 2 2.47.35
3.3 8.220.5 18.6
11.5
17.99.4
38.0
51.1
28.748.6
48.9
80.5
50.9
21.4
9.9
3.1
5.14
5.5
37 20.1
16.1
3.814.2
4.6
0%5%
10%15%20%25%30%35%40%45%50%55%60%65%70%75%80%85%90%95%
100%
Cans Trays mix alu foils & poly-laminated
foil
paper-laminated foil
non-doped waste
(Valmadrera)
non-doped waste (Piacenza)
%
Type of packaging
salt dross
ingot > 5 mm
ingot 0.8-5 mm
Ingots
Bottom ashes fraction < 0.8 mm after grinding
Bottom ashes fraction < 0.8 mm before grinding
Fly ashes
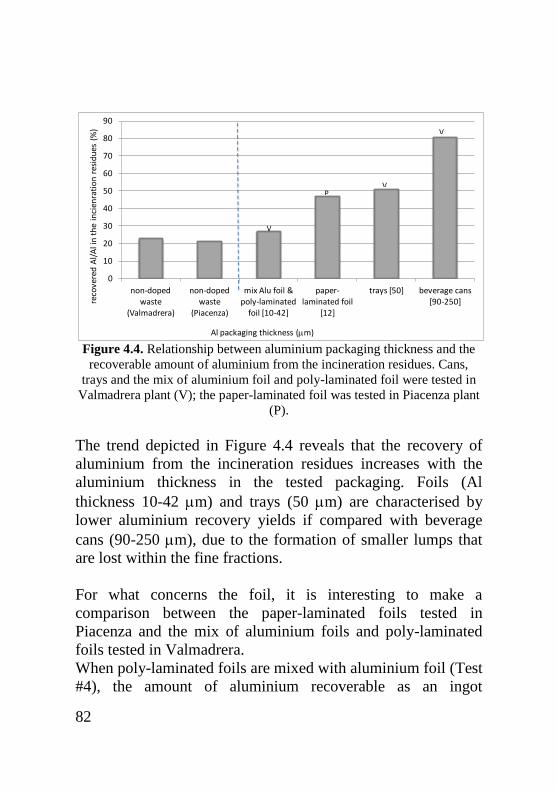
82
Figure 4.4. Relationship between aluminium packaging thickness and the
recoverable amount of aluminium from the incineration residues. Cans,
trays and the mix of aluminium foil and poly-laminated foil were tested in
Valmadrera plant (V); the paper-laminated foil was tested in Piacenza plant
(P).
The trend depicted in Figure 4.4 reveals that the recovery of
aluminium from the incineration residues increases with the
aluminium thickness in the tested packaging. Foils (Al
thickness 10-42 m) and trays (50 m) are characterised by
lower aluminium recovery yields if compared with beverage
cans (90-250 m), due to the formation of smaller lumps that
are lost within the fine fractions.
For what concerns the foil, it is interesting to make a
comparison between the paper-laminated foils tested in
Piacenza and the mix of aluminium foils and poly-laminated
foils tested in Valmadrera.
When poly-laminated foils are mixed with aluminium foil (Test
#4), the amount of aluminium recoverable as an ingot
0
10
20
30
40
50
60
70
80
90
non-doped waste
(Valmadrera)
non-doped waste
(Piacenza)
mix Alu foil & poly-laminated
foil [10-42]
paper-laminated foil
[12]
trays [50] beverage cans [90-250]re
cove
red
Al/
Al i
n t
he
inci
enra
tio
n r
esid
ues
(%
)
Al packaging thickness (m)
V
PV
V
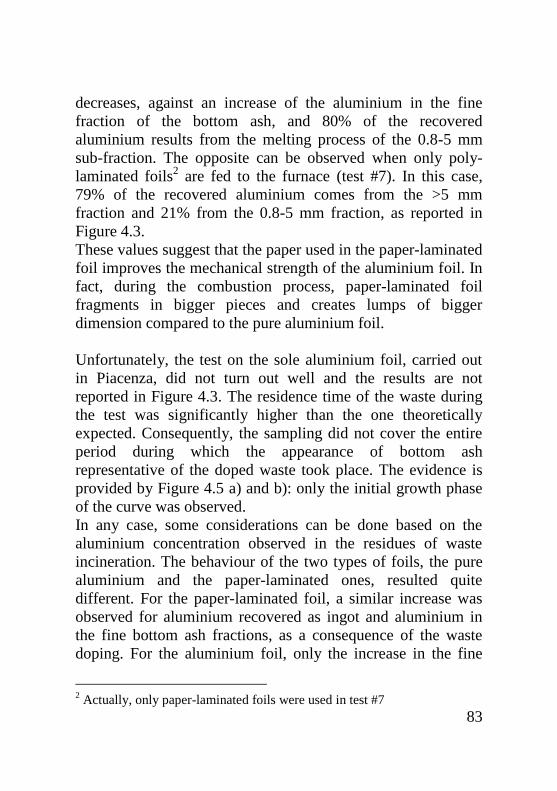
83
decreases, against an increase of the aluminium in the fine
fraction of the bottom ash, and 80% of the recovered
aluminium results from the melting process of the 0.8-5 mm
sub-fraction. The opposite can be observed when only poly-
laminated foils2 are fed to the furnace (test #7). In this case,
79% of the recovered aluminium comes from the >5 mm
fraction and 21% from the 0.8-5 mm fraction, as reported in
Figure 4.3.
These values suggest that the paper used in the paper-laminated
foil improves the mechanical strength of the aluminium foil. In
fact, during the combustion process, paper-laminated foil
fragments in bigger pieces and creates lumps of bigger
dimension compared to the pure aluminium foil.
Unfortunately, the test on the sole aluminium foil, carried out
in Piacenza, did not turn out well and the results are not
reported in Figure 4.3. The residence time of the waste during
the test was significantly higher than the one theoretically
expected. Consequently, the sampling did not cover the entire
period during which the appearance of bottom ash
representative of the doped waste took place. The evidence is
provided by Figure 4.5 a) and b): only the initial growth phase
of the curve was observed.
In any case, some considerations can be done based on the
aluminium concentration observed in the residues of waste
incineration. The behaviour of the two types of foils, the pure
aluminium and the paper-laminated ones, resulted quite
different. For the paper-laminated foil, a similar increase was
observed for aluminium recovered as ingot and aluminium in
the fine bottom ash fractions, as a consequence of the waste
doping. For the aluminium foil, only the increase in the fine
2 Actually, only paper-laminated foils were used in test #7
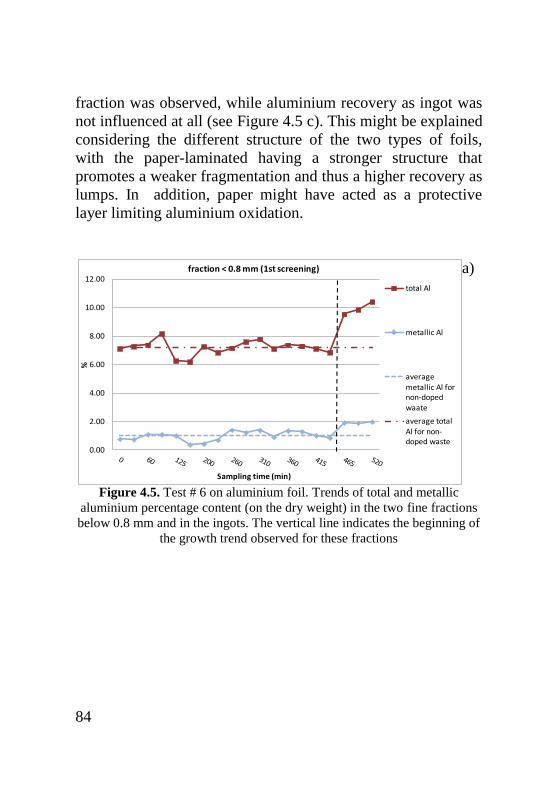
84
fraction was observed, while aluminium recovery as ingot was
not influenced at all (see Figure 4.5 c). This might be explained
considering the different structure of the two types of foils,
with the paper-laminated having a stronger structure that
promotes a weaker fragmentation and thus a higher recovery as
lumps. In addition, paper might have acted as a protective
layer limiting aluminium oxidation.
a)
Figure 4.5. Test # 6 on aluminium foil. Trends of total and metallic
aluminium percentage content (on the dry weight) in the two fine fractions
below 0.8 mm and in the ingots. The vertical line indicates the beginning of
the growth trend observed for these fractions
0.00
2.00
4.00
6.00
8.00
10.00
12.00
%
Sampling time (min)
fraction < 0.8 mm (1st screening)
total Al
metallic Al
average
metallic Al for non-doped waate
average total
Al for non-doped waste
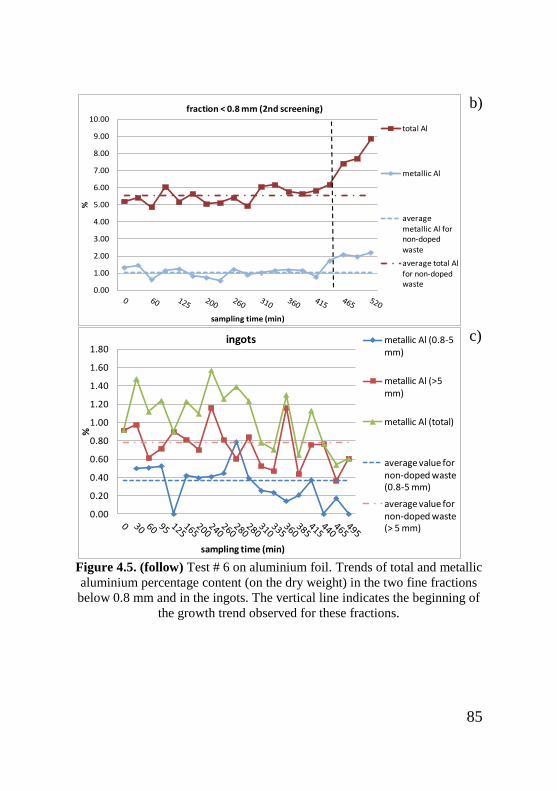
85
b)
c)
Figure 4.5. (follow) Test # 6 on aluminium foil. Trends of total and metallic
aluminium percentage content (on the dry weight) in the two fine fractions
below 0.8 mm and in the ingots. The vertical line indicates the beginning of
the growth trend observed for these fractions.
0.00
1.00
2.00
3.00
4.00
5.00
6.00
7.00
8.00
9.00
10.00
%
sampling time (min)
fraction < 0.8 mm (2nd screening)
total Al
metallic Al
average metallic Al for non-doped waste
average total Al for non-doped waste
0.00
0.20
0.40
0.60
0.80
1.00
1.20
1.40
1.60
1.80
%
sampling time (min)
ingots metallic Al (0.8-5 mm)
metallic Al (>5 mm)
metallic Al (total)
average value for non-doped waste (0.8-5 mm)
average value for non-doped waste (> 5 mm)

86
As for the aluminium foil, figure 4.3. does not report the results
of the two tests on spray cans, both the one carried out in
Valmadrera and the one in Piacenza. In both the cases, in fact,
the experimentation did not turn out well. Spray cans are
characterised by thick walls and, during the combustion
process, they create lumps of big dimension. When aluminium
is present in small sized lump units, the loss of a lump or a
fragment during the sampling does not significantly alter its
average concentration. However, if lumps are big and limited
in number, the loss of a single unit in the sampling phase
substantially alters the results. During the test on spray cans in
Valmadrera plant (test #3), sampling conditions of bottom ash
were extremely harsh3 and it is very likely that several lumps
were lost during sampling operations, thus affecting the results
of the analysis, as it is visible in Figure 4.6.
During the test on spray cans carried out in Piacenza (test #5),
the sampling time was probably too short to see the effect of
the waste doping and the percentage content of metallic
aluminium in the ingots shows an irregular trend, apparently
not linked to the doping of the waste, as represented in Figure
4.7. This implies that it was impossible to estimate the waste
residence time and consequently the time interval for the
numerical integration of the curve.
Despite the impossibility to evaluate the aluminium mass
balance for the spray cans, an interesting consideration can be
done on their behaviour in the furnace. Based on the
aluminium concentration in the fly ash depicted in Figure 4.8,
it is evident that spray cans do not influence the aluminium
concentration in the fly ash. This can be explained by the
structure of the spray cans, which are the thickest and more
3 A huge amount of vapours from the bottom ash pit prevented to have a
clear view of the material during sampling operations.
87
robust among all tested packaging. The low specific surface
and the mechanical properties promote the formation of big
lumps with concentrate in bottom ash, whereas the
fragmentation in little pieces that can leave the waste entrained
by the flue gas is negligible.
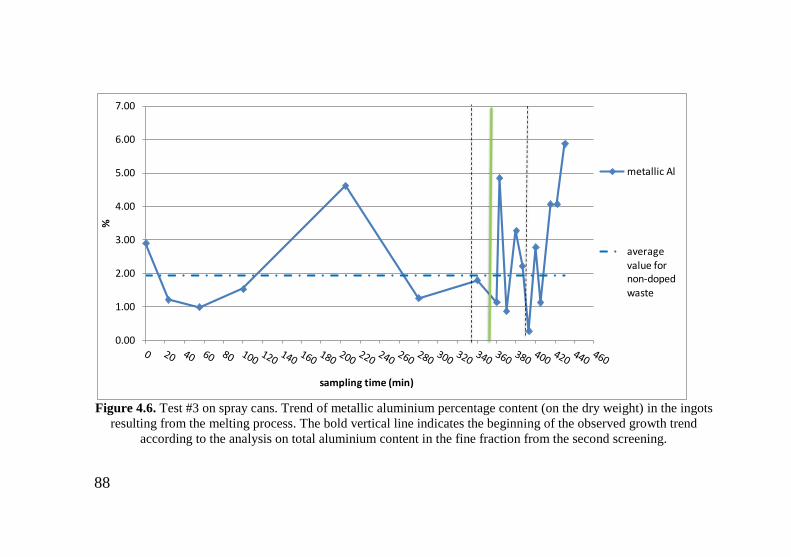
88
Figure 4.6. Test #3 on spray cans. Trend of metallic aluminium percentage content (on the dry weight) in the ingots
resulting from the melting process. The bold vertical line indicates the beginning of the observed growth trend
according to the analysis on total aluminium content in the fine fraction from the second screening.
0.00
1.00
2.00
3.00
4.00
5.00
6.00
7.00%
sampling time (min)
metallic Al
average value for non-doped
waste
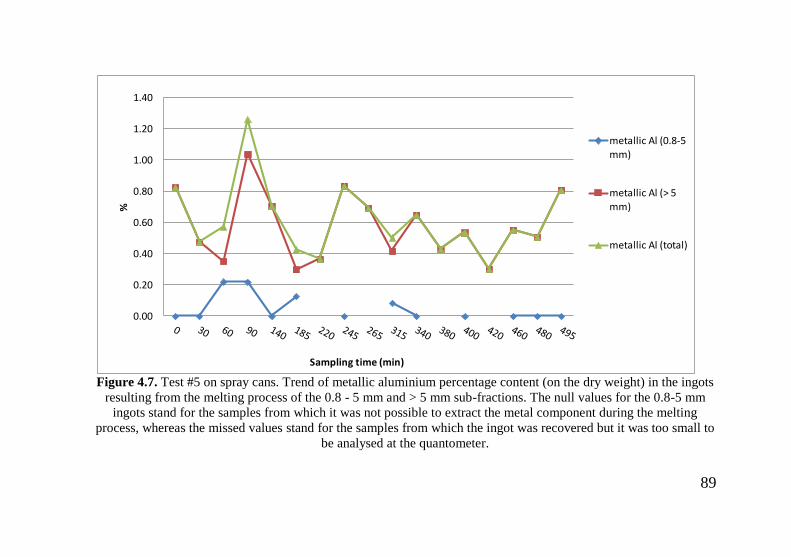
89
Figure 4.7. Test #5 on spray cans. Trend of metallic aluminium percentage content (on the dry weight) in the ingots
resulting from the melting process of the 0.8 - 5 mm and > 5 mm sub-fractions. The null values for the 0.8-5 mm
ingots stand for the samples from which it was not possible to extract the metal component during the melting
process, whereas the missed values stand for the samples from which the ingot was recovered but it was too small to
be analysed at the quantometer.
0.00
0.20
0.40
0.60
0.80
1.00
1.20
1.40
%
Sampling time (min)
metallic Al (0.8-5 mm)
metallic Al (> 5 mm)
metallic Al (total)
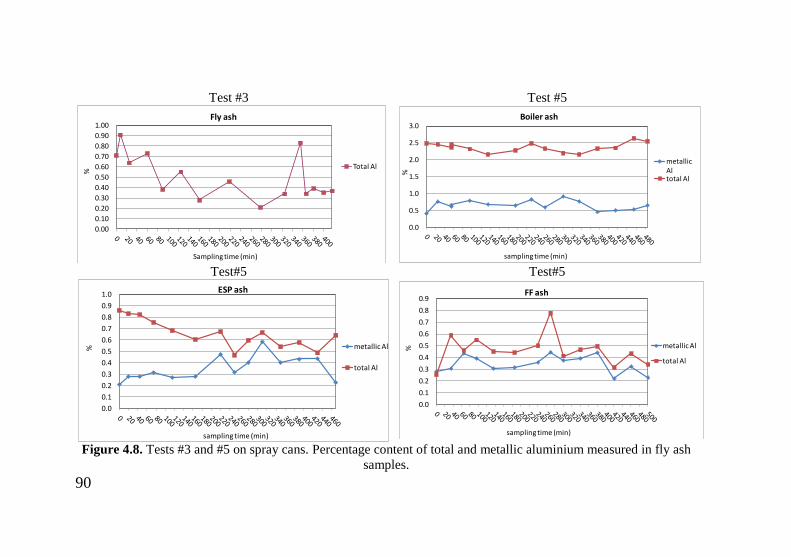
90
Test #3 Test #5
Test#5 Test#5
Figure 4.8. Tests #3 and #5 on spray cans. Percentage content of total and metallic aluminium measured in fly ash
samples.
0.00
0.10
0.20
0.30
0.40
0.50
0.60
0.70
0.80
0.90
1.00
%
Sampling time (min)
Fly ash
Total Al
0.0
0.5
1.0
1.5
2.0
2.5
3.0
%
sampling time (min)
Boiler ash
metallic Altotal Al
0.0
0.1
0.2
0.3
0.4
0.5
0.6
0.7
0.8
0.9
1.0
%
sampling time (min)
ESP ash
metallic Al
total Al
0.0
0.1
0.2
0.3
0.4
0.5
0.6
0.7
0.8
0.9
%
sampling time (min)
FF ash
metallic Al
total Al

91
Aluminium oxidation
Values in Table 4.7 reports the percentage of aluminium in its
metallic form for the tested packaging. Data about the non-
doped waste will be discuss later.
Average values show the importance of the packaging
thickness: the thicker the packaging is, the less it is oxidised
during the combustion process. This is a consequence of the
less surface area exposed to the oxidising gases. Of course
thickness is not the only parameter influencing the behaviour
of the packaging materials. The packaging technical strength
plays an important role, avoiding the fragmentation of the
material and the consequent increasing of the exposed surface.
As it is clear from Figure 4.9, the percentage of Al in the
metallic form decreases when the poly-laminated foil is mixed
with the aluminium foil, even if the thickness of the Al layer in
the poly-laminated foil is lower than that of the pure aluminium
foil. Paper acts as a protective layer, not only improving the
mechanical strength of the packaging but also preventing Al
oxidation.
These results call in question the CEN standard 1343 1:2004
that considers the Al foil < 50 m recoverable in the form of
energy, and thus completely oxidised. From our results, about
50% of the Al in the foils is present in the metallic form,
despite the low thickness of these packaging materials. This
suggests a revision of the standard, based on full-scale tests, in
order to define new rules to account the Al fed to incineration
furnaces for energy recovery or for material recovery.
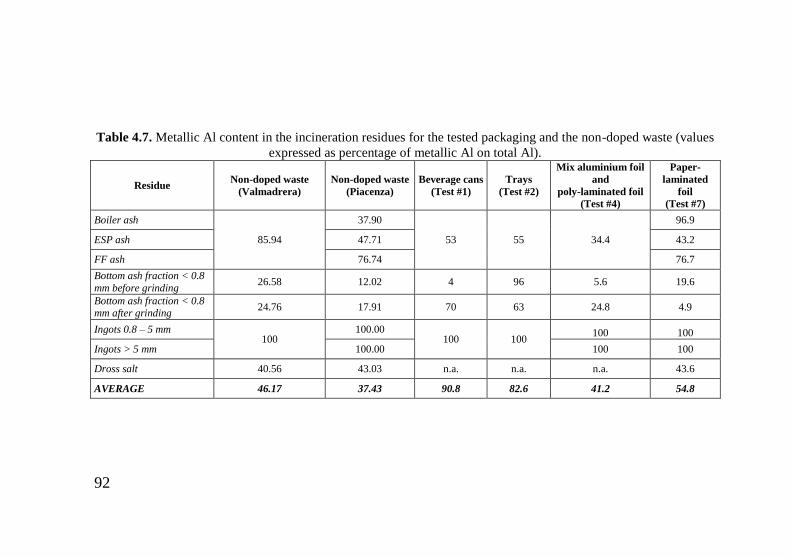
92
Table 4.7. Metallic Al content in the incineration residues for the tested packaging and the non-doped waste (values
expressed as percentage of metallic Al on total Al).
Residue Non-doped waste
(Valmadrera)
Non-doped waste
(Piacenza)
Beverage cans
(Test #1)
Trays
(Test #2)
Mix aluminium foil
and
poly-laminated foil
(Test #4)
Paper-
laminated
foil
(Test #7)
Boiler ash
85.94
37.90
53 55 34.4
96.9
ESP ash 47.71 43.2
FF ash 76.74 76.7
Bottom ash fraction < 0.8
mm before grinding 26.58 12.02 4 96 5.6 19.6
Bottom ash fraction < 0.8 mm after grinding
24.76 17.91 70 63 24.8 4.9
Ingots 0.8 – 5 mm 100
100.00 100 100
100 100
Ingots > 5 mm 100.00 100 100
Dross salt 40.56 43.03 n.a. n.a. n.a. 43.6
AVERAGE 46.17 37.43 90.8 82.6 41.2 54.8
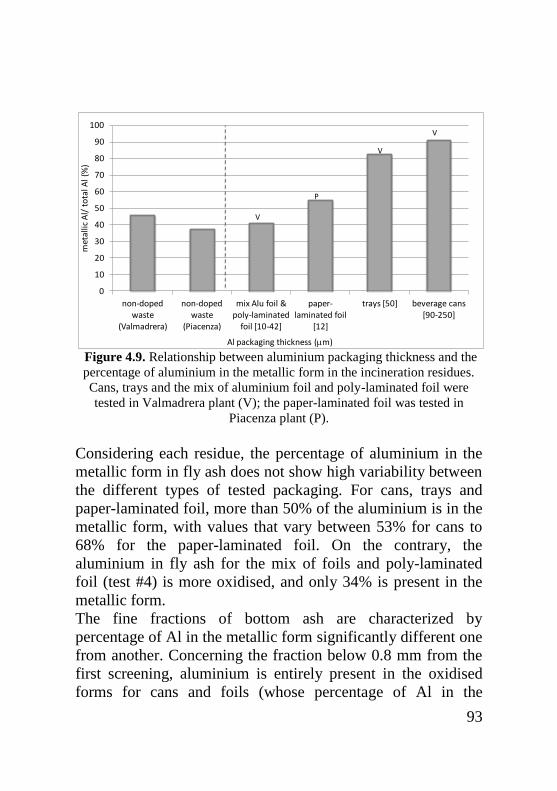
93
Figure 4.9. Relationship between aluminium packaging thickness and the
percentage of aluminium in the metallic form in the incineration residues.
Cans, trays and the mix of aluminium foil and poly-laminated foil were
tested in Valmadrera plant (V); the paper-laminated foil was tested in
Piacenza plant (P).
Considering each residue, the percentage of aluminium in the
metallic form in fly ash does not show high variability between
the different types of tested packaging. For cans, trays and
paper-laminated foil, more than 50% of the aluminium is in the
metallic form, with values that vary between 53% for cans to
68% for the paper-laminated foil. On the contrary, the
aluminium in fly ash for the mix of foils and poly-laminated
foil (test #4) is more oxidised, and only 34% is present in the
metallic form.
The fine fractions of bottom ash are characterized by
percentage of Al in the metallic form significantly different one
from another. Concerning the fraction below 0.8 mm from the
first screening, aluminium is entirely present in the oxidised
forms for cans and foils (whose percentage of Al in the
0
10
20
30
40
50
60
70
80
90
100
non-doped waste
(Valmadrera)
non-doped waste
(Piacenza)
mix Alu foil & poly-laminated
foil [10-42]
paper-laminated foil
[12]
trays [50] beverage cans [90-250]
met
allic
Al/
to
tal A
l (%
)
Al packaging thickness (m)
V
P
V
V

94
metallic form is equal to 4% for cans, 5.6% for the mix of foils
and poly-laminated foils and 20% for the paper-laminated foil),
whereas it is almost all in its metallic form for trays (96%).
Concerning the fine fraction obtained from the second
screening, the highest percentages of Al in the metallic form
belong to cans and trays (70% and 63%, respectively), while
foils are more oxidised (percentage of Al in the metallic form
equal to 25% for the mix of foils and poly-laminated foils and
5% for the paper-laminated foils).
4.2.3. Non-doped waste
Aluminium flow rate
The aluminium partitioning in the residues of the incineration
process was evaluated for the standard operating conditions of
the two plants of Valmadrera and Piacenza. The results are
reported in Figure 4.3.
The partition of aluminium in the residues of the combustion
process results quite similar for the two plants. On average,
about 61-67% of the aluminium concentrates in the fine
fraction of the bottom ash and cannot be recovered with the
current technologies. Only 21-23% can be thus recovered from
the bottom ash and recycled as ingots. Out of this amount, 13-
24% comes from the bottom ash fraction included between 0.8
and 5 mm and 76-87% from the fraction bigger than 5 mm.
This means that, even if most of the aluminium scraps are
recoverable through standard eddy current technologies, a non
negligible amount can be recovered only in advanced treatment
plant, equipped with a grinding stage and advanced eddy
current separators.
95
The aluminium that during the combustion process
concentrates in the fly ash results negligible and included
between 2.5 and 7%.
For what concerns the data about the salt dross, it must be said
that the melting process performed during the experimentation
was characterized by a very low efficiency compared to the
industrial process. In fact, the non-ferrous scraps recovered
from the ash were melted together despite the high content of
other-non ferrous metals. On the contrary, in the industrial
processes, the non-ferrous scraps recovered from the bottom
ash are diluted in a mix of pure Al scraps, achieving a better
recycling efficiency. If we include the metallic Al lost in the
salt dross during the melting process, the amount of Al
potentially recoverable and recyclable from the ash thus
increases up to 23-29%.
Comparing aluminium partitioning in the residues of the
incineration process for the non-doped waste and for the
selected packaging materials, we notice that the data of the
URW are similar to that obtained for the foils. This seems to
suggest that most of the aluminium in the URW consists of
flexible packaging, like aluminium foil and poly-laminated
foil. In fact, while the separated collection of cans and spray
cans is well established and achieves a good efficiency, that of
the flexible packaging is more complex. Most of this materials
is in fact used during cooking and, being contaminated by food
residues, is not collected at the source but thrown away in the
URW. The recovery of these flexible packaging materials from
the bottom ash is therefore very interesting and represents an
important challenge, since it is complicated by the little
dimension of the ingots that they form during the combustion
process.
96
Aluminium oxidation and energy recovery
Less than 50% of the aluminium in the non-doped waste is
present on average in the residues in the metallic form, as
reported in Table 4.7. The plant design seems to have some
influence on the observed data. Valmadrera plant, which is
equipped with a forward-acting grate, shows a higher
percentage of metallic Al compared to Piacenza plant,
equipped with a backward-acting grate. Furthermore, the
residence time of the waste on the grate and in the bottom ash
extraction turned to be longer in Piacenza plant (9-10 hours in
Piacenza plant and 4-6 hours in Valmadrea), which means that
the aluminium scraps are exposed for a longer time to high
temperature oxidation processes.
Even if most of the aluminium is presented in its oxidised form
and thus cannot be recovered as material, it contributes to the
energy developed during the combustion process. In fact, at
combustion temperatures above 850°C, the complete oxidation
of 1 kg Al into Al2O3 releases 31 MJ of energy, which
corresponds to the same amount released by 1 kg of coal or 0.8
kg of fuel. The energy potentially recoverable from aluminium
oxidation in the waste is reported in Table 4.8. It must be
specified that all the oxidised aluminium has been assumed as
Al2O3, thus resulting in a specific energy release equal to 31
MJ/kg. This is not necessarily true because aluminium in the
3+ oxidation state might be present in other mineral phases
(such as ettringite, zeolites or other alumino-calcium hydrate
compounds), resulting in different specific energy releases.
Therefore, the results of the calculation must be considered as
rough estimates.
On average, aluminium contribution to the energy released by
the waste during the combustion process resulted equal to 1%,
almost proportional to its presence in the waste.
97
Table 4.8. Potential for energy recovery from the oxidation of aluminium
scraps in non-doped waste.
Oxidised Al
(kg /tURW)
energy release
from Al
(MJ/tURW)
LHV waste
(MJ/t)
Energy contribution
of Al (%)
non-doped
waste
(Valmadrera)
5.71 177.12 15391 1.15
non-doped waste
(Piacenza)
4.62 143.25 14207 1.01
Other non-ferrous metals
Table 4.9 shows the average content of the principal elements
in the ingots obtained from the melting process in the crucible
for the non-doped waste. The results are reported separately for
the tests carried out in Valmadrera plant (where all the non-
ferrous metals were melted together) and in Piacenza plant
(where the melting process was performed separately for the
fraction < 5mm and > 5 mm).
As a general indication, the highest content of metals other
than aluminium was found for Cu and Zn, in this order. On
average the ingots recovered from Piacenza bottom ash are
richer of other non-ferrous metals compared to those of
Valmadrera plant.
For what concerns Piacenza plant, almost all the metal content
in the ingots obtained from the melting of the 0.8 - 5 mm sub-
fraction are significantly higher than the corresponding values
for the sub-fraction above 5 mm. The reason mainly lies in the
generally higher concentrations of heavy metals that
concentrates in the bottom ash fraction below 2 mm, as
reported by Hu et al., 2007 and also observed in chapter 5 of
this thesis.
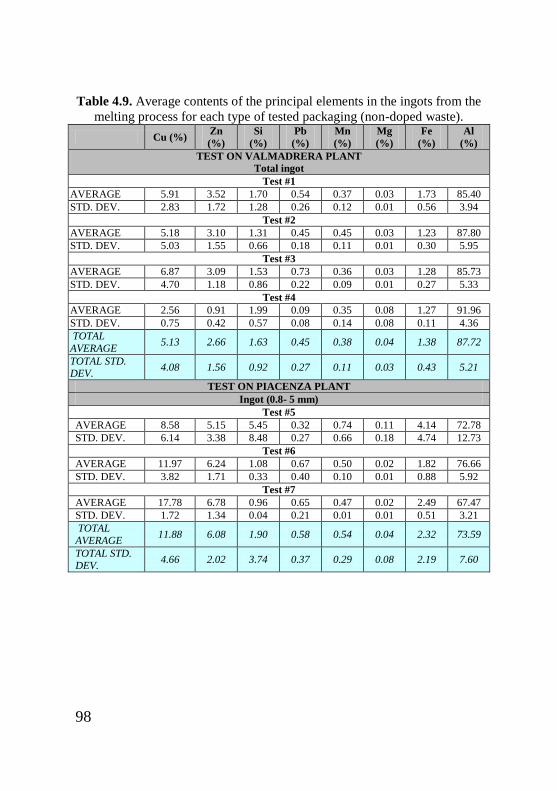
98
Table 4.9. Average contents of the principal elements in the ingots from the
melting process for each type of tested packaging (non-doped waste).
Cu (%) Zn
(%)
Si
(%)
Pb
(%)
Mn
(%)
Mg
(%)
Fe
(%)
Al
(%)
TEST ON VALMADRERA PLANT
Total ingot
Test #1
AVERAGE 5.91 3.52 1.70 0.54 0.37 0.03 1.73 85.40
STD. DEV. 2.83 1.72 1.28 0.26 0.12 0.01 0.56 3.94
Test #2
AVERAGE 5.18 3.10 1.31 0.45 0.45 0.03 1.23 87.80
STD. DEV. 5.03 1.55 0.66 0.18 0.11 0.01 0.30 5.95
Test #3
AVERAGE 6.87 3.09 1.53 0.73 0.36 0.03 1.28 85.73
STD. DEV. 4.70 1.18 0.86 0.22 0.09 0.01 0.27 5.33
Test #4
AVERAGE 2.56 0.91 1.99 0.09 0.35 0.08 1.27 91.96
STD. DEV. 0.75 0.42 0.57 0.08 0.14 0.08 0.11 4.36
TOTAL
AVERAGE 5.13 2.66 1.63 0.45 0.38 0.04 1.38 87.72
TOTAL STD. DEV.
4.08 1.56 0.92 0.27 0.11 0.03 0.43 5.21
TEST ON PIACENZA PLANT
Ingot (0.8- 5 mm)
Test #5
AVERAGE 8.58 5.15 5.45 0.32 0.74 0.11 4.14 72.78
STD. DEV. 6.14 3.38 8.48 0.27 0.66 0.18 4.74 12.73
Test #6
AVERAGE 11.97 6.24 1.08 0.67 0.50 0.02 1.82 76.66
STD. DEV. 3.82 1.71 0.33 0.40 0.10 0.01 0.88 5.92
Test #7
AVERAGE 17.78 6.78 0.96 0.65 0.47 0.02 2.49 67.47
STD. DEV. 1.72 1.34 0.04 0.21 0.01 0.01 0.51 3.21
TOTAL
AVERAGE 11.88 6.08 1.90 0.58 0.54 0.04 2.32 73.59
TOTAL STD. DEV.
4.66 2.02 3.74 0.37 0.29 0.08 2.19 7.60
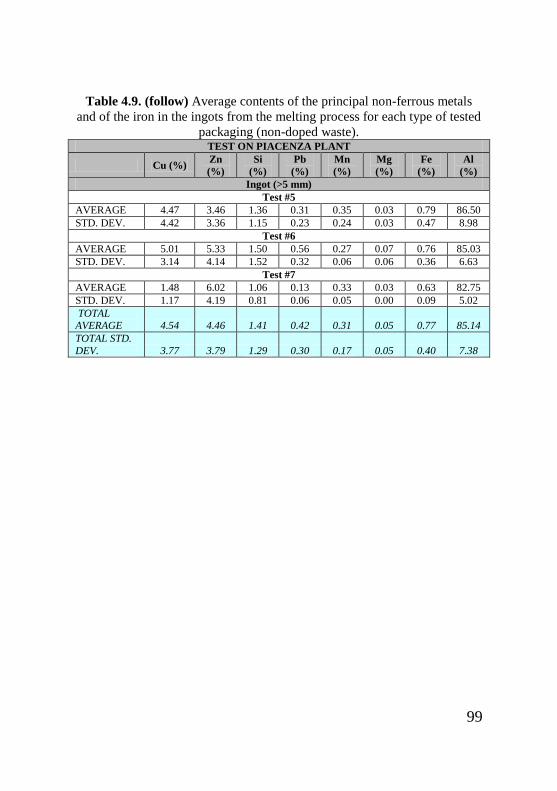
99
Table 4.9. (follow) Average contents of the principal non-ferrous metals
and of the iron in the ingots from the melting process for each type of tested
packaging (non-doped waste). TEST ON PIACENZA PLANT
Cu (%) Zn
(%)
Si
(%)
Pb
(%)
Mn
(%)
Mg
(%)
Fe
(%)
Al
(%)
Ingot (>5 mm)
Test #5
AVERAGE 4.47 3.46 1.36 0.31 0.35 0.03 0.79 86.50
STD. DEV. 4.42 3.36 1.15 0.23 0.24 0.03 0.47 8.98
Test #6
AVERAGE 5.01 5.33 1.50 0.56 0.27 0.07 0.76 85.03
STD. DEV. 3.14 4.14 1.52 0.32 0.06 0.06 0.36 6.63
Test #7
AVERAGE 1.48 6.02 1.06 0.13 0.33 0.03 0.63 82.75
STD. DEV. 1.17 4.19 0.81 0.06 0.05 0.00 0.09 5.02
TOTAL AVERAGE 4.54 4.46 1.41 0.42 0.31 0.05 0.77 85.14
TOTAL STD.
DEV. 3.77 3.79 1.29 0.30 0.17 0.05 0.40 7.38

101
5. RECOVERY OF ALUMINIUM FROM THE
BOTTOM ASH FINE FRACTION
According to the results reported in Chapter 4, about 21-23%
of the aluminium present in the URW in Northern Italy can be
actually recovered from the bottom ash and recycled. This
amount is probably underestimated due to the low efficiency of
the melting process performed during the experiment tests. If
we consider all the metallic Al potentially recoverable from the
ash (including the metallic Al lost in the salt dross during the
melting process), the value increases up to 23-29%.
Out of this amount, 13-24% comes from the bottom ash
fraction smaller than 5 mm, whose recovery is not efficient in
bottom ash treatment plant equipped only with standard eddy
current machines and without a grinding stage. In fact, the
recovery rate of ECS drops from almost 100% for particles
larger than 20 mm to virtually zero for particle size between 5
and 12 mm, depending on the number of screening steps and
on the plant layout and complexity (Berkhout et al., 2011).
This chapter analyses two different treatment options for the
fine fraction (< 4 mm) of MSWI bottom ash: a) recovering
metallic Al through an advanced treatment process including
additional steps of grinding and sieving; b) producing hydrogen
gas by reacting metallic Al with water under alkaline anaerobic
conditions.
102
5.1. MATERIALS AND METHODS
Sampling procedure
The research was partially carried out in Sweden, at Lund
University, and partially in Italy.
The bottom ash was sampled in a bottom ash treatment plant
located in South Sweden, with a total capacity of about 40,000
tonnes per year. Bottom ash is produced at a nearby MSW
incineration plant treating residual waste in a grate furnace
with wet extraction system. The treatment process is quite
complex, as illustrated in Figure 5.1, including a number of
sorting steps with several magnets and ECS for the specific
particle sizes. The study focuses on the particles smaller than 4
mm from which non-ferrous scraps are separated by means of a
standard ECS. Bottom ash was sampled from the conveyor belt
both upstream and downstream of the ECS separator.

103
Figure 5.1. Layout of the bottom ash treatment plant. The ECS highlighted in grey is where sampling took place.
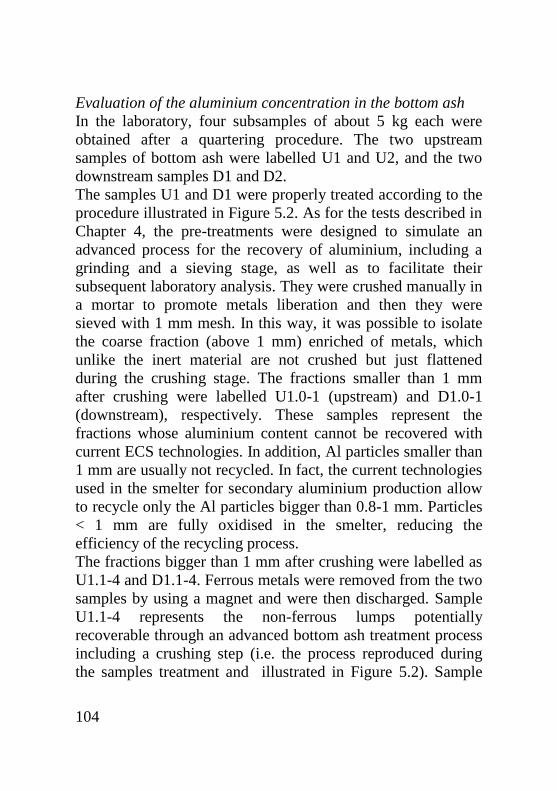
104
Evaluation of the aluminium concentration in the bottom ash
In the laboratory, four subsamples of about 5 kg each were
obtained after a quartering procedure. The two upstream
samples of bottom ash were labelled U1 and U2, and the two
downstream samples D1 and D2.
The samples U1 and D1 were properly treated according to the
procedure illustrated in Figure 5.2. As for the tests described in
Chapter 4, the pre-treatments were designed to simulate an
advanced process for the recovery of aluminium, including a
grinding and a sieving stage, as well as to facilitate their
subsequent laboratory analysis. They were crushed manually in
a mortar to promote metals liberation and then they were
sieved with 1 mm mesh. In this way, it was possible to isolate
the coarse fraction (above 1 mm) enriched of metals, which
unlike the inert material are not crushed but just flattened
during the crushing stage. The fractions smaller than 1 mm
after crushing were labelled U1.0-1 (upstream) and D1.0-1
(downstream), respectively. These samples represent the
fractions whose aluminium content cannot be recovered with
current ECS technologies. In addition, Al particles smaller than
1 mm are usually not recycled. In fact, the current technologies
used in the smelter for secondary aluminium production allow
to recycle only the Al particles bigger than 0.8-1 mm. Particles
< 1 mm are fully oxidised in the smelter, reducing the
efficiency of the recycling process.
The fractions bigger than 1 mm after crushing were labelled as
U1.1-4 and D1.1-4. Ferrous metals were removed from the two
samples by using a magnet and were then discharged. Sample
U1.1-4 represents the non-ferrous lumps potentially
recoverable through an advanced bottom ash treatment process
including a crushing step (i.e. the process reproduced during
the samples treatment and illustrated in Figure 5.2). Sample
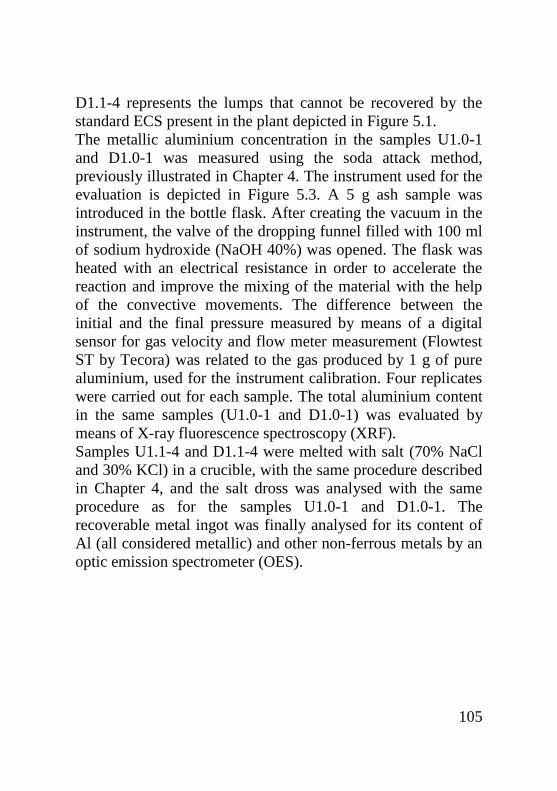
105
D1.1-4 represents the lumps that cannot be recovered by the
standard ECS present in the plant depicted in Figure 5.1.
The metallic aluminium concentration in the samples U1.0-1
and D1.0-1 was measured using the soda attack method,
previously illustrated in Chapter 4. The instrument used for the
evaluation is depicted in Figure 5.3. A 5 g ash sample was
introduced in the bottle flask. After creating the vacuum in the
instrument, the valve of the dropping funnel filled with 100 ml
of sodium hydroxide (NaOH 40%) was opened. The flask was
heated with an electrical resistance in order to accelerate the
reaction and improve the mixing of the material with the help
of the convective movements. The difference between the
initial and the final pressure measured by means of a digital
sensor for gas velocity and flow meter measurement (Flowtest
ST by Tecora) was related to the gas produced by 1 g of pure
aluminium, used for the instrument calibration. Four replicates
were carried out for each sample. The total aluminium content
in the same samples (U1.0-1 and D1.0-1) was evaluated by
means of X-ray fluorescence spectroscopy (XRF).
Samples U1.1-4 and D1.1-4 were melted with salt (70% NaCl
and 30% KCl) in a crucible, with the same procedure described
in Chapter 4, and the salt dross was analysed with the same
procedure as for the samples U1.0-1 and D1.0-1. The
recoverable metal ingot was finally analysed for its content of
Al (all considered metallic) and other non-ferrous metals by an
optic emission spectrometer (OES).
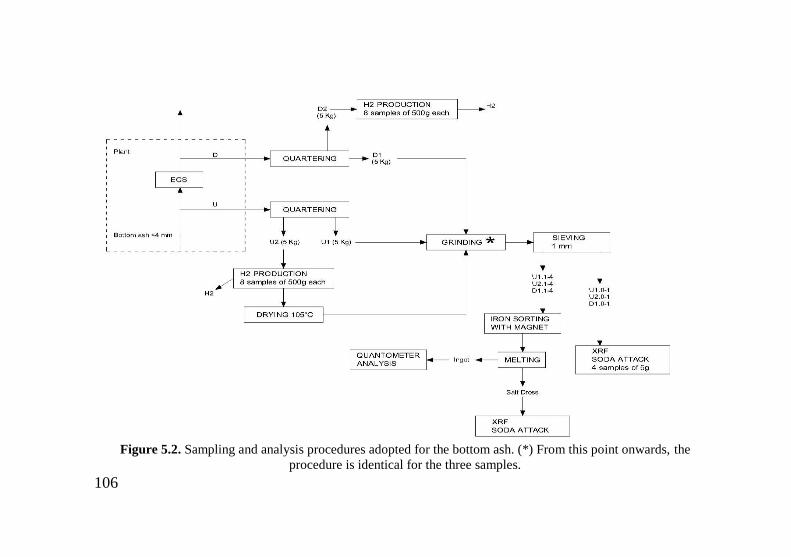
106
Figure 5.2. Sampling and analysis procedures adopted for the bottom ash. (*) From this point onwards, the
procedure is identical for the three samples.
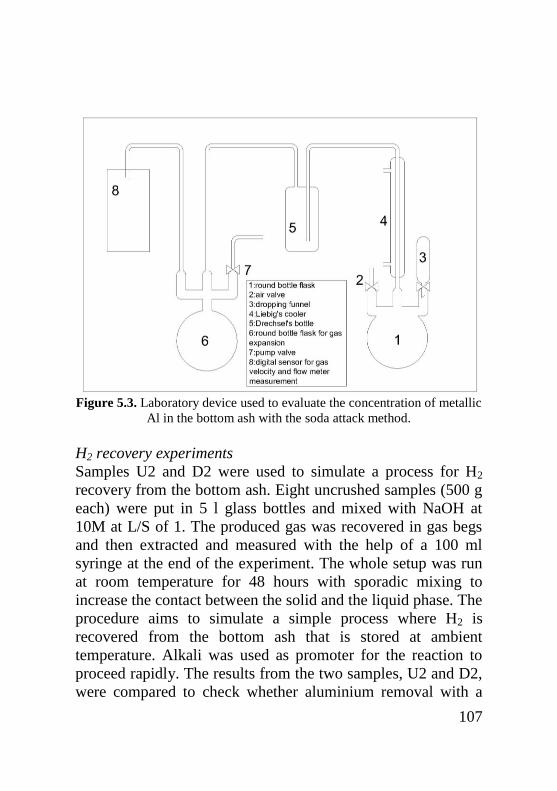
107
Figure 5.3. Laboratory device used to evaluate the concentration of metallic
Al in the bottom ash with the soda attack method.
H2 recovery experiments
Samples U2 and D2 were used to simulate a process for H2
recovery from the bottom ash. Eight uncrushed samples (500 g
each) were put in 5 l glass bottles and mixed with NaOH at
10M at L/S of 1. The produced gas was recovered in gas begs
and then extracted and measured with the help of a 100 ml
syringe at the end of the experiment. The whole setup was run
at room temperature for 48 hours with sporadic mixing to
increase the contact between the solid and the liquid phase. The
procedure aims to simulate a simple process where H2 is
recovered from the bottom ash that is stored at ambient
temperature. Alkali was used as promoter for the reaction to
proceed rapidly. The results from the two samples, U2 and D2,
were compared to check whether aluminium removal with a
108
standard ECS significantly affects H2 production, as one might
expect.
After the gas recovery, sample U2 was dried in an oven at
105°C for 24 h and analyzed with the same procedure as for the
sample U1. This allowed to evaluate if the H2 produced by the
bottom ash mainly comes from the lumps or from the particles
in the fine fraction. The loss of aluminium potentially
recoverable with ECS technologies, due to the oxidation of the
lumps during the soda attack process, was also evaluated.
Sample D2 was non analysed after H2 production, because its
aluminium content after gas recovery was considered of poor
interest.
5.2. RESULTS
5.2.1. Aluminium recovery
Table 5.1 reports the total and metallic aluminium content of
the sampled bottom ash. As explained in Chapter 4, the ingot
fraction is representative of the metal actually recoverable from
the bottom ash. Since it is obtained from the melting process,
the numerical value is representative of the efficiency of the
whole recycling process. On the contrary, the aluminium in the
bottom ash fraction < 1mm represents a loss, because it cannot
be recovered from bottom ash, neither recycled in the
secondary aluminium smelter. The table also provides
aluminium concentration in the salt dross produced during the
melting process, which includes Al in the oxidized form as
well as the metallic Al trapped in the salt. In this section, only
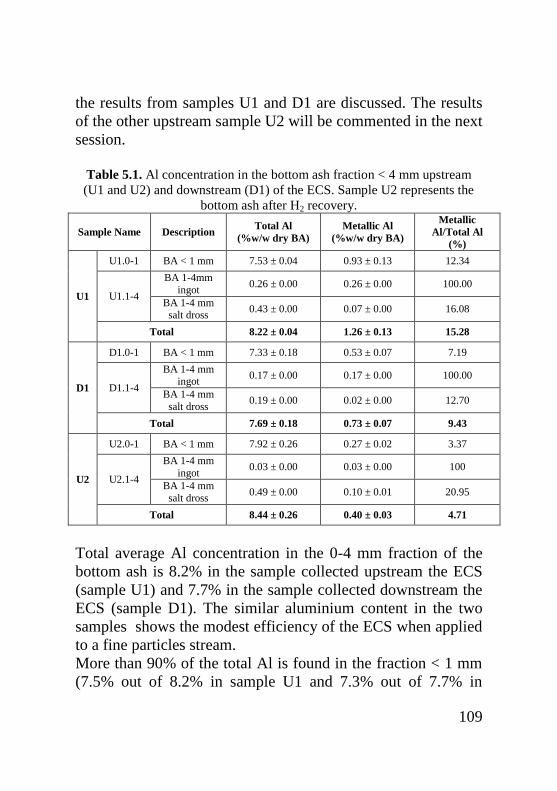
109
the results from samples U1 and D1 are discussed. The results
of the other upstream sample U2 will be commented in the next
session.
Table 5.1. Al concentration in the bottom ash fraction < 4 mm upstream
(U1 and U2) and downstream (D1) of the ECS. Sample U2 represents the
bottom ash after H2 recovery.
Sample Name Description Total Al
(%w/w dry BA)
Metallic Al
(%w/w dry BA)
Metallic
Al/Total Al
(%)
U1
U1.0-1 BA < 1 mm 7.53 ± 0.04 0.93 ± 0.13 12.34
U1.1-4
BA 1-4mm
ingot 0.26 ± 0.00 0.26 ± 0.00 100.00
BA 1-4 mm salt dross
0.43 ± 0.00 0.07 ± 0.00 16.08
Total 8.22 ± 0.04 1.26 ± 0.13 15.28
D1
D1.0-1 BA < 1 mm 7.33 ± 0.18 0.53 ± 0.07 7.19
D1.1-4
BA 1-4 mm ingot
0.17 ± 0.00 0.17 ± 0.00 100.00
BA 1-4 mm
salt dross 0.19 ± 0.00 0.02 ± 0.00 12.70
Total 7.69 ± 0.18 0.73 ± 0.07 9.43
U2
U2.0-1 BA < 1 mm 7.92 ± 0.26 0.27 ± 0.02 3.37
U2.1-4
BA 1-4 mm
ingot 0.03 ± 0.00 0.03 ± 0.00 100
BA 1-4 mm
salt dross 0.49 ± 0.00 0.10 ± 0.01 20.95
Total 8.44 ± 0.26 0.40 ± 0.03 4.71
Total average Al concentration in the 0-4 mm fraction of the
bottom ash is 8.2% in the sample collected upstream the ECS
(sample U1) and 7.7% in the sample collected downstream the
ECS (sample D1). The similar aluminium content in the two
samples shows the modest efficiency of the ECS when applied
to a fine particles stream.
More than 90% of the total Al is found in the fraction < 1 mm
(7.5% out of 8.2% in sample U1 and 7.3% out of 7.7% in
110
sample D1). Therefore, it cannot be separated from the bottom
ash stream with the current ECS technologies. Most of the Al
in the bottom ash below 5-6 mm comes, in fact, from the light
packaging and the Al foils, as showed in Chapter 4 and
reported by Hu et al. (2011). These materials are usually
characterised by a low thickness and mechanical strength,
which facilitate their concentration in the fine fraction of the
ash as well as their high oxidation level.
During combustion, the aluminium scraps undergo oxidation
processes which affects the amount of metallic Al in the lumps
separated from the bottom ash stream through ECS. These
processes are particularly important for the small scraps which
concentrate in the fine fraction of the bottom ash, whose small
size and the consequent high specific surface can easily explain
their high oxidation level. In fact, only less that 15% of the Al
in the analysed samples is present in the metallic form and,
thus, can be potentially recycled.
These two aspects, the high content of Al in the bottom ash
fraction below 1 mm and the high oxidation level, determine
the modest recovery of Al detected in the analysed bottom ash
samples.
In more detail, focusing on the metallic Al, its concentration in
the upstream sample U1 is equal to 1.26% of the weight of dry
bottom ash. If we consider only the Al potentially recoverable,
i.e. that in the bottom ash fraction above 1 mm, the percentage
decreases to 0.33% of the weight of dry ash. However, during
the recycling process part of this Al is unavoidably trapped in
the salt dross. The percentage of Al actually recoverable as an
ingot is thus lower and equal to 0.26% of the weight of dry ash.
This means that only 21% of the metallic Al in the ash can be
actually recovered as an ingot, which corresponds to 3.1% of
the total Al in the bottom ash.
111
After the ECS (sample D1), the total content of metallic Al
decreases to 0.73% of the dry weight of the bottom ash and, if
we consider only the Al actually recoverable as an ingot, the
figure decreases to 0.17% of the dry weight of the ash (0.2% if
we neglect the recycling process, including the amount of
metallic Al in the salt dross).
The difference between the recovered ingot from the bottom
ash samples upstream and downstream the ECS (samples U1
and D1, respectively) represents the amount of Al lumps
separated by the ECS operating in the investigated plant and
then recycled. This is representative of a standard bottom ash
treatment plant based on a single ECS and without a grinding
stage aimed at liberating the metal particles. On the contrary,
the aluminium recovered from the sample U1 is representative
of the efficiency of an advanced bottom ash treatment process,
including a grinding stage.
A standard bottom ash treatment plant can, thus, recover only
32% of the aluminium potentially recoverable with an
advanced process, as resulting from Eq. 5.1, which also
includes the efficiency of the recycling process.
η standard BA treatment plant & melting process = (ingot.U1
– ingot.D1)/ingot.U1 (Eq. 5.1)
where the prefix ingot. is the concentration of the aluminium
recovered as an ingot in the bottom ash samples U1 and D1 and
referred to the weight of the dry bottom ash, as reported in
Table 5.1.
Since the non-ferrous metals recovered from the bottom ash
were melted together during the tests, without a previous
separation of the Al lumps from the other non-ferrous metals
like in full-scale smelters, a non-negligible amount of metallic
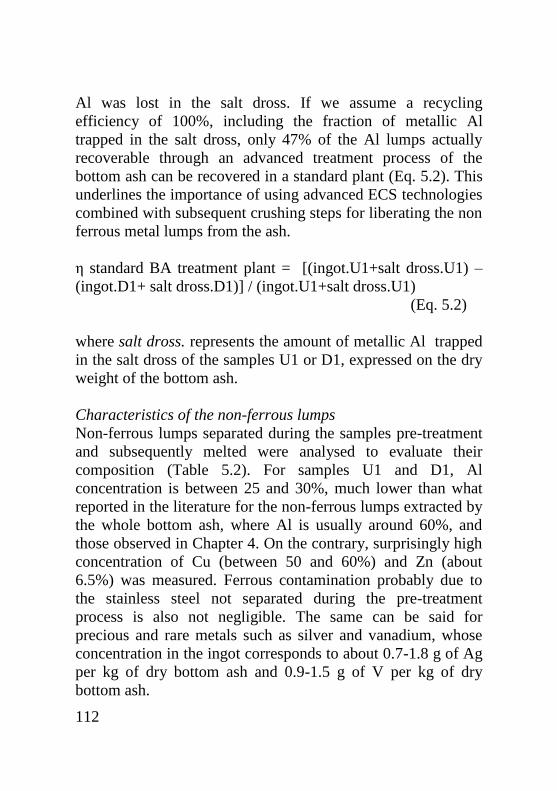
112
Al was lost in the salt dross. If we assume a recycling
efficiency of 100%, including the fraction of metallic Al
trapped in the salt dross, only 47% of the Al lumps actually
recoverable through an advanced treatment process of the
bottom ash can be recovered in a standard plant (Eq. 5.2). This
underlines the importance of using advanced ECS technologies
combined with subsequent crushing steps for liberating the non
ferrous metal lumps from the ash.
η standard BA treatment plant = [(ingot.U1+salt dross.U1) –
(ingot.D1+ salt dross.D1)] / (ingot.U1+salt dross.U1)
(Eq. 5.2)
where salt dross. represents the amount of metallic Al trapped
in the salt dross of the samples U1 or D1, expressed on the dry
weight of the bottom ash.
Characteristics of the non-ferrous lumps
Non-ferrous lumps separated during the samples pre-treatment
and subsequently melted were analysed to evaluate their
composition (Table 5.2). For samples U1 and D1, Al
concentration is between 25 and 30%, much lower than what
reported in the literature for the non-ferrous lumps extracted by
the whole bottom ash, where Al is usually around 60%, and
those observed in Chapter 4. On the contrary, surprisingly high
concentration of Cu (between 50 and 60%) and Zn (about
6.5%) was measured. Ferrous contamination probably due to
the stainless steel not separated during the pre-treatment
process is also not negligible. The same can be said for
precious and rare metals such as silver and vanadium, whose
concentration in the ingot corresponds to about 0.7-1.8 g of Ag
per kg of dry bottom ash and 0.9-1.5 g of V per kg of dry
bottom ash.
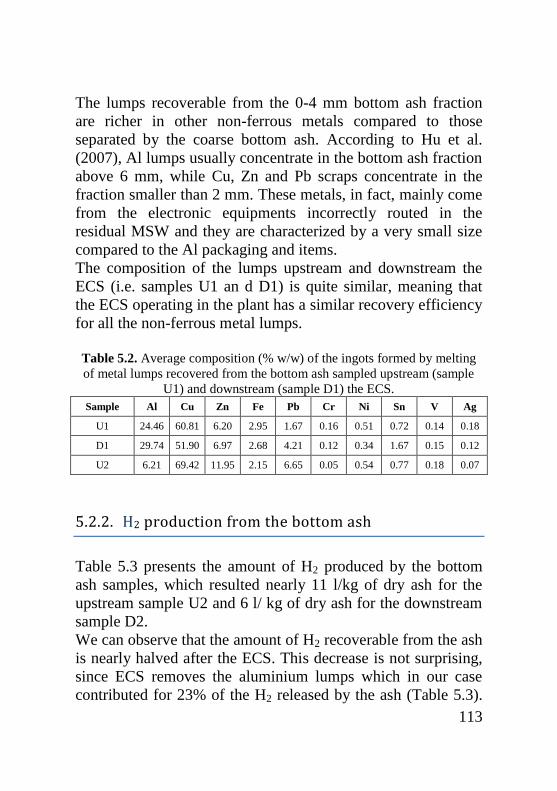
113
The lumps recoverable from the 0-4 mm bottom ash fraction
are richer in other non-ferrous metals compared to those
separated by the coarse bottom ash. According to Hu et al.
(2007), Al lumps usually concentrate in the bottom ash fraction
above 6 mm, while Cu, Zn and Pb scraps concentrate in the
fraction smaller than 2 mm. These metals, in fact, mainly come
from the electronic equipments incorrectly routed in the
residual MSW and they are characterized by a very small size
compared to the Al packaging and items.
The composition of the lumps upstream and downstream the
ECS (i.e. samples U1 an d D1) is quite similar, meaning that
the ECS operating in the plant has a similar recovery efficiency
for all the non-ferrous metal lumps.
Table 5.2. Average composition (% w/w) of the ingots formed by melting
of metal lumps recovered from the bottom ash sampled upstream (sample
U1) and downstream (sample D1) the ECS.
Sample Al Cu Zn Fe Pb Cr Ni Sn V Ag
U1 24.46 60.81 6.20 2.95 1.67 0.16 0.51 0.72 0.14 0.18
D1 29.74 51.90 6.97 2.68 4.21 0.12 0.34 1.67 0.15 0.12
U2 6.21 69.42 11.95 2.15 6.65 0.05 0.54 0.77 0.18 0.07
5.2.2. H2 production from the bottom ash
Table 5.3 presents the amount of H2 produced by the bottom
ash samples, which resulted nearly 11 l/kg of dry ash for the
upstream sample U2 and 6 l/ kg of dry ash for the downstream
sample D2.
We can observe that the amount of H2 recoverable from the ash
is nearly halved after the ECS. This decrease is not surprising,
since ECS removes the aluminium lumps which in our case
contributed for 23% of the H2 released by the ash (Table 5.3).
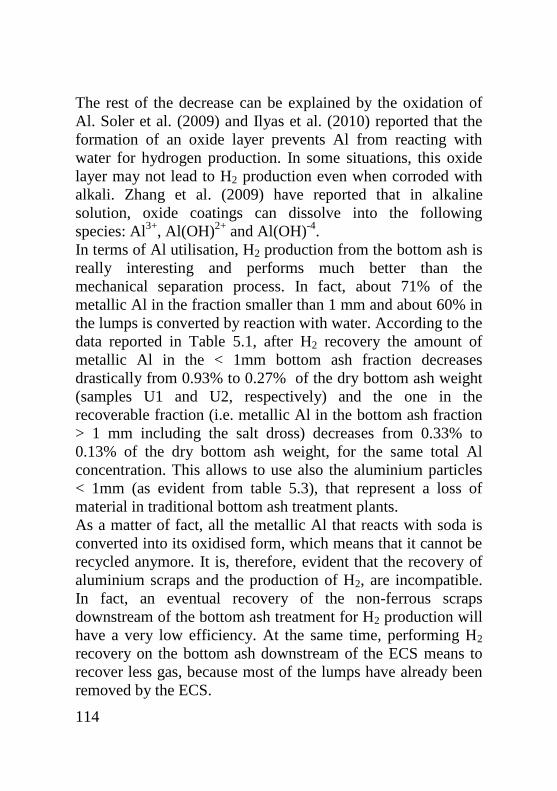
114
The rest of the decrease can be explained by the oxidation of
Al. Soler et al. (2009) and Ilyas et al. (2010) reported that the
formation of an oxide layer prevents Al from reacting with
water for hydrogen production. In some situations, this oxide
layer may not lead to H2 production even when corroded with
alkali. Zhang et al. (2009) have reported that in alkaline
solution, oxide coatings can dissolve into the following
species: Al3+
, Al(OH)2+
and Al(OH)-4
.
In terms of Al utilisation, H2 production from the bottom ash is
really interesting and performs much better than the
mechanical separation process. In fact, about 71% of the
metallic Al in the fraction smaller than 1 mm and about 60% in
the lumps is converted by reaction with water. According to the
data reported in Table 5.1, after H2 recovery the amount of
metallic Al in the < 1mm bottom ash fraction decreases
drastically from 0.93% to 0.27% of the dry bottom ash weight
(samples U1 and U2, respectively) and the one in the
recoverable fraction (i.e. metallic Al in the bottom ash fraction
> 1 mm including the salt dross) decreases from 0.33% to
0.13% of the dry bottom ash weight, for the same total Al
concentration. This allows to use also the aluminium particles
< 1mm (as evident from table 5.3), that represent a loss of
material in traditional bottom ash treatment plants.
As a matter of fact, all the metallic Al that reacts with soda is
converted into its oxidised form, which means that it cannot be
recycled anymore. It is, therefore, evident that the recovery of
aluminium scraps and the production of H2, are incompatible.
In fact, an eventual recovery of the non-ferrous scraps
downstream of the bottom ash treatment for H2 production will
have a very low efficiency. At the same time, performing H2
recovery on the bottom ash downstream of the ECS means to
recover less gas, because most of the lumps have already been
removed by the ECS.
115
It is interesting to notice that the ingot composition varies after
H2 recovery, with a further reduction of the already low Al
concentration (Table 5.2).
Table 5.3. H2 production (l kg
-1 of dry bottom ash at 0°C and atmospheric
pressure) from the bottom ash sampled upstream (sample U2) and
downstream (sample D2) the ECS, evaluated following the procedure
illustrated in paragraph 5.1.
Sample Average Std.Dev p-value t-test
U2 10.8 (77% from BA< 1mm)
4.9 0.0029 (23% from BA > 1mm)
D2 5.7 1.2
5.2.3. Economic and environmental considerations
Before a new system is developed, the economic feasibility of
improving aluminium recovery from the fine fraction of the
bottom ash by substituting a standard ECS with an advanced
one, or by developing H2 recovery, must be evaluated by
comparing the amount and the value of the recovered
aluminium lumps or H2 with the cost of the plant.
To evaluate the additional cost of an advanced bottom ash
treatment plant compared to a standard one, the economic data
from Kohaupt (2011) were used. The cost of a standard ECS is
assumed to be 85,000 Euros, whereas that of an advanced ECS,
for example one at high frequency, is assumed equal to
130,000 Euros for the same capacity. Considering also a
grinding machine to improve metals recovery and a screen,
which cost about 500,000 Euros and 200,000 Euros
respectively, the total investment amounts to 745,000 Euros.
The installed power of the same machines is assumed equal to
about 12 kW for the advanced ECS, 10 kW for the standard
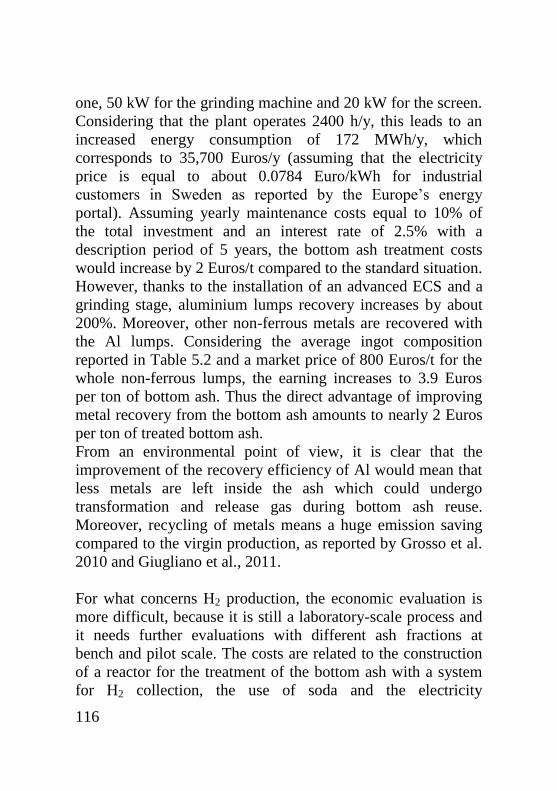
116
one, 50 kW for the grinding machine and 20 kW for the screen.
Considering that the plant operates 2400 h/y, this leads to an
increased energy consumption of 172 MWh/y, which
corresponds to 35,700 Euros/y (assuming that the electricity
price is equal to about 0.0784 Euro/kWh for industrial
customers in Sweden as reported by the Europe’s energy
portal). Assuming yearly maintenance costs equal to 10% of
the total investment and an interest rate of 2.5% with a
description period of 5 years, the bottom ash treatment costs
would increase by 2 Euros/t compared to the standard situation.
However, thanks to the installation of an advanced ECS and a
grinding stage, aluminium lumps recovery increases by about
200%. Moreover, other non-ferrous metals are recovered with
the Al lumps. Considering the average ingot composition
reported in Table 5.2 and a market price of 800 Euros/t for the
whole non-ferrous lumps, the earning increases to 3.9 Euros
per ton of bottom ash. Thus the direct advantage of improving
metal recovery from the bottom ash amounts to nearly 2 Euros
per ton of treated bottom ash.
From an environmental point of view, it is clear that the
improvement of the recovery efficiency of Al would mean that
less metals are left inside the ash which could undergo
transformation and release gas during bottom ash reuse.
Moreover, recycling of metals means a huge emission saving
compared to the virgin production, as reported by Grosso et al.
2010 and Giugliano et al., 2011.
For what concerns H2 production, the economic evaluation is
more difficult, because it is still a laboratory-scale process and
it needs further evaluations with different ash fractions at
bench and pilot scale. The costs are related to the construction
of a reactor for the treatment of the bottom ash with a system
for H2 collection, the use of soda and the electricity
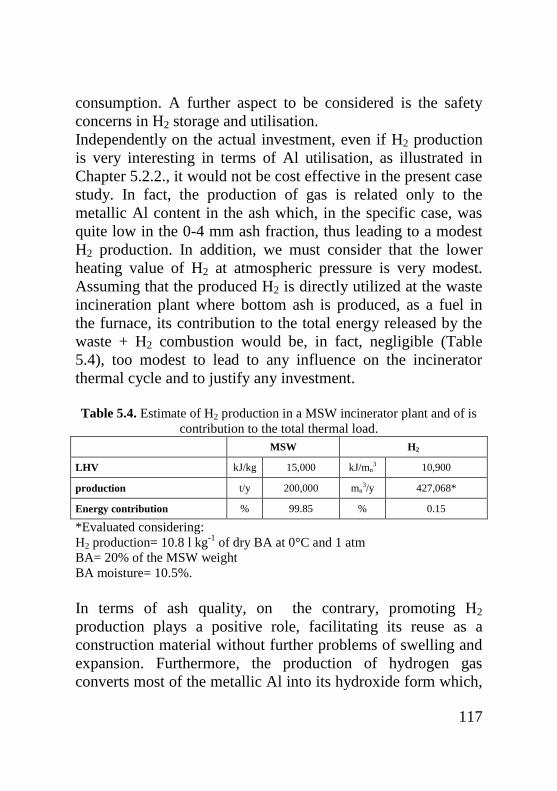
117
consumption. A further aspect to be considered is the safety
concerns in H2 storage and utilisation.
Independently on the actual investment, even if H2 production
is very interesting in terms of Al utilisation, as illustrated in
Chapter 5.2.2., it would not be cost effective in the present case
study. In fact, the production of gas is related only to the
metallic Al content in the ash which, in the specific case, was
quite low in the 0-4 mm ash fraction, thus leading to a modest
H2 production. In addition, we must consider that the lower
heating value of H2 at atmospheric pressure is very modest.
Assuming that the produced H2 is directly utilized at the waste
incineration plant where bottom ash is produced, as a fuel in
the furnace, its contribution to the total energy released by the
waste + H2 combustion would be, in fact, negligible (Table
5.4), too modest to lead to any influence on the incinerator
thermal cycle and to justify any investment.
Table 5.4. Estimate of H2 production in a MSW incinerator plant and of is
contribution to the total thermal load.
MSW H2
LHV kJ/kg 15,000 kJ/mn3 10,900
production t/y 200,000 mn3/y 427,068*
Energy contribution % 99.85 % 0.15
*Evaluated considering:
H2 production= 10.8 l kg-1
of dry BA at 0°C and 1 atm
BA= 20% of the MSW weight
BA moisture= 10.5%.
In terms of ash quality, on the contrary, promoting H2
production plays a positive role, facilitating its reuse as a
construction material without further problems of swelling and
expansion. Furthermore, the production of hydrogen gas
converts most of the metallic Al into its hydroxide form which,
118
if precipitated, could act as a binder for metals as well as the
ash itself. However, upon drying the ash shows cementatious
behaviour due to formation hydroxides, which could be
negative, because formation of Al-hydroxide gel can lower the
aggregate stability. Therefore mechanical strength of
aggregates after the carbonation and drying needs to be tested.
Based on the above considerations, in this specific case study
aluminium recovery should be preferred to H2 production. At
this initial stage of research, it is however not possible to
extend such findings to other situations. The choice of a
particular process should consider the specific context and
balance the presumed benefits against financial and
environmental costs. According to the actual bottom ash
composition and to the Al distribution into the different
particles fractions, H2 production might turn to be more
advantageous than Al recovery. For example, when most of the
scraps consists of other non ferrous metals, such as Cu, Zn and
eventually rare and precious metals, the reduction of the
amount of recoverable metallic Al as a consequence of H2
recovery could be economically advantageous, provided that
the ECS is opportunely designed to maximize the recovery of
other non-ferrous metals instead of aluminium lumps.
In any case, further experimentation would be required,
including the investigation of the leaching behaviour of the
elements after H2 production and the evaluation of the
environmental impacts of the two processes. Moreover, a
comparative life cycle assessment would provide much better
understanding of the benefits of the two processes.
119
6. CONCLUSIONS
Recovering aluminium and other non-ferrous metals from
waste incineration bottom ash has become a common practice
in the last decades. The concentration of these metals in the
bottom ash can be higher than that in the ore, making their
recovery advantageous from an economical point of view. In
addition, significant environmental benefits are associated to
their recycling, and their separation is crucial in view of the
recovery of the inert fraction of bottom ash.
Despite metals recovery is a common practice, the correct
design of the plant is a hard task, since it requires to know how
much aluminium is in the ash and what are its main
characteristics, in terms of dimensional classification of the
lumps and of their quality, expressed by the oxidation level
and the presence of other non-ferrous metals.
All these aspects make easily understandable why metal
recovery from the ash is one of the hot topic of waste
management.
The efficiency of metal recovery from the bottom ash is very
uncertain. Despite the huge number of publications about this
topic, finding an average value suitable for all Europe is rather
impossible. The separated collection varies from one country
to another, thus influencing the amount of aluminium in the
waste and its composition. Aluminium can, in fact, be present
in the waste as packaging or as other materials (like pots etc).
Among the packaging materials, we can find cans, spray cans,
foils etc, whose recovery from the ash is very different, as
resulted from the tests reported in the thesis.

120
The recovery of the aluminium packaging from the ash and its
oxidation level in the residues of the incineration process is
strictly related to the structure and the mechanical properties of
the material. About 81% of the aluminium in the cans can be
recovered from the bottom ash and recycled as secondary
aluminium, but this amount decreases to 51% when trays are
considered, 27% for a mix of aluminium and poly-laminated
foils and 47% for paper-laminated foils. The recovery of
aluminium from the incineration residues thus increases
proportionally to aluminium thickness in the tested packaging.
Foils (Al thickness 10-42 m) and trays (50 m) are
characterised by lower aluminium recovery yields if compared
with beverage cans (90-250 m), due to a stronger
fragmentation on the combustion grate and thus the formation
of smaller lumps that are lost within the fine fractions. These
values also suggest that the paper used in the paper-laminated
foil improves the mechanical strength of the aluminium foil. The aluminium that is not recovered concentrates in the fine
fraction of the bottom ash (< 0.8 mm), from which aluminium
cannot be recovered also if advanced technologies are used. A
minor amount (less than 7%) can be found in the fly ash.
Looking at the residual waste and at its natural content of
aluminium, only 26-37% of the Al fed to the furnace of the
incineration plant can be separated from the bottom ash with
ECS technologies. This corresponds to an amount of secondary
aluminium producible equal to about 21-23% of the aluminium
in the URW. This value refers to the typical situation of
Northern Italy, where the separated collection of waste reached
48% in 2009, with better performances in some provinces. For
example, in the two provinces feeding the WTE plants where
the experimentations were carried out, Lecco and Piacenza, the
121
efficiency of the separated collection was equal to 57.3% and
50.7% in 2009, respectively, and the source separation of
aluminium packaging amounted at 0.7 and 2 kg/person/year,
respectively. In these situations, most of the aluminium in the
residual waste probably consists of flexible packaging like the
foil, and thus concentrates in the fine fraction of the bottom ash
(< 0.8 mm) and cannot be recovered. Where the separated
collection is less efficient, like in other Italian regions, the
amount of aluminium in the residual waste can be higher and
also its composition can be different, with a prevailing
presence of rigid packaging materials. This may result in a
greater amount of aluminium potentially recoverable from the
ash. The results previously illustrated seem to underestimate the
potential for aluminium recovery from the bottom ash
compared to what reported in the literature. For example, some
experiences carried out in Northern Europe, especially in the
Netherlands, showed that about 60-70% of the aluminium
scraps can be recovered from the ash (Muchova and Rem,
2007; Manders, 2008).
Aluminium recovery from the ash is particularly difficult when
the lumps produced during the combustion process are smaller
than 5 mm. In fact, the standard ECS usually installed in the
plant, have a good separation efficiency only for lumps bigger
than 4-5 mm. The size of the lumps is related to the
characteristics of the aluminium in the waste, as previously
explained. For the flexible packaging, a non negligible amount
of aluminium is recovered from the bottom ash fraction
included between 0.8 mm and 5 mm. 21% of the recovered
aluminium from the poly-laminated foil come from the lumps
< 5 mm, and this amount increases to 80% when the poly-
laminated foils are mixed with aluminium foils.
122
If we consider the residual waste, about 13-24% of the
recoverable aluminium comes from the bottom ash fraction
included between 0.8 and 5 mm and 76-87% from the fraction
bigger than 5 mm (corresponding to 3-5% and 16-20% of the
total Al in the ash, respectively). This means that, even if most
of the aluminium scraps are recoverable through standard eddy
current technologies, a non negligible amount of aluminium
can be recovered only in advanced treatment plants.
Focusing on the fine fraction, the analysis of the bottom ash <
4 mm sampled in a Swedish plant shows that about 3% of the
total aluminium, corresponding to about 21% of the metallic
Al, can be recovered and recycled from the bottom ash when
an advanced treatment is applied, similarly to what observed in
the Italian bottom ash. The important difference that was
observed between Italy and Sweden is the percentage of
aluminium in the non-ferrous fraction. In the Swedish bottom
ash, aluminium is only 20-30% of the total non-ferrous metals,
whereas in the analysed Italian bottom ash aluminium was
about 70% of the non-ferrous metals in the fraction < 5mm.
Despite the amount of aluminium detected in the Swedish
bottom ash was very low, improving metal recovery from the
fine fraction, by including a grinding stage and advanced ECS
in the plant layout, is economical advantageous. On the
contrary, the alternative of producing H2 from the ash does not
seem a good choice, especially when aluminium concentration
in the ash is very low and the consequent H2 production is
modest.
Even considering all the uncertainties associated to the amount
of aluminium that can be actually recovered from the bottom
ash, a rough estimate of the aluminium potentially recoverable
in Italy is presented in this work. The resulting values are very
123
interesting: between 16,300 and 24,900 tonnes might be
recovered in 2015 and between 19,300 and 34,600 tonnes in
2020, depending on the actual production of waste, on the
separated collection and on the WTE plants that will enter into
operation in the next 10 years. This corresponds to an amount
of secondary aluminium potentially producible included
between 11,300 and 17,300 tonnes in 2015 and between 13,400
and 24,000 tonnes in 2020. Of course, all the bottom ash
should be treated, if we want to recover this amount of
aluminium. This means a great improvement and development
of the sector, with the construction of new bottom ash
treatment plants, whose current capacity is absolutely
insufficient.
6.1. FURTHER RESEARCH
The research project has focused on aluminium recovery from
the bottom ash and has evaluated the amount of aluminium
potentially recoverable from the ash as a function of the
different packaging materials that can be present in the waste
and of the scraps oxidation level.
Two main parameters influence the recovery rate:
- the type of aluminium materials that are present in the
waste: types of packaging, its thickness and mechanical
properties;
- the characteristics of the incineration plant and the
combustion parameters: grate type, bottom ash
extraction system, waste and bottom ash residence time,
O2 in the combustion chamber etc.
The experimentation involved only two incineration plants,
both of them equipped with a wet discharge system of the
bottom ash. The composition of the burned waste was not
124
analysed during the test and, thus, the actual composition of the
aluminium fraction in the residual waste was unknown.
In order to complete the picture of the aluminium potentially
recoverable from the bottom ash, the evaluation should be
extended to other plants with different technological options
(grate type, bottom ash extraction system etc). It is important to
evaluate each time the waste composition in order to measure
the content of the different types of aluminium materials. Once
a significant data base is collected, it is possible to identify the
relationship existing among the efficiency of the separated
collection, the type of packaging materials present in the
residual waste, the characteristic of the incineration plant, the
combustion parameters and the amount of aluminium
potentially recoverable from the bottom ash.
The work has also focused on aluminium recovery from the
fine fraction of the bottom ash. The study was carried out only
on one incineration plant and should be extended to other
plants. This will allow to evaluate the amount of aluminium
potentially recoverable as a function of the waste management
system and of the incineration plant design and to express a
more founded opinion about the alternative of H2 production.
Furthermore, if this alternative appears to be interesting, the
leaching behavior of the ash after H2 production should be
investigated.
Similar investigations should be extended to other elements in
the waste (like Cu, Ag, Au), in order to assess the amount of
material actually recoverable from the bottom ash.
125
REFERENCES
ADEME, 2008. Machefers d’incinération des ordures
ménagères. DUNOD Edition.
Alu DK, 2006. Speech at EAA Packaging Group Seminar, 28-
29 September 2006, Krakow
Aluminium and Miljo DK, 2003. Metal separation from bottom
ash using detection/ejection technology. Speech at EEA-
Packalu Seminar Bruxelles, 24 June 2003
Association of Incinerators NL, 2006. Speech at EAA
Packaging Group Seminar, 28-29 September 2006, Krakow.
Astrup, T., Cappai, G., Lechner, P., Muntoni, A., Polettini, A.,
Pomi, R., Van Gerven, T., Van Zomeren, A., 2007. State-of-
the-art and outlook on management of waste-to-energy bottom
ashes. Part 2: Utilization. Conference proceedings from
Sardinia 2007, Eleventh International Waste Management and
Landfill Symposium. 1-5 October 2007, Cagliari, Italy.
Aubert, J., Hussun, B., Vaquier, A., 2004. Metallic aluminium
in MSWI fly ash: quantification and influence on the properties
of cement-based products. Waste Manag. 24, 589-596
Barcellesi, A., 2008. La gestione dei rifiuti urbani nella
provincia di Piacenza: analisi del ciclo di vita dei possibili
scenari evolutivi [Urban waste management in Piacenza
126
province: life cycle analysis of possible evaluation scenarios].
Master Degree Thesis, A.Y. 2007-2008, Politecnico di Milano.
Supervisor: prof. M. Grosso
Baun, D.L., Kamuk, B., Avanzi, P., 2007. Treatment of bottom
ash from Waste to Energy plants: overview and experiences.
Proceedings Sardinia 2007, Eleventh International Waste
Managament and Landfill Symposium. 1-5 October 2007,
Cagliari, Italy.
Berkhout, S.P.M., Oudenhoven, B.P.M., Rem, P.C., 2011.
Optimizing non-ferrous metal value from MSWI bottom ashes.
Journal of Environmental Protection 2, 564-570
Biganzoli, L., 2008. Bilanci di microinquinanti nella
termovalorizzazione dei rifiuti: valutazioni sperimentali su un
impianto reale e considerazioni comparative. [Micro-pollutants
mass balance in waste incineration: evaluation on a full-scale
plant and comparative considerations]. Master degree, A.Y.
2007-2008, Politecnico di Milano.
CiAl, 2006. Bilancio 2006: Risultati raggiunti, nuovi obiettivi e
progetti speciali [2006 Balance: achieved results, new targets
and special projects]. www.cial.it
CiAl, 2009. Gestione e Bilancio 2009. [Balance report 2009]
www.cial.it
CIAL, 2011. Separazione e recupero dei metalli e
valorizzazione delle scorie di combustione dei rifiuti urbani.
[Metals recovery and valorization of MSWI bottom ash]
www.cial.it
127
Comans R.N.J., Meima J.A., Geelhoed P.A., 2000. Reduction
of contaminant leaching from MSWI bottom ash by addition of
sorbing components. Waste Management 20, 125-133
Costa G., Baciocchi R., Polettini A., Pom, R., Hills C.D., Carey
P.J., 2007. Current status and perspective of accelerated
carbonation processes on municipal waste combustion
residues. Environmental Monitoring and Assessment 135, 55-
75.
Crannel B.S., Eighmy T.T., Krzanowski J.E., Eusden J.D., Sha,
E.L., Francis C.A., 2000. Heavy metal stabilization in
municipal solid waste combustion bottom ash using soluble
phpsphate. Waste Management 20, 135-148
Cristellensen, K., Skaarup, J., 2006. Management of bottom
ash from WTE plants. An overview of management options
and treatment method. ISWA Working group on Thermal
Treatment of waste. Subgroup Bottom ash from WTE plants.
Decreto del Ministero dell’ambiente e della tutela del territorio
n. 186 del 5 aprile 2006 Regolamento recante modifiche al
decreto ministeriale 5 febbraio 1997 << Individuazione dei
rifiuti non pericolosi sottoposti alle procedure semplificate di
recupero, ai sensi degli articoli 31 e 33 del decreto legislativo 5
febbraio 1997, n.22>>
Directive 2008/98/EC on waste and repealing certain
Directives.
De Vries, W., Rem, P., Berkhout, P., 2009. ADR: a new
method for dry classification. Proceedings of the ISWA
International Conference, Lisbon, 12.15 October 2009
128
EEA, 2011. Municipal waste generation.
http://www.eea.europa.eu/data-and-maps/indicators/municipal-
waste-generation/municipal-waste-generation-assessment-
published-4, latest access on the 23th of July 2012.
Fernandez-Bertos M., Li X., Simons S.J.R., Hills C.D., Carey
P.J., 2004. Investigation of accelerated carbonation for the
stabilization of MSW incinerator ashes and the sequestration of
CO2. Green Chemistry 6, 428-436
France Aluminium Recyclage, 2006. Speech at EAA
Packaging Group Seminar, 28-29 September 2006, Krakow.
Fraunholcz, N., Rem, P.C., Haeser, P.A.C.M., 2002. Dry
Magnus separation. Minerals Engineering 15, 45-51
Giugliano, M., Cernuschi, S., Grosso, M., Rigamonti, L., 2011.
Material and energy recovery in integrated waste management
system. An evaluation based on life cycle assessment. Waste
Manag. 31, 2092-2101.
Grosso, M., Rigamonti, L., Biganzoli, L., Schiona, G, 2010.
Metal recovery from incineration bottom ashes: future
opportunities in Italy. 2nd
International Conference on
Hazardous and Industrial Waste Management, 5-8 October
2010, Chania, Crete, Greece
Grosso, M., Biganzoli, L., Rigamonti, L., 2011. A quantitative
estimated of potential recovery from incineration bottom ashes.
Resources, Conservation and Recycling 55, 1178-1184.
129
Hu, Y., Rem, P., Di Maio, F., Muchova, L., 2007. Metal
distribution in Los Angeles MSWI bottom ash. Proceedings
Sardinia 2007, Eleventh International Waste Management and
Landfill Symposium, S. Margherita di Pula, Italy, 1-5- October
2007
Hu, Y., Bakker, M.C.M, de Heij, P.G., 2011. Recovery and
distribution of incinerated aluminium packaging waste. Waste
Management 31 (2011) 2422–2430.
Ilyas, A., Badshah, M., Praagh, M.V., Persson, K.M., 2010.
Evaluation of H2 gas production from MSWI bottom ash.
Proceedings Venice 2010, Third International Symposium on
energy from Biomass and Waste. Venice, Italy, 8-11
November 2010
Ishii, K., Ozaki, R., Kaneko, K., Fukushima, H., Masuda, M.,
2007. Corrosion Science 49, 2581-2601.
ISPRA, 2011. Rapporto rifiuti 2010. [Waste Report 2010]
www.ispraambiente.it
Kohaupt, 2011. Global economics of bottom ash processing.
Presentation at CEWEP-EAA Seminar From Ashes to Metals,
5-6 September 2011, Copenhagen.
Kuo Y., Lin T., Tsai P., Lee W., Lin H., 2003. Fate of
polycyclic aromatic hydrocarbons during vitrification of
incinerator ash in a coke bed furnace. Chemosphere 9, 51-313
Lamers, F., 2008. Developments in upgrading and utilization of
MSWI bottom ash within Europe. Conference proceedings
from Nextgeneration biowaste, 8-10 October 2008, Milan
130
Lopez-Delgado a., Pena C., Lopez V., Lopez F.A., 2003.
Quality of ferrous scraps from MSW incinerators: a case study
of Spain. Resources conservation and Recycling 40, 39-51
Maglio, B., 2003. Criteri di definizione di una tecnologia di
trattamento termico per i rifiuti solidi urbani delle province di
Savona e Imperia. [Parameters for the definition of a
technology for the thermal treatment of the MSW of Savona
and Imperia Provinces]. Master Thesis, Università degli studi
di Genova.
Magnus Project NL, 2003. Magnus separation Project. Speech
at EEA-Packalu Seminar Bruxelles, 24 June 2003.
Manders, J.L.C., 2008. The renewable Energy contribution of
Waste to Energy across Europe. CEWEP, 2008.
www.cewep.com/storage/med/media/energy/283_Renew_Ener
gy_Europe_JM_7.pdf, latest access on 2 February 2011
Marchese F.,Poggio M., Giusti G., 2005. Maturazione in
cumulo all’aperto di scorie pesanti derivanti dall’incenerimento
di RSU. Rifiuti solidi XIX -5, 294-302
Mizutani, S., Sakai, S., Takatsuki, H., 1999. Investigation of
hydrogen generation from municipal solid waste incienration
fly ash. J. Mater. Cycles Waste Manag. 2, 16-23
Muchova, L , Rem, P., Van Berlo, M., 2006. Innovative
Technology for the Treatment of Bottom Ash. Conference
proceeding from ISWA/NVRD World Congress 2007,
Amsterdam, The Netherlands, 24-27 September 2007.

131
Muchova, L., Rem, P., 2007. Wet or dry separation. Waste
Management World, December 2007.
Muller, U., Rubner, K., 2006. The microstructure of concrete
made with municipal waste incinerator bottom ash as an
aggregate component. Cem. Concr. Res. 36,1434-1443.
Pecqueur, G., Crignon, C., Quénée, B., 2001. Behaviour of
cement-treated MSWI bottom ash. Waste management 21,
229-233.
Polettini A., Pomi R., Carcani G., 2005. The effect of Na and
Ca salts on MSWI bottom ash activation for reuse as a
pozzolanic admixture. Resource, Conservation and Recycling.
43, 403-418
Polettini, A., Astrup, T., Cappai, G., Lechner, P., Muntoni, A.,
Pomi, R., Van Gerven, T., Van Zomeren, A., 2007. State-of-
the-art and outlook on management of waste-to-energy bottom
ashes. Part 1: Treatment. Conference proceedings from
Sardinia 2007, Eleventh International Waste Management and
Landfill Symposium. 1-5 ottobre 2007, Cagliari, Italy.
Pruvost, F., 2009. The potential for the valorisation of used
aluminium packaging in Waste-to-Energy plants in Europe - A
study for EAA and IAI. Interim report. Main findings of the
documentary search. January 5, 2009.
Pruvost, F., 2011. Potential for increased aluminium recovery
from bottom ashes in Europe. CEWEP-EAA Seminar,
Copenhagen September 5-6 2011.
132
Ragaglia M., 2004. Influenza dei processi di weathering sul
comportamento alla lisciviazione di scorie di fondo da
incenerimento dei rifiuti. Master Thesis. Università La
Sapienza di Roma.
Rem, P.C., De Vries, C., Van Kooy, L.A., Bevilacqua, P.,
Reuter, M.A., 2004. The Amsterdam pilot on bottom ash.
Miner. Eng., n.17, 363-365
Rendek E., Ducom G., Germain P., 2006. Carbon dioxin
sequestration in municipal solid waste incinerator (MSWI)
bottom ash. Journal of Hazardous Materials B128, 73-79
Sabbas, T., Polettini, R., Astrup, T., Hjelmar, O., Mostbauer,
P., Cappai, G., Magel, G., Salhofer, S., Speiser, C., Heuss-
assbichler, S., Klein R., Lechner, P., 2003. Management of
municipal solid waste incineration residues. Waste Manag. 23,
61-88
Schiona G., 2009. Il riciclo e la sostenibilità ambientale
dell’alluminio. In “La gestione integrata dei rifiuti”, edited by
Giuliano, M., Grosso, M., Rigamonti, L. Published by Cipa
Editore.
Settimo, F., Bevilacqua, P., Rem, P., 2004. Eddy current
separation of fine non-ferrous particles from bulk streams.
Physical separation in Science and Engineering 13, 15-23
Soler, L., Cendela, A.M., Macanas, J., Munoz M., Casado J.,
2009. In situ generation of hydrogen from water by aluminium
corrosion in solutions of sodium aluminate. Journal of Power
Sources 192, 21-26.

133
Stockburger, D., Stannard, J.H., Rao, B.M.L., Kobasz, W.,
Tuck, C.D., 1991. Hydrogen storage materials, battery and
electrochemistry. Eds: Corrigas A., Srinivasan S.
Electrochemical society USA, 431-444
Stucchi, S., 2003. Il bilancio degli elementi tossici nel processo
di termovalorizzazione dei rifiuti solidi urbani. Esperienza su
due impianti reali. [Toxic elements mass balance in MSW
incineration process]. Master degree thesis, Politecnico di
Milano. Supervisors: Cernuschi S., Grosso M.
Tenorio, J.A.S., Espinosa, D.C.R., 2000. High-temperature
oxidation of Al-Mg alloys. Oxidation of metals 53, 361-373.
Zhang, S., Rem, P.C., Forssberg, E., 1999. The investigation of
separability of particles smaller than 5 mm by eddy current
separation technology. Part I: rotating type eddy current
separators. Magnetic and electrical separation 9, 233-251
Vargel, C., 2004. Corrosion of aluminium. Elsevier edition.
Viganò F., Consonni S., Grosso M., Rigamonti L., 2010.
Material and energy recovery from Automotive Shredded
Residues (ASR) via sequential gasification and combustion.
Waste Management, 30, 145-153
Young, D.J., 2008. High temperature oxidation and corrosion
of metals. Elsevier edition.

135
ANNEX I
The detailed results obtained from the analysis of the samples
taken during Test #7 on paper-laminated foil are here
presented.
I.1. Bottom ash
Table I.1 gives an overview of the type and quantity of the
sub-fractions obtained from the pre-treatment of bottom ash
samples taken during Test #7 on aluminium paper-laminated
foil.
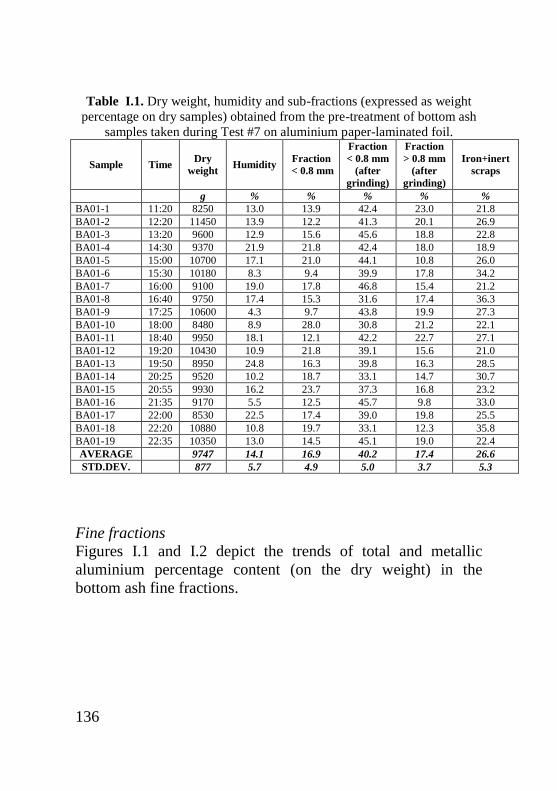
136
Table I.1. Dry weight, humidity and sub-fractions (expressed as weight
percentage on dry samples) obtained from the pre-treatment of bottom ash
samples taken during Test #7 on aluminium paper-laminated foil.
Sample Time Dry
weight Humidity
Fraction
< 0.8 mm
Fraction
< 0.8 mm
(after
grinding)
Fraction
> 0.8 mm
(after
grinding)
Iron+inert
scraps
g % % % % %
BA01-1 11:20 8250 13.0 13.9 42.4 23.0 21.8
BA01-2 12:20 11450 13.9 12.2 41.3 20.1 26.9
BA01-3 13:20 9600 12.9 15.6 45.6 18.8 22.8
BA01-4 14:30 9370 21.9 21.8 42.4 18.0 18.9
BA01-5 15:00 10700 17.1 21.0 44.1 10.8 26.0
BA01-6 15:30 10180 8.3 9.4 39.9 17.8 34.2
BA01-7 16:00 9100 19.0 17.8 46.8 15.4 21.2
BA01-8 16:40 9750 17.4 15.3 31.6 17.4 36.3
BA01-9 17:25 10600 4.3 9.7 43.8 19.9 27.3
BA01-10 18:00 8480 8.9 28.0 30.8 21.2 22.1
BA01-11 18:40 9950 18.1 12.1 42.2 22.7 27.1
BA01-12 19:20 10430 10.9 21.8 39.1 15.6 21.0
BA01-13 19:50 8950 24.8 16.3 39.8 16.3 28.5
BA01-14 20:25 9520 10.2 18.7 33.1 14.7 30.7
BA01-15 20:55 9930 16.2 23.7 37.3 16.8 23.2
BA01-16 21:35 9170 5.5 12.5 45.7 9.8 33.0
BA01-17 22:00 8530 22.5 17.4 39.0 19.8 25.5
BA01-18 22:20 10880 10.8 19.7 33.1 12.3 35.8
BA01-19 22:35 10350 13.0 14.5 45.1 19.0 22.4
AVERAGE 9747 14.1 16.9 40.2 17.4 26.6
STD.DEV. 877 5.7 4.9 5.0 3.7 5.3
Fine fractions
Figures I.1 and I.2 depict the trends of total and metallic
aluminium percentage content (on the dry weight) in the
bottom ash fine fractions.
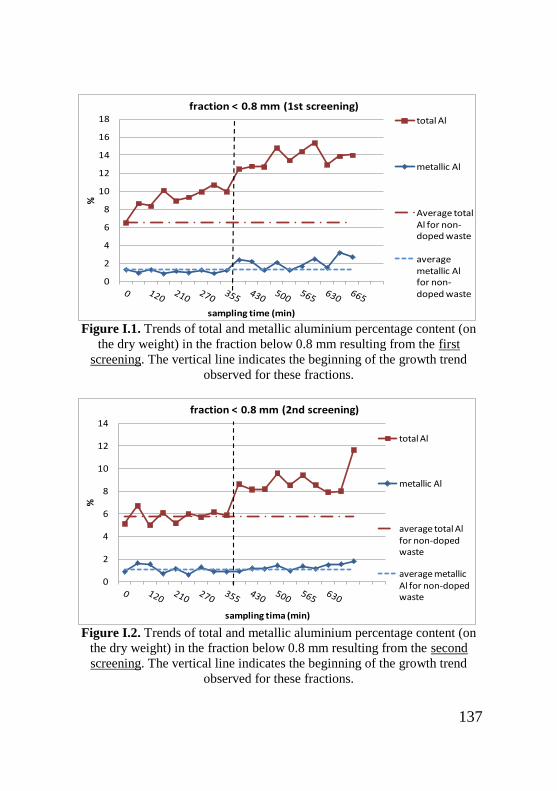
137
Figure I.1. Trends of total and metallic aluminium percentage content (on
the dry weight) in the fraction below 0.8 mm resulting from the first
screening. The vertical line indicates the beginning of the growth trend
observed for these fractions.
Figure I.2. Trends of total and metallic aluminium percentage content (on
the dry weight) in the fraction below 0.8 mm resulting from the second
screening. The vertical line indicates the beginning of the growth trend
observed for these fractions.
0
2
4
6
8
10
12
14
16
18
%
sampling time (min)
fraction < 0.8 mm (1st screening) total Al
metallic Al
Average total Al for non-doped waste
average metallic Al for non-doped waste
0
2
4
6
8
10
12
14
%
sampling tima (min)
fraction < 0.8 mm (2nd screening)
total Al
metallic Al
average total Al for non-doped waste
average metallic Al for non-doped waste
138
The two fine fractions show an evident growth trend from 390
minutes after the beginning of sampling operations. This is
more evident for the fine fraction after the second screening,
whereas for that after the first screening total aluminium
concentration seems to increase continuously from the very
beginning of the sampling operations. However, the graph in
Figure I.1 must not mislead. When the concentrations are
rescaled on the mass on the whole bottom ash samples (before
the pre-treatment of the ash), it is evident that Al concentration
starts to increase from 390 minutes after the beginning of the
sampling operations also for the fine fraction after the first
screening, as depicted in Figure I.3.
The trend of aluminium in the fine fractions shows the
impossibility to appreciate the complete evolution of the curve
and, in particular, its decreasing phase towards the average
values of the non-doped waste. Unfortunately the sampling
time was shorter than the actual residence time of the waste in
the furnace and in the bottom ash extraction system. Despite
this limitation, the curves were integrated to evaluate the
aluminium mass balance.
The integration of the curves of total and metallic aluminium
content in the fine fractions starts from 355 minutes after the
beginning of the sampling.
Dotted horizontal lines indicate the average values of total and
metallic aluminium percentage content calculated for the non-
doped waste. Concerning the fine fraction resulting from the
first screening, the average total aluminium content is equal to
9.2%, while the average metallic aluminium content is 1.1%.
For the fine fraction resulting from the second screening, the
average percentage contents are equal to 5.8% and 1.1%,
respectively.
Table I.2 reports the calculation of fed packaging average
contribution. Table I.3 shows the aluminium content in the
139
metallic form in the two bottom ash fine fractions. Less than
29% of the aluminium in the fine fractions is present in the
metallic form. The table does not reveal any significant change
due to the doping of the waste.

140
Figure I.3. Temporal evolution of total Aluminium concentration in the bottom ash samples during the tests on
aluminium paper-laminated foil. Percentage is expressed on the mass of the total bottom ash samples. The vertical
line indicates the beginning of the growth trend observed for these fractions.
0
1
2
3
4
5
6
09
:36
09
:50
10
:04
10
:19
10
:33
10
:48
11
:02
11
:16
11
:31
11
:45
12
:00
12
:14
12
:28
12
:43
12
:57
13
:12
13
:26
13
:40
13
:55
14
:09
14
:24
14
:38
14
:52
15
:07
15
:21
15
:36
15
:50
16
:04
16
:19
16
:33
16
:48
17
:02
17
:16
17
:31
17
:45
18
:00
18
:14
18
:28
18
:43
18
:57
19
:12
19
:26
19
:40
19
:55
20
:09
20
:24
20
:38
20
:52
21
:07
21
:21
21
:36
21
:50
22
:04
22
:19
22
:33
22
:48
23
:02
23
:16
%
sampling time
ingot 0.8-5 mm
ingot > 5 mm
Bottom ash fraction < 0.8 mm (first screening)
Bottom ash fraction < 0.8 mm (second screening)salt dross
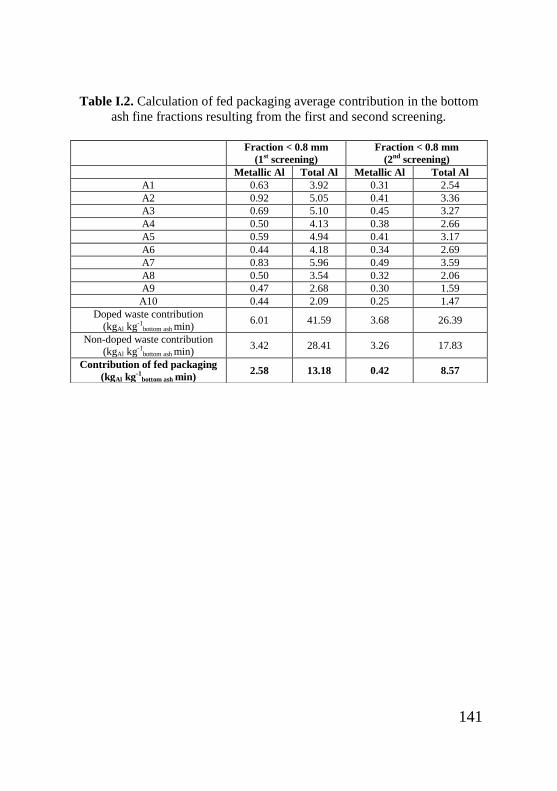
141
Table I.2. Calculation of fed packaging average contribution in the bottom
ash fine fractions resulting from the first and second screening.
Fraction < 0.8 mm
(1st screening)
Fraction < 0.8 mm
(2nd screening)
Metallic Al Total Al Metallic Al Total Al
A1 0.63 3.92 0.31 2.54
A2 0.92 5.05 0.41 3.36
A3 0.69 5.10 0.45 3.27
A4 0.50 4.13 0.38 2.66
A5 0.59 4.94 0.41 3.17
A6 0.44 4.18 0.34 2.69
A7 0.83 5.96 0.49 3.59
A8 0.50 3.54 0.32 2.06
A9 0.47 2.68 0.30 1.59
A10 0.44 2.09 0.25 1.47
Doped waste contribution
(kgAl kg-1bottom ash min)
6.01 41.59 3.68 26.39
Non-doped waste contribution (kgAl kg-1
bottom ash min) 3.42 28.41 3.26 17.83
Contribution of fed packaging
(kgAl kg-1bottom ash min)
2.58 13.18 0.42 8.57
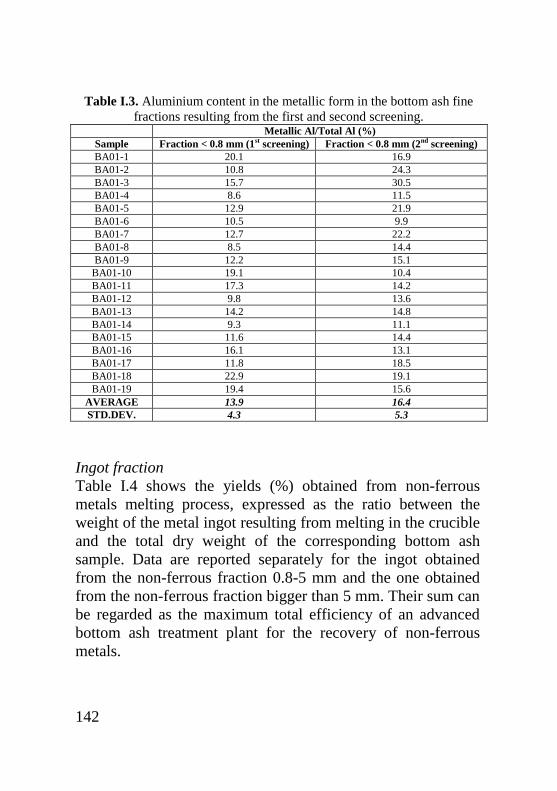
142
Table I.3. Aluminium content in the metallic form in the bottom ash fine
fractions resulting from the first and second screening. Metallic Al/Total Al (%)
Sample Fraction < 0.8 mm (1st screening) Fraction < 0.8 mm (2nd screening)
BA01-1 20.1 16.9
BA01-2 10.8 24.3
BA01-3 15.7 30.5
BA01-4 8.6 11.5
BA01-5 12.9 21.9
BA01-6 10.5 9.9
BA01-7 12.7 22.2
BA01-8 8.5 14.4
BA01-9 12.2 15.1
BA01-10 19.1 10.4
BA01-11 17.3 14.2
BA01-12 9.8 13.6
BA01-13 14.2 14.8
BA01-14 9.3 11.1
BA01-15 11.6 14.4
BA01-16 16.1 13.1
BA01-17 11.8 18.5
BA01-18 22.9 19.1
BA01-19 19.4 15.6
AVERAGE 13.9 16.4
STD.DEV. 4.3 5.3
Ingot fraction
Table I.4 shows the yields (%) obtained from non-ferrous
metals melting process, expressed as the ratio between the
weight of the metal ingot resulting from melting in the crucible
and the total dry weight of the corresponding bottom ash
sample. Data are reported separately for the ingot obtained
from the non-ferrous fraction 0.8-5 mm and the one obtained
from the non-ferrous fraction bigger than 5 mm. Their sum can
be regarded as the maximum total efficiency of an advanced
bottom ash treatment plant for the recovery of non-ferrous
metals.
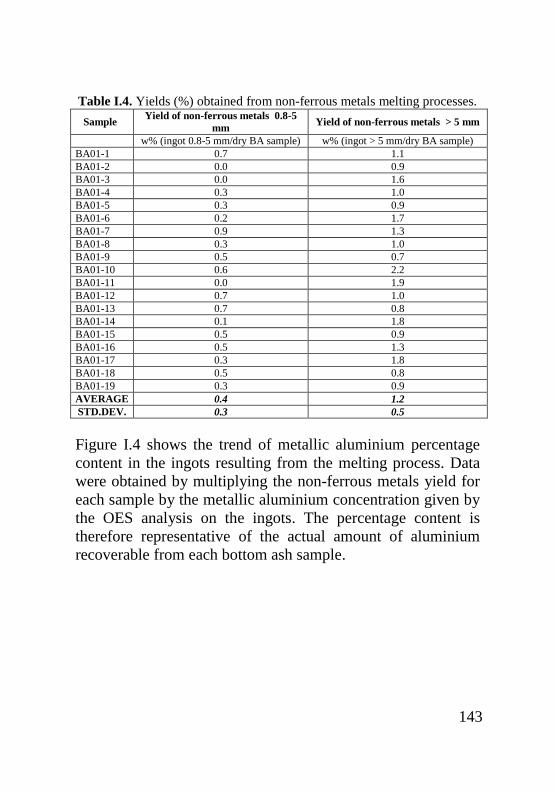
143
Table I.4. Yields (%) obtained from non-ferrous metals melting processes.
Sample Yield of non-ferrous metals 0.8-5
mm Yield of non-ferrous metals > 5 mm
w% (ingot 0.8-5 mm/dry BA sample) w% (ingot > 5 mm/dry BA sample)
BA01-1 0.7 1.1
BA01-2 0.0 0.9
BA01-3 0.0 1.6
BA01-4 0.3 1.0
BA01-5 0.3 0.9
BA01-6 0.2 1.7
BA01-7 0.9 1.3
BA01-8 0.3 1.0
BA01-9 0.5 0.7
BA01-10 0.6 2.2
BA01-11 0.0 1.9
BA01-12 0.7 1.0
BA01-13 0.7 0.8
BA01-14 0.1 1.8
BA01-15 0.5 0.9
BA01-16 0.5 1.3
BA01-17 0.3 1.8
BA01-18 0.5 0.8
BA01-19 0.3 0.9
AVERAGE 0.4 1.2
STD.DEV. 0.3 0.5
Figure I.4 shows the trend of metallic aluminium percentage
content in the ingots resulting from the melting process. Data
were obtained by multiplying the non-ferrous metals yield for
each sample by the metallic aluminium concentration given by
the OES analysis on the ingots. The percentage content is
therefore representative of the actual amount of aluminium
recoverable from each bottom ash sample.
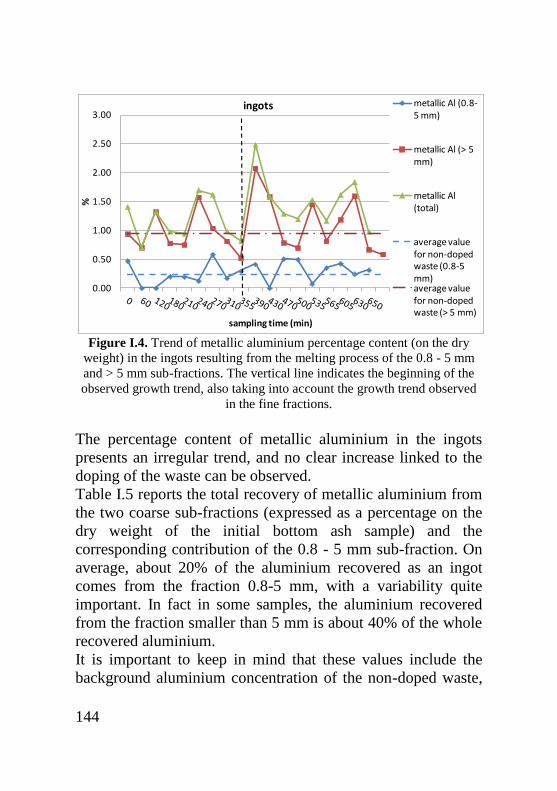
144
Figure I.4. Trend of metallic aluminium percentage content (on the dry
weight) in the ingots resulting from the melting process of the 0.8 - 5 mm
and > 5 mm sub-fractions. The vertical line indicates the beginning of the
observed growth trend, also taking into account the growth trend observed
in the fine fractions.
The percentage content of metallic aluminium in the ingots
presents an irregular trend, and no clear increase linked to the
doping of the waste can be observed.
Table I.5 reports the total recovery of metallic aluminium from
the two coarse sub-fractions (expressed as a percentage on the
dry weight of the initial bottom ash sample) and the
corresponding contribution of the 0.8 - 5 mm sub-fraction. On
average, about 20% of the aluminium recovered as an ingot
comes from the fraction 0.8-5 mm, with a variability quite
important. In fact in some samples, the aluminium recovered
from the fraction smaller than 5 mm is about 40% of the whole
recovered aluminium.
It is important to keep in mind that these values include the
background aluminium concentration of the non-doped waste,
0.00
0.50
1.00
1.50
2.00
2.50
3.00
%
sampling time (min)
ingots metallic Al (0.8-5 mm)
metallic Al (> 5 mm)
metallic Al (total)
average value for non-doped waste (0.8-5 mm)average value for non-doped waste (> 5 mm)
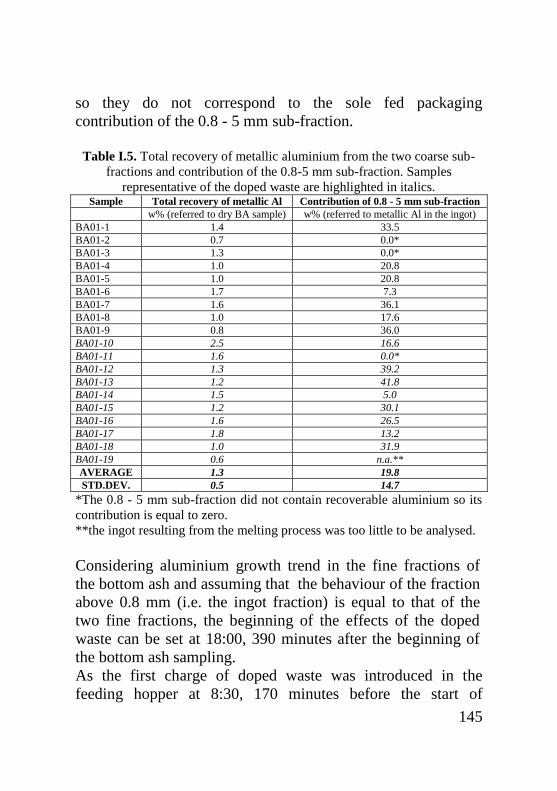
145
so they do not correspond to the sole fed packaging
contribution of the 0.8 - 5 mm sub-fraction.
Table I.5. Total recovery of metallic aluminium from the two coarse sub-
fractions and contribution of the 0.8-5 mm sub-fraction. Samples
representative of the doped waste are highlighted in italics. Sample Total recovery of metallic Al Contribution of 0.8 - 5 mm sub-fraction
w% (referred to dry BA sample) w% (referred to metallic Al in the ingot)
BA01-1 1.4 33.5
BA01-2 0.7 0.0*
BA01-3 1.3 0.0*
BA01-4 1.0 20.8
BA01-5 1.0 20.8
BA01-6 1.7 7.3
BA01-7 1.6 36.1
BA01-8 1.0 17.6
BA01-9 0.8 36.0
BA01-10 2.5 16.6
BA01-11 1.6 0.0*
BA01-12 1.3 39.2
BA01-13 1.2 41.8
BA01-14 1.5 5.0
BA01-15 1.2 30.1
BA01-16 1.6 26.5
BA01-17 1.8 13.2
BA01-18 1.0 31.9
BA01-19 0.6 n.a.**
AVERAGE 1.3 19.8
STD.DEV. 0.5 14.7
*The 0.8 - 5 mm sub-fraction did not contain recoverable aluminium so its
contribution is equal to zero.
**the ingot resulting from the melting process was too little to be analysed.
Considering aluminium growth trend in the fine fractions of
the bottom ash and assuming that the behaviour of the fraction
above 0.8 mm (i.e. the ingot fraction) is equal to that of the
two fine fractions, the beginning of the effects of the doped
waste can be set at 18:00, 390 minutes after the beginning of
the bottom ash sampling.
As the first charge of doped waste was introduced in the
feeding hopper at 8:30, 170 minutes before the start of
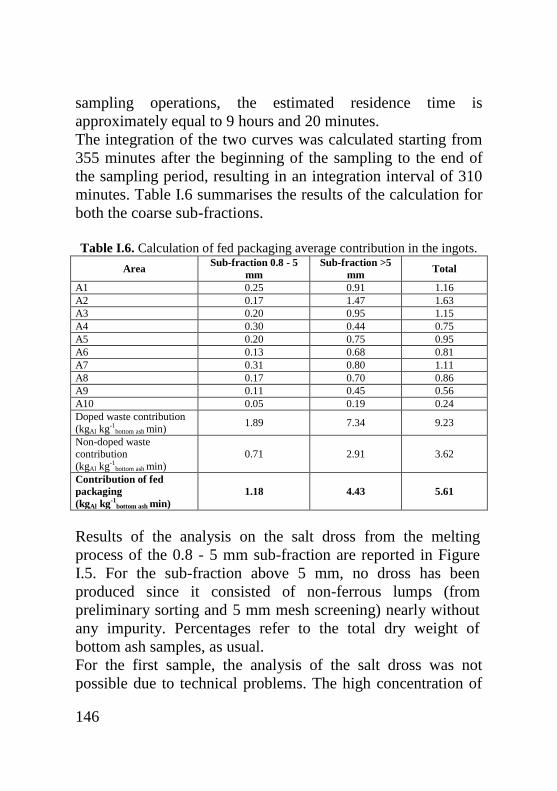
146
sampling operations, the estimated residence time is
approximately equal to 9 hours and 20 minutes.
The integration of the two curves was calculated starting from
355 minutes after the beginning of the sampling to the end of
the sampling period, resulting in an integration interval of 310
minutes. Table I.6 summarises the results of the calculation for
both the coarse sub-fractions.
Table I.6. Calculation of fed packaging average contribution in the ingots.
Area Sub-fraction 0.8 - 5
mm
Sub-fraction >5
mm Total
A1 0.25 0.91 1.16
A2 0.17 1.47 1.63
A3 0.20 0.95 1.15
A4 0.30 0.44 0.75
A5 0.20 0.75 0.95
A6 0.13 0.68 0.81
A7 0.31 0.80 1.11
A8 0.17 0.70 0.86
A9 0.11 0.45 0.56
A10 0.05 0.19 0.24
Doped waste contribution
(kgAl kg-1bottom ash min)
1.89 7.34 9.23
Non-doped waste contribution
(kgAl kg-1bottom ash min)
0.71 2.91 3.62
Contribution of fed
packaging
(kgAl kg-1bottom ash min)
1.18 4.43 5.61
Results of the analysis on the salt dross from the melting
process of the 0.8 - 5 mm sub-fraction are reported in Figure
I.5. For the sub-fraction above 5 mm, no dross has been
produced since it consisted of non-ferrous lumps (from
preliminary sorting and 5 mm mesh screening) nearly without
any impurity. Percentages refer to the total dry weight of
bottom ash samples, as usual.
For the first sample, the analysis of the salt dross was not
possible due to technical problems. The high concentration of
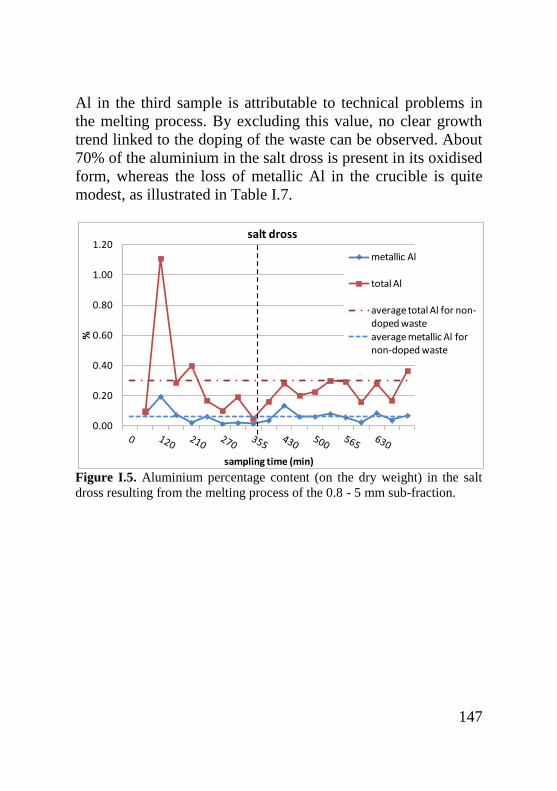
147
Al in the third sample is attributable to technical problems in
the melting process. By excluding this value, no clear growth
trend linked to the doping of the waste can be observed. About
70% of the aluminium in the salt dross is present in its oxidised
form, whereas the loss of metallic Al in the crucible is quite
modest, as illustrated in Table I.7.
Figure I.5. Aluminium percentage content (on the dry weight) in the salt
dross resulting from the melting process of the 0.8 - 5 mm sub-fraction.
0.00
0.20
0.40
0.60
0.80
1.00
1.20
%
sampling time (min)
salt dross
metallic Al
total Al
average total Al for non-doped wasteaverage metallic Al for non-doped waste
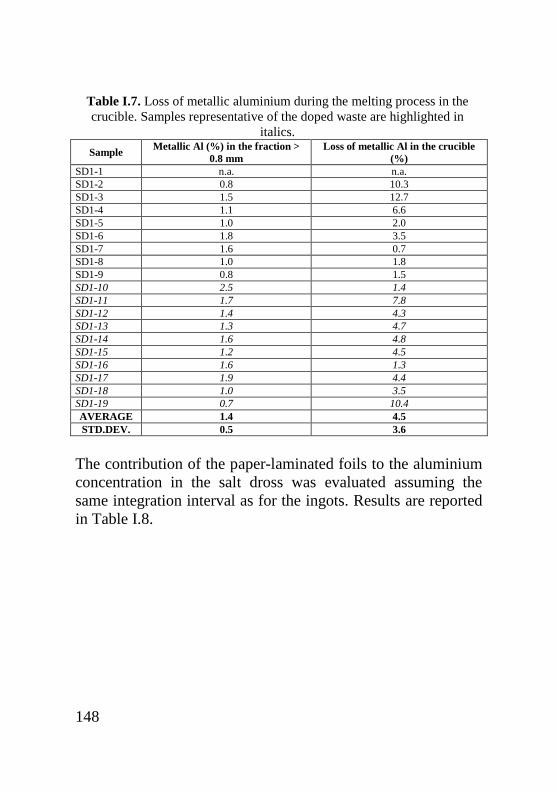
148
Table I.7. Loss of metallic aluminium during the melting process in the
crucible. Samples representative of the doped waste are highlighted in
italics.
Sample Metallic Al (%) in the fraction >
0.8 mm
Loss of metallic Al in the crucible
(%)
SD1-1 n.a. n.a.
SD1-2 0.8 10.3
SD1-3 1.5 12.7
SD1-4 1.1 6.6
SD1-5 1.0 2.0
SD1-6 1.8 3.5
SD1-7 1.6 0.7
SD1-8 1.0 1.8
SD1-9 0.8 1.5
SD1-10 2.5 1.4
SD1-11 1.7 7.8
SD1-12 1.4 4.3
SD1-13 1.3 4.7
SD1-14 1.6 4.8
SD1-15 1.2 4.5
SD1-16 1.6 1.3
SD1-17 1.9 4.4
SD1-18 1.0 3.5
SD1-19 0.7 10.4
AVERAGE 1.4 4.5
STD.DEV. 0.5 3.6
The contribution of the paper-laminated foils to the aluminium
concentration in the salt dross was evaluated assuming the
same integration interval as for the ingots. Results are reported
in Table I.8.

149
Table I.8. Calculation of fed packaging average contribution in the salt
dross. Area Metallic Al Total Al
A1 0.02 0.07
A2 0.07 0.18
A3 0.08 0.19
A4 0.04 0.13
A5 0.05 0.18
A6 0.04 0.18
A7 0.03 0.18
A8 0.03 0.11
A9 0.02 0.09
A10 0.02 0.08
Doped waste contribution
(kgAl kg-1bottom ash min)
0.38 1.38
Non-doped waste contribution (kgAl kg-1
bottom ash min) 0.18 0.93
Contribution of fed packaging
(kgAl kg-1bottom ash min)
0.20 0.46
I.2. Fly ash
Boiler ash
Figure I.6 shows the percentage content of total and metallic
aluminium measured in boiler ash samples.
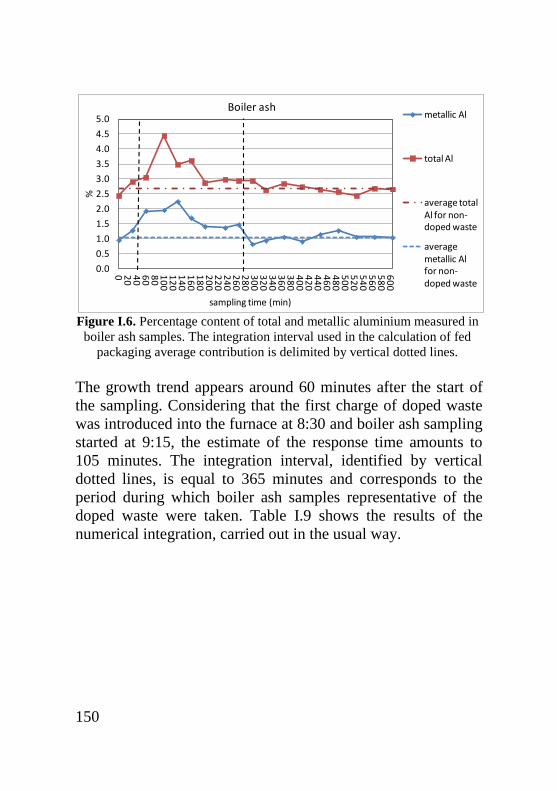
150
Figure I.6. Percentage content of total and metallic aluminium measured in
boiler ash samples. The integration interval used in the calculation of fed
packaging average contribution is delimited by vertical dotted lines.
The growth trend appears around 60 minutes after the start of
the sampling. Considering that the first charge of doped waste
was introduced into the furnace at 8:30 and boiler ash sampling
started at 9:15, the estimate of the response time amounts to
105 minutes. The integration interval, identified by vertical
dotted lines, is equal to 365 minutes and corresponds to the
period during which boiler ash samples representative of the
doped waste were taken. Table I.9 shows the results of the
numerical integration, carried out in the usual way.
0.0
0.5
1.0
1.5
2.0
2.5
3.0
3.5
4.0
4.5
5.0
0 20
40
60
80
10
01
20
14
01
60
18
02
00
22
02
40
26
02
80
30
03
20
34
03
60
38
04
00
42
04
40
46
04
80
50
05
20
54
05
60
58
06
00
%
sampling time (min)
Boiler ash metallic Al
total Al
average total Al for non-doped waste
average metallic Al for non-doped waste
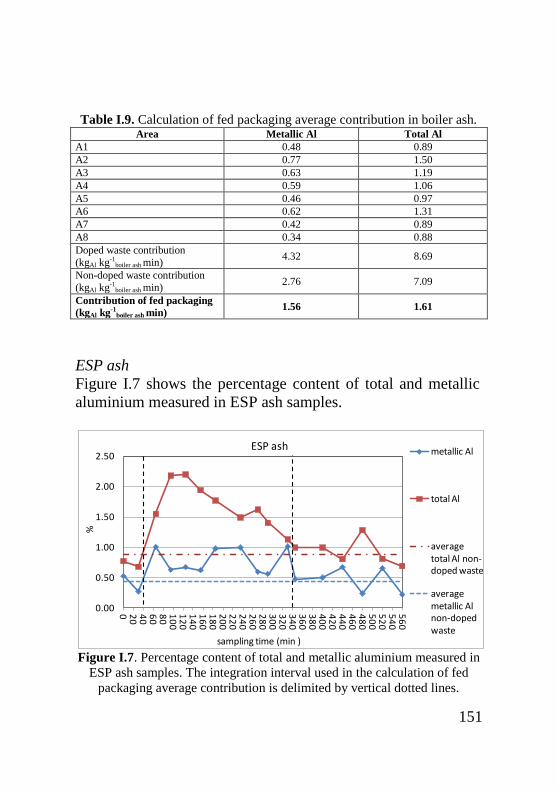
151
Table I.9. Calculation of fed packaging average contribution in boiler ash.
Area Metallic Al Total Al
A1 0.48 0.89
A2 0.77 1.50
A3 0.63 1.19
A4 0.59 1.06
A5 0.46 0.97
A6 0.62 1.31
A7 0.42 0.89
A8 0.34 0.88
Doped waste contribution
(kgAl kg-1boiler ash min)
4.32 8.69
Non-doped waste contribution
(kgAl kg-1boiler ash min)
2.76 7.09
Contribution of fed packaging
(kgAl kg-1boiler ash min)
1.56 1.61
ESP ash
Figure I.7 shows the percentage content of total and metallic
aluminium measured in ESP ash samples.
Figure I.7. Percentage content of total and metallic aluminium measured in
ESP ash samples. The integration interval used in the calculation of fed
packaging average contribution is delimited by vertical dotted lines.
0.00
0.50
1.00
1.50
2.00
2.50
0 20
40
60
80
10
01
20
14
01
60
18
02
00
22
02
40
26
02
80
30
03
20
34
03
60
38
04
00
42
04
40
46
04
80
50
05
20
54
05
60
%
sampling time (min )
ESP ash metallic Al
total Al
average total Al non-doped waste
average metallic Al non-doped waste
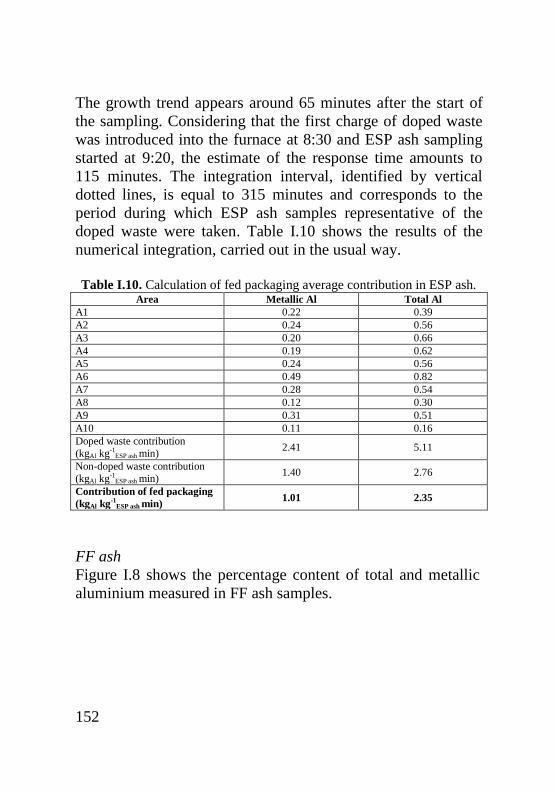
152
The growth trend appears around 65 minutes after the start of
the sampling. Considering that the first charge of doped waste
was introduced into the furnace at 8:30 and ESP ash sampling
started at 9:20, the estimate of the response time amounts to
115 minutes. The integration interval, identified by vertical
dotted lines, is equal to 315 minutes and corresponds to the
period during which ESP ash samples representative of the
doped waste were taken. Table I.10 shows the results of the
numerical integration, carried out in the usual way.
Table I.10. Calculation of fed packaging average contribution in ESP ash.
Area Metallic Al Total Al
A1 0.22 0.39
A2 0.24 0.56
A3 0.20 0.66
A4 0.19 0.62
A5 0.24 0.56
A6 0.49 0.82
A7 0.28 0.54
A8 0.12 0.30
A9 0.31 0.51
A10 0.11 0.16
Doped waste contribution
(kgAl kg-1ESP ash min)
2.41 5.11
Non-doped waste contribution
(kgAl kg-1ESP ash min)
1.40 2.76
Contribution of fed packaging
(kgAl kg-1ESP ash min)
1.01 2.35
FF ash
Figure I.8 shows the percentage content of total and metallic
aluminium measured in FF ash samples.
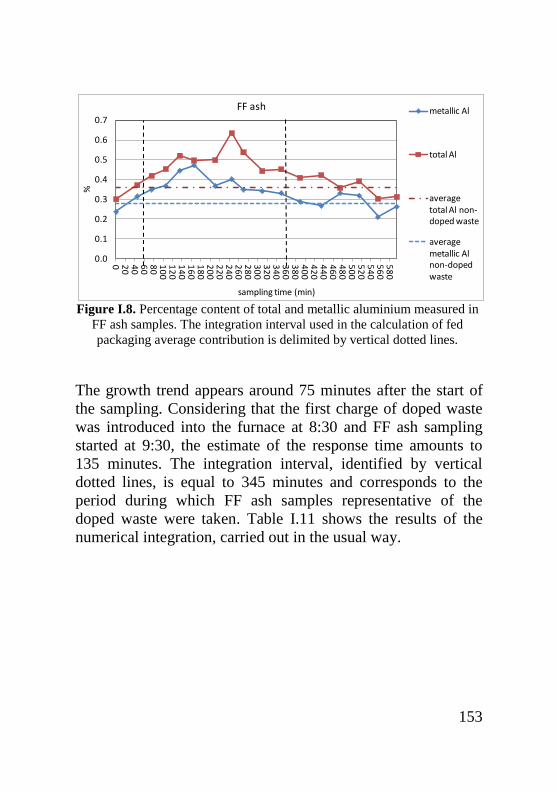
153
Figure I.8. Percentage content of total and metallic aluminium measured in
FF ash samples. The integration interval used in the calculation of fed
packaging average contribution is delimited by vertical dotted lines.
The growth trend appears around 75 minutes after the start of
the sampling. Considering that the first charge of doped waste
was introduced into the furnace at 8:30 and FF ash sampling
started at 9:30, the estimate of the response time amounts to
135 minutes. The integration interval, identified by vertical
dotted lines, is equal to 345 minutes and corresponds to the
period during which FF ash samples representative of the
doped waste were taken. Table I.11 shows the results of the
numerical integration, carried out in the usual way.
0.0
0.1
0.2
0.3
0.4
0.5
0.6
0.7
0 20
40
60
80
10
01
20
14
01
60
18
02
00
22
02
40
26
02
80
30
03
20
34
03
60
38
04
00
42
04
40
46
04
80
50
05
20
54
05
60
58
0
%
sampling time (min)
FF ash metallic Al
total Al
average total Al non-doped waste
average metallic Al non-doped waste

154
Table I.11. Calculation of fed packaging average contribution in FF ash.
Area Metallic Al Total Al
A1 0.10 0.12
A2 0.11 0.13
A3 0.12 0.15
A4 0.14 0.15
A5 0.19 0.22
A6 0.13 0.20
A7 0.09 0.15
A8 0.14 0.20
A9 0.13 0.18
A10 0.12 0.17
Doped waste contribution
(kgAl kg-1FF ash min)
1.16 1.49
Non-doped waste contribution
(kgAl kg-1FF ash min)
0.96 1.24
Contribution of fed packaging
(kgAl kg-1FF ash min)
0.20 0.25
I.3.Bottom ash quenching water
During this test, only two samples of bottom ash quenching
water were taken, due to technical problems. Both samples
referred to the non-doped waste, as reported in table I.12. For
this reason, the contribution of aluminium foil to aluminium
concentration in the quenching waste could not be evaluated.
Table I.12. Total aluminium concentration in the bottom ash quenching
water. Sample time Total Al (mg l-1)
W1-1 14:30 1130
W1-2 16:30 797
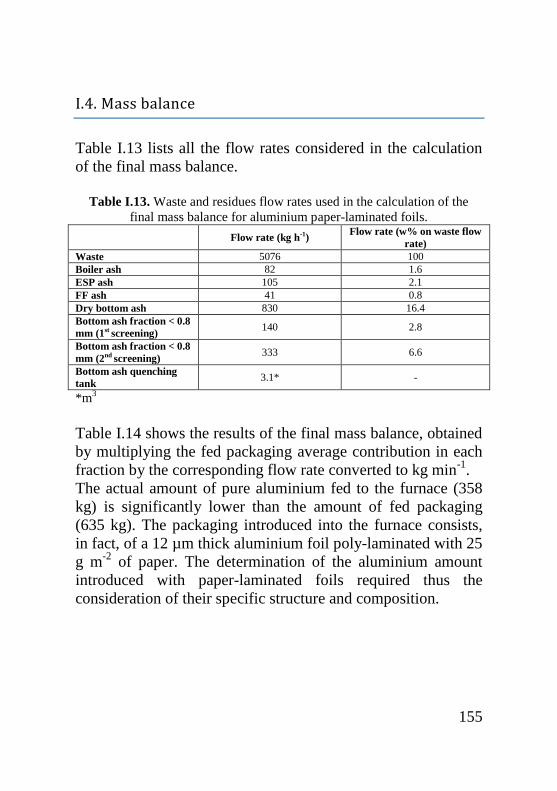
155
I.4. Mass balance
Table I.13 lists all the flow rates considered in the calculation
of the final mass balance.
Table I.13. Waste and residues flow rates used in the calculation of the
final mass balance for aluminium paper-laminated foils.
Flow rate (kg h-1)
Flow rate (w% on waste flow
rate)
Waste 5076 100
Boiler ash 82 1.6
ESP ash 105 2.1
FF ash 41 0.8
Dry bottom ash 830 16.4
Bottom ash fraction < 0.8
mm (1st screening) 140 2.8
Bottom ash fraction < 0.8
mm (2nd screening) 333 6.6
Bottom ash quenching
tank 3.1* -
*m3
Table I.14 shows the results of the final mass balance, obtained
by multiplying the fed packaging average contribution in each
fraction by the corresponding flow rate converted to kg min-1
.
The actual amount of pure aluminium fed to the furnace (358
kg) is significantly lower than the amount of fed packaging
(635 kg). The packaging introduced into the furnace consists,
in fact, of a 12 µm thick aluminium foil poly-laminated with 25
g m-2
of paper. The determination of the aluminium amount
introduced with paper-laminated foils required thus the
consideration of their specific structure and composition.
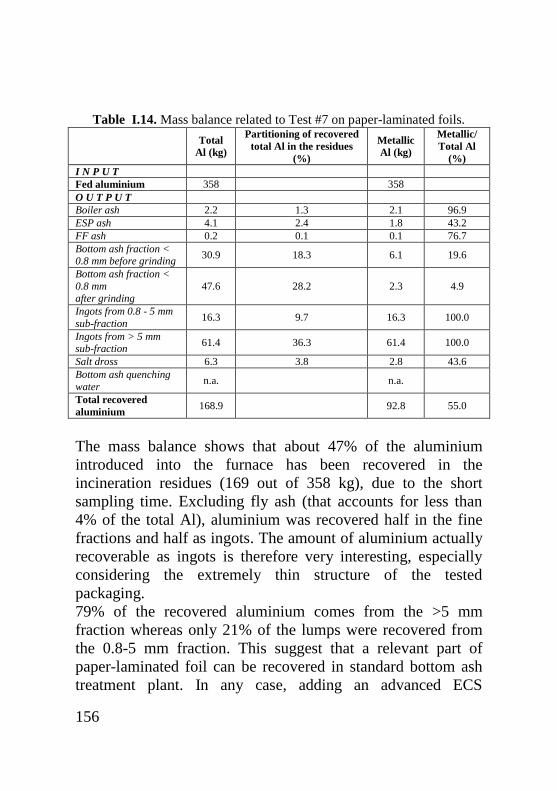
156
Table I.14. Mass balance related to Test #7 on paper-laminated foils.
Total
Al (kg)
Partitioning of recovered
total Al in the residues
(%)
Metallic
Al (kg)
Metallic/
Total Al
(%)
I N P U T
Fed aluminium 358 358
O U T P U T
Boiler ash 2.2 1.3 2.1 96.9
ESP ash 4.1 2.4 1.8 43.2
FF ash 0.2 0.1 0.1 76.7
Bottom ash fraction < 0.8 mm before grinding
30.9 18.3 6.1 19.6
Bottom ash fraction <
0.8 mm after grinding
47.6 28.2 2.3 4.9
Ingots from 0.8 - 5 mm
sub-fraction 16.3 9.7 16.3 100.0
Ingots from > 5 mm sub-fraction
61.4 36.3 61.4 100.0
Salt dross 6.3 3.8 2.8 43.6
Bottom ash quenching
water n.a. n.a.
Total recovered
aluminium 168.9 92.8 55.0
The mass balance shows that about 47% of the aluminium
introduced into the furnace has been recovered in the
incineration residues (169 out of 358 kg), due to the short
sampling time. Excluding fly ash (that accounts for less than
4% of the total Al), aluminium was recovered half in the fine
fractions and half as ingots. The amount of aluminium actually
recoverable as ingots is therefore very interesting, especially
considering the extremely thin structure of the tested
packaging.
79% of the recovered aluminium comes from the >5 mm
fraction whereas only 21% of the lumps were recovered from
the 0.8-5 mm fraction. This suggest that a relevant part of
paper-laminated foil can be recovered in standard bottom ash
treatment plant. In any case, adding an advanced ECS
157
specifically calibrated on grains smaller than 5 mm allows to
increase the yield of aluminium recovery by a non negligible
27%.
4% of the paper-laminated foil fed to the furnace is lost during
the melting process in the salt dross and almost half of this
amount is in the metallic form. However, we must take in
account the differences between the melting process in the
melting pot, performed during the experimentation, and the real
recycling process in the secondary smelter. In addition,
foundries usually treat the salt dross in order to further recover
the metallic aluminium trapped in the salt.
Only 55% of the recovered aluminium is in its metallic form,
as expected considering the thin structure of the packaging and,
consequently, the potentially high oxidation level of
aluminium. In particular, the metallic/total Al ratio is
particularly low for the bottom ash fine fractions whereas, on
the contrary, most of the aluminium in the fly ash is metallic.
The complete mass balance of aluminium can be tentatively
estimated by enlarging the integration interval of the bottom
ash. An integration interval twice the one previously used for
the bottom ash was assumed, based on two considerations:
Bottom ash (ingots and fine fraction after the second
screening) resulting from the doped waste was sampled
for about 5 hours, without observing a decreasing of
aluminium concentration. We can assume that only the
first half of the curve was measured and, thus, the time
frame interested by the extraction of the doped bottom
ash was double the integration time reported in chapter
I.1.
The interval between the time when the first sample of
doped bottom ash was observed during the test #6 and
the start of the test #7 was equal to 13 hours. Thus, the
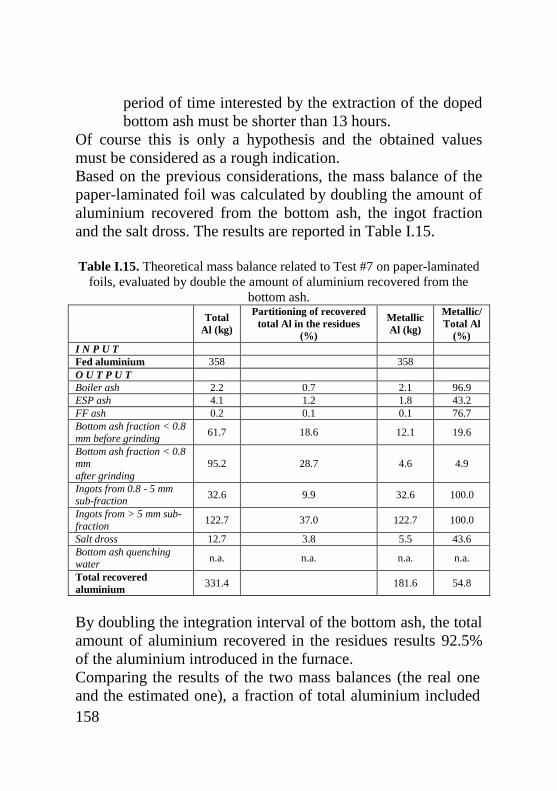
158
period of time interested by the extraction of the doped
bottom ash must be shorter than 13 hours.
Of course this is only a hypothesis and the obtained values
must be considered as a rough indication.
Based on the previous considerations, the mass balance of the
paper-laminated foil was calculated by doubling the amount of
aluminium recovered from the bottom ash, the ingot fraction
and the salt dross. The results are reported in Table I.15.
Table I.15. Theoretical mass balance related to Test #7 on paper-laminated
foils, evaluated by double the amount of aluminium recovered from the
bottom ash.
Total
Al (kg)
Partitioning of recovered
total Al in the residues
(%)
Metallic
Al (kg)
Metallic/
Total Al
(%)
I N P U T
Fed aluminium 358 358
O U T P U T
Boiler ash 2.2 0.7 2.1 96.9
ESP ash 4.1 1.2 1.8 43.2
FF ash 0.2 0.1 0.1 76.7
Bottom ash fraction < 0.8
mm before grinding 61.7 18.6 12.1 19.6
Bottom ash fraction < 0.8 mm
after grinding
95.2 28.7 4.6 4.9
Ingots from 0.8 - 5 mm sub-fraction
32.6 9.9 32.6 100.0
Ingots from > 5 mm sub-
fraction 122.7 37.0 122.7 100.0
Salt dross 12.7 3.8 5.5 43.6
Bottom ash quenching water
n.a. n.a. n.a. n.a.
Total recovered
aluminium 331.4 181.6 54.8
By doubling the integration interval of the bottom ash, the total
amount of aluminium recovered in the residues results 92.5%
of the aluminium introduced in the furnace.
Comparing the results of the two mass balances (the real one
and the estimated one), a fraction of total aluminium included
159
between 96 and 98% concentrates in the bottom ash (fine
fractions plus ingots), with only a negligible quantity that is
lost with fly ash.
About 46-47% of the total aluminium fed into the furnace can
be actually recovered from the bottom ash and recycled.
Nearly one fifth of this amount comes from smaller lumps
(ingot 0.8-5 mm), which means it is recoverable only if
advanced treatments for the bottom ash are applied. The
residual amount of total aluminium (46-47% of the aluminium
fed to the furnace) concentrates in the fine fractions of the
bottom ash and, thus, cannot be recovered with the current
ECS technologies.
About 4% of the total aluminium theoretically recoverable is
lost during the melting process and concentrates in the dross
salt.