Embed Size (px)
DESCRIPTION
Aluminium EU ETS
Citation preview
international energy agencyagence internationale de l’energie
Climate poliCy and Carbon leakage
Impacts of the European Emissions Trading Scheme on Aluminium
IEA InformAtIon pApEr
Julia Reinaud
inteRnational eneRgy agency
© OECD/IEA, October 2008
INTERNATIONAL ENERGY AGENCY
the international energy agency (iea) is an autonomous body which was established in november 1974 within the framework of the organisation for economic co-operation and development (oecd) to implement an international energy programme.
it carries out a comprehensive programme of energy co-operation among twenty-eight of the oecd thirty member countries. the basic aims of the iea are:n to maintain and improve systems for coping with oil supply disruptions.n to promote rational energy policies in a global context through co-operative relations
with non-member countries, industry and international organisations.n to operate a permanent information system on the international oil market.n to improve the world’s energy supply and demand structure by developing alternative
energy sources and increasing the efficiency of energy use.n to promote international collaboration on energy technology.n to assist in the integration of environmental and energy policies.
the iea member countries are: australia, austria, Belgium, canada, czech republic, denmark, Finland, France, germany, greece, Hungary, ireland, italy, Japan, republic of Korea, luxembourg, netherlands, new Zealand, norway, Poland, Portugal, Slovak republic, Spain, Sweden, Switzerland, turkey, United Kingdom and United States. the european commission also participates in the work of the iea.
ORGANISATION FOR ECONOMIC CO-OPERATION AND DEVELOPMENT
the oecd is a unique forum where the governments of thirty democracies work together to address the economic, social and environmental challenges of globalisation. the oecd is also at the forefront of efforts to understand and to help governments respond to new developments and concerns, such as corporate governance, the information economy and the challenges of an ageing population. the organisation provides a setting where governments can compare policy experiences, seek answers to common problems, identify good practice and work to co-ordinate domestic and international policies.
the oecd member countries are: australia, austria, Belgium, canada, czech republic, denmark, Finland, France, germany, greece, Hungary, iceland, ireland, italy, Japan, republic of Korea, luxembourg, Mexico, netherlands, new Zealand, norway, Poland, Portugal, Slovak republic, Spain, Sweden, Switzerland, turkey, United Kingdom and United States.the european commission takes part in the work of the oecd.
© OECD/IEA, 2008
international energy agency (iea), Head of communication and information office,
9 rue de la Fédération, 75739 Paris cedex 15, France.
Please note that this publication is subject to specific restrictions that limit its use and distribution.
The terms and conditions are available online at http://www.iea.org/Textbase/about/copyright.asp
1
Acknowledgements
The author would like to thank Richard Baron, Barbara Buchner, Dolf Gielen, Nigel Jollands, and Richard Bradley at IEA, for their advice and comments. Denny Ellerman (MIT) provided inspiration for the project. Bob Lambrechts, Eirik Nordheim, Patrick Schrynmakers (EAA), Alessandro Profili (Alcoa), John Segal and Kelly Driscoll (CRU Monitor) and Philippe Quirion (CIRED) have all provided very useful input and feedback on the results. Caroline Gill and Andrea Nour (IEA) provided administrative and legal support.
This work was partly supported by the Japanese government
The views expressed in this report are those of the authors and do not
necessarily represent the views of the IEA or its members.
2
EXECUTIVE SUMMARY
The implementation of the Kyoto Protocol – or other regimes that exclude major
players in important industrial activities –creates competitiveness concerns for
CO2-intensive products that are traded internationally and face uneven greenhouse
gas constraints.
Since 2005, the European Union has created an emissions trading scheme (ETS)
that caps GHG emissions of power generation, but also of industrial activities
whose products, in some cases, are traded internationally. The primary aluminium
sector in Europe, whose direct emissions are not capped, stands to lose profit
margins and, possibly, market shares, as electricity prices are bound to increase as
the constraint on CO2 emissions in power generation results in the pass-through
CO2 prices onto electricity prices.
This report explores the possible effect of climate policy on the competitiveness of
the European primary aluminium sector, a first step towards a more robust method
of quantification of this issue. A clear assessment of this question is increasingly
important at a time where the European Commission considers measures to limit
competitiveness losses driven by climate policy.
“[The European Commission] will base its analysis on the assessment of the
inability to pass through the cost of required allowances in product prices without
significant loss of market share to installations outside the EU not taking
comparable action to reduce emissions” (EC 2008). In the case of the aluminium
sector, the price is set globally at the London Metals Exchange and the Shanghai
Futures Exchange. European producers are therefore unable to unilaterally
increase prices to account for cost that they, alone, face. Could, then, the ETS
have triggered carbon leakage?
Carbon leakage: scope of the analysis
Carbon leakage is defined as the increase in emissions outside a region as a direct
result of the policy to cap emission in this region. Carbon leakage means that the
domestic climate mitigation policy is less effective and more costly in containing
emission levels, a legitimate concern for policy-makers.
This report focuses on the competitiveness leakage channel for manufacturing
sectors: immediate loss of market share for carbon-constrained industrial
products, to the benefit of non carbon constrained countries (i.e. decreases of
exports and increases of imports); and relocation of energy-intensive industries to
countries with a more favourable climate policy. Changes in trade patterns as a
result of uneven carbon constraints are the main indicator of this competitiveness-
driven carbon leakage.
3
Competitiveness – loss of competitiveness: definitions
In theory, the competitiveness of a sector or company is defined as its ability to
maintain profits and market share. A substantial increase in costs for a sector in
one region (entailing loss in profits compared to international competitors) would
affect an industry’s competitiveness (its ability to retain market shares) in
different ways: enhanced competition from cheaper competitors on domestic and
overseas markets and lower profits leading to lower capacity to invest and expand
activities.
With or without the CO2 cost component, the European primary smelting industry
has de facto lost its position: demand is increasingly met by imports as domestic
production is saturated and no investments in additional capacity are in the
pipeline. Although there may be loss in market share, there will not necessarily be
a loss in profits as the volume sold remains constant and prices are at high levels.
This report considers two indicators of competitiveness for a sector in a given
region: the estimated profit margins of primary aluminium smelters and trade
flows.
Europe’s competitive situation since 1999
About 85% of Europe’s primary aluminium imports originate from eight countries:
Norway, Russia, Mozambique, Brazil, Iceland, United Arab Emirates, Canada and
South Africa. At present, it costs more to produce a tonne of primary aluminium in
Europe than in many other regions. However, this was already the situation in
1999, prior to the introduction of a carbon cost in the EU. The carbon constraint is
obviously only one element in this picture, as higher electricity prices prevailed
before the introduction of the ETS (with the exception of China and India).
Differences in labour and power costs are the main reasons for this competitive
situation.
1. Changes in costs
Monitoring the impact of the EU ETS on the European production cost levels
requires looking at electricity cost increases since the start of the EU ETS in 2005,
and assessing whether Europe’s cost increase is higher than for the rest of the
world – and then determining whether carbon policy is the main cause of such
difference. We rely on 1999 and 2006 data to test this hypothesis.
The cost increase in Europe between 1999 and 2006 was below the global average
over the same period. As for electricity prices, estimated prices paid by smelters
increased in Europe at a rate that is slightly above the global average
4
(EUR6.9/MWh for Europe compared to EUR5.6/MWh for the word average).1 How
much of the increase was linked to CO2 versus the interruption of long-term
contracts is difficult to determine. Indeed, in 2006, 82% of the European primary
smelting capacity was still under long-term electricity contracts.
If maintaining profits and expanding capacity are the industry’s objective,
European smelters have benefited from high profit margins as a result of high
aluminium prices – which apply to the rest of the world as well. Average prices for
2005-2006 were 62% higher than 1998-1999, which means a doubling of profit
margins in Europe. Any effect of higher electricity prices in Europe would be partly
blurred by this situation.
2. Trade flows: is there evidence of carbon leakage?
Has the price of CO2 triggered additional imports into the EU 27? Statistical
analysis of 1999-2006 trade data does not confirm that CO2 prices affected EU
primary aluminium trade flows. At the same time, growing demand in Europe has
not triggered investment in local primary smelting capacity. The region is obviously
less attractive for new capacity than regions that guarantee lower energy costs.
Since the beginning of the EU ETS in 2005, three smelters have closed in Germany,
Hungary and France (representing 6.5% of European production in 2006). Two more
smelters in Norway also closed over the same period, and while Norway was not
covered by the EU ETS, it had its own trading scheme that capped emissions from
its electricity sector. Is this a sign of possible relocation caused by the CO2 cap? At
this stage of the analysis, it is not possible to conclude. The study of the impacts
of the EU ETS on competitiveness is, and will remain plagued by the difficulty to
establish the counterfactual, i.e., what would have happened in the absence of a
CO2 cost: how does one detect, in the rapid industrial production growth outside
the EU, the actual effect of an ambitious climate policy in the EU? While decisions
to close and re-open an existing smelter may be relatively quick, investment in
new capacity takes years to finalise. Any impact on locating new capacity outside
the EU, at the expense of existing EU capacity, may require more time to
materialise. A constant monitoring of trade flows is necessary to watch how the
situation evolves.
Conclusions at this stage
Much of the EU primary smelter capacity is still under long-term electricity
contracts and the specifics of these contracts are unknown. Hence, it is difficult to
assess the exact impact of the ETS. By 2010, power supply contracts will have
expired for 65% of European capacity. The reaction of smelters to this new
environment will be an indication of the seriousness of climate policy
1 These estimates were calculated using CRU cost data on electricity, and EAA or IAI data on electricity consumption per smelter on an average country or regional basis.
5
competitiveness impacts on this activity. Whether or not the additional CO2 cost in
electricity prices is what would trigger a closure remains unclear. Unless
companies develop new electricity purchasing strategies that will mitigate the
effect of the carbon cost on power prices, construction of new smelters is more
likely to occur in regions where smelters can secure cheap, long-term supply of
electricity.
Will smelters close and production relocate once long-term contracts expire? This
also depends on the aluminium market cycle. In any case, European producers
would incur higher production costs than unconstrained competitors. The inclusion
of their direct emissions in the ETS, if allowances were fully auctioned, could only
worsen the picture. Indeed, the proposed revised Directive that extends the EU
ETS would be broadened to include primary and secondary aluminium and would
cover its emissions of CO2 and perfluorocarbons (PFCs) from 2013 onward.
Policy questions
The proposed revision of the current EU-ETS Directive lists several measures aimed
to mitigate carbon leakage. The first is continued free allocation. For those sectors
or sub-sectors where there is a risk of carbon leakage, and where electricity
constitutes a high proportion of production costs, the level of free allocation “may
take into account the electricity consumption in the production process”, hence
compensating electricity-intensive sectors from CO2-driven electricity cost
increases. Having a clear idea of the role CO2 prices play in electricity contracts
will be critical before considering compensating for increases in indirect CO2 costs.
The second is a “carbon equalisation system” for imports: “imported products
would be included into the EU in the Community Scheme” (EC, 2008). To the
extent these trade measures are put forward for to restore a sector’s
competitiveness to its level without a carbon constraint, the extent to which they
are still conducive to GHG emissions reductions world-wide will be critical.
Provided that such measures would be compatible with the WTO, many technical
questions remain; What products will be included (semi-finished and/or finished)?
How would import-related emissions be measured and verified? Would the supply
of allowances for such carbon adjustment come from the EU allowance market, or
from a separate pool of allowances, or other Kyoto mechanisms?
To conclude, if sectoral carbon leakage is deemed politically relevant, robust
indicators (not just simulations) are needed. This report shows that primary
aluminium has not suffered from carbon leakage to date. More ambitious climate
policy goals may nonetheless alter this picture.
6
TABLE OF CONTENTS
Executive Summary ............................................................................ 2
INTRODUCTION ................................................................................. 8
1. Setting the context: aluminium production and trade flows ..................... 10
1.1 Sector boundary: which production processes? ..................................... 10
1.2 Production levels and projected additional capacity .............................. 12
1.2.1 Production levels ..................................................................... 12
1.2.2 Projected additional capacity ...................................................... 12
1.3 Evolution of primary aluminium prices .............................................. 13
1.4 Trends in EU trade flows of primary aluminium .................................... 16
1.4.1 Trends in EU trade flows............................................................. 16
1.4.2 A Focus on imports in Europe from non EU producers .......................... 19
2. Competitiveness of European producers: definition, status and evolution .... 20
2.1 Potential impacts the EU-ETS on the European primary aluminium sector..... 20
2.2 Evolution of production costs ......................................................... 21
2.3 Estimated power prices paid in primary smelting: evolution since 1999 ....... 24
2.3.1 World average ......................................................................... 24
2.3.2 Focus on Europe....................................................................... 26
2.4 Evolution of operational margins ..................................................... 29
3. Impact of the EU-ETS on European trade flows .................................... 30
3.1 Statistical tests and analysis on trade flows ........................................ 30
3.2 Statistical results ........................................................................ 31
3.2.1 Regression analysis ................................................................... 31
3.2.2 Testing structural changes .......................................................... 32
4. Conclusions on the impacts of the first phase of the EU-ETS .................... 32
5. Initial thoughts on border adjustments within the context of an emissions
trading scheme ............................................................................... 35
CONCLUSION .................................................................................. 38
References .................................................................................... 39
Annex 1: Regional specific power consumption in aluminium smelting ............. 40
Annex 2: Evolution of freight rates ....................................................... 41
7
Annex 3: Statistical tests ................................................................... 43
Figure 1: Boundaries of the primary aluminium sector ................................ 11
Figure 2: Primary aluminium production by region: 1980 - 2006 ..................... 12
Figure 3: Primary aluminium 3 month-ahead price (1990-2007) in EUR and USD .. 15
Figure 4: Primary aluminium regional balance 2006.................................... 16
Figure 5: EU 27 Primary aluminium trade and production ............................. 17
Figure 6: EU-27 Imports of primary aluminium by country of origin (intra EU 27
excluded) ..................................................................................... 19
Figure 7: Operational cost estimates (2006) ............................................. 22
Figure 8: Increase in alumina, labour and power costs per tonne of aluminium
(1999 – 2006) ................................................................................. 23
Figure 9: Power price estimates (selected regions 1999 – 2006) ..................... 25
Figure 10: European power price estimates (1999 – 2006) ............................ 26
Figure 11: Freight price index (1985 – 2007) ............................................. 41
Table 1: Average electricity consumption in the primary aluminium sector for
Europe in 2005 ............................................................................... 11
Table 2: Changes in EU 27 primary aluminium production and trade (2004-2006) . 18
Table 3: Cost increase estimates at EUR20/tCO2 price ................................ 21
Table 4: Variation in production costs since 1999 ...................................... 23
Table 5: Increase in estimated contracted power prices (1999 – 2006) ............. 25
Table 6: Status of primary aluminium electricity contracts in 2007 ................. 27
Table 7: Summary comparison of the proposed revision of the EU-ETS and the
current Directive ............................................................................. 32
Table 8: Direct emissions from primary aluminium production ....................... 35
Table 9: Increase in costs following the account of direct and indirect CO2 costs at
EUR20/tCO2 ................................................................................... 35
8
INTRODUCTION
Currently, governments around the world rely on various policy tools to mitigate climate
change (e.g. cap-and-trade, voluntary agreements, taxes, subsidies, etc.). The
Heiligendamm G8 summit declaration explicitly mentions that “market mechanisms, such as
emissions-trading within and between countries (…) can provide pricing signals and have
the potential to deliver economic incentives to the private sector. Fostering the use of
clean technologies, setting up emissions-trading systems and, as many of us are doing,
linking them are complementary and mutually reinforcing approaches.”
However, not all countries are proceeding at equal speed. Concerns about the loss of
industrial competitiveness remain one of the major barriers to setting more robust CO2
mitigation obligations on industrial sectors around the world. Country-level commitments do
not necessarily imply an identical price of carbon across activities within an individual
country. Some countries have taken very limited steps, yet they cannot be held entirely
responsible, as the UNFCCC draws distinctions between countries.
Carbon leakage is defined as the increase in emissions outside a region as a direct result of
the policy to cap emission in this region. Carbon leakage means that the domestic climate
mitigation policy is less effective and more costly in containing emission levels, a legitimate
concern for policy-makers.
Since 2005, the European Union has created an emissions trading scheme (ETS) that caps
GHG emissions for certain sectors. The EU-ETS is embedded in the broader regime created
by the Kyoto Protocol, but applies only to European countries and its industrial activities
whose products, in some cases, face competition from countries without emission
constraints. Since its implementation, industry has been actively debating how much the
EU-ETS would affect their competitiveness vis-à-vis the rest of the world, and how much
carbon leakage would follow. The impact of the EU-ETS on competitiveness is twofold:
direct costs associated with the cap on direct emissions; indirect impact through increases
in electricity prices. Indeed, in a competitive market, the pass-through of CO2 prices in
electricity prices is inevitable as each free allowances has an opportunity cost associated
with it (Reinaud, 2007).
Competitiveness, in the context of climate policy, is a notion that applies best to some
sectors, tied to the qualitative and cost parameters of a product. The activities that are
most prone to such competitiveness problems are trade-exposed, energy-intensive activities
(primarily heavy industry). Although the primary aluminium sector is not directly covered by
the ETS, the impacts of the CO2 price are felt through increases in electricity prices.
Working on the basis of EU averages for manufacturing plants and the power generation
mix, the IEA found that the implementation of the EU-ETS (i.e. including free allocation of
emission allowances) would only have modest impacts on the cost structure of most of
energy-intensive industries (Reinaud 2005). 2 Nonetheless, primary aluminium could face
increased electricity costs provided that electricity prices reflect the full opportunity cost
2 Local circumstances related to power markets and prices, and openness to foreign competitors
could of course change these conclusions.
9
of CO2 allowances and that electricity is purchased through the wholesale market. Reinaud
analysis shows that foreign imports could increase their competitiveness in European
markets for primary aluminium, in spite of freight costs and border tariffs.
This paper explores the ex-post impacts of the EU-ETS on the competitiveness of the
primary aluminium sector, looking at the 3 years of functioning of the scheme. It indicates
the magnitude of the competitiveness-driven carbon leakage issue for the primary
aluminium sector as some IEA member countries are considering more binding measures to
combat climate change. The competitiveness-driven channels of carbon leakage for
manufacturing sectors are: immediate loss of market share for carbon-constrained
industrial products, to the benefit of non carbon constrained countries (i.e. decreases of
exports and increases of imports); and location of energy-intensive industries to countries
with a more favourable climate policy.
The purpose of this paper is also to clarify the debate and bring evidence that can be drawn
to date, without sidestepping remaining uncertainties. As we will see, much of the EU
primary smelter capacity is still under long term electricity contracts and the specifics of
these contracts are unknown. At this stage, it is difficult to assess the exact impact of the
ETS.
The paper begins by setting the context: how important is European primary aluminium
production compared to the rest of the world? How important is the European market for
non-EU producers, and who are the main competitors on the domestic market? It looks into
the cost situation of European producers and assesses whether change in costs have been
more important in Europe than on a global average. The focus is on estimates of power
prices paid by smelters, a first indication of the EU-ETS effects on competitiveness. Tests on
trade flows then verify whether the EU-ETS has had an impact on Europe’s net imports – if
net imports increased, this would be evidence of sectoral carbon leakage.3 These tests
verify whether net trade flows have structurally changed since 2005 (i.e. a flood in non-EU
imports and/or a decrease in EU exports). The report concludes on the ex-post effects of
the EU-ETS on the primary aluminium sector, and provides initial thoughts on some cost
mitigation measures various governments have suggested as a means for reducing potential
carbon leakage.
This paper focuses only on the primary aluminium industry. It does not look into other parts
of the production chain.
3 “If competitive distortions are significantly different between constrained regions and
unconstrained regions, carbon leakage should be apparent in the trade flows to and from the
constrained region. In the short term, an indicator of carbon leakage is a change in international
trade flows of carbon constrained products. In the case where the CO2 price triggers cost
differentiation and companies do not pass-through the additional cost, differences in cost levels
could trigger changes in trade flows as companies shift to the sourcing of emissions-intensive
products from abroad. Over the long run, the main indicators of carbon leakage are changes in
investments patterns” (Reinaud 2008).
10
1. Setting the context: aluminium production and trade flows
1.1 Sector boundary: which production processes?
The aluminium industry features mining and alumina production, primary and secondary
smelting and metal processing into semi-finished products (e.g. bars, profiles, wires, sheets,
foils, tubes, pipes) or speciality products (e.g. powders, special alloys). From a technical
standpoint, there is no difficulty in producing a new aluminium product from the same used
product. Further, there are no differences in quality between a product entirely made of
primary metal and a product made of recycled metal.
The production of primary aluminium consists of three steps: bauxite mining, alumina
production and electrolysis. 100 tonnes of bauxite produces 40 - 50 tonnes of alumina
(aluminium oxide), which then produces 20 – 25 tonnes of primary aluminium.4,5
In the secondary aluminium sector (i.e. recycling), there is a distinction made between:
remelters which work from the cleaner scrap and sell final products to rolling mills and
extruders; and refineries who buy all qualities of scrap and sell alloys to foundries as
well as the steel sector.
In the aluminium sector, integrated companies such as Rio Tinto, UC Rusal, BHP Billiton,
Chalco, VALE, Alcoa, etc, produce everything differ from those that are specialised. The
specialised companies can be alumina focused (e.g. Alumina company (Australia) produces
only alumina), smelter specialised (e.g. the Gulf countries, which are focusing on
transforming alumina into metal), or finished product oriented (e.g. India, where some
companies have become owners of European rolling mills).
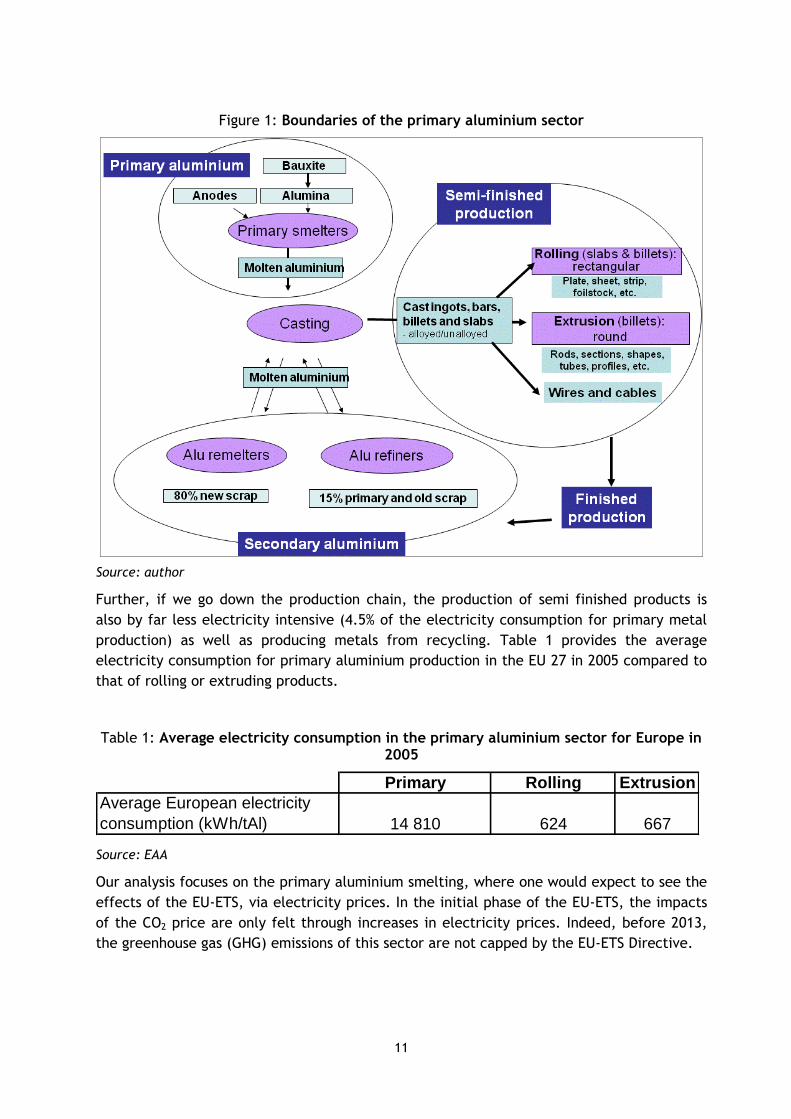
Figure 1 illustrates the production chain for the aluminium sector. Once the primary
aluminium sector (or the recycling industry) produces molten aluminium, it is then
transported to the cast house where it is alloyed in holding furnaces by the addition of other
metals, cleaned of oxides and gases, and then cast into ingots of various forms (EAA). Other
finishing processes are applied based on consumers’ needs. This report focuses solely on the
impact of the EU-ETS on primary smelters.
In the whole aluminium industry, most of the electricity is consumed in primary ingot
production (i.e. the primary aluminium segment). Primary aluminium production is about
twenty times as energy intensive as recycling (IEA, 2007). Indeed, electrolysis is the most
energy intensive step in the production of aluminium.6 Location of primary smelters is,
therefore, extremely sensitive to the levels of electricity costs.
4 The alumina yield difference comes from the chemical composition of bauxite. 5 Primary aluminium is extracted from alumina in reduction plants (smelters) through electrolysis.
Two main types of smelters are used for the electrolysis: the Hall-Héroult system and the Søderberg
cell. The majority of global primary aluminium production uses the former, and in Europe, Søderberg
units account for some 10% of the total capacity (EAA). By 2010, the share of the latter technology
should decrease to 6% of total EU capacity as it is less efficient in its electricity use than the Hall-
Héroult system. 6 Primary aluminium smelting consumes large quantities of electricity: the electrolysis uses 15.3 MWh
per ton (MWh/t) on average globally; the EU-27 average is lower, at 14.8 MWh/t.
11
Figure 1: Boundaries of the primary aluminium sector
Source: author
Further, if we go down the production chain, the production of semi finished products is
also by far less electricity intensive (4.5% of the electricity consumption for primary metal
production) as well as producing metals from recycling. Table 1 provides the average
electricity consumption for primary aluminium production in the EU 27 in 2005 compared to
that of rolling or extruding products.
Table 1: Average electricity consumption in the primary aluminium sector for Europe in 2005
Primary Rolling Extrusion
Average European electricity
consumption (kWh/tAl) 14 810 624 667
Source: EAA
Our analysis focuses on the primary aluminium smelting, where one would expect to see the
effects of the EU-ETS, via electricity prices. In the initial phase of the EU-ETS, the impacts
of the CO2 price are only felt through increases in electricity prices. Indeed, before 2013,
the greenhouse gas (GHG) emissions of this sector are not capped by the EU-ETS Directive.
12
1.2 Production levels and projected additional capacity
1.2.1 Production levels
Between 1980 and 2006, the world total production of primary aluminium increased by
108%. This growth was mainly driven by the emergence of Chinese demand and its
exponential supply growth. In 2006, it was reported that China increased its production to
9.349 million tonnes, or 26% of the world production that year, and in 2007, it further
increased its production capacity by 38% (ENAM, 2007).
In 2006, the largest producing smelters were in Russia (two smelters over 950kt), Bahrain
(one smelter over 850kt), Dubai (one smelter over 780kt), South Africa (one smelter over
700kt), Canada (one smelter over 570kt) and Mozambique (one smelter over 560kt) (CRU).
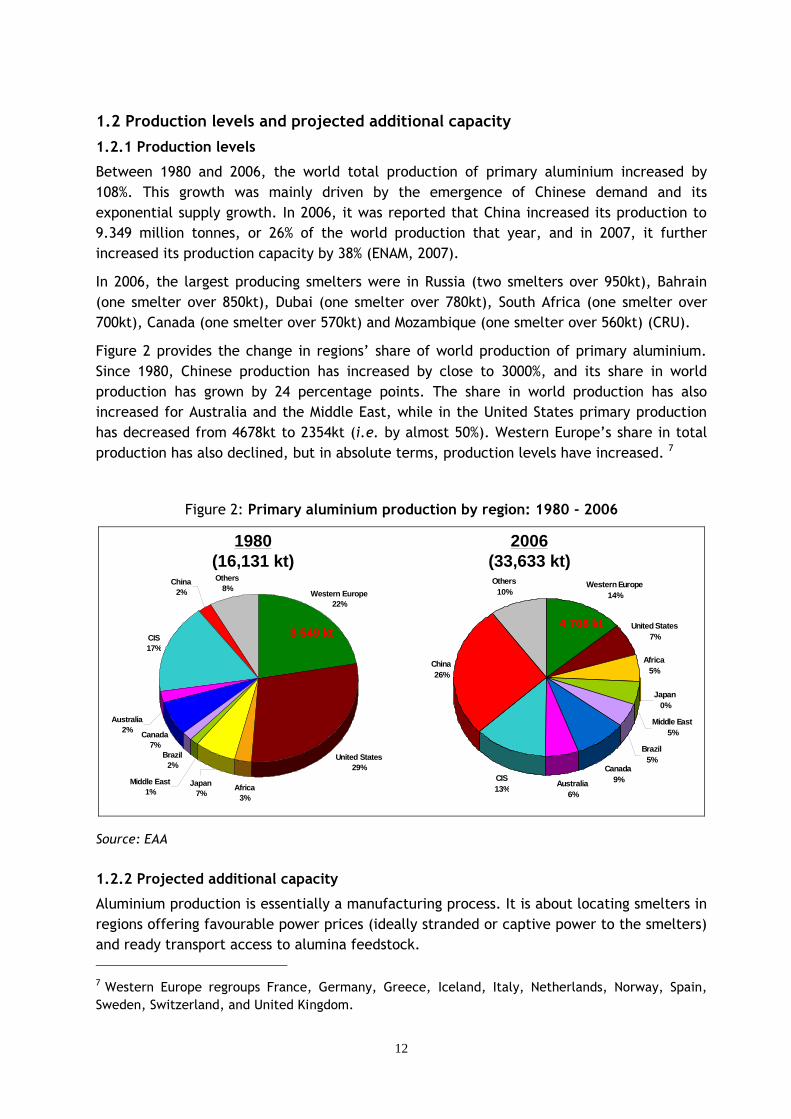
Figure 2 provides the change in regions’ share of world production of primary aluminium.
Since 1980, Chinese production has increased by close to 3000%, and its share in world
production has grown by 24 percentage points. The share in world production has also
increased for Australia and the Middle East, while in the United States primary production
has decreased from 4678kt to 2354kt (i.e. by almost 50%). Western Europe’s share in total
production has also declined, but in absolute terms, production levels have increased. 7
Figure 2: Primary aluminium production by region: 1980 - 2006
United States
29%
Western Europe
22%
Others
8%China
2%
CIS
17%
Australia
2%
Africa
3%
Brazil
2%
Canada
7%
Middle East
1%Japan
7%
1980
(16,131 kt)
2006
(33,633 kt)
Western Europe
14%
United States
7%
Africa
5%
Japan
0%
Middle East
5%
Brazil
5%Canada
9%Australia
6%
CIS
13%
China
26%
Others
10%
4 708 kt4 708 kt3 549 kt3 549 kt
Source: EAA
1.2.2 Projected additional capacity
Aluminium production is essentially a manufacturing process. It is about locating smelters in
regions offering favourable power prices (ideally stranded or captive power to the smelters)
and ready transport access to alumina feedstock.
7 Western Europe regroups France, Germany, Greece, Iceland, Italy, Netherlands, Norway, Spain,
Sweden, Switzerland, and United Kingdom.
13
Currently, with the exception of China, new aluminium smelters are built in areas where
electricity prices are cheap compared to Europe. There are a high level of committed
projects (ca. 5Mt excluding China – of which 4.2 Mt Greenfield projects and ca. 3.2 Mt for
China alone) and planned (or mooted) projects (ca. 8Mt) in new aluminium production
areas, with the intended electricity supply spanning from hydro, nuclear, natural gas and
coal. The projected additional or extension of existing capacity is in United Arab Emirates
(UAE), Argentina, Brazil, Canada, Dubai, Iceland, India, Iran, Kazakh, Oman, Qatar and
Russia. 8
The amount of new capacity (China excluded) that will come on line by 2011 is equivalent
to 166% of Europe’s 2006 primary aluminium production, 15% of the world production for the
same year. Further capacity is planned in China – the equivalent to 107% of Europe’s 2006
capacity should come on-line by 2010. Nonetheless, the Chinese government is trying to
regulate production and limit primary aluminium exports, which they consider as indirect
electricity exports.
1.3 Evolution of primary aluminium prices
The profitability of the European primary aluminium industry strongly depends on which
price is used as a benchmark. Increases in costs associated with increases in prices can
maintain a company’s margins. Today, the aluminium industry uses the London Metals
Exchange (LME) and the Shanghai Futures Exchange (SFE) in almost all phases of the
aluminium cycle.9 LME and SFE are a world price. Aluminium sales are determined by the
market price and are only for a relatively small share driven by product and location
premiums. Hence, one single company cannot influence its levels. The iron and steel or
cement sectors are different in this regard as there no world price for their products,
conferring producers possible pass-through opportunities (see Box 1).10
LME-based pricing extends from raw materials to semi-fabricated products such as sheets
and extrusions, and finished products such as cans, foil and even recycled material. Indeed,
in project and trade finance, banks insist that clients remain hedged via LME or OTC
products.
8 It is important to note that these committed projects are firm: they have political as well as
electricity supply contracts. Nonetheless, there have been signs that long term gas supply contracts
for additional supply in Oman may be renegotiated and may not benefit from advantageous
conditions. Indeed, these are dependant on the supply from Qatar, and Qatar could renegotiate these
supply contracts. Further, Qatar has a moratorium on new LNG projects. Hence, this new capacity
may not benefit from low gas prices unless they find solutions with Iran. 9 The Shanghai Futures Exchange (SFE) is also used as a benchmark for aluminium prices. 10 For a full review of elements influencing pass-through rates in a sector see Reinaud (2008)
14
Box 1: Pricing environment for aluminium, cement and steel
Aluminium:
Pricing environment: Aluminium-related prices are set globally at the London Metals Exchange
(LME) and the Shanghai Futures Exchange (SFE). 11 LME price is applicable to one specified grade of
pure aluminium. The price of all other types of aluminium is composed of the same LME base price
plus premiums, which include transport and tariffs, and the specific price for shape and alloy of the
semi-finished product. 12.13 As a result, producers cannot pass-through cost increases on the LME
price unless their competitors join them in such price move – which they have no interest in doing.
Both the geographic market and the pricing environment distinguish primary aluminium from other
energy-intensive activities such as iron and steel and cement.
Cement:
Pricing environment in Europe: Contract prices between producers and their major customers
(concrete producers and builder merchants) are generally negotiated on a bilateral basis.
Nevertheless, an analysis of Eurostat production data reveals substantial and persistent differences
in average market prices between adjacent countries (see Ponssard and Walker 2008). This confirms
that the price of cementitious products is determined at a regional or national level depending on
the cement type.14 Further, there may also be a difference in prices between coastal installations
versus inland producers. Inland producers could in theory tend to impose higher prices as they are
more protected from foreign competitors.
Iron and steel:
Pricing environment: Steel prices are mainly set on a bilateral basis over a region, if not more
globally. 15 There is no common price indicator for steel, nor a central market place for steel
products. However, there is a growing trend for benchmark price discovery of long products on a
regional basis. Steel futures are developing on the London Metals Exchange, the New York Metals
Exchange and the Dubai Gold and Commodities Exchange (SBB Insight Issue 48).
Source: Reinaud, 2008
11 In the EU case decision on the merger between Rio Tinto and Alcan (Case No COMP/M.4827),
“geographic markets for primary aluminium should be defined as global”. “The final price of
aluminium is determined to an overwhelming extent by the LME price and, only to a negligible
extent, by the regional premiums.”
http://ec.europa.eu/comm/competition/mergers/cases/decisions/m4827_20071002_20310_en.pdf 12 Note that primary and secondary aluminium cannot be distinguished (although certain applications
require only the use of primary). 13 97.5% of global aluminium volume is traded on the LME (in 2007) and trade is about 30 times higher
than real production. However, only 1% of physical aluminium is traded on the LME.
14 In the EU case decision on the merger between Cemex and RMC (Case No COMP/M.3572), the
European Commission notes “there are two main types of cement: grey cement and white cement“.
“Regarding the relevant geographic markets, for white cement it has been defined as at least EEA
whereas for grey cement it has been considered as national or EEA, leaving the final definition open”
(see Case No COMP/M.3713 for the merger between Holcim and Aggregate Industries). 15 See EU case decision on the merger between Mittal and Arcelor (COMP/M.4137) “The market for
the production and direct sale of carbon steel flat and long products are at least EEA-wide.” (i.e.
European Economic Agreement)
15
In Europe, aluminium is priced in dollars (USD) whereas most costs incurred are in Euros
(EUR), meaning European producers are exposed to the volatility of the exchange rate.
However, in 2005 and 2006 LME prices in dollars and Euro followed more or less same price
movements resulting in the exchange rate having very little impact (EAA, 2006). This was
not the case in 2007 (or between 1999 and 2004). A competitive disadvantage occurred for
European based semi-fabricators as the prices in dollars increased less than the prices in
Euro.
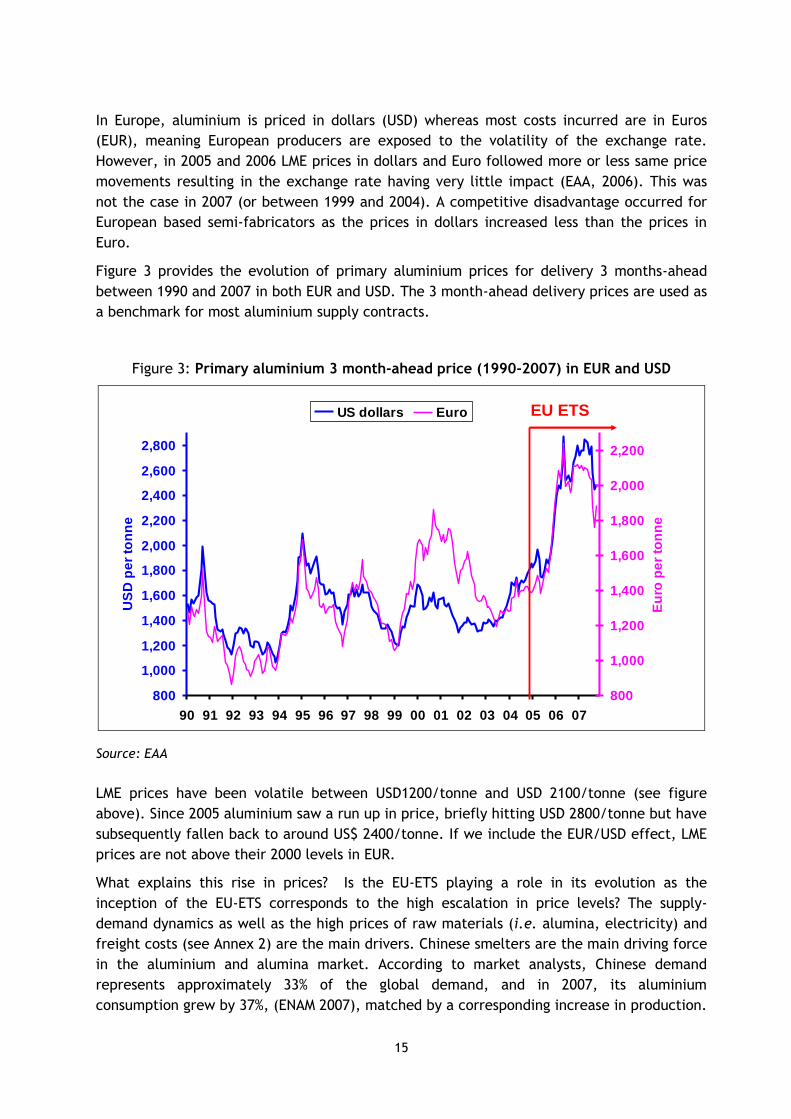
Figure 3 provides the evolution of primary aluminium prices for delivery 3 months-ahead
between 1990 and 2007 in both EUR and USD. The 3 month-ahead delivery prices are used as
a benchmark for most aluminium supply contracts.
Figure 3: Primary aluminium 3 month-ahead price (1990-2007) in EUR and USD
800
1,000
1,200
1,400
1,600
1,800
2,000
2,200
2,400
2,600
2,800
90 91 92 93 94 95 96 97 98 99 00 01 02 03 04 05 06 07
US
D p
er
ton
ne
800
1,000
1,200
1,400
1,600
1,800
2,000
2,200
Eu
ro p
er
ton
ne
US dollars Euro EU ETS
Source: EAA
LME prices have been volatile between USD1200/tonne and USD 2100/tonne (see figure
above). Since 2005 aluminium saw a run up in price, briefly hitting USD 2800/tonne but have
subsequently fallen back to around US$ 2400/tonne. If we include the EUR/USD effect, LME
prices are not above their 2000 levels in EUR.
What explains this rise in prices? Is the EU-ETS playing a role in its evolution as the
inception of the EU-ETS corresponds to the high escalation in price levels? The supply-
demand dynamics as well as the high prices of raw materials (i.e. alumina, electricity) and
freight costs (see Annex 2) are the main drivers. Chinese smelters are the main driving force
in the aluminium and alumina market. According to market analysts, Chinese demand
represents approximately 33% of the global demand, and in 2007, its aluminium
consumption grew by 37%, (ENAM 2007), matched by a corresponding increase in production.
16
1.4 Trends in EU trade flows of primary aluminium
1.4.1 Trends in EU trade flows
Global demand in aluminium is dependent on economic cycles and has grown with a
compounded annual growth rate of 4.8% in the last 10 years (1997-2006) (IAI). China is the
key demand region going forward because of absolute volume and growth rate. In 2006,
Russia, Oceania (i.e. Australia and NZ), Africa, and Latin America were net exporters. On
the contrary, in that same year, the consumption level in Asia (including China) was closely
followed by the United States as well as Western Europe and these three regions had a
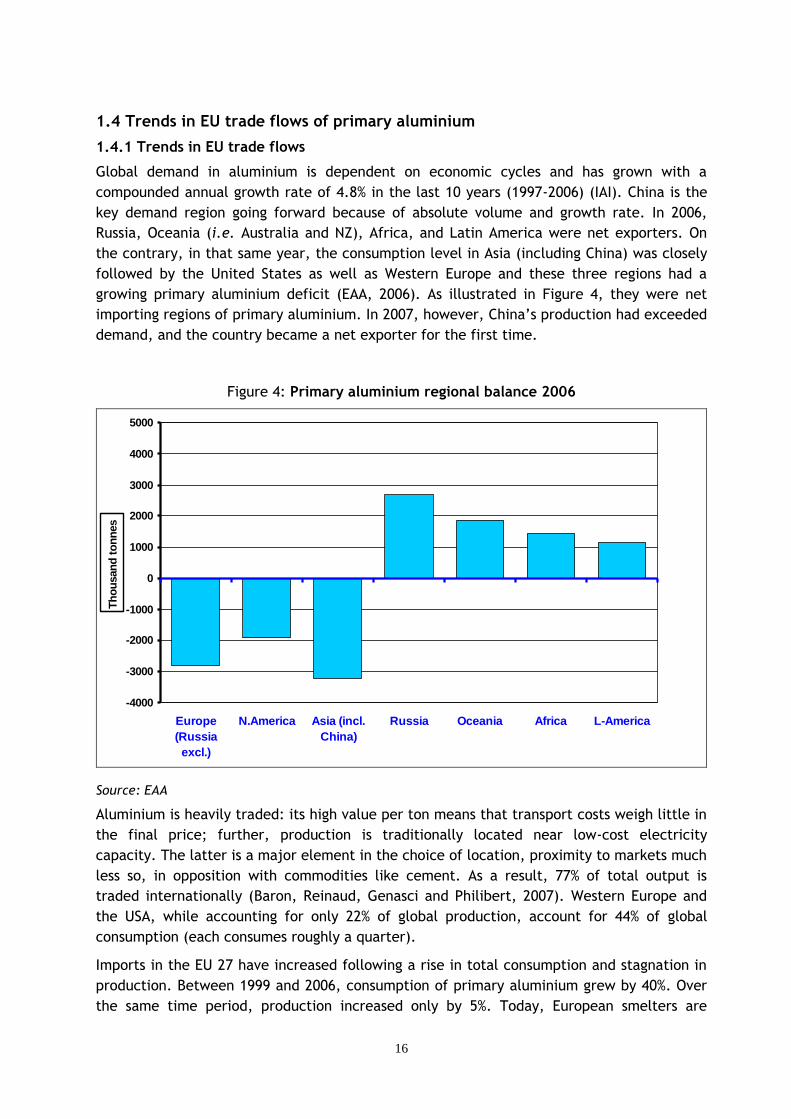
growing primary aluminium deficit (EAA, 2006). As illustrated in Figure 4, they were net
importing regions of primary aluminium. In 2007, however, China’s production had exceeded
demand, and the country became a net exporter for the first time.
Figure 4: Primary aluminium regional balance 2006
-4000
-3000
-2000
-1000
0
1000
2000
3000
4000
5000
Europe
(Russia
excl.)
N.America Asia (incl.
China)
Russia Oceania Africa L-America
Th
ou
san
d t
on
nes
Source: EAA
Aluminium is heavily traded: its high value per ton means that transport costs weigh little in
the final price; further, production is traditionally located near low-cost electricity
capacity. The latter is a major element in the choice of location, proximity to markets much
less so, in opposition with commodities like cement. As a result, 77% of total output is
traded internationally (Baron, Reinaud, Genasci and Philibert, 2007). Western Europe and
the USA, while accounting for only 22% of global production, account for 44% of global
consumption (each consumes roughly a quarter).
Imports in the EU 27 have increased following a rise in total consumption and stagnation in
production. Between 1999 and 2006, consumption of primary aluminium grew by 40%. Over
the same time period, production increased only by 5%. Today, European smelters are
17
running at full capacity and no construction or extension of smelters is currently planned in
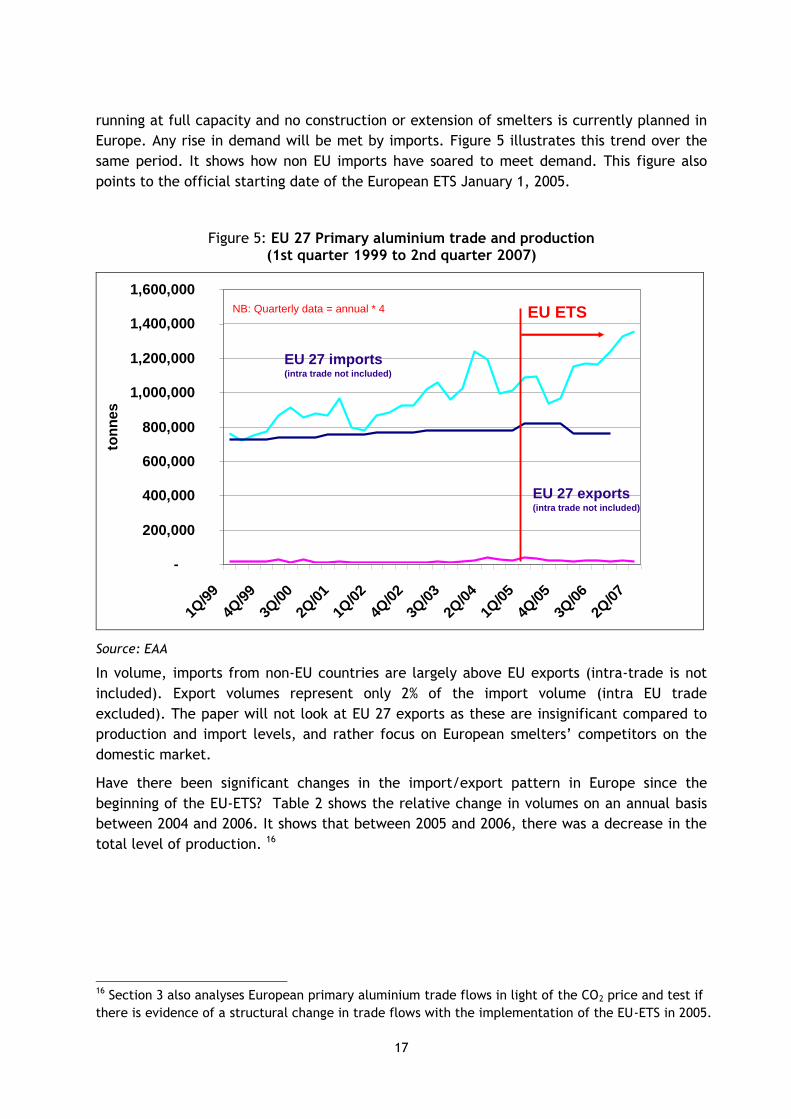
Europe. Any rise in demand will be met by imports. Figure 5 illustrates this trend over the
same period. It shows how non EU imports have soared to meet demand. This figure also
points to the official starting date of the European ETS January 1, 2005.
Figure 5: EU 27 Primary aluminium trade and production (1st quarter 1999 to 2nd quarter 2007)
-
200,000
400,000
600,000
800,000
1,000,000
1,200,000
1,400,000
1,600,000
1Q/9
9
4Q/9
9
3Q/0
0
2Q/0
1
1Q/0
2
4Q/0
2
3Q/0
3
2Q/0
4
1Q/0
5
4Q/0
5
3Q/0
6
2Q/0
7
ton
nes
NB: Quarterly data = annual * 4
EU 27 exports(intra trade not included)
EU 27 imports(intra trade not included)
EU ETS
Source: EAA
In volume, imports from non-EU countries are largely above EU exports (intra-trade is not
included). Export volumes represent only 2% of the import volume (intra EU trade
excluded). The paper will not look at EU 27 exports as these are insignificant compared to
production and import levels, and rather focus on European smelters’ competitors on the
domestic market.
Have there been significant changes in the import/export pattern in Europe since the
beginning of the EU-ETS? Table 2 shows the relative change in volumes on an annual basis
between 2004 and 2006. It shows that between 2005 and 2006, there was a decrease in the
total level of production. 16
16 Section 3 also analyses European primary aluminium trade flows in light of the CO2 price and test if
there is evidence of a structural change in trade flows with the implementation of the EU-ETS in 2005.
18
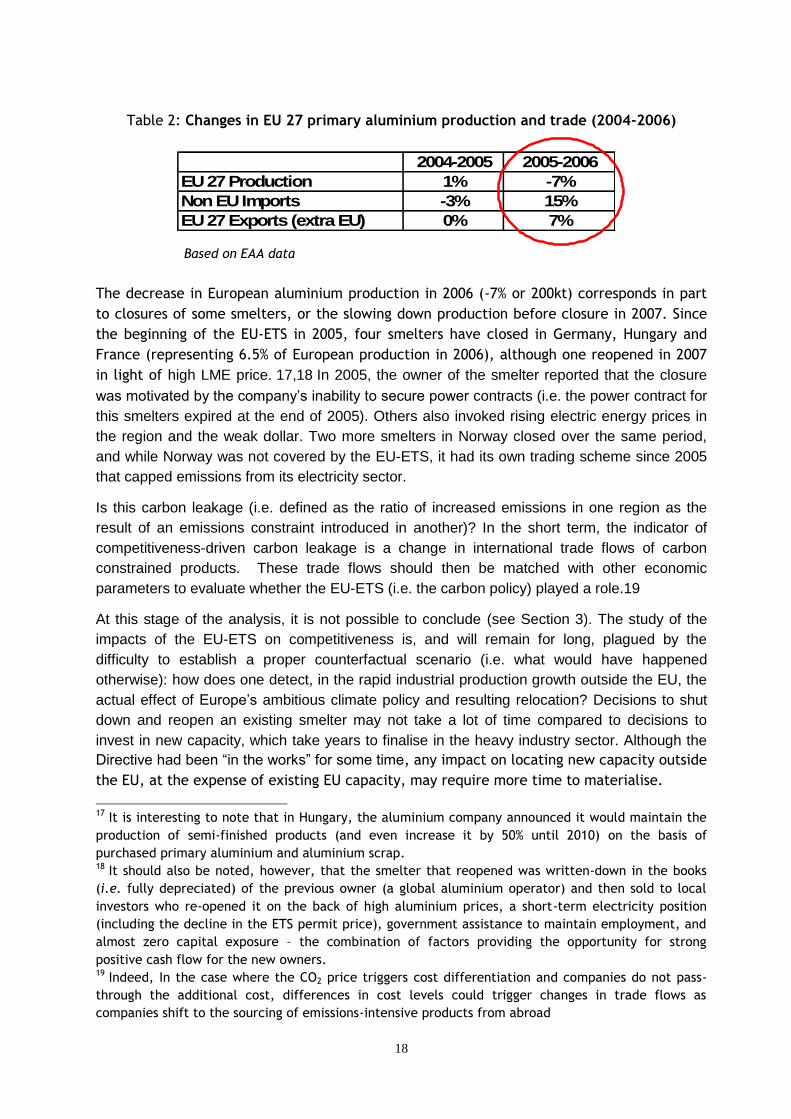
Table 2: Changes in EU 27 primary aluminium production and trade (2004-2006)
2004-2005 2005-2006
EU 27 Production 1% -7%
Non EU Imports -3% 15%
EU 27 Exports (extra EU) 0% 7%
Based on EAA data
The decrease in European aluminium production in 2006 (-7% or 200kt) corresponds in part
to closures of some smelters, or the slowing down production before closure in 2007. Since
the beginning of the EU-ETS in 2005, four smelters have closed in Germany, Hungary and
France (representing 6.5% of European production in 2006), although one reopened in 2007
in light of high LME price. 17,18 In 2005, the owner of the smelter reported that the closure
was motivated by the company’s inability to secure power contracts (i.e. the power contract for
this smelters expired at the end of 2005). Others also invoked rising electric energy prices in
the region and the weak dollar. Two more smelters in Norway closed over the same period,
and while Norway was not covered by the EU-ETS, it had its own trading scheme since 2005
that capped emissions from its electricity sector.
Is this carbon leakage (i.e. defined as the ratio of increased emissions in one region as the
result of an emissions constraint introduced in another)? In the short term, the indicator of
competitiveness-driven carbon leakage is a change in international trade flows of carbon
constrained products. These trade flows should then be matched with other economic
parameters to evaluate whether the EU-ETS (i.e. the carbon policy) played a role.19
At this stage of the analysis, it is not possible to conclude (see Section 3). The study of the
impacts of the EU-ETS on competitiveness is, and will remain for long, plagued by the
difficulty to establish a proper counterfactual scenario (i.e. what would have happened
otherwise): how does one detect, in the rapid industrial production growth outside the EU, the
actual effect of Europe’s ambitious climate policy and resulting relocation? Decisions to shut
down and reopen an existing smelter may not take a lot of time compared to decisions to
invest in new capacity, which take years to finalise in the heavy industry sector. Although the
Directive had been “in the works” for some time, any impact on locating new capacity outside
the EU, at the expense of existing EU capacity, may require more time to materialise.
17 It is interesting to note that in Hungary, the aluminium company announced it would maintain the
production of semi-finished products (and even increase it by 50% until 2010) on the basis of
purchased primary aluminium and aluminium scrap. 18 It should also be noted, however, that the smelter that reopened was written-down in the books
(i.e. fully depreciated) of the previous owner (a global aluminium operator) and then sold to local
investors who re-opened it on the back of high aluminium prices, a short-term electricity position
(including the decline in the ETS permit price), government assistance to maintain employment, and
almost zero capital exposure – the combination of factors providing the opportunity for strong
positive cash flow for the new owners. 19 Indeed, In the case where the CO2 price triggers cost differentiation and companies do not pass-
through the additional cost, differences in cost levels could trigger changes in trade flows as
companies shift to the sourcing of emissions-intensive products from abroad
19
1.4.2 A Focus on imports in Europe from non EU producers
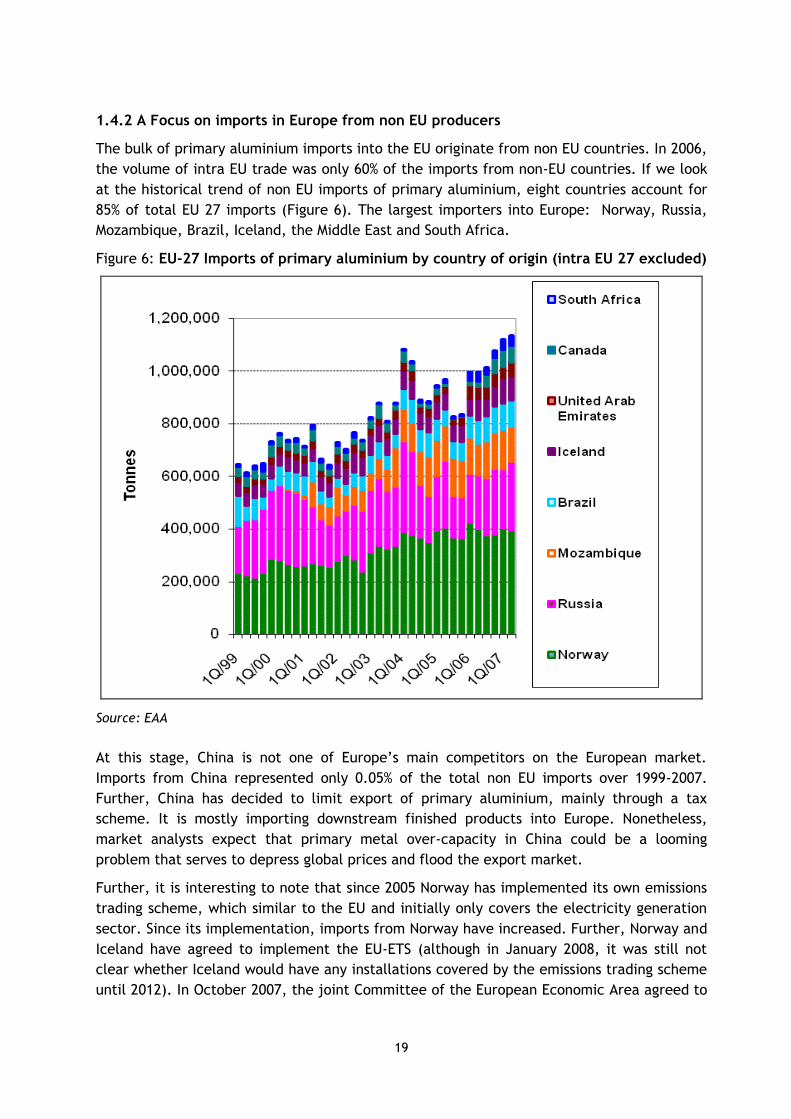
The bulk of primary aluminium imports into the EU originate from non EU countries. In 2006,
the volume of intra EU trade was only 60% of the imports from non-EU countries. If we look
at the historical trend of non EU imports of primary aluminium, eight countries account for
85% of total EU 27 imports (Figure 6). The largest importers into Europe: Norway, Russia,
Mozambique, Brazil, Iceland, the Middle East and South Africa.
Figure 6: EU-27 Imports of primary aluminium by country of origin (intra EU 27 excluded)
Source: EAA
At this stage, China is not one of Europe’s main competitors on the European market.
Imports from China represented only 0.05% of the total non EU imports over 1999-2007.
Further, China has decided to limit export of primary aluminium, mainly through a tax
scheme. It is mostly importing downstream finished products into Europe. Nonetheless,
market analysts expect that primary metal over-capacity in China could be a looming
problem that serves to depress global prices and flood the export market.
Further, it is interesting to note that since 2005 Norway has implemented its own emissions
trading scheme, which similar to the EU and initially only covers the electricity generation
sector. Since its implementation, imports from Norway have increased. Further, Norway and
Iceland have agreed to implement the EU-ETS (although in January 2008, it was still not
clear whether Iceland would have any installations covered by the emissions trading scheme
until 2012). In October 2007, the joint Committee of the European Economic Area agreed to
20
incorporate the EU Directive in their legislation. This means that these schemes could also
potentially expand their scope to cap the aluminium industry’s direct emissions post 2012.
Preliminary conclusion:
Trends since 1999 show a growing share of non-EU imports and a relatively constant (low)
level of EU exports. European producers are de facto loosing market share, but this is the
result of a particular situation: production levels in Europe are saturated and no new
smelters are planned.
Nonetheless, we can wonder if the lack in new production or the closures of smelters is the
result of a loss in European competitiveness. If yes, what are the driving forces: exchange
rates, higher growth in electricity costs compared to other regions, CO2 pass-through in
electricity prices? If so, how much of the electricity cost increase was linked to CO2 versus
the interruption of long-term contracts will be difficult to determine.
2. Competitiveness of European producers:
definition, status and evolution
In this section, the definition of competitiveness of a sector (or an industry facility) is
focused on its ability to produce at a lower cost than competitors, while maintaining profits.
Trade patterns of a region or country (and the share of European primary aluminium in the
international market) and their evolution are also a relevant indicator for the international
competitiveness of a sector, but will be treated in Section 3.
The aim of this section is to trace whether the EU-ETS has caused a loss in competitiveness
of the primary aluminium sector in Europe vis-à-vis the rest of the world, which in turn
could translate into carbon leakage. If carbon leakage occurred, this means that the
domestic climate mitigation policy is less effective and more costly in containing emission
levels.
Note that there may be a discrepancy between how policy-makers look at competitiveness
(iron and steel in Japan or the European Union versus China) and how companies themselves
see it (i.e. a multinational company with assets in both China and Europe may well see
growth in investment in China as a winner from a competitiveness perspective, even though
on paper, it could be construed as a loss of competitiveness from a European perspective).
2.1 Potential impacts the EU-ETS on the European primary aluminium sector
GHG emission trading schemes may cause an increase in production costs, whether the cost
elements are variable (e.g. raw materials, energy, maintenance) or fixed (e.g. labour,
financing of the capital cost or depreciation). The effect of the first phase of the EU-ETS on
the primary aluminium may be indirect or from a rebound effect of this indirect effect.
Increases in costs of certain raw materials following an increase in demand of those
products as their consumption triggers less emissions than if others where consumed
(e.g., natural gas compared to coal, scrap), or because these products are also covered
by the same policy instrument (e.g., electricity).
21
Increase in financial costs as a result of a higher required return on investment or higher
interest rates if the investment risk is perceived as higher by investors.
The high electricity intensity of aluminium makes it vulnerable to electricity price hikes
triggered by CO2 costs in power generation. Studies have shown that the cost of the EU-ETS
can be high at the margin for aluminium (Reinaud, 2005; McKinsey and Ecofys, 2006). These
marginal costs could have a pronounced effect on decisions to increase output in the region,
or import. Reinaud (2005) studies the impacts of the EU-ETS on the competitiveness of the
primary aluminium industry through the increase in cost of electricity Reinaud assumes that
electricity pricing would lead to a full pass-through of the carbon opportunity cost in power
prices. A EUR20 per tonne of CO2 would result in a 21% price increase in Continental Europe
(or an increase of EUR10/MWh). McKinsey and Ecofys (2006) follow the same methodology
and also estimate that a EUR20/tCO2 price will increase in electricity prices by EUR10/MWh.
Table 3 shows cost increases estimates for European primary smelters under a full pass-
through of electricity price scenario. Results are slightly higher in the McKinsey and Ecofys
report as they consider a slightly higher electricity-intensity for European primary smelters.
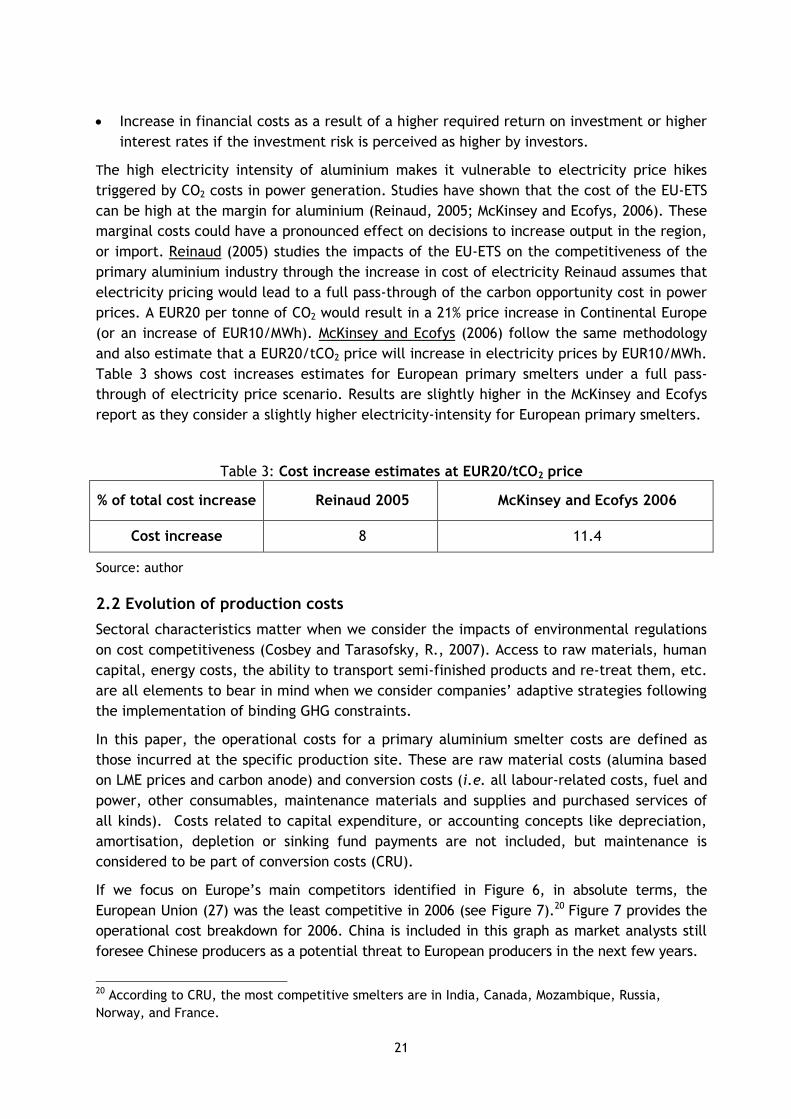
Table 3: Cost increase estimates at EUR20/tCO2 price
% of total cost increase Reinaud 2005 McKinsey and Ecofys 2006
Cost increase 8 11.4
Source: author
2.2 Evolution of production costs
Sectoral characteristics matter when we consider the impacts of environmental regulations
on cost competitiveness (Cosbey and Tarasofsky, R., 2007). Access to raw materials, human
capital, energy costs, the ability to transport semi-finished products and re-treat them, etc.
are all elements to bear in mind when we consider companies’ adaptive strategies following
the implementation of binding GHG constraints.
In this paper, the operational costs for a primary aluminium smelter costs are defined as
those incurred at the specific production site. These are raw material costs (alumina based
on LME prices and carbon anode) and conversion costs (i.e. all labour-related costs, fuel and
power, other consumables, maintenance materials and supplies and purchased services of
all kinds). Costs related to capital expenditure, or accounting concepts like depreciation,
amortisation, depletion or sinking fund payments are not included, but maintenance is
considered to be part of conversion costs (CRU).
If we focus on Europe’s main competitors identified in Figure 6, in absolute terms, the
European Union (27) was the least competitive in 2006 (see Figure 7).20 Figure 7 provides the
operational cost breakdown for 2006. China is included in this graph as market analysts still
foresee Chinese producers as a potential threat to European producers in the next few years.
20 According to CRU, the most competitive smelters are in India, Canada, Mozambique, Russia,
Norway, and France.
22
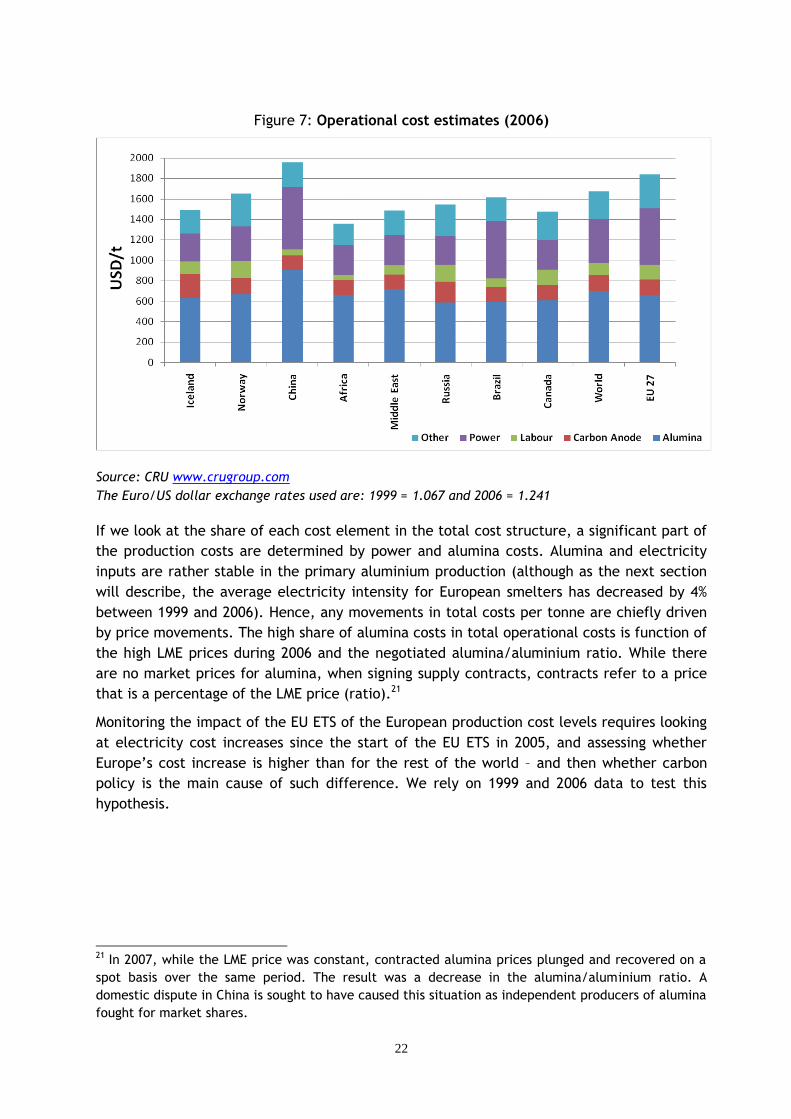
Figure 7: Operational cost estimates (2006)
Source: CRU www.crugroup.com
The Euro/US dollar exchange rates used are: 1999 = 1.067 and 2006 = 1.241
If we look at the share of each cost element in the total cost structure, a significant part of
the production costs are determined by power and alumina costs. Alumina and electricity
inputs are rather stable in the primary aluminium production (although as the next section
will describe, the average electricity intensity for European smelters has decreased by 4%
between 1999 and 2006). Hence, any movements in total costs per tonne are chiefly driven
by price movements. The high share of alumina costs in total operational costs is function of
the high LME prices during 2006 and the negotiated alumina/aluminium ratio. While there
are no market prices for alumina, when signing supply contracts, contracts refer to a price
that is a percentage of the LME price (ratio).21
Monitoring the impact of the EU ETS of the European production cost levels requires looking
at electricity cost increases since the start of the EU ETS in 2005, and assessing whether
Europe’s cost increase is higher than for the rest of the world – and then whether carbon
policy is the main cause of such difference. We rely on 1999 and 2006 data to test this
hypothesis.
21 In 2007, while the LME price was constant, contracted alumina prices plunged and recovered on a
spot basis over the same period. The result was a decrease in the alumina/aluminium ratio. A
domestic dispute in China is sought to have caused this situation as independent producers of alumina
fought for market shares.
23
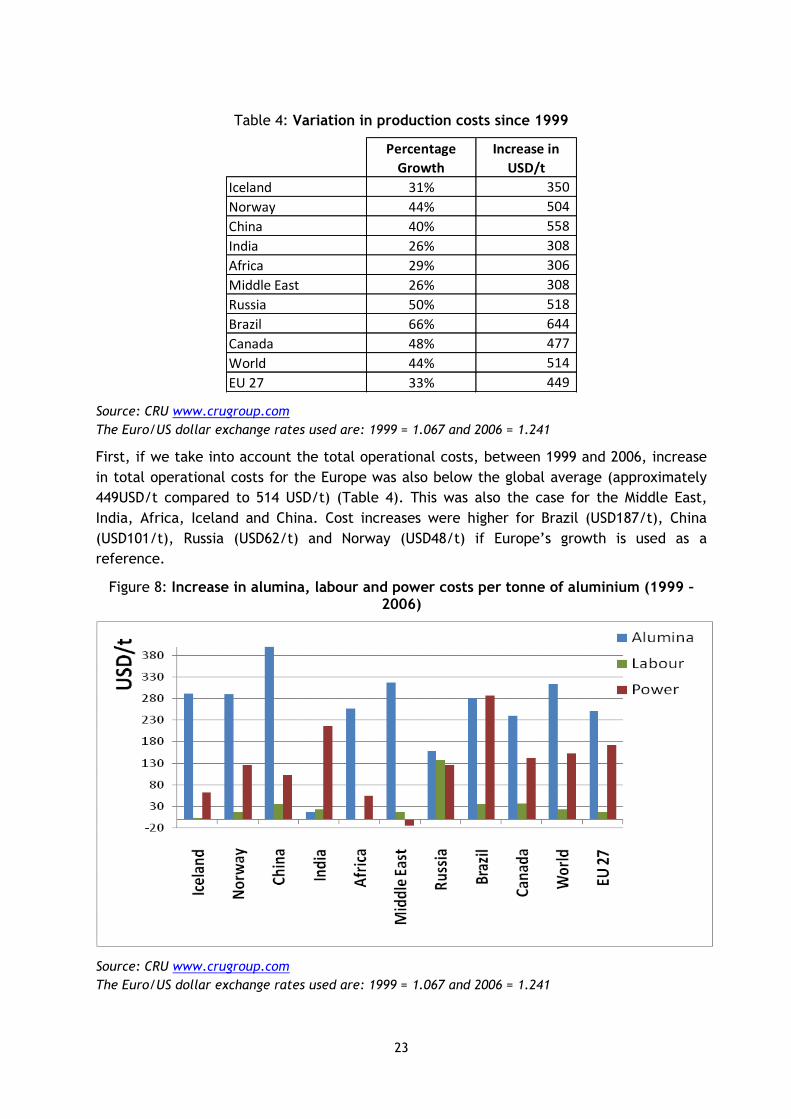
Table 4: Variation in production costs since 1999
Percentage
Growth
Increase in
USD/t
Iceland 31% 350
Norway 44% 504
China 40% 558
India 26% 308
Africa 29% 306
Middle East 26% 308
Russia 50% 518
Brazil 66% 644
Canada 48% 477
World 44% 514
EU 27 33% 449
Source: CRU www.crugroup.com
The Euro/US dollar exchange rates used are: 1999 = 1.067 and 2006 = 1.241
First, if we take into account the total operational costs, between 1999 and 2006, increase
in total operational costs for the Europe was also below the global average (approximately
449USD/t compared to 514 USD/t) (Table 4). This was also the case for the Middle East,
India, Africa, Iceland and China. Cost increases were higher for Brazil (USD187/t), China
(USD101/t), Russia (USD62/t) and Norway (USD48/t) if Europe’s growth is used as a
reference.
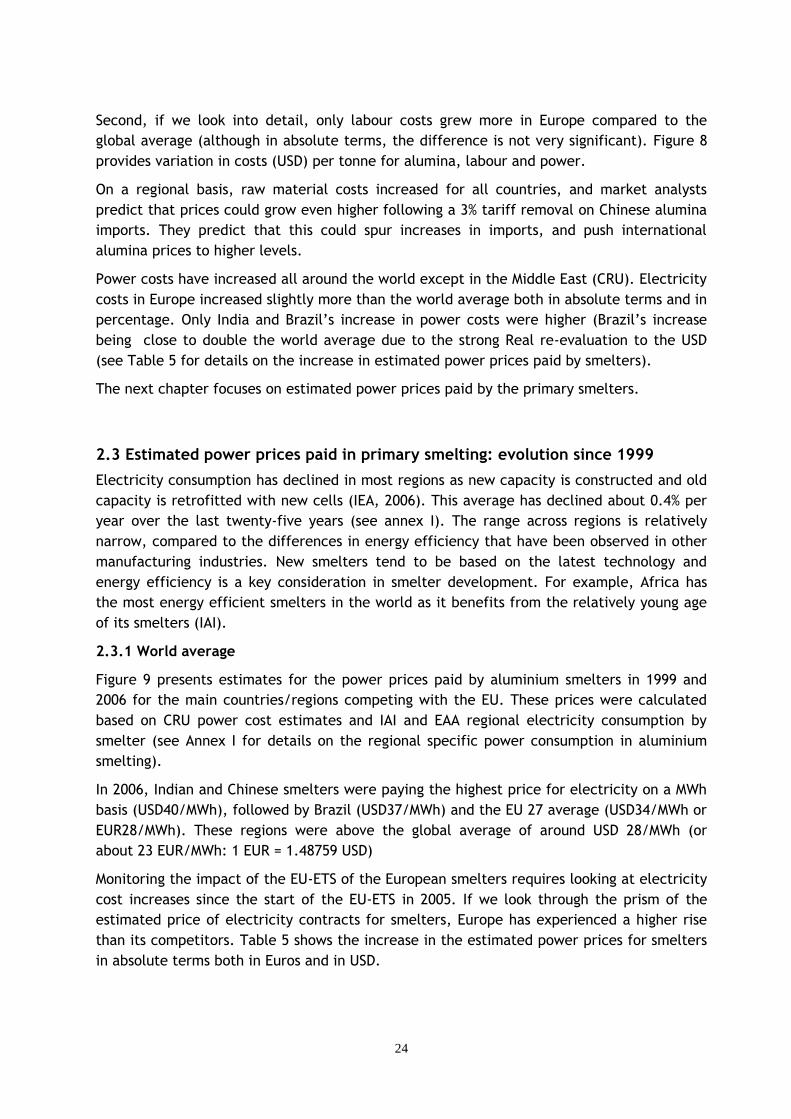
Figure 8: Increase in alumina, labour and power costs per tonne of aluminium (1999 – 2006)
Source: CRU www.crugroup.com
The Euro/US dollar exchange rates used are: 1999 = 1.067 and 2006 = 1.241
24
Second, if we look into detail, only labour costs grew more in Europe compared to the
global average (although in absolute terms, the difference is not very significant). Figure 8
provides variation in costs (USD) per tonne for alumina, labour and power.
On a regional basis, raw material costs increased for all countries, and market analysts
predict that prices could grow even higher following a 3% tariff removal on Chinese alumina
imports. They predict that this could spur increases in imports, and push international
alumina prices to higher levels.
Power costs have increased all around the world except in the Middle East (CRU). Electricity
costs in Europe increased slightly more than the world average both in absolute terms and in
percentage. Only India and Brazil’s increase in power costs were higher (Brazil’s increase
being close to double the world average due to the strong Real re-evaluation to the USD
(see Table 5 for details on the increase in estimated power prices paid by smelters).
The next chapter focuses on estimated power prices paid by the primary smelters.
2.3 Estimated power prices paid in primary smelting: evolution since 1999
Electricity consumption has declined in most regions as new capacity is constructed and old
capacity is retrofitted with new cells (IEA, 2006). This average has declined about 0.4% per
year over the last twenty-five years (see annex I). The range across regions is relatively
narrow, compared to the differences in energy efficiency that have been observed in other
manufacturing industries. New smelters tend to be based on the latest technology and
energy efficiency is a key consideration in smelter development. For example, Africa has
the most energy efficient smelters in the world as it benefits from the relatively young age
of its smelters (IAI).
2.3.1 World average
Figure 9 presents estimates for the power prices paid by aluminium smelters in 1999 and
2006 for the main countries/regions competing with the EU. These prices were calculated
based on CRU power cost estimates and IAI and EAA regional electricity consumption by
smelter (see Annex I for details on the regional specific power consumption in aluminium
smelting).
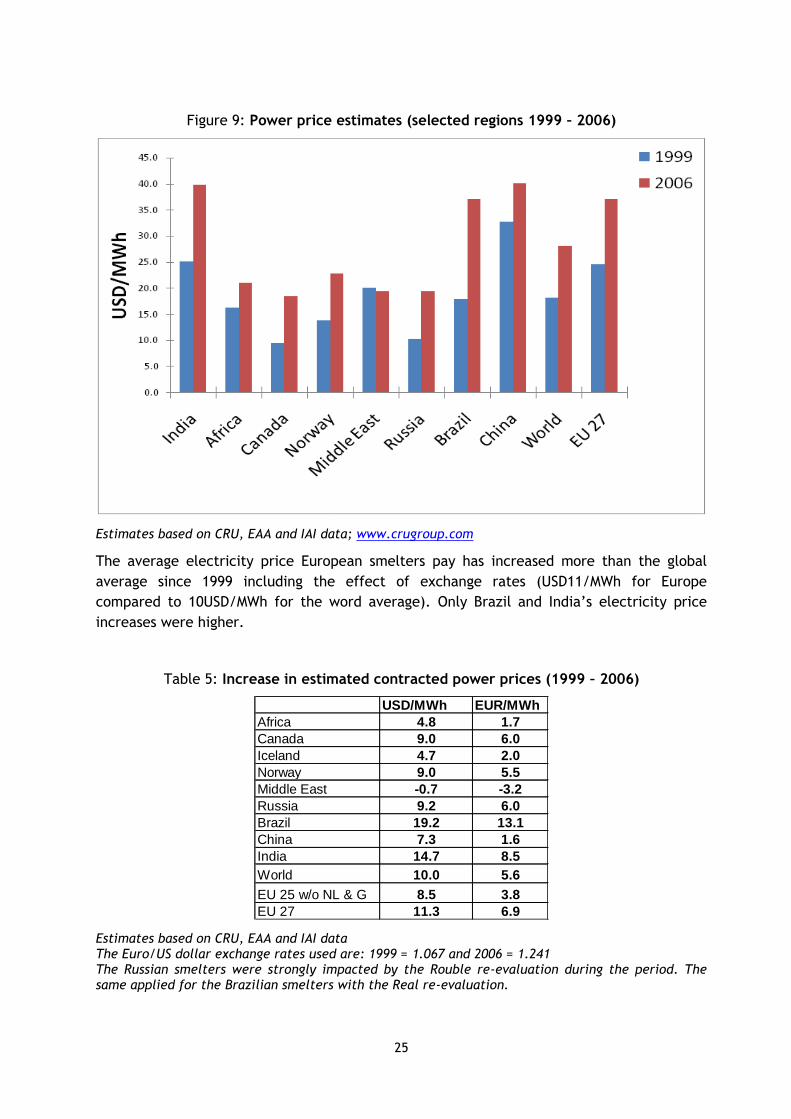
In 2006, Indian and Chinese smelters were paying the highest price for electricity on a MWh
basis (USD40/MWh), followed by Brazil (USD37/MWh) and the EU 27 average (USD34/MWh or
EUR28/MWh). These regions were above the global average of around USD 28/MWh (or
about 23 EUR/MWh: 1 EUR = 1.48759 USD)
Monitoring the impact of the EU-ETS of the European smelters requires looking at electricity
cost increases since the start of the EU-ETS in 2005. If we look through the prism of the
estimated price of electricity contracts for smelters, Europe has experienced a higher rise
than its competitors. Table 5 shows the increase in the estimated power prices for smelters
in absolute terms both in Euros and in USD.
25
Figure 9: Power price estimates (selected regions 1999 – 2006)
Estimates based on CRU, EAA and IAI data; www.crugroup.com
The average electricity price European smelters pay has increased more than the global
average since 1999 including the effect of exchange rates (USD11/MWh for Europe
compared to 10USD/MWh for the word average). Only Brazil and India’s electricity price
increases were higher.
Table 5: Increase in estimated contracted power prices (1999 – 2006)
USD/MWh EUR/MWh
Africa 4.8 1.7
Canada 9.0 6.0
Iceland 4.7 2.0
Norway 9.0 5.5
Middle East -0.7 -3.2
Russia 9.2 6.0
Brazil 19.2 13.1
China 7.3 1.6
India 14.7 8.5
World 10.0 5.6
EU 25 w/o NL & G 8.5 3.8
EU 27 11.3 6.9
Estimates based on CRU, EAA and IAI data The Euro/US dollar exchange rates used are: 1999 = 1.067 and 2006 = 1.241 The Russian smelters were strongly impacted by the Rouble re-evaluation during the period. The same applied for the Brazilian smelters with the Real re-evaluation.
26
2.3.2 Focus on Europe
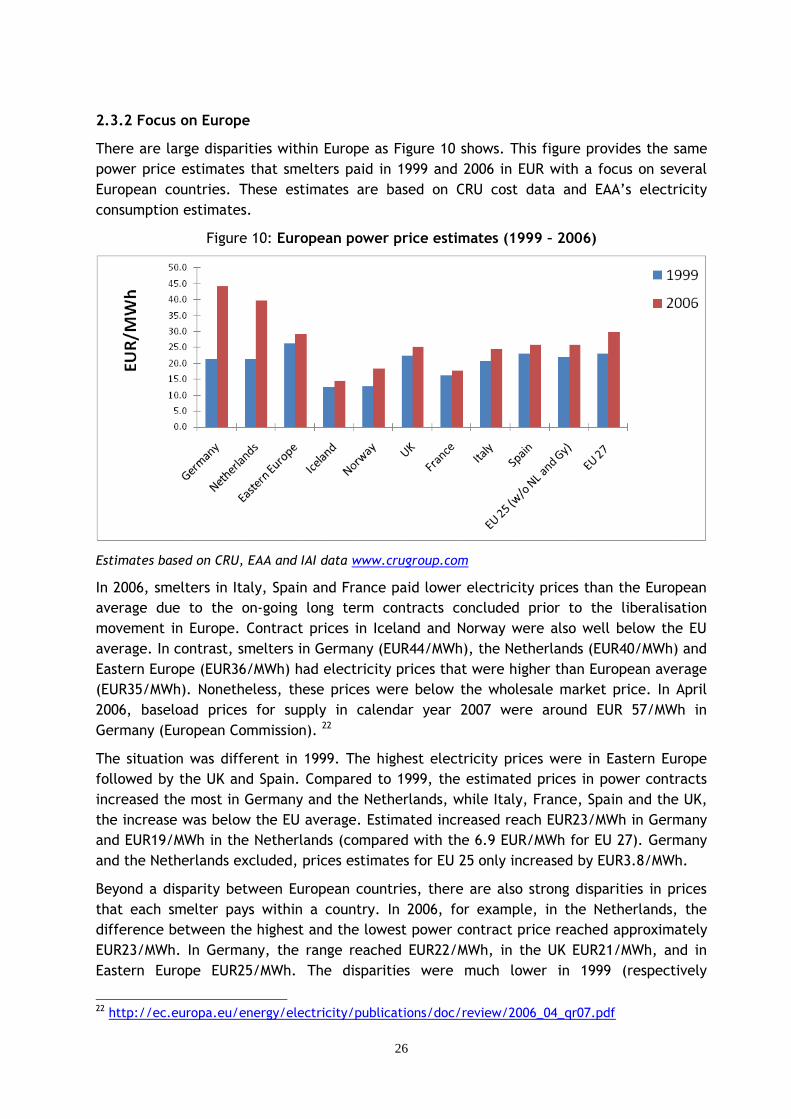
There are large disparities within Europe as Figure 10 shows. This figure provides the same
power price estimates that smelters paid in 1999 and 2006 in EUR with a focus on several
European countries. These estimates are based on CRU cost data and EAA’s electricity
consumption estimates.
Figure 10: European power price estimates (1999 – 2006)
Estimates based on CRU, EAA and IAI data www.crugroup.com
In 2006, smelters in Italy, Spain and France paid lower electricity prices than the European
average due to the on-going long term contracts concluded prior to the liberalisation
movement in Europe. Contract prices in Iceland and Norway were also well below the EU
average. In contrast, smelters in Germany (EUR44/MWh), the Netherlands (EUR40/MWh) and
Eastern Europe (EUR36/MWh) had electricity prices that were higher than European average
(EUR35/MWh). Nonetheless, these prices were below the wholesale market price. In April
2006, baseload prices for supply in calendar year 2007 were around EUR 57/MWh in
Germany (European Commission). 22
The situation was different in 1999. The highest electricity prices were in Eastern Europe
followed by the UK and Spain. Compared to 1999, the estimated prices in power contracts
increased the most in Germany and the Netherlands, while Italy, France, Spain and the UK,
the increase was below the EU average. Estimated increased reach EUR23/MWh in Germany
and EUR19/MWh in the Netherlands (compared with the 6.9 EUR/MWh for EU 27). Germany
and the Netherlands excluded, prices estimates for EU 25 only increased by EUR3.8/MWh.
Beyond a disparity between European countries, there are also strong disparities in prices
that each smelter pays within a country. In 2006, for example, in the Netherlands, the
difference between the highest and the lowest power contract price reached approximately
EUR23/MWh. In Germany, the range reached EUR22/MWh, in the UK EUR21/MWh, and in
Eastern Europe EUR25/MWh. The disparities were much lower in 1999 (respectively
22 http://ec.europa.eu/energy/electricity/publications/doc/review/2006_04_qr07.pdf
27
EUR2/MWh, EUR3/MWh, EUR16/MWh, and EUR17/MWh). These are signs that smelters that
pay the highest cost may no longer benefit from long term contracts (see Table 6). Indeed,
in the Netherlands and in some smelters in Germany, it is reported that some plants are no
longer running under long term prices. Another explanation could be that for some smelters,
a part of their electricity price is pegged to LME prices as LME prices were also at high levels
in 2006. Nonetheless, the first hypothesis is more realistic than the latter according to
industry sources.
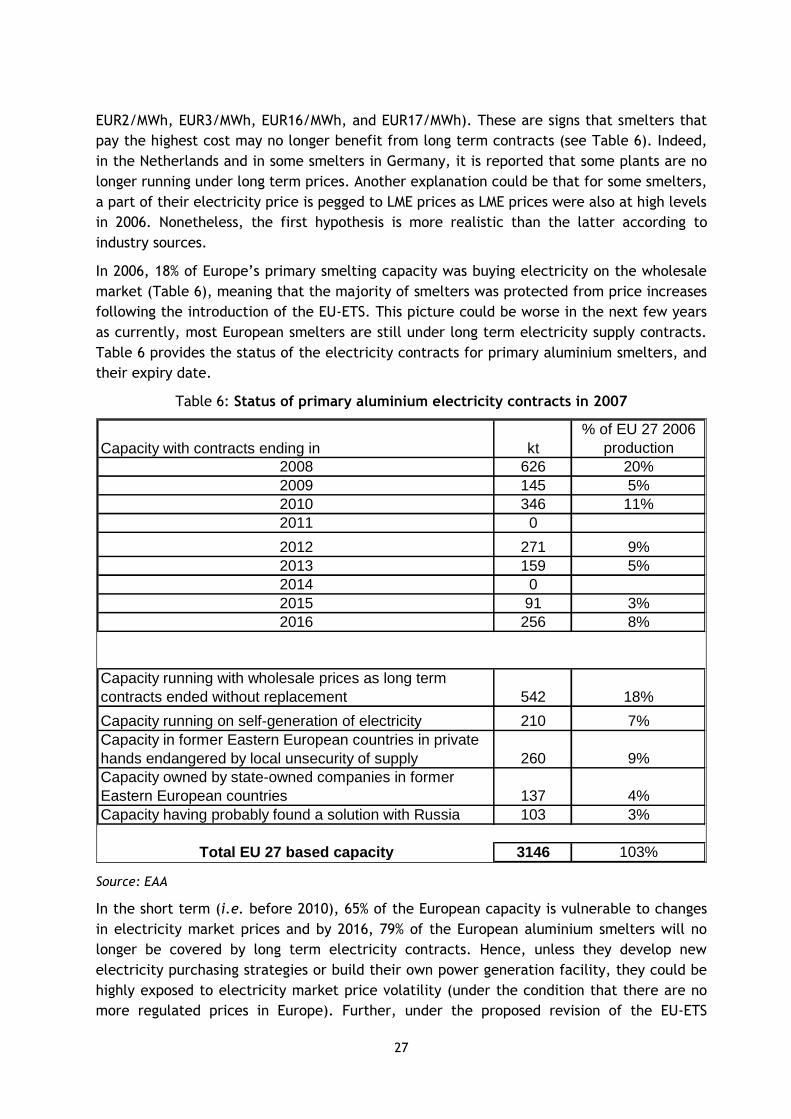
In 2006, 18% of Europe’s primary smelting capacity was buying electricity on the wholesale
market (Table 6), meaning that the majority of smelters was protected from price increases
following the introduction of the EU-ETS. This picture could be worse in the next few years
as currently, most European smelters are still under long term electricity supply contracts.
Table 6 provides the status of the electricity contracts for primary aluminium smelters, and
their expiry date.
Table 6: Status of primary aluminium electricity contracts in 2007
Capacity with contracts ending in kt
% of EU 27 2006
production
2008 626 20%
2009 145 5%
2010 346 11%
2011 0
2012 271 9%
2013 159 5%
2014 0
2015 91 3%
2016 256 8%
Capacity running with wholesale prices as long term
contracts ended without replacement 542 18%
Capacity running on self-generation of electricity 210 7%
Capacity in former Eastern European countries in private
hands endangered by local unsecurity of supply 260 9%
Capacity owned by state-owned companies in former
Eastern European countries 137 4%
Capacity having probably found a solution with Russia 103 3%
Total EU 27 based capacity 3146 103%
Source: EAA
In the short term (i.e. before 2010), 65% of the European capacity is vulnerable to changes
in electricity market prices and by 2016, 79% of the European aluminium smelters will no
longer be covered by long term electricity contracts. Hence, unless they develop new
electricity purchasing strategies or build their own power generation facility, they could be
highly exposed to electricity market price volatility (under the condition that there are no
more regulated prices in Europe). Further, under the proposed revision of the EU-ETS
28
Directive, CO2 allowances could be fully auctioned to the power sector. Will this increase
power prices even more? Although in theory the opportunity costs of free allowances holds
the same economic value than auctioned permits, estimates of pass-through rates of the
free CO2 allowances in 2005 ranged between 39 and 70% in Germany and the Netherlands
(Sijm et al, 2006).
There is no single EU electricity market, but several markets and regulatory frameworks
across the EU (Reinaud, 2007). Further, if companies’ are not bound by long term electricity
contracts, end-user prices can be a mix of various market prices. Thus, the impact of CO2 on
end-user electricity prices is even less well known than the impact on generation prices.
How does the electricity cost faced by industrial energy users relate to the prices observed
on electricity markets (whether they are organised through an exchange or not)? Obviously,
the relationship hinges on industrials’ power purchasing strategies. As a result, changes in
electricity costs for energy-intensive industries cannot be estimated from day-ahead or
forward electricity prices variations – although supply contracts are sometimes indexed to
exchange prices (Reinaud, 2007).
In Europe, industry has access to various electricity pricing mechanisms, depending on the
country or region of operation. Not all of these purchasing methods entail the same
exposure to CO2 prices. Further, not all supply contracts are based on the electricity
market’s fundamentals such as fuel or CO2 prices if the electricity market is supplied by
fossil fuel generation. As mentioned above, the contracting parties may agree that the
benchmark price for contracts is the final price of the product (e.g. LME) and in which case,
the CO2 price does not affect the electricity cost for industry.23 The main categories are
identified in Box 2 .
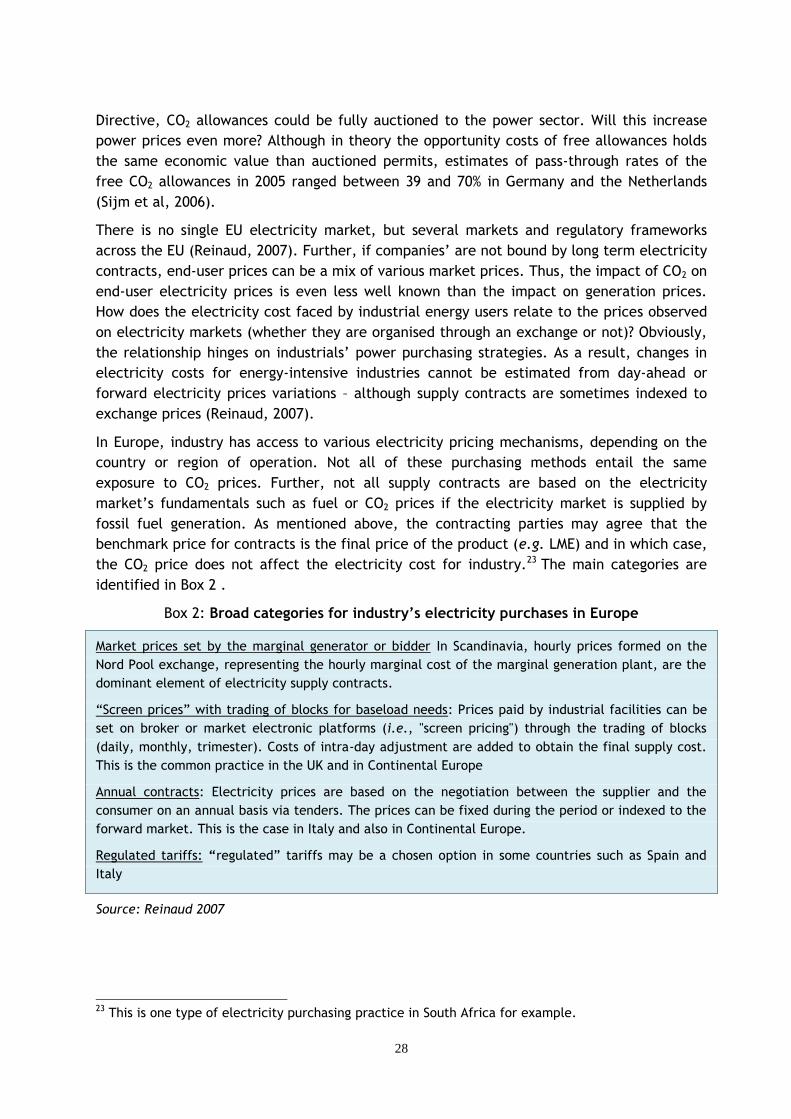
Box 2: Broad categories for industry’s electricity purchases in Europe
Market prices set by the marginal generator or bidder In Scandinavia, hourly prices formed on the
Nord Pool exchange, representing the hourly marginal cost of the marginal generation plant, are the
dominant element of electricity supply contracts.
“Screen prices” with trading of blocks for baseload needs: Prices paid by industrial facilities can be
set on broker or market electronic platforms (i.e., "screen pricing") through the trading of blocks
(daily, monthly, trimester). Costs of intra-day adjustment are added to obtain the final supply cost.
This is the common practice in the UK and in Continental Europe
Annual contracts: Electricity prices are based on the negotiation between the supplier and the
consumer on an annual basis via tenders. The prices can be fixed during the period or indexed to the
forward market. This is the case in Italy and also in Continental Europe.
Regulated tariffs: “regulated” tariffs may be a chosen option in some countries such as Spain and
Italy
Source: Reinaud 2007
23 This is one type of electricity purchasing practice in South Africa for example.
29
Whatever the form of electricity contract European smelters will sign, if the power costs
increase while LME prices remain stable, the European aluminium sector could lose its profit
margins. Indeed, changes in electricity costs are not translated into changes of the
aluminium LME price. 24
2.4 Evolution of operational margins
Has the profitability of the primary aluminium sector been hit since the EU-ETS? The
competitiveness impacts of the European aluminium industry strongly depend on which
aluminium price is used as a benchmark. From 2003, international aluminium price have
skyrocketed, blurring partly any effect of higher power prices on European smelters’
operational margins (see section 101 for LME price variations). An illustration of this is the
closure of a German smelter in 2005 that reopened in 2007 in light of high LME prices. 25
High LME prices have allowed European primary aluminium smelters to benefit from
operational margins in the order of 49%, compared to 20% on average in 1999. These
estimates are based on CRU data and LME 3 month-ahead 1998-1999 (USD 1380/t) and 2005-
2006 (2 250 USD/t).26 In comparison, the operational margin on a global level reached 40% in
2006 (29% in 1999), mostly driven down by China’s relatively low margins (18%). Indeed, in
the countries that import into Europe, these levels were above European profit margins
(e.g. 54% in Russia, 53% in the Middle East, 65% in Norway and 71% in Iceland).
There are also strong disparities in Europe. In France, Italy and Spain, business operating
margins were higher than the European average (67%, 63% and 61% respectively). Smelters
in Germany and the Netherlands whose long term contracts may have expired reported
profits margins below the EU average (20% and 31% respectively). Expiration of long-term
contracts would have led to a sudden surge in power prices. Yet how much of the increase is
linked to CO2 price versus the interruption of long-term contracts? Further, whether or not
it is the CO2 in these electricity prices is what would trigger a closure is another unanswered
question. 24 Nonetheless, while LME price cannot be influenced or negotiated, the regional premium is open to
strategic behaviour for operators and is partly negotiable. Some portion of costs increases may be
passed-on to regional premiums. Nonetheless, if European producers were to increase their regional
premium price as a result of high electricity prices, the aluminium market in Europe could become
more exposed to competition from non-EU countries in low electricity priced regions. Further, in
2007, there was a factor 8 difference between premiums and LME prices. So the overall pass-through
capacity of a European producer is low compared to the benchmark price (LME 3 months ahead). 25 It should be noted, however, that the smelter that reopened was written-down in the books (i.e.
fully depreciated) of the previous owner (a global aluminium operator) and then sold to local
investors who re-opened it on the back of high aluminium prices, a short-term electricity position
(including the decline in the ETS permit price), German Government assistance to maintain
employment, and almost zero capital exposure – the combination of factors providing the opportunity
for strong positive cash flow for the new owners. 26 These estimates are based on CRU’s definition of “Business Operating Costs”. They do not take into
account the costs of capital. They include all costs incurred at the specific production site and
additional costs associated with the transportation, sales, marketing of the commodity, interest on
working capital and sustaining capital investment costs. According to CRU, they yield an estimate of
free cash flow when deducted from the benchmark price.
30
Preliminary conclusion:
In this paper, one dimension of competitiveness is a sector’s ability to produce at a lower
cost than its competitors, while maintaining profits. Although profits levels have been
sustained following the strong increase in LME prices since 2005, operational costs
increased on a global level. The playing field remained approximately the same around the
world, and even worked in favour of Europe as a whole, as costs increased less than the
global average. Nonetheless, it costs more to produce the tonne of primary aluminium in
Europe than it does in many competing countries. This is true today, but it was also the
situation in 1999, prior to the introduction of a carbon cost in the EU.
Were the effects of the EU-ETS visible in Europe’s cost increase since 1999? Focusing on the
electricity price component where any effect of the EU-ETS could have been felt, estimates
of electricity prices paid by smelters in Europe increased slightly more in absolute terms
than the global average both in EUR and in USD over the same period (EUR 6.9/MWh for
Europe compared to EUR 5.6/MWh for the word average). Further, much of the EU primary
smelter capacity is still under long term electricity contracts. Those smelters whose long
term contracts are reported to have expired (e.g. in the Netherlands and in Germany)
suffered from a surge in power prices. Nonetheless, with or without the CO2, these smelters
would have been hit with (too) high electricity prices. Whether or not the additional CO2
cost in wholesale electricity prices is what would trigger a closure is unclear.
3. Impact of the EU-ETS on European trade flows
For policy-makers, the main concern behind uneven carbon constraints is the issue of carbon
leakage (i.e. an increase in emissions outside the region as a direct result of the policy to
cap emission in the EU). If carbon leakage took place, this means that the domestic climate
mitigation policy is less effective in containing emission levels.
Changes in trade patterns as a result of uneven carbon constraints are the main short term
indicator of this leakage. The aim of this section is to analyse European primary aluminium
trade flows in light of the CO2 price and test if there is evidence of a structural change in
trade flows with the implementation of the EU-ETS in 2005.
3.1 Statistical tests and analysis on trade flows
The data gathered for this exercise are in the form of historical time series. Quarterly data
from the first quarter 1999 to the second quarter 2007 (i.e. from January 1999 to June
2007) was available.
We attempted to explain the net trade flows (i.e. imports minus exports) in Europe as a
function of several variables:
EU 27 consumption volumes. The expected correlation is that of a positive impact on
trade flows: the higher the consumption volume in Europe, the higher level of imports.
Aluminium prices (LME 3 month-ahead delivery quoted in USD). The expected effect is
not clear: higher prices could reduce global consumption levels, both reducing imports
and exports.
31
Price premiums for delivery in Europe (i.e. Rotterdam CIF 3 month ahead delivery).
While LME prices are a global price, for delivery into Europe, suppliers add a price
premium that in this case includes the impact of freight costs. The expected correlation
is that of a negative impact on trade flows: the higher the premium for imports into
Europe, the lower the level of imports.
The US/EUR exchange rate. The expected correlation is that of a positive impact on
trade flows: the higher the US/EURO exchange rate, the higher level of imports paid in
dollars and the lower the level of European exports.
The CO2 price. The assumption is that the CO2 allowance price would be passed through
to electricity prices, and the CO2 price used as a reference is the year-ahead price (e.g.
2005 prices are the prices quoted for delivery in 2006). In continental Europe, if
smelters are no longer under long term supply contracts, the general practice is to sign
electricity contracts one year ahead (Box 2). The electricity suppliers hedge their
position by buying CO2 allowances on the forward market. For this reason, the fall in CO2
prices end-2006 did not coincide with a fall in electricity prices in Europe. Contracts
signed in 2006 used 2007 CO2 prices and those signed in 2007, used 2008 prices. In 2007,
the 2008 CO2 price had no relation with the 2007 CO2 spot price.
Two elements were tested:
1/ Can the net trade flows be explained by the variables chosen? (See Annex 3 for detailed results of the regression and explanations of the model)
2/ Was there a structural change in the trade flows following implementation of the
EU-ETS? (See Annex 3 for details on the model used and the caveats for the usage of
this method)
3.2 Statistical results
3.2.1 Regression analysis
USD/EUR exchange rate as well as price premiums for Europe do not explain changes in
trade flows (i.e. statistically insignificant variables).
In order of importance, the variables that explain Europe’s net trade flows (i.e. significant
variables) are: world LME aluminium prices, EU 27 primary aluminium consumption volumes,
and CO2 prices (starting 2Q 2004). The coefficient for LME prices and consumption volumes
are positive, respectively 0.23 and 0.4. While this positive correlation makes sense for the
consumption variable (i.e. the higher the consumption level, the higher the import rate), it
is not possible to conclude regarding the LME factor.
What is surprising is the negative correlation between CO2 and net imports. This invalidates
our model’s assumption that CO2 prices should lead to higher imports.
32
3.2.2 Testing structural changes
The test determined if the net trade flows were statistically significant from the time
before the EU-ETS to the period after the EU-ETS. The structural change in trade flows
cannot be confirmed. There has not been a structural change in trade flows between 1999
and 2006.
Preliminary conclusion
Statistical analysis of 1999-2006 data does not confirm the assumption that CO2 prices,
through their impact on electricity prices, affected EU primary aluminium trade flows.
4. Conclusions on the impacts of the first phase of the EU-ETS
We looked ex-post at the impacts of the first phase of the EU-ETS (2005-2007), often
regarded as a testing phase before the Kyoto Protocol compliance period (2008-2012), on
the primary aluminium sector. While operational costs have increased, there is no statistical
evidence that the EU-ETS has increased imports of primary aluminium from non-carbon
constrained countries. All this said, there has been no rise in capacity in Europe. This
underlines that investors associate Europe with a higher risk than greenfield investments in
other regions. But this is not a new phenomenon.
The effects of the EU-ETS could be different with caps on the primary sectors’ direct GHG
emissions. Investors say that the costs of any future cap are already included in investment
decisions, even though this possibility is only under discussion at this stage. Indeed, as
indicated in the proposed revisions to the EU-ETS Directive to improve and extend the EU
greenhouse gas emission allowance trading system, the EU-ETS could be extended starting
January 2013 to include primary and secondary aluminium. It would cover these sectors CO2
emissions and well perfluorocarbons.
Table 7 provides the key features of the proposal.
Table 7: Summary comparison of the proposed revision of the EU-ETS and the current
Directive27 (see next page)
27 “Proposal for a Directive of the European Parliament and of the Council amending Directive
2003/87/EC so as to improve and extend the EU greenhouse gas emission allowance trading system”
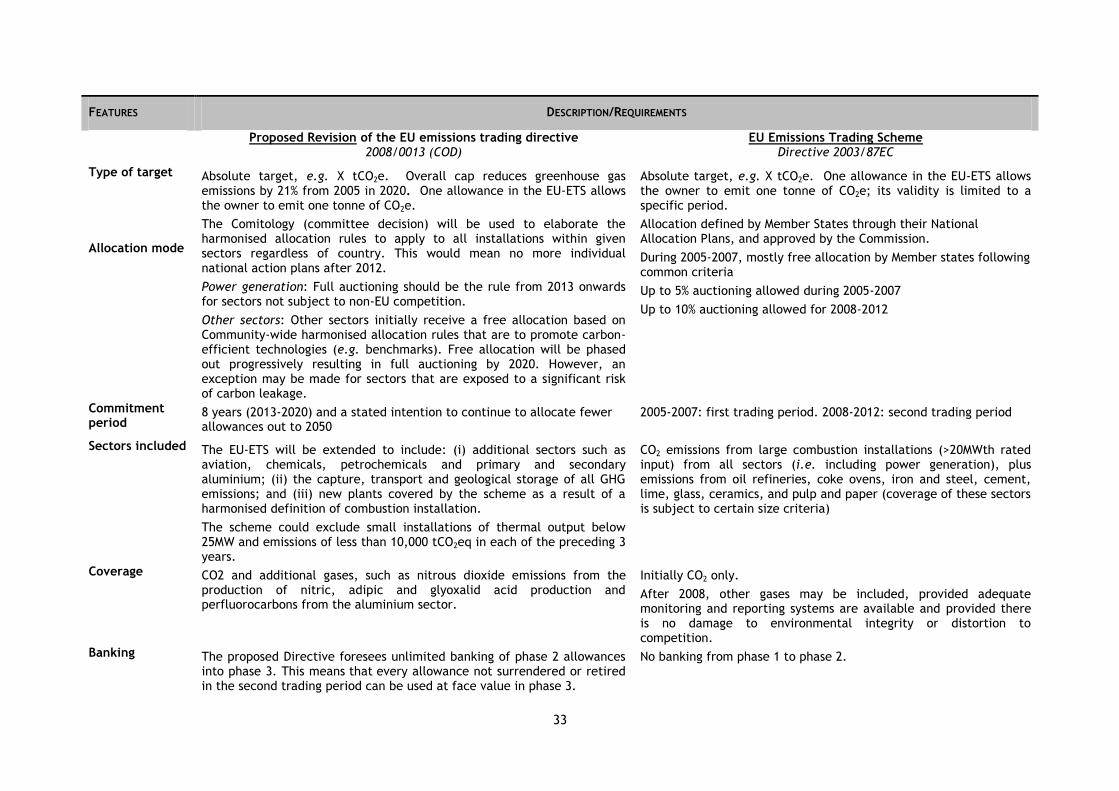
33
FEATURES DESCRIPTION/REQUIREMENTS
Proposed Revision of the EU emissions trading directive 2008/0013 (COD)
EU Emissions Trading Scheme Directive 2003/87EC
Type of target Absolute target, e.g. X tCO2e. Overall cap reduces greenhouse gas emissions by 21% from 2005 in 2020. One allowance in the EU-ETS allows the owner to emit one tonne of CO2e.
Absolute target, e.g. X tCO2e. One allowance in the EU-ETS allows the owner to emit one tonne of CO2e; its validity is limited to a specific period.
Allocation mode
The Comitology (committee decision) will be used to elaborate the harmonised allocation rules to apply to all installations within given sectors regardless of country. This would mean no more individual national action plans after 2012.
Power generation: Full auctioning should be the rule from 2013 onwards for sectors not subject to non-EU competition.
Other sectors: Other sectors initially receive a free allocation based on Community-wide harmonised allocation rules that are to promote carbon-efficient technologies (e.g. benchmarks). Free allocation will be phased out progressively resulting in full auctioning by 2020. However, an exception may be made for sectors that are exposed to a significant risk of carbon leakage.
Allocation defined by Member States through their National Allocation Plans, and approved by the Commission.
During 2005-2007, mostly free allocation by Member states following common criteria
Up to 5% auctioning allowed during 2005-2007
Up to 10% auctioning allowed for 2008-2012
Commitment period
8 years (2013-2020) and a stated intention to continue to allocate fewer allowances out to 2050
2005-2007: first trading period. 2008-2012: second trading period
Sectors included The EU-ETS will be extended to include: (i) additional sectors such as aviation, chemicals, petrochemicals and primary and secondary aluminium; (ii) the capture, transport and geological storage of all GHG emissions; and (iii) new plants covered by the scheme as a result of a harmonised definition of combustion installation.
The scheme could exclude small installations of thermal output below 25MW and emissions of less than 10,000 tCO2eq in each of the preceding 3 years.
CO2 emissions from large combustion installations (>20MWth rated input) from all sectors (i.e. including power generation), plus emissions from oil refineries, coke ovens, iron and steel, cement, lime, glass, ceramics, and pulp and paper (coverage of these sectors is subject to certain size criteria)
Coverage CO2 and additional gases, such as nitrous dioxide emissions from the production of nitric, adipic and glyoxalid acid production and perfluorocarbons from the aluminium sector.
Initially CO2 only.
After 2008, other gases may be included, provided adequate monitoring and reporting systems are available and provided there is no damage to environmental integrity or distortion to competition.
Banking The proposed Directive foresees unlimited banking of phase 2 allowances into phase 3. This means that every allowance not surrendered or retired in the second trading period can be used at face value in phase 3.
No banking from phase 1 to phase 2.
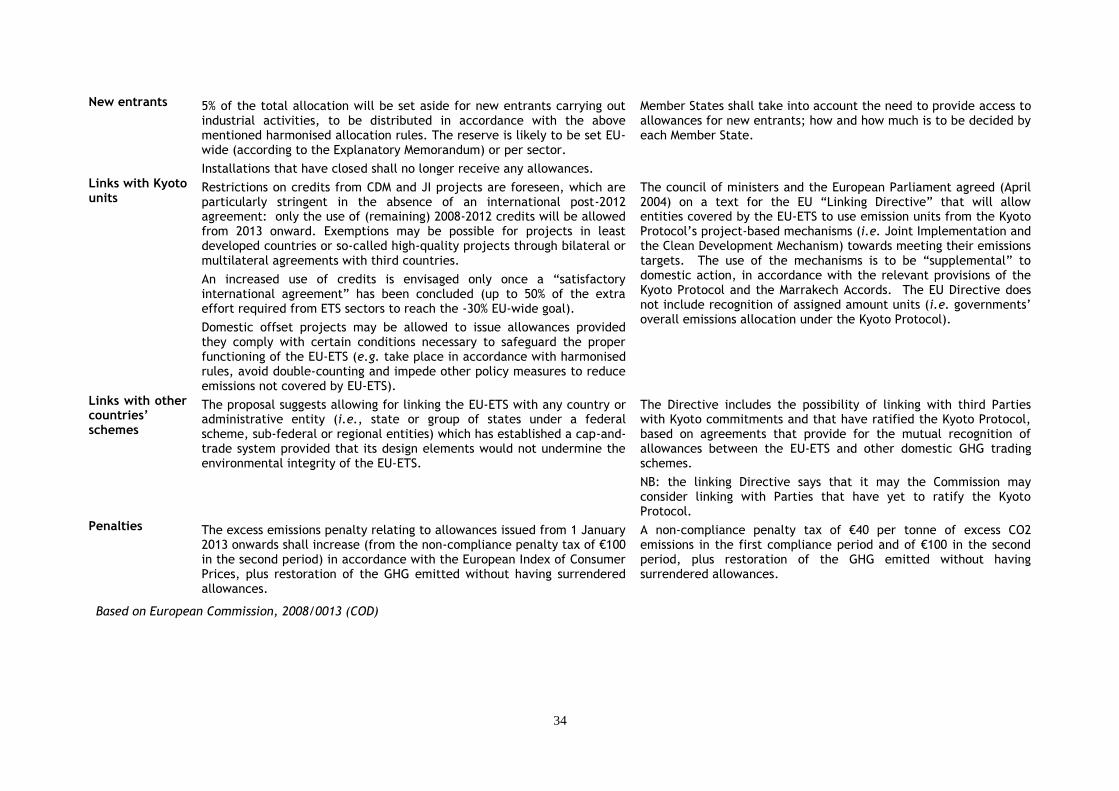
34
New entrants 5% of the total allocation will be set aside for new entrants carrying out industrial activities, to be distributed in accordance with the above mentioned harmonised allocation rules. The reserve is likely to be set EU-wide (according to the Explanatory Memorandum) or per sector.
Installations that have closed shall no longer receive any allowances.
Member States shall take into account the need to provide access to allowances for new entrants; how and how much is to be decided by each Member State.
Links with Kyoto units
Restrictions on credits from CDM and JI projects are foreseen, which are particularly stringent in the absence of an international post-2012 agreement: only the use of (remaining) 2008-2012 credits will be allowed from 2013 onward. Exemptions may be possible for projects in least developed countries or so-called high-quality projects through bilateral or multilateral agreements with third countries.
An increased use of credits is envisaged only once a “satisfactory international agreement” has been concluded (up to 50% of the extra effort required from ETS sectors to reach the -30% EU-wide goal).
Domestic offset projects may be allowed to issue allowances provided they comply with certain conditions necessary to safeguard the proper functioning of the EU-ETS (e.g. take place in accordance with harmonised rules, avoid double-counting and impede other policy measures to reduce emissions not covered by EU-ETS).
The council of ministers and the European Parliament agreed (April 2004) on a text for the EU “Linking Directive” that will allow entities covered by the EU-ETS to use emission units from the Kyoto Protocol’s project-based mechanisms (i.e. Joint Implementation and the Clean Development Mechanism) towards meeting their emissions targets. The use of the mechanisms is to be “supplemental” to domestic action, in accordance with the relevant provisions of the Kyoto Protocol and the Marrakech Accords. The EU Directive does not include recognition of assigned amount units (i.e. governments’ overall emissions allocation under the Kyoto Protocol).
Links with other countries’ schemes
The proposal suggests allowing for linking the EU-ETS with any country or administrative entity (i.e., state or group of states under a federal scheme, sub-federal or regional entities) which has established a cap-and-trade system provided that its design elements would not undermine the environmental integrity of the EU-ETS.
The Directive includes the possibility of linking with third Parties with Kyoto commitments and that have ratified the Kyoto Protocol, based on agreements that provide for the mutual recognition of allowances between the EU-ETS and other domestic GHG trading schemes.
NB: the linking Directive says that it may the Commission may consider linking with Parties that have yet to ratify the Kyoto Protocol.
Penalties The excess emissions penalty relating to allowances issued from 1 January 2013 onwards shall increase (from the non-compliance penalty tax of €100 in the second period) in accordance with the European Index of Consumer Prices, plus restoration of the GHG emitted without having surrendered allowances.
A non-compliance penalty tax of €40 per tonne of excess CO2 emissions in the first compliance period and of €100 in the second period, plus restoration of the GHG emitted without having surrendered allowances.
Based on European Commission, 2008/0013 (COD)
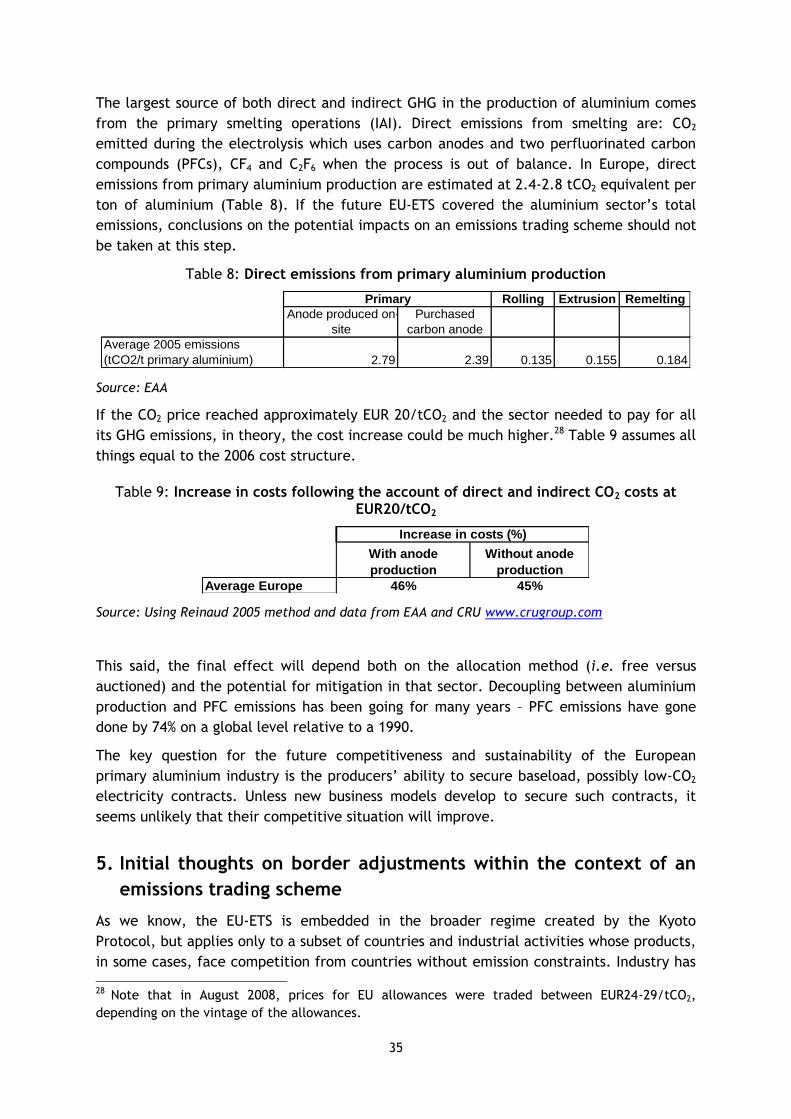
35
The largest source of both direct and indirect GHG in the production of aluminium comes
from the primary smelting operations (IAI). Direct emissions from smelting are: CO2
emitted during the electrolysis which uses carbon anodes and two perfluorinated carbon
compounds (PFCs), CF4 and C2F6 when the process is out of balance. In Europe, direct
emissions from primary aluminium production are estimated at 2.4-2.8 tCO2 equivalent per
ton of aluminium (Table 8). If the future EU-ETS covered the aluminium sector’s total
emissions, conclusions on the potential impacts on an emissions trading scheme should not
be taken at this step.
Table 8: Direct emissions from primary aluminium production
Rolling Extrusion Remelting
Anode produced on-
site
Purchased
carbon anode
Average 2005 emissions
(tCO2/t primary aluminium) 2.79 2.39 0.135 0.155 0.184
Primary
Source: EAA
If the CO2 price reached approximately EUR 20/tCO2 and the sector needed to pay for all
its GHG emissions, in theory, the cost increase could be much higher.28 Table 9 assumes all
things equal to the 2006 cost structure.
Table 9: Increase in costs following the account of direct and indirect CO2 costs at EUR20/tCO2
With anode
production
Without anode
production
Average Europe 46% 45%
Increase in costs (%)
Source: Using Reinaud 2005 method and data from EAA and CRU www.crugroup.com
This said, the final effect will depend both on the allocation method (i.e. free versus
auctioned) and the potential for mitigation in that sector. Decoupling between aluminium
production and PFC emissions has been going for many years – PFC emissions have gone
done by 74% on a global level relative to a 1990.
The key question for the future competitiveness and sustainability of the European
primary aluminium industry is the producers’ ability to secure baseload, possibly low-CO2
electricity contracts. Unless new business models develop to secure such contracts, it
seems unlikely that their competitive situation will improve.
5. Initial thoughts on border adjustments within the context of an
emissions trading scheme
As we know, the EU-ETS is embedded in the broader regime created by the Kyoto
Protocol, but applies only to a subset of countries and industrial activities whose products,
in some cases, face competition from countries without emission constraints. Industry has
28 Note that in August 2008, prices for EU allowances were traded between EUR24-29/tCO2,
depending on the vintage of the allowances.
36
been actively debating how much the EU-ETS would affect their competitiveness vis-à-vis
the rest of the world.
In January 2008, the European Commission released a proposal for revision of its emissions
trading scheme. 29 It is part of a broader energy and environment package to deliver
ambitious GHG emission reductions in the EU. If enacted as proposed, Article 10b
“Measures to support certain energy intensive industries in the event of carbon leakage”
states that in the event that other developed countries and other major emitters of GHG
do not participate in an international agreement, the Commission recognises that
European companies could be put at a competitive disadvantage. This loss in
competitiveness could resulting in carbon leakage, whereby reduced emissions in the EU
lead to an increase in third countries”.
By June 30, 2010 the Commission will decide which energy-intensive industrial sectors are
likely to be subject to carbon leakage. “The basis of the analysis will be on companies’
ability to pass-through the cost of required allowances in product prices without
significant loss of market share to installations outside the EU not taking comparable
action to reduce emissions.” In the case of the aluminium sector, European producers are
unable to unilaterally increase prices to account for cost that they, alone, face. But the
in the case of other heavy-industries, the question is, how do you measure the level of
pass-through? Further, as explained in Reinaud (2008), a domestic sectors’ ability to pass-
through additional costs that foreign competitors do not bear is dynamic as elements
driving competition change with time (e.g. transport costs, production costs, production
availability, product specifications, etc.).
Beyond the question of determining pass-through capabilities for a sector, for those
sectors or sub-sectors where there is a risk of carbon leakage, and where electricity
constitutes a high proportion of production costs, the level of free allocation “may take
into account the electricity consumption in the production process”, hence compensating
electricity-intensive sectors from CO2-driven electricity cost increases. Such measure
could prove difficult to implement as long-term contracts on electricity prices are
confidential. It may be difficult to pinpoint the role of CO2 in the electricity prices
actually delivered to smelters
Mitigating measures for these industries include a continued free allocation of allowances,
or some carbon equalisation system that would "seek to put EU and non-EU producers on a
comparable footing", and should be in conformity with European Community, WTO and
UNFCCC principles. The carbon equalisation system would be done by "applying to
importers of goods requirements similar to those applicable to installations within the EU,
by requiring the surrender of allowances." 30 Yet, this does not imply rebating carbon costs
for exported products. Only under this condition would the CO2 playing field for trade
29 “Proposal for a Directive of the European Parliament and of the Council amending Directive
2003/87/EC so as to improve and extend the EU greenhouse gas emission allowance trading system”
30 Concerns about the loss of industrial competitiveness and potential carbon leakage have also
triggered thoughts in the US on adjustment measures in some countries where cap-and-trade
schemes are proposed (See Reinaud 2008 for an overview of with legislative proposals include these
provisions).
37
exposed sectors be levelled and the effectiveness of the carbon equalisation system (also
called border adjustment for some) ensured.
Further, many technical questions remain unanswered at this stage. For example, on what
products should one set the border adjustment (BA)? Ideally, the BA would cover all goods
from a given emission-intensive trade exposed sector. However, as noted in Reinaud
(2008), there is an inherent tension between full coverage on the one hand, and
administrative feasibility on the other. Second, even if an accurate determination of the
amount of carbon emitted in the production of a finished good could be made, assigning a
price for emissions through a BA would have a negligible effect on its overall cost.
Targeting the BA to the most emissions-intensive traded products in a sector could be one
solution to addressing carbon leakage for a sector. Yet if only semi-finished emission-
intensive products were covered, such a BA could worsen the competitiveness situation for
the downstream industry. Moreover, how would import-related emissions be measured and
verified? Would the supply of allowances for such carbon adjustment come from the EU
allowance market, or from a separate pool of allowances, or other Kyoto mechanisms?
Finally, to the extent these trade measures are put forward for to restore a sector’s
competitiveness to its level without a carbon constraint, the extent to which they are still
conducive to GHG emissions reductions world-wide will be critical. This is the subject of
another Reinaud (2008) publication.
38
CONCLUSION
The purpose of this paper was to explore the issue of carbon leakage for a sector with a
view to elaborate a robust method of quantification of this issue. We tested this in the
case of primary aluminium the EU-ETS. This report shows that the European primary
aluminium on average has not suffered from carbon leakage to date. The absence of
statistical evidence of a direct effect of CO2 prices on aluminium trade flows is not
surprising. There is a number of reasons as to why the impacts during the period under
review would have been difficult to observe: the prevalence of long-term electricity
contracts; a high cycle for demand of aluminium and correspondingly high LME prices,
which should alleviate concomitant increases in cost, including related to CO2; high levels
of imports following an increase in consumption and no additional production capacity
coming on-line in Europe; and finally, aluminium smelter direct emissions were not
covered by the EU-ETS in this period.
Yet even if the impacts of the EU-ETS are not yet observable, this should not be taken as
definitive evidence that increased in electricity prices triggered by the EU-ETS have had
no impact on aluminium smelting in Europe. Some smelters have definitely suffered from
increases in electricity prices following the end of their long term contracts. What remains
unclear, however, is how quickly such phenomenon will develop and lead to an additional
increase in aluminium imports, from what would have happened in the absence of the EU-
ETS. Indeed, the study of the impacts of the EU-ETS on competitiveness is, and will remain
for long, plagued by the difficulty to establish a proper counterfactual scenario (i.e., what
would have happened in the absence of a CO2 cost).
Growing demand in Europe has not triggered investment in local primary smelting capacity.
The region is obviously less attractive for new capacity than regions that guarantee lower
energy costs. The carbon constraint is, nonetheless, only one element in this European
picture, as higher electricity prices prevailed before the introduction of the ETS (with the
exception of China and India) (CRU cost estimates). The key question for the future
competitiveness and sustainability of the European primary aluminium industry is the
producers’ ability to secure baseload, possibly low-CO2 electricity contracts. Unless new
business models develop to secure such contracts, it seems likely that their competitive
situation will deteriorate.
To conclude, the assessment tools developed in this paper are important in light of
mitigation measures the EU (and other governments) may exercise to limit
competitiveness losses driven by climate policy in specific industries. An clear and
objective assessment will be needed, identifying clearing what results from the carbon
policy. Appropriate compensation will not be completed without a full view on some
critical issues.
39
REFERENCES Baron R., J. Reinaud, M. Genasci and C. Philibert (2007), Sectoral Approaches to Greenhouse Gas Mitigation- Exploring Issues for Heavy Industry, IEA Information Paper. http://www.iea.org/textbase/papers/2007/Sectoral_Approach_Info_WEB.pdf
CRU, www.crugroup.com
European Aluminium Association, www.eaa.net
ENAM India Research (2007), Aluminium Sector – China Visit – Al Set for a Big Upswing, December 13, India
European Commission (2008), Proposal for a Directive of the European Parliament and of the Council amending Directive 2003/87/EC so as to improve and extend the EU greenhouse gas emission allowance trading system, COM(2008), Brussels, 23.1.2008.
International Aluminium Institute, www.world-aluminium.org
IEA (2006), Energy Technology Perspectives-- Scenarios & Strategies to 2050. OECD/IEA, Paris.
IEA (2007), Tracking Industrial Energy Efficiency and CO2 Emissions, OECD/IEA, Paris.
McKinsey, Ecofys, 2006, Report on International Competitiveness. EU-ETS Review, Report for the European Commission, December. http://ec.europa.eu/environment/climat/emission/pdf/etsreview/061222compreport.pdf
Ponssard, J.-P. and N. Walker (2008) EU emission trading and the cement sector: a spatial competition analysis, March, University College Dublin and Ecole Polytechnique, Paris
Reinaud, J. (2008), Issues behind Competitiveness and Carbon Leakage under Uneven Climate Polices – Focus on Heavy Industry, IEA Information Paper.
________ (2005a), European Refinery Industry under the EU Emissions Trading Scheme – Competitiveness, Trade Flows and Investment Implications. IEA Information Paper. http://www.iea.org/Textbase/Papers/2005/IEA_Refinery_Study.pdf
________ (2005b), Industrial Competitiveness under the European Union Emissions Trading Scheme. IEA Information Paper. http://www.iea.org/textbase/papers/2005/Industrial_Competitiveness.pdf
________ (2007), CO2 Allowance and Electricity Price Interaction – Impact on Industry’s Electricity Purchasing Strategies in Europe. IEA Information Paper, http://www.iea.org/textbase/papers/2007/jr_price_interaction.pdf
SBB Insight (2007), Steel futures prepare to engage the market, Issue 48, October
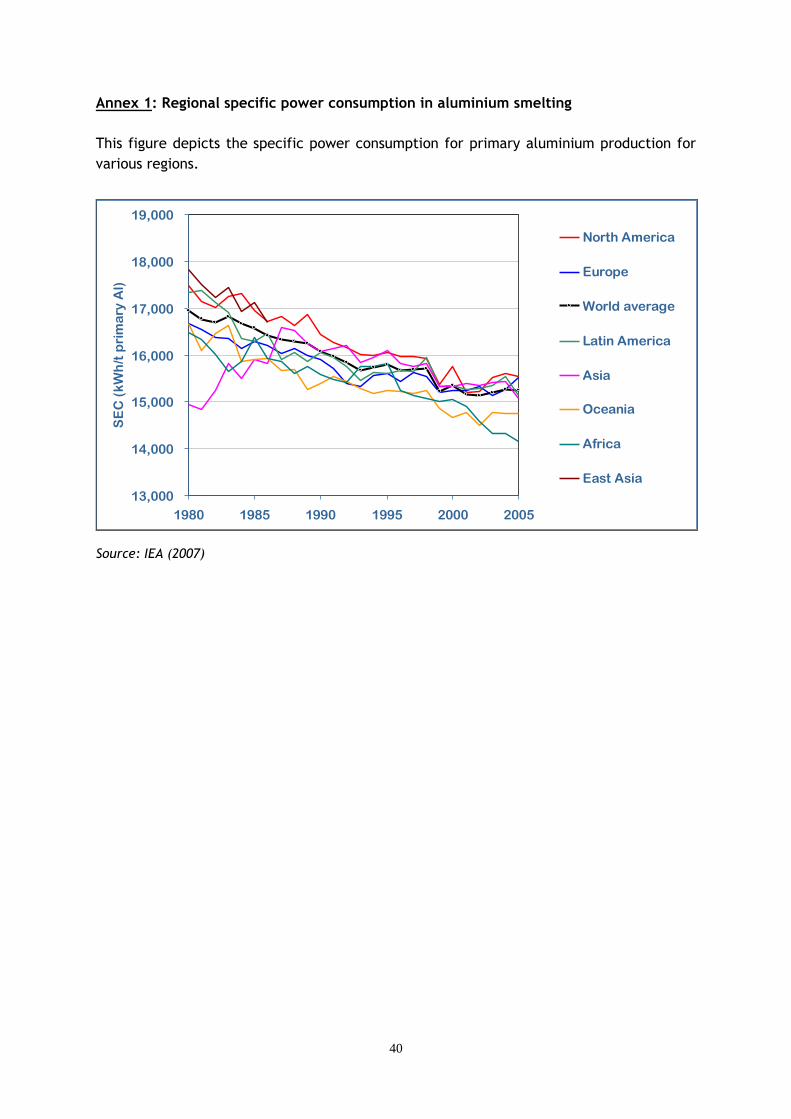
40
Annex 1: Regional specific power consumption in aluminium smelting
This figure depicts the specific power consumption for primary aluminium production for
various regions.
13,000
14,000
15,000
16,000
17,000
18,000
19,000
1980 1985 1990 1995 2000 2005
SE
C (
kW
h/t
pri
ma
ry A
l)
North America
Europe
World average
Latin America
Asia
Oceania
Africa
East Asia
Source: IEA (2007)
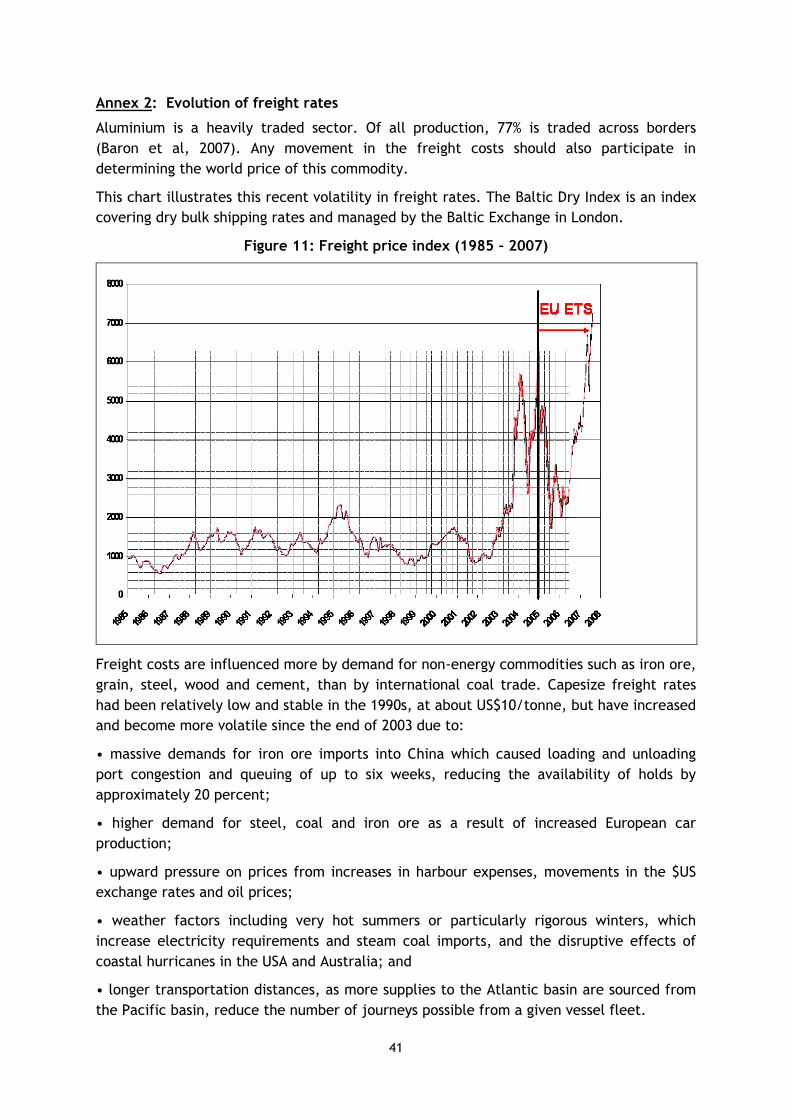
41
Annex 2: Evolution of freight rates
Aluminium is a heavily traded sector. Of all production, 77% is traded across borders
(Baron et al, 2007). Any movement in the freight costs should also participate in
determining the world price of this commodity.
This chart illustrates this recent volatility in freight rates. The Baltic Dry Index is an index
covering dry bulk shipping rates and managed by the Baltic Exchange in London.
Figure 11: Freight price index (1985 – 2007)
Freight costs are influenced more by demand for non-energy commodities such as iron ore,
grain, steel, wood and cement, than by international coal trade. Capesize freight rates
had been relatively low and stable in the 1990s, at about US$10/tonne, but have increased
and become more volatile since the end of 2003 due to:
• massive demands for iron ore imports into China which caused loading and unloading
port congestion and queuing of up to six weeks, reducing the availability of holds by
approximately 20 percent;
• higher demand for steel, coal and iron ore as a result of increased European car
production;
• upward pressure on prices from increases in harbour expenses, movements in the $US
exchange rates and oil prices;
• weather factors including very hot summers or particularly rigorous winters, which
increase electricity requirements and steam coal imports, and the disruptive effects of
coastal hurricanes in the USA and Australia; and
• longer transportation distances, as more supplies to the Atlantic basin are sourced from
the Pacific basin, reduce the number of journeys possible from a given vessel fleet.

42
In recent years, a shipping capacity shortage has left charter rates for all classes of vessel
at historic highs. Ship developments should increase the supply of available holds and ease
freight market prices. However, the success of the Chinese government in moderating
infrastructure investment and the growth of its steel production, together with the
potential requirements of a growing market in India for raw material imports, remain
significant uncertainties for the global freight market.
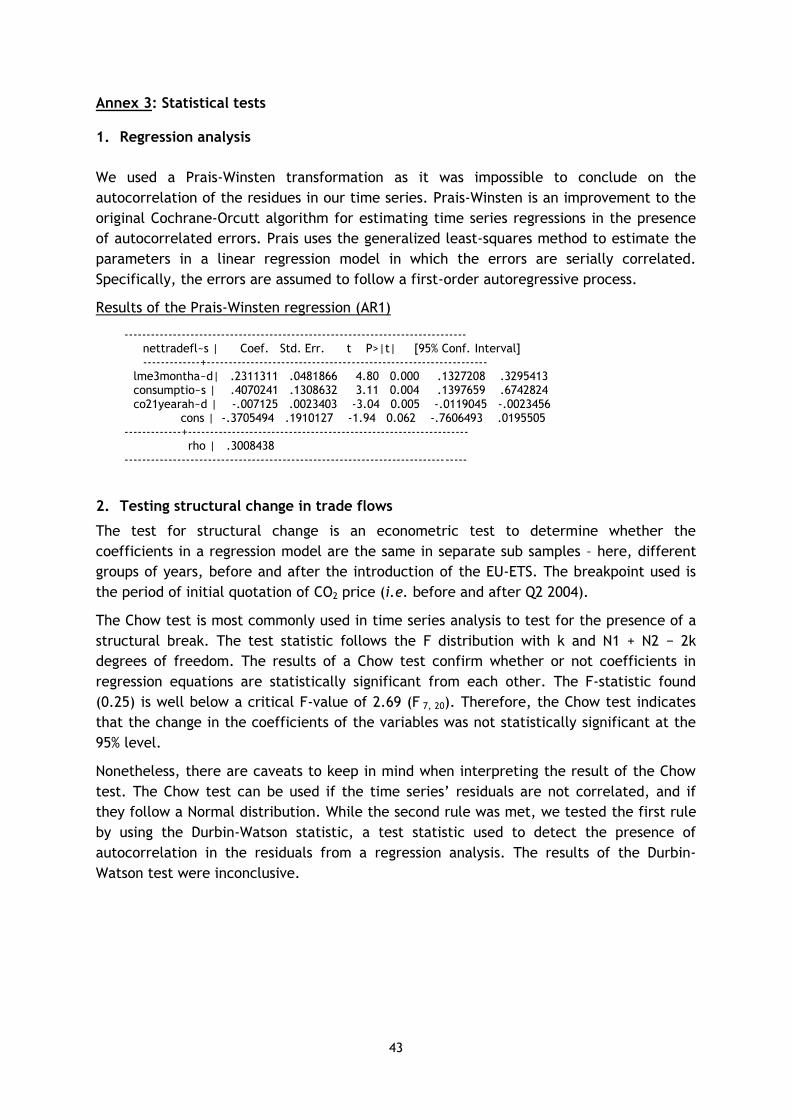
43
Annex 3: Statistical tests 1. Regression analysis
We used a Prais-Winsten transformation as it was impossible to conclude on the
autocorrelation of the residues in our time series. Prais-Winsten is an improvement to the
original Cochrane-Orcutt algorithm for estimating time series regressions in the presence
of autocorrelated errors. Prais uses the generalized least-squares method to estimate the
parameters in a linear regression model in which the errors are serially correlated.
Specifically, the errors are assumed to follow a first-order autoregressive process.
Results of the Prais-Winsten regression (AR1)
------------------------------------------------------------------------------ nettradefl~s | Coef. Std. Err. t P>|t| [95% Conf. Interval] -------------+----------------------------------------------------------------
lme3montha~d| .2311311 .0481866 4.80 0.000 .1327208 .3295413 consumptio~s | .4070241 .1308632 3.11 0.004 .1397659 .6742824 co21yearah~d | -.007125 .0023403 -3.04 0.005 -.0119045 -.0023456
cons | -.3705494 .1910127 -1.94 0.062 -.7606493 .0195505 -------------+----------------------------------------------------------------
rho | .3008438 ------------------------------------------------------------------------------
2. Testing structural change in trade flows
The test for structural change is an econometric test to determine whether the
coefficients in a regression model are the same in separate sub samples – here, different
groups of years, before and after the introduction of the EU-ETS. The breakpoint used is
the period of initial quotation of CO2 price (i.e. before and after Q2 2004).
The Chow test is most commonly used in time series analysis to test for the presence of a
structural break. The test statistic follows the F distribution with k and N1 + N2 − 2k
degrees of freedom. The results of a Chow test confirm whether or not coefficients in
regression equations are statistically significant from each other. The F-statistic found
(0.25) is well below a critical F-value of 2.69 (F 7, 20). Therefore, the Chow test indicates
that the change in the coefficients of the variables was not statistically significant at the
95% level.
Nonetheless, there are caveats to keep in mind when interpreting the result of the Chow
test. The Chow test can be used if the time series’ residuals are not correlated, and if
they follow a Normal distribution. While the second rule was met, we tested the first rule
by using the Durbin-Watson statistic, a test statistic used to detect the presence of
autocorrelation in the residuals from a regression analysis. The results of the Durbin-
Watson test were inconclusive.