Embed Size (px)
Citation preview

1
Altice enters US market with
acquisition of Suddenlink
May 20, 2015
2
DISCLAIMER
NOT AN OFFER TO SELL OR SOLICITATION OF AN OFFER
TO PURCHASE SECURITIES
This presentation does not constitute or form part of, and should not be construed as, an offer
or invitation to sell securities of Altice S.A. or any of its affiliates (collectively the “Altice Group”)
or the solicitation of an offer to subscribe for or purchase securities of the Altice Group, and
nothing contained herein shall form the basis of or be relied on in connection with any contract
or commitment whatsoever. Any decision to purchase any securities of the Altice Group should
be made solely on the basis of the final terms and conditions of the securities and the
information to be contained in the offering memorandum produced in connection with the
offering of such securities. Prospective investors are required to make their own independent
investigations and appraisals of the business and financial condition of the Altice Group and
the nature of the securities before taking any investment decision with respect to securities of
the Altice Group. Any such offering memorandum may contain information different from the
information contained herein.
FORWARD-LOOKING STATEMENTS
Certain statements in this presentation constitute forward-looking statements within the
meaning of the Private Securities Litigation Reform Act of 1995. These forward-looking
statements include, but are not limited to, all statements other than statements of historical
facts contained in this presentation, including, without limitation, those regarding our intentions,
beliefs or current expectations concerning, among other things: our future financial conditions
and performance, results of operations and liquidity; our strategy, plans, objectives, prospects,
growth, goals and targets; and future developments in the markets in which we participate or
are seeking to participate. These forward-looking statements can be identified by the use of
forward-looking terminology, including the terms “believe”, “could”, “estimate”, “expect”,
“forecast”, “intend”, “may”, “plan”, “project” or “will” or, in each case, their negative, or other
variations or comparable terminology. Where, in any forward-looking statement, we express an
expectation or belief as to future results or events, such expectation or belief is expressed in
good faith and believed to have a reasonable basis, but there can be no assurance that the
expectation or belief will result or be achieved or accomplished. To the extent that statements
in this press release are not recitations of historical fact, such statements constitute forward-
looking statements, which, by definition, involve risks and uncertainties that could cause actual
results to differ materially from those expressed or implied by such statements.
FINANCIAL MEASURES
This presentation contains measures and ratios (the “Non-IFRS Measures”), including EBITDA
and Operating Free Cash Flow that are not required by, or presented in accordance with, IFRS
or any other generally accepted accounting standards. We present Non-IFRS or any other
generally accepted accounting standards. We present Non-IFRS measures because we
believe that they are of interest for the investors and similar measures are widely used by
certain investors, securities analysts and other interested parties as supplemental measures of
performance and liquidity. The Non-IFRS measures may not be comparable to similarly titled
measures of other companies, have limitations as analytical tools and should not be
considered in isolation or as a substitute for analysis of our, or any of our subsidiaries’,
operating results as reported under IFRS or other generally accepted accounting standards.
Non-IFRS measures such as EBITDA are not measurements of our, or any of our subsidiaries’,
performance or liquidity under IFRS or any other generally accepted accounting principles. In
particular, you should not consider EBITDA as an alternative to (a) operating profit or profit for
the period (as determined in accordance with IFRS) as a measure of our, or any of our
operating entities’, operating performance, (b) cash flows from operating, investing and
financing activities as a measure of our, or any of our subsidiaries’, ability to meet its cash
needs or (c) any other measures of performance under IFRS or other generally accepted
accounting standards. In addition, these measures may also be defined and calculated
differently than the corresponding or similar terms under the terms governing our existing debt.
EBITDA and similar measures are used by different companies for differing purposes and are
often calculated in ways that reflect the circumstances of those companies. You should
exercise caution in comparing EBITDA as reported by us to EBITDA of other companies.
EBITDA as presented herein differs from the definition of “Consolidated Combined EBITDA” for
purposes of any the indebtedness of the Altice Group. The information presented as EBITDA is
unaudited. In addition, the presentation of these measures is not intended to and does not
comply with the reporting requirements of the U.S. Securities and Exchange Commission (the
“SEC”) and will not be subject to review by the SEC; compliance with its requirements would
require us to make changes to the presentation of this information.
3
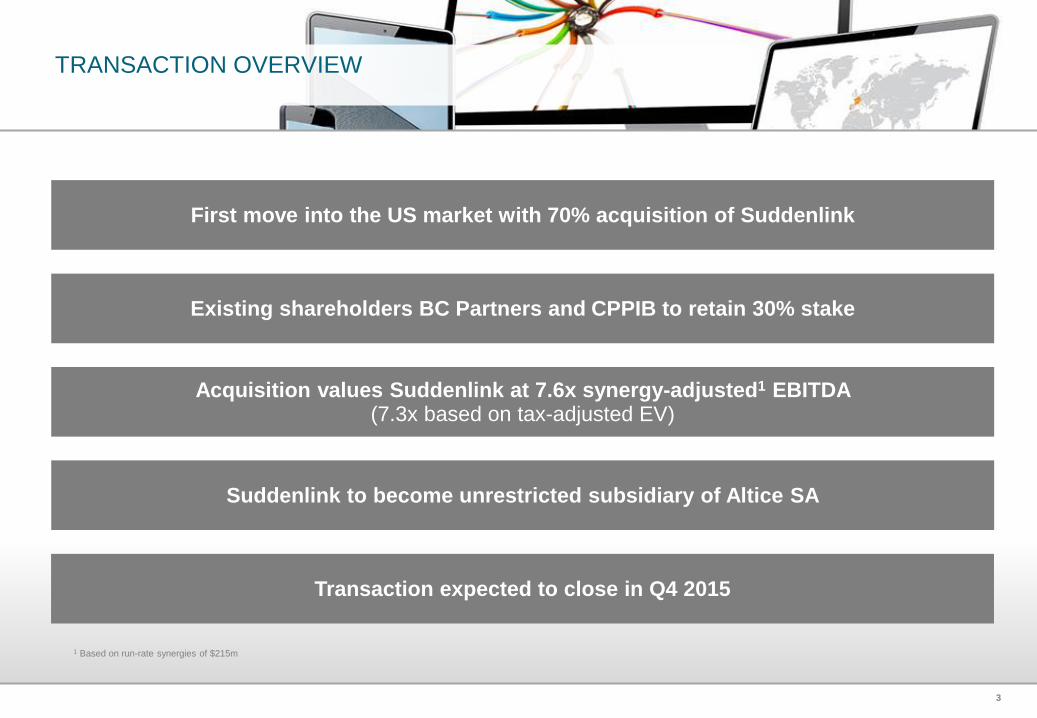
TRANSACTION OVERVIEW
First move into the US market with 70% acquisition of Suddenlink
Existing shareholders BC Partners and CPPIB to retain 30% stake
Suddenlink to become unrestricted subsidiary of Altice SA
Transaction expected to close in Q4 2015
Acquisition values Suddenlink at 7.6x synergy-adjusted1 EBITDA (7.3x based on tax-adjusted EV)
1 Based on run-rate synergies of $215m
4
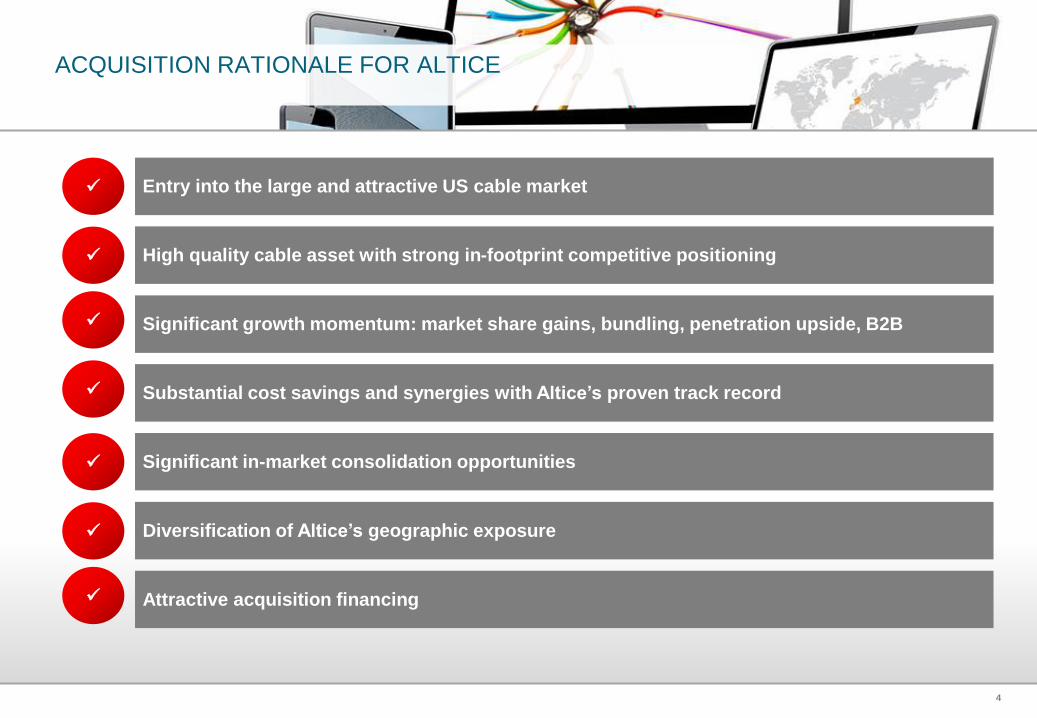
ACQUISITION RATIONALE FOR ALTICE
Entry into the large and attractive US cable market
High quality cable asset with strong in-footprint competitive positioning
Significant growth momentum: market share gains, bundling, penetration upside, B2B
Substantial cost savings and synergies with Altice’s proven track record
Significant in-market consolidation opportunities
Attractive acquisition financing
Diversification of Altice’s geographic exposure
5
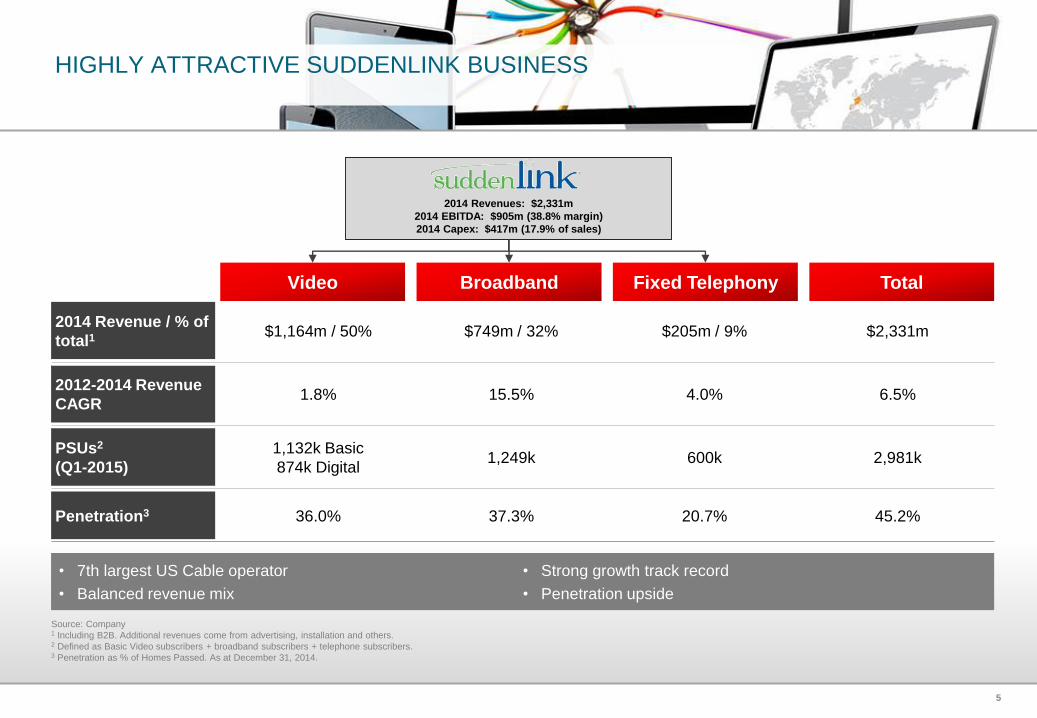
HIGHLY ATTRACTIVE SUDDENLINK BUSINESS
Source: Company1 Including B2B. Additional revenues come from advertising, installation and others.2 Defined as Basic Video subscribers + broadband subscribers + telephone subscribers.3 Penetration as % of Homes Passed. As at December 31, 2014.
2014 Revenues: $2,331m
2014 EBITDA: $905m (38.8% margin)
2014 Capex: $417m (17.9% of sales)
2014 Revenue / % of
total1$1,164m / 50% $749m / 32% $205m / 9% $2,331m
2012-2014 Revenue
CAGR1.8% 15.5% 4.0% 6.5%
PSUs2
(Q1-2015)
1,132k Basic
874k Digital1,249k 600k 2,981k
Penetration3 36.0% 37.3% 20.7% 45.2%
• 7th largest US Cable operator
• Balanced revenue mix
• Strong growth track record
• Penetration upside
Fixed TelephonyBroadbandVideo Total
6
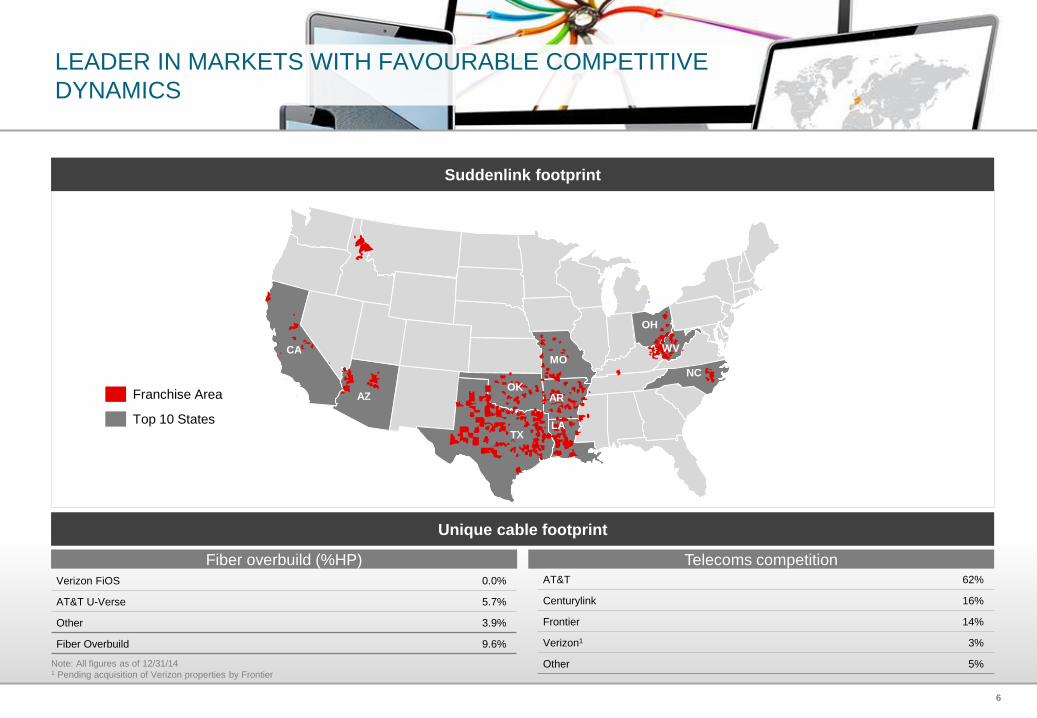
LEADER IN MARKETS WITH FAVOURABLE COMPETITIVE
DYNAMICS
Unique cable footprint
Verizon FiOS 0.0%
AT&T U-Verse 5.7%
Other 3.9%
Fiber Overbuild 9.6%
AT&T 62%
Centurylink 16%
Frontier 14%
Verizon1 3%
Other 5%
Franchise Area
Top 10 States
AZ
TX
OK
MO
AR
LA
OH
NC
Suddenlink footprint
Telecoms competition
CA WV
Note: All figures as of 12/31/14 1 Pending acquisition of Verizon properties by Frontier
Fiber overbuild (%HP)
7
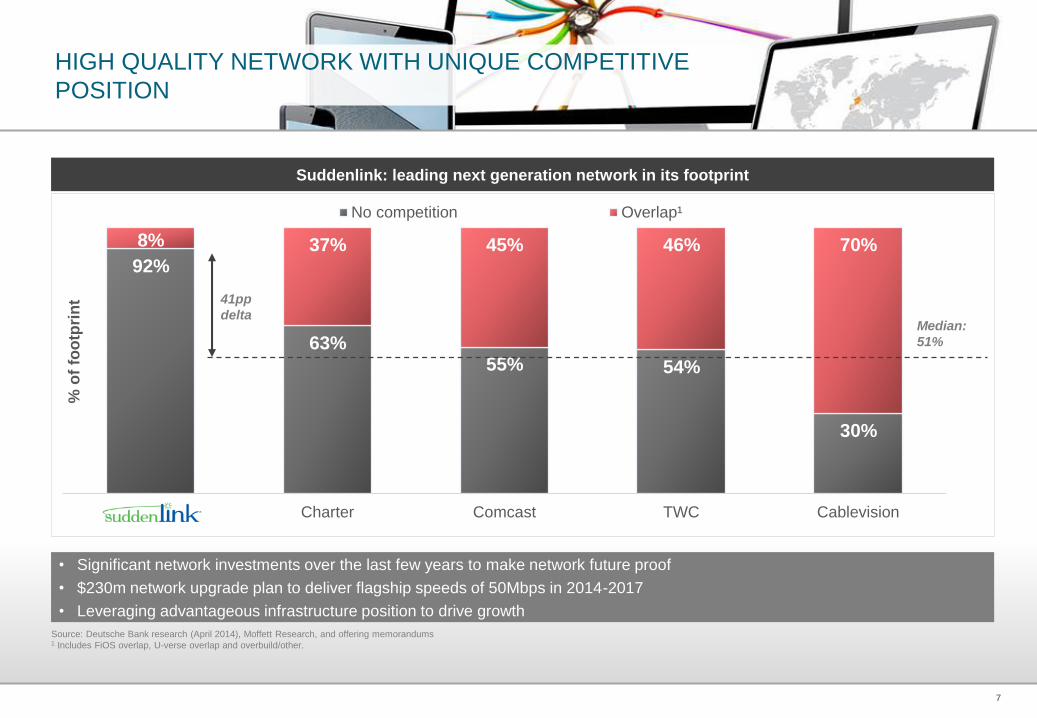
HIGH QUALITY NETWORK WITH UNIQUE COMPETITIVE
POSITION
• Significant network investments over the last few years to make network future proof
• $230m network upgrade plan to deliver flagship speeds of 50Mbps in 2014-2017
• Leveraging advantageous infrastructure position to drive growth
Source: Deutsche Bank research (April 2014), Moffett Research, and offering memorandums1 Includes FiOS overlap, U-verse overlap and overbuild/other.
92%
63%55% 54%
30%
8% 37% 45% 46% 70%
Charter Comcast TWC Cablevision
No competition Overlap¹
% o
f fo
otp
rin
t 41pp
deltaMedian:
51%
Suddenlink: leading next generation network in its footprint
8
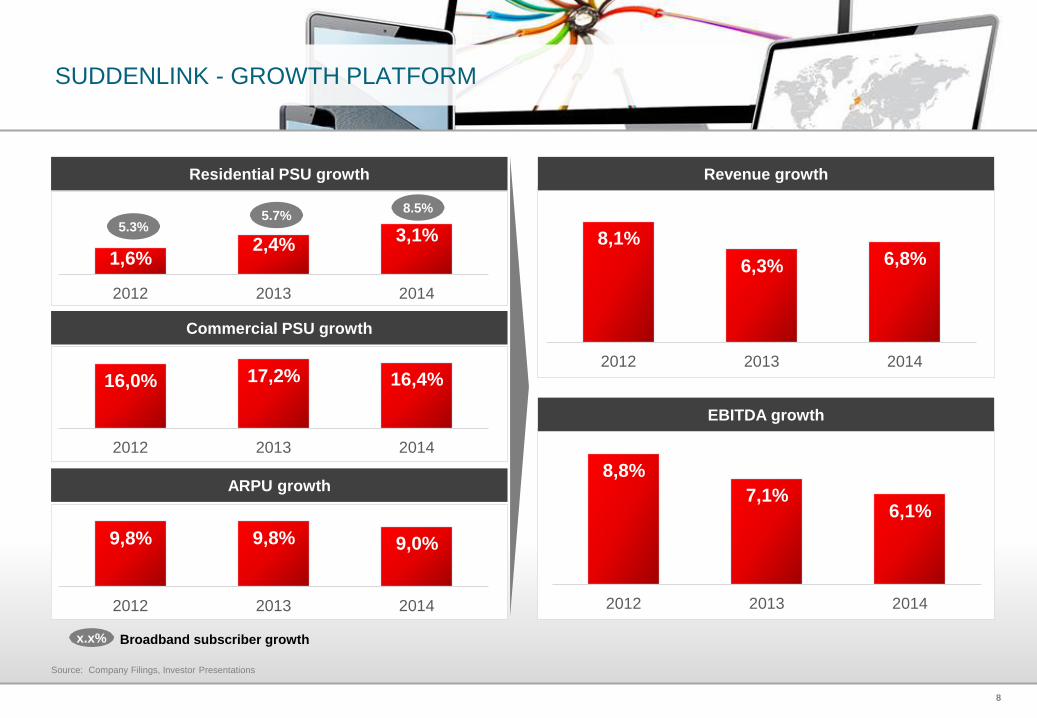
SUDDENLINK - GROWTH PLATFORM
Source: Company Filings, Investor Presentations
8,8%
7,1% 6,1%
2012 2013 2014
16,0% 17,2% 16,4%
2012 2013 2014
1,6% 2,4%
3,1%
2012 2013 2014
8,1%
6,3% 6,8%
2012 2013 2014
Revenue growth
Commercial PSU growth
EBITDA growth
Residential PSU growth
5.3%5.7%
8.5%
x.x% Broadband subscriber growth
9,8% 9,8% 9,0%
2012 2013 2014
ARPU growth
9
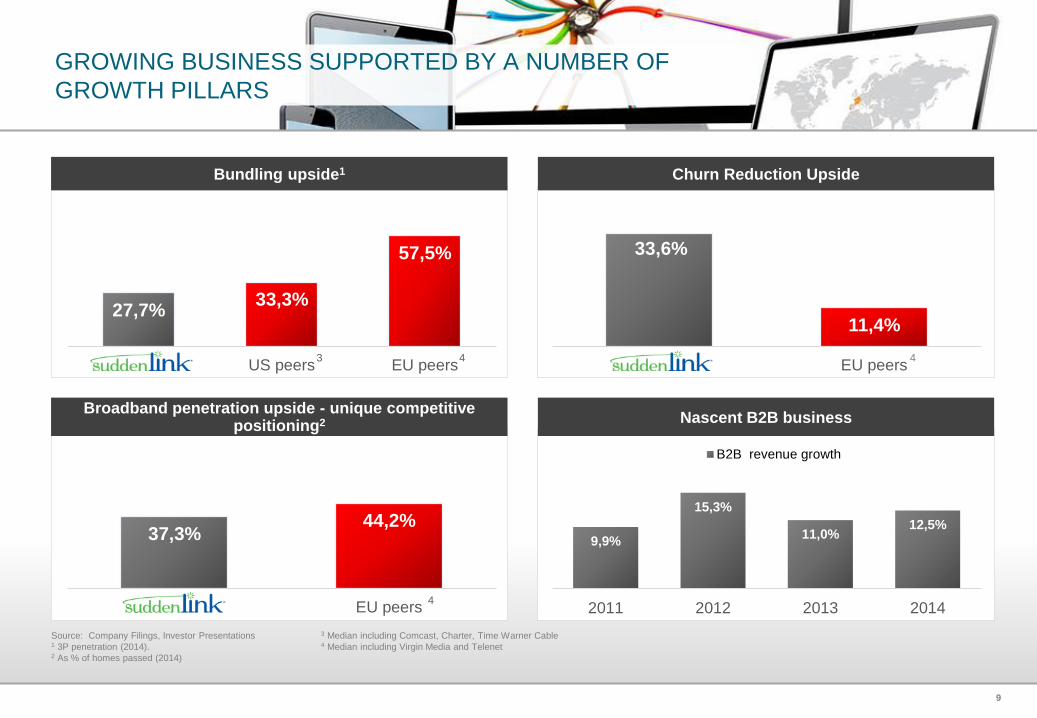
GROWING BUSINESS SUPPORTED BY A NUMBER OF
GROWTH PILLARS
Source: Company Filings, Investor Presentations1 3P penetration (2014).2 As % of homes passed (2014)
9,9%
15,3%
11,0% 12,5%
2011 2012 2013 2014
B2B revenue growth
3 Median including Comcast, Charter, Time Warner Cable4 Median including Virgin Media and Telenet
27,7% 33,3%
57,5%
US peers EU peers
37,3% 44,2%
EU peers
33,6%
11,4%
EU peers43 4
4
Bundling upside1
Broadband penetration upside - unique competitive positioning2
Churn Reduction Upside
Nascent B2B business
10
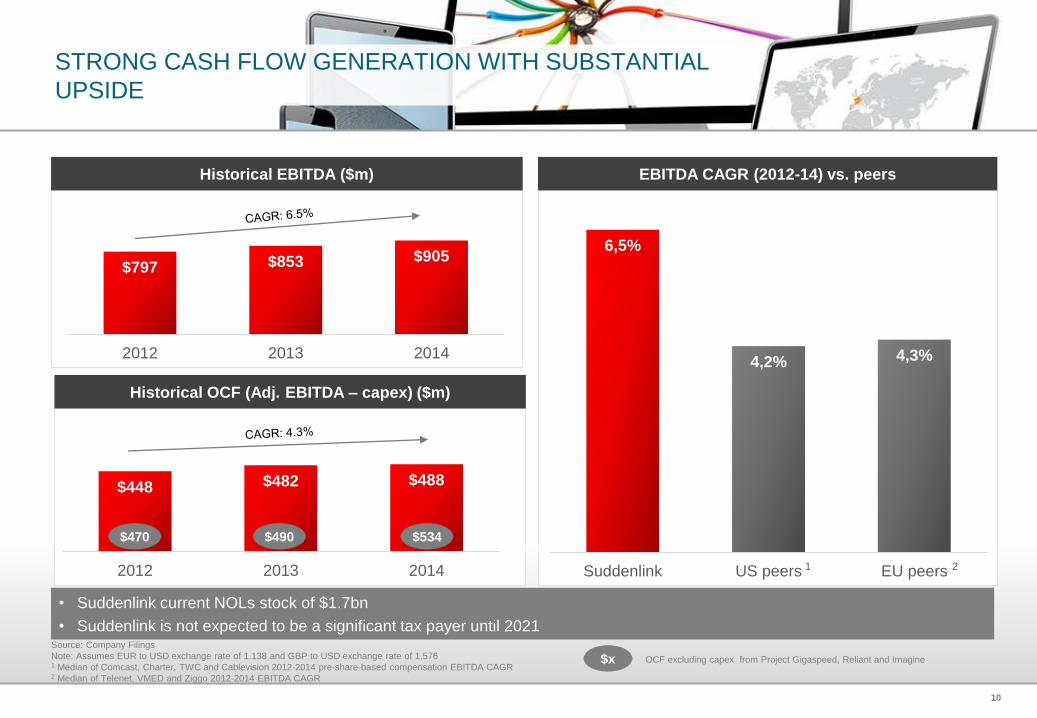
STRONG CASH FLOW GENERATION WITH SUBSTANTIAL
UPSIDE
Source: Company Filings
Note: Assumes EUR to USD exchange rate of 1.138 and GBP to USD exchange rate of 1.5761 Median of Comcast, Charter, TWC and Cablevision 2012-2014 pre-share-based compensation EBITDA CAGR 2 Median of Telenet, VMED and Ziggo 2012-2014 EBITDA CAGR
• Suddenlink current NOLs stock of $1.7bn
• Suddenlink is not expected to be a significant tax payer until 2021
Historical EBITDA ($m)
Historical OCF (Adj. EBITDA – capex) ($m)
$797 $853 $905
2012 2013 2014
$448 $482 $488
2012 2013 2014
EBITDA CAGR (2012-14) vs. peers
6,5%
4,2% 4,3%
Suddenlink US peers EU peers 21
$470
$x OCF excluding capex from Project Gigaspeed, Reliant and Imagine
$490 $534
11
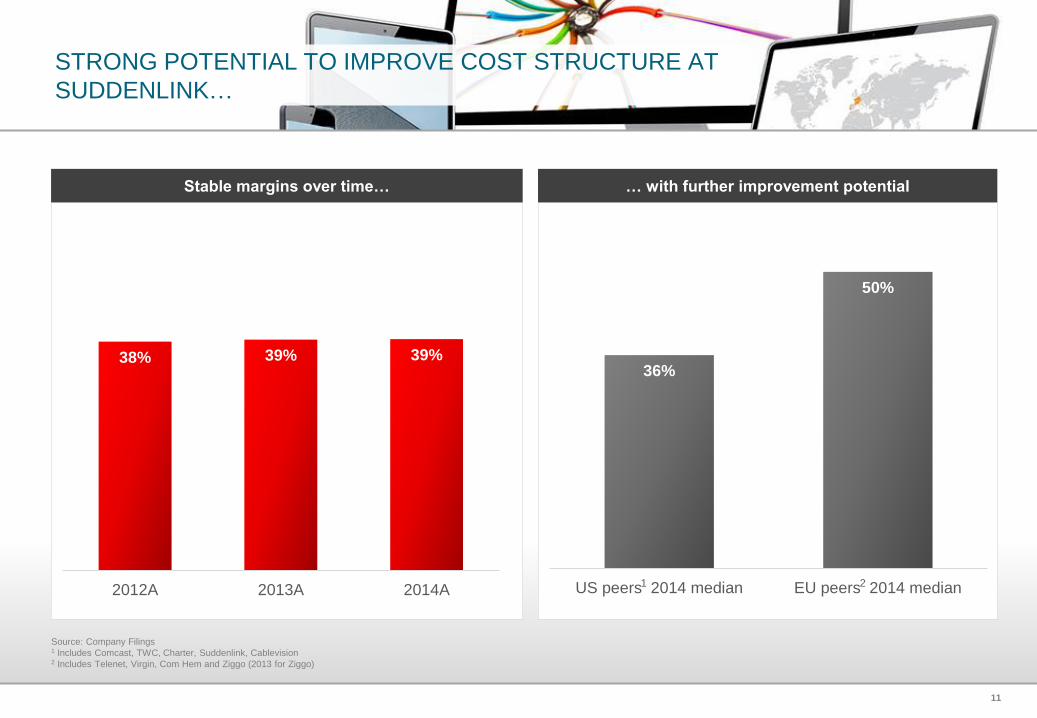
36%
50%
US peers 2014 median EU peers 2014 median
STRONG POTENTIAL TO IMPROVE COST STRUCTURE AT
SUDDENLINK…
Stable margins over time… … with further improvement potential
38% 39% 39%
2012A 2013A 2014A1 2
Source: Company Filings1 Includes Comcast, TWC, Charter, Suddenlink, Cablevision2 Includes Telenet, Virgin, Com Hem and Ziggo (2013 for Ziggo)
12
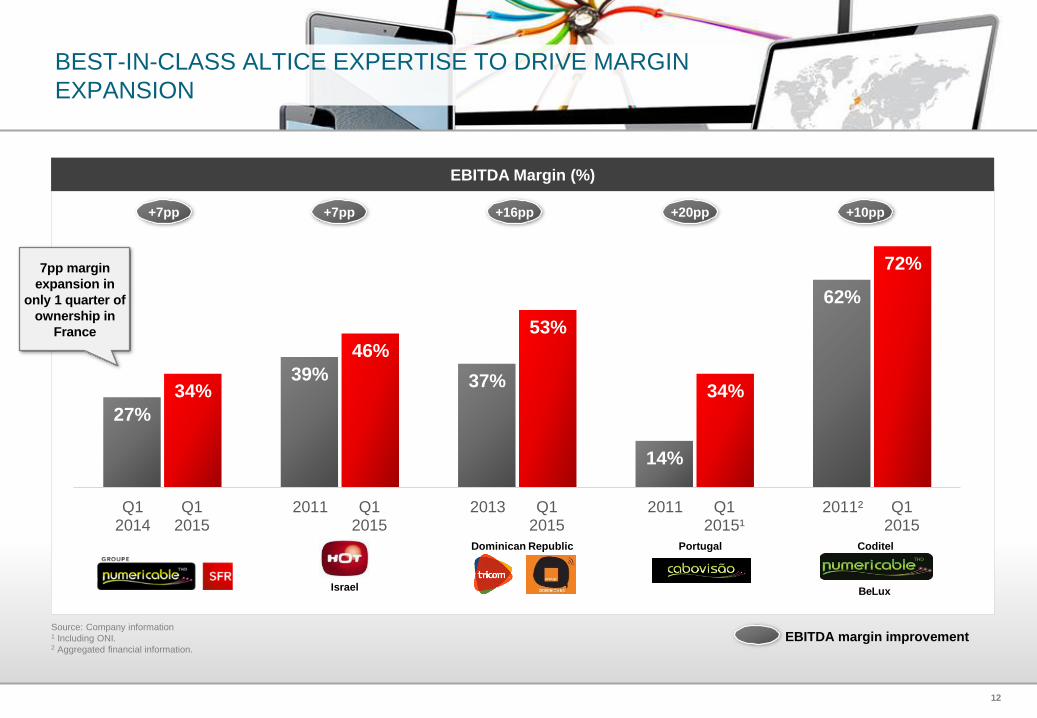
BEST-IN-CLASS ALTICE EXPERTISE TO DRIVE MARGIN
EXPANSION
Source: Company information1 Including ONI. 2 Aggregated financial information.
27%
39% 37%
14%
62%
34%
46%
53%
34%
72%
Q12014
Q12015
2011 Q12015
2013 Q12015
2011 Q12015¹
2011² Q12015
+7pp +7pp +16pp +20pp +10pp
EBITDA margin improvement
Israel BeLux
CoditelPortugalDominican Republic
EBITDA Margin (%)
7pp margin
expansion in
only 1 quarter of
ownership in
France
13
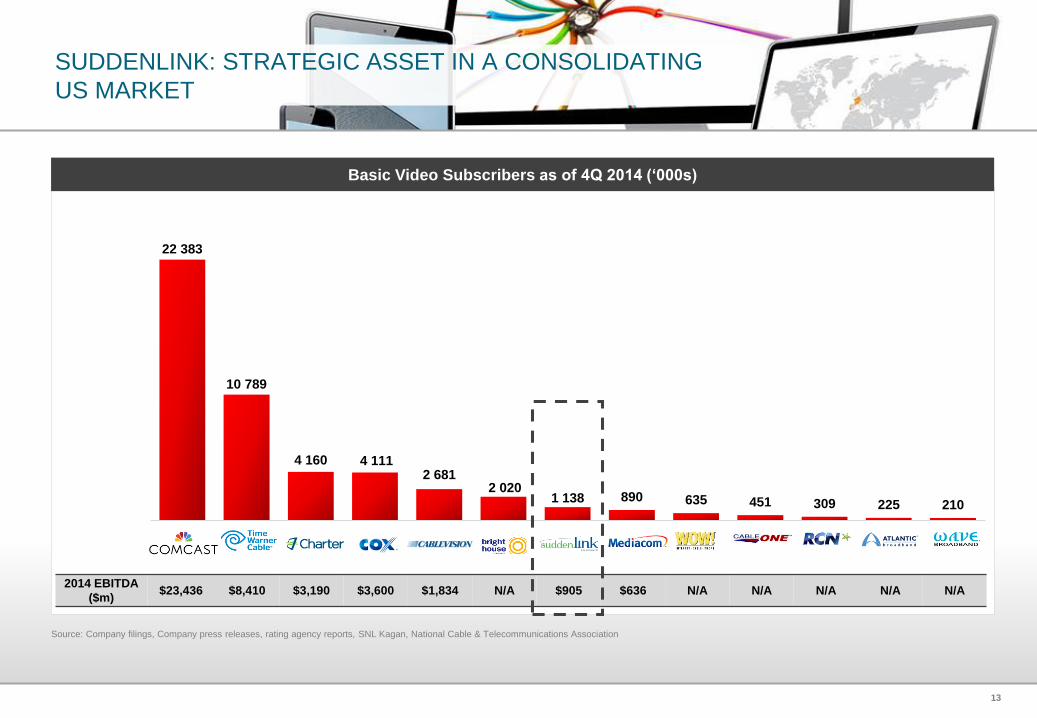
SUDDENLINK: STRATEGIC ASSET IN A CONSOLIDATING
US MARKET
Source: Company filings, Company press releases, rating agency reports, SNL Kagan, National Cable & Telecommunications Association
22 383
10 789
4 160 4 1112 681
2 0201 138 890 635 451 309 225 210
Overlap¹
2014 EBITDA
($m) $23,436 $8,410 $3,190 $3,600 $1,834 N/A $905 $636 N/A N/A N/A N/A N/A
Basic Video Subscribers as of 4Q 2014 (‘000s)
14
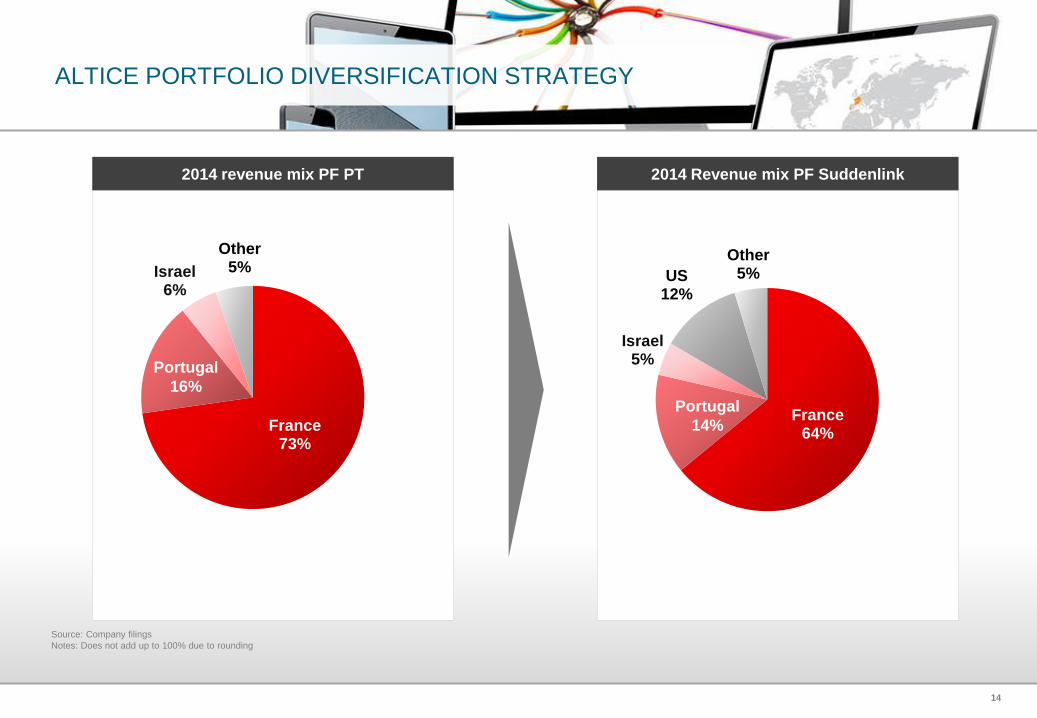
ALTICE PORTFOLIO DIVERSIFICATION STRATEGY
Source: Company filings
Notes: Does not add up to 100% due to rounding
France64%
Israel5%
US12%
Other5%
2014 revenue mix PF PT 2014 Revenue mix PF Suddenlink
France73%
Israel6%
Other5%
Portugal
16%
Portugal
14%
15
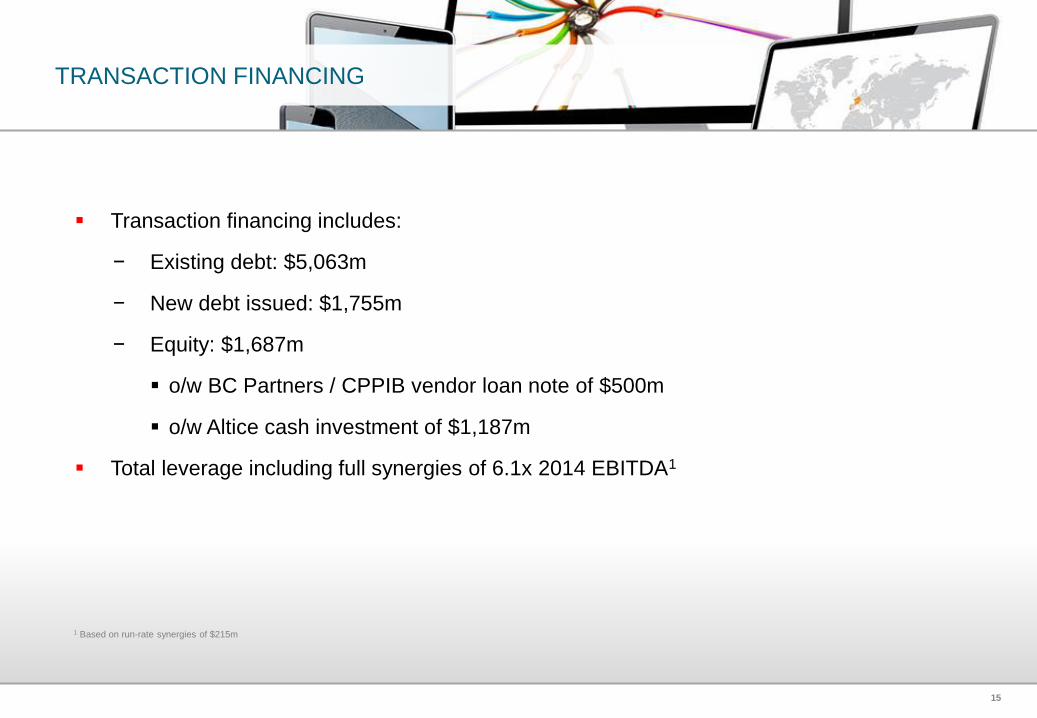
TRANSACTION FINANCING
Transaction financing includes:
− Existing debt: $5,063m
− New debt issued: $1,755m
− Equity: $1,687m
o/w BC Partners / CPPIB vendor loan note of $500m
o/w Altice cash investment of $1,187m
Total leverage including full synergies of 6.1x 2014 EBITDA1
1 Based on run-rate synergies of $215m

16
Appendix
17
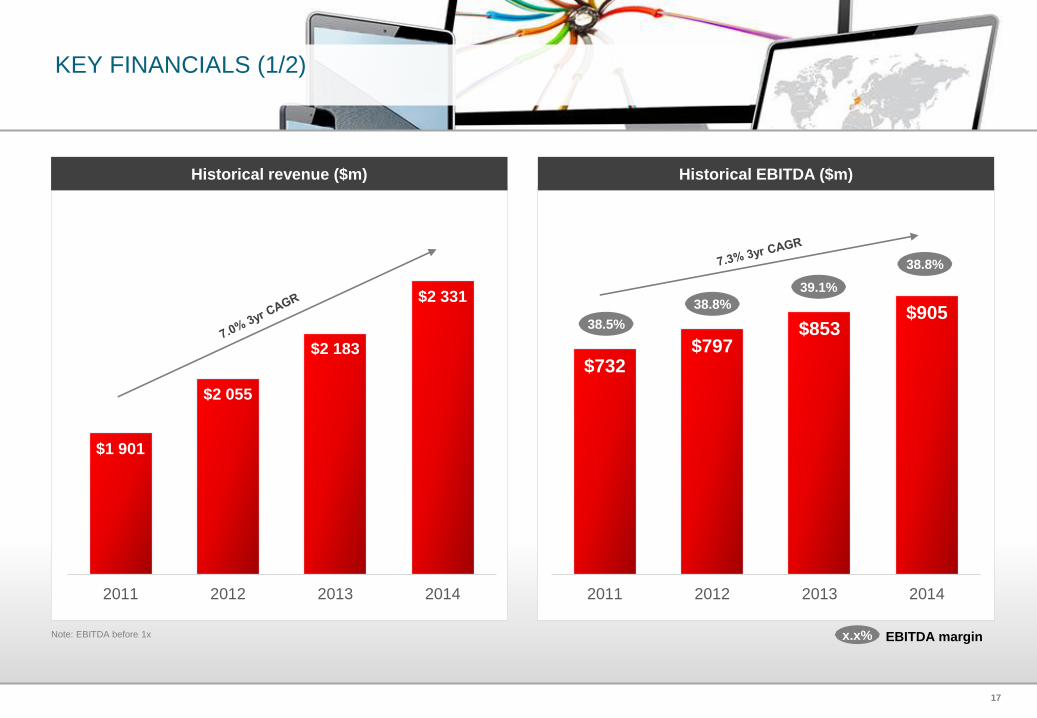
KEY FINANCIALS (1/2)
Note: EBITDA before 1x
$1 901
$2 055
$2 183
$2 331
2011 2012 2013 2014
$732$797
$853$905
2011 2012 2013 2014
38.5%
38.8%
39.1%
38.8%
x.x% EBITDA margin
Historical revenue ($m) Historical EBITDA ($m)
18
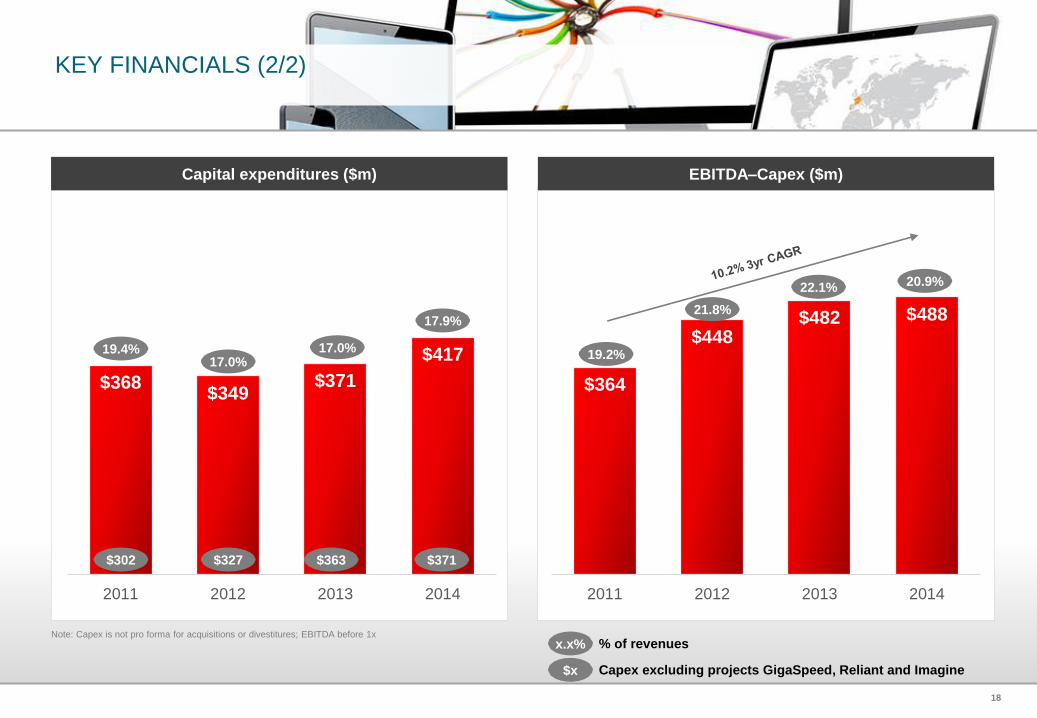
KEY FINANCIALS (2/2)
$368$349
$371
$417
2011 2012 2013 2014
Note: Capex is not pro forma for acquisitions or divestitures; EBITDA before 1x
$364
$448$482 $488
2011 2012 2013 2014
19.2%
21.8%
22.1% 20.9%
$302 $371$327 $363
x.x% % of revenues
Capital expenditures ($m) EBITDA–Capex ($m)
19.4%
17.9%
17.0%17.0%
$x Capex excluding projects GigaSpeed, Reliant and Imagine


![2014 FCC EEO PUBLIC FILE REPORT FOR SUDDENLINK ... · 2014 FCC EEO PUBLIC FILE REPORT FOR SUDDENLINK COMMUNICATIONS Employment Unit # 12215– [Smith County, Tyler, Texas] This Report](https://img.pdfslide.us/doc/110x75/5c4c37e993f3c30e021215b7/2014-fcc-eeo-public-file-report-for-suddenlink-2014-fcc-eeo-public-file.jpg)