Embed Size (px)
Citation preview

Altice Reorganization8 January 2018

2
Disclaimer
FORWARD-LOOKING STATEMENTS
This presentation includes statements that express opinions, expectations, beliefs, plans, objectives, assumptions or projections regarding future
events or future results and therefore are, or may be deemed to be, “forward-looking statements. ” Words such as “expects,” “anticipates,” “believes,”
“estimates,” “may,” “will,” “should,” “could,” “seeks,” “potential,” “continue,” “intends,” “plans” and similar words and terms used in the discussion of
future operating results, future financial performance and future events identify forward-looking statements in this prospectus. All of these forward-
looking statements are based on management’s current expectations and beliefs about future events. As with any projection or forecast, they are
susceptible to uncertainty and changes in circumstances. Various factors could adversely affect Altice USA’s operations, business or financial results
in the future and cause actual results to differ materially from those contained in the forward-looking statements, including those factors discussed
under “Risk Factors” in our registration statement on Form S-1, filed with the Securities and Exchange Commission (“SEC”) on January 8, 2018 and
available on the SEC’s website at http://www.sec.gov.
NON-GAAP FINANCIAL MEASURES
Adjusted EBITDA, which is a non-GAAP financial measure, is defined as net income (loss) excluding income taxes, income (loss) from discontinued
operations, other non-operating income or expenses, loss on extinguishment of debt and write-off of deferred financing costs, loss on interest rate
swap contracts, gain (loss) on equity derivative contracts, gain (loss) on investments, interest expense (including cash interest expense), interest
income, depreciation and amortization (including impairments), share-based compensation expense or benefit, restructuring expense or credits and
transaction expenses. We believe Adjusted EBITDA is an appropriate measure for evaluating the operating performance of the Altice USA. Adjusted
EBITDA and similar measures with similar titles are common performance measures used by investors, analysts and peers to compare performance
in our industry. Internally, we use revenue and Adjusted EBITDA measures as important indicators of our business performance, and evaluate
management’s effectiveness with specific reference to these indicators. We believe Adjusted EBITDA provides management and investors a useful
measure for period-to-period comparisons of our core business and operating results by excluding items that are not comparable across reporting
periods or that do not otherwise relate to the Altice USA’s ongoing operating results. Adjusted EBITDA should be viewed as a supplement to and not a
substitute for operating income (loss), net income (loss), and other measures of performance presented in accordance with GAAP. Since Adjusted
EBITDA is not a measure of performance calculated in accordance with GAAP, this measure may not be comparable to similar measures with similar
titles used by other companies. Altice USA also uses Adjusted EBITDA less Capital Expenditures (which we call “OpFCF” in this presentation) as an
indicator of the Altice USA’s financial performance. We believe this measure is one of several benchmarks used by investors, analysts and peers for
comparison of performance in Altice USA’s industry, although it may not be directly comparable to similar measures reported by other companies. For
reconciliations, see Q3-17 Altice N.V. earnings release posted to the Altice N.V. website.
NON-IFRS FINANCIAL MEASURES
This presentation contains Adjusted EBITDA for Altice N.V. (“Non-IFRS Measure”) that is not required by, or presented in accordance with,
international financial reporting standards (“IFRS”) or any other generally accepted accounting standards. We present Non-IFRS measures because
we believe that they are of interest for the investors and similar measures are widely used by certain investors, securities analysts and other interested
parties as supplemental measures of performance and liquidity. The Non-IFRS measures may not be comparable to similarly titled measures of other
companies, have limitations as analytical tools and should not be considered in isolation or as a substitute for analysis of our, or any of our
subsidiaries’, operating results as reported under IFRS or other generally accepted accounting standards. Adjusted EBITDA is not a measurement of
Altice N.V., or any of Altice N.V.’s subsidiaries’, performance or liquidity under IFRS or any other generally accepted accounting principles.
NON-IFRS FINANCIAL MEASURES (CONTINUED)
In particular, you should not consider Adjusted EBITDA as an alternative to (a) operating profit or profit for the period (as determined in accordance
with IFRS) as a measure of our, or any of our operating entities’, operating performance, (b) cash flows from operating, investing and financing
activities as a measure of our, or any of our subsidiaries’, ability to meet its cash needs or (c) any other measures of performance under IFRS or other
generally accepted accounting standards. Adjusted EBITDA and similar measures are used by different companies for differing purposes and are
often calculated in ways that reflect the circumstances of those companies. You should exercise caution in comparing Adjusted EBITDA as reported
by Altice N.V. to Adjusted EBITDA of other companies. Adjusted EBITDA as presented herein differs from the definition of “Consolidated Combined
EBITDA” for purposes of any the indebtedness of the Altice Group. The information presented as Adjusted EBITDA is unaudited. Capital expenditure
(Capex), while measured in accordance with IFRS principles, is not a term that is defined in IFRS nor is it presented separately in the Altice N.V.
financial statements. However, Altice N.V.’s management believes it is an important indicator for the Altice Group as the profile varies greatly between
activities: (i) the fixed business has fixed Capex requirements that are mainly discretionary (network, platforms, general), and variable capex
requirements related to the connection of new customers and the purchase of Customer Premise Equipment (TV decoder, modem, etc); (ii) Mobile
Capex is mainly driven by investment in new mobile sites, upgrade to new mobile technology and licenses to operate; once engaged and operational,
there are limited further Capex requirements and (iii) Other Capex: Mainly related to costs incurred in acquiring content rights.
MISCELLANEOUS
Altice USA has filed a registration statement with the Securities and Exchange Commission (SEC) for the offering to which this presentation relates.
You should read the preliminary prospectus in that registration statement and other documents Altice USA has filed with the SEC for more complete
information about Altice USA. You may get these documents for free by visiting EDGAR on the SEC website at www.sec.gov. Alternatively, you may
also request a copy of the current preliminary prospectus, at no cost, by mail to Lisa Anselmo, Altice USA, Inc., 1 Court Square West, Long Island
City, NY 11101 USA. To review a filed copy of the current registration statement and preliminary prospectus, click the following link on the SEC
website at www.sec.gov as follows (or if such address has changed, by reviewing ATUS filings for the relevant date on the SEC website):
https://www.sec.gov/Archives/edgar/data/1702780/000104746918000085/a2234168zs-1.htm
Altice USA will publish an EU prospectus in connection with the distribution to which this presentation relates. Upon approval by the Netherlands
Authority for the Financial Markets (AFM) and, to the extent relevant, notification for passporting in relevant Member States of the European Economic
Area in accordance with article 18 of the Directive 2003/71/EC, the EU prospectus will be made available on the website of Altice N.V. and, upon
request, a hard copy will be available free of charge by Altice USA.
THIS PRESENTATION DOES NOT CONSTITUTE AN OFFER OUTSIDE OF THE U.S.
This presentation is intended for information only, does not constitute a prospectus or similar document outside of the United States and should not be
treated as investment advice. This presentation does not constitute or form part of, and should not be construed as, an offer or invitation to sell
securities of Altice N.V. or any of its affiliates (including Altice USA), collectively the “Altice Group,” or the solicitation of an offer to subscribe for or
purchase securities of the Altice Group outside of the United States, and nothing contained herein shall form the basis of or be relied on in connection
with any contract or commitment whatsoever. Any decision to purchase any securities of the Altice Group should be made solely on the basis of the
final terms and conditions of the securities and the information to be contained in a prospectus or offering memorandum produced in connection with
the offering of such securities outside of the United States. Prospective investors outside of the United States are required to make their own
independent investigations and appraisals of the business and financial condition of the Altice Group and the nature of the securities before taking any
investment decision with respect to securities of the Altice Group. Any such prospectus or offering memorandum may contain information different
from the information contained herein.
3
Altice Group Pre- and Post-Reorganization Revenue SplitSimplified group structure
Altice USA Post-Reorganization Altice Europe Post-Reorganization (2)
Note: LTM revenue splits as of the end of September 2017
(1) Including Teads & rest of Altice Group and eliminations
(2) See slide 15 in this presentation for details of the new perimeter for Altice NV ex-US (“Altice Europe”)
Altice
France
Altice
International
Altice
Pay TV
(1)
Altice Group Pre-Reorganization
74%
26%
35%47%
10%7%

Separation of Altice USA from Altice NV
4
5
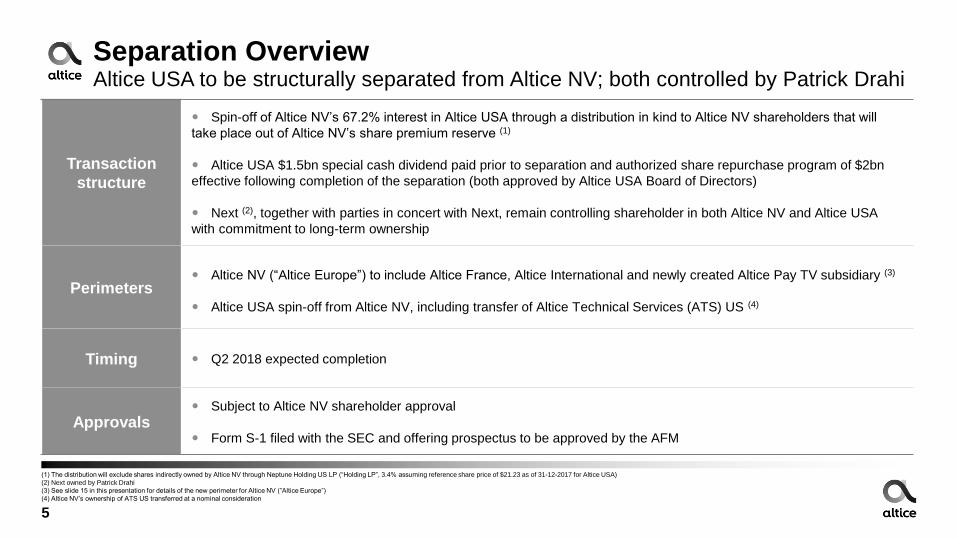
Separation OverviewAltice USA to be structurally separated from Altice NV; both controlled by Patrick Drahi
Transaction
structure
Spin-off of Altice NV’s 67.2% interest in Altice USA through a distribution in kind to Altice NV shareholders that will
take place out of Altice NV’s share premium reserve (1)
Altice USA $1.5bn special cash dividend paid prior to separation and authorized share repurchase program of $2bn
effective following completion of the separation (both approved by Altice USA Board of Directors)
Next (2), together with parties in concert with Next, remain controlling shareholder in both Altice NV and Altice USA
with commitment to long-term ownership
Perimeters Altice NV (“Altice Europe”) to include Altice France, Altice International and newly created Altice Pay TV subsidiary (3)
Altice USA spin-off from Altice NV, including transfer of Altice Technical Services (ATS) US (4)
Timing Q2 2018 expected completion
Approvals Subject to Altice NV shareholder approval
Form S-1 filed with the SEC and offering prospectus to be approved by the AFM
(1) The distribution will exclude shares indirectly owned by Altice NV through Neptune Holding US LP (“Holding LP”, 3.4% assuming reference share price of $21.23 as of 31-12-2017 for Altice USA)
(2) Next owned by Patrick Drahi
(3) See slide 15 in this presentation for details of the new perimeter for Altice NV (”Altice Europe”)
(4) Altice NV’s ownership of ATS US transferred at a nominal consideration
6
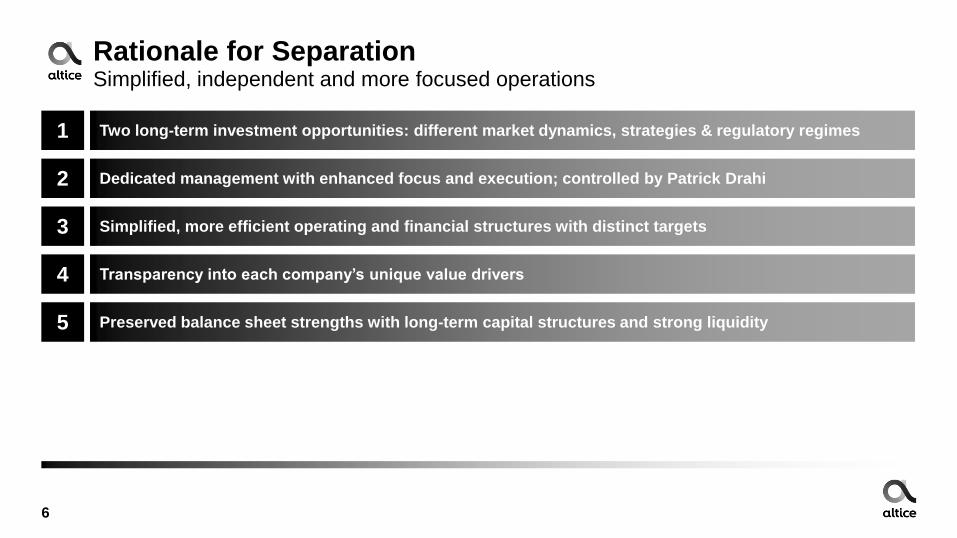
Rationale for SeparationSimplified, independent and more focused operations
Two long-term investment opportunities: different market dynamics, strategies & regulatory regimes
2
Simplified, more efficient operating and financial structures with distinct targets3
Preserved balance sheet strengths with long-term capital structures and strong liquidity
4
Dedicated management with enhanced focus and execution; controlled by Patrick Drahi
5
Transparency into each company’s unique value drivers
1
7
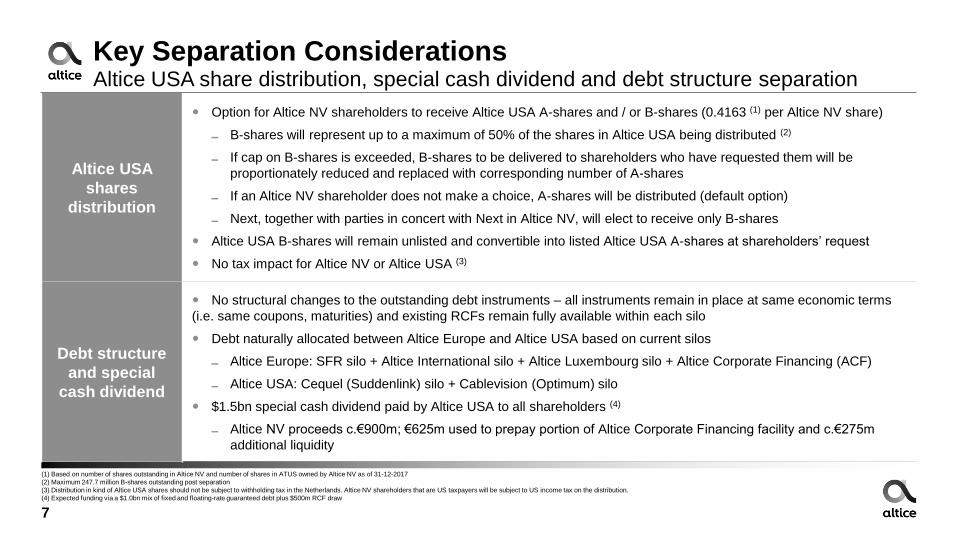
Key Separation ConsiderationsAltice USA share distribution, special cash dividend and debt structure separation
Altice USA
shares
distribution
Option for Altice NV shareholders to receive Altice USA A-shares and / or B-shares (0.4163 (1) per Altice NV share)
▬ B-shares will represent up to a maximum of 50% of the shares in Altice USA being distributed (2)
▬ If cap on B-shares is exceeded, B-shares to be delivered to shareholders who have requested them will be
proportionately reduced and replaced with corresponding number of A-shares
▬ If an Altice NV shareholder does not make a choice, A-shares will be distributed (default option)
▬ Next, together with parties in concert with Next in Altice NV, will elect to receive only B-shares
Altice USA B-shares will remain unlisted and convertible into listed Altice USA A-shares at shareholders’ request
No tax impact for Altice NV or Altice USA (3)
Debt structure
and special
cash dividend
No structural changes to the outstanding debt instruments – all instruments remain in place at same economic terms
(i.e. same coupons, maturities) and existing RCFs remain fully available within each silo
Debt naturally allocated between Altice Europe and Altice USA based on current silos
▬ Altice Europe: SFR silo + Altice International silo + Altice Luxembourg silo + Altice Corporate Financing (ACF)
▬ Altice USA: Cequel (Suddenlink) silo + Cablevision (Optimum) silo
$1.5bn special cash dividend paid by Altice USA to all shareholders (4)
▬ Altice NV proceeds c.€900m; €625m used to prepay portion of Altice Corporate Financing facility and c.€275m
additional liquidity
(1) Based on number of shares outstanding in Altice NV and number of shares in ATUS owned by Altice NV as of 31-12-2017
(2) Maximum 247.7 million B-shares outstanding post separation
(3) Distribution in kind of Altice USA shares should not be subject to withholding tax in the Netherlands. Altice NV shareholders that are US taxpayers will be subject to US income tax on the distribution.
(4) Expected funding via a $1.0bn mix of fixed and floating-rate guaranteed debt plus $500m RCF draw
100%
Altice USAAltice NV
8
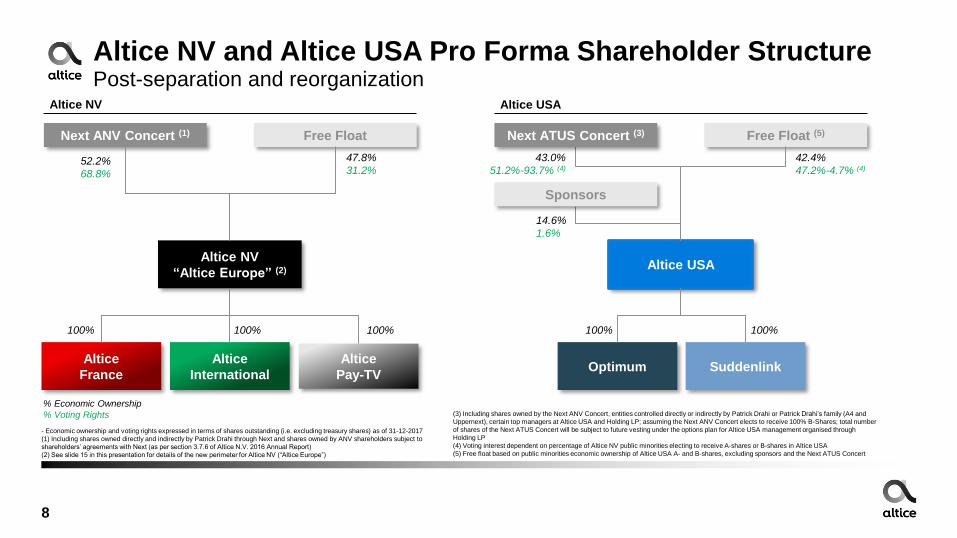
Altice NV and Altice USA Pro Forma Shareholder Structure Post-separation and reorganization
- Economic ownership and voting rights expressed in terms of shares outstanding (i.e. excluding treasury shares) as of 31-12-2017
(1) Including shares owned directly and indirectly by Patrick Drahi through Next and shares owned by ANV shareholders subject to
shareholders’ agreements with Next (as per section 3.7.6 of Altice N.V. 2016 Annual Report)
(2) See slide 15 in this presentation for details of the new perimeter for Altice NV (“Altice Europe”)
Next ANV Concert (1) Free Float
Altice NV
“Altice Europe” (2)
Altice
France
Altice
International
% Economic Ownership
% Voting Rights
52.2%
68.8%
47.8%
31.2%
100%
Altice
Pay-TV
Altice USA
Optimum Suddenlink
43.0%
51.2%-93.7% (4)
100% 100%
Next ATUS Concert (3)
Sponsors
Free Float (5)
14.6%
1.6%
42.4%
47.2%-4.7% (4)
(3) Including shares owned by the Next ANV Concert, entities controlled directly or indirectly by Patrick Drahi or Patrick Drahi’s family (A4 and
Uppernext), certain top managers at Altice USA and Holding LP; assuming the Next ANV Concert elects to receive 100% B-Shares; total number
of shares of the Next ATUS Concert will be subject to future vesting under the options plan for Altice USA management organised through
Holding LP
(4) Voting interest dependent on percentage of Altice NV public minorities electing to receive A-shares or B-shares in Altice USA
(5) Free float based on public minorities economic ownership of Altice USA A- and B-shares, excluding sponsors and the Next ATUS Concert
100%
9
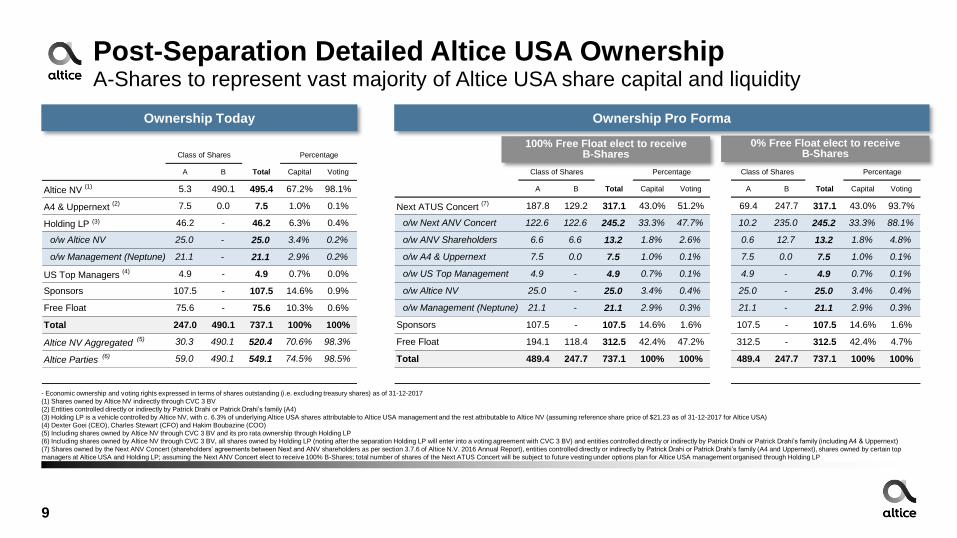
Post-Separation Detailed Altice USA OwnershipA-Shares to represent vast majority of Altice USA share capital and liquidity
- Economic ownership and voting rights expressed in terms of shares outstanding (i.e. excluding treasury shares) as of 31-12-2017
(1) Shares owned by Altice NV indirectly through CVC 3 BV
(2) Entities controlled directly or indirectly by Patrick Drahi or Patrick Drahi’s family (A4)
(3) Holding LP is a vehicle controlled by Altice NV, with c. 6.3% of underlying Altice USA shares attributable to Altice USA management and the rest attributable to Altice NV (assuming reference share price of $21.23 as of 31-12-2017 for Altice USA)
(4) Dexter Goei (CEO), Charles Stewart (CFO) and Hakim Boubazine (COO)
(5) Including shares owned by Altice NV through CVC 3 BV and its pro rata ownership through Holding LP
(6) Including shares owned by Altice NV through CVC 3 BV, all shares owned by Holding LP (noting after the separation Holding LP will enter into a voting agreement with CVC 3 BV) and entities controlled directly or indirectly by Patrick Drahi or Patrick Drahi’s family (including A4 & Uppernext)
(7) Shares owned by the Next ANV Concert (shareholders’ agreements between Next and ANV shareholders as per section 3.7.6 of Altice N.V. 2016 Annual Report), entities controlled directly or indirectly by Patrick Drahi or Patrick Drahi’s family (A4 and Uppernext), shares owned by certain top
managers at Altice USA and Holding LP; assuming the Next ANV Concert elect to receive 100% B-Shares; total number of shares of the Next ATUS Concert will be subject to future vesting under options plan for Altice USA management organised through Holding LP
Ownership Today
100% Free Float elect to receive B-Shares
0% Free Float elect to receive B-Shares
Ownership Pro Forma
Class of Shares Percentage
A B Total Capital Voting
Altice NV (1) 5.3 490.1 495.4 67.2% 98.1%
A4 & Uppernext (2) 7.5 0.0 7.5 1.0% 0.1%
Holding LP (3) 46.2 - 46.2 6.3% 0.4%
o/w Altice NV 25.0 - 25.0 3.4% 0.2%
o/w Management (Neptune) 21.1 - 21.1 2.9% 0.2%
US Top Managers (4) 4.9 - 4.9 0.7% 0.0%
Sponsors 107.5 - 107.5 14.6% 0.9%
Free Float 75.6 - 75.6 10.3% 0.6%
Total 247.0 490.1 737.1 100% 100%
Altice NV Aggregated (5) 30.3 490.1 520.4 70.6% 98.3%
Altice Parties (6) 59.0 490.1 549.1 74.5% 98.5%
Class of Shares Percentage
A B Total Capital Voting
ATUS Next Concert (7) 69.4 247.7 317.1 43.0% 93.7%
o/w Next 10.2 235.0 245.2 33.3% 88.1%
o/w ANV Shareholders 0.6 12.7 13.2 1.8% 4.8%
o/w A4 & Uppernext 7.5 0.0 7.5 1.0% 0.1%
o/w US Top Managers 4.9 - 4.9 0.7% 0.1%
o/w Altice NV 25.0 - 25.0 3.4% 0.4%
o/w Management (Neptune) 21.1 - 21.1 2.9% 0.3%
Sponsors 107.5 - 107.5 14.6% 1.6%
Free Float 312.5 - 312.5 42.4% 4.7%
Total 489.4 247.7 737.1 100% 100%
(3)
Class of Shares Percentage
A B Total Capital Voting
Next ATUS Concert (7) 187.8 129.2 317.1 43.0% 51.2%
o/w Next ANV Concert 122.6 122.6 245.2 33.3% 47.7%
o/w ANV Shareholders 6.6 6.6 13.2 1.8% 2.6%
o/w A4 & Uppernext 7.5 0.0 7.5 1.0% 0.1%
o/w US Top Management 4.9 - 4.9 0.7% 0.1%
o/w Altice NV 25.0 - 25.0 3.4% 0.4%
o/w Management (Neptune) 21.1 - 21.1 2.9% 0.3%
Sponsors 107.5 - 107.5 14.6% 1.6%
Free Float 194.1 118.4 312.5 42.4% 47.2%
Total 489.4 247.7 737.1 100% 100%

10
Expected Separation TimetableQ2 2018 expected completion
Transaction
Execution
US Regulatory
ApprovalEstimated 90 – 120 Days (1)
April 2018:
- AFM Prospectus approval
- Form S-1 declared
effective by SEC
- Potential US prospectus
delivery
- Call for Altice NV EGM
May 2018:
- EGM
- Offer start date
- US prospectus
delivery
March 15th 2018:
- FY 2017 results
January 8th 2018:
- Separation announcement
- Form S-1 filing with SEC
Offering Prospectus AFM Approval Process
Form S-1 Review and Approval by SEC
Up to 4 months42 Days
Offer Period
c. 2 weeks
Q2 2018:
- Altice USA special
dividend payment
- Separation effective
- Distribution in kind of
Altice USA shares
(1) up to 180 days

Altice Europe Strategic Update
11

12
Altice Europe: Fully-Converged, European-Focused PlatformStrong base to deliver growth and enhanced profitability
Fully-converged fixed / mobile operator in each market
Number 1 or 2 position with nationwide coverage across all markets
Full consumer and business services provider across all markets
Fiber and mobile network leadership with strong investment commitment
100%
100%
#1 / #2
#1
Revenue growth EBITDA margin Op. FCF margin

13
Altice Europe Growth and De-leveraging StrategyReturn Europe to growth, monetize infrastructure and content investment, de-leverage
1 Operational and financial turnaround in France and Portugal
2
Monetizing content investments through various pay TV models and growing advertising revenue
3
Disposals of non-core assets
4
Optimizing performance in each market, improving customer service, maximizing lifetime customer value
5
Continuing to invest in best-in-class infrastructure
14
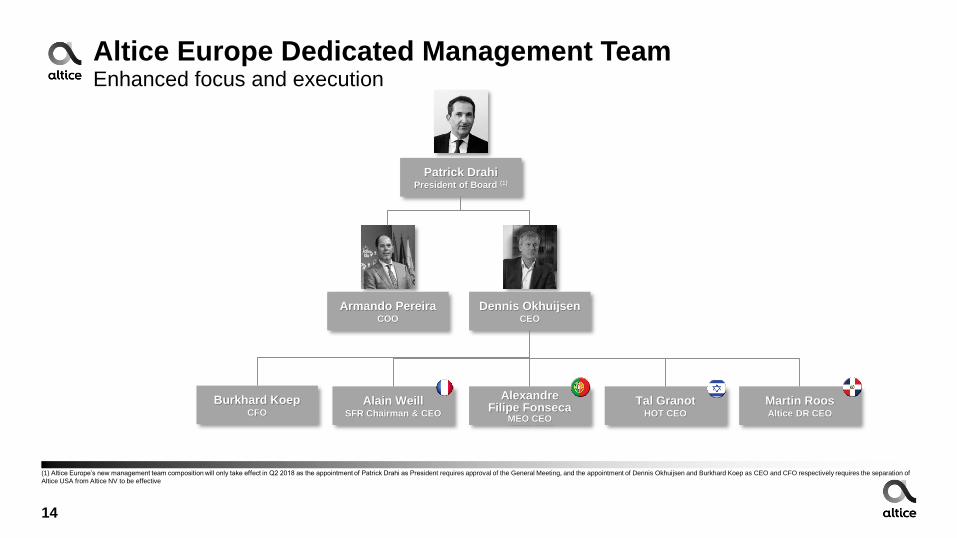
Altice Europe Dedicated Management TeamEnhanced focus and execution
Patrick DrahiPresident of Board (1)
Dennis OkhuijsenCEO
Armando PereiraCOO
Burkhard KoepCFO
Alexandre Filipe Fonseca
MEO CEO
Tal GranotHOT CEO
Martin RoosAltice DR CEO
Alain WeillSFR Chairman & CEO
(1) Altice Europe’s new management team composition will only take effect in Q2 2018 as the appointment of Patrick Drahi as President requires approval of the General Meeting, and the appointment of Dennis Okhuijsen and Burkhard Koep as CEO and CFO respectively requires the separation of
Altice USA from Altice NV to be effective

15
Altice Europe Pro Forma Group StructureNew perimeter with simplified corporate structure from H1 2018
Altice France Altice International (1) Altice Pay TV (2)
SFR Telecom
SFR Media (NextRadioTV(3) & Press)
French Overseas Territories
Support Services – integration
▬ Technical services (ATS France)
▬ Customer services (Intelcia)
Portugal (MEO)
Israel (HOT)
Dominican Republic
Teads
Support Services – integration
▬ Technical services (ATS ex-France)
Altice Content division
Major sports rights (Including Champions
League and English Premier League)
Premium content (Discovery, NBCU,
other entertainment rights)
(1) Excluding green.ch AG and Green Datacenter AG in Switzerland following disposals announced on December 1, 2017
(2) Content assets transferred from Altice International, Altice France and Altice NV
(3) NextRadioTV 49% owned by SFR Group, currently under regulatory process for a change of control
Increased accountability, operational alignment, transparency and reduction of intercompany transactions

Revenue Adjusted EBITDA Capex (2)
(€bn) (€bn) (€bn)
4.4 4.3
9M 2016 9M 2017
16
Altice Europe Pro Forma Financials on New Perimeter (1)
Strong asset base to execute turnaround
(1) See slide 15 in this presentation for details of the new perimeter for Altice Europe and the appendix of this presentation for detailed financial information for 9m 2017 on this new perimeter compared to the old Altice NV reporting perimeter
(2) Accrued Capex
(3) Excludes €407.7m of capex related to the acquisition of multi-year major sports rights
11.0 11.0
9M 2016 9M 2017
2.3 2.3
9M 2016 9M 2017
(3)

17
Altice France Business StrategyBack to Altice basics
1
Monetize content with premium subscribers2
3 Best network quality and coverage on fixed and mobile
Focus on KPIs to grow customer base
to generate best-in-class growth in revenue, EBITDA and OpFCF

OpFCF (2)
Old Perimeter (SFR Group) New Perimeter
(€bn) (€bn)
18
Altice France Financials: Old vs. New Perimeter 2018 inflection year: operational improvements to improve financial performance
Revenue
Old Perimeter (SFR Group) (1) New Perimeter
(€bn) (€bn)
11.1 11.1
2016A LTM 2017
11.0 10.9
2016A LTM 2017
1.51.3
2016A LTM 2017
• OpFCF impacted by content investment and peak capex investment in 2017 on old perimeter
• c.€300m of pay TV content expense remaining in France in 2018 after reorganization
• c.€200m negative impact in 2018 from VAT law change
• Revenue drag in Q4 2017 from B2B and low-margin wholesale and equipment revenue declines (FY 2017 revenue c.-2% YoY)
1.7 1.8c.1.6-1.7
2016A LTM 2017 2018E
VAT
impact
(c.0.2)
(1) As previously reported for Q3 2017 results
(2) OpFCF defined as Adjusted EBITDA-capex

19
Altice Pay TVMonetize content investments in a separate subsidiary with its own P&L
A new business with strong initial investment, OpFCF positive medium term
SPORT
SFR revenue share
Potential other revenue streams (e.g. OTT, advertising)
New partnership opportunities
High-value content portfolio, enhanced with UEFA rights in 2018
Etc….
20
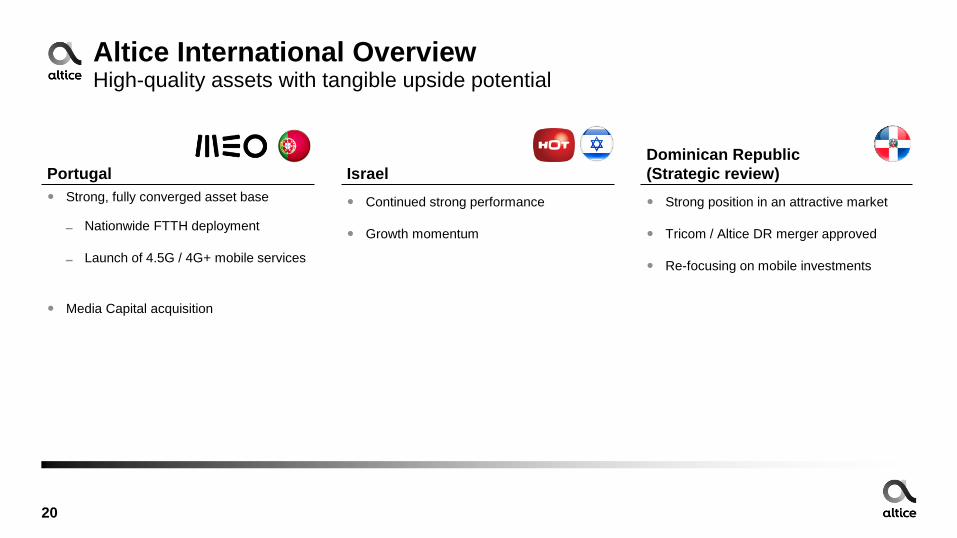
Altice International OverviewHigh-quality assets with tangible upside potential
Portugal Israel
Dominican Republic
(Strategic review)
Strong, fully converged asset base
▬ Nationwide FTTH deployment
▬ Launch of 4.5G / 4G+ mobile services
Media Capital acquisition
Continued strong performance
Growth momentum
Strong position in an attractive market
Tricom / Altice DR merger approved
Re-focusing on mobile investments

Altice Pay TVGross Debt €0.0bn
Net Debt €(0.3)bn
LTM Adj. EBITDA €(0.2)bn
100% 100%
Altice Corporate
Financing S.a.r.l. (ACF)
Gross Debt (3) €1.7bn
Net Debt (3) €1.6bn
21
Altice NV Pro Forma Debt Capital Structure (1)
Altice USA cash dividend to pay down ACF facility
Altice Lux (Europe)
restricted group
Altice France (SFR) silo
Altice International silo
Altice InternationalGross Debt €8.5bn
Net Debt €8.1bn
LTM Adj. EBITDA €1.9bn
Gross Leverage 4.4x
Net Leverage 4.2x
Undrawn RCF (2) €0.9bn
Altice France (SFR)Gross Debt €16.2bn
Net Debt €15.8bn
LTM Adj. EBITDA €4.2bn
Gross Leverage 3.8x
Net Leverage 3.7x
Undrawn RCF (2) €0.8bn
Altice Luxembourg S.A. (HoldCo)Gross Debt €6.2bn
Net Debt €6.2bn
Undrawn RCF(1) €0.2bn
(1) Pro forma for signed disposals of green.ch AG and Green Datacenter AG in Switzerland (€184m EV, announced on December 1, 2017) and acquisition of Media Capital (€440m EV, announced on July 14, 2017); and pro forma for new organisation including €550m for transfers of FOT, ATS
France and Intelcia (support services) from Altice International to Altice France (of which €300m is paid in cash and €250m vendor note which is not reflected in debt); pro forma for $1.5bn special cash dividend payment from Altice USA; Group net debt includes €400m of cash at Altice NV
(2) Pro forma for new organization: Altice France drawn for €300m. Altice Luxembourg and Altice International undrawn
(3) Total size of facility shown pro forma for prepayment of c.€625m with proceeds from Altice USA dividend
Altice NV
Top Co (Consolidated)
Gross Debt €32.6bn
Net Debt €31.0bn
Gross Leverage 5.7x
Net Leverage 5.4x
Altice Pay TV silo
100%
Altice Europe (Consolidated)Gross Debt €30.9bn
Net Debt €30.1bn
Gross Leverage 5.2x
Net Leverage 5.0x
Undrawn RCF (Consolidated) (2) €1.9bn

Altice maturity profile (€bn)
2018 2019 2020 2021 2022 2023 2024 2025 2026 2027 2028
22
Altice NV Debt Maturity Profile (1)
Long-dated maturities
0.3 0.1 0.3 1.9 8.3 2.7 2.6 5.4 10.2 - 0.7
Altice International Altice France (SFR) Altice Luxembourg Altice Corporate Financing S.à.r.l. (ACF)
Altice Europe Restricted GroupCorporate
Note: Maturity profile excluding leases/other debt (c.€290m)
(1) Pro-forma for new organisation. Includes €625m of prepayment of the ACF facility following €900m dividend from Altice US

23
Altice NV Debt Maturity and Liquidity AnalysisLong dated maturities and strong liquidity position
Long Dated Maturity Profile (1) Strong Liquidity Position
WAL of 6.6 years
WACD of 5.5%
No major maturities at SFR until 2022, and no major
maturities at Altice International until 2023
ACF maturity of 2021
Cash as of 1 January 2018 (2)
Altice USA dividend
RCF available (3)
▬ SFR
▬ Altice International
▬ Altice Luxembourg
Total
Future disposal proceeds
€1.0bn
€0.3bn
€0.8bn
€0.8bn
€0.2bn
€3.1bn
+++
(1) Pro forma for new organisation
(2) Pro forma for disposals of green.ch AG and Green Datacenter AG in Switzerland (CHF 214 million or €184m equivalent EV, announced on December 1, 2017) and acquisition of Media Capital (€440m EV, announced on July 14, 2017)
(3) Pro forma for new organization. Altice France RCF drawn for € 300m to pay for transfers from Altice International. Altice International RCF drawn for EUR 100m and Altice Luxemburg undrawn

5.4x (1)
c.4x
Current leverage Corporate actions& asset disposals
Cash flow generation EBITDA growth Target leverage
24
Altice NV Pro Forma Deleveraging ProfileMultiple de-leveraging levers: Operational focus without meaningful standalone M&A
• Tower portfolio strategic review
• Altice DR strategic review
(1) Pro forma for signed disposals of green.ch AG and Green Datacenter AG in Switzerland (€184m EV, announced on December 1, 2017) and acquisition of Media Capital (€440m EV, announced on July 14, 2017); and pro forma for new organisation including €550m for transfers of FOT, ATS
France and Intelcia (support services) from Altice International to Altice France (of which €300m is paid in cash and €250m vendor note which is not reflected in debt); pro forma for $1.5bn special cash dividend payment from Altice USA; Group net debt includes €400m of cash at Altice NV
(2) Non-recurring items such as exceptional restructuring costs in France fall away post 2018
(2)

Altice USA Strategic Update
25

Altice USA Business StrategyComplete Altice basics to be prepared for next phase of market consolidation
26
1 Complete implementation of opex efficiencies
2
3
Focus on KPIs to improve revenue growth
Full scale deployment of Altice One and fiber (FTTH) build out
to generate best-in-class growth in revenue, EBITDA and OpFCF

Altice USA Key Capital Markets ConsiderationsIncreased free float, new leverage target and new shareholder returns policy
27
1 Special dividend of $1.5bn
2
New leverage target of 4.5x to 5.0x net debt to EBITDA (reduced from 5.0x to 5.5x)
3
Reiterating efficiency targets
4
Free float of Altice USA A-shares to increase from c.10% to c.42% (1)
5
Authorized share repurchase program of $2bn
6 Fiber (FTTH) deployment and new MVNO network investment within historical capex envelope
(1) c.42% free float based on public minorities economic ownership of Altice USA A and B shares, excluding sponsors and the Next ATUS Concert

28
Altice USA Dedicated Management TeamEnhanced focus and execution
Hakim BoubazineCo-President & COO
Charlie StewartCo-President & CFO
Dexter GoeiCEO
Armando PereiraStrategic Advisor
for all Operations
Patrick DrahiChairman of
Altice USA

Altice USA Margin Progression Substantially improved margins and cash flow
29
OpFCF 1
margin16.5%
FY 2015
25.6%
FY 2016
32.8%
✓ Improved margins
✓ Dynamic and simplified organization
✓ More optimization potential
✓ Virtuous cost reduction from lower
customer activity levels
✓ Re-investments
Capex % of sales Operating free cash flow margin
YTD 2017
16.2% 15.5% 10.2% 12.1% 9.6%
13.9% 7.1% 9.8% 12.5%
14.8% 16.6% 23.3%
24.0% 28.7% 26.4%
33.8% 32.9%
31.6%
31.0% 32.1% 33.5% 36.1%
38.3% 40.3% 40.8%
42.7% 44.1%
Q3 15 Q4 15 Q1 16 Q2 16 Q3 16 Q4 16 Q1 17 Q2 17 Q3 17
(1) Accrued Capex. Capex is prepared in accordance with U.S. GAAP. Adjusted EBITDA and Adjusted EBITDA less capex (OpFCF) are non GAAP-measures. For a reconciliation, please see the Q3-17 Altice NV earnings release posted to the Altice NV website
Altice USA (1)
Adj. EBITDA margin

Altice USA Leverage, Maturity and Liquidity Analysis Rapid de-leveraging with strong liquidity position
30
Rapid De-leveraging Supporting Shareholder Returns
Net Debt / LTM EBITDA
Long-dated Maturity Profile & Strong Liquidity Position (1)
WAL life of 6.0 years
WACD of 6.2%
No material maturities at Suddenlink until 2020, and near-
term maturities at Optimum covered by a $2.3bn revolving
credit facility (currently drawn)
Available liquidity of $1.3bn
▬ $0.5bn cash
▬ $0.8bn undrawn RCF
(1) Pro forma for $1.5bn dividend as of the end of Q3 2017. Subsequent to Q3 Optimum repaid $725m of its outstanding revolver
5.6x 5.4x
7.1x
6.1x(1) 6.4x
5.3x5.8x(1)
Q2-16 Q3-17 Q4-15 Q3-17 Q3-17 Target
4.5x
to 5.0x
Altice USA
Q3-17 Q3-17Q3-17
$1.5bn
dividend

Altice USA Debt Capital StructurePer Q3 2017 as adjusted for Altice USA special cash dividend
31
Cequel (Suddenlink) silo
Cablevision (Optimum) silo
100% 100%
(1) Adjusted for $1.5bn dividend
(2) Suddenlink RCF $0.4bn undrawn minus $17m LOCs. Optimum RCF of $2.3bn minus $0.1bn LOCs and $1.7bn drawn (PF for $500m drawing for dividend). Subsequent to Q3 Optimum repaid $725m of its outstanding revolver. Undrawn RCF at Optimum is $1.2bn pro forma
for this repayment
Cablevision (Optimum) (1)
Gross Debt $16.5bn
Net Debt $16.3bn
LTM Adj. EBITDA GAAP $2.7bn
Net Leverage 6.1 x
Undrawn RCF(2) $0.5bn
Cequel (Suddenlink)
Gross Debt $6.8bn
Net Debt $6.7bn
LTM Adj. EBITDA GAAP $1.3bn
Net Leverage 5.3x
Undrawn RCF(2) $0.3bn
Altice USA (Consolidated)(1)
Gross Debt
Net Debt
Net Leverage
$23.2bn
$22.7bn
5.8x
Undrawn RCF (Consolidated)(2) $0.8bn

Altice USA Debt Maturity ProfileLong-dated maturities following pro-active refinancing activity
32
Note: Maturity profile excluding leases/other debt (c.$20m), includes RCF drawn of $1,675m for Optimum shown at maturity date. Subsequent to Q3 Optimum repaid $725m of its outstanding revolver
Altice USA maturity profile ($bn)
2018 2019 2020 2021 2022 2023 2024 2025
1.6 0.6 1.6 4.0 0.7 2.9 0.8 11.0
> 2025
$1.0

Appendix
33

34
Altice NV New vs. Old Perimeter: Revenue (1)
Altice NV (“Altice Europe”) New Perimeter Altice NV Old Perimeter
Note: Altice Europe revenue on the new perimeter excludes Altice USA, revenue from Altice NV’s international wholesale voice business (separated to be sold) amounting to a total of €101.7m, €121.1m and €80.9m for Q1 2017, Q2 2017 and Q3 2017 respectively (of which France
amounted to €61.4m, €85.3m and €50.6m for Q1 2017, Q2 2017 and Q3 2017 respectively; Portugal €30.3m, €34.0m and €19.2m respectively; Dominican Republic €17.8m, €16.6m and €14.6m respectively; Eliminations -€7.8m, -€14.8m and -€3.5m respectively). Altice Europe revenue on new perimeter also excludes green.ch AG and Green Datacenter AG in Switzerland (following disposals announced on December 1, 2017) amounting to a total of €13.6m, €13.6m and €12.7m for Q1 2017, Q2 2017 and Q3 2017 respectively
(1) Financials for 'Altice France – Media (Other)' shown in this presentation are pro forma for the sale of press titles within the AMG France business in April and October 2017, Altice France Media (Other) revenue in FY 2016 was €397m, €106m in Q4 2016 and €336m for the 9 months
ending September 2017 post these disposals
In million Euros Q1-17 Q2-17 Q3-17 In million Euros Q1-17 Q2-17 Q3-17
Revenue Revenue
France - Telecom 2,521.1 2,536.7 2,543.7 France - Telecom 2,582.5 2,622.0 2,647.3
France - Media (Other) 92.8 127.3 90.6 France - Media 95.4 130.8 109.4
FOT 42.4 43.6 35.0
Support Services (External) 15.8 23.6 20.3
Total Altice France 2,672.0 2,731.2 2,689.5 Total Altice France 2,677.8 2,752.9 2,756.7
Portugal 545.4 550.8 532.6 Portugal 572.7 575.8 566.2
Israel 261.9 265.8 251.5 Israel 261.9 265.8 251.5
Dominican Republic 164.8 159.9 157.3 Dominican Republic 182.6 176.5 170.1
Teads - - 64.2 FOT 52.7 53.8 47.9
Others 6.0 (5.7) 1.6 Others 291.9 271.2 370.1
Total Altice International 978.2 970.8 1,007.2 Total Altice International 1,361.8 1,343.0 1,405.7
Total Pay TV 8.6 7.1 12.6 Total Altice USA 2,166.0 2,112.2 1,970.2
Corporate and other (5.6) 11.3 3.9 Corporate and other 27.7 88.4 83.3
Eliminations (30.1) (21.0) (22.4) Eliminations (329.1) (350.3) (461.3)
Total Altice Europe Consolidated 3,623.0 3,699.3 3,690.8 Total Altice NV Consolidated 5,904.3 5,946.2 5,754.6

35
Altice NV New vs. Old Perimeter: EBITDA
Altice NV (“Altice Europe”) New Perimeter Altice NV Old Perimeter
Note: Altice Europe EBITDA on new perimeter excludes EBITDA from Altice NV’s international wholesale voice business (separated to be sold) amounting to a total of €2.9m, €3.3m and €2.7m for Q1 2017, Q2 2017 and Q3 2017 respectively (of which France amounted to €2.2m, €2.7m
and €2.4m for Q1 2017, Q2 2017 and Q3 2017 respectively; Portugal €0.7m, €0.5m and €0.2m respectively, and; Dominican Republic €0.0m, €0.1m and €0.1m respectively). Altice Europe EBITDA on new perimeter also excludes green.ch AG and Green Datacenter AG in Switzerland (following disposals announced on December 1, 2017) amounting to a total of €6.5m, €5.9m and €5.4m for Q1 2017, Q2 2017 and Q3 2017 respectively
In million Euros Q1-17 Q2-17 Q3-17 In million Euros Q1-17 Q2-17 Q3-17
Adjusted EBITDA Adjusted EBITDA
France - Telecom 920.1 1,049.9 1,076.0 France - Telecom 803.8 929.6 990.7
France - Media (Other) 13.5 25.3 7.2 France - Media 10.6 23.4 18.5
FOT 20.2 14.5 21.6
Total Altice France 953.9 1,089.7 1,104.8 Total Altice France 814.4 953.0 1,009.2
Portugal 262.9 253.2 248.2 Portugal 262.8 255.5 265.0
Israel 118.6 120.2 116.9 Israel 117.0 120.6 116.1
Dominican Republic 96.7 90.7 85.0 Dominican Republic 95.9 90.6 84.1
Teads - - 12.1 FOT 20.2 14.5 21.6
Others (.8) 1.2 (.5) Others 96.1 81.7 81.9
Total Altice International 477.5 465.3 461.7 Total Altice International 592.0 562.8 568.8
Total Pay TV (53.0) (63.0) (64.5) Total Altice USA 896.2 912.7 884.7
Corporate and other (44.5) 8.7 (23.3) Corporate and other (37.6) 3.4 (35.4)
Eliminations (1.2) (1.8) (8.4) Eliminations (26.8) (26.4) (69.7)
Total Altice Europe Consolidated 1,332.5 1,498.8 1,470.3 Total Altice NV Consolidated 2,238.1 2,405.5 2,357.5
36
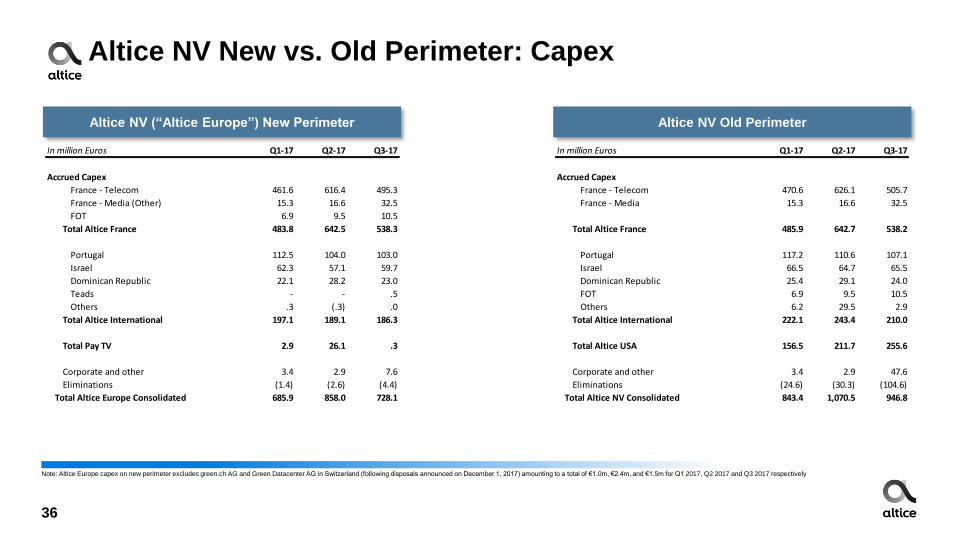
Altice NV New vs. Old Perimeter: Capex
Altice NV (“Altice Europe”) New Perimeter Altice NV Old Perimeter
Note: Altice Europe capex on new perimeter excludes green.ch AG and Green Datacenter AG in Switzerland (following disposals announced on December 1, 2017) amounting to a total of €1.0m, €2.4m, and €1.5m for Q1 2017, Q2 2017 and Q3 2017 respectively
In million Euros Q1-17 Q2-17 Q3-17 In million Euros Q1-17 Q2-17 Q3-17
Accrued Capex Accrued Capex
France - Telecom 461.6 616.4 495.3 France - Telecom 470.6 626.1 505.7
France - Media (Other) 15.3 16.6 32.5 France - Media 15.3 16.6 32.5
FOT 6.9 9.5 10.5
Total Altice France 483.8 642.5 538.3 Total Altice France 485.9 642.7 538.2
Portugal 112.5 104.0 103.0 Portugal 117.2 110.6 107.1
Israel 62.3 57.1 59.7 Israel 66.5 64.7 65.5
Dominican Republic 22.1 28.2 23.0 Dominican Republic 25.4 29.1 24.0
Teads - - .5 FOT 6.9 9.5 10.5
Others .3 (.3) .0 Others 6.2 29.5 2.9
Total Altice International 197.1 189.1 186.3 Total Altice International 222.1 243.4 210.0
Total Pay TV 2.9 26.1 .3 Total Altice USA 156.5 211.7 255.6
Corporate and other 3.4 2.9 7.6 Corporate and other 3.4 2.9 47.6
Eliminations (1.4) (2.6) (4.4) Eliminations (24.6) (30.3) (104.6)
Total Altice Europe Consolidated 685.9 858.0 728.1 Total Altice NV Consolidated 843.4 1,070.5 946.8

37
Altice Pay TV Content Cost SchedulePremium content to drive customer acquisition and long-term ARPU accretion
€m 2016A 2017E 2018E 2019E 2020E 2021E 2022E 2023E
Content expense
(incl. NBC/Discovery, Originals etc.)43 135 193 177 174 179 58 3
UEFA (incl. Champions League) - 70 105 351 351 176 - -
Other major sports
(incl. Premier League)120 135 144 22 13 3 - -
Payment to acquire intangible
assets120 206 249 373 364 178 - -
Total committed cash content costs 163 341 442 550 538 357 58 3
Total 2018 to 2023: c.€1.9bn
A new business with strong initial investment, OpFCF positive medium term