Embed Size (px)
Citation preview

ALTERNATIVE STRATEGIES
MONTHLY FUND SUMMARIES
AS AT OCTOBER 31, 2017
NORREP CAPITAL MANAGEMENT

TABLE OF CONTENTS
Fund Performance
Norrep Market Neutral Income Fund
Norrep Canadian Enhanced Equity Fund
3
4
6
By combining cutting-edge techniques to reduce risk, increasing investable cash and driving outperformance with NCM’s proven methodology, our experienced Portfolio Mangers have expanded the scope of what an investment can do, creating an opportunity to add a valuable form of diversity to your portfolio
Invest inNew Ideas
FUND PERFORMANCE SUMMARIES
Fund YTD 1Y 3Y 5Y 10Y 15YSince
Inception Inception DateFundYield1
ALTERNATIVE STRATEGIES
Norrep Market Neutral Income Fund 2.7% 1.9% -0.7% 1.7% - - 4.6% Dec 31, 2010 4.2%
Norrep Canadian EnhancedEquity Fund 15.1% 17.0% - - - - 11.5% Jan 31, 2015 2.7%
as at October 31, 2017
All performance F Series as of October 31, 2017, net of fees, annualized, unless otherwise stated. Commissions, trailing commissions, management fees and expenses all may be associated with investments. Please read the offering memorandum before investing. The indicated rates of return are the historical annual compounded total returns including changes in unit value and reinvestment of all distributions and do not take into account sales, redemption, distribution or optional charges or income tax-es payable by any securityholder that would have reduced returns. Investment funds are not guaranteed, their values change frequently and past performance may not be repeated. The rate of return is used only to illustrate the effects of the compound growth rate and is not intended to reflect the future values or returns in any Fund. These funds are available for sale to Accredited Investors, BC residents by Offering Memorandum or with a minimum purchase of $150,000 by a non-individual, and are subject to resale restrictions under applicable securities laws.
NOTES
1. Fund yields are reviewed annually and set on December 31st of each year.

PERFORMANCE
1 month 3 month 6 month YTD 1 year 3 year 5 year Inception
F 0.1% 2.4% 2.1% 2.7% 1.9% -0.7% 1.7% 4.6%
A 0.0% 2.2% 1.6% 1.8% 0.8% -1.8% 0.6% 3.5%
VALUE OF $10,000 INVESTED AT INCEPTION
$8,000
$9,000
$10,000
$11,000
$12,000
$13,000
$14,000
$15,000
$16,000
2017201620152014201320122011
$13,619
UNCORRELATED RETURNSPercentage of Positive Months Number of Positive Months Average Monthly Return
Up Markets1 54.9% 28/51 0.2%
Down Markets1 58.1% 18/31 0.7%
Overall1 56.1% 46/82 0.4%1. Based on the S&P TSX Composite Total Return Index
2017 Paid Distributions $0.321
2016 Paid Distributions $0.484
2015 Paid Distributions $0.516
2014 Paid Distributions $0.523
DISTRIBUTIONS
NORREP MARKET NEUTRALINCOME FUND
MONTHLY SUMMARY AS AT October 31, 2017
Jan Feb Mar Apr May Jun Jul Aug Sep Oct Nov Dec Total
2011 -0.8% 2.6% 1.8% -2.0% 1.9% -0.1% 0.9% 4.8% 1.7% -1.2% 2.6% -0.2% 12.3%
2012 -1.8% 1.2% 2.3% 3.3% 1.7% 1.9% 3.3% -0.8% -1.9% 1.9% -0.8% -1.9% 8.5%
2013 0.3% 1.0% 2.6% -0.1% 1.7% -0.5% 1.1% -1.3% -0.9% 3.5% 1.2% -0.7% 8.4%
2014 0.7% 2.0% 0.8% 0.2% 0.7% 0.8% 0.3% -0.8% -1.3% 2.0% -1.3% -3.4% 0.7%
2015 4.1% -2.3% 1.8% -1.9% 1.9% -0.2% 2.3% -0.6% 1.7% -2.0% 0.5% -0.6% 4.7%
2016 -1.2% -2.7% 2.0% 1.8% -1.9% 0.8% 1.0% -1.6% -1.3% -0.4% -1.0% 0.2% -4.3%
2017 -0.0% -0.3% 1.1% -0.2% -1.0% 0.2% 0.5% 1.2% 1.1% 0.1% - - 2.7%
MONTHLY PERFORMANCE
Who don’t want large-scale movements in markets to affect their investments and who want to receive a quarterly distributionFOR INVESTORS
Paid Quarterly
NAV/Share F Series: $10.26 A Series: $9.53
A Canadian absolute return fund targeting positive returns regardless of market direction, providing low volatility and targets a quarterly distribution of $0.107 to help with downside protection.
Aggregate of eligible and capital gains dividends paid. Complete list and breakdown available at norrep.com.
4
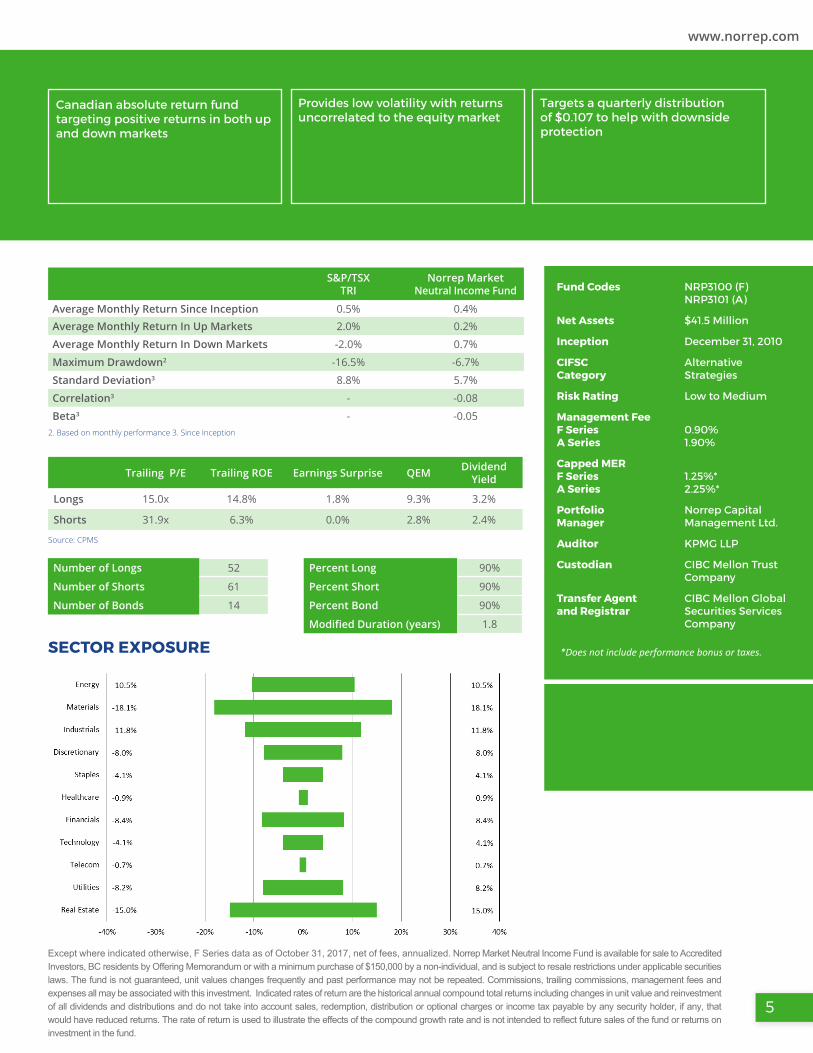
SECTOR EXPOSURE
Trailing P/E Trailing ROE Earnings Surprise QEM Dividend Yield
Longs 15.0x 14.8% 1.8% 9.3% 3.2%
Shorts 31.9x 6.3% 0.0% 2.8% 2.4%
Number of Longs 52
Number of Shorts 61
Number of Bonds 14
Percent Long 90%
Percent Short 90%
Percent Bond 90%
Modified Duration (years) 1.8
S&P/TSX TRI
Norrep Market Neutral Income Fund
Average Monthly Return Since Inception 0.5% 0.4%Average Monthly Return In Up Markets 2.0% 0.2%
Average Monthly Return In Down Markets -2.0% 0.7%
Maximum Drawdown2 -16.5% -6.7%
Standard Deviation3 8.8% 5.7%
Correlation3 - -0.08
Beta3 - -0.052. Based on monthly performance 3. Since Inception
Except where indicated otherwise, F Series data as of October 31, 2017, net of fees, annualized. Norrep Market Neutral Income Fund is available for sale to Accredited Investors, BC residents by Offering Memorandum or with a minimum purchase of $150,000 by a non-individual, and is subject to resale restrictions under applicable securities laws. The fund is not guaranteed, unit values changes frequently and past performance may not be repeated. Commissions, trailing commissions, management fees and expenses all may be associated with this investment. Indicated rates of return are the historical annual compound total returns including changes in unit value and reinvestment of all dividends and distributions and do not take into account sales, redemption, distribution or optional charges or income tax payable by any security holder, if any, that would have reduced returns. The rate of return is used to illustrate the effects of the compound growth rate and is not intended to reflect future sales of the fund or returns on investment in the fund.
Fund Codes NRP3100 (F)NRP3101 (A)
Net Assets $41.5 Million
Inception December 31, 2010
CIFSCCategory
AlternativeStrategies
Risk Rating Low to Medium
Management FeeF SeriesA Series
0.90%1.90%
Capped MERF SeriesA Series
1.25%*2.25%*
Portfolio Manager
Norrep Capital Management Ltd.
Auditor KPMG LLP
Custodian CIBC Mellon Trust Company
Transfer Agentand Registrar
CIBC Mellon Global Securities ServicesCompany
*Does not include performance bonus.
Source: CPMS
Keith Leslie, CFAChief Risk Officer and Portfolio Manager
PORTFOLIO MANAGER
www.norrep.com
*Does not include performance bonus or taxes.
Canadian absolute return fund targeting positive returns in both up and down markets
Provides low volatility with returns uncorrelated to the equity market
Targets a quarterly distribution of $0.107 to help with downside protection
5

PERFORMANCE
1 month 3 month 6 month YTD 1 year Inception
F 2.9% 9.4% 11.7% 15.1% 17.0% 11.5%
A 2.8% 9.3% 11.2% 14.2% 16.0% 10.4%
1. 2015 return begins with January 31 inception
NORREP CANADIANENHANCEDEQUITY FUND
MONTHLY SUMMARY AS AT October 31, 2017
Who want exposure to Canadian equities in a fund that has additional choices for downside protection FOR INVESTORS
2017 Paid Distributions $0.228
2016 Paid Distributions $0.321
2015 Paid Distributions $0.303
Aggregate of eligible and capital gains dividends paid. Complete list and breakdown available at norrep.com.
DISTRIBUTIONS
VALUE OF $10,000 INVESTED AT INCEPTION
$9,000
$9,500
$10,000
$10,500
$11,000
$11,500
$12,000
$12,500
$13,000
$13,500
201720162015
$13,488
Paid Quarterly
Beta represents the tendency of the fund’s return to respond to market swings. <1 means the fund has less volatile returns than the index. Correlation measures how two instruments (fund and index) move in relation to each other: +1 is perfect positive cor-relation. R-Squared is a number 0 to 100 representing the percentage of a fund’s movements explained by movements in its index. A high number indicates a more useful beta figure. Standard Deviation is a measurement of investment volatility (up and down) that illustrates how much dispersion there is from the mean. The lower the standard deviation the closer the data points are to the mean (average).
METRICS SINCE INCEPTIONBeta Correlation R-squared Standard Deviation
0.93 0.88 78.0 8.1%
NAV/Share F Series: $12.46 A Series: $12.13
A large cap Canadian equity fund that uses both long and short positions to reduce risk, while also targeting a quarterly distribution of $0.076. The Fund is ideal for experienced investors looking for innovative means to enhance returns.
6
Jan Feb Mar Apr May Jun Jul Aug Sep Oct Nov Dec Total
2015 - 4.6% 0.8% 3.1% 0.5% -1.0% 0.3% -3.8% -2.4% 1.6% 0.0% -3.9% -0.6%
2016 -0.7% -0.7% 7.0% 3.5% 1.2% -0.2% 4.8% 0.6% 0.5% -0.7% 0.0% 1.7% 17.9%
2017 -1.4% -0.5% 2.7% -0.6% -0.3% 1.6% 0.8% 2.2% 4.1% 2.9% - - 15.1%
MONTHLY PERFORMANCE

Fund Codes NRP 5100 (F)NRP 5101 (A)
Net Assets $13.0 Million
Inception January 31, 2015
CIFSC Category
AlternativeStrategies
Risk Rating Medium
Management Fee F SeriesA Series
1.00%*2.00%*
Benchmark Index S&P/TSX Composite Total Return Index
Portfolio Manager
Norrep Capital Management Ltd.
Auditor KPMG LLP
Custodian CIBC Mellon Trust Company
Transfer Agent and Registrar
CIBC Mellon Global Securities Services Company
*Does not include performance bonus.PORTFOLIO WEIGHTS
Bank of Montreal Manulife Financial Corporation
Canadian Imperial Bank of Commerce Parex Resources Inc.
Canadian National Railway Company Royal Bank of Canada
Enerplus Corp. Russel Metals Inc.
HudBay Minerals Inc. Whitecap Resources Inc.
TOP TEN HOLDINGS LISTED ALPHABETICALLY
Except where indicated otherwise, F Series data as of October 31, 2017, net of fees, annualized. Norrep Canadian Enhanced Equity Fund is available for sale to Accredited Investors, BC residents by Offering Memorandum or with a minimum purchase of $150,000 by a non-individual, and is subject to resale restrictions under applicable securities laws. The fund is not guaranteed, unit values changes frequently and past performance may not be repeated. Commissions, trailing commissions, management fees and expenses all may be associated with this investment. Indicated rates of return are the historical annual compound total returns including changes in unit value and reinvestment of all dividends and distributions and do not take into account sales, redemption, distribution or optional charges or income tax payable by any security holder, if any, that would have reduced returns. The rate of return is used to illustrate the effects of the compound growth rate and is not intended to reflect future sales of the fund or returns on investment in the fund.
Keith Leslie, CFAChief Risk Officer and Portfolio Manager
PORTFOLIO MANAGER15+14+13+5+4+0+28+1+3+7+5+0+5+0+0+G<Energy (15.3%) <Basic Materials (13.7%) <Industrials (13.4%) <Consumer Discretionary (4.5%) <Consumer Staples (4.4%) <Financials (27.7%) <Information Technology (1.3%) <Telecommunications (2.9%) <Utilities (6.9%) <Real Estate (5.2%) <Net Cash (4.7%)
www.norrep.com
Canadian Equity Fund with more choices than a standard long-only mutual fund through its use of long and short positions to provide enhanced portfolio returns with additional downside protection
In normal times, the fund will invest 130% of its assets in long positions and 30% of its assets in short positions for 100% net market exposure
Targets a quarterly distribution of $0.076
Long Positions S&P/TSX Composite Index Short Positions
Trailing P/E 14.7x 18.9x 28.5x
Trailing ROE 15.1% 12.6% 8.3%
Earnings Surprise 1.6% 1.5% -0.3%
Earnings Momentum (QEM) 9.4% 7.2% -0.9%
Dividend Yield 2.9% 2.8% 2.2%
Cash Flow / Debt 0.35 0.32 0.16
Source: CPMS
PORTFOLIO ATTRIBUTES
7

CONTACT US
Calgary Barclay CentreSuite 1100, 606 - 4 Street SWCalgary, Alberta T2P 1T1
Toronto TD North TowerSuite 4330, 77 King Street WestToronto, Ontario M5K 1H6
403.531.2650 phone1.877.531.9355 client services1.877.431.1407 sales & [email protected]
www.norrep.com
NORREP CAPITAL MANAGEMENT
FUND OF FUNDS
ALTERNATIVE INVESTMENTS
STAND ALONE FUNDS
4
5
6
Norrep Income Growth ClassCanadian equity balanced fund that blends growth, yield, and stability without sacrificing upside potential.
Norrep Energy Plus ClassAll cap Canadian energy equity fund utilizing its Calgary-based expertise to invest in the best opportunities in Canada’s oil and gas sector.
Norrep Entrepreneurs ClassDisciplined Canadian micro cap equity fund investing in underfollowed companies with a track record of success.
7 Norrep Tactical Opportunities ClassTactical balanced fund with a broad mandate to invest in the best risk/reward opportunities in Canada and around the world.
8
Norrep II ClassCanadian small cap equity fund with a disciplined and repeatable value-based investment approach.
3
NCM OPPORTUNITIES CORP.
Norrep Premium Growth ClassAll-in-one fund of funds investment solution providing access to an equity-focused portfolio of Norrep products which are continually monitored by an investment committee.
10
11
12Norrep US Dividend Plus ClassU.S. equity fund focusing on dividend paying stocks using a unique all cap approach that provides access to the world’s largest economy.
9 Norrep Global Income Growth ClassGlobal equity balanced fund that offers geographic and sector diversification, with an attractive tax-efficient yield.
14 Norrep High Income FundFixed income fund with a unique strategy of overweighting either floating rate senior secured loans or high yield corporate bonds, depending on market conditions.
Norrep Market Neutral Income FundCanadian absolute return fund targeting positive returns over reasonable time periods, regardless of market direction.
Norrep Canadian Enhanced Equity FundCanadian equity fund using an active extension strategy to provide more flexibility than a standard mutual fund.
13 Norrep Fund (closed)Canadian small cap equity fund with a disciplined and repeatable value-based investment approach.
15 Norrep Short Term Income FundDesigned specifically to preserve your wealth and generate incomein the short term. Providing better short-term yield than typical short duration products.
CORE FUNDS
Norrep Core Canadian Offers investors a portfolio of stable, high quality Canadian large cap equities. Targets an attractive long-term return with lower volatility than its index.
2 Norrep Core Global Offers investors exposure to the global markets, targeting an attractive long-term return with lower volatility than its index.
1
NCM OPPORTUNITIES CORP.
FUND OF FUNDS
S
TAN
D A
LON
E FU
NDS
A
LTER
NA
TIVE
INV
ESTM
ENTS
10
11
1213
15
14
CO
RE
FU
ND
S COR
E F
UN
DS
1
2
3
4
5
6
7
8
9
NORREP INVESTMENTS PRODUCT RANGE


![COLOURS - jcdesign.eu · MITO DIMENSIONS INDEX SYMBOL kg m3 pcs PRODUCT ILLUSTRATION COMMENTS WIDTH DEPTH HEIGHT [mm] MEETING TABLES 800 800 740 MIT10 36.0 0.107 3 column ł 50 mm,](https://img.pdfslide.us/doc/110x75/5ec15911113e1d655752a9ee/colours-mito-dimensions-index-symbol-kg-m3-pcs-product-illustration-comments-width.jpg)