Embed Size (px)
Citation preview

Alternative respiratory genes can improve
tolerance to abiotic stresses in rice
(Oryza sativa L.)
Vajira Rupika Wanniarachchi
BSc (Hons) MPhil
A thesis submitted for the degree of Doctor of Philosophy
at
The School of Biological Sciences
Flinders University of South Australia
December 2016

I
Table of contents
Table of contents I
List of figures VIII
List of tables XIII
Abstract XIV
Declaration XVI
Acknowledgments XVII
Chapter 1: General introduction
1.1 Genetic diversity and domestication of rice 1
1.2 Rice as a model system for cereals 4
1.3 Economic importance of rice 4
1.4 Salinity as a limiting factor in crop production 6
1.5 Mechanisms of salinity tolerance 8
1.6 Oxygen and nitrogen reactive species and oxidative stress in plants 12
1.7 Plant cellular respiration 17
1.8 Mitochondrial electron transport chain (mETC) in Plants 18
1.9 Alternative pathway for respiration in pants 19
1.9.1 Alternative oxidase (AOX) 20
1.9.2 Alternative NAD(P)H dehydrogenases (NDHs) 24
1.10 Mitochondrial retrograde regulation 25
1.11 Role of alternative respiratory proteins in stress tolerance 28
1.12 Alternative pathway of respiration in rice 30
1.13 Genetic engineering and value added plants 32
1.14 Gene expression diversity in plants 35
1.15 Aims of the study 37
Chapter 2: General materials and methods
2.1 Plant growth and salinity analysis 40
2.1.1 Growth facilities and conditions 40
2.1.2 Seed treatment and germination 40
2.1.3 Hydroponic systems 41
2.1.4 Measurement of plant biomass and tissue ion concentration 42

II
2.2 Molecular analysis 43
2.2.1 Extraction of nucleic acid from plant tissues 43
2.2.1.1 Total RNA 43
2.2.1.2 Genomic DNA 44
2.2.2 Polymerase chain reaction (PCR) 45
2.2.3 Agarose gel electrophoresis 46
2.2.4 Complementary DNA (cDNA) synthesis 46
2.2.5 Reverse transcription polymerase chain reaction (RT- PCR) 47
2.2.6 Colony PCR 47
2.2.7 Isolation and purification of plasmid DNA 48
2.2.8 Diagnostic restriction digestion 49
2.2.9 Preparation of electro-competent cells 49
2.2.10 Gateway cloning system 50
2.2.11 Transformation of plasmid DNA into E.coli strain DH10B 50
2.2.12 Transformation of plasmid DNA into A. tumefaciens strain AGL1 51
2.2.13 DNA sequencing 51
2.2.14 Preparation of glycerol stock cultures 51
2.3 Gene expression analysis 52
2.3.1 Gene nomenclature 52
2.3.2 Primer designing 52
2.3.3 Preparation of qRT-PCR standards 53
2.3.4 Quantitative Reverse Transcription Polymerase Chain
Reaction (qRT-PCR) 56
2.3.5 Reference gene selection for normalization of qRT-PCR data 56
2.4 Protein analysis and enzyme activity assays in isolated
mitochondria 57
2.4.1 Isolation and purification of mitochondria 57
2.4.2 Respiratory Assays 59
2.4.2.1 Alternative oxidase activity assay 59
2.4.2.2 Alternative dehydrogenase activity assay 59
2.4.3 Determination of protein concentration 60
2.4.4 Antibody designing and testing 60
2.4.5 Antibody dot blot technique 60
2.4.6 Western blot analysis 61
2.4.6.1 Preparation of 10% SDS-PAGE gel 61
2.4.6.2 Sample preparation and separation 62

III
2.4.6.3 Transferring the protein from the gel to the membrane 633
2.4.6.4 Visualization of proteins in membranes 63
2.4.6.5 Antibody staining 64
2.4.7 Stripping membrane for re-probing 64
2.4.8 Coomassie blue staining 65
2.5 Data analysis 65
Chapter 3: Alternative pathway of respiration in rice: Identification and
characterization
3.1 Introduction 66
3.2 Materials and methods 69
3.2.1 Identification of alternative pathway (AP) genes in rice 69
3.2.2 Identification of conserved regions/domains in rice AP genes 70
3.2.3 Determination of subcellular localizations of AP genes 70
3.2.4 Phylogenetic analysis 70
3.2.5 Exon-intron structural polymorphism in rice AP genes 71
3.2.6 Exon-intron gene structural polymorphism among different
rice species 72
3.2.7 Screening for stress responsive AP genes in rice 72
3.2.8 Search for conserved cis-acting regulatory motifs in rice AP genes 72
3.3 Results 75
3.3.1 Both AOXs and NDHs were identified in japonica rice 75
3.3.2 Both AOXs and NDHs were identified in indica rice 75
3.3.3 AOX proteins were identified as members of the Ferritin-like
superfamily 77
3.3.4 NDH proteins were identified as members of the Pyr-redox
superfamily 77
3.3.5 All rice AOX proteins are predicted be targeted only to mitochondria
while some NDH proteins are predicted to be dual targeted 83
3.3.6 Protein phylogeny reveals that rice AOX proteins can be grouped
into four subfamilies along with other monocot species 85
3.3.7 Protein phylogeny reveals that rice NDH proteins can be grouped
into three families along with other monocot species 85
3.3.8 Exon-intron structure polymorphism in AP genes is present
within and between species 88

IV
3.3.9 Exon-intron structural polymorphism in AOX1a is higher than
that of NDB2 among different rice species 96
3.3.10 Three reference genes were selected for normalization of
qRT-PCR data 99
3.3.11 Transcript abundance of rice AP genes change in response
to chemical disruption of the mETC 101
3.3.12 Functional elements of Arabidopsis AOX1a and NDB2 promoters
were also found to be present in rice AOX1a and NDB2 105
3.4 Discussion 107
Chapter 4: Expression of rice alternative respiratory pathway genes under
salt stress
4.1 Introduction 118
4.2 Materials and methods 119
4.2.1 Plant material and growth conditions 119
4.2.2 Screening for salt-tolerance 120
4.2.3 Measurement of biomass and tissue ion concentrations 120
4.2.4 Analysis of transcript abundance 120
4.2.5 Analysis of relative abundance of proteins in isolated mitochondria 121
4.2.6 Enzyme activity assays in isolated mitochondria 121
4.3 Results 122
4.3.1 Physiological responses of two rice cultivars under salinity stress 122
4.3.2 Alteration of transcript abundance of alternative respiratory
pathway genes in response to salinity stress 125
4.3.3 Protein levels of alternative respiratory pathway in response
to salinity stress 130
4.3.3.1 Changes in AOX protein abundance 130
4.3.3.2 Changes in NDB2 protein abundance 134
4.3.4 Alternative respiratory pathway enzyme activity in response
to salinity stress 138
4.3.4.1 Changes in oxygen consumption rates across cytochrome
and AOX pathway in response to salinity stress 138
4.3.4.2 Changes in NAD(P)H oxidation in response to salinity stress 139
4.4 Discussion 140

V
Chapter 5: Differential sensitivity of rice cultivars to salinity stress and cultivar
variation in the expression of alternative respiratory pathway genes
5.1 Introduction 149
5.2 Materials and methods 152
5.2.1 Plant materials 152
5.2.2 Salinity tolerance assay 152
5.2.2.1 Screening for salt-tolerance 153
5.2.2.2 Measurements of biomass and tissue ion concentration 153
5.2.3 Gene expression analysis 153
5.2.4 Statistical analysis 155
5.3 Results 155
5.3.1 Differential responses of rice cultivars to salt stress 155
5.3.2 Cultivar variation in plant biomass production 156
5.3.3 Tissue and cultivar variation in Na+ and K+ accumulation 158
5.3.3.1 Tissue and cultivar variation in K+ accumulation 158
5.3.3.2 Tissue and cultivar variation in Na+ accumulation 160
5.3.4 Cultivar variation in growth responses to tissue ion accumulation 162
5.3.4.1 Cultivar variation in root growth and Na+ accumulation 162
5.3.4.2 Cultivar variation in shoot growth and Na+ accumulation 163
5.3.5 Cultivar variation in plant growth and Na+/K+ ratio 164
5.3.5.1 Cultivar variation in shoot growth and Na+/K+ ratio 165
5.3.5.2 Cultivar variation in root growth and Na+/K+ ratio 166
5.3.6 Cultivar variation in the expression of alternative pathway
genes under salinity stress 167
5.3.6.1 Cultivar variation in the expression of AOX1 isoforms 167
5.3.6.2 Cultivar variation in the expression of NDB isoforms 169
5.3.6.3 Cultivar variation in expression of NDA isoforms and NDC1 171
5.3.7 Cultivar variation in the expression of antioxidant defence genes
MnSOD and CAT-A under salinity stress 174
5.3.8 Correlation between the expression of AP genes, tissue ion
accumulation and relative growth 176
5.3.9 Correlation between the expression of alternative respiratory
pathway genes and the antioxidant defence genes 177
5.4 Discussion 180

VI
Chapter 6: Generation and characterization of transgenic rice carrying salt-
responsive Arabidopsis alternative respiratory genes, AtAOX1a
and AtNDB2
6.1 Introduction 186
6.2 Materials and methods 188
6.2.1 Plasmid vectors used in the study 188
6.2.2 Identity verification of plasmid vectors 192
6.2.2.1 Identity verification of Gateway® entry clone carrying AtAOX1a 192
6.2.2.2 Identity verification of Gateway® entry clone carrying AtNDB2 192
6.2.2.3 Identity verification of pIPKb003 overexpression vector 193
6.2.3 Generation of genetic constructs via LR cloning 193
6.2.4 Generation of transgenic rice carrying AtAOX1a and AtNDB2 194
6.2.4.1 Callus induction and proliferation 194
6.2.4.2 Production and selection of transgenic rice carrying AtAOX1a 194
6.2.4.3 Production and selection of transgenic rice carrying AtNDB2 195
6.2.5 Segregation analysis of putative T1 transgenic rice 195
6.2.6 Evaluation of transgenic rice carrying AtAOX1a or AtNDB2
genes under salt stress 196
6.3 Results 198
6.3.1 Identities of Gateway® entry clones and pIPKb003
overexpression vector were confirmed by both colony
PCR and diagnostic restriction digestion 198
6.3.2 Identities of genetic constructs carrying Arabidopsis
salt-responsive genes were confirmed by colony PCR,
diagnostic restriction digestion as well as by sequencing 200
6.3.3 Transgenic rice carrying Arabidopsis salt-responsive
genes were generated and confirmed by PCR 204
6.3.3.1 Integration and expression of transgenes in T0
plants were confirmed by PCR and RT-PCR 206
6.3.3.2 The majority of transgenic rice lines showed normal
phenotype similar to wild type under normal growth conditions 208
6.3.4 Inheritance of transgenes into T1 generation was confirmed
by PCR analyses 210
6.3.5 Transgenic rice showed a tendency towards the improvement
of grain yield under salinity stress 212
6.4 Discussion 216

VII
Chapter 7: General discussion
7.1 Summary and major findings 221
7.1.1 Rice alternative pathway for respiration consists of
AOXs and NDHs that are responsive to oxidative stress induced
by the disruption of mETC 221
7.1.2 Rice alternative respiratory genes are responsive to
environmental stresses like high salinity and show tissue
specific expression 223
7.1.3 Contrasting genotypic and tissue-specific variation exists in
physiological and molecular responses amongst rice cultivars
in response to salinity stress 225
7.1.4 Transgenic rice overexpressing AtAOX1a and AtNDB2 were
successfully generated 227
7.2 Conclusions 229
Appendix 230
Bibliography 250

VIII
List of figures
Figure 1.1 Parallel domestication of two rice species 2
Figure 1.2 Subpopulation structure in Asian rice O. sativa 3
Figure 1.3 Cereal crop production targets 5
Figure 1.4 Illustration of the two phase growth response of plant under
salinity stress 9
Figure 1.5 A schematic diagram showing major stresses that plants
suffer under high salinity growth condition and the corresponding
responses plants use in order to survive these detrimental effects 11
Figure 1.6 Main sites of reactive oxygen species (ROS) production in
plant cells and involvement of major antioxidative enzymes) 13
Figure 1.7 Sources and targets of reactive oxygen species (ROS) 14
Figure 1.8 The metabolic interplay between auxin and hydrogen peroxide
to control plant growth, development and stress tolerance 15
Figure 1.9 Diagram of cellular respiration 18
Figure 1.10 The alternative respiratory pathway in the plant mitochondrial
electron transport chain 20
Figure 1.11 Crystal structure of trypansomal alternative oxidase (TAO) 23
Figure 1.12 Potential signalling pathways for plant MRR 26
Figure 2.1 Rice seedlings growing on mini hydroponic systems 41
Figure 2.2 Separation of mitochondria by Percoll discontinuous
density gradient centrifugation 58
Figure 2.3 Set up for a gel “sandwich” to transfer protein from the
SDS-PAGE gel to the nitrocellulose membrane 63
Figure 3.1 The traditional and alternative respiratory enzymes in plant
mitochondrial electron transport chain 68
Figure 3.2 A multiple sequence alignment of full length AOX protein
from Arabidopsis, japonica and indica rice 79
Figure 3.3 A multiple sequence alignment of full length NDA proteins
from Arabidopsis, japonica and indica rice 80
Figure 3.4 A multiple sequence alignment of full length NDB proteins
from Arabidopsis, japonica and indica rice 81
Figure 3.5 A multiple sequence alignment of full length NDC proteins
from Arabidopsis, japonica and indica rice 82
Figure 3.6 Representative protein phylogenetic tree of monocot species
with AOX protein sequences showing four major clades,
AOX1a, AOX1b, AOX1c and AOX1d 86

IX
Figure 3.7 Representative protein phylogenetic tree of monocot
species with NDH protein sequences showing three major
clades, NDA, NDB and NDC 87
Figure 3.8 Comparison of exon-intron structure of AOX1a gene
from Arabidopsis, japonica and indica rice 89
Figure 3.9 Comparison of exon-intron structure of AOX1b gene
from Arabidopsis, japonica and indica rice 89
Figure 3.10 Comparison of exon-intron structure of AOX1c gene
from Arabidopsis, japonica and indica rice 90
Figure 3.11 Comparison of exon-intron structure of AOX1d gene
from Arabidopsis, japonica and indica rice 90
Figure 3.12 Comparison of exon-intron structure of NDA1 gene
from Arabidopsis, japonica and indica rice 91
Figure 3.13 Comparison of exon-intron structure of NDA2 gene
from Arabidopsis, japonica and indica rice 91
Figure 3.14 Exon-intron structure of NDB3 in japonica and indica rice 93
Figure 3.15 Comparison of exon-intron structure of NDB1 gene
from Arabidopsis, japonica and indica rice 94
Figure 3.16 Comparison of exon-intron structure of NDB2 gene
from Arabidopsis, japonica and indica rice 94
Figure 3.17 Comparison of exon-intron structure of NDB3 gene
from Arabidopsis, japonica and indica rice 95
Figure 3.18 Comparison of exon-intron structure of NDC1 gene
from Arabidopsis, japonica and indica rice 95
Figure 3.19 Exon-intron structural organization of AOX1a gene in
different rice species 97
Figure 3.20 Exon-intron structural organization of NDB2 gene in
different rice species 98
Figure 3.21 Mean Cq values in different cDNA samples from
different candidate reference genes 100
Figure 3.22 Summary of the subcellular localization of NDH proteins
in Arabidopsis, japonica and indica rice 108
Figure 3.23 Loss of intron 2 from the conserved structure and evolution
of exon-intron structure with 3 exons interrupted by 2 introns 109
Figure 3.24 Loss of intron 3 from the conserved structure and evolution
of exon-intron structure with 3 exons interrupted by 2 introns 110
Figure 3.25 Exon-intron structural organization of AOX1b gene in
different rice species 111

X
Figure 3.26 Exon-intron structural organization of NDA1 gene in
different rice species 113
Figure 4.1 Comparative growth analysis for assessing relative salinity
tolerance in seedlings of two rice cultivars, Nipponbare and Langi 123
Figure 4.2 Comparative analysis of tissue ion accumulation for
assessing relative salinity tolerance in seedlings of two
rice cultivars, Nipponbare and Langi 124
Figure 4.3 Comparative study of expression of AOX isoforms in two
rice cultivars, Nipponbare and Langi, under salt-treated
and non-treated conditions 126
Figure 4.4 Comparative study of expression of NDB isoforms in two rice
cultivars, Nipponbare and Langi, under salt-treated
and non-treated conditions 128
Figure 4.5 Comparative study of expression of NDA and NDC
isoforms in two rice cultivars, Nipponbare and Langi,
under salt-treated and non-treated conditions 129
Figure 4.6 Detection of rice AOX protein in mitochondria isolated from
salt-treated and control roots by the monoclonal AOA antibody 131
Figure 4.7 Detection of rice AOX protein in mitochondria isolated from
salt-treated and control shoots by the monoclonal AOA antibody 132
Figure 4.8 Transcript abundance of AOX isoforms in salt-treated and
non-treated roots and shoots of cv Nipponbare over a
period of 15 days 133
Figure 4.9 Detection of NDB2 protein in seedling mitochondria 134
Figure 4.10 Detection of rice NDB2 protein in mitochondria isolated
from salt-treated and control shoots by the polyclonal NDB2
antibody developed during the current study 136
Figure 4.11 Transcript abundance of NDB2 in salt-treated and non-treated
roots and shoots from cv Nipponbare over a period of 15 days 137
Figure 4.12 Average oxygen consumption rates for mitochondria isolated
from salt-treated and non-treated shoot and root tissues 138
Figure 4.13 NAD(P)H oxidation in mitochondria isolated from salt-treated
and non-treated root and shoot tissues 139
Figure 4.14 Transcriptional level expression of AOX isoforms in different
rice cultivars in response to salinity stress 142
Figure 4.15 Transcriptional level expression of NDB isoforms in different
rice cultivars in response to salinity stress 147

XI
Figure 4.16 Transcriptional level expression of NDA isoforms and NDC1
in different rice cultivars in response to salinity stress 148
Figure 5.1 The differential sensitivity of plant species to elevated salinity 149
Figure 5.2 Representative image showing growth reduction and leaf tip
senescence in salt-treated rice seedlings 156
Figure 5.3 Cultivar variation in relative shoot and root dry biomass
production of rice seedlings grown under salt stress 157
Figure 5.4 K+ accumulation in roots (A) and shoots (B) from 16 different
cultivars grown under 50 mM NaCl for 2 days followed by
120 mM NaCl for further 10 days on hydroponic culture system 159
Figure 5.5 Na+ accumulation in roots (A) and shoots (B) from 16 different
cultivars grown under 50 mM NaCl for 2 days followed by
120 mM NaCl for further 10 days on hydroponic culture system 161
Figure 5.6 Effect of Na+ accumulation on root growth of seedlings grown
under 50 mM NaCl for 2 days followed by 120 mM NaCl for
further 10 days on hydroponic culture system 162
Figure 5.7 Effect of Na+ accumulation on shoot growth of seedlings
grown under 50 mM NaCl for 2 days followed by 120 mM
NaCl for further 10 days on hydroponic culture system 163
Figure 5.8 Cultivar variation in shoot growth and Na+/K+ of 16 cultivars
grown under 50 mM NaCl for 2 days followed by 120 mM
NaCl for further 10 days on hydroponic culture system 165
Figure 5.9 Cultivar variation in root growth and Na+/K+ of 16 cultivars
grown under 50 mM NaCl for 2 days followed by 120 mM
NaCl for further 10 days on hydroponic culture system 166
Figure 5.10 Comparative transcriptional study of AOX1 isoforms in
non-stressed and salt-stressed tissues from selected rice
cultivars grown on hydroponic culture system for nine days
under treatment 168
Figure 5.11 Comparative transcriptional study of NDB isoforms in
non-stressed and salt-stressed tissues from selected rice
cultivars grown on hydroponic culture system for nine days
under treatment 170
Figure 5.12 Comparative transcriptional study of NDA isoforms and NDC1
in non-stressed and salt-stressed tissues from selected rice
cultivars grown on hydroponic culture system for nine days
under treatment 172

XII
Figure 5.13 Comparative transcriptional study of antioxidant defence
genes in non-stressed and salt-stressed tissues from
selected rice cultivars grown on hydroponic culture system
for nine days under treatment 175
Figure 6.1 Schematic representation of Gateway® entry clone
carrying AtAOX1a gene 189
Figure 6.2 Schematic representation of Gateway® entry clone
carrying AtNDB2 gene 190
Figure 6.3 Schematic representation of pIPKb003 overexpression vector 191
Figure 6.4 Experimental set up for the evaluation of transgenic rice
under salinity stress in controlled (greenhouse) conditions 197
Figure 6.5 Diagnostic restriction digests of entry clones and pIPKb003
overexpression vector used to generate genetic constructs 199
Figure 6.6 Schematic representation of AtAOX1a
overexpression/destination clone 201
Figure 6.7 Schematic representation of AtNDB2
overexpression/destination clone 202
Figure 6.8 Diagnostic restriction digests to confirm the identity
of genetic constructs/destination clones used in
Agrobacterium transformation of rice 203
Figure 6.9 Steps in generation of transgenic rice through tissue culture 205
Figure 6.10A Representative gel images showing PCR analyses of T0
plants carrying AtNDB2 to confirm the presence of transgene 206
Figure 6.10B Representative gel image showing PCR analyses of T0
plants carrying AtAOX1a to confirm the presence of transgene 206
Figure 6.11A Representative gel image showing expression analyses of T0
plants carrying AtNDB2 to confirm the expression of transgene 207
Figure 6.11B Representative gel image showing expression analyses
of T0 plants carrying AtAOX1a to confirm the expression
of transgene 207
Figure 6.12 Phenotypes of transgenic rice plants transformed with
Arabidopsis alternative pathway genes, AOX1a and NDB2 209
Figure 6.13 Representative gel images showing PCR analyses of T1
plants carrying AtNDB2 to confirm the presence of transgene 210
Figure 6.14 Representative gel images showing PCR analyses of T1
plants carrying AtAOX1a to confirm the presence of transgene 211

XIII
List of tables
Table 2.1 Primers used in molecular analysis of AtAOX1a
and AtNDB2 genes 47
Table 2.2 Details of primers used for qRT-PCR analysis 54
Table 2.3 Details of reference gene primers used in the study 55
Table 3.1 Details of rice species used in the study of exon-intron
structural polymorphism in AOX1a and NDB2 genes 74
Table 3.2 Alternative respiratory pathway genes identified in japonica
and indica rice 76
Table 3.3 Subcellular localization of identified alternative respiratory
proteins from japonica and indica rice 84
Table 3.4 Coefficient of variation (CV) of Cq values from different
reference genes 99
Table 3.5 Transcript level changes of alternative respiratory genes
in shoots when traditional ETC was chemically inhibited 103
Table 3.6 Transcript level changes of alternative respiratory genes in
roots when traditional ETC was chemically inhibited 104
Table 3.7 Summary of the conserved cis–acting regulatory motifs
predicted to be present in rice AOX and NDH promoter
regions, which were found to be functional in Arabidopsis
AOX1a and NDB2 106
Table 5.1 Details of rice genotypes/cultivars used in the study 154
Table 5.2 Correlation of the expression of alternative respiratory
pathway genes and tissue ion accumulation of seven rice
cultivars grown under 120 mM salinity stress for 9 days 178
Table 5.3 Correlation of the expression of alternative pathway genes
and the expression of antioxidant defence genes, MnSOD
and CAT-A of seven rice cultivars grown under 120 mM
salinity stress for 9 days 179
Table 6.1 Segregation analysis of T1 generation of AtNDB2 and
AtAOX1a transgenic lines based on PCR 211
Table 6.2 Growth and yield analysis of transgenic lines carrying
Arabidopsis salt-responsive genes AtAOX1a or AtNDB2
under 30 mM NaCl stress applied with the start of
panicle initiation 214
Table 6.3 Leaf Na+ and K+ accumulation in seedlings grown under
30 mM NaCl stress for one month 215

XIV
Abstract
The non-phosphorylating alternative respiratory pathway (AP) for plants, which consists
of two protein groups, alternative dehydrogenases (NDHs) and alternative oxidases
(AOXs), has become an area of research interest due to its potential role during stress
tolerance. Although the physiological functions of AOXs have been extensively studied
those of NDHs are largely unclear and less is known about their responses to abiotic
stresses. The main objective of this study was to investigate whether the alterations in
AP genes could infer tolerance to abiotic stresses in cereal crops, using rice a model
cereal. To achieve this, it was first necessary to identify all candidate genes encoding
members of this pathway in rice. To explore the role of AP in stress in rice two
approaches were taken; 1. Examine the expression of AP genes in different varieties
of rice with varied tolerance to salt and 2. Development of transgenic lines of rice
overexpressing AP genes and assess impact of growth under salt stress.
Database screening of the rice genome revealed that both AOX and NDH genes are
present in rice. NDH grouped into three distinct families, NDA, NDB and NDC, as in
Arabidopsis, but AOX2 type gene was absent. Co-expression of AP genes was
observed in response to chemical inhibition of the cytochrome pathway of the
mitochondrial electron transport chain, suggesting potential co-regulation. Analysis of
promoter regions revealed that these genes share common cis-acting regulatory
elements, previously found to be functional in Arabidopsis. However, functional
analysis of them in rice is yet be investigated.
A number of rice AP genes was co-expressed in response to salinity stress also. A
comparative study of two contrasting rice cultivars, Nipponbare and Langi, further
revealed the existence of cultivar and tissue-dependent variation in gene expression.
As found in other species, AOX proteins exist as homodimers in rice and the reduced
(active) form was found to be predominant in mitochondria from salt-stressed tissues

XV
while the oxidized (inactive) form was more abundant in non-stressed tissues,
suggesting post-translational regulation of AOX may be more important in rice than
protein levels per se. A novel polyclonal antibody raised against NDB2 showed a higher
abundance of NDB2 in salt-treated shoots than in non-treated shoots, suggesting
NDB2 might be important in salinity tolerance responses. However, in contrast to
shoots, corresponding bands were not detected in either salt-treated or non-treated
roots. This suggests the possibility of having different post-translational regulations in
shoots and roots in rice. However, this needs to be further investigated.
A study on 16 different rice cultivars revealed the existence of wide genotypic and
tissue-specific variation in gene expression and tolerance mechanisms in response to
salinity stress. Expression of AOX1a and NDA2 in leaf tissues showed a strong positive
correlation with tissue Na+ content. But, there was no correlation between AP gene
expression and shoot growth. In fact, the expression of AOX1c and NDB2 in roots
revealed strong negative correlation with relative growth of roots. Although it is possible
that some AP components play a certain role in salinity tolerance in some cultivars,
transcriptional data did not reveal any particular trend in AP gene expression in
response to salinity stress amongst the cultivars tested, suggesting AP gene
expression levels may not be good molecular markers for salt tolerance in rice.
Transgenic rice plants overexpressing salt-responsive AtAOX1a or AtNDB2, driven by
the rice actin-1 promoter were successfully generated via Agrobacterium-mediated
transformation. Yield performances of segregating transgenic lines under salinity stress
were evaluated at panicle initiation stage, and a significant reduction of empty seed
production was revealed in some transgenic lines compared to their controls,
suggesting a possible increase in tolerance to high salinity. This result suggests that
overexpression of heterologous stress-responsive genes could be a potential avenue
for improving rice towards a particular stress tolerance, however this needs
confirmation when homozygous lines have been selected.

XVI
Declaration
I certify that this thesis does not incorporate without acknowledgment any material
previously submitted for a degree or diploma in any university; and that to the best of
my knowledge and belief it does not contain any material previously published or written
by another person except where due reference is made in the text.
………………………………
Vajira Rupika Wanniarachchi
Date:

XVII
Acknowledgments
I am thankful to many people who helped me to complete my PhD project successfully.
First of all, I would like to express my thanks and gratitude to my PhD supervisors,
Assoc. Prof, Kathleen Soole, Prof. David Day, Assoc. Prof Colin Jenkins and
Dr. Yuri Shavrukov for their ideas, helpful discussions, guidance, encouragements and
inspirations throughout entire PhD process, which helped to shape my scientific growth.
A special thank goes to Dr. Yuri Shavrukov for helping me to get access to research
facilities at Plant Accelerator and Australian Centre for Plant Functional genomics,
Waite Campus, South Australia.
I must also thank Flinders University of South Australia and the Grains Research and
Development Corporation for providing financial support through Flinders University
Research Scholarship and the Grains Industry Research Scholarship, which have
allowed me to undertake a PhD and to be able to carry out this research. I also
acknowledge the Yanco Agricultural Institute, New South Wales Department of Primary
Industries for providing me with rice genotypes.
I would like to thank all my fellow lab mates and friends from combined plant research
lab, School of Biological Sciences for all the fun, invaluable discussions, help and
support that really made my PhD experience rewarding and exciting.
Finally, a huge thank you goes to my husband, Dinesh and to my lovely daughters,
Imalshi and Sanithi, who has shared this journey with me with patience, love and
support.

Chapter 1
1
1 General introduction
1.1 Genetic diversity and domestication of rice
Rice is an annual crop with around 3 to 6 months of life cycle that varies depending
on the cultivar and the environment in which it grows. The mature plant has a main
stem and several tillers that later bear terminal flowering heads and panicles. Rice
completes two distinguishable phases during their life cycle; a vegetative phase and
a reproductive phase. The vegetative phase includes germination, early seedling
growth and tillering. The reproductive phase is subdivided into the time before and
after heading, that is, panicle exsertion and the ripening period (Maclean et al., 2002).
Rice is a member of the Family Poaceae (or Gramineae), belonging to the genus
Oryza, which consists of more than 20 wild species and two cultivated species. The
cultivated species, O. sativa (Asian rice) and O. glaberrima (African rice) are diploid
(2n=24) and have an AA genome (Brar and Khush, 1997; Khush, 1997). Wild species
have either 2n=24 or 2n=48 chromosomes representing AA, BB, CC, BBCC, CCDD,
EE, FF, GG and HHJJ genomes (Brar and Khush, 1997; Khush, 1997).
The history of rice domestication has long been a subject of debate. It is believed that
the cultivated species originated from a common ancestor with an AA genome and
became domesticated through two parallel evolutionary pathways (Figure 1.1)
(Khush, 1997; Chang, 2003; Purugganan, 2014). The present day rice O. sativa is
believed to be domesticated from Asian common wild rice, O. rufipogon while African
rice was domesticated from O. barthii (Khush, 1997; Molina et al., 2011; Purugganan,
2014). A number of genetic studies using molecular markers or DNA sequence
information have also revealed that O. sativa cultivars are more closely related to O.
rufipogon than to any other Oryza species (Lu et al., 2002; Rakshit et al., 2007). It is
obvious that during domestication, morphological and physiological traits were altered
in response to human selection (Purugganan, 2014).

Chapter 1
2
Figure 1.1 Parallel domestication of two rice species (Purugganan, 2014)
O. sativa and O. glaberrima represent parallel domestications on two different continents.
Around 9,000 years ago, wild O. rufipogon was domesticated in Asia and evolved into
O. sativa. Around 3,000 years ago, O. barthii was cultivated in Africa, leading to the evolution
of O. glaberrima. Kya-thousand years ago (Purugganan, 2014).
Asian rice, O. sativa, is one of world’s oldest and most important crop species and is
believed to have been domesticated ∼9,000 years ago (Molina et al., 2011;
Purugganan, 2014). It is grown all over the world while O. glaberrima is cultivated only
in part of Africa. Traditionally, two major sub species, japonica and indica, have been
identified in Asian rice based on their morphological characters and responses to
chemicals (Oka, 1974; Kovach et al., 2009; Molina et al., 2011). These two groups
are different from each other in their adaptation to climatic, ecogeographic and cultural
conditions (Chang, 2003). Japonica varieties are cultivated in both lowland and high-
elevation upland areas of tropical South East (SE) Asia, and in colder, temperate
climates, including north eastern Asia, Europe, Western US, Chile and Australia.
Indica varieties are mainly grown in lowland areas throughout South and SE Asia and

Chapter 1
3
China (Zhao et al., 2010). Studies based on genetic variation of Asian rice came up
with broad classification system, which categorises Asian rice into five
subpopulations; indica, aus, temperate japonica, tropical japonica and aromatic. Of
these five subpopulations, indica and aus belong to the indica varietal group whereas
tropical japonica, temperate japonica and aromatic are closely related to the japonica
varietal group (Garris et al., 2005; Caicedo et al., 2007; Kovach et al., 2007; Zhao et
al., 2010) (Figure 1.2).
Figure 1.2 Subpopulation structure in Asian rice O. sativa (Garris et al., 2005; Kovach et al., 2007)
Characterization is based on the presence of deep genetic differentiation in O. sativa using
genetic markers or DNA sequence information. The tree clearly illustrates the major division
between the two varietal groups (indica and japonica), and their further subdivision into five
groups, indica, aus, tropical japonica, temperate japonica and aromatic (Garris et al., 2005;
Kovach et al., 2007).

Chapter 1
4
1.2 Rice as a model system for cereals
Rice (Oryza sativa L.) is recognized as an ideal model system for genome research
in monocots and cereals based on several key features (Delseny et al., 2001;
Shimamoto and Kyozuka, 2002). It has the smallest genome (430 Mb approximately)
(Arumuganathan and Earle, 1991; Delseny et al., 2001) compared to other major
cereals such as sorghum (750 Mb), maize (2400 Mb), barley (4900 Mb) and wheat
(16,000 Mb) (Sasaki and Sederoff, 2003; Bennetzen et al., 2005). The rice genome
was completely sequenced by the International Rice Genome Sequencing Project in
2004 (IRGSP, 2005) and now is publicly available providing researchers an invaluable
resource for genomic comparison studies. Further, the rice genome shows a close
relatedness to other major cereals. Comparative mapping studies have revealed that
synteny and gene homology are highly conserved between rice and other cultivated
cereals. Rice contains 98% of known protein homologs of maize, wheat, and barley
(Goff et al., 2002). Once an important gene has been isolated from rice, it can be used
as a probe to isolate the corresponding homologue in other economically important
cereals like wheat, maize or barley (Delseny et al., 2001; Sorrells et al., 2003). The
availability of an efficient transformation system in rice also makes it a good model
system for cereals.
1.3 Economic importance of rice
Rice is the most important food staple worldwide. It is grown on approximately
155 million hectares and accounts for one-fifth of the global calorie supply
(Pandey et al., 2010). Out of three leading food crops, rice, wheat and maize, in the
world, rice records the highest human consumption accounting 85% of total
production, compared with 72% for wheat and 19% for maize. Rice provides 21% of
global human per capita energy as well as 15% of per capita protein. Rice also
provides minerals, vitamins, and fibre (http://www.knowledgebank.irri.org).

Chapter 1
5
More food is needed to feed the rapidly growing human population. The International
Rice Research Institute (IRRI, 2000) has predicted that 800 million tons per year more
rice will be required in 2025 (Kubo and Purevdorj, 2004). According to the recent
Declaration of the World Summit on Food Security, 70% more food is required by
2050 to meet the demand which will predominantly be coming from developing
countries (FAO, 2009). To meet this requirement, the current annual average crop
production of 32 million metric tons per year needs to be increased up to 44 million
metric tons per year (Figure 1.3). This represents a 38% increase in production, which
is believed to be sufficient to sustain populations for another 40 years (Tester and
Langridge, 2010).
Figure 1.3 Cereal crop production targets (Tester and Langridge, 2010)
Due to breeding and agronomic improvements, the global cereal production has risen from
877 million metric tons in 1961 to 2351 million metric tons in 2007 (blue). To meet the future
demand of over 4000 metric tons by the year 2050, production needs to be increased by 38%
(red) (Tester and Langridge, 2010). The inset table shows the data for three major cereal
productions in 2007 (data from FAO: http//faostat.fao.org/).
In the current century, achieving this target of increased food production in a stable
environment will be quite challenging. Besides the limited availability of arable land

Chapter 1
6
and water, environmental threats posed by biotic (e.g. pest and diseases) and abiotic
(e.g. drought, salinity, extreme light, nutrient deficiency, cold) stresses are major
challenges, and it is obvious that global climate changes will put more pressure on
the situation. To be successful in this unprecedented target of food production,
substantial changes in methods for agronomic practices and crop improvement are
required (Tester and Langridge, 2010). Thus, it is worthwhile to study harmful effects
of these environmental stresses on plants, the tolerance mechanisms plants use to
withstand them, and the strategies that can be applied to overcome the situation,
ensuring normal growth and development of plants. Salinity is one of the serious
constraints responsible for the major loss of global cereal production including rice.
The current study focuses specifically on salinity stress and tolerance mechanisms
cereals use to overcome the situation, using the model cereal rice.
1.4 Salinity as a limiting factor in crop production
Among the various abiotic stress factors, soil salinization has been identified as one
of the biggest threats to inland agriculture (Tester and Davenport, 2003). It has been
estimated that 20% of total cultivated and 33% of irrigated agricultural lands worldwide
are afflicted by high salinity and these salinized areas are increasing at a rate of 10%
annually due to low precipitation, high surface evaporation, weathering of native
rocks, irrigation with saline water, and poor cultural practices. It has also been
estimated that more than half of the arable land would be salinized by the year 2050
(Jacoby et al., 2011; Jamil et al., 2011).
When crop plants are under salt stress, yield reduction mainly results from alteration
of various metabolic processes in plants. Crop yields are significantly reduced in salt
affected areas with an estimation of 30-50% of yield loss for rice, 10-90% yield loss
for wheat and 50-70% for cotton and 30-90% for sugarcane (Eynard et al., 2005). This
occurs due to the increased osmotic pressure limiting water uptake (physiological
drought), extreme pH, and ionic competition limiting nutrient uptake created by excess

Chapter 1
7
of salts in the soil solution (Eynard et al., 2005). The effect of salinity stress on rice
depends on the plant’s developmental stage (Rad et al., 2012; Balkan et al., 2015).
Primary growth stages such as tillering and panicle initiation are more sensitive to
salinity, but panicle emergence and ripening are much more tolerant to salinity
(Rad et al., 2012).
Australian agriculture is also greatly affected by salt. Naturally occurring large salt
deposits stored deep in soils or as surface salt deposits are common features in the
Australian landscape. Altered land use and management practices such as
widespread vegetation clearance, poor land use, irrigation and industrial practices
have facilitated the transport of salts to the soil surface or to waterways resulting in
excessive amounts of dissolved salt in water, which affects agriculture and the quality
of drinking water. It has been estimated that a further 5.7 million hectares of Australia
have a high potential to develop salinity. Unless effective solutions are implemented,
it is predicted that the salinity affected area could increase to 17 million hectares by
2050, most of which is agricultural land (NLWRA, 2001).
Soil salinity not only stresses plants, it also challenges human life and the world
economy through severely damaging agriculture. As predicted by The Food and
Agricultural Organization of the United Nations (FAO), global population will reach to
9.1 billion by 2050 and world food production will need to be raised by 70% to meet
the increasing demand. To achieve the projected increase in food production is quite
challenging as it will have to overcome number of hurdles blocking its way like rising
energy prices, growing depletion of underground aquifers, the continuing loss of
farmland to urbanization, and increased drought and flooding resulting from climate
change (Steduto et al., 2012). Therefore, it is important to understand the tolerance
mechanisms of plants that allow them to grow in saline soil (Ismail et al., 2014) and
to develop crop varieties which can withstand such hazardous environmental
conditions while maintaining their normal growth and yield.

Chapter 1
8
1.5 Mechanisms of salinity tolerance
Salinity tolerance in plants depends on a range of anatomical, physiological,
biochemical and molecular adaptations, which help them to survive under the stress.
Salinity has different effects on plants. It affects plant growth, as well as
developmental processes such as seed germination, seedling growth and vigour,
vegetative growth, flowering and fruit set (Sairam and Tyagi, 2004). In salt-affected
plants, the result is primarily the result of ionic imbalance and hyperosmotic stress.
The effect of this imbalance or disruption in homeostasis occurs at the cell level as
well as at the whole-plant level (Zhu et al., 1997; Xiong and Zhu, 2002). The most
common effect of soil salinity is growth inhibition by Na+ and Cl-, which interferes with
the normal physiological processes, such as enzyme activities and protein synthesis,
as well as causing osmotic imbalances (Munns and Tester, 2008). For many plants,
such as cereal crops, Na+ is the primary cause of ion-specific damage (Tester and
Davenport, 2003). Normal growth and development of plants is dependent on the
capacity of plants to overcome salinity stress and this capacity has enormous
significance for crop yield.
An obvious response of plants to salinity is reduction of shoot growth, which occurs
in two phases, an osmotic stress phase and an ion specific effect phase (Figures 1.4
and 1.5). The osmotic phase is independent of Na+ accumulation while the ion specific
effect phase is associated with Na+ accumulation in plant tissues (Munns, 1993). As
a rapid response to the increase in external osmotic pressure, the plant inhibits the
growth of young leaves, which can be seen as a reduction of leaf area, number of
leaves or number of tillers produced in case of cereal crops. This effect occurs in all
plant varieties equally. The second response is a slower reaction, which is visible in
mature leaves. Due to accumulation of Na+ in leaves, plants accelerate the
senescence of mature leaves (Tester and Davenport, 2003). This has an additional
impact on their growth, and differences in salt tolerance capacity between plant
varieties as salt-tolerant or salt-sensitive, emerge (Figure 1.4). Tolerant plants are

Chapter 1
9
those that can maintain higher growth rates and higher yield performance when grown
in saline conditions compared to susceptible plants experiencing the same conditions
(Tester and Davenport, 2003). However, the final consequence of stress-induced
responses is reduction of plant growth and productivity. The growth and yield
reduction occur as a result of the shortening of the life time of individual leaves which
leads to the reduction of net productivity and crop yield (Munns, 1993).
Figure 1.4 Illustration of the two phase growth response of plant under salinity stress (Munns, 1993; Carillo et al., 2011)

Chapter 1
10
There are several predominant salt tolerance mechanisms operating in plants:
restriction of the entry of toxic ions at root level (exclusion), transporting the toxic ions
to stem, leaf sheath or older leaves (plant level compartmentation), sequestration of
the toxic ions to vacuole or cell wall (cell level compartmetation), scavenging ROS
using antixidative enzyme, and excretion of salt through glands, salt hairs or bladders
by halophytes (Rajendran et al., 2009; Roy and Chakraborty, 2014). There may be a
significant contribution of all these mechanisms to overall salt tolerance of a plant and
the contribution of an individual mechanism varies between different plant species
and even within genotypes (Tester and Davenport, 2003). However, plants which use
more than one mechanism are more salinity tolelant than plants which rely on only
one mechnism (Figure 1.5) (Rajendran et al., 2009; Horie et al., 2012).
Genes control all salt tolerance mechanisms and a clear understanding of how
different genes contribute to stress tolerance opens the opportunity to engineer them
to develop crop varieties with better performance. Human interference is considered
as one of the major cause of salinity through the use of poor-quality irrigation systems
around the world. Therefore, apart from the need for proper irrigation practices, a
concerted effort to understand the effects of salinity on plants, development of
genetically engineered crop varieties and superior salt-tolerant cultivars are essential
to combat the world’s salinization problems (Rengasamy, 2006).

Chapter 1
11
Figure 1.5 A schematic diagram showing major stresses that plants suffer under high salinity growth condition and the corresponding responses plants use in order to survive these detrimental effects (Horie et al., 2012)
Bold arrows and boxes with bold line indicate the harmful effects of salt stress; dash arrows
and boxes with dash line indicate the physiological approaches adapted by plants to
overcome the harmful effect of stress; Adaptation: Phenotypic changes that occur within
individual plants to overcome salinity stress.
Considerable understanding has been gained on the behaviour of plants at the
molecular level in response to environmental stresses. It is obvious that plant cells
increase the expression of some genes while at the same time they decrease
expression of others. New genes that are otherwise not expressed in the absence of
osmotic stress may also begin to be expressed (Zhu et al., 1997; Xiong and Zhu,
2002). Different genes coordinate different functions to acclimate to the adverse effect
of stress condition and they are localized to various cell organelles/subunits or

Chapter 1
12
compartments. Salt tolerance is a complex trait involving the coordinated action of
many gene families that perform a variety of functions such as control of water loss
through stomata, ion sequestration, metabolic adjustment, osmotic adjustment and
antioxidative defense (Abogadallah, 2010).
There is evidence that plant cellular respiratory proteins, especially proteins
associated with the alternative pathway of respiration, such as alternative oxidase and
alternative dehydrogenases, play a regulatory role in plant abiotic stress tolerance,
not only by maintaining reactive oxygen species at non-deleterious levels within the
cell, but also by giving metabolic flexibility that may be required for biosynthesis
(Vanlerberghe, 2013). The present study is focused on identifying the possible role of
rice alternative respiratory proteins when plants are exposed to saline conditions.
1.6 Oxygen and nitrogen reactive species and oxidative stress in plants
Reactive oxygen species (ROS) is a term used to describe a number of reactive
molecules and free radicals derived from molecular oxygen. Non-radical reactive
molecules include hydrogen peroxide (H2O2), singlet oxygen (1O2) and ozone (O3)
etc., and superoxide (O2•−), hydroxyl (OH•) and peroxyl (ROO·) radicals are
commonly found free radicals (Halliwell, 2006; Considine et al., 2015; Del Rio, 2015).
Chloroplast (photosystem I and II), mitochondria (complex I, ubiquinone and complex
III of electron transport chain (ETC)) and peroxisomes are the main sites of ROS
production in plants (Figure 1.6), while endoplasmic reticulum, cell membrane, cell
wall and the apoplast are considered as secondary sites (Gill and Tuteja, 2010; Das
and Roychoudhury, 2014). The term reactive nitrogen species (RNS) includes
radicals like nitric oxide (NO•) and nitric dioxide (NO2•), as well as non-radicals such
as nitrous acid (HNO2) and dinitrogen tetroxide (N2O4), among others. RNS are also
produced in plants although the generating systems have still not been fully
characterized (Del Rio, 2015).

Chapter 1
13
Figure 1.6 Main sites of reactive oxygen species (ROS) production in plant cells and involvement of major antioxidative enzymes (Das et al., 2015)
GO, glycolate oxidase; 3PGA, 3-phosphoglycerate; RuBisCo, ribulose 1,5-bisphosphate
carboxylase/oxygenase; RuBP, ribulose 1,5-bisphosphate; SOD, superoxide dismutase;
XO, xanthine oxidase; CAT, catalase; APX, ascorbate peroxidase (Das et al., 2015).
Production of oxygen-based radicals is common to all aerobic species and these
molecules have the potential to cause a number of deleterious events in cells,
including peroxidation of lipids, denaturation of proteins, mutation of DNA and various
types of cellular oxidative damage. During biotic and abiotic stresses ROS are
significantly accumulated in plant cells resulting an oxidative damage even ending up
with cell death (Krishnamurthy and Rathinasabapathi, 2013b; Das and
Roychoudhury, 2014). On the other hand, the increased production of ROS during
stresses is also thought to act as a signal for the activation of stress-response
pathways (Krishnamurthy and Rathinasabapathi, 2013b). Plants possess efficient
enzymatic and non-enzymatic antioxidative systems to protect themselves against
oxidative damage and also to control ROS at low levels for signal transduction. Apart
from being potentially harmful molecules, a number of studies showed that ROS plays
a key role in the signalling network supporting and regulating numerous biological

Chapter 1
14
processes such as growth, development, and physiological responses to biotic and
environmental stresses, and programmed cell death (Figure 1.7) (Considine et al.,
2015; Del Rio, 2015). It is not yet understood how ROS plays these two contrasting
functional roles of causing oxidative damage to the cell and signalling for stress
protection, but it obviously depends on the concentration of ROS.
Figure 1.7 Sources and targets of reactive oxygen species (ROS) (Hekimi et al., 2011)
A number of exogenous and endogenous factors can stimulate ROS production from the
mitochondria and other compartments. Cellular ROS levels are controlled by a complex
network of antioxidant activities which help to maintain the ROS levels either to act as
modulators in signalling pathways involved in stress-responses and other functions or causing
damage to lipids, nucleic acids, and proteins (Hekimi et al., 2011).
Accumulating evidence from different plant species suggest that in stressed plants,
the growth regulator auxin may be the mediator in regulating the level of ROS and
directing its role in oxidative damage or signalling (Figure 1.8) (Zhang et al., 2009;
Krishnamurthy and Rathinasabapathi, 2013a; Krishnamurthy and Rathinasabapathi,
2013b).

Chapter 1
15
Figure 1.8 The metabolic interplay between auxin and hydrogen peroxide to control plant growth, development and stress tolerance (Krishnamurthy and Rathinasabapathi, 2013b)
Green arrows indicate positive effects and red negative effects (Krishnamurthy and
Rathinasabapathi, 2013b). (MAPKs - mitogen-activated protein kinases).
Plants use different strategies for defense against oxidative stress, such as avoidance
of ROS production, detoxification of ROS and repairing ROS-mediated damage.
Plants use several mechanisms to avoid ROS, including maintaining a balance
between substrate availability and ATP production, activation of AOX, uncoupler
proteins and alternative dehydrogenase to keep ETC adequately oxidized (Moller,
2001). Detoxification of ROS is an important process for the survival of living cells.
There are a number of enzymatic (eg. superoxide dismutase) and non-enzymatic
(eg. glutathione) defense mechanisms in cells to detoxify the harmful effect of ROS.
These mechanisms help to maintain the balance between production and removal of
ROS in the cell. The imbalance of ROS production and removal creates an oxidative
stress within the cell.

Chapter 1
16
When plants are subjected to environmental, biotic and chemical stresses, oxidative
stress is induced in plant cells. These stresses alter plant metabolism, growth and
development and, at their extremes, can lead to death (Jacoby et al., 2012). Recently,
a number of studies have examined the changes that occur within plant mitochondria
following the induction of oxidative stress. The main sites of ROS production in the
ETC in both animal and plant mitochondria appear to be complexes I and III. ROS
production is higher when the ETC is most reduced (Moller and Kristensen, 2004). It
is a widely accepted fact that the stress responsive alternative respiratory enzymes
such as AOX regulate the level of reducing power in the mitochondrial electron
transport chain when ROS accumulation is accelerated by environmental stresses
(Vanlerberghe and McIntosh, 1997), as well as during biotic stresses such as
pathogen attack (Gilliland, 2003). AOX plays a role in modulating ROS production in
cells. Similarly, there is evidence showing that AOX is playing a similar role in
modulating reactive nitrogen species (RNS) in cells (Cvetkovska and Vanlerberghe,
2012).
High levels of salt stress can induce the cell death of tissues and this process is mostly
regulated by the functions associated with mitochondria and seems to be linked to the
production of ROS (Rhoads et al., 2006). Many cell death inducing stress factors,
such as pathogen infection, H2O2 and O3, cause an increase in the activity of cyanide
resistant respiration, suggesting that there is a role of AOX in regulating cell death in
plants (Feng et al., 2013). Van Aken et al. (2009) proposed that AOX acts as a buffer
that determines the threshold for the induction of programmed cell death in plants.
This programming role of AOX can be acquired directly by its ability to suppress the
induction of ROS and indirectly by causing changes in the energy status of cells due
to the non-phosphorylating nature of the alternative respiratory pathway. Changes to
the energy state of the cell are likely achieved in combination with alternative
NAD(P)H dehydrogenases, which are co-regulated with AOX (Van Aken et al., 2009).

Chapter 1
17
1.7 Plant cellular respiration
Cellular respiration, also known as aerobic respiration, is a very important process
common to almost all eukaryotic organisms, which involves the controlled oxidation
of reduced organic substrates to CO2 and H2O. This is a sequential set of processes
that transport reduced glycolytic products from the cytosol into the mitochondrion
followed by a series of reactions leading to the production of CO2 and reduction of
oxygen to water (Siedow and Day, 2000). Three major steps are involved in this
process of cellular respiration viz. glycolysis, tricarboxylic acid cycle (TCA) (Citric Acid
Cycle/Krebs cycle) and Electron Transport Chain (ETC) (Figure 1.9). Glycolysis takes
place in the cytoplasm and TCA and the ETC is localized in the mitochondrion. During
glycolysis, sucrose is converted to pyruvate as a main product, but also malate, as
well as reduced cofactor NADH and ATP. A set of carriers and channels allow
substrates and cofactors from the cytosol to enter to the mitochondrion. In the TCA,
the associated enzymes undertake the oxidative decarboxylation of organic acids
producing CO2, NAD(P)H and FADH2, as well as ATP. Finally, in the inner
mitochondrial membrane, the reduced co-enzymes generated through glycolysis and
the TCA are oxidized by a set of electron transfer proteins that ultimately donate
electrons to O2 producing H2O. This process releases a large amount of free energy,
which is conserved in the acid anhydride linkages of ATP molecules (Siedow and
Day, 2000; Jacoby et al., 2012), which is synthesized during this process. Both
electron transport and ATP synthesis are collectively known as oxidative
phosphorylation. The energy produced during oxidative phosphorylation drives
metabolic reactions involved in plant growth, development and other maintenance
activities. Changes in this process will affect the growth and productivity of plants.
Generally, the process of respiration in plants is the same as other eukaryotic
organisms, but there are some special characteristics that can be found in the plants’
respiratory pathway to cope with the unique environmental and metabolic conditions
faced by plants (Siedow and Day, 2000).

Chapter 1
18
Figure 1.9 Diagram of cellular respiration
Three major steps; glycolysis, Krebs cycle and electron transport chain, are involved in the
cellular respiration (https://en.wikipedia.org/wiki/Cellular_respiration)
1.8 Mitochondrial electron transport chain (mETC) in Plants
The key role of mitochondria in living cells is to produce energy through oxidative
phosphorylation. This is done through a serious of events catalyzed by several
enzyme complexes in the inner mitochondrial membrane forming the ETC.
The ETC of plant mitochondria contains a series of membrane bound redox centers
that maintain electron flow from NADH and FADH2 to oxygen, ultimately forming water
(Figure 1.10). The classical mitochondrial ETC conserved among eukaryotes consists
of four multiple subunits protein complexes commonly known as Complexes I through
IV. Complex I (NADH dehydrogenase) oxidizes matrix NADH and donates electron to
Tricarboxylic Acid Cycle in the Mitochondria

Chapter 1
19
Ubiquinone producing NAD+. The electron flow through complex I is accompanied by
H+ translocation across the membrane which finally contributes to ATP synthesis.
Rotenone, a flavonoid, inhibits the activity of Complex I. Complex II which represents
succinate dehydrogenase oxidizes the Krebs cycle intermediate succinate to
fumarate and donates electrons to Ubiquinone. As Complex II does not translocate
H+ across the membrane it contributes less to ATP production than Complex I.
Malonate is a strong competitive inhibitor of succinate dehydrogenase activity
(Siedow and Day, 2000). Ubiquinone reduced by these dehydrogenases is oxidized
by complex III (UQ-cytochrome c oxidoreductase) and transfers electrons to
cytochrome c, a peripheral membrane protein located on the outer surface of the inner
membrane. Cytochrome c carries electrons from Complex III to complex IV
(cytochrome c oxidase), the terminal electron carrier in the classical ETC. These two
complexes pump protons across the mitochondrial membrane and thus contribute to
the production of ATP. Antimycin A and myxothiazol are complex III activity inhibitors
while chemicals like cyanide, azide and CO inhibit the activity of Complex IV. Finally,
oxygen accepts electrons from Complex IV and is reduced to H2O. Electron flow
through proton pumping complexes I, III and IV creates an electrochemical gradient
across the mitochondrial inner membrane that finally ends up with production of ATP.
1.9 Alternative pathway for respiration in pants
In addition to classical respiratory complexes, plant mETC contains five additional
enzymes not present in mammalian mitochondria: four NAD(P)H dehydrogenases
(NDHs) and an alternative oxidase (AOX), forming an alternative respiratory pathway
(Moller, 2001; Finnegan et al., 2004; Rasmusson et al., 2004) (Figure 1.10). The
NDHs oxidize NAD(P)H and donate electrons to the common pool of Ubiquinone, by-
passing respiratory Complex I while AOX transfers electrons from Ubiquinol to
oxygen, bypassing the cytochrome pathway. As alternative respiratory proteins do not
contribute to the proton pumping system, these processes are not coupled to ATP

Chapter 1
20
production. Therefore, the alternative pathway of respiration is a non-energy
conserving process (Siedow and Day, 2000; Finnegan et al., 2004; Millar et al., 2011).
Figure 1.10 The alternative respiratory pathway in the plant mitochondrial electron transport chain (Vanlerberghe, 2013)
Abbreviations: I, II, III, IV: respiratory complexes I to IV; IMM, inner mitochondrial membrane;
IMS, inner membrane space; AOX, alternative oxidase; NDex, external NAD(P)H
dehydrogenases; NDin, internal NAD(P)H dehydrogenases; MnSOD, manganese superoxide
dismutase; Q, ubiquinone pool (Vanlerberghe, 2013).
1.9.1 Alternative oxidase (AOX)
The alternative oxidase pathway, also known as cyanide-resistant respiration, was
discovered at the beginning of 20th century as a curiosity in thermogenesis in voodoo
lily (Sauromatum guttatum) during anthesis (Juszczuk & Rychter, 2003) and later was
found to be a typical feature of plant respiration. From the start of the purification of
AOX protein from S. guttatum (Elthon and McIntosh, 1987), considerable progress
has been made in AOX research in the directions of identification of AOX gene
families and the regulation of its expression during the past two decades. The most
extensively studied component of the plant mitochondrial electron transport chain is
AOX (Kuhn et al., 2015). The current knowledge on AOX includes a detailed
knowledge of its structure including the detailed understanding of the crystal structure

Chapter 1
21
(Shiba et al., 2013), biochemical characteristics (Siedow and Umbach, 2000; Millar et
al., 2011), evolution and regulation of AOXs (McDonald, 2008; Pu et al., 2015), and
transcriptional and post-transcriptional regulation (Vanlerberghe and McIntosh, 1997;
Millar et al., 2011).
The structure of AOX is very similar in all organisms so far investigated (Wagner and
Moore, 1997). It is an interfacial protein peripherally associated with the matrix side
of the inner mitochondrial membrane (Siedow and Umbach, 2000). Shiba et al. (2013)
published the crystal structure of trypanosomal AOX and revealed that it is a
homodimer with the non-haem di-iron carboxylate active site buried within a four-helix
bundle. It contains four monomers per asymmetric unit that associate to form
homodimers. Each monomer consists of a long N-terminal arm, six long α-helices and
four short α-helices (Figure 1.11). The four long α-helices (2, 3, 5 and 6) are arranged
in an antiparallel fashion and form a four-helix bundle which acts as a scaffold to bind
the two iron atoms (Shiba et al., 2013).
AOX is encoded by a small nuclear gene family (Considine et al., 2002). Two separate
gene subfamilies have been identified in higher plants, AOX1-type and AOX2-type. In
dicots, both subfamilies are present while in monocots only AOX1-type is present
(Considine et al., 2002). The expression of gene family members depends on the
plant, type of tissue, growth and development stage, and environment. Induction of
some isoforms of AOX1 is linked to stress while the expression of AOX2 is related to
some specific tissues and development (Considine et al., 2002; Arnholdt-Schmitt et
al., 2006). AOX is present in all higher plants and also in some algae, fungi, eubacteria
and protists. The presence of AOX was also found in animal phyla, including Mollusca,
Nematoda and Chordata (McDonald and Vanlerberghe, 2004).
The existence of three AOX genes in gymnosperms has also been reported
(Frederico et al., 2009). Two of them belong to the subfamily AOX1 while the other
one belong to the subfamily AOX2. The presence of all subfamilies of AOX was

Chapter 1
22
reported in soybean (Whelan et al., 1996; McCabe et al., 1998; Tanudji et al., 1998).
Four isoforms of AOX1 (a, b, c and d) are present in rice (O. sativa) (Considine et al.,
2002; Costa et al., 2014) whereas Arabidopsis thaliana contains four AOX1 isoforms
(a, b, c and d) and one AOX2 gene.
A number of studies have been done to examine changes in AOX capacity and activity
in response to different abiotic stresses such as cold (Lei et al., 2010; Wang et al.,
2011), light (Feng et al., 2007; Florenz‐Sarasa et al., 2011), high temperature
(Armstrong et al., 2008; Murakami and Toriyama, 2008), high salt concentration
(Ferreira et al., 2008; Smith et al., 2009) and heavy metal ions, Cd2+ (Wang et al.,
2013) as well as biotic stresses like bacterial infections (Vanlerberghe, 2013). The
current study focuses on the expression of rice AOXs, OsAOX1a, OsAOX1b and
OsAOX1c, under salinity stress in controlled environmental conditions and their
potential role in abiotic stress tolerance.

Chapter 1
23
Figure 1.11 Crystal structure of trypansomal alternative oxidase (TAO) (Shiba et al., 2013)
A: Dimeric structure of TAO viewed roughly perpendicular (Left) and parallel (Right) to the
helix axes; B: Surface representation of dimers showing the hydrophobic (Left) and hydrophilic
(Right) surfaces; C: Proposed binding model of the TAO dimer to membranes shown by
surface (Left) and cartoon (Right) representations

Chapter 1
24
1.9.2 Alternative NAD(P)H dehydrogenases (NDHs)
Apart from the proton-pumping respiratory complex I of the classical ETC, plant
mitochondria contain an additional type of proteins which facilitate the electron
transfer from cytoplasmic and matrix NAD(P)H to ubiquinone in a non-energy
conserving manner (Michalecka et al., 2003). These extra enzymes are known as
type II NAD(P)H dehydrogenases or alternative NAD(P)H dehydrogenases (NDHs).
Biochemical characterization of isolated plant mitochondria has revealed the
presence of internal as well as external types of NDHs, operating in parallel with
complex I (Rasmusson and Moller, 1991; Roberts et al., 1995). The distinguishing
feature of NDHs is that they are insensitive to rotenone and thus referred as rotenone-
insensitive dehydrogenases. The rotenone-insensitive NAD(P)H dehydrogenase has
a lower affinity for NAD(P)H compared to complex I and operates only when the matrix
NAD(P)H concentration is high (Siedow and Day, 2000). The activity of external NDHs
is strongly depended on the presence of calcium (Ca2+) (Moller, 2001; Moller and
Kristensen, 2004; Millar et al., 2011).
The NDHs also occur as gene families. Arabidopsis contains seven nuclear encoded
NDHs which have been clustered into three gene families NDA (AtNDA1 and
AtNDA2), NDB (AtNDB1, AtNDB2, AtNDB3 and AtNDB4) and NDC (AtNDC1)
(Michalecka et al., 2003). In potato, two genes, StNDA1 and StNDB1, are shown to
encode proteins directed to the internal and external sides of the inner mitochondrial
membrane, respectively (Rasmusson and Agius, 2001). Phylogenetic analyses and
subcellular targeting prediction studies carried out by Xu et al. (2013) revealed the
presence of five NDH proteins in rice which are also clustered into three families as
in Arabidopsis, NDA (OsNDA1 and OsNDA2), NDB (OsNDB1 and OsNDB2) and NDC
(OsNDC1). They further described that in addition to their mitochondrial location,
some of them, such as OsNDA2, OsNDB1 and OsNDB2, can be found in
peroxisomes as well as in chloroplasts (OsNDC1).

Chapter 1
25
As was suggested for the AOXs, NDHs are also considered to be present in cells to
allow flexible tuning of the redox balance in the cytosol and matrix, and to adjust to
the changing need for ATP synthesis (Svensson et al., 2002). The NDHs may also
help to avoid ROS formation from complex I. It was shown that the additional
NAD(P)H dehydrogenases may be up-regulated under stress conditions and a
number of studies have been done to understand their role in abiotic stress tolerance,
such as low temperature (Svensson et al., 2002) and light (Michalecka et al., 2003),
and also to study the growth and stress tolerance changes when these genes are
altered (Smith et al., 2011).
1.10 Mitochondrial retrograde regulation
The nucleus, the chloroplast and the mitochondrion are major storage sites of genetic
materials in plant cells. The nucleus possesses the majority of genetic information,
including genes that encode organelle proteins, and therefore plays a key role in
controlling most aspects of organelles’ gene expression, growth, and development.
Generally, the signal flow is from nucleus to organelle and the process is defined as
anterograde signalling or anterograde regulation (Yang et al., 2008; Giraud et al.,
2009; Ng et al., 2014). Environmental stresses, biotic stresses or mutations can alter
the functions of cellular organelles like mitochondria and chloroplast and in response
these organelles direct changes in nuclear gene expression. Nuclear gene expression
alterations directed by affected organelles through organelle-to-nucleus signalling is
known as retrograde signalling or retrograde regulation (Butow and Avadhani, 2004;
Rhoads and Vanlerberghe, 2004; Rhoads and Subbaiah, 2007; Yang et al., 2008).
Transduction of signals from affected plant mitochondria to nucleus in order to activate
nuclear gene expression is referred to as mitochondrial retrograde regulation (MRR)
(Rhoads and Subbaiah, 2007; Li et al., 2013a). Mitochondrial retrograde signalling
can be triggered by dysfunction of mitochondria and could link to metabolic signalling
pathways or normal ROS signalling pathways to induce nuclear gene expression

Chapter 1
26
(Rhoads and Subbaiah, 2007). Retrograde signalling is believed to be an important
regulatory mechanism involved in plant development as well as in abiotic/biotic stress
responses (Rhoads and Subbaiah, 2007; Li et al., 2013a). Although the underlying
mechanism is not yet fully understood, there is evidence that the responses of
mitochondria to stresses, together with the specific target genes of MRR in individual
stress responses, may determine the fate of plant cells, resulting in either recovery or
cell death (Figure 1.12).
Figure 1.12 Potential signalling pathways for plant MRR (Rhoads and Subbaiah, 2007)
These include signals such as lipid peroxidation products, calmodulin, cyclic nucleotides, and
phospholipases. mtETC, mitochondrial electron transport chain; mtROS, mitochondrial
reactive oxygen species; PPases, protein phosphatases; RNS, reactive nitrogen species; TFs,
transcription factors (Rhoads and Subbaiah, 2007).
The general process of MRR is conserved among yeast, mammals, and plants, but,
the molecular mechanisms of signalling and signal transduction are not necessarily
conserved across species (Liu and Butow, 2006). Currently, chloroplast retrograde
regulation is the best studied retrograde signalling pathway in plants. MRR is poorly
understood and centres on dysfunction of mitochondria (Rhoads and Subbaiah,
2007). Dysfunction of mitochondria resulting from ROS damage and changes in the

Chapter 1
27
redox state of the cell, ultimately activates MRR to induce nuclear genes to produce
proteins involved in the recovery of mitochondrial functions (Rhoads and Subbaiah,
2007; Yang et al., 2008). The induction of a large number of abiotic stress responsive
genes has been reported in a variety of plants including rice. These stress-induced
genes not only function to protect cells from stress by production of important
metabolic proteins, but also in the regulation of genes for signal transduction in the
stress response (Todaka et al., 2012).
Increasing evidence shows that expression of AOXs and NDHs, as well as genes
encoding enzymes aimed at regaining ROS level/redox homeostasis, such as
glutathione transferase, catalase, ascorbate peroxidase and superoxide dismutase,
are increased by MRR during mETC inhibition (Amirsadeghi et al., 2007; Feng et al.,
2010a; Keunen et al., 2011; Li et al., 2013a).
Li et al (2013a) demonstrated that abiotic stresses such as drought, salinity, cold etc.,
initiate MRR to induce rice alternative respiratory pathway genes AOX1a and AOX1b
via mitochondrial produced O2-. The absence of AOX1a in Arabidopsis results in acute
sensitivity to combined light and drought stress, which triggers altered expression of
antioxidant defence components and stress responsive genes (Giraud et al., 2008).
The investigation done by Giraud et al. (2009) revealed that ABI4 (ABSCISIC ACID
INSENSITIVE4), an ABA-responsive transcription factor, plays a central role in
mediating mitochondrial retrograde signals to induce the expression of AOX1a in
Arabidopsis.
Much information is currently available on plant MRR as a response to dysfunctional
mETC and the AOX pathway can be an important model to study MRR (Dojcinovic et
al., 2005; Rhoads and Subbaiah, 2007). The current study investigates whether there
is a link between tissue salt accumulation, ROS production and expression of rice
alternative respiratory genes in salt-stressed seedlings and whether there is varietal
dependence of these factors.

Chapter 1
28
1.11 Role of alternative respiratory proteins in stress tolerance
A number of studies have attempted to identify the physiological role of alternative
respiratory enzymes and their relationship to abiotic stress tolerance in plants. These
studies mainly focus on the role of AOX rather than the role of type II NAD(P)H
dehydrogenases.
The role of AOX in modulating abiotic stresses, particularly those expected to
generate ROS, has been widely studied. At the whole plant level, it is not yet clearly
understood how the alternative pathway of respiration alone contributes to the survival
of plant under stress condition, but at the cellular level, it is clear that AOX can limit
the production of ROS from the ETC when ROS formation is accelerated by
environmental stress (Maxwell et al., 1999). Under normal conditions, Complex I of
the ETC is the main enzyme responsible for oxidizing NADH, and is also a major site
of ROS production, together with complex III. The AOX and possibly type II NAD(P)H
dehydrogenases, located inside of the inner mitochondrial membrane, function to
limit mitochondrial ROS production by keeping the ETC relatively oxidized (Moller,
2001).
A number of studies have come up, over the last decade, providing evidence that
there is a specific role for the alternative respiratory enzymes in environmental stress
tolerance. AOX controls the mitochondrial generation of ROS by stabilizing the
reduction state of electron transport, which allows plants to cope with environmental
stresses (Mhadhbi et al., 2013). Apart from the role played in the reduction of ROS
generation in mitochondria, AOX also acts to reduce the formation of RNS by
disturbing the transfer of single electrons from the ETC to nitrite (Cvetkovska and
Vanlerberghe, 2012). There are a large number of studies that have been done using
different plant species to demonstrate that changes in the abundance of the AOX
transcripts lead to different physiological responses to biotic and abiotic stresses.

Chapter 1
29
These studies are predominantly related to the ROS status (Vanlerberghe et al., 2009;
Wang et al., 2011). It is also suggested that the activity of AOX controls the level of
potential mitochondrial signaling molecules such as superoxide, nitric oxide and
important redox couples, providing a degree of signaling homeostasis to the
organelle. Evidence suggests that AOX function in metabolic signaling homeostasis
is particularly important during abiotic stresses such as low temperature, drought, and
nutrient deficiency, as well as biotic stresses such as bacterial infection
(Vanlerberghe, 2013).
In Arabidopsis, salt stress resulted in an increase of transcriptional levels of AOX1a,
along with the alternative dehydrogenases, AtNDB2 and AtNDB4 genes (Smith et al.,
2009) showing that there is a role to play in salinity stress. This study also shows that
there may be a certain functional link between AOX and NDH. Clifton et al. (2005)
also observed the co-expression of AOX1a and NDB2 under a number of treatments
in Arabidopsis. Tolerance to salt stress may be due to the combined result of a
number of systems. The salt tolerance showed by Medicago truncatula may be in part
due to an efficient control of oxidative balance by involvement of both antioxidant
systems and alternative respiratory pathway (Mhadhbi et al., 2011; Mhadhbi et al.,
2013). Complete light dependence and diurnal changes in expression of AP genes
also reported. Svensson and Rasmusson (2001) observed that NDA1 transcript
abundance of potato leaves grown in dark was 500 times lower compared to those
grown in light, suggesting that the NDA1 gene is involved in photosynthetically
associated processes, most likely photorespiration (Svensson and Rasmusson,
2001).
The responses of alternative respiratory enzymes seem to be species dependent. In
potato leaves, internal NADH dehydrogenase capacity was down regulated during
cold treatment (Svensson et al., 2002) and AOX was not induced at either transcript
or at protein level. However, the exposure of Nicotiana tabacum cells to low
temperature resulted in an increase of AOX at both transcript and protein levels

Chapter 1
30
(Wang et al., 2011). The expression of AOX was relatively high in soybean hypocotyls
throughout development (McCabe et al., 1998), but, in mung beans, the highest
capacity and activity of alternative respiration was observed in the seedling ‘true’
leaves when compared to other seedling parts tested, such as hypocotyls and
cotyledon. Mung bean hypocotyls recorded the lowest capacity and activity of
alternative pathway (Li et al., 2000). These studies show that the activity of the
alternative respiratory pathway differs even in different parts of the same plant.
Some studies suggest that the expression of alternative respiratory genes is
dependent on the intensity of the stress. In rice suspension cultures, expression of
AOX gene family members showed different expression patterns in response to
varying levels of hydrogen sulfide, an inhibitor of cytochrome pathway (Xiao et al.,
2010). This study revealed that with the increase of hydrogen sulfide concentration,
transcript levels of AOX1a and AOX1c increased gradually and remained at high
levels. But, although the transcript level of AOX1b increased at low concentrations of
hydrogen sulfide, its expression was inhibited at high concentrations.
1.12 Alternative pathway of respiration in rice
To date, although plenty of work has been done attempting to understand the role of
alternative respiratory pathway in stress tolerance in dicots, less attention has been
given to monocots, including rice. Among the few reports available, stress responses
of only rice AOXs have been revealed (Abe et al., 2002; Saika et al., 2002a; Xiao et
al., 2010). Apart from the phylogenetic analyses and subcellular targeting predictions
by Xu et al. (2013), there is no published work on the characterization of rice NDHs
or their responses during abiotic/biotic stress conditions so far.

Chapter 1
31
However, there are reports on the expression of AOX in rice during abiotic stresses
such as low temperature and salinity. A group of researchers (Ito et al., 1997) has
demonstrated that there is an increase of the transcription levels of AOX genes, both
AOX1a and AOX1b, in etiolated rice seedlings when they were exposed to low
temperature. This suggests that AOX was playing a certain role in adjusting the plant
to the stress situation. The expression of AOX1a and AOX1b was also induced
significantly in a time-dependent manner when rice seedlings were exposed to
salinity, drought and low temperature, whereas AOX1c transcript level did not
significantly change (Li et al., 2013a). A contrasting expression pattern of AOX family
members was observed when rice seedlings were grown under total darkness,
dark/light cycles or continuous light (Feng et al., 2007). They observed the highest
transcript level of AOX1c in seedlings grown under continuous light whereas there
was no detectable expression of AOX1a and AOX1b in the treatment with light.
Studies have attempted to show that AOX could be involved in the prevention of ROS
formation in salt-stressed rice seedlings and the expression of AOX1a under higher
salt could be mediated through H2O2 (Feng et al., 2010b). Cell death of rice roots
under high salt stress is linked to the accumulation of H2O2 in vivo. Salt stress
increased the activity of cyanide-resistant respiration and enhanced transcript levels
of AOX1a and AOX1b, but not AOX1c, in rice roots (Feng et al., 2013).
Some studies demonstrated that the expression of AOX depends on the
developmental stage. Abe et al. (1997) reported differential accumulation of AOX
protein at three different developmental stages of rice anthers, uninucleate
microspore stage, bicellular pollen stage and tricellular pollen stage. The study
revealed a higher abundance of active form of AOX at uninucleate microspore stage
compared to tricellular pollen stage. Ranawake et al. (2012) observed that levels of
expression of the same genes differed under different stress conditions during their
study on expression profiles of 12 known stress responsive genes in rice (O. sativa
cv Nipponbare). They noticed that some genes were positively regulated under some

Chapter 1
32
stresses but negatively regulated under other stresses. For example, OsAOX1a did
not respond to any of the three stresses (drought, low temperature and NaCl) tested
and ABA treatment while OsAOX1b was induced by all three stresses but not ABA
(Ranawake et al., 2012).
Wang et al. (2013) demonstrated that AOX played a role in acquiring tolerance to
heavy metal ions in some rice cultivars. These researchers have investigated the
primary mechanisms employed by four rice (O. sativa L. japonica group) cultivars in
attaining Cd tolerance and revealed that different rice cultivars employed different
mechanisms to survive under Cd stress and AOX was among them.
The present study aims to identify all components of the rice alternative respiratory
pathway using sequence homology to known Arabidopsis genes and to characterize
them under oxidative stress created by exposure of seedling tissues to chemical
treatments, which inhibit respiratory complexes of mitochondrial electron transport
chain, and by exposure of seedlings to environmental stresses like high salt.
1.13 Genetic engineering and value added plants
The use of modern biotechnology techniques to change the genes of an organism is
referred to as genetic engineering, genetic manipulation or genetic modification. The
organism that has been modified using these techniques is known as a genetically
modified organism (GMO) (Key et al., 2008). Production of plants with favourable
characteristics using conventional breeding techniques is a long process and there
are barriers due to sexual incompatibility and species differences. Genetic
engineering not only allows this process to dramatically speed up but also to
overcome barriers of sexual incompatibilities between plant species and enormously
increase the size of the available gene pool (Key et al., 2008). This technology has
been utilized in a variety of fields to produce plants with added qualities such as
resistance to biotic and abiotic stresses, enhanced nutritional quality of the product,

Chapter 1
33
herbicide, pesticides resistance and increased productivity. In addition, there is
growing interest in producing drugs and industrial proteins in transgenic plants. There
are a number of biotechnology techniques which are being used to develop GMOs in
agriculture. The most commonly used methods are biolistic methods (particle gun) or
Agrobacterium tumefaciens mediated transformation. Gene overexpression and
silencing have become common tools for functional characterization of genes in
crops. These tools facilitate phenotypic change associated with changing the
expression of a gene of interest.
Investigations of the role of the alternative pathway of respiration also have been
facilitated by transgenic techniques. Once the transgenic line of a certain crop variety
is produced, it can be used to study the functional role of alternative respiratory genes
under various stress conditions. Alteration of the AOX1a gene in rice with sense cDNA
constructs resulted in increased expression of AOX1a in leaves while antisense cDNA
resulted in decreased expression of AOX1a (Abe and Toriyama, 2003). Rice lines
overexpressing AOX1a proteins exhibited enhanced high temperature tolerance
compared with wildtype and antisense transgenic lines (Murakami and Toriyama,
2008). A similar study has been done with transgenic tobacco suspensions cells and
showed that the capacity of the alternative pathway can be down-regulated or up-
regulated by silencing or overexpressing responsible genes (Vanlerberghe et al.,
1994). Li et al., (2013b) also showed that overexpression of OsAOX1a in rice strongly
enhanced the ability of rice seedlings to grow under cold stress, especially in respect
to root extension.
Many studies have demonstrated that increasing the antioxidant capacity of a plant
improves abiotic stress tolerance (McKersie et al., 1996; Badawi et al., 2004), and the
expression of a combination of antioxidant enzymes was shown to be a promising
strategy to enhance abiotic stress tolerance in plants (Reguera et al., 2012).
Transgenic rice plants constitutively co-expressing GST (glutathione S-transferase)
and CAT (catalase) genes showed enhanced tolerance to salinity and oxidative

Chapter 1
34
stresses in their vegetative stage (Zhao and Zhang, 2006). Co-expression of three
antioxidant enzymes, copper zinc superoxide dismutase (CuZnSOD), ascorbate
peroxidase (APX) and dehydroascorbate reductase (DHAR) in tobacco, resulted in a
higher tolerance to salt stress (Lee et al., 2007).
Zhang et al. (2012) demonstrated that transient expression systems are effective in
functional characterization of genes. They have developed a system for
overexpression and silencing genes for Betula platyphylla Suk (Chinese birch) by
isolating the cinnamoyl-CoA reductase (CCR) gene and its promoter. Overexpression
and silencing of the CCR gene were performed on birch seedlings using an
Agrobacterium-mediated transient expression system resulting in different expression
levels of CCR.
Panda et al. (2013) observed enhanced performance of tobacco cells under
aluminium stress when cells were transformed by overexpressing the Ntaox1 gene
under the control of the cauliflower mosaic virus (CaMV) 35 S promoter. Normally, Al
stress suppresses mitochondrial respiration of tobacco cells (Nicotiana tabacum L.)
and produces ROS within the cell, disturbing their growth. Transformed cells showed
a better growth performance with a decreased inhibition of respiration and reduced
ROS production, demonstrating that AOX is playing a critical role in stress tolerance
in plant cells. Smith et al (2011) observed that suppression of alternative
dehydrogenase, NDB4, in Arabidopsis leads to the increased expression of NDB2
and AOX1a at both transcript and protein level. These altered Arabidopsis lines
showed altered phenotypic characteristics and lower ROS production in cells. In the
current study, selected salt-responsive alternative pathway genes will be
overexpressed in rice and transgenic rice will be characterized under stress
conditions.

Chapter 1
35
1.14 Gene expression diversity in plants
Gene expression can be modulated at several steps, including transcription, RNA
splicing, translation, and post-translational modification. The level of gene expression
may vary among individuals as well as populations, leading to a vast diversity in their
phenotypic characteristics. Gene expression variations exist widely within and
between populations in prokaryotic as well as eukaryotic organisms as a result of
either genetic or non-genetic factors (Li et al., 2010a). Genetic factors which cause
changes in DNA sequence resulting in expression differences include single
nucleotide polymorphisms (SNPs) (Chagné et al., 2007) and copy number variations
(CNVs) (Orozco et al., 2009). Non-genetic factors include epigenetic
modifications such as DNA methylation, histone modifications and small RNA based
mechanisms, which can contribute to create phenotypic variations (Grativol et al.,
2012).
Quantitative trait loci (QTL) are genetic regions associated with variation in gene
expression among individuals. A single gene can have one or multiple QTLs (Druka
et al., 2010). These variations can be due to sequence polymorphisms in target genes
either at cis-regulatory (proximal) or trans-regulatory (distal) regions, leading to
phenotypic differences. Identifying variation in gene expression within a segregating
mapping population can have several uses (Druka et al., 2010), such as to map the
chromosomal positions of genes based on constitutive differences in expression
between parents, categorizing QTL into cis- or trans-QTL effects relative to the
physical location of a gene etc. (Hammond et al., 2011).
Plants have developed various anatomical, morphological, cellular, biochemical and
molecular adjustments to stresses to guarantee their survival under adverse
conditions. Many studies have showed that genotype as well as epigenotype may
contribute to phenotypic variation often responding differently to environmental
variation (Grativol et al., 2012). Transcript profiling techniques allow the simultaneous

Chapter 1
36
examination of gene expression at different time periods in different tissues.
There is significant phenotypic variation in oxidative stress response and leaf
senescence between japonica rice and indica rice. Liu et al. (2010) explored the
possible molecular mechanism underlying this phenotypic variation during oxidative
stress using methyl viologen as a ROS agent to induce oxidative stress in rice
seedlings. They observed that cultivar 93-11 (indica) seedlings exhibited severe leaf
senescence under methyl viologen treatment compared to Nipponbare (japonica),
which may be caused by genomic and transcriptional variation between the two
cultivars.
Quinoa (Chenopodium quinoa Willd.) is an Andean plant showing a remarkable
variably in salinity tolerance. Ruiz-Carrasco et al. (2011) investigated whether the
genetic variability in quinoa is associated with the different degree of salinity tolerance
and confirmed the existence of genotype specific responses to high salinity at
physiological and molecular levels. In foxtail millet, several key genes have been
identified that were differentially expressed in response to salinity stress using salt-
sensitive and salt-tolerant cultivars (Jayaraman et al., 2008). In this study, cDNA-
AFLP (cDNA Amplified Fragment Length Polymorphism) was employed to identify
genes that exhibited modulated expression following salt treatments and their
expression patterns were validated through quantitative reverse transcription PCR
(qRT-PCR) analysis in the salt-tolerant cultivar compared with a salt-susceptible
cultivar.
Many studies have revealed expression variation of genes under different abiotic
stresses such as salinity (Jayaraman et al., 2008), drought (Machado and Cruzan,
2010), ion toxicity (Bogacki et al., 2013) etc., in plants. During the current study,
physiological and molecular responses of different rice varieties towards the oxidative
stress imposed via increased salinity will be studied, with emphasis on expression of
alternative pathway genes.

Chapter 1
37
1.15 Aims of the study
Beside their primary role in carbon metabolism, plant mitochondria act as signaling
organelles which can influence processes such as gene expression (Vanlerberghe,
2013). Alternative respiratory pathway genes, especially AOX, can control the level of
ROS and RNS, potential mitochondrial signaling molecules, in the cell, thereby
protecting the cell from oxidative stress (Vanlerberghe et al., 2009; Cvetkovska and
Vanlerberghe, 2012). This function of alternative pathway (AP) genes is particularly
important during abiotic and biotic stress tolerance in plants (Vanlerberghe, 2013).
There have been significant achievements in the understanding of the response
mechanisms of AP genes under abiotic stress in various crop varieties. Most studies
of AP gene regulation have focused on dicot plants while less work has been reported
on alternative respiratory genes in monocots, including rice. In rice, work so far, has
predominantly been limited to the studies on the expression of AOX in plants exposed
to number of environmental stress conditions and no published work is available on
studying the expression of rice NDHs under stress conditions. Therefore, it is
important to extend the study towards the expression of NDHs in rice under stress
conditions, as well as to test the validity of this approach in commercially important
rice cultivars.
The overall aim of the current project was to explore whether modifications in the
alternative pathway of respiration can improve tolerance to abiotic stresses in cereals
using rice as a model cereal. This overall aim will be achieved through several sub-
aims. These sub-aims will be discussed in details in individual chapters of the thesis.
Chapter 3 of the thesis will deal with the identification and characterization of
alternative pathway gene homologs present in rice using bioinformatics tools.
Protein/genomic sequences of Arabidopsis AP gene homologs will be BLAST
searched against protein/genomic sequences in the MSU RGAP Release 7 of the
Rice Genome Annotation Project and alternative pathway members in rice will be

Chapter 1
38
identified. Further, the diversity of intron-exon structure of all resulting genes and
genetic level variation will be studied compared to Arabidopsis alternative pathway
genes. Stress responsive rice AP genes will be identified by exposing rice seedling to
oxidative stress created through chemical inhibition of cytochrome respiration.
Chapter 4 of the thesis will be on identification of rice AP genes responsive to salt
stress and their possible response mechanisms. This aim will be mainly addressed
by identifying the salt-responsive rice AP genes in two rice cultivars O. sativa ssp
japonica cv. Nipponbare and O. sativa ssp indica cv Langi. Seedlings from two
cultivars will be exposed to moderate salt stress under controlled environment and
physiological responses of two rice cultivars to applied salt stress and expression of
AP genes will be studied using quantitative reverse transcription polymerase chain
reaction (qRT-PCR). Chapter 4 will further discuss the detection of alternative
pathway enzyme activity and proteins using isolated mitochondria.
Chapter 5 of the thesis will discuss the diversity of AP gene expression, growth
responses and tissue ion accumulation in different rice cultivars grown under salinity
stress. Initially, 16 rice cultivars, which include both japonica and indica rice, will be
screened for growth performance and tissue ion accumulation under moderate salt
stress. AP gene expression of cultivars, which exhibited extreme growth performance,
will also be discussed.
Chapter 6 of the thesis will be on development of transgenic rice lines carrying salt-
responsive Arabidopsis alternative respiratory genes, AtAOX1a and AtNDB2 and
evaluation of their growth performance under salt stress. Smith et al. (2009) reported
that overexpression of AtAOX1a and AtNDB2 genes in Arabidopsis resulted in
increased biomass production and reduced ROS levels in cells under salt stress. This
chapter will discuss an attempt of applying the same system into rice, by
overexpressing AtAOX1a and AtNDB2 in rice cultivar Nipponbare via Agrobacterium-
mediated transformation. It will also include the details on the preliminary studies on

Chapter 1
39
evaluation of transgenes’ performance under environmentally realistic salt stress
conditions.
Finally, I expect that findings of the current study will contribute to the understanding
of the response mechanisms of alternative respiratory genes to abiotic stresses in
other economically important cereals like wheat and barley. The knowledge of
potential salt-responsive alternative pathway genes will be beneficial for future studies
and the production of improved rice varieties to abiotic stresses including salt stress.

Chapter 2
40
2 General materials and methods
2.1 Plant growth and salinity analysis
2.1.1 Growth facilities and conditions
Experiments described in Chapter 4 were conducted in a greenhouse (No.06) of the
Plant Accelerator, Waite Campus, University of Adelaide, South Australia. The growth
conditions at the Plant Accelerator for rice were a 12 hour (hr) photoperiod,
temperatures of 280C/26oC (day/night) and 75% relative humidity. Supplementary
lighting (~400-500 µE m-2 s-1) was used during winter season to get a minimum of a
12 hr photoperiod. Experiments described in Chapter 5 and 6 were conducted at the
PC2 greenhouse, School of Biological Sciences, Flinders University of South
Australia. Growth conditions at the PC2 greenhouse, Flinders University, were
28oC/220C (day/night) temperature and the photoperiod was the day length during the
summer season of the year. Supplementary lighting (~400-500 µE m-2 s-1) was used
during winter season to get a minimum of a 12 hr photoperiod.
2.1.2 Seed treatment and germination
Rice seeds were sorted for uniform size and sterilized with 70% (v/v) ethanol for 1 min
followed by thorough rinsing (x 5) with sterile Milli-Q (ultra-pure) water. Then, seeds
were further sterilized with 2.5% sodium hypochlorite (50% v/v commercial bleach
with 1 drop of Tween 20 per 50 ml) for 15 min and further washed in sterile Milli-Q
water to remove all traces of sodium hypochlorite. Surface sterilized seeds were
germinated on wet Whatman (Grade 1) filter paper in Petri plates (150 mm x 15 mm).
Plates were sealed with parafilm, to prevent evaporation and contamination, and
incubated in a growth chamber (Sanyo Versatile Environmental Test Chamber, Model
no MLR 351H) for germination with a 12 hr photoperiod at 28oC for 7-10 days.
Seedlings with good root and shoot systems were transplanted to hydroponic tanks.

Chapter 2
41
2.1.3 Hydroponic systems
Twelve litre blue coloured plastic boxes were used to establish hydroponic systems
for growing rice seedlings for salinity tolerance assays. The white lids of these boxes
contained 96 small holes at equal distances to hold 1.5 ml microtubes. Rice seedlings
were transplanted into 1.5 ml microtubes which had their lids and 6 mm of the bottom
removed to allow for the seedling roots to grow out of the tube into the nutrient solution
in the box. The tubes were placed into the holes in the lids suspended above the
hydroponic solution (Figure 2.1). Continuous aeration of the hydroponic solution was
achieved by using a commercially available aquarium pump, plastic tubing and
aeration stones (Shavrukov et al., 2012).
Figure 2.1 Rice seedlings growing on mini hydroponic systems
The hydroponic tanks were filled with nutrient solution prepared using RO water
(water filtered through Reverse Osmosis system) and containing 5 mM NH4NO3;
5 mM KNO3; 2 mM Ca(NO3)2.4H2O; 2 mM MgSO4.7H2O; 0.1 mM KH2PO4; 0.05 mM
NaFe(III)EDTA; 5 µM MnCl2.4H2O; 5 µM ZnSO4.7H2O; 50 µM H3BO3; 0.5 µM
CuSO4.5H2O; and 0.1 µM Na2MoO3; pH 6-7 (Cotsaftis et al., 2011). The H3BO3 was

Chapter 2
42
removed from the medium when hydroponics were established at Plant Accelerator,
Waite campus as the RO water already rich with boron (Dr. Yuri Shavrukov, University
of Adelaide, personnel communication). The nutrient medium was replaced weekly
until the experiment was completed and the nutrient solution was topped up regularly
with RO water to maintain the total volume.
2.1.4 Measurement of plant biomass and tissue ion concentration
Destructive sampling (complete destruction of whole tissue sample) was carried out
to determine the root and shoot biomass from seedlings treated with 120 mM NaCl
for 10 days (salt-treated) and from non-treated seedlings grown under the same
experimental conditions as salt-treated seedlings. Root samples (cut from ~1 cm
below the shoot-root junction) taken from the hydroponic solution were thoroughly
washed with water to remove residual NaCl and other nutrients still present on root
surface before being blotted dry with paper towels. Root and shoot samples were
weighed immediately to determine fresh weight. Dry weights of tissues were
measured after samples were dried at 80oC in an oven for two days.
Tissue Na+ and K+ concentrations were measured in total root and shoot tissues
collected from each replicate. Tissues placed in 50 ml Falcon tubes were digested in
20-40 ml of 1% (v/v) nitric acid (HNO3) for 5 hours minimum at 70oC in a Hot Block
(Model SC 154, Environmental Express, Mt Pleasant, SC, USA) or in an oven.
Samples were shaken several times to ensure complete digestion. The
concentrations of Na+ and K+ were determined on the digest (taken without disturbing
plant materials) using a Flame photometer (Model 420; Sherwood Scientific Ltd,
Cambridge, UK). The tissue ion concentrations were calculated as sap based (based
on the tissue water content) and dry weight based methods.

Chapter 2
43
2.2 Molecular analysis
2.2.1 Extraction of nucleic acid from plant tissues
2.2.1.1 Total RNA
Total RNA from rice leaf and root tissues was extracted using the TRIZOL based
extraction method (Chomczynski and Sacchi, 2006). In this study, TRIZOL reagent
was replaced with TRIZOL-like reagent, which consisted of 38% (v/v) phenol pH 4.3
(Cat. No. P4682, Sigma Aldrich, St. Louis, MO, USA), 12% (w/v) guanidine
thiocyanate (Cat. No. G9277, Sigma Aldrich, St. Louis, MO, USA), 7% (w/v)
ammonium thiocyanate (Cat. No. 221988, Sigma Aldrich, St. Louis, MO, USA), 3%
(w/v) 3 M sodium acetate, pH 5.0, and 5% (v/v) glycerol. The whole RNA extraction
process was carried out under the fume hood.
Fresh rice leaves and roots were sampled into 10 ml yellow cap tubes and snap frozen
in liquid nitrogen. Samples were stored at -800C until use. Liquid nitrogen cooled
tissues in yellow cap tubes (root or shoot) were ground to a fine powder by vortexing
(Vortex Mixer, Ratex Instruments, Australia) at maximum speed with several (2-3)
9 mm stainless steel balls to maximize grinding. The ball bearings were removed and
50-100 mg of fine powder was transferred to 2 ml microtubes. The plant material was
lysed by adding 1 ml of pre-cooled TRIZOL-like reagent. The samples were
thoroughly mixed by quick vortexing (for 10 sec) and then incubated at room
temperature for 5 min. The mixtures were centrifuged at 11,000 x g for 10 min in a
cold room (4oC) and the supernatants were transferred to fresh 1.5 ml microtubes. To
remove proteins and other organic contaminants, 200 l of chloroform was added into
each sample and mixed vigorously by quick vortexing (for 10 sec) and incubated at
room temperature for 10 min. Samples were again centrifuged at 11,000 x g for
20 min in the cold room. After centrifugation, the colourless upper aqueous layer
containing the RNA was transferred into fresh 1.5 ml microtubes without disturbing

Chapter 2
44
the bottom debris. Five hundred ml of iso-propanol was added into each tube and the
tubes were mixed well by quick vortexing and then incubated at room temperature for
10 min to precipitate RNA. The tubes were centrifuged at 11,000 x g for 10 min in a
cold room to pellet RNA. The supernatants were removed and the RNA pellets were
washed by adding 1 ml of 75% (v/v) ethanol. Samples were mixed well and
centrifuged at 7,500 x g for 5 min in the cold room. Ethanol was removed without
disturbing the RNA pellet. The RNA pellets were air dried in the fume hood for
10-15 min then were redissolved in 25 µl of sterile Milli-Q water at 60oC for 10 min to
assist the resuspension of RNA. The quality and quantity of RNA were estimated
using a NanoDrop 1000 spectrophotometer (Thermo Scientific Pty Ltd, USA).
Absorbance was measured at wavelengths of 230, 260 and 280 nm. The purity of the
total RNA was assessed using the ratio of absorbance at 260 and 280 and 260 and
230 nm. RNA was stored at -80oC until further use.
2.2.1.2 Genomic DNA
DNA extraction was done according to the method described by Pallotta et al. (2003)
from freeze dried leaf tissues with several modifications. Two pieces of 2-3 cm long
leaf segments were collected into 2 ml microtubes (Eppendorf) from 3-4 weeks old
rice seedlings and stored at -80oC. Tissues were then transferred to a freeze dryer
(Christ Beta 2-8 freeze dryer, John Morris Scientific Pty Ltd) to dry the samples
overnight. Two 4 mm ball bearings were added into each tube and the tissues ground
to a fine powder using a Retsch Mill, MM 400 at a frequency of 30/second for 1-2 min.
Ball bearings were then removed from the tubes.
DNA extraction buffer (0.1 M Tris-HCl at pH 7.5, 0.05 M EDTA and 1.25% (w/v) SDS)
was preheated to 650C and 600 µl was added to each tube. The tubes were shaken
well and incubated at 650C for 30 min. Then the tubes were mixed thoroughly and
cooled to room temperature before adding 300 µl of 6 M ammonium acetate. The

Chapter 2
45
microtubes were mixed vigorously again to mix plant materials in ammonium acetate
and left to stand for 15 min in a fridge at 4oC, centrifuged at 1,300 x g (4000 rpm) at
4oC for 15 min to precipitate proteins and plant residues. Six hundred microliters of
supernatants were recovered into fresh 1.5 ml tubes and 360 µl of iso-propanol was
added into each. The microtubes were mixed vigorously and the DNA was allowed to
precipitate for 20-30 min at room temperature. DNA was pelleted by centrifugation at
1,300 x g and the supernatants tipped off. The tubes were inverted on paper towels
for less than 1 min to drain off remaining fluid with due care not to lose the DNA pellet.
Then the pellets were washed with 70% ethanol by short vortexing and centrifuged at
1,300 x g at 4oC for 20 min, and the supernatants discarded. The DNA pellets were
resuspended in 200 µl of sterile Milli-Q water and left overnight at 4oC in a fridge to
ensure dissolving. The DNA solutions were centrifuged again at 1,300 x g for 20 min
to remove undissolved cellular components and 150 µl of each supernatant was
transferred into a fresh tube. DNA quantification and quality assessment were carried
out using the NanoDrop 1000 spectrophotometer (Thermo Scientific Pty Ltd) and
stored at -20oC until use.
2.2.2 Polymerase chain reaction (PCR)
Go Taq Flexi DNA polymerase and the corresponding MgCl2, 5 x (green or colourless)
reaction buffer and dNTP mix from Promega (Madison, WI, USA; www.promega.com)
were used in general PCR. PCR reactions consisted of 5 µl of 5 x reaction buffer,
3 µl of 25 mM MgCl2, 0.4 µl of 10 mM dNTP mix, 0.4 µl of 20 µM forward primer,
0.4 µl of 20 µM reverse primer, 0.1µl of Go Taq DNA polymerase, 1-2 µl of template
DNA and sterile Milli-Q water to final volume of 25 µl. PCR reactions were carried out
in a thermal cycler (MyCyclerTM, Bio-Rad). The PCR cycles were started with an
initial denaturation at 94oC for 2 min, followed by 35-39 cycles of denaturation
(94oC for10 sec), annealing (55-62oC, depending on the primer pair, for 10 sec) and
extension (72oC for 20 sec). Reactions were completed with a final extension at 72oC

Chapter 2
46
for 2-5 min depending on the size of the final product. PCR products were separated
by gel electrophoresis in 1.5% agarose (Promega, Madison, MI, USA or Bioline,
Alexandria, NSW, Australia) gels.
2.2.3 Agarose gel electrophoresis
The DNA products from PCR, RT-PCR, and restriction digestions were separated by
agarose gel electrophoresis. The gels were prepared using 1 x TAE buffer (40 mM
Tris base, 20 mM acetic acid and 1 mM EDTA, pH 8.0) and 1-2% (w/v) analytical
grade agarose (Promega, Madison, MI, USA or Bioline, Alexandria, NSW, Australia).
GelRed (Biotium) or SYBR Safe Gel Stain (Bio-Rad, Hercules, CA, USA) was used
to stain DNA. Each gel was cast and run in an EasyCast Mini Gel System (Bio-Rad).
Gels were submerged in 1 x TAE buffer. Each PCR product was mixed with loading
dye (Promega, www.promega.com) before loading on to the gel (if not PCR buffer
with loading dye was used in PCR reaction). DNA marker ladders, 1 kb or 100 bp
DNA ladders from Promega, were used to determine the approximate size of the DNA
product. Electrophoresis was run at 90 volts for about 45 min to separate DNA. All gel
imaging was performed on the GelDocTM EZ imager (Bio-Rad) or ChemiDocTM MP
Imaging System (Bio-Rad).
2.2.4 Complementary DNA (cDNA) synthesis
The iScriptTM cDNA Synthesis Kit (Bio-Rad) was used to reverse transcribe mRNA
into cDNA. The reaction was carried our as per the manufacture’s guidelines. A 20 µl
reaction was made up including 4 µl of 5 x iScript reaction mix, 1 µl iScript reverse
transcriptase, 1 µg of DNase-treated RNA and nuclease-free water to a final volume
of 20 µl. The reaction mix was incubated at 25°C for 5 min, 42°C for 30 min, and 85°C
for 5 min in a thermal cycler (MyCyclerTM, Bio-Rad). The synthesised cDNA was
diluted 1:9 in sterile Milli-Q water before being used in qPCR/RT-PCR reactions.

Chapter 2
47
2.2.5 Reverse transcription polymerase chain reaction (RT- PCR)
RT-PCR was performed to check the expression of transgenes. The RT-PCR reaction
was set up in the same manner as the general polymerase chain reaction described
in Section 2.2.2 using cDNA (Section 2.2.4) as template.
2.2.6 Colony PCR
Glycerol stock cultures (-80oC) of bacteria carrying entry clones of genes of interest,
and the empty binary vector pIPKb003 were used to initiate plate cultures. Colony
PCR was performed to select bacterial colonies carrying AtAOX1a and AtNDB2 entry
clones and expression clones using gene-specific primers (Table 2.1). A single colony
grown on Luria Betani (LB) plates (tryptone (Sigma-Aldrich, Australia) 10 g/l, yeast
extract 5 g/l and NaCl 5 g/l, pH 7.5, supplemented with the relevant antibiotic) was
picked with the help of a pipette tip and swirled in sterile TE buffer. This cell
suspension was used as DNA template in a colony PCR. The reaction set up and
thermocycler conditions were as in Section 2.2.2. The PCR products were visualized
on a 1.5% agarose gel (Section 2.2.3) in order to check the presence of gene of
interest. 5-8 PCR positive colonies were selected for diagnostic restriction digestions.
Table 2.1 Primers used in molecular analysis of AtAOX1a and AtNDB2 genes
Gene name Forward primer sequence Reverse primer sequence Product size (bp)
AtAOX1a (At3g22370)
CTGGACCACGTTTGTTC ACACCCCAATAGCTCG 277
AtNDB2 (At4g05020)
CCGAAACTGATGATGTATCTAAG
CCGTATGGAAGAGTGTGAGAA
172

Chapter 2
48
2.2.7 Isolation and purification of plasmid DNA
Plasmid DNA was isolated from various bacteria carrying the pIPKb003 empty vector,
entry vectors, and expression vectors for diagnostic restriction digestion,
transformation reactions as well as for DNA sequencing. The Wizard® Plus SV
Minipreps DNA Purification System (Promega) was used as per manufacture’s
guidelines.
Plasmid DNA was isolated from 10 ml of overnight grown bacterial cultures in LB liquid
medium which were initiated from single colonies raised on selection medium. The
bacterial cells were harvested by centrifugation at 4000 x g for 2 min in a benchtop
centrifuge and used to produce a clear cell lysate. The supernatant was poured off
and the pellet was completely resuspended in 250 µl cell resuspension solution with
vigorous vortexing and transferred into 1.5 ml Eppendorf tubes. Then, 250 µl cell lysis
solution was added and mixed well by inverting tubes 5-6 times. The cell lysate was
incubated at room temperature (RT) for about 5 min until the solution cleared. Ten
microliters of alkaline protease solution was added and mixed well by inverting tubes
5-6 times and incubated at RT for 5 min. The alkaline protease inactivates
endonucleases and other proteins released during the lysis of the bacterial cells that
can adversely affect the quality of the isolated DNA. Then, 350 µl of neutralization
solution was added and mixed well. The lysate was centrifuged at 14,000 x g in a
microcentrifuge for 10 min at RT. The cleared lysate was applied directly to a spin
column without disturbing the white precipitate and centrifuged for 1 min. The filtrate
in the collection tube was discarded and 750 μl of column wash solution was added
and centrifuged at maximum speed for 1 min. This step was repeated with 250 µl of
column wash solution. The columns were centrifuged for a further 2 min to remove
residual ethanol. The spin columns were transferred into new 1.5 ml Eppendorf tubes
and 50 µl nuclease free water added then incubated for 5 min at RT. Plasmid DNA
was eluted by centrifugation at 14,000 x g for 1 min and stored at -20oC until use.

Chapter 2
49
2.2.8 Diagnostic restriction digestion
Restriction digests were conducted as per the guidelines recommended by the
manufacturer; New England BioLabs. BamHI, PstI and EcoRV restriction enzymes
were used in the study. Custom digestions of plasmid DNA were performed with the
selected restriction enzymes and cut sites and expected lengths of DNA fragments
were determined using NEBcutter V2.0 (http://tools.neb.com/NEBcutter2/ index.php)
computer program (Vincze et al., 2003). The expected DNA fragment patterns were
compared with the DNA band patterns resulting from the actual restriction digests by
visualizing on a 0.8% (w/v) agarose gel.
2.2.9 Preparation of electro-competent cells
Electro-competent cells of both E. coli strain, DB10B and Agrobacterium tumefaciens
strain, AGL1 were prepared following a standard protocol:
A loop full of bacterial cells from a -80ºC glycerol stock was used to establish a 10 ml
LB culture containing the appropriate antibiotic and incubated overnight at 37ºC
(or 30ºC if A. tumefaciens was used) with shaking. On the following day, 1 ml of the
overnight culture was used to inoculate 250 ml of LB and incubated at 37ºC (or 30ºC
if A. tumefaciens was used) with shaking for 4-5 hours until the optical density reached
0.6 at 600 nm (measured in a Beckman DU 640 spectrophotometer, USA). The
culture was then chilled on ice for 10 min and then transferred aseptically into 50 ml
ice-cold Falcon tubes prior to centrifugation at 3000 x g for 20 min at 4ºC. The pellet
was resuspended in 50 ml of sterile Milli-Q water and centrifuged for 15 min at 4oC.
The pellet was then resuspended in 5 ml of 10% (v/v) autoclaved glycerol and
centrifuged at 3000 x g for 30 min. Finally, the pellet was resuspended in 200 µl of
ice-cold sterile 10% (v/v) glycerol. The cells were divided into aliquots (20 µl), snap
frozen in liquid nitrogen and stored at -80ºC.

Chapter 2
50
2.2.10 Gateway cloning system
The Gateway® cloning system (Invitrogen) was used to transfer genes of interest from
Gateway entry clones into pIPKb003 destination vector (Himmelbach et al., 2007),
using the LR Clonase® II. Reactions were performed according to the manufacturer’s
guidelines. Two microliter of LR Clonase II enzyme mix (Cat. No. 11791-100) was
added to the reaction mix containing 1-7 µl of plasmid DNA from entry clone
(50-150 ng/µl) and TE buffer at pH 8.0 up to a final reaction volume of 10 µl. The
mixtures were incubated at 25oC overnight (~16 hrs). Then, 1 µl proteinase K was
added to the mixtures and they were incubated at 37oC for 10 min to inactivate LR
Clonase II enzyme and to terminate the reaction. The recombinant plasmid DNA
mixtures were used to transform E.coli strains DH10B through electroporation.
2.2.11 Transformation of plasmid DNA into E.coli strain DH10B
The plasmid DNA carrying genes of interest were introduced into E.coli strain DB10B
cells by electroporation. Plasmid DNA (1-100 ng) was mixed with 20 µl of electro-
competent E. coli strain DH10B cells and the electroporation was performed with a
Gene Pulser II Porator Electroporation System (Bio-Rad) according to the
manufacturer’s instructions. Cells were incubated with 250 µl of liquid LB medium
(without antibiotics) at 37oC for 45 min with shaking. A 50 µl volume of bacterial culture
was then spread on LB agar plates supplemented with the appropriate antibiotic
(usually 100 µg/ml spectinomycin) and the plates were incubated at 37oC overnight.
Several relatively large single colonies were selected and colony PCR (Section 2.2.6)
was carried out with gene-specific primers (Table 2.1) to confirm the presence of the
gene of interest. The PCR-positive colonies were selected to establish liquid LB
cultures containing the appropriate antibiotic. The overnight grown cultures were used
to prepare glycerol stocks or to isolate plasmid DNA for diagnostic restriction
digestion, and for DNA sequencing.

Chapter 2
51
2.2.12 Transformation of plasmid DNA into A. tumefaciens strain AGL1
Genetic constructs were introduced into Agrobacterium strain AGL1 by
electroporation as above (Section 2.2.11) except using 20 µg/ml rifampicin and
100 µg/ml spectinomycin and plates were incubated at 30oC overnight. Several
relatively larger colonies were selected and colony PCR (Section 2.2.6) was
performed with gene-specific primers (Table 2.1) to confirm the presence of the gene
of interest. The PCR-positive colonies were selected to establish LB liquid cultures.
The overnight grown cultures were used to prepare glycerol stock cultures which were
then stored at -80oC for future use in callus transformation.
2.2.13 DNA sequencing
Sequence analysis of the IPKb003 destination vectors, carrying coding DNA
sequences (CDS) of AtAOX1a and AtNDB2 genes, were done by using vector specific
primers. (Forward primer sequence: TGCGGAGCTTTTTTGTAGGCGCG; Reverse
primer sequence: CCGGCAACAGGATTCAATCTTAAG). The primers were
designed about 40-50 bases away from the ATG start codon and stop codon of the
gene of interest. Plasmid DNA was isolated and purified as described in Section 2.2.7.
The purified DNA samples were prepared as per the guidelines provided by Australian
Genome Research Facility (AGRF), Waite campus, Urrbrae, South Australia and
submitted for sequencing. DNA sequence data (chromatograms) were checked for
accuracy using the Chromas Lite 2.0 (chromas-lite.software.informer.com/2.0/)
computer program and sequence alignments were done using the Clustal Omega
multiple sequence alignment program (www.ebi.ac.uk/Tools/msa/clustalo).
2.2.14 Preparation of glycerol stock cultures
Overnight-grown bacterial cultures carrying the genetic constructs were used to
establish glycerol stock cultures. Five hundred microliter of bacterial culture was
mixed well with 500 µl of sterile glycerol (50% (v/v)) in 1.5 ml screw capped tubes.

Chapter 2
52
The tubes were snap frozen in liquid nitrogen and stored in -80oC for future use.
2.3 Gene expression analysis
2.3.1 Gene nomenclature
The genomic sequences and other relevant details of all the alternative oxidases
(AOX) and alternative dehydrogenases (NDH) identified in rice were obtained from
the Rice Genome Annotation Project (rice.plantbiology.msu.edu) and Gramene
(www.gramene.org) databases. The gene nomenclature used in the present work
followed the guidelines described by McCouch (2008). Details of the alternative
respiratory genes identified in rice can be found in Table 3.2 and will be discussed in
Sections 3.3.1 and 3.3.2.
2.3.2 Primer designing
Primers were designed for qRT-PCR analysis, general PCR and for sequencing of
plasmid clones. The qRT-PCR primers were manually designed to span a 100-200
bp product. The melting temperatures of primers were calculated by using
OligoCalc: Oligonucleotide Properties Calculator computer software
(www.basic.northWestern.edu/biotools/OligoCalc.html). The self-complementarity
(possibility of forming primer dimers, potential hairpin formation and 3’
complementarity) of primers were checked with the same computer software as
above. Primers were designed to span an intron-exon boundary and close to the 3’-
end of the gene where possible. The genomic sequences of AOXs and NDHs were
BLAST against corresponding coding DNA sequences (CDS) to locate introns and
exons using the SDSC (San Diego Supercomputer Centre) Biology Workbench
(workbench.sdsc.edu/.). All primer pairs were tested by standard RT-PCR using Go
Taq Flexi DNA polymerase and the presence of a single amplification product of the
expected size for each gene was verified by electrophoresis.

Chapter 2
53
For confirmation of the sequence of expression clones, both forward and reverse
primers were designed from the vector backbone 40-50 bases away from the point
where gene of interest was inserted. All primers were synthesized either by
GeneWorks Pty Ltd (Australia) or Sigma-Aldrich Australia. The details of the primers
used in this study including sequences for the reference genes can be found in Table
2.2 and 2.3, respectively.
2.3.3 Preparation of qRT-PCR standards
qRT-PCR standards were prepared for three rice AOXs, (OsAOX1a, OsAOX1b and
OsAOX1c), six rice NDHs (OsNDA1-2, OSNDB1-3 and OsNDC1), six selected
reference genes (OsActin, OsElf1, OsPplase, OsGAPDH, Ostubulin, Os18S) and for
two antioxidant defence genes, OsMnSOD and OsCAT-A. PCR was performed with the
respective primer pairs using cDNA as templates, the presence of a single product at
expected size was verified for each gene by visualizing on 1.5 % agarose gel. The
PCR products were purified using the Wizard SV Gel and PCR Clean-UP system
(Promega, USA) and quantified using a Nanodrop spectrophotometer
(ThermoScientific, Waltham, USA). Standards for qRT-PCR were prepared with
purified products at concentrations of 10-2, 10-4 and 10-6 fmol/µl for subsequent qRT-
PCR analysis.

Chapter 2
54
Table 2.2 Details of primers used for qRT-PCR analysis
Gene name
Gene description
Forward primer sequence
Tm (°C)
Reverse primer sequence
Tm (°C)
Expected product size (bp)
OsAOX1a Alternative oxidase 1a CGTCAATCACTTCGCATCGG 53.8 GCAAATCCTCGGCAGTAGAC 53.8 105
OsAOX1b Alternative oxidase 1b AGGGGATGAAGCTGAAGGAT
51.8 TACGCATGTAGTAGCAGTGAT
50.5 109
OsAOX1c Alternative oxidase 1c AAGATCGAGAACGTCCCCGCG 58.3 TCCATCCCCTGAAAATGAACAT 51.1 158
OsNDA1 Alternative dehydrogenase A1
GGTGGACCTGAGGGAGAACAAG 58.6 CAGTTGACCGCCACGTAGAACC 58.6 132
OsNDA2 Alternative dehydrogenase A2
GATGTTAAACAGCGTTATTCACATGT 53.2 ACCTCTTCTCCATTGTCCAGGAT 55.3 197
OsNDB1 Alternative dehydrogenase B1
TGTGGATTCCCAAGTTAAAAGT 49.2 AATTGTGTCGTCCTGATCCTGT 53.0 163
OsNDB2 Alternative dehydrogenase B2
AGGATCAGAGGCACAGGGCGTC 60.4 TGGCATAGACAGAATACCATAG 51.1 165
OsNDB3 Alternative dehydrogenase B3
ATTTGCTGAGGATAAGTTTGGA 49.2 CAATTTGTTTCATGAACTCTGA 47.4 191
OsNDC1 Alternative dehydrogenase C1
CTACTATTGGAACTTCAACCTGCT 54.0 CTACCTGGCCCCGACCATTTAA 56.7 157
OsMnSOD Manganese-superoxide dismutase
AACTTGGTTCCTTTGTTGGGAATT
52.3 AACATCAAGCAGTCGCATTTTCGTA 54.4 151
OsCAT-A Catalase isozyme A ATAGACAGGAGAGGTTCATCCG 54.8 TCACATGCTTGGCTTCACGTTGA
55.3 158

Chapter 2
55
Table 2.3 Details of reference gene primers used in the study
Gene name
Gene description
Forward primer sequence
Tm (°C)
Reverse primer sequence
Tm (°C)
Product size (bp)
Reference
OsActin Actin GAAGATCACTGCCTTGCTCC 53.8 CGATAACAGCTCCTCTTGGC 53.8 249 (Kim et al., 2003)
OsElf1 Elongation factor 1 alpha
ATCTGGGAAATCATCGGTTCTG 53.0 AGATCGTCCACAATGGTCATCA 53.0 189 (Cotsaftis et al., 2011)
OsGAPDH Glyceraldehyde-3-phosphate dehydrogenase
GGGCTGCTAGCTTCAACATC 53.8 TTGATTGCAGCCTTGATCTG 49.7 190 (Kim et al., 2003)
OsTubulin Alpha tubulin TACCGTGCCCTTACTGTTCC 53.8 CGGTGGAATGTCACAGACAC 53.8 234 (Kim et al., 2003)
OsPplase Peptidylprolyl isomerase
CTGGCAAAGAACCTAAACCTCATC 55.7 TGCTCCTGTGGTGTAACTGCTTT
55.3 194 (Cotsaftis et al., 2011)
Os18S 18S ribosomal RNA ATGATAACTCGACGGATCGC 51.8 CTTGGATGTGGTAGCCGTTT 51.8 169 (Kim et al., 2003)

Chapter 2
56
2.3.4 Quantitative Reverse Transcription Polymerase Chain Reaction (qRT-PCR)
Gene expression analysis was carried out with three AOXs (AOX1a, AOX1b and
AOX1c) and six NDHs (NDA1-2, NDB1-3, and NDC1) and antioxidant defence genes.
The qRT-PCR analysis was performed with a CFX96 Real Time PCR Detection
System (Bio-Rad, Hercules, California, USA). Reactions in final volume of 10 μl were
set up with the 5 μl SsoFast EvaGreen Supermix Master Mix (Bio-Rad, Hercules,
California, USA), 2 μl cDNA sample, 0.3 μl of 20 μM gene-specific forward and reverse
primers, and sterile Milli-Q water to a total volume 10 μl.
All the PCR reactions were performed using the following conditions: 3 min at 95°C
and 39 cycles of 10 s at 95°C, 30s at 55-60°C and 10 s at 95°C, and then a melt
gradient from 65oC to 95oC for 5s, in 96-well white colour reaction plates (Bio-Rad,
California, USA). The specificity of the amplification was tested by dissociation curve
analysis and agarose gel electrophoresis.
2.3.5 Reference gene selection for normalization of qRT-PCR data
Six rice reference genes, OsActin, OsTubulin, OsGAPDH, OsPplase, OsElF1 and
Os18S, which have already been widely used in qRT-PCR studies in rice (Table 2.3),
were tested with selected cDNA samples from cultivar Nipponbare and Langi.
Samples were selected representing different time points, different tissue types (root
and shoot) as well as treated and untreated samples. Final absolute quantification
cycle (Cq) values from qRT-PCR (Section 2.3.4) representing the mean of three
biological replicates with three technical replicates (Fan et al., 2013) were used to
compare expression stability of reference genes across samples tested. Three
reference genes with least variation across tested samples (based on coefficient of
variance) were selected as reference genes for subsequent gene expression
investigations.

Chapter 2
57
2.4 Protein analysis and enzyme activity assays in isolated mitochondria
2.4.1 Isolation and purification of mitochondria
For enzyme activity assays and mitochondrial protein analysis it was necessary to
isolate mitochondria from salt-treated and untreated root and shoot tissues from rice.
Seedlings of cv. Nipponbare growing at their early vegetative stage (4-week-old) were
used to isolate mitochondria. Nipponbare is a model japonica rice cultivar which has
been used as a standard rice cultivar in a variety of abiotic and biotic stress studies
and was used in this study.
Mitochondrial isolation was carried out following the method described by Kristensen
et al. (2004) with slight modifications. Shoots and roots (30-40 g fresh weight) were
harvested separately from salt-treated and control hydroponically-grown rice
seedlings nine days after salt application. The roots taken out from the hydroponic
solution were thoroughly washed with water to remove residual NaCl and other
nutrients and blotted dry with paper towels. Mitochondrial isolation was carried out
separately for shoot and root tissues and all the steps were done at 4oC in the cold
room. Shoots/roots were cut into 2-3 cm pieces and homogenized with a Polytron
PT10-35 GT dispersing unit (Kinematica, Australia) by 5 x 10 s bursts at around
5000 rpm in the isolation medium (30 g fresh weight/300 ml of medium; 0.3 M
mannitol, 5 mM EDTA, 30 mM MOPS, 1% (w/v) BSA, 5 mM DTT, 1% PVP, pH 7.3).
The homogenate was strained through two layers of Mira-cloth (Cat No. 475855-IR,
Calbiochem, USA) and centrifuged (Avanti J-26 XPI centrifuge, Beckman Coulter,
USA using JA 25.50 rotor) at 1,935 x g (4000 rpm) for 5 min. The supernatant was
transferred into fresh tubes and centrifuged at 17,418 x g (12,000 rpm) for 20 min.
Then the supernatant was discarded and the crude mitochondrial pellet was
resuspended in wash medium (0.3M mannitol, 1mM EDTA, 10mM MOPS, pH 7.2)
and centrifuged at 17,418 x g for 20 min. The crude mitochondrial pellet was again

Chapter 2
58
resuspended in 1-2 ml of wash medium and layered on the top of discontinuous
Percoll gradient which consisted of four layers: 6 ml of 60% (v/v) Percoll, 8 ml of 45%
(v/v) Percoll, 10 ml of 28% (v/v) Percoll and 10 ml of 5% (v/v) Percoll. The gradient
was centrifuged at 30,000 x g (13,200 rpm) for 45 min (Optima L-100 XP centrifuge,
Beckman Coulter, USA using SW32T1 rotor) so that the cellular organelles and debris
were separated according to their density. In this gradient, mitochondria were located
in between the 28% Percoll layer and the 45% Percoll layer (Figure 2.2). The layers
above the mitochondrial band were removed carefully by aspiration without disturbing
the mitochondrial band. The mitochondrial band was taken out with a pasture pipette
and Percoll contamination of pellet was completely removed by repeated dilution (with
wash medium) and pelletation (Avanti J-26 XPI centrifuge, Beckman Coulter, USA
using JA 25.50 rotor, 39,191 x g (18,000 rpm) for 20 min).
Figure 2.2 Separation of mitochondria by Percoll discontinuous density gradient centrifugation
The Percoll gradient centrifugation technique separates suspensions of organelles and cell
debris from tissue homogenate according to their density.
5%
28%
45%
60%
Band 1
Band 2
Band 3
Band 4
Mitochondria

Chapter 2
59
The final pellet was resuspended in a small volume (~0.8 ml) of wash medium.
Isolated mitochondria were immediately used for biochemical assays or snap frozen
in liquid nitrogen and stored at -80oC for protein quantification and Western blot
analysis.
2.4.2 Respiratory Assays
Mitochondrial respiratory assays were carried out with a Clark-type Oxygraph Plus
oxygen electrode system (Hansatech Instruments Ltd). Calibration of the instrument
was carried out according to the manufacturer’s guidelines and oxygen consumption
rates of mitochondria isolated from control and salt-treated shoot and root tissues
were investigated at 25oC.
2.4.2.1 Alternative oxidase activity assay
The oxygen uptake rate of mitochondria isolated from shoot or root was measured in
1 ml total volume of a standard reaction medium (0.3 M mannitol, 10 mM TES, 10 mM
KH2PO4, 2 mM MgCl2, pH 7.2) containing 200 µl mitochondria (equivalent to 0.4-0.8
mg mitochondrial protein). Total oxygen consumption rate was measured in the
presence of following components in final concentration; 10 mM succinate, 5 mM
pyruvate, 1 mM NADH, 1mM ATP, 1 mM ADP, 5 mM DTT. The cyanide resistant and
the residual oxygen consumption rates were determined in the presence of 1 mM
KCN and 250 nM OG (Octyl Gallate) in final concentrations, respectively.
2.4.2.2 Alternative dehydrogenase activity assay
The oxygen uptake rate of mitochondria isolated from root or shoot was measured in
1 ml total volume of standard reaction medium (as above) containing 200 µl
mitochondria (equivalent to 0.4-0.8 mg mitochondrial protein). to determine activities
of total external NADH and NADPH dehydrogenases, Ca2+ dependent and Ca2+
independent external NADH and NADPH dehydrogenases.

Chapter 2
60
Initially, EGTA was added into the reaction medium at 3 mM final concentration and
allowed 2 min to chelate Ca2+. Then, oxygen consumption rate by Ca2+ independent
NADPH dehydrogenase was measured in the presence of NADPH and ADP at 2 mM
final concentration. The maximal rate of NADPH oxidation (total oxygen consumption
by Ca2+ independent and Ca2+ dependent NADPH dehydrogenases) was measured
by addition of CaCl2 at 2 mM final concentration. The oxygen consumption rate by
Ca2+ dependent NADPH dehydrogenase was calculated as total oxygen consumption
– oxygen consumption by Ca2+ independent dehydrogenase. Similarly, total NADH
oxidation, Ca2+ independent and Ca2+ dependent NADH oxidation were determined
using NADH and ADP as substrates.
2.4.3 Determination of protein concentration
The concentration of isolated mitochondrial protein was determined using a BCA
Protein Assay Kit (Pierce, Rockford, IL, USA) as per manufacturer’s guidelines using
a microplate method. Absorbance was measured at 572 nm using a POLARstar
Omega microplate reader (BMG LABTEC, The Microplate Reader Company).
2.4.4 Antibody designing and testing
Polyclonal antibodies were derived from peptides to identify rice NDB2 (OsNDB2)
protein. The specificity of the peptide sequences were tested by Clustal analysis
(http://www.ebi.ac.uk/Tools/msa/clustalo/) of protein sequences with other rice
alternative dehydrogenases. Antibody production was done by BioMatiks
(www.biomatik.com).
2.4.5 Antibody dot blot technique
The effectiveness of antibodies was evaluated by dot blot technique. A range of
primary antibody dilutions was tested at a range of antigen (peptide) dilutions. Using
a narrow-mouth pipette, 2 µl from undiluted, 1/2, 1/4, 1/8 and 1/16 -fold diluted peptide
solutions were applied to nitrocellulose membrane strips. The area of solution binding

Chapter 2
61
to the membrane was minimized by applying the solution slowly. Then, the membrane
strips were allowed to air dry for 10 min. Strips were placed in individual plastic
containers and non-specific sites were blocked by soaking in blocking buffer (20 mM
Tris base, 150 mM NaCl, 5% skim milk, 0.1% Tween 20 pH 7.4) at RT for 1 hr with
gentle agitation on a rotary platform. Membrane strips were then incubated with range
of primary antibody dilutions (1:2000 to 1:12,000 dilutions) in blocking buffer for 1 hr
with gentle agitation. The membrane strips were washed three times (5 min each) in
TBST buffer (20 mM Tris base, 150 mM NaCl, and 0.1% (v/v) Tween 20 pH 7.4) while
agitating, to remove excess primary antibody. Then membrane strips were incubated
with secondary antibody (HRP conjugated anti rabbit) in blocking buffer at RT for 1 hr
with gentle agitation. The secondary antibody dilution was done following the
manufacturer’s instructions. The membrane strips were washed three times with
TBST buffer (20 mM Tris base, 150 mM NaCl, and 0.1% (v/v) Tween 20, pH 7.4) to
remove excess secondary antibody while agitating as described above. Once
drained, membrane strips were developed in Immun-StarTM WesternTM
Chemiluminescent substrate (Bio-Rad) at RT and visualized using a ChemiDocTM MP
Western blot imaging system.
2.4.6 Western blot analysis
Comparison of the alternative respiratory pathway protein levels in salt-treated and
untreated tissues was done by using 10% SDS-PAGE (Sodium Dodecyl Sulphate–
Polyacrylamides Gel Electrophoresis) followed by Western blotting. Selected
proteins, having been separated according to their molecular weight by SDS-PAGE,
were identified using specific antibodies.
2.4.6.1 Preparation of 10% SDS-PAGE gel
The glass cassette sandwich for SDS-PAGE gel casting was prepared by placing two
cleaned glass plates, spacer plate and short plate, in the casting frame according to

Chapter 2
62
manufacturer’s instructions. The 10% (v/v) resolving gel monomer solution (40%
acrylamide, 10% SDS, 1.5 M Tris pH 8.8, 10% APS, TEMED) was poured into the gel
cassette up to a pre-marked level, about 1 cm away from the comb teeth. The
monomer solution was immediately overlayed with water to prevent oxidation and
allowed to polymerize for about 30-45 min. The top of the resolving gel was dried with
filter papers and a 4% (v/v) stacking gel monomer solution (40% acrylamide, 10%
SDS, 1.0 M Tris pH 6.8, 10% APS, TEMED) was poured on to the polymerized
resolving gel. The desired comb was inserted and aligned. The stacking gel was left
for about 30 min to polymerize. The gels were wrapped with wet filter papers and
stored at 4oC until required.
2.4.6.2 Sample preparation and separation
Samples (80 µg) of purified mitochondrial protein were used in the Western blot
analysis. Equal volumes of 2 x loading buffer (100 mM Tris HCl pH 6.8, 200 mM DTT,
4% SDS, 0.5% bromophenol blue, 20% glycerol) was added to each sample, mixed
well and the mixtures heated at 95oC for 5 min in a Single Dry Block Heater (Ratex
Instruments, Australia).
Precast 10% SDS-PAGE gels were assembled in electrode assembly module and
placed in a Mini-Protean Tetra cell tank (Bio-Rad) following the manufacturer’s
instructions. Gels were submerged in SDS-PAGE running buffer (25 mM Tris base,
192 mM Glycine, 0.1% SDS pH 8.3) and equal volumes of protein samples were
loaded, electrophoresed at 170 volts for 60 min to separate proteins. Molecular weight
marker (PrecisionPlus ProteinTM Dual colour Protein Marker, Bio-Rad) or NEB
unstained protein marker was also run with each gel to assess the size of the target
protein.

Chapter 2
63
2.4.6.3 Transferring the protein from the gel to the membrane
A wet transfer method was used to transfer separated proteins from the gel to the
nitrocellulose membrane. After electrophoresis, the stacking gel was removed from
the resolving gel. The resolving gel and the nitrocellulose membrane were
sandwiched between wet filter papers and wet sponges (Figure 2.3). After ensuring
no air bubbles were formed between the gel and the membrane, all parts of the gel
sandwich were clamped tightly together using a gel holder cassette (Bio-Rad). Then
the cassette was placed in the electrode module and the Mini Trans-Blot® Cell
(Bio-Rad) was assembled following the manufacturer’s instructions. The gel sandwich
was submerged in transfer buffer (25 mM Tris base, 152 mM Glycine pH 8.3) and
transfer was conducted at 60 volts for 90 min.
Figure 2.3 Set up for a gel “sandwich” to transfer protein from the SDS-PAGE gel to the nitrocellulose membrane
(http://www.ou.edu/OpenEducation/ou-resources/biochemical-methods/index.html)
2.4.6.4 Visualization of proteins in membranes
Locating the protein bands on the membrane as well as to check the success of
protein transfer from the gel to the membrane were done by staining with Ponceau S
(1% Ponceau stain, 2% acetic acid). The membrane was unloaded from the transfer
chamber and briefly washed with TBST (20 mM Tris base, 150 mM NaCl, 0.1% Tween

Chapter 2
64
20 pH 7.4), then the membrane was immersed in the Ponceau stain for about 15-30
min with gentle shaking and subsequently was washed in water to remove excess
stain until the background of the membrane was clear and the protein bands were
well defined. Then the membrane was destained completely by repeated washings in
TBST before staining with antibody.
2.4.6.5 Antibody staining
The membrane was blocked for one hour at RT using blocking buffer (20 mM Tris
base, 150 mM NaCl, 5% skim milk, 0.1% Tween 20 pH 7.4), which prevents non-
specific background binding of primary and/or secondary antibodies to the membrane.
Then the membrane was incubated overnight at 4oC with an appropriate dilution of
primary antibody in blocking buffer with gentle agitation. On the following day, the
membrane was washed three times, with a 15 min wash followed by two 5 min washes
with TBST buffer. The washing was accelerated by gentle agitation of the membrane
in the buffer. The membrane was then incubated with a pre-determined dilution of
secondary antibody in blocking buffer at RT for one hour. Excess secondary antibody
was removed from the membrane by washing three times in TBST buffer, as
described above. The membrane was drained and developed in Immun-StarTM
WesternTM Chemiluminescent substrate (Bio-Rad) at RT and visualized using a
ChemiDocTM MP Western blot imaging system.
2.4.7 Stripping membrane for re-probing
The membrane was stripped using stripping buffer (50 mM Tris base, 100 µM
β-mercaptoethanol, 2% SDS pH 6.8) for 30 min and washed thoroughly to remove
stripping buffer with TBST three times (5 min each) with gentle agitation. The
membrane was blocked with blocking buffer for 1 hr. Re-probing and visualization of
the membrane was carried out following the same procedure described in Section
2.4.6.5.

Chapter 2
65
2.4.8 Coomassie blue staining
Coomassie blue staining of gels were done to confirm the transfer of proteins to
membrane or to locate protein bands. Polyacrylamide gels were fixed in destain
solution (10% (v/v) glacial acetic acid and 10% (v/v) methanol) for 10-30 min, and
then incubated with Coomassie blue stain (0.1% (w/v) Coomassie blue, 40% (v/v)
methanol, 10% (v/v) glacial acetic acid) for 60 min. Gels were immersed in destain
solution until the background of the gel was fully destained with the solution being
replaced several times.
2.5 Data analysis
Graphs were plotted using either GraphPad prism version 7 or Microsoft Excel 2010
programs. Data are generally expressed as mean ± SEM (Standard Error of the
Mean). Analysis of variance or t-test was performed to determine whether there were
significant differences between means of control and treated samples at 95%
confidence level using GraphPad prism (http://www.graphpad.com/scientific-
software/prism/). Further details of statistical analytical methods used for each data
set can be found with relevant figures and tables in results sections.

Chapter 3
66
3 Alternative pathway of respiration in rice: Identification and characterization
3.1 Introduction
Two distinct pathways exist in the plant mitochondrial electron transport chain (ETC)
to oxidise NAD(P)H produced through the central respiratory pathways which include
the pentose phosphate and tricarboxylic acid pathways. Initially, the NAD(P)H
produced from both pathways feed into either Complex I or the alternative
dehydrogenases (NDH), to reduce the common pool of ubiquinone, which is then
oxidized by either the traditional cytochrome oxidase or alternative oxidase (AOX)
(Rasmusson et al., 2004). Alternative respiratory enzymes allow plant mitochondria to
respire in the presence of inhibitors of traditional respiratory complexes I, III, and IV;
rotenone, antimycin A (AA), and cyanide (CN), respectively (Finnegan et al., 2004). It
is proposed that these enzymes provide metabolic homeostasis of carbon and energy
metabolism, and signalling homeostasis in the organelle (Vanlerberghe, 2013).
Evidence suggests that this is particularly important during abiotic and biotic stress
tolerance (Vanlerberghe, 2013). Consequently, the alternative pathway has become
an area of research interest due to its potential role during stress tolerance.
Initially, our limited knowledge of genomic data hindered exploring the distribution of
alternative respiratory pathway components in different organisms. In earlier studies,
enzyme activity assays and inhibitor studies were used to show the presence of the
alternative respiratory enzyme activities. Yeast (Saccharomyces cerevisiae), which
lacks Complex I, has at least three non-phosphorylating NAD(P)H dehydrogenases in
its respiratory chain; two of these are external facing (ScNDE1, ScNDE2) and the other
is internal facing ScNDI1 (Luttik et al., 1998). These findings paved the way to explore
the distribution of NDHs in both animal and plant kingdoms. Enzyme activity assays
have shown that the alternative pathway enzyme activities to be present in
mitochondria from fungi such as Neurospora crassa (Weiss et al., 1970) as well as in

Chapter 3
67
plants like potato (Rasmusson et al., 1999). The availability of sequence data and
bioinformatics tools accelerated the process of identification and characterization of
alternative pathway genes in many organisms from the plant and animal kingdoms,
making it an area of research interest.
Initially, AOX was thought to be limited to plants and some fungi and protists. But
bioinformatics studies have found AOX sequences in organisms from all kingdoms
(except Archaebacteria) including animals (McDonald et al., 2003; McDonald and
Vanlerberghe, 2006). Taking advantage of publicly available genomic sequence data
and bioinformatics tools, it has been shown that alternative pathway genes, both AOXs
and NDHs, are present in most animal taxa except Arthropoda and Vertebrata
(McDonald and Vanlerberghe, 2006).
The alternative respiratory pathway in Arabidopsis has been well studied. It contains
five AOX genes, AOX1a-d and AOX2 (Thirkettle-Watts et al., 2003) and seven NDH
genes which are belong to three subfamilies, NDA (AtNDA1-2), NDB (AtNDB1-4) and
NDC (AtNDC1) (Michalecka et al., 2003). For all these genes, encoded proteins have
been localized to mitochondria and within the mitochondria, all four members of NDB
group located on the outside of the inner mitochondrial membrane while NDA family
and NDC1 located on the inside of the inner mitochondrial membrane (Figure 3.1).
However, some of these NDHs have been identified to be localized into more than one
organelle. Some are localized to peroxisomes (AtNDA1, AtNDA2 and AtNDB1) while
AtNDC1 is localized to chloroplast other than mitochondria (Michalecka et al., 2003;
Xu et al., 2013).
There is a wide distribution of alternative respiratory pathway genes in plant as well as
animal kingdoms. It has also been suggested, in a number of plant species, that
alternative pathway proteins play a crucial role in abiotic stress tolerance by regulating
the production of reactive oxygen species (ROS) in cells during environmental stress.
Therefore, it is worthwhile to investigate whether different plant species, especially

Chapter 3
68
crop species, share common AOX and NDH structure and expression profiles, which
will be important in improved varietal development programs.
Figure 3.1 The traditional and alternative respiratory enzymes in plant mitochondrial electron transport chain
The traditional respiratory complexes are depicted in white, including the proton-pumping
complexes I, III and IV. Type II NAD(P)H dehydrogenases and AOX are depicted in grey
shading. Broken lines denote presently unclear enzymatic properties. SDH, succinate
dehydrogenase (Rasmusson and Wallstrom, 2010).
The overall aim of the current project was to explore whether modifications in the
alternative pathway of respiration can improve tolerance to abiotic stresses in cereals
using rice as a model cereal. There are several approches to achieve this target and
this chapter describes the identification of the complete rice alternative pathway genes
using publicly available databases and bioinformatics tools and assessing which of
these are the stress-responsive genes. Sequences of Arabidopsis alternative pathway
genes were used to mine databases to identify alternative pathway gene sequence
homologs in japonica rice and indica rice. There were no published works on the study
of rice alternative dehydrogenases (NDH) until the start of the current work. However,

Chapter 3
69
later Xu et al. (2013) published on the dual targeting ability of rice NDHs. The present
study was carried out extending the work towards the comparative analysis of gene
sequence and gene structural diversity of identified rice AOXs and NDHs in two rice
sub-species and Arabidopsis using publicly available databases and bioinformatics
programs. Further, the stress responsive genes were identified by generating gene
expression profiles in root and shoot tissues exposed to oxidative stress induced by
chemical inhibition of traditional respiratory pathway.
3.2 Materials and methods
3.2.1 Identification of alternative pathway (AP) genes in rice
Protein/genomic sequences for all Arabidopsis AOXs (AtAOX1a, At3g22370;
AtAOX1b, At3g22360; AtAOX1c, At3g27620; AtAOX1d, At1g32350; AtAOX2,
At5g64210) and NDHs (AtNDA1, At1g07180; AtNDA2, At2g29990; AtNDB1,
At4g28220; AtNDB2, At4g05020; AtNDB3, At4g21490; AtNDB3, At2g20800; AtNDC1,
At5g08740) were downloaded from the TAIR (The Arabidopsis Information Resource)
web site (https://www.arabidopsis.org) and used for BLASTp/BLASTn searches
against protein/genomic reference sequences of genes in the MSU RGAP Release 7
on Rice Genome Annotation Project database (rice.plantbiology.msu.edu) to identify
alternative pathway homologs in japonica rice. Protein/genomic sequences of
identified japonica rice AP genes were used in BLASTp/BLASTn searches against O.
sativa ssp indica group protein/genomic sequences on the Gramene database
(www.gramene.org) to identify AOX and NDH homologs in indica rice.

Chapter 3
70
3.2.2 Identification of conserved regions/domains in rice AP genes
Conserved domain search of identified proteins were carried out to find the protein
families that they belong to and to check whether the proteins have been grouped
correctly. A conserved regions/domains search of identified AP genes from both rice
sub-species was carried out using the “InterPro” protein sequence analysis and
classification computer program (http://www.ebi.ac.uk/interpro/) and results were
confirmed with the NCBI (National Centre for Biotechnology Information) conserved
domain database search (http://www.ncbi.nlm.nih.gov/Structure/cdd/wrpsb.cgi).
Multiple alignments and pairwise alignments of protein/genomic sequences were
carried out with Clustal Omega (http://www.ebi.ac.uk/Tools/msa/clustalo/) and
resultant aligned sequences were visualized using GenDoc computer software
(http://genedoc.software.informer.com/) to identify variations/similarities in sequences
of both rice sub-species and compared with Arabidopsis.
3.2.3 Determination of subcellular localizations of AP genes
Computational determination of the subcellular localization of identified AP genes from
both rice groups was carried out using publicly available subcellular localization
prediction programs; TargetP (http://www.cbs.dtu.dk/services/TargetP/), Predotar
(http://urgi.versailles.inra.fr/Tools/), ChloroP1, (http://www.cbs.dtu.dk/Servies), and
Plant-mPLOC (http://www.csbio.sjtu.edu.cn/bioinf/plant-multi/). Proteins targeting to
the peroxisomes were predicted using PredPlantPTS1 (http://ppp.gobics.de/).
3.2.4 Phylogenetic analysis
AOX and NDH protein phylogenetic trees were constructed using the neighbour-
joining method (Saitou and Nei, 1987) in the MEGA7 (Molecular Evolutionary Genetic
Analysis version 7) computer program (Tamura et al., 2013). The alignments of protein
sequences were performed using the Clustal Omega multiple sequence alignment
program (http://www.ebi.ac.uk/Tools/msa/clustalo/) and data were imported to the
MEGA 7 computer program. Phylogenetic tree construction was carried out using the

Chapter 3
71
Bootstrap method with 1000 replications, “number of differences” as the substitution
model and “complete deletion” for gaps/missing data treatment. AOX and NDH protein
sequences from 10 different monocot species were used for the phylogenetic tree
construction. Protein sequences were downloaded from publicly available databases
such as NCBI (http://www.ncbi.nlm.nih.gov), Gramene (www.gramene.org), Plaza 3
(http://bioinformatics.psb.ugent.be/plaza/versions/plaza_v3_monocots/), Phytozome
(http://www.phytozome.net), as well as from the Rice Genome Annotation Project
(http://rice.plantbiology.msu.edu/).
3.2.5 Exon-intron structural polymorphism in rice AP genes
A comparative study of the exon-intron structure of AP genes from two rice sub-
species and Arabidopsis was carried out to explore the diversity of exon-intron
structures in the rice sub-species and to study how they have deviated from dicot
species using Arabidopsis as an example. Exon-intron gene structures of AOXs and
NDHs were generated using the Gene Structure Display Server 2.0 (GSDS 2.0)
computer program (http://gsds.cbi.pku.edu.cn/) and compared with each other.
Genomic and coding DNA sequences of japonica rice and indica rice were obtained
from the Rice Genome Annotation Project (http://rice.plantbiology.msu.edu/) and
Gramene databases (www.gramene.org), respectively, while genomic and coding
DNA sequences for Arabidopsis were downloaded from the TAIR website
(https://www.arabidopsis.org). The results were further confirmed by working out exon
and intron regions for all AOX and NDH genes using the BL2SEQ option on the SDSC
biology workbench (San-Diego Supercomputer Centre; http://workbench.sdsc.edu/)
computer program and by the exon-intron data retrieved from the Gramene database
before generating gene structures using the GSDS 2.0 program.

Chapter 3
72
3.2.6 Exon-intron gene structural polymorphism among different rice species
An extended study was carried out to explore the exon-intron structural diversity of
AOX1a and NDB2 genes in different rice species (including japonica and indica rice).
Identified japonica rice AOX1a and NDB2 sequences were used as queries to perform
BLAST searches against the rice database on the Gramene website. The “UniProt”
(www.uniprot.org), “InterPro” (www.ebi.ac.uk/interpro/protein/) or NCBI databases
were used to confirm the presence of respective conserved domains and molecular
functions of putative AOX1a and NDB2 genes. Genomic and CDS sequences of
AOX1a and NDB2 genes from 10 rice species (Table 3.1) were obtained from the
Gramene database and exon-intron structures were generated using the Gene
Structure Display Server 2.0 program (http://gsds.cbi.pku.edu.cn/).
3.2.7 Screening for stress responsive AP genes in rice
Three-week-old rice seedlings (O. sativa ssp japonica cv Nipponbare), grown on Petri
dishes, were exposed to respiratory inhibitors, 20 µM antimycin A or 5 mM potassium
cyanide to create oxidative stress in seedling tissues. Roots and shoots were collected
before treatment, 6 h and 24 h after treatments, to extract RNA for gene expression
analysis. RNA extraction, cDNA synthesis and gene expression analysis using qRT-
PCR technique were carried out as described in sections 2.2.1.1, 2.2.4 and 2.3.4,
respectively.
3.2.8 Search for conserved cis-acting regulatory motifs in rice AP genes
Cis-acting regulatory elements (CAREs) located on promoter regions are responsible
for the signalling pathways that regulate stress-induced gene expression in plants (Ho
et al., 2008). A number of conserved CAREs have been identified in Arabidopsis
AOX1a and NDB2, which are responsive to oxidative stress. A computational
approach was used for identifying similar motifs in rice promoter regions AOX1a and
NDB2 genes. The “CentriMo”, Local Motif Enrichment Analysis tool on the motif

Chapter 3
73
prediction algorithm “MEME” (meme-suite.org) was used to detect the presence of
Arabidopsis regulatory cis-sequence elements in promoter regions of AOX1a and
NDB2 from japonica and indica rice. Both directions of the DNA strand were analysed
for the presence of motifs. Promoter region sequences of japonica AOX1a (1.5 kb)
and NDB2 (1.3 kb) genes were retrieved from the relevant BAC clones while promoter
sequences for AOX1a (1.5 kb) and NDB2 (1.5 kb) from indica rice was obtained from
the Gramene database (www.gramene.org). For all other AP genes, promoter region
sequences (1.5 kb) were downloaded from the Gramene database and presence of
CAREs were analysed as described above.

Chapter 3
74
Table 3.1 Details of rice species used in the study of exon-intron structural polymorphism in AOX1a and NDB2 genes. Extracted from Gramene database (www.gramene.org)
Rice species Species description
1 O. barthii The progenitor of the West African cultivated rice, O.
glaberrima. It belongs to the AA genome group and has 12
chromosomes and a genome size of 411Mb.
2 O. brachyantha A wild rice which is a distant relative of cultivated rice (O.
sativa ssp. japonica and O. sativa ssp indica). Only member
in the F genome type. This diploid species is distributed in
Western and Central Africa with a genome size of ~362 Mb
3 O. glaberrima African cultivated rice, which was domesticated from extant
progenitor, O. barthii. Similar to Asian and African rice.
Represents diploid AA genome group, having 12
chromosomes and an estimated size of ~358 Mb.
4 O. glumaepatula A wild rice from South America and belongs to the AA
genome group and has 12 chromosomes with a genome size
of 464 Mb.
5 O. longistaminata A wild rice, perennial, tall (2 m or more), erect, and
rhizomatous grass which is belong to AA genome type.
6 O. meridionalis Australian wild rice that belongs to AA genome group. It has
12 chromosomes with a genome size of 435 Mb.
7 O. nivara A wild rice from India that belongs to AA genome group. It
has 12 chromosomes and a genome size of 448 Mb.
8 O. punctata A wild native rice species from Africa. A diploid species
belongs to BB genome type. It has 12 chromosomes and a
genome size of 423 Mb.
9 O. rufipogon A tetraploid wild rice with BBCC genome type. A perennial,
tufted, and scrambling grass with nodal tillering; plant height
variable (1-5 m) depending on the depth of water.
10 O. sativa ssp. indica One of the two most commonly cultivated sub-species of
rice (along with O. sativa ssp japonica) and is the most widely
grown in hot climates of Southern Asia. The genome is very
similar to that of japonica.
11 O. sativa ssp.
japonica
Important model species for monocot plants and cereals and
has a compact diploid genome of ~ 500 Mb (n=12). Fully
sequenced.

Chapter 3
75
3.3 Results
3.3.1 Both AOXs and NDHs were identified in japonica rice
Both type 1 AOXs and NDHs were identified in japonica rice. Sequence search
(BLAST) against the Rice Genome Annotation Project database
(http://rice.plantbiology.msu.edu/) resulted in four gene sequences homologous to
Arabidopsis AOXs: AOX1a (LOC_Os04g51150), AOX1b (LOC_Os04g51160), AOX1c
(LOC_Os02g47200), and AOX1d (LOC_Os02g21300), and six sequence homologous
to NDHs: NDA1 (LOC_Os07g37730), NDA2 (LOC_Os01g61410), NDB1
(LOC_Os06g47000), NDB2 (LOC_Os05g26660), NDB3 (LOC_Os08g04630) and
NDC1 (LOC_Os06g11140) in rice sub-species japonica (Table 3.2). No hits were
found for sequences corresponding to AtAOX2, confirming the fact that the AOX2 type
is absent in monocots (Considine et al., 2002).
3.3.2 Both AOXs and NDHs were identified in indica rice
Homologous sequences for all AOXs and NDHs identified in japonica rice were also
present in indica rice. A BLAST search against protein/genomic sequence database
of the O. sativa indica group on the Gramene website identified four AOX isoforms:
AOX1a (BGIOSGA014422), AOX1b (BGIOSGA014421), AOX1c (BGIOSGA005788)
and AOX1d (BGIOSGA008063), and also six NDHs: NDA1 (BGISOGA025955), NDA2
(BGIOSGA004734), NDB1 (BGIOSGA020655), NDB2 (BGIOSGA018290), NDB3
(BGIOSGA027677) and NDC1 (BGIOSGA021679) in indica rice (Table 3.2). Pairwise
alignment of CDS sequences revealed that all AOX and NDH isoforms from japonica
rice were very similar to those of indica rice except NDB3. NDB3 from japonica rice
consisted of a shorter sequence compared to indica rice (Table 3.2).

Chapter 3
76
Table 3.2 Alternative respiratory pathway genes identified in japonica and indica rice
Four isoforms of type 1 AOXs and six NDHs were identified in japonica rice as well as in indica rice. Sequence alignment studies showed that AOXs and
NDHs from japonica rice were very similar to those from indica rice except NBD3. Sequences for japonica rice were downloaded from the Rice Genome
Annotation Project website (rice.plantbiology.msu.edu) while sequences for indica were downloaded from the Gramene website (www.gramene.org).
aa-amino acids.
Alternative oxidases Alternative dehydrogenases
Gene name
Japonica rice Indica rice
Gene name
Japonica rice Indica rice
Gene Locus/ID Protein length (aa)
Gene Locus/ID Protein length (aa)
Gene Locus/ID Protein length (aa)
Gene Locus/ID Protein length (aa)
AOx1a LOC_Os04g51150 332 BGIOSGA014422 332 NDA1 LOC_Os07g37730 562 BGISOGA025955 561
AOX1b LOC_Os04g51160 335 BGIOSGA014421 335 NDA2 LOC_Os01g61410 499 BGIOSGA004734 497
AOX1c LOC_Os02g47200 345 BGIOSGA005788 345 NDB1 LOC_Os06g47000 588 BGIOSGA020655 588
AOX1d LOC_Os02g21300 339 BGIOSGA008063 339 NDB2 LOC_Os05g26660 575 BGIOSGA018290 575
NDB3 LOC_Os08g04630 357 BGIOSGA027677 580
NDC1 LOC_Os06g11140 548 BGIOSGA021679 548

Chapter 3
77
3.3.3 AOX proteins were identified as members of the Ferritin-like superfamily
Conserved domain searches confirmed that all japonica and indica putative AOX
proteins belong to the Ferritin-like superfamily of di-iron containing four-helix-bundle
proteins (http://www.ncbi.nlm.nih.gov/Structure/cdd/) as of Arabidopsis AOXs
(Figure 3.2). This confirms the presence of iron-binding sites in all identified AOX
proteins in both rice groups similar to Arabidopsis AOXs, which is considered as a
positive identification characteristic of AOXs (McDonald et al., 2003). Pairwise
alignment of amino acid sequences showed that AOXs from both rice sub-species
share 100% amino acid (aa) residue identity (Appendix A) while alignment of rice and
Arabidopsis AOX sequences showed that rice AOX1a, AOX1b, AOX1c and AOX1d
share 85%, 73%, 77% and 70% of amino acid residue identity with corresponding
Arabidopsis AOXs.
There are two highly conserved cysteine (Cys) residues, CysI and CysII, in most plant
AOXs, which are important in the regulation of AOX activity (Umbach et al., 2006;
McDonald, 2008). Although rice AOX1a, AOX1c and AOX1d proteins shared these
conserved Cys residues similar to Arabidopsis AOXs, they were replaced by serine
(Ser) in AOX1b in both japonica and indica rice (Umbach et al., 2006; McDonald, 2009)
(Figure 3.2).
3.3.4 NDH proteins were identified as members of the Pyr-redox superfamily
All three groups of NDH proteins; NDA, NDB and NDC from both groups of rice were
identified as members of pyridine nucleotide disulphide oxidoreductase (Pyr-redox)
superfamily as of Arabidopsis NDHs, in which two characteristic GXGXXG motifs are
present. The first motif facilitates NAD(P)H binding (NADB domain) while the second
motif is responsible for specifically binding a substrate and catalyzing a particular
enzymatic reaction (http://www.ncbi.nlm.nih.gov/Structure/cdd/). Both of these
domains were present in NDA (Figures 3.3), NDB (Figure 3.4) and NDC (Figure 3.5)
family members from both rice groups as well as in Arabidopsis. In addition to the

Chapter 3
78
NADB domain, NDB proteins from Arabidopsis, indica and japonica contained
EF-hand domains, except japonica NDB3, that facilitate binding of Ca2+ (Figure 3.4).
Ca2+ binding EF-hand motifs were also absent in both NDA and NDC group members.
Pairwise alignment of protein sequences of NDHs from japonica and indica rice
showed that they share very similar sequences except that NDB3 having shorter
sequence (Appendix B). NDB3 protein sequence of japonica rice is shorter (357 aa)
compared to indica NDB3 (580 aa) and that of Arabidopsis (580 aa) (Figure 3.4).
Protein sequence alignment analysis of rice and Arabidopsis revealed that rice NDA1
and NDA2 share 71% and 77% of amino acid residue identity with AtNDA1 and
AtNDA2 respectively while NDB1, NDB2 and NDB3 share 65%, 64% and 63% amino
acid residue identity with corresponding Arabidopsis NDBs. Rice NDC1 also shares
65% of amino acid sequence identity with AtNDC1.

Chapter 3
79
Figure 3.2 A multiple sequence alignment of full length AOX proteins from Arabidopsis, japonica and indica rice
Purple arrows point to conserved Cysteine (C) or substitute Serine (S) residues (in rice AOX1b), which are responsible for the regulation of AOX activity. Underlines indicate four alpha-helix bundles found in the core of AOX and numbered as I–IV. The red arrows point to conserved duplicate metal ligands, glutamate and histidine (EXXH) and two additional glutamate (E) residues within four-helix bundle. Three consecutive glutamate (E) residues are located on the third ion-binding site in all AOXs from Arabidopsis as well as two rice groups, which are conserved in most AOX proteins (McDonald, 2009). Rice AOX1a, AOX1b, AOX1c and AOX1d share 85%, 73%, 77% and 70% of amino acid residue identity with corresponding Arabidopsis AOXs.
IV
Arab_AOX1a :
Japo_AOX1a :
Indi_AOX1a :
Arab_AOX1b :
Japo_AOX1b :
Indi_AOX1b :
Arab_AOX1c :
Japo_AOX1c :
Indi_AOX1c :
Arab_AOX1d :
Japo_AOX1d :
Indi_AOX1d :
---MMITRGGAKAAKSLLVAAGPRLFSTVRTVSSHEALSAS-HILKPGVTSAWIWTRAPTIGGMRFASTITLGEKTP--M
----MSSRM---AGSAILRHVGGVRLFTASATSPAAAAAA---AARP--FL-AGGEAVPGVWGLRLMSTSSVASTEA---
----MSSRM---AGSAILRHVGGVRLFTASATSPAAAAAA---AARP--FL-AGGEAVPGVWGLRLMSTSSVASTEA---
---MMMSRR-----------YGAKLM----ETAV----THS-HLLNPRVPLVTENIRVPAMGVVRVFSKMTFEKKKT--T
----MSSRM---AGATLLRHLGPRLFAAEPVYSGLAASAR---GVMP-----A----AARIFPARMASTSSAGADV----
----MSSRM---AGATLLRHLGPRLFAAEPVYSGLAASAR---GVMP-----A----AARIFPARMASTSSAGADV----
----MITTL-----------LRRSLL----DASKQATSING-ILFH--QLAPAKYFRVPAVGGLRDFSKMTFEKKKT--S
----MGSRA---AGSVLLRHLCPRVS---SSTS-AAAHAH---AQRP--PLAGAGGGGVALWARLLSTSAAAAKEETAAS
----MGSRA---AGSVLLRHLCPRVS---SSTS-AAAHAH---AQRP--PLAGAGGGGVALWARLLSTSAAAAKEETAAS
-----------MSYRSIYRTLRPVLSSSVQSSG------LGIGGFR--------GHLISHLPNVRLLSSDTS--------
MALVQSARRA--AGP-----AASRLFSTASVAAAGRSPVAGLPKALPRPAISSLWMVGAAAPPRRFAGTAAVGGVDVT--
MALVQSARRA--AGP-----AASRLFSTASVAAAGRSPVAGLPKALPQPAISSLWMVGAAAPPRRFAGTAAVGGVDVT--
: 74
: 64
: 64
: 55
: 57
: 57
: 56
: 64
: 64
: 47
: 71
: 71
Arab_AOX1a :
Japo_AOX1a :
Indi_AOX1a :
Arab_AOX1b :
Japo_AOX1b :
Indi_AOX1b :
Arab_AOX1c :
Japo_AOX1c :
Indi_AOX1c :
Arab_AOX1d :
Japo_AOX1d :
Indi_AOX1d :
KEEDANQ-KKTENESTGGDAAGGNNKGDKGIASYWGVEPN-KITKEDGSEWKWNCFRPWETYKADITIDLKKHHVPTTFL
--------AAKAE------AKKADAEKEVVVNSYWGIEQSKKLVREDGTEWKWSCFRPWETYTADTSIDLTKHHVPKTLL
--------AAKAE------AKKADAEKEVVVNSYWGIEQSKKLVREDGTEWKWSCFRPWETYTADTSIDLTKHHVPKTLL
EEKGS--------SGG---KADQGNKGEQLIVSYWGVKPM-KITKEDGTEWKWSCFRPWETYKSDLTIDLKKHHVPSTLP
KE--GAA-EKLPEPAATAAAAATDPQNKKAVVSYWGIQPP-KLVKEDGTEWKWLSFRPWDTYTSDTSIDVTKHHEPKGLP
KE--GAA-EKLPEPAATAAAAATDPQNKKAVVSYWGIQPP-KLVKEDGTEWKWLSFRPWDTYTSDTSIDVTKHHEPKGLP
EEEEG--------SGDGVKVNDQGNKGEQLIVSYWGVKPM-KITKEDGTEWKWSCFRPWETYKADLTIDLKKHHVPSTLP
KENTGSTAAAKAEATKAAKEGPASATASPVASSYWGIEAS-KLASKDGVEWKWSCFRPWETYSPDTTIDLKKHHEPKVLL
KENTGSTAAAKAEATKAAKEGPASATASPVASSYWGIEAS-KLASKDGVEWKWSCFRPWETYSPDTTIDLKKHHEPKVLL
----------SPVSGNNQPENPIRTADGKVISTYWGIPPT-KITKPDGSAWKWNCFQPWDSYKPDVSIDVTKHHKPSNFT
-------------APTATPPPAKKEESEKEAASYWGVAPT-RLVKEDGTVWKWSCFRPWDTYEADVAIDLTKHHNPATLG
-------------APTATPPPAKKEESEKEAASYWGVAPT-RLVKEDGTVWKWSCFRPWDTYEADVAIDLTKHHNPATLG
: 152
: 130
: 130
: 123
: 133
: 133
: 127
: 143
: 143
: 116
: 137
: 137
Arab_AOX1a :
Japo_AOX1a :
Indi_AOX1a :
Arab_AOX1b :
Japo_AOX1b :
Indi_AOX1b :
Arab_AOX1c :
Japo_AOX1c :
Indi_AOX1c :
Arab_AOX1d :
Japo_AOX1d :
Indi_AOX1d :
DRIAYWTVKSLRWPTDLFFQRRYGCRAMMLETVAAVPGMVGGMLLHCKSLRRFEQSGGWIKALLEEAENERMHLMTFMEV
DKIAYWTVKSLRFPTDIFFQRRYGCRAMMLETVAAVPGMVGGMLLHLRSLRRFEQSGGWIRTLLEEAENERMHLMTFMEV
DKIAYWTVKSLRFPTDIFFQRRYGCRAMMLETVAAVPGMVGGMLLHLRSLRRFEQSGGWIRTLLEEAENERMHLMTFMEV
DKLAYWTVKSLRWPTDLFFQRRYGCRAMMLETVAAVPGMVGGMLVHCKSLRRFEQSGGWIKALLEEAENERMHLMTFMEV
DKLAYWTVRSLAVPRDLFFQRRHASHALLLETVAGVPGMVGGMLLHLRSLRRFEQSGGWIRALLEEAENERMHLMTFLEV
DKLAYWTVRSLAVPRDLFFQRRHASHALLLETVAGVPGMVGGMLLHLRSLRRFEQSGGWIRALLEEAENERMHLMTFLEV
DKIAYWMVKSLRWPTDLFFQRRYGCRAIMLETVAAVPGMVGGMLMHFKSLRRFEQSGGWIKALLEEAENERMHLMTFMEV
DKVAYWTVKALRVPTDIFFQRRYGCRAMMLETVAAVPGMVGGMLLHLRSLRRFEHSGGWIRALLEEAENERMHLMTFMEV
DKVAYWTVKALRVPTDIFFQRRYGCRAMMLETVAAVPGMVGGMLLHLRSLRRFEHSGGWIRALLEEAENERMHLMTFMEV
DKFAYWTVQTLKIPVQLFFQRKHMCHAMLLETVAAVPGMVGGMLLHLKSLRRFEHSGGWIKALLEEAENERMHLMTFIEL
DKVARWTVKSLRWPVDLFFQRRYGCRAMMLETVAAVPGMVAGAVLHLRSLRRFEHSGGWIRALLEEAENERMHLMTFMEV
DKVARWTVKSLRWPVDLFFQRRYGCRAMMLETVAAVPGMVAGAVLHLRSLRRFEHSGGWIRALLEEAENERMHLMTFMEV
: 232
: 210
: 210
: 203
: 213
: 213
: 207
: 223
: 223
: 196
: 217
: 217
Arab_AOX1a :
Japo_AOX1a :
Indi_AOX1a :
Arab_AOX1b :
Japo_AOX1b :
Indi_AOX1b :
Arab_AOX1c :
Japo_AOX1c :
Indi_AOX1c :
Arab_AOX1d :
Japo_AOX1d :
Indi_AOX1d :
AKPKWYERALVITVQGVFFNAYFLGYLISPKFAHRMVGYLEEEAIHSYTEFLKELDKGNIENVPAPAIAIDYWRLPADAT
ANPKWYERALVITVQGVFFNAYFLGYLLSPKFAHRVVGYLEEEAIHSYTEFLKDLEAGKIDNVPAPAIAIDYWRLPANAT
ANPKWYERALVITVQGVFFNAYFLGYLLSPKFAHRVVGYLEEEAIHSYTEFLKDLEAGKIDNVPAPAIAIDYWRLPANAT
AKPNWYERALVIAVQGIFFNAYFLGYLISPKFAHRMVGYLEEEAIHSYTEFLKELDNGNIENVPAPAIAIDYWRLEADAT
MQPRWWERALVLAAQGVFFNAYFVGYLVSPKFAHRFVGYLEEEAVSSYTEYLKDLEAGKIENTPAPAIAIDYWRLPADAT
MQPRWWERALVLAAQGVFFNAYFVGYLVSPKFAHRFVGYLEEEAVSSYTEYLKDLEAGKIENTPAPAIAIDYWRLPADAT
AKPKWYERALVISVQGVFFNAYLIGYIISPKFAHRMVGYLEEEAIHSYTEFLKELDNGNIENVPAPAIAVDYWRLEADAT
AKPRWYERALVLAVQGVFFNAYFLGYLLSPKLAHRVVGYLEEEAIHSYTEYLKDIEAGKIENVPAPPIAIDYWRLPAGAT
AKPRWYERALVLAVQGVFFNAYFLGYLLSPKLAHRVVGYLEEEAIHSYTEYLKDIEAGKIENVPAPPIAIDYWRLPAGAT
SQPKWYERAIVFTVQGVFFNAYFLAYVISPKLAHRITGYLEEEAVNSYTEFLKDIDAGKFENSPAPAIAIDYWRLPKDAT
SQPRWYERALVVAVQGAFFNAYLASYLLSPRFAHRIVGYLEEEAVHSYTEFLRDLDAGKIDDVPAPAIAIDYWRLPADAT
SQPRWYERALVVAVQGAFFNAYLASYLLSPRFAHRIVGYLEEEAVHSYTEFLRDLDAGKIDDVPAPAIAIDYWRLPADAT
: 312
: 290
: 290
: 283
: 293
: 293
: 287
: 303
: 303
: 276
: 297
: 297
Arab_AOX1a :
Japo_AOX1a :
Indi_AOX1a :
Arab_AOX1b :
Japo_AOX1b :
Indi_AOX1b :
Arab_AOX1c :
Japo_AOX1c :
Indi_AOX1c :
Arab_AOX1d :
Japo_AOX1d :
Indi_AOX1d :
LRDVVMVVRADEAHHRDVNHFASDIHYQGRELKEAPAPIGYH
LKDVVTVVRADEAHHRDVNHFASDIHYQGMELKQTPAPIGYH
LKDVVTVVRADEAHHRDVNHFASDIHYQGMELKQTPAPIGYH
LRDVVMVVRADEAHHRDVNHYASDIHYQGRELKEAPAPIGYH
LKDVVTVIRADEAHHRDLNHFASDIQQQGMKLKDTPAPIGYH
LKDVVTVIRADEAHHRDLNHFASDIQQQGMKLKDTPAPIGYH
LRDVVMVVRADEAHHRDVNHYASDIHYQGHELKEAPAPIGYH
LKDVVVVVRADEAHHRDVNHFASDVHFQGMDLKDIPAPLDYH
LKDVVVVVRADEAHHRDVNHFASDVHFQGMDLKDIPAPLDYH
LRDVVYVIRADEAHHRDINHYASDIQFKGHELKEAPAPIGYH
LRDVVMVVRADEAHHRDVNHYASDIHYQGHALREVAAPLGYH
LRDVVMVVRADEAHHRDVNHYASDIHYQGHALREVAAPLGYH
: 354
: 332
: 332
: 325
: 335
: 335
: 329
: 345
: 345
: 318
: 339
: 339
I II
III

Chapter 3
80
Figure 3.3 A multiple sequence alignment of full length NDA proteins from Arabidopsis, japonica and indica rice
The positions of the GXGXXG conserved domains are indicated by the red bars below the alignment. The first GXGXXG motif facilitates NAD(P)H binding (NADB domain) and the second is responsible for specifically binding a substrate and catalyzing a particular enzymatic reaction. EF-hand motifs are absent form NDA proteins. Rice NDA1 and NDA2 share 71%, and 77% of amino acid residue identity with Arabidopsis NDA1 and NDA2 respectively.
Arab_NDA1 :
Japo_NDA1 :
Indi_NDA1 :
Arab_NDA2 :
Japo_NDA2 :
Indi_NDA2 :
* 20 * 40 * 60 * 80 *
------------------------------MLWIKNLARISQTTSSSVGNV---FRNPESYTL------SS--------RFCTALQ----
MAWSRIARGSQLTQPLSRILAEGNAAATPAAYALRNAAALGQRASSA--------SASSSFHSLALAGLADKYAAGAAGRLQPSRGISTT
MAWSRIARGSQLTQPLSRILAEGNAAATPAAYALRNAAALGQRASSA--------SASSSFHSLALAGLADKYAAGAAGRLQPSRGISTT
------------------------------MFMIKNLTRISPNTSSIITRFRNSGSSSLSYTL------AS--------RFCTAQE----
---------------------------MAASSLLRSLSRISRRG-----CVG--GAGPSPFHH------S---------RL---------
---------------------------MAASSLLRSLSRISRRG-----CVG--GAGPSPFHH------S---------RL---------
: 39
: 82
: 82
: 42
: 32
: 32
Arab_NDA1 :
Japo_NDA1 :
Indi_NDA1 :
Arab_NDA2 :
Japo_NDA2 :
Indi_NDA2 :
100 * 120 * 140 * 160 * 180
-------KQQVTDTVQAKEDVVNALEPQRYDGLAPTKEGEKPRVLVLGSGWAGCRVLKGIDTSIYDVVCVSPRNHMVFTPLLASTCVGTL
SPALRPAAEAAARVVECSDAADEAAAAAAVPDLGPTRPGEKPRVVVLGTGWAACRFLKDVDTRAYDVVCISPRNHMVFTPLLASTCVGTL
SPALRPAAEAAARVVECSDAADEAA-AAAVPDLGPTRPGEKPRVVVLGTGWAACRFLKDVDTRAYDVVCISPRNHMVFTPLLASTCVGTL
-------TQ-----IQSPAKIPNDVDRSQYSGLPPTREGEKPRVVVLGSGWAGCRLMKGIDTNLYDVVCVSPRNHMVFTPLLASTCVGTL
------------PYSPFSTAAADAVERRGFAGLGPTAKGEKARVVVLGTGWAGSRLMKDIDTTGYEVVCVSPRNHMVFTPLLASTCVGTL
------------PYSPFSTAAADAVERRGFAGLGPTAKGEKARVVVLGTGWAGSRLMKDIDTTGYEGVCVSPRNHMVFTPLLASTCVGTL
: 122
: 172
: 171
: 120
: 110
: 110
Arab_NDA1 :
Japo_NDA1 :
Indi_NDA1 :
Arab_NDA2 :
Japo_NDA2 :
Indi_NDA2 :
* 200 * 220 * 240 * 260 *
EFRSVAEPISRIQPAISREPGSYYFLANCSKLDADNHEVHCETVTEGS-STLKPWKFKIAYDKLVLACGAEASTFGINGVLENAIFLREV
EFRSVVEPVSRIQSALATRPGSYFFLASCTGIDTGRHEVHCTAA-DGDGLPANPYNFKVSYDKLVIASGSEPLTFGIKGVAENAIFLREV
EFRSVVEPVSRIQSALATRPGSYFFLASCTGIDTGRHEVHCTAA-DGDGLPANPYNFKVSYDKLVIASGSEPLTFGIKGVAENAIFLREV
EFRSVAEPISRIQPAISREPGSFFFLANCSRLDADAHEVHCETLTDGL-NTLKPWKFKIAYDKLVIASGAEASTFGIHGVMENAIFLREV
EFRSVAEPLARIQPAVSKSPGSYFLLARCTAVDPDAHTIDCETVTEGEKDTLKPWKFKVAYDKLVFACGAEASTFGIRGVTDHAIFLREV
EFRSVAEPLARIQPAVSKSPGSYFLLARCTAVDPDAHTIDCETVTEGEKDTLKPWKFKVAYDKLVFACGAEASTFGIRGVTDHAIFLREV
: 211
: 261
: 260
: 209
: 200
: 200
Arab_NDA1 :
Japo_NDA1 :
Indi_NDA1 :
Arab_NDA2 :
Japo_NDA2 :
Indi_NDA2 :
280 * 300 * 320 * 340 * 360
HHAQEIRRKLLLNLMLSEVPGIGEDEKKRLLHCVVVGGGPTGVEFSGELSDFIMKDVRQRYSHVKDDIRVTLIEARDILSSFDDRLRHYA
SHAQEIRRKLLTNLMLSENPGLSEEEKKRLLHCVVVGGGPTGVEFSGELSDFITRDVRERYAHVKDYVKVTLIEANEILSSFDVGLRQYA
SHAQEIRRKLLTNLMLSENPGLSEEEKKRLLHCVVVGGGPTGVEFSGELSDFITRDVRERYAHVKDYVKVTLIEANEILSSFDVGLRQYA
HHAQEIRRKLLLNLMLSDTPGISKEEKRRLLHCVVVGGGPTGVEFSGELSDFIMKDVRQRYAHVKDDIHVTLIEARDILSSFDDRLRRYA
HHAQEIRRKLLLNLMLSDVPGISEEEKRRLLHCVVVGGGPTGVEFSGELSDFIIRDVKQRYSHVKDYIHVTLIEANEILSSFDVRLRQYA
HHAQEIRRKLLLNLMLSDVPGISEEEKRRLLHCVVVGGGPTGVEFSGELSDFIIRDVKQRYSHVKDYIHVTLIEANEILSSFDVRLRQYA
: 301
: 351
: 350
: 299
: 290
: 290
Arab_NDA1 :
Japo_NDA1 :
Indi_NDA1 :
Arab_NDA2 :
Japo_NDA2 :
Indi_NDA2 :
* 380 * 400 * 420 * 440 *
IKQLNKSGVKLVRGIVKEVKPQKLILDDGTEVPYGPLVWSTGVGPSSFVRSLDFPKDPGGRIGIDEWMRVPSVQDVFAIGDCSGYLESTG
TDHLSKYGVNLVRGVVKEVKPREIELSDGSRVPYGVLVWSTGVGPSEFVRSLPLPKSPGGRIGVDEWLRVPSVEDVFALGDCAGFLEGTG
TDHLSKYGVNLVRGVVKEVKPREIELSDGSRVPYGVLVWSTGVGPSEFVRSLPLPKSPGGRIGVDEWLRVPSVEDVFALGDCAGFLEGTG
IKQLNKSGVRFVRGIVKDVQSQKLILDDGTEVPYGLLVWSTGVGPSPFVRSLGLPKDPTGRIGIDEWMRVPSVQDVFAIGDCSGYLETTG
TNQLTKSGVRLVRGIVKDVQPNKLILDNGEEVPYGLLVWSTGVGPSSFVKSLPFPKSPGGRIGVDEWLRVPSARDVFAIGDCSGFLESTG
TNQLTKSGVRLVRGIVKDVQPNKLILDNGEEVPYGLLVWSTGVGPSSFVKSLPFPKSPGGRIGVDEWLRVPSARDVFAIGDCSGFLESTG
: 391
: 441
: 440
: 389
: 380
: 380
Arab_NDA1 :
Japo_NDA1 :
Indi_NDA1 :
Arab_NDA2 :
Japo_NDA2 :
Indi_NDA2 :
460 * 480 * 500 * 520 * 540
KSTLPALAQVAEREGKYLANLFNVMGKAGGGRANSA-KEMELGEPFVYKHLGSMATIGRYKALVDLRESKEGKGISMAGFLSWFIWRSAY
RAVLPALAQVAEREGRYLARVMSRIAAQDGGRAGRAVGSAELGEPFVYKHIGSMASVGRYKALVDLRENKDARGVSMAGFVSWLMWRSAY
RAVLPALAQVAEREGRYLARVMSRIAAQDGGRAGRAVGSAELGEPFVYKHIGSMASVGRYKALVDLRENKDARGVSMAGFVSWLMWRSAY
KPTLPALAQVAEREGKYLANLLNAIGKGNGGRANSA-KEIELGVPFVYKHLGSMATIGRYKALVDLRESKDAKGISMTGFVSWFIWRSAY
KDVLPALAQVAERQGKYLAHLLNHVMKAGGGHANCE-IDVDLGPAFVYKHLGSMATVGRYKALVDLRQSKESKGISLAGFVSWFIWRSAY
KDVLPALAQVAERQGKYLAHLLNHVMKAGGGHANCE-IDVDLGPAFVYKHLGSMATVGRYKALVDLRQSK--AGISLAGFVSWFIWRSAY
: 480
: 531
: 530
: 478
: 469
: 467
Arab_NDA1 :
Japo_NDA1 :
Indi_NDA1 :
Arab_NDA2 :
Japo_NDA2 :
Indi_NDA2 :
* 560 *
LTRVVSWRNRFYVAINWLTTFVFGRDISRI-
LTRVVSWRNRFYVAVNWATTLVFGRDNTRIG
LTRVVSWRNRFYVAINWATTLVFGRDNTRIG
LTRVISWRNRFYVAINWFTTFVFGRDISRI-
LTRVVSWRNRFYVAINWLTTLLFGRDISRI-
LTRVVSWRNRFYVAINWLTTLLFGRDISRI-
: 510
: 562
: 561
: 508
: 499
: 497
GXGXXG
GXGXXG

Chapter 3
81
Figure 3.4 A multiple sequence alignment of full length NDB proteins from Arabidopsis, japonica and indica rice
The position of the GXGXXG conserved domains; characteristic of the family “Pyr-redox”, are
indicated by the red bars below the alignment. The purple bar below the alignment represents
the EF-hand motif which is responsible for Ca2+ binding. EF-hand sequence is absent from
japonica rice NDB3 and it has relatively shorter sequence compared to indica rice and
Arabidopsis. Rice NDB1, NDB2 and NDB3 share 66%, 64% and 63% amino acid residue
identity with Arabidopsis NDB1, NDB2 and NDB3 respectively.
Arab_NDB1 :
Japo_NDB1 :
Indi_NDB1 :
Arab_NDB2 :
Japo_NDB2 :
Indi_NDB2 :
Arab_NDB3 :
Japo_NDB3 :
Indi_NDB3 :
* 20 * 40 * 60 * 80 *
---MTLL--------SSLGRASRSAP-LASKLLLLGTLSGGSIVAYADANEEAN------KKEEHKKKKVVVLGTGWAGISFLKDLDITS
---MGFFFFASRAAARFLGEARIIHPGVSTAALLVAAASGGGLVAYADSAGENASS--ETSQEAPRKKKVVVLGTGWAGTSFLKDLDCSK
---MGFFFFASRAAARFLGEARIIHPGVSTAALLVAAASGGGLVAYADSAGENASS--ETSQEAPRKKKVVVLGTGWAGTSFLKDLDCSK
---MRNFSVFER-----FSKAFKDHPSLT-RILVVSTISGGGLIAYSEANASYGANGGAVVETGTKKKKVVLLGTGWAGTSFLKNLNNSQ
MSASGGLSLVRRAV-----EAARRTPRWQKRLLVLTAGV--GSLTYA-CQDNQVL----QINDGTGKKRVVIVGTGWAGASFLRNIDTSL
MSASGGLSLVRRAV-----EAARRTPRWQKRLLVLTAGV--GSLTYA-CQDNQVL----QINDGTGKKRVVIVGTGWAGASFLRNIDTSL
---MRPFAYFER-----LSQAFHDYPSLS-KILVVSTISGGGLIVYSEANPSYSNNG---VETKTRKRKVVLLGTGWAGASFLKTLNNSS
MRW--TAFMWEGAS-----RAFNHRPTFTNLVLVLGAASSGGLVAYADSNSDDVV----GKPQGPPKKKIVVLGTGWGGTTFLRNLDSRL
MRW--TAFMWEGAS-----RAFNHRPTFTNLVLVLGAASSGGLVAYADSNSDDVV----GKPQGPPKKKIVVLGTGWGGTTFLRNLDSRL
: 72
: 85
: 85
: 81
: 78
: 78
: 78
: 79
: 79
Arab_NDB1 :
Japo_NDB1 :
Indi_NDB1 :
Arab_NDB2 :
Japo_NDB2 :
Indi_NDB2 :
Arab_NDB3 :
Japo_NDB3 :
Indi_NDB3 :
100 * 120 * 140 * 160 * 180
YDVQVVSPQNYFAFTPLLPSVTCGTVEARSIVESVRNITKKKNGEIELWEADCFKIDHVNQKVHCRPVFKDDPEASQEFSLGYDYLIVAV
YEVKVISPRNYFAFTPLLPSVTCGTVEARSIVEPIRKMLEKKRKDVAFYEAECFKIDASKKAVHCRSAVGTNFDGNGDFMVDYDYLVVAL
YEVKVISPRNYFAFTPLLPSVTCGTVEARSIVEPIRKMLEKKRKDVAFYEAECFKIDASKKAVHCRSAVGTNFDGNGDFMVDYDYLVVAL
YEVQIISPRNYFAFTPLLPSVTCGTVEARSVVEPIRNIGRK-NVDTSYLEAECFKIDPASKKVYCRSKQGLSSNGKKEFSVDYDYLVIAT
YDVHVVSPRNYFTFTPLLPSVTCGTVEARSIVEPIRNIVRKRGGAFRFWEAECYKIDPTNKKIHCRSD----SDGNSEFVVDYDYLVVSV
YDVHVVSPRNYFTFTPLLPSVTCGTVEARSIVEPIRNIVRKRGGAFRFWEAECYKIDPTNKKIHCRSD----SDGNSEFVVDYDYLVVSV
YEVQVISPRNYFAFTPLLPSVTCGTVEARSVVEPIRNIARKQNVEMSFLEAECFKIDPGSKKVYCRSKQGVNSKGKKEFDVDYDYLVIAT
YDVQVISPRNYFAFTPLLPSVTCGTVEPRSVVEPIRRILEKKGGDIKFWEAECFKIDSSNKKIHCRSNIGTNLDGNGEFLVDYDYLVIAV
YDVQVISPRNYFAFTPLLPSVTCGTVEPRSVVEPIRRILEKKGGDIKFWEAECFKIDSSNKKIHCRSNIGTNLDGNGEFLVDYDYLVIAV
: 162
: 175
: 175
: 170
: 164
: 164
: 168
: 169
: 169
Arab_NDB1 :
Japo_NDB1 :
Indi_NDB1 :
Arab_NDB2 :
Japo_NDB2 :
Indi_NDB2 :
Arab_NDB3 :
Japo_NDB3 :
Indi_NDB3 :
* 200 * 220 * 240 * 260 *
GAQVNTFGTPGVLENCHFLKEVEDAQRIRRGVIDCFEKAILPGLTEEQRRRKLHFVIVGGGPTGVEFAAELHDFIIEDITKIYPSVKELV
GATVNTFNTPGVMENCYFLKEVEDAQKIRRNVIDCFEKASLPNISEEEKRKILHFVIIGGGPTGVEFAAEMHDFLVEDLVKLYPAIQDFV
GATVNTFNTPGVMENCYFLKEVEDAQKIRRNVIDCFEKASLPNISEEEKRKILHFVIIGGGPTGVEFAAEMHDFLVEDLVKLYPAIQDFV
GAQSNTFNIPGVEENCHFLKEVEDAQRIRKTVIDSFEKASLPELSDEERKRILHFVVVGGGPTGVEFAAELHDFVTEDLVSLYPRAKGSV
GARPNTFNTPGVVENCHFLKEVEDAQKIRKSVLKCFERASLPNLTEEERKKNLHFVVIGGGPTGVEFAAELHDFVNEDLAKLYPDVKKYA
GARPNTFNTPGVVENCHFLKEVEDAQKIRKSVLKCFERASLPNLTEEERKKNLHFVVIGGGPTGVEFAAELHDFVNEDLAKLYPDVKKYA
GAQSNTFNIPGVEENCHFLKEVEDAQRIRSTVIDSFEKASLPGLNEQERKRMLHFVVVGGGPTGVEFASELHDFVNEDLVKLYPKAKNLV
GARSNTFNTPGVEENCFFLKEVEDAQKIRRNVMDCFERASLPYLDEEERKKNLHFVVVGGGPTGVEFAAELHDFVTEDLSKLYPSIQHLV
GARSNTFNTPGVEENCFFLKEVEDAQKIRRNVMDCFERASLPYLDEEERKKNLHFVVVGGGPTGVEFAAELHDFVTEDLSKLYPSIQHLV
: 252
: 265
: 265
: 260
: 254
: 254
: 258
: 259
: 259
Arab_NDB1 :
Japo_NDB1 :
Indi_NDB1 :
Arab_NDB2 :
Japo_NDB2 :
Indi_NDB2 :
Arab_NDB3 :
Japo_NDB3 :
Indi_NDB3 :
280 * 300 * 320 * 340 * 360
KITLIQSGDHILNTFDERISSFAEQKFTRDGIDVQTGMRVMSVTDKDITVKVKSSGELVSIPHGLILWSTGVGTRPVISDFMEQVGQGGR
KITIIQSGEHILNMFDQRIATFAEMKFQRDGIEVNTGFRVVKVSDDLITMKSKSL-GEVSVPYGMAVWSAGIGTRPVIMDFMQQIGQTNR
KITIIQSGEHILNMFDQRIATFAEMKFQRDGIEVNTGFRVVKVSDDLITMKSKSL-GEVSVPYGMAVWSAGIGTRPVIMDFMQQIGQTNR
RITLLEAADHILTMFDKRITEFAEEKFSRDGIDVKLGSMVTKVNEKDISAKTKGG-EVSSIPYGMIVWSTGIGTRPVIKDFMKQIGQGNR
NISVIEAGDHILTMFDKRITQFAEDKFKRTGIDLKTNFKVVKVSDKAITMTNSAT-GEIAVPYGMAVWSTGIGTRPLIMDFMKQVGQANR
NISVIEAGDHILTMFDKRITQFAEDKFKRTGIDLKTNFKVVKVSDKAITMTNSAT-GEIAVPYGMAVWSTGIGTRPLIMDFMKQVGQANR
QITLLEAADHILTMFDKRITEFAEEKFTRDGIDVKLGSMVVKVNDKEISAKTKAG-EVSTIPYGMIVWSTGIGTRPVIKDFMKQIGQGNR
KISLIEAADHILTMFDKRITEFAEDKFGRDGIDVKTGYKVVKVAKDAITMQNPAT-GDIAVPYGMAVWSTGIGTRPFISEFMKQIGQVPS
KISLIEAADHILTMFDKRITEFAEDKFGRDGIDVKTGYKVVKVAKDAITMQNPAT-GDIAVPYGMAVWSTGIGTRPFISEFMKQIGQGKR
: 342
: 354
: 354
: 349
: 343
: 343
: 347
: 348
: 348
Arab_NDB1 :
Japo_NDB1 :
Indi_NDB1 :
Arab_NDB2 :
Japo_NDB2 :
Indi_NDB2 :
Arab_NDB3 :
Japo_NDB3 :
Indi_NDB3 :
* 380 * 400 * 420 * 440 *
RAVATNEWLQVTGCENVYAVGDCASIAQRKILGDIANIFKAADADNSGTLTMEELEGVVDDIIVRYPQVELYLKSKHMRHINDLLADSEG
RVLATNEWLRVHECDNIYAIGDCASITQRKIMDDISTVFKMADKDNSGTLTLKEINDVLEDICIRYPQVELYMKSMHMLDIRDLIKDAIG
RVLATNEWLRVHECDNIYAIGDCASITQRKIMDDISTVFKMADKDNSGTLTLKEINDVLEDICIRYPQVELYMKSMHMLDIRDLIKDAIG
RALATDEWLRVEGTDNIYALGDCATINQRKVMEDVSAIFSKADKDKSGTLTLKEFQEAMDDICVRYPQVELYLKSKRMRGIADLLKEAET
RVLATDEWLRVHGCDDVYALGDCATITQRKVMEDIASIFRVADKDNSGSLTVKKIKNVLGDIYERYPQVELYLKTNQMKDFHDLLKDSDG
RVLATDEWLRVHGCDDVYALGDCATITQRKVMEDIASIFRVADKDNSGSLTVKKIKNVLGDIYERYPQVELYLKTNQMKDFHDLLKDSDG
RALATDEWLRVEGCDNIYALGDCATINQRKVMEDIAAIFKKADKENSGTLTMKEFHEVMSDICDRYPQVELYLKSKGMHGITDLLKQAQA
KKLSSTL------CS---------------------------------------------------------------------------
RVLATDEWLRVRECDGVYAVGDCATINQRRVMDDISEIFRVADKDNSGTLTVKEIQDVLDDIYVRYPQVELYLKSRQMNGIADLVRTAKG
: 432
: 444
: 444
: 439
: 433
: 433
: 437
: 357
: 438
Arab_NDB1 :
Japo_NDB1 :
Indi_NDB1 :
Arab_NDB2 :
Japo_NDB2 :
Indi_NDB2 :
Arab_NDB3 :
Japo_NDB3 :
Indi_NDB3 :
460 * 480 * 500 * 520 * 540
N----ARKEVDIEAFKLALSEADSQMKTLPATAQVAAQQGAYLAKCFNRMEQCKELPEGPKRFRT--GGHHQFRPFQYKHFGQFAPLGGD
D-SHKESMVVNIEEFKKALSHVDSQVKSIPATAQVAAQQGHYLAECFNKMDQCKEHPEGPLRMTGTGSGRHNFRPFRYKHLGQFAPLGGE
D-SHKESMVVNIEEFKKALSHVDSQVKSIPATAQVAAQQGHYLAECFNKMDQCKEHPEGPLRMTGTGSGRHNFRPFRYKHLGQFAPLGGE
DDVSKNNIELKIEEFKSALSQVDSQVKFLPATAQVAAQQGAYLAKCFDRMEECEKSPEGPIRMRG--EGRHRFRPFRYRHLGQFAPLGGE
N-AIKESKELNIEEFKKALARVDSQVKMLPATAQVASQEGAYLANCFNKMKYCEENPEGPLRIRG--TGRHRFKPFRYRHLGQFAPLGGE
N-AIKESKELNIEEFKKALARVDSQVKMLPATAQVASQEGAYLANCFNKMKYCEENPEGPLRIRG--TGRHRFKPFRYRHLGQFAPLGGE
ENGSNKSVELDIEELKSALCQVDSQVKLLPATGQVAAQQGTYLAKCFDRMEVCEKNPEGPIRIRG--EGRHRFRPFRYRHLGQFAPLGGE
------------------------------------------------------------------------------------------
D-AEKESVELNIEEFKKALSLVDSQVKNLPATAQVASQQGQYLARCFNKMKDAEENPEGPIRIRG--EGRHRFRPFRYRHLGQFAPLGGE
: 516
: 533
: 533
: 527
: 520
: 520
: 525
: -
: 525
Arab_NDB1 :
Japo_NDB1 :
Indi_NDB1 :
Arab_NDB2 :
Japo_NDB2 :
Indi_NDB2 :
Arab_NDB3 :
Japo_NDB3 :
Indi_NDB3 :
* 560 * 580 *
QAAAELPGDWVSAGKSAQWLWYSVYASKQVSWRTRALVVSDWTRRYIFGRDSSRI
QAAAELPGDWVSMGHSTQWLWYSVYASKQVSWRTRMLVVSDWTRRFIFGRDSSRI
QAAAELPGDWVSMGHSTQWLWYSVYASKQVSWRTRMLVVSDWTRRFIFGRDSSRI
QTAAQLPGDWVSIGHSSQWLWYSVYASKQVSWRTRVLVVSDWMRRFIFGRDSSSI
QTAAQLPGDWIHVGHSTQWLWYSVYASKQFSWRTRMLVVSDWGRRFIYGRDSSSL
QTAAQLPGDWIHVGHSTQWLWYSVYASKQFSWRTRMLVVSDWGRRFIYGRDSSSL
QTAAQLPGDWVSIGHSSQWLWYSVYASKQVSWRTRVLVVSDWMRRFIFGRDSSRI
-------------------------------------------------------
QTAAQLPGDWISIGHSTQWLWYSVYATKQISWRTRALVISDWSRRFIFGRDSSCI
: 571
: 588
: 588
: 582
: 575
: 575
: 580
: -
: 580
EF hand motif
GXGXXG
GXGXXG

Chapter 3
82
Figure 3.5 A multiple sequence alignment of full length NDC proteins from Arabidopsis, japonica and indica rice
The position of the GXGXXG conserved domains are denoted by red bars bellow the alignment.
The first GXGXXG motif facilitates NAD(P)H binding (NADB domain) and the second is
responsible for specifically binding a substrate and catalyzing a particular enzymatic reaction.
EF-hand motifs are absent from NDC proteins in Arabidopsis as well as in rice. NDC1 sequence
from Arabidopsis is shorter than rice NDC1 sequences. Rice NDC1 sequences share 65% of
amino acid residue identity with Arabidopsis NDC1.
Arab_NDC1 :
Japo_NDC1 :
Indi_NDC1 :
* 20 * 40 * 60 * 80
MAVLSSVSSLIPFSYGATRLTSKA---SLASRTSGFN---------LSSRWNSTRNSPMLY---------LSRAVTNNSG
-------MSCRAAPWGRPSLPGGRPSPGSARQRGPFGGLNVWRNSILNNSWRLGG-TPMKFGLPSRLFRLMASSSSGDGG
-------MSCRAAPWGRPSLPGGRPSPGSARQRGPFGVLNVWRNSILNNSWSLGG-TPMKFGLPSRLFRLMASSSSGDGG
: 59
: 72
: 72
Arab_NDC1 :
Japo_NDC1 :
Indi_NDC1 :
* 100 * 120 * 140 * 160
T-TEISDNETAPRTYSWPDNKRPRVCILGGGFGGLYTALRLESLVWPEDKKPQVVLVDQSERFVFKPMLYELLSGEVDVW
FSRPSSTDEGPMPIYSWPDKQRPRVCILGGGFGGLYTALRLESLVWPNDKKPQVMLVDQSDRFVFKPMLYELLSGEVDVW
FSRPSSTDEGPMPIYSWPDKQRPRVCILGGGFGGLYTALSLESLVWPNDKKPQVMLVDQSDRFVFKPMLYELLSGEVDVW
: 138
: 152
: 152
Arab_NDC1 :
Japo_NDC1 :
Indi_NDC1 :
* 180 * 200 * 220 * 240
EIAPRFSDLLTNTGIQFLRDRVKTLLPCDHLGVNGSEISVTGGTVLLESGFKIEYDWLVLALGAESKLDVVPGAMELAFP
EIAPSFTELLKNTSVQFVKDSVKLLRPSDHFRRDS-GGSCTGGVVHLESGTVIEYDWLVLALGAEAKIDVVPGSAEYAIP
EIAPSFTELLKNTSVQFVKDSVKLLRPSDHFRRDS-GGSCTGGVVHLESGTVIEYDWLVLALGAEAKIDVVPGSAEYAIP
: 218
: 231
: 231
Arab_NDC1 :
Japo_NDC1 :
Indi_NDC1 :
* 260 * 280 * 300 * 320
FYTLEDAIRVNEKLSKLERKNFKD-GSAIKVAVVGCGYAGVELAATISERLQDRGIVQSINVSKNILTSAPDGNREAAMK
FTTLDDALKVESQLKMLERRRFGKNSPDIQVAIVGLGYSGVELAATISERLKNKGIVQAINVQTTICPSAPPGNRDAALK
FTTLDDALKVESQLKMLERRRFGKNSPDIQVAIVGLGYSGVELAATISERLKNKGIVQAINVQTTICPSAPPGNRDAALK
: 297
: 311
: 311
Arab_NDC1 :
Japo_NDC1 :
Indi_NDC1 :
* 340 * 360 * 380 * 400
VLTSRKVQLLLGYLVQSIKRASNLEE--------------DEGYFLELQPAERGLESQIIEADIVLWTVGAKPLLTKLEP
VLESRNIQLFLGYFVNCIREASASEDSSSMVTDAKEVNGDHKKLLLELQPAQRGIQSQVLEADMVLWTVGSTSQIPRLQP
VLESRNIQLFLGYFVNCIREASASEDSSSMVTDAKEVNGDHKKLLLELQPAQRGIQSQVLEADMVLWTVGSTSQIPRLQP
: 363
: 391
: 391
Arab_NDC1 :
Japo_NDC1 :
Indi_NDC1 :
* 420 * 440 * 460 * 480
-SGPNVLPLNARGQAETDETLRVKGHPRIFALGDSSSLRDSNGKILPTTAQVAFQEADFTGWNIWAAINNRPLLPFRFQN
PDAPYVIPLNGRGQVETEETLQVKGHPRTFAIGDSAALRDPSGKLLPATAQVAFQQADFAGWNLWAAINDRPLLPFRFQN
PDAPYVIPLNGRGQVETEETLQVKGHPRTFAIGDSAALRDPSGKLLPATAQVAFQQADFAGWNLWAAINDRPLLPFRFQN
: 442
: 471
: 471
Arab_NDC1 :
Japo_NDC1 :
Indi_NDC1 :
* 500 * 520 * 540 *
LGEMMTLGRYDAAISPSFIEGLTLEGPIGHAARKLAYLIRLPTDEHRFMVRISWFAKSAVDSIALLQSNLTKVLSGS
LGEMMTLGRSDAAITASFIEGLTLEGPLGHAARKIVYCLRMPTDEHRVKVGISWFTKTAVDSLASLQNAVSSMLTSP
LGEMMTLGRSDAAITASFIEGLTLEGPLGHAARKIVYCLRMPTDEHRVKVGISWFTKTAVDSLASLQNAVSSMLTSP
: 519
: 548
: 548
GXGXXG
GXGXXG

Chapter 3
83
3.3.5 All rice AOX proteins are predicted be targeted only to mitochondria while some NDH proteins are predicted to be dual targeted
Some nuclear encoded proteins appear to be targeted to more than one organelle and
these are designated as dual targeted proteins (Elhafez et al., 2006; Carrie et al.,
2008). The subcellular locations of rice AOX and NDH proteins were assessed using
a number of subcellular prediction programs. From these programs, AOXs from both
japonica and indica rice were predicted to be targeted to mitochondria, having
cleavable N-terminal targeting signals (Table 3.3). No peroxisomal type 1 targeting
sequences (PTS1) at the C-terminus were identified according to the prediction
program “PredplantPTS1” confirming that AOXs do not target to peroxisomes. Whilst
NDA1 protein from both rice sub-species was predicted to be targeted to mitochondria,
NDA2 was predicted to be dual targeted to both mitochondria and peroxisomes based
on predicted PTS1 signals. It is interesting to note that NDB1 and NDB2 from both rice
sub-species were predicted to be dual targeted to mitochondria and peroxisomes but
NDB3 was predicted to be localized only to mitochondria. NDC1 from both rice groups
was predicted to be dual targeted to both mitochondria and chloroplasts but not
targeted to peroxisomes (Table 3.3).

Chapter 3
84
Table 3.3 Subcellular localization of identified alternative respiratory proteins from japonica and indica rice
Prediction of subcellular targeting of rice alternative respiratory proteins using publicly available subcellular localization prediction programs; TargetP
(http://www.cbs.dtu.dk/services/TargetP/), Predotar (http://urgi.versailles.inra.fr/Tools/), Plant-mPLOC (http://www.csbio.sjtu.edu.cn/bioinf/plant-multi/) and ChloroP1,
(http://www.cbs.dtu.dk/Servies). Proteins targeting to the peroxisomes were predicted using PredPlantPTS1 (http://ppp.gobics.de/).
Protein
Targeting organelle predicted by different programs
Plant- mPLOC TargetP MitoProtII ChloroP1 Predotar PredPlantPTS1
AOX1a Mitochondria Mitochondria Mitochondria Chloroplast Mitochondria Not targeted to peroxisomes
AOX1b Mitochondria Mitochondria Mitochondria Chloroplast Mitochondria Not targeted to peroxisomes
AOX1c Mitochondria Mitochondria Mitochondria Chloroplast Mitochondria Not targeted to peroxisomes
AOX1d Mitochondria Mitochondria/ Chloroplast
Mitochondria Chloroplast Mitochondria Not targeted to peroxisomes
NDA1 Mitochondria Mitochondria Mitochondria Chloroplast Mitochondria Not targeted to peroxisomes
NDA2 Mitochondria Mitochondria Mitochondria Chloroplast Mitochondria Peroxisomes
NDB1 Mitochondria Mitochondria Mitochondria Not targeted to chloroplast
Probably mitochondria
Peroxisomes
NDB2 Mitochondria Mitochondria Mitochondria Not targeted to chloroplast
Possibly mitochondria
Peroxisomes
NDB3 Mitochondria Mitochondria Mitochondria Not targeted to chloroplast
Possibly ER Not targeted to peroxisomes
NDC1 Mitochondria Chloroplast Mitochondria Chloroplast Possibly plastid Not targeted to peroxisomes

Chapter 3
85
3.3.6 Protein phylogeny reveals that rice AOX proteins can be grouped into four subfamilies along with other monocot species
Protein phylogeny was used in order to identify different AOX subfamilies in selected
monocot species and to see whether the identified rice AOX sequences were grouped
accordingly. Phylogenetic analysis showed that all AOX orthologs from selected
monocot species were clustered into four distinct clades (Figure 3.6); type a, b, c and
d. Rice AOXs from both sub-species were also grouped into four clades accordingly
(indicated by red arrows) and showed very close similarity. The phylogenetic tree also
revealed that there was a close similarity between type “a” and type “c” group members
compared to type “b” or type “d”. There was obvious further clustering of members
within the main clades. For example, the type “b” clade was further divided into four
sub-groups and AOX1b from the two rice sub-species were grouped within the type
“b” clade as a separate group. Similarly, type “a” members were grouped into two
major sub-groups (Figure 3.6).
3.3.7 Protein phylogeny reveals that rice NDH proteins can be grouped into three families along with other monocot species
Phylogenetic analysis of NDHs showed clustering of monocot alternative
dehydrogenases into three discrete clades; NDA, NDB and NDC (Figure 3.7). There
was very clear further division of the NDB clade into three sub-groups as NDB1, NDB2
and NDB3. The NDA clade was further divided into two groups as NDA1 and NDA2.
The rice NDH proteins also clustered into these NDA, NDB and NDC families
(indicated by red arrows). It was very clear that NDA and NDB families had a higher
degree of homology with each other than with the NDC family, as reported for
Arabidopsis (Michalecka et al., 2003).

Chapter 3
86
Figure 3.6 Representative protein phylogenetic tree of monocot species with AOX protein sequences showing four major clades, AOX1a, AOX1b, AOX1c and AOX1d
The phylogenetic tree was constructed using the Neighbor-Joining method in MEGA 7
(www.megasoftware.net/). Numbers at each node are the percentage bootstrap values of 1000
replicates. The scale bar indicates the number of amino acid substitutions at each site.
Wheat|BAB88645|WAOX1a
Barley|BAJ94443|HvAOX1a
Purple false brome|Bradi5g205040|BdAOX1a
Japonica rice|LOC Os04G51150|OsAOX1a
Indica rice|OSINDICA 04G42960|AOX1a
Foxtail millet|Seita.7G223700|SiAOX1a
Maize|GRMZM2G125669|ZmAOX1a
Sugarcane|AAU11467|SoAOX1a
Sorghum|Sobic.006G202500|SbAOX1a
Wheat|BAB88646|WAOX1c
Purple false brome|Bradi5g205040|BdAOX1c
Japonica rice|LOC Os02G47200|OsAOX1c
Indica rice|OSINDICA 02G45530|AOX1c
Foxtail millet|Seita.1G286500|SiAOX1c
Sugarcane|AAU11469|SoAOX1c
Maize|AAL27795|ZmAOX1c
Sorghum|Sobic.004G270500|SbAOX1c
Japonica rice|LOC Os02G21300|OsAOX1d
Indica rice|OSINDICA 02G20320|AOX1d
Sorghum|Sobic.006G203000|SbAOX1b2
Sugarcane|AAU11470|SoAOX1b2
Maize|GRMZM2G074743|ZmAOX1b
Foxtail millet|Seita.7G223900|SiAOX1b1
Japonica rice|LOC Os04G51160|OsAOX1b
Indica rice|OSINDICA 04G42970|AOX1b
Maize|GRMZM2G074761|ZmAOX1b1
Sugarcane|AAU11468|SoAOX1b1
Sorghum|Sobic.006G202600|SbAOX1b1
Foxtail millet|Seita.7G223800|SiAOX1b2
Purple false brome|Bradi5g20557|BdAOX1b
Purple false brome|Bradi5g20547|BdAOX1b
Barley|BAK00314|HvAOX1b
Wheat|BF474492|WAOX1b
Barley|BAJ96608|HvAOX1b
100
99
100
100
100
83
39
99
94
83
66
85
98
50
49
100
71
99
98
96
99
100
61
68
93
95
63
90
98
62
98
5

Chapter 3
87
Figure 3.7 Representative protein phylogenetic tree of monocot species with NDH protein sequences showing three major clades, NDA, NDB and NDC
The phylogenetic tree was constructed using the Neighbor-Joining method in MEGA 7
(www.megasoftware.net/). Numbers at each node are the percentage bootstrap values of 1000
replicates. The scale bar indicates the number of amino acid substitutions at each site.
Maize|GRMZM2G563190|ZmNDB2
Maize|GRMZM2G090487|ZmNDB3
Sorghum|SB03G036480|SbNDB2
Foxtail millet|SI005G34840|SiNDB2
Japonica rice|LOC Os05g26660|OsNDB2
Indica rice|BGIOSGA018290|NDB2
Barley|HV36877G00010|HvNDB2
Purple false brome|BRADI2g51830|BdNDB2
Japonica rice|LOC Os08g04630|OsNDB3
Indica rice|BGIOSGA027677|NDB3
Barley|HV47987G00010|HvNDB3
Purple false brome|BRADI3g14800|BdNDB3
Foxtail millet|SI006G06630|SiNDB3
Maize|GRMZM2G145972|ZmNDB4
Sorghum|SB07G003070|SbNDB3
Barley|HV1569455G00010|HvNDB1
Purple false brome|BRADI1G33097.3|BdNDB1
Japonica rice|LOC Os06g47000|OsNDB1
Indica rice|BGIOSGA020655|NDB1
Foxtail millet|SI004G26340|SiNDB1
Maize|GRMZM2G322328|ZmNDB1
Sorghum|SB10G027690|SbNDB1
Maize|GRMZM2G041418|ZmNDA1
Sorghum|SB02G036490|SbNDA1
Foxtail millet|SI002G36270|SiNDA1
Purple false brome|BRADI1g24620|BdNDA1
Japonica rice|LOC Os07g37730|OsNDA1
Indica rice|BGIOSGA025955|NDA1
Barley|HV7977G00010|HvNDA2
Purple false brome|BRADI2g53970|BdNDA2
Maize|GRMZM2G069260|ZmNDA2
Sorghum|SB03G038750|SbNDA2
Foxtail millet|SI005G37600|SiNDA2
Japonica rice|LOC Os01g61410|OsNDA2
Indica rice|BGIOSGA004734|NDA2
Zmays|GRMZM2G080044|ZmNDC1
Foxtail millet|SI004G07880|SiNDC1
Sorghum|SB10G007230|SbNDC1
Barley|HV49824G00010|HvNDC1
Purple false brome|BRADI1g45921|BdNDC1
Japonica rice|LOC Os06g11140|OsNDC1
Indica rice|OSINDICA 06G10630|NDC1100
61
100
60
60
100
100
100
92
82
29
37
100
73
49
70
100
100
100
87
56
59
68
99
100
91
83
83
40
100
100
9993
100
82
100
94
59
30
10

Chapter 3
88
3.3.8 Exon-intron structural polymorphism in AP genes is present within and between species
A comparative study of the exon-intron structures of alternative respiratory pathway
genes in japonica and indica rice was conducted to explore gene structure
polymorphism in two rice sub-species. Information on Arabidopsis exon-intron
structures were also included in the study to explore how monocot gene structures
have deviated from those in the dicots. The study found that there are variations in
exon-intron gene structure between dicots and monocots as well as within the two rice
sub-species.
AOX1 genes from Arabidopsis, japonica and indica rice groups have a conserved
structure consisting of four exons interrupted by three introns, with the exception of
rice AOX1b (Figures 3.8, 3.9, 3.10 and 3.11). The AOX1b genes from both rice sub-
species have three exons separated by two introns (Figure 3.9). It is suggested that
this could be due to the loss of the second intron in the other AOX genes (Considine
et al., 2002).
NDA gene structures from Arabidopsis and the two rice groups also show variation.
AtNDA1 has 8 coding sequences separated by 7 non-coding regions, while NDA1 from
both japonica and indica rice have three coding regions separated by two non-coding
regions (Figure 3.12). The exon-intron structure of NDA1 from both rice groups is
similar to that of rice AOX1b (Figure 3.9). All three plant species, Arabidopsis, japonica
and indica rice, share a similar NDA2 gene structure: 8 exons interrupted by 7 introns
(Figure 3.13). A similar number of exons and introns were present in NDA gene family
members in Arabidopsis (Figures 3.12 and 3.13), but in the two rice groups, there is a
reduction of number of exons and introns in NDA1 compared to NDA2 (Figures 3.12
and 3.13).

Chapter 3
89
Figure 3.8 Comparison of exon-intron structure of AOX1a gene from Arabidopsis, japonica and indica rice
AOX1a from all three plant groups are consisted of conserved structure of plant AOXs; four exons interrupted by three introns.
Figure 3.9 Comparison of exon-intron structure of AOX1b gene from Arabidopsis, japonica and indica rice
AOX1b from Arabidopsis is consisted of conserved structure of plant AOXs; four exons interrupted by three introns. But, gene structure from both rice groups are
consisted of three exons separated by two introns.

Chapter 3
90
Figure 3.10 Comparison of exon-intron structure of AOX1c gene from Arabidopsis, japonica and indica rice
AOX1c from all three plant groups are consisted of conserved structure of plant AOXs; four exons interrupted by three introns.
Figure 3.11 Comparison of exon-intron structure of AOX1d gene from Arabidopsis, japonica and indica rice
AOX1d from all three plant groups are consisted of conserved structure of plant AOXs; four exons interrupted by three introns.

Chapter 3
91
Figure 3.12 Comparison of exon-intron structure of NDA1 gene from Arabidopsis, japonica and indica rice
Exon-intron structure of NDA1 from Arabidopsis is consisted of 8 exons separated by 7 introns. However, exon-intron structure of NDA1 from both rice groups contains
3 exons separated by two exons showing the similar structure as seen in rice AOX1b in Figure 3.9.
Figure 3.13 Comparison of exon-intron structure of NDA2 gene from Arabidopsis, japonica and indica rice
Exon-intron structure of NDA2 from all three plant groups, Arabidopsis, japonica and indica rice are similar with 8 exons separated by 7 introns. Exon-intron structure
of NDA1 and NDA2 from Arabidopsis shares similar structure (Figure 3.12).

Chapter 3
92
The comparison of exon-intron structures of the NDB gene family also revealed
variations in the number of exons and introns between Arabidopsis and the two rice
groups (Figures 3.14, 3.15, 3.16 and 3.17). Japonica and indica rice share similar
exon-intron gene structure for NDB1 and NDB2, 10 exons separated by 9 introns
(Figures 3.15 and 3.16). NDB3 from indica rice is also has a similar exon-intron
structure, but that from japonica rice has a different structure. Although it has 9 exons,
only 5 of them are coding exons (www.gramene.org, http://rice.plantbiology.msu.edu/)
and the rest are situated in the 3’ UTR as non-coding exons. As a result, the japonica
NDB3 protein sequence is shorter (357 aa) than the indica NDB3 protein (580 aa),
which has 10 coding exons (Figures 3.14 and 3.17). However, analysis of organization
of NDB3 from 10 other rice species revealed that they all share the exon-intron
structure similar to indica rice with 10 exons divided by 9 introns mostly producing
translation length of 580 aa. This confirms that this is the predominant structure
amongst rice species. Therefore, it is suspicious that only japonica rice deviates from
this structure and appears truncated and may reflect a sequencing error for the
sequence uploaded into the database.
NDB gene family members from Arabidopsis show varying numbers of exons and
introns in their gene structure. NDB1 has 9 exons interrupted by 8 introns while NDB2
and NDB3 have 11 and 10 exons, respectively. It is reported that AtNDB2 has two
splice variants (www.gramene.org), one with 10 coding exons producing a translation
length of 582 aa, while the second splice variant has 11 exons resulting in a translation
length of 619 aa. NDC family members from both rice groups showed similar exon-
intron structures with 11 exons separated by 10 introns, while NDC1 from Arabidopsis
has 10 exons (Figure 3.18).

Chapter 3
93
Figure 3.14 Exon-intron structure of NDB3 in japonica and indica rice
Exon-intron structure of NDB3 from indica rice is consisted of 10 coding exons while that from
japonica rice contains only 5 coding exons (www.gramene.org). Rest of them are located in the
UTR as non-coding exons. Coding exons are indicated by black boxes and non-coding exons
are indicated by empty boxes. Introns are indicated by black lines. Purple colour indicates
untranslated regions.

Chapter 3
94
Figure 3.15 Comparison of exon-intron structure of NDB1 gene from Arabidopsis, japonica and indica rice
Exon-intron structure of NDB1 from Arabidopsis is consisted of 9 exons separated by 8 introns. Two rice groups share a similar exon-intron structure for NDB1 with
10 exons separated by 9 introns. Arabidopsis NDB1 is lack of one exon compared to two rice groups.
Figure 3.16 Comparison of exon-intron structure of NDB2 gene from Arabidopsis, japonica and indica rice
Arabidopsis is consisted of an exon-intron structure of NDB2 with 11 exons interrupted by 10 introns while two rice groups share similar structure with 10 exons
separated by 9 introns similar to their NDB1 exon-intron structure (Figure 3.15).

Chapter 3
95
Figure 3.17 Comparison of exon-intron structure of NDB3 gene from Arabidopsis, japonica and indica rice
Arabidopsis and indica rice is consisted of an exon-intron structure of NDB3 with 10 exons interrupted by 9 introns. NDB3 from japonica rice group is consisted of 9 exons, only 5 of them are coding exons (www.gramene.org).
Figure 3.18 Comparison of exon-intron structure of NDC1 gene from Arabidopsis, japonica and indica rice
Two rice groups share similar exon-intron structure of NDC1 with 11 exons separated by 10 introns while Arabidopsis has gene structure with 10 exons separated by 9 introns.

Chapter 3
96
3.3.9 Exon-intron structural polymorphism in AOX1a is higher than that of NDB2 among different rice species
The loss or gain of introns creates complexity of gene structure, which is a key
evolutionary mechanism of most gene families (Cao, 2016). To understand the
evolution and diversity of rice AP genes, exon-intron structures of AOX1a and NDB2
from 11 rice species were investigated. This analysis revealed that cultivated rice,
O. glaberrima (African rice) and two Asian rice sub-species of O.sativa ssp indica and
O. sativa ssp. japonica, share a common exon-intron gene structure for AOX1a with
four coding exons separated by three introns (Figure 3.19). O. brachyantha, a wild rice
species, also shared this structure, but it has three more non-coding exons in the 5’
UTR (www.gramene.org). Multiple alignment of protein sequences from these four rice
species showed a very similar sequence pattern with only a few amino acid residue
mismatches. All other wild rice species have 5-8 exons, except O. punctata (BB
genome type), which has only two coding exons (Figure 3.19).
NDB2 structures showed less diversity compared to those of AOX1a. Apart from
O. longistaminata and O. punctata, all other rice species shared a similar exon-intron
organization in their NDB2 gene, with 10 exons separated by 9 introns (Figure 3.20).
O. longistaminata NDB2 has 9 exons interrupted by 8 introns, while that of O. punctata
has 13 exons separated by 12 introns, the highest number of exons and intron found
in rice NDB2 genes. Multiple alignment of amino acid sequences showed all rice
species have very similar protein sequences with 575 amino acid residues, except
O. brachyantha (579 aa), O. longistaminata (547 aa) and O. punctata (913 aa).

Chapter 3
97
Figure 3.19 Exon-intron structural organization of AOX1a gene in different rice species
Exon-intron structural organization of AOX1a gene showed high polymorphism among different rice species. Cultivated rice, O. glaberrima (African rice), two Asian
rice sub-species of O.sativa ssp indica and O. sativa ssp. japonica and O. brachyantha (a wild rice) shared exon-intron gene structure with four coding exons separated
by three introns, which is the conserved AOX structure in plants (Considine et al., 2002). O. punctata has the exon-intron structure with the lowest number of exons
(2) while all other wild rice species were consisted of 5-8 number of exons.

Chapter 3
98
Figure 3.20 Exon-intron structural organization of NDB2 gene in different rice species
All rice species except O. longistaminata and O. punctata share a similar exon-intron structure with 10 exons separated by 9 introns. The exon-intron structures of
O. longistaminata and O. punctata are consisted of 9 exons separated by 8 introns and 13 exons separated by 12 introns respectively.

Chapter 3
99
3.3.10 Three reference genes were selected for normalization of qRT-PCR data
The accuracy of results obtained by qRT-PCR depends on the accurate transcript
normalization using stably expressed genes, reference genes (Guenin et al., 2009),
across tested samples. Therefore, systematic validation of reference is important for
generating reliable, accurate data in qRT-PCR analyses. qRT-PCR assay was carried
out to examine the expression stability of 6 candidate reference genes (Table 2.3)
across a range of cDNA samples by comparing quantification cycle (Cq) values
(Sections 2.3.4 and 2.3.5). The coefficient of variance (CV) of Cq values was used as
the indicator of the expression stability of a particular gene (Fan et al., 2013) and three
genes with lowest CV values were selected as reference genes for normalization of
qRT-PCR data in subsequent gene expression analyses.
Table 3.4 Coefficient of variation (CV) of Cq values from different reference genes
Reference gene
Cq range Mean Cq CV
Os18S 14.6-22.7 19.1 0.16
OsGAPDH 22.5-34.1 26.4 0.18
OsPplase 27.6-31.2 29.9 0.05
OsTubulin 21.8-31.6 26.2 0.12
OsElF1 24.8-27.2 26.3 0.03
OsActin 25.5-33.4 28.4 0.10
The expression levels of 6 reference genes varied widely, with Cq values ranging from
14 to 34 (Table 3.4 and Figure 3.21). Although Os18S was the most highly expressed
candidate reference gene, with a mean Cq value of 19.1, its expression variability in
different tissue samples was also higher with Cq values ranging from 14.6 to 22.7.
Three genes, OsElF1, OsPplase and OsActin maintained a relatively constant
expression levels in different tissue samples tested (Figure 3.21) and therefore they
were selected as reference genes to normalize gene expression data.

Chapter 3
100
Me
an
Cq
cDNA sample
Me
an
Cq
M
ea
n C
q
Me
an
Cq
M
ea
n C
q
Me
an
Cq
cDNA sample
cDNA sample cDNA sample
cDNA sample
cDNA sample
OsPplase
Os18S OsGAPDH
OsElF1
OsTubulin OsActin
Figure 3.21 Mean Cq values in different cDNA samples from different candidate reference genes
qRT-PCR assay was carried out to examine the expression stability of 6 candidate reference
genes, OsActin, OsTubulin, OsGAPDH, OsPplase, OsElF1 and Os18S, across a range of
cDNA samples, representing salt-treated and control shoots and roots from cultivar Nipponbare
and Langi. Samples were collected 6 and 12 days after the salt treatment.
NCS, Nipponbare control shoots; NTS, Nipponbare treated shoots; NCR, Nipponbare control
root; Nipponbare treated roots; LCS, Langi control shoots; LCR, Langi control roots.

Chapter 3
101
3.3.11 Transcript abundance of rice AP genes change in response to chemical disruption of the mETC
All rice AOX and NDH sequences were found in expression sequence tag (EST)
databases (http://www.ncbi.nlm.nih.gov) confirming that all sequences have been
detected at the transcript level in certain tissue type under stressed or non-stressed
conditions. Expression patterns of alternative pathway genes under oxidative stress
were studied to identify the stress-responsive genes in rice. Antimycin A (AA) and
KCN, inhibitors of traditional electron transport pathway components, Complex III and
IV respectively, were used to create oxidative stress in plants. Rice seedlings were
exposed to 20 µM AA or 5 mM KCN and changes in transcription levels in roots and
shoots were determined using qRT-PCR technique at predetermined time-points as
described in Section 3.2.7. Transcript data were normalized against geometric
average (Vandesompele et al., 2002) of three selected reference genes, OsActin,
OsElF1 and OsPlase (Sections 2.3.5 and 3.3.10), and used to calculate transcript level
of each gene relative to the control at each time point, set at 1.00 (Table 3.5 and 3.6).
The preliminary transcript level data normalized against geometric mean of three
reference genes is also shown as relative transcript abundance for each gene in
control and treated shoots and roots in Supplementary Figures C1-C6 (Appendix C).
Transcript abundance of AOX1a was significantly enhanced in shoots 6 h after
exposing to 5 mM KCN as well as 20 µM AA. There was a 58-fold increase of transcript
abundance in KCN-treated shoots compared to control while the increase was 2.3-fold
in AA-treated shoots (Table 3.5). Transcript levels of AOX1b were also significantly
higher in shoots exposed to KCN but not AA. Transcript levels of AOX1b increased
248- and 348-fold, 6 h and 24 h after treatment compared to their corresponding
controls (Table 3.5). No noticeable changes of AOX1c transcript levels were observed
(Table 3.5). Of the NDH genes, NDB2 transcript levels were significantly higher in
shoots 6 h after seedlings were exposed to KCN as well as AA. There was a significant
increase also in NDA1 and NDB3 transcript levels in KCN-treated shoots after 6 h of
treatment (Table 3.5). Although there were higher transcript levels of NDA1, NDA2,

Chapter 3
102
NDB1, NDB3 and NDC1 in AA-treated shoots 6 h or/and 24 h after treatment, the
increases were not significant compared to their controls (Table 3.5).
Transcript abundance of all AOX isoforms (AOX1a, AOX1b and AOX1c) and NDH
isoforms, except NDB3 and NDC1, were significantly increased in roots either 6 h or
24 h after AA treatment (Table 3.6). Of the NDH genes, only NDB2 maintained the
higher level of transcript abundance up to 24 h after AA treatment, while transcript
levels of all other NDH genes decreased over the longer time. Although transcript
abundance of NDB3 and NDC1 in roots increased during AA treatment, but not
significantly compared to their controls. In KCN-treated roots, the transcript abundance
of two AOX isoforms (AOX1a and AOX1b), two NDA isoforms (NDA1 and NDA2) and
two NDB isoforms (NDB2 and NDB3) were significantly increased either 6 h or 24 h
after the treatment (Table 3.6). The transcript abundance for treatment with KCN was
not significantly increased for NDA2 and NDB2 in roots at 6 h, but significantly
increased 24 h after treatment. Transcript abundance of AOX1c, NDA2, and NDB1
were decreased in KCN treated shoots while transcript levels of NDC1 were
decreased both in KCN treated roots and shoots (Table 3.5. and 3.6).
Interestingly, transcript abundance of AOX1a and NDB2 increased significantly in both
roots and shoots when seedlings were exposed either KCN or AA treatments and
showed a similar pattern. In shoots, significantly higher transcript abundances of both
genes were observed 6 h after KCN or AA treatments. In roots also, significantly high
transcript abundance was detected in both AOX1a and NDB2 6 h after AA treatment
and maintained until 24 h. Only in KCN-treated roots, AOX1a showed an early
increase of transcript levels (at 6 h) while higher transcript abundance of NDB2 was
observed 24 h after treatment (Table 3.6).

Chapter 3
103
Table 3.5 Transcript level changes of alternative respiratory genes in shoots when traditional ETC was chemically inhibited
Exposure to potassium cyanide (5 mM) and antimycin A (20 µM) treatments up-regulates AOX and NDH gene expression in rice (O. sativa ssp japonica cv
Nipponbare). Gene expression analyses were carried out using qRT-PCR and transcript levels were determined in both shoot and root tissues exposed to
treatments for 6 h and 24 h or grown under control conditions. Data are shown as mean ± SEM of three biological replicates relative to the control at each
point set at 1.00. Significant transcript level changes relative to the control according to two way ANOVA are indicated by green boxes (p≤0.05). Blue boxes
indicate increased transcript levels relative to control but not significant.
Potassium cyanide (KCN) treatment (5 mM)
Antimycin A (AA) treatment (20 µM)
Shoots
Gene KCN (mM) 0 h 6 h 24 h AA (µM) 0 h 6 h 24 h
AOX1a 0
1.0 ± 0.4 1.0 ± 0.37 1.0 ± 0.50 0
1.0 ± 0.18 1.0 ± 0.23 1.0 ± 0.07
5 58.2 ± 15.51 1.0 ± 0.29 20 2.3 ± 0.73 1.2 ± 0.13
AOX1b 0 1.0 ± 0.4
1.0 ± 0.33 1.0 ± 0.88 0 1.0 ± 0.12
1.0 ± 0.29 1.0 ± 0.15
5 248.6 ± 63.97 348.6 ± 78.37 20 1.2 ± 0.62 0.9 ± 0.19
AOX1c 0
1.0 ± 0.4 1.0 ± 0.32 1.0 ± 0.53 0
1.0 ± 0.22 1.0 ± 0.46 1.0 ± 0.20
5 0.3 ± 0.08 0.1 ± 0.02 20 1.0 ± 0.59 0.7 ± 0.14
NDA1 0
1.0 ± 0.7 1.0 ± 0.53 1.0 ± 0.57 0
1.0 ± 0.28 1.0 ± 0.83 1.0 ± 0.44
5 17.4 ± 3.13 0.7 ± 0.05 20 1.3 ± 0.77 2.2 ± 0.18
NDA2 0
1.0 ± 0.2 1.0 ± 0.70 1.0 ± 0.36 0
1.0 ± 0.13 1.0 ± 0.40 1.0 ± 0.18
5 0.2 ± 0.04 1.1 ± 0.20 20 1.4 ± 0.52 1.5 ± 0.49
NDB1 0
1.0 ± 0.35 1.0 ± 0.40 1.0 ± 0.26 0
1.0 ± 0.09 1.0 ± 0.22 1.0 ± 0.04
5 0.2 ± 0.11 0.9 ± 0.66 20 1.3 ± 0.45 2.1 ± 0.50
NDB2 0
1.0 ± 0.12 1.0 ± 0.41 1.0 ± 0.27 0
1.0 ± 0.11 1.0 ± 0.62 1.0 ± 0.12
5 5.2 ± 0.91 1.9 ± 0.42 20 2.8 ± 0.79 1.4 ± 0.06
NDB3 0
1.0 ± 0.36 1.0 ± 0.37 1.0 ± 0.07 0
1.0 ± 0.21 1.0 ± 0.85 1.0 ± 0.43
5 18.3 ± 0.7.5 0.7 ± 0.05 20 1.3 ± 0.82 1.6 ± 0.41
NDC1 0
1.0 ± 0.33 1.0 ± 0.39 1.0 ± 0.02 0
1.0 ± 0.02 1.0 ± 0.31 1.0 ± 0.21
5 0.6 ± 0.07 0.2 ± 0.11 20 1.0 ± 0.47 1.7 ± 0.38

Chapter 3
104
Table 3.6 Transcript level changes of alternative respiratory genes in roots when traditional ETC was chemically inhibited
Exposure to potassium cyanide (5 mM) and antimycin A (20 µM) treatments up-regulates AOX and NDH gene expression in rice (O. sativa ssp japonica cv
Nipponbare). Gene expression analyses were carried out using qRT-PCR and transcript levels were determined in both shoot and root tissues exposed to
treatments for 6 h and 24 h or grown under control conditions. Data are shown as mean ± SEM of three biological replicates relative to the control at each
point set at 1.00. Significant transcript level changes relative to the control according to two way ANOVA are indicated by green boxes (p≤0.05). Blue boxes
indicate increased transcript levels relative to control but not significant.
Potassium cyanide treatment (5 mM)
Antimycin A treatment (20 µM)
Roots
Gene KCN (mM) 0 h 6 h 24 h AA (µM) 0 h 6 h 24 h
AOX1a 0
1.0 ± 0.12 1.0 ± 0.22 1.0 ± 0.20 0
1.0 ± 0.31 1.0 ± 0.27 1.0 ± 0.29
5 44.0 ± 4.52 5.1 ± 1.01 20 11.53 ± 1.60 6.5 ± 0.76
AOX1b 0 1.0 ± 0.51
1.0 ± 0.06 1.0 ± 0.34 0 1.0 ± 0.21
1.0 ± 0.26 1.0 ± 0.11
5 355.4 ± 46.55 11.3 ± 1.36 20 5.9 ± 1.88 6.5 ± 2.16
AOX1c 0
1.0 ± 0.42 1.0 ± 0.14 1.0 ± 0.25 0
1.0 ± 0.50 1.0 ± 0.39 1.0 ± 0.23
5 1.7 ± 0.25 0.1 ± 0.02 20 3.0 ± 0.65 1.0 ± 0.30
NDA1 0
1.0 ± 0.19 1.0 ± 0.20 1.0 ± 0.25 0
1.0 ± 0.73 1.0 ± 0.28 1.0 ± 0.42
5 56.9 ± 13.04 2.0 ± 0.15 20 6.5 ± 0.46 0.5 ± 0.02
NDA2 0
1.0 ± 0.66 1.0 ± 0.19 1.0 ± 0.28 0
1.0 ± 0.26 1.0 ± 0.10 1.0 ± 0.07
5 3.0 ± 0.81 6.0 ± 1.33 20 3.1± 0.39 0.7 ± 0.17
NDB1 0
1.0 ± 0.68 1.0 ± 0.35 1.0 ± 0.63 0
1.0 ± 0.02 1.0 ± 0.30 1.0 ± 0.17
5 1.6 ± 1.13 0.9 ± 0.23 20 2.4 ± 0.71 0.7± 0.12
NDB2 0
1.0 ± 0.48 1.0 ± 0.27 1.0 ± 0.10 0
1.0 ± 0.31 1.0 ± 0.09 1.0 ± 0.32
5 2.0 ± 0.37 7.1 ± 1.63 20 2.8 ± 0.18 3.8 ± 0.42
NDB3 0
1.0 ± 0.46 1.0 ± 0.54 1.0 ± 0.14 0
1.0 ± 0.64 1.0 ± 0.06 1.0 ± 0.12
5 29.7 ± 5.64 1.0 ± 0.38 20 2.4 ± 0.85 1.2 ± 0..06
NDC1 0
1.0 ± 0.47 1.0 ± 0.21 1.0 ± 0.10 0
1.0 ± 0.09 1.0 ± 0.17 1.0 ± 0.22
5 1.0 ± 0.19 0.4 ± 0.14 20 1.8 ± 0.85 0.8 ± 0.26

Chapter 3
105
3.3.12 Functional elements of Arabidopsis AOX1a and NDB2 promoters were also found to be present in rice AOX1a and NDB2
The search within the promoter region of AOX1a from japonica and indica rice for the
presence of the cis-acting regulatory elements (CAREs) that were functional in
Arabidopsis AOX1a revealed that the most of them were also present in rice AOX1a
(Table 3.7). Seven out of the ten functional elements in Arabidopsis AOX1a were also
found be present in both japonica and indica rice suggesting that these regulatory
element sequences were conserved among plant species. All functional CAREs found
in promoter region of Arabidopsis NDB2 were also found to be present in the promoter
region of NDB2 from both rice groups. As in Arabidopsis, it seems that rice AOX1a
and NDB2 promoter regions were also sharing number of regulatory elements which
are responsible for controlling stress tolerance responses (Table 3.7). However, it is
yet to be investigated whether these regulatory elements are functional in rice.
The promoter region search for the presence of CAREs were extended to other rice
AP genes as it was found that some other AP genes were also co-induced with AOX1a
and NDB2. Similar to rice AOX1a and NDB2, functional elements were present in the
1.5 kb upstream regions of other AP genes from japonica and indica (Table 3.7). It is
interesting to note that all 6 functional elements found in Arabidopsis NDB2 were
predicted to be present in rice NDA2, NDB1, NDB2, NDB3 while only five of them were
predicted to be present in NDA1 and NDC1 (Table 3.7).

Chapter 3
106
AOX1a NDB2 AOX1a AOX1b AOX1c NDA1 NDA2 NDB1 NDB2 NDB3 NDC1
TGAAGC ✓ ✓ ✓ ✓
CGTGAT ✓ ✓ ✓ ✓ ✓ ✓ ✓ ✓ ✓ ✓ ✓
ATCCG ✓ ✓ ✓ ✓ ✓ ✓ ✓
CACACA ✓ ✓ ✓ ✓
CGGCTTT ✓ ✓ ✓
TCGTAAA ✓ ✓ ✓ ✓ ✓ ✓ ✓ ✓ ✓ ✓ ✓
TCTCT ✓ ✓ ✓ ✓ ✓ ✓ ✓ ✓ ✓ ✓
GTCATC ✓ ✓ ✓ ✓ ✓ ✓ ✓ ✓ ✓ ✓ ✓
ACGTG ✓ ✓ ✓ ✓ ✓ ✓ ✓ ✓ ✓ ✓ ✓
TTCGATCA ✓ ✓ ✓
Arabidopsis Rice Motif Sequence
Table 3.7 Summary of the conserved cis–acting regulatory motifs predicted to be present in rice AOX and NDH promoter regions, which were found to be functional in Arabidopsis AOX1a and NDB2
Putative CAREs in rice AP genes were identified using the computer program “CentriMo”, Local Motif Enrichment Analysis tool on the motif prediction
algorithm “MEME” (meme-suite.org) with default settings.
‘✓’ motif signal detected in promoter region

Chapter 3
107
3.4 Discussion
The objectives of this Chapter were to identify alternative pathway homologs in two
rice sub-species using sequence similarity to Arabidopsis alternative pathway genes,
to characterize them, and to identify genes that respond to oxidative stress. The
bioinformatics survey revealed that both AOXs and NDHs are present in both japonica
and indica rice. Only AOX1-type genes were present, while AOX2-types were absent
in rice, as reported from other monocot species (Considine et al., 2002). Four isoforms
of AOX1 (AOX1a, AOX1b, AOX1c and AOX1d) and 6 members of NDHs (NDA1,
NDA2, NDB1, NDB2, NDB3 and NDC1) homologous to Arabidopsis genes were
identified. All NDH gene families found in dicot plants so far were present in both
japonica and indica rice. Genes from all AOX and NDH families encode proteins
predicted be targeted to mitochondria, while some of the NDH proteins are predicted
to also localise to other organelles, as suggested previously by (Xu et al., 2013).
Further analysis of rice AP gene sequences confirmed that all AOX proteins belong to
the Ferritin-like protein superfamily with characteristic iron binding sites, while NDH
proteins were found to belong to the pyr-redox superfamily with NADP(H) binding
domains. Phylogenetic analysis revealed the separation of AOXs into four major
groups (type a, b, c and d) and NDHs into three major families, NDA, NDB and NDC.
Japonica and indica rice share very high similarity between AP protein sequences.
Dual targeting of NDH proteins has been reported in many plant species including
Arabidopsis, rice, grapes and potato (Carrie et al., 2008; Xu et al., 2013). It has been
experimentally shown that AtNDA1, AtNDA2 and AtNDB1 are dual targeted to
mitochondria and peroxisomes while AtNDC1 is dual targeted to mitochondria and
chloroplasts (Michalecka et al., 2003; Xu et al., 2013). In the current study, the
prediction of subcellular locations of identified NDH proteins from japonica and indica
rice revealed that some might be targeted to more than one organelle. The current
study demonstrated that NDA2, NDB1 and NDB2 from both rice sub-species were

Chapter 3
108
predicted to be dual targeted to mitochondria and peroxisomes, while NDC1 from both
rice sub-species was predicted to be dual targeted to mitochondria and chloroplasts.
Similar results were reported for dual targeting of NDH proteins from rice by Xu et al.
(2013) using GFP (Green Florescence Protein) fusion analysis. In Arabidopsis, both
NDA family members were targeted to peroxisomes in addition to mitochondria while
only one member from the NDB family (NDB1) was dual targeted to mitochondria and
peroxisomes (Xu et al., 2013). In contrast, in rice two NDB family members (NDB1 and
NDB2) were dual targeted to mitochondria and peroxisomes while only one member
from the NDA family (NDA2) dual targeted to mitochondria and peroxisomes. These
results are summarised in Figure 3.22.
Figure 3.22 Summary of the subcellular localization of NDH proteins in Arabidopsis, japonica and indica rice
In both rice groups, NDA2, NDB1 and NDB2 were dual targeted to mitochondria and
peroxisomes while NDC1 was dual targeted to mitochondria and chloroplast. In Arabidopsis,
NDA1, NDA2 and NDB1 were dual targeted to mitochondria and peroxisomes while NDC1 was
dual targeted to mitochondria and chloroplast (Xu et al., 2013). Chloroplasts-green,
Mitochondria-grey and Peroxisomes-blue.
The organization of genomic sequences and expression of AP genes has also been
found to be highly variable among plant species. In the present study, the exon-intron
organization of AOX and NDH genes from japonica and indica rice was studied and
compared with Arabidopsis AP genes to explore the polymorphisms between two rice
sub-species as well as between monocots and dicots. Plant AOXs have been

Chapter 3
109
extensively studied in terms of biochemistry as well as gene expression and regulation
under stress conditions. However, little information about gene structure especially for
NDHs is available. A structure of four exons interrupted by three introns has been
recognized as the conserved AOX gene structure in plants (Considine et al., 2002;
Polidoros et al., 2009). Although all four isoforms of Arabidopsis AOX1 shared a
conserved gene structure, polymorphisms were apparent in rice. The exon-intron
organization of AOX1a, AOX1c and AOX1d from japonica and indica rice have the
predominant exon-intron structure of four exons interrupted by three introns, but that
of AOX1b from both rice groups consisted of 3 exons separated by 2 introns. The
occurrence of an exon-intron gene structural polymorphism was reported in other plant
species also. For example, the exon-intron structure of AOX1a from potato (Solanum
tuberosum) consists of 3 exons interrupted by 2 introns (Polidoros et al., 2009) while
other isoforms shared the conserved gene structure for AOX. It is suggested that
variations in exon-intron organization have evolved through loss or gain of introns,
exon recombination, exon gain or deletion of fragments (Polidoros et al., 2009; Pu et
al., 2015). The possible responsible mechanism for the variation in rice AOX1b has
been suggested as loss of the second intron (Figure 3.23) (Considine et al., 2002).
Similarly, the possible mechanism for the variation in potato AOX1a gene structure
has been suggested as loss of the third intron (Figure 3.24) (Polidoros et al., 2009).
Figure 3.23 Loss of intron 2 from the conserved structure and evolution of exon-intron structure with 3 exons interrupted by 2 introns eg: rice AOX1b

Chapter 3
110
Figure 3.24 Loss of intron 3 from the conserved structure and evolution of exon-intron structure with 3 exons interrupted by 2 introns eg: potato AOX1a
As it was found that the exon-intron organization of rice AOX1b is different from
Arabidopsis, to check whether this is common in rice species, the gene structure of
AOX1b from 8 rice species (Table 3.1), including both cultivated and wild types, was
studied using the genomic data available on the Gramene database
(www.gramene.org). The results revealed that 3 exons separated by 2 introns was the
predominant form for AOX1b (Figure 3.25). In gene evolution studies, it would be very
useful to explore whether the 3 exons and 2 introns structure of AOX1b gene is limited
to rice species or a common feature in monocots. However, formation of the gene
structure of 3 exons divided by 2 introns through the loss of second intron has been
observed only in Poaceae members (O. sativa, Sorghum bicolor, Zea mays and
Panicum virgatum) (Pu et al., 2015). In this study, further investigation revealed that
there is a very high polymorphism in AOX1a gene structure among different rice
species. Although cultivated species shared the conserved structure for AOX1a, the
structure of AOX1a from all wild types consisted of 5-8 exons except O. punctata,
which had only two exons (Figure 3.19).

Chapter 3
111
Figure 3.25 Exon-intron structural organization of AOX1b gene in different rice species
Three exons separated by 2 introns found to be the predominant gene structure for AOX1b in rice. Out of 8 rice species investigated, 7 species share this structure
except O. rufipogen, which has 4 exons. Both japonica and indica rice groups share the predominant gene structure with 3 exons separated by 2 introns.

Chapter 3
112
Less is known about the biochemistry, and gene expression and regulation of plant
NDHs under stress conditions, especially in monocots. A study of exon-intron
organization of Arabidopsis NDHs has been reported (Michalecka et al., 2003) but no
work has been reported so far on rice NDHs except their dual targeting ability (Xu et
al., 2013). The current study focused on the structural polymorphism of rice NDHs as
well as their role under abiotic stress tolerance. The current bioinformatics analysis
revealed that exon-intron organization of NDA1 in japonica and indica rice is
completely different from that of rice NDA2 as well as from Arabidopsis NDA family
members. The rice NDA1 consists of 3 exons separated by 2 introns in contrast to
NDA2, which has 8 exons. A comparative study of exon-intron structure of NDA1 from
10 rice species, including japonica and indica rice (Table 3.1), using the data available
on Gramene database, confirmed that it was the predominant structure of NDA1
among rice species including wild rice. The majority of rice species (8 out of 10) shared
common exon-intron structure of 3 exons divided by 2 introns. Two species, O. barthii
and O. longistaminata consist of 4 exons divided by 3 introns (Figure 3.26). Although
it is hard to predict the exact evolutionary mechanism, there appears to have been a
reduction of the number of exons as well as introns. The presence of fewer exons and
introns in NDA1 appears to be specific to rice amongst the species studied to date and
it is worthwhile to explore whether this is a feature of all monocot species. A study of
NDA2 from 10 rice species demonstrated that 7 species carry 8 exons separated by 7
introns while the other 3 species have 9 or 10 exons. This suggests that 8 exons
separated by 7 introns is predominant in rice NDA2. All NDB family members from
japonica and indica rice share similar gene structure, which consisted of 10 exons
divided by 9 introns. A study of the NDB2 from 10 rice species showed that all except
two species, O. longistaminata and O. punctata share the common structure of 10
exons separated by 9 introns, suggesting this is the predominant in rice NDB family
members (Figure 3.20).

Chapter 3
113
Figure 3.26 Exon-intron structural organization of NDA1 gene in different rice species
Three exons separated by 2 introns found to be the predominant gene structure for NDA1 in rice. Out of 10 rice species investigated, 8 species share this structure
except O. barthii and O. longistaminata which share 4 exons separated by 3 introns. Both japonica and indica rice groups share the predominant gene structure with
3 exons separated by 2 introns.

Chapter 3
114
Potassium cyanide (KCN) and antimycin A (AA) are well-known inhibitors of the
traditional mitochondrial electron transport chain (mETC) (Moller, 2001). KCN inhibits
respiration through the cytochrome pathway by blocking a proton translocation site in
complex IV while AA inhibits complex III (Moller, 2001; Takumi et al., 2002;
Schwarzlander et al., 2009; Ma et al., 2011). Disruption of mETC activity by AA or
KCN can increase ROS production in plant cells leading to oxidative stress (Moller,
2001; Umbach et al., 2012). Changes in transcript levels of AP genes have been
reported from a variety of plant species treated with AA or KCN suggesting that AP
genes are responsive to oxidative stress created though inhibition of mETC activity
and play a role in controlling ROS in plant cells (Vanlerberghe and Mclntosh, 1996;
Karpova, 2002; Geisler et al., 2004; Umbach et al., 2012). In Arabidopsis cells, NDB2
and AOX1a are consistently up-regulated co-ordinately during oxidative stress (Clifton
et al., 2005). During the current study, rice seedlings were exposed to AA or KCN,
and changes in transcript levels in roots and shoots were studied using qRT-PCR.
Results showed that a number of rice AP genes were responsive to oxidative stress.
Although AOX1a and NDB2 appeared to be the most commonly stress-responsive,
AOX1b, NDA1, NDA2 as well as NDB3 also responded in some treatments. In
Arabidopsis, leaves sprayed with 10 µM AA specifically up-regulated the transcript
level of AOX1a but other AOX genes were unaffected (Saisho et al., 1997). Similarly,
in the current study, 20 µM AA treatment up-regulated the transcript abundance of
rice AOX1a in shoots but AOX1b or AOX1c were not affected. In contrast, there was
a significant increase of transcript level of all AOX isoforms tested in AA-treated roots.
This could be due to the fact that though the AA concentration tested was strong
enough to induce all three AOX isoforms in roots, it might not be strong enough to
induce AOX1b or AOX1c in shoots other than AOX1a reflecting the difference in
sensitivity to stresses between shoots and roots, and between the AOX isoforms
(Ohtsu et al., 2002). Alternatively, regulation of AOXs might be different in roots and

Chapter 3
115
shoots as it is suggested that multiple signalling pathways might be involved in the
induction of AOXs in plants (Thirkettle-Watts et al., 2003). In the present study, when
rice seedlings were treated with 5 mM KCN, the transcript abundance of AOX1a and
AOX1b increased dramatically in both shoots and roots while a slight reduction and
negligible changes were observed in AOX1c transcript levels in shoots and roots
respectively. Similarly, a rapid increase of AOX1a transcript level was also observed
when 5-day old rice seedlings were exposed to 100 µM sodium azide, an inhibitor of
cytochrome oxidase (Saika et al., 2002b). When wheat seedlings were exposed 3 mM
KCN, an increase of WAOX1a transcript abundance was observed but not WAOX1c
suggesting that two WAOX1 genes were transcriptionally controlled by two different
regulatory pathways (Takumi et al., 2002). It is likely that different regulatory pathways
to control gene expression at transcriptional level exist also in rice.
Compared to AOX, less work has been done on NDHs. No study has been reported
so far on the expression pattern of rice NDH genes under abiotic stress conditions.
The current chapter focused on identifying stress-responsive rice NDH genes by
exposing seedlings to AA or KCN treatments. A change of transcript abundance was
observed in number of rice NDH genes in both shoots and roots suggesting that NDHs
are also responsive to oxidative stress along with AOXs. It was clear that tissue type
as well as type of treatment affected gene induction. The induction magnitude of some
NDH genes (NDA1 and NDB3) were very high in KCN treated shoots as well as in
roots compared to AA treated tissues. AOX1a and NDB2 appeared to be co-
expressed in AA treated shoots while transcript abundance of all five genes; AOX1a,
AOX1b, NDA1, NDB2 and NDB3 were observed in KCN-treated shoots. Although the
expression magnitude was lower, the number of co-expressed NDH genes and AOX
was higher in AA treated roots compared to KCN treated roots.

Chapter 3
116
Overall, the transcriptional analysis of rice alternative respiratory pathway genes
under oxidative stress revealed that a number of genes are stress-responsive.
However, AOX1a and NDB2 appeared to be most consistently responsive. Transcript
level responses are important in identifying the molecular mechanisms underlying
signalling and for understanding the role and regulation of the gene in cellular
responses (Van Aken et al., 2009). The regulatory regions of genes, generally known
as promoters, are the key players of any signalling pathway for induction of gene(s)
at the transcriptional level (Ho et al., 2008). Cis-acting regulatory elements (CAREs),
which are located on the promoter region, play a role in regulating the expression of
mitochondrial-encoded genes under stress conditions (Ho et al., 2008). To gain a
better understanding of induction of rice AP genes under oxidative stress, promoter
regions of AP genes were searched for the presence of functional elements. AOX1a
and NDB2 genes have been initially selected to identify sequence elements
responsible for the regulating stress response as they appeared to be highly
responsive when mETC was chemically inhibited. Also, it is reported that AOX1a and
NDB2 in Arabidopsis are likely co-regulated by sharing common CAREs in the
promoter region (Ho et al., 2008). Functional analysis of the AtAOX1a promoter region
revealed the presence of 10 CAREs and six of them were also found to be functional
in AtNDB2 (Ho et al., 2008). In rice, although there was a difference in magnitude,
AOX1a and NDB2 showed similar patterns of transcript abundance under tested
conditions in both roots and shoots. Subsequent analyses of promoters of other co-
induced rice AP genes also revealed the sharing of similar CAREs as AOX1a and
NDB2.

Chapter 3
117
The regulation of AOX gene expression generally appears to involve the same signal
pathways in different plant species (Thirkettle-Watts et al., 2003) and it was found that
AOX gene paralogs which showed similar expression pattern in soybean and
Arabidopsis shared common regulatory motifs (Thirkettle-Watts et al., 2003).
Therefore, it is worthwhile to investigate whether the promoter regions of rice AOX
also share the same regulatory motifs that are responsible for signalling during stress
conditions as in other plant species and to see whether there is a co-regulation of rice
AOX1a and NDB2 by sharing common CAREs. As a start, promoter regions of AOX1a
and NDB2 genes from japonica and indica rice were analysed and the results
revealed that most of the functional CAREs present in the promoter of Arabidopsis
AOX1a were also present in rice. As in Arabidopsis, six of the functional elements
were also found to be present in the upstream region of rice NDB2 suggesting that
these co-induced genes share common regulatory motifs. Not only NDB2, but there
were some other rice AP genes co-induced with AOX1a or other AOX isoforms under
oxidative stress created via disrupting the function of mETC. Therefore, the presence
of functional elements in other co-induced genes were also investigated and results
revealed the presence of functional elements similar to Arabidopsis, further confirming
the sharing of common regulatory elements in co-induced genes under stress
conditions. However, it is yet to be confirmed whether these CAREs are functional in
rice. The use of information on promoter activity together with transcript analysis and
mutants is important in understanding the underlying regulatory mechanisms in gene
expression under stress conditions (Ho et al., 2008). Therefore, functional analysis of
cis-regulatory elements present in upstream regions of rice AP genes would be a vital
achievement for understanding of regulatory mechanisms of rice AP gene expression
under environmental stresses.

Chapter 4
118
4 Expression of rice alternative respiratory pathway genes under salt stress
4.1 Introduction
High salt concentrations in plant cells result in an excessive production of ROS, such
as O2-, .OH and H2O2 etc., by impairment of electron transport within different
subcellular organelles such as chloroplasts and mitochondria (Sharma et al., 2012). It
is a well-established fact that plants use several enzymatic and non-enzymatic
antioxidants to scavenge ROS induced during environmental stress conditions.
Evidence suggests that alternative respiratory pathway genes, AOXs along with
NDHs, play a regulatory role in plant abiotic stress tolerance through maintaining ROS
at non deleterious level within the mitochondrion (Vanlerberghe, 2013).
Most stressful conditions, including drought (Bartoli et al., 2005; Feng et al., 2009), low
temperature (Ito et al., 1997; Mizuno et al., 2008), high salt (Ferreira et al., 2008; Smith
et al., 2009; Feng et al., 2010b; Feng et al., 2013), and heavy metal toxicity
(Panda et al., 2013; Wang et al., 2013), increase AOX transcript abundance, AOX
protein and the capacity of alternative respiratory pathway. Increases in AOX (AOX1a
and AOX1b) transcript abundance as well capacity of AOX respiration were observed
in rice leaves when rice seedlings were exposed to 300 mM NaCl (Feng et al., 2010b).
This study further revealed that the induction of AOXs in tissues treated with high salt
(300 mM) was more intense compared to tissues treated with low salt concentrations
(150 mM), suggesting that AOX response is dependent on the intensity of the stress.
Similarly, enhancement of cyanide-resistant respiration and an increase in AOX
transcript levels were observed in rice roots treated with 200 mM or 300 mM NaCl for
12 h (Feng et al., 2013). Similarly, induction of rice AOX isoforms, especially AOX1a
and AOX1b, were reported when seedlings were treated with 300 mM NaCl
(Li et al., 2013a) and 250 mM NaCl (Ohtsu et al., 2002).

Chapter 4
119
Although the AOX has received considerable attention from researchers, less attention
has been given to the alternative dehydrogenases. There is no published work so far
on responses of rice non-energy conserving alternative dehydrogenases under
environmental stress conditions. The previous chapter on bioinformatics revealed that
there are 6 NDHs in rice along with four isoforms of AOXs. Further characterization of
these demonstrated that transcript levels of rice NDHs as well as AOXs were up-
regulated when the cytochrome pathway was chemically inhibited. This suggests that
a number of rice alternative dehydrogenases are also stress-responsive and co-
expressed with AOXs when plants are under stress. The current chapter describes the
characterization of rice alternative pathway components, AOXs and NDHs, under
salinity stress. A comparative study was carried out to explore the diversity in
physiological and gene expression responses of rice seedlings from two different rice
cultivars; Nipponbare (japonica rice) and Langi (indica rice) grown under high salinity.
Rice seedlings grown on hydroponic cultures were exposed to salt stress in their early
vegetative stage and cultivar differences in physiological responses and in expression
of alternative pathway genes in shoots and roots were investigated. The study was
extended to investigate the correlation of changes in transcript abundance with the
changes in corresponding protein level and enzyme activity in shoot and root tissues
in response to salinity stress using cultivar Nipponbare.
4.2 Materials and methods
4.2.1 Plant material and growth conditions
Experiments were conducted at the Plant Accelerator, Waite Campus, University of
Adelaide, Australia from March to April 2013 under the growth conditions described in
Section 2.1.1. Cultivar Nipponbare (japonica rice) was selected for the study and
cultivar Langi (indica rice) was used for a comparison in salt screening and gene
expression analysis.

Chapter 4
120
4.2.2 Screening for salt-tolerance
The salt screening experiment was performed using a hydroponic system established
as described in Section 2.1.3. Seedlings grown hydroponically for 3 weeks (~4 weeks
old seedlings) were exposed to 120 mM NaCl added in two increments (50 mM NaCl
+ 0.75 mM CaCl2 and 70 mM NaCl + 1.0 mM CaCl2). The second salt addition was
made two days after the first. CaCl2 was added to the nutrient medium to maintain a
constant Ca2+ activity of 1 mM throughout the experiment.
4.2.3 Measurement of biomass and tissue ion concentrations
Shoots and roots were harvested 10 days after the salt application for biomass
measurements and for tissue ion analysis. FW, DW and Na+ and K+ concentrations of
shoots and roots were measured as described in Section 2.1.4. The growth responses
to salinity was shown by ‘relative growth in dry weight’, which is the growth in dry
weight of the NaCl-treated seedlings relative to that in the control (%). Five biological
replicates were used from each treatment; salt-treated and control.
4.2.4 Analysis of transcript abundance
Fresh shoot and root samples were harvested at predetermined time points (1, 2, 6,
12 days after salt application) for RNA extraction. Samples were snap frozen in liquid
N2 and stored at -80oC until further use. Three biological replicates were collected from
salt-treated and from non-treated plants at each time point. RNA extraction and cDNA
synthesis were performed as described in Sections 2.2.1.1 and 2.2.4 respectively.
Transcript abundance of genes was investigated using qRT-PCR as described in
Section 2.3.4. For accurate quantification of gene expression data, it is essential to
normalize qRT-PCR data to a fixed reference; one that is not affected by the
experimental conditions. Therefore, qRT-PCR data obtained were normalized to the
geometric mean expression of three stable reference genes, OsElF1, OsPplase and
OsActin, selected out of a set of 6 as described in Section 3.3.10 to remove systematic
variation in experiments which affects the measured gene expression levels.

Chapter 4
121
4.2.5 Analysis of relative abundance of proteins in isolated mitochondria
The abundance of AOX and NDB2 proteins were estimated in mitochondria purified
from salt-treated and non-treated shoot and root tissues of Nipponbare, using the
Western blot technique. Separation of proteins using SDS-PAGE, electro-blotting onto
a nitrocellulose membrane, probing with primary antibody and visualization of immuno-
reactive peptides were carried out as described in Sections 2.4.6.
The abundance of AOX protein in salt-treated and non-treated tissues was estimated
by immunoblotting purified mitochondrial proteins with monoclonal AOA antibody, with
the peptide recognition sequence of RADEAHHRDVNH (Finnegan et al., 1999),
against AOX. Electro-blotted membranes were incubated with the AOA primary
antibody (1:10000) as described in Section 2.4.6.5 followed by rabbit anti-mouse IgG
horseradish peroxidase conjugated secondary antibody (Rockland Immunochemicals
Inc.) (1:10000) and visualized by chemiluminescence. The abundance of NDB2
protein was estimated by using the polyclonal antibody, developed during the current
study, with the peptide recognition sequence of CQDNQVLQINDGTGKKR. Separated
mitochondrial proteins were electro-botted on to nitrocellulose membrane and probed
with OsNDB2 primary antibody (1:8000) as described in Section 2.4.6.5 followed by
Goat anti-rabbit IgG horseradish peroxidase conjugated secondary antibody (1:10000)
(Rockland Immunochemicals Inc.), and visualized by chemiluminescence. Protein
loading was determined either by re-probing the same membrane or duplicate
membrane with the monoclonal antibody porin (1:10000) (loading control).
4.2.6 Enzyme activity assays in isolated mitochondria
Relative changes in AOX and Ca2+ dependent and Ca2+ independent alternative
dehydrogenase enzyme activities were estimated in salt-treated and non-treated shoot
and root tissues using purified mitochondria as described in Section 2.4.2.

Chapter 4
122
4.3 Results
4.3.1 Physiological responses of two rice cultivars under salinity stress
Salt affected seedlings showed obvious reduction in plant size compared to their
controls and displayed leaf tip burning and some necrosis. There was a significant
reduction of dry biomass production in both shoots and roots in response to elevated
salt in Langi compared to respective controls. However, roots of Nipponbare showed
non-significant reduction of biomass in response to salinity (Figure 4.1A). It is
interesting to note that there was a tissue specific nature of Na+ accumulation in the
two cultivars. The Na+ concentration in shoots was higher compared to roots in both
cultivars (Figure 4.2A) and Nipponbare accumulated more Na+ in shoots than did
Langi. In contrast, the ratio of Na+/K+ was higher in the roots of both cultivars, indicating
that roots accumulated less K+ compared to shoots (Figure 4.2B). A comparatively
higher shoot Na+/K+ ratio was recorded in Nipponbare while that in roots was lower,
compared to Langi (Figure 4.2B).
Despite higher Na+ accumulation and higher Na+/K+ ratios, Nipponbare had a
significantly higher relative dry shoot biomass production compared to that of Langi
(75.73% and 47.75% respectively: Figure 4.1B). Nipponbare also had higher relative
root growth (56.75% and 44.33% respectively). This indicates that Nipponbare is
capable of tolerating more Na+ compared to Langi.

Chapter 4
123
Figure 4.1 Comparative growth analysis for assessing relative salinity tolerance in seedlings of two rice cultivars, Nipponbare and Langi
Four weeks old seedlings grown on hydroponic culture system were exposed to 50 mM NaCl
stress for 2 days followed by 120 mM NaCl for further 8 days and growth was assessed in term
of fresh and dry biomass production. Data were compared as absolute dry weight (A) and
relative dry weight (B) in shoot and root tissues of two cultivars. Values are shown as mean +
SEM (n=5). *, ** and **** represent the statistical significant difference at P<0.01, P<0.001 and
P<0.00001 according to t-test, respectively. Relative growth in dry weight: the growth in dry
weight of the NaCl-treated shoots or roots relative to that in the control.
(A)
(B)

Chapter 4
124
Figure 4.2 Comparative analysis of tissue ion accumulation for assessing relative salinity tolerance in seedlings of two rice cultivars, Nipponbare and Langi
Four weeks old seedlings grown on hydroponic culture system were exposed to 50 mM NaCl
stress for 2 days followed by 120 mM NaCl for further 8 days and Na+ and K+ accumulation in
tissues were measured using Flame photometer. Accumulation of Na+ (A) and ratio of Na+/K+
(B) in tissues were compared. Data are shown as mean + SEM from five biological replicates.

Chapter 4
125
4.3.2 Alteration of transcript abundance of alternative respiratory pathway genes in response to salinity stress
Results presented in Chapter 3 demonstrated that both AOX and NDH genes were
stress-responsive with AOX1a and NDB2 the most responsive to the direct inhibition
of cytochrome pathway by antimycin A and KCN. Here, I examine the responsiveness
of rice AOXs and NDHs in response to the environmental stress of salinity, widening
the study to the expression of AP genes in different cultivars. Expression of three AOX
isoforms (AOX1a, AOX1b and AOX1c) and six NDHs (NDA1-2, NDB1-3, and NDC1)
in root and shoot tissues from cultivars Nipponbare and Langi were measured using
qRT-PCR.
Transcript abundance of AOX1a and AOX1b from both cultivars increased in shoots
and decreased in the roots in response to salinity stress (Figures 4.3A and B).
However, the magnitude of responses differed between cultivars. There was a
significant reduction of transcript levels of all three AOX isoforms in salt-treated
Nipponbare roots over 12 day period, but in Langi roots, only AOX1a and AOX1b
decreased. Both cultivars recorded their highest AOX1c transcript abundance 12 days
after the salt application (Figure 4.3C). In general, in both cultivars, AOX transcripts
increased in shoots and decreased in roots in response to salinity.

Chapter 4
126
Figure 4.3 Comparative study of expression of AOX isoforms in two rice cultivars, Nipponbare and Langi, under salt-treated and non-treated conditions
Fold change expression of AOX isoforms, AOX1a (A), AOX1b (B) and AOX1c (C), in seedling
tissues were analysed in response to 120 mM NaCl using qRT-PCR over a period of 12 days.
Transcript levels in salt-treated or in control tissues were determined at 1, 2, 6 and 12 day(s)
after the start of salt application and normalized against the geometric mean of three stable
reference genes. Data are shown as the mean + SEM of three biological replicates relative to
the control at each time point set as 1.00. * indicates a significant difference at p<0.01
according to t-test.
(A)
(B)
(C)

Chapter 4
127
The most dramatic change in transcript abundance in response to salinity was of NDB1
in Nipponbare-roots, with the highest abundance of (7.4-fold) at day 2. The response
of NDB3 transcripts in Nipponbare-roots was similar to that of NDB1 except that NDB3
responded to salt stress earlier (Figures 4.4A and C). NDB2 transcript abundance
increased significantly only in Nipponbare-shoots, 12 days after the salt treatment
(Figure 4.4B). NDB3 transcript abundance increased in Langi-shoots and Nipponbare-
shoots, several days after salt treatment. These results clearly indicate the diversity of
expression of NDB isoforms in rice in response to salinity stress.
Transcript abundance of NDA1 increased in shoots and decreased in roots of
Nipponbare several days after salt treatment. NDA1 transcript abundance decreased
somewhat in roots of Langi (Figure 4.5A). In Langi, in contrast to NDA1, NDA2
transcript level increased in shoots, peaking at day 6, while that in roots decreased
initially and then levelled (Figure 4.5B). A significantly higher abundance of root NDC1
was recorded in Langi at day 6 while, in shoots, it peaked at day 12. In Nipponbare,
the transcript abundance of NDC1 peaked at 12 days after the salt application in both
roots and shoots (Figure 4.5C). Overall, these results show that rice alternative
respiratory pathway genes are responsive to salinity stress but responses varied with
cultivar as well as with tissue type.
It has been reported that the changes in the alternative pathway gene transcript
abundance under environmental stress conditions correlates with the changes in the
corresponding protein abundance and enzyme activity in plant tissues (Smith et al.,
2009; Wang et al., 2011). With the aim of investigating the potential correlation of
transcriptional level changes and corresponding protein levels and enzyme activity in
response to salinity stress, the current study was extended with relevant experiments
continued with cultivar Nipponbare.

Chapter 4
128
Figure 4.4 Comparative study of expression of NDB isoforms in two rice cultivars, Nipponbare and Langi, under salt-treated and non-treated conditions
Fold change expression of NDB isoforms, NDB1 (A), NDB2 (B) and NDB3 (C), in seedling
tissues were analysed in response to 120 mM NaCl using qRT-PCR over a period of 12 days.
Transcript levels were determined in salt-treated or in control tissues at 1, 2, 6 and 12 day(s)
after the start of salt application and normalized against the geometric mean of three stable
reference genes. Data are shown as the mean + SEM of three biological replicates relative to
the control at each time point set as 1.00. * indicates a significant difference at p<0.01
according to t-test.
(A)
(B)
(C)

Chapter 4
129
Figure 4.5 Comparative study of expression of NDA and NDC isoforms in two rice cultivars, Nipponbare and Langi, under salt-treated and non-treated conditions
Fold change expression of NDA isoforms, NDA1 (A), NDA2 (B), and NDC1 (C), in seedling
tissues were analysed in response to 120 mM NaCl using qRT-PCR over a period of 12 days.
Transcript levels were determined in salt-treated or in control tissues at 1, 2, 6 and 12 day(s)
after the start of salt application and normalized against the geometric mean of three stable
reference genes. Data are shown as the mean + SEM of three biological replicates relative to
the control at each time point set as 1.00. * indicates a significant difference at p<0.01
according to t-test.
(A)
(B)
(C)

Chapter 4
130
4.3.3 Protein levels of alternative respiratory pathway in response to salinity stress
Using an immunoblotting strategy, the relative abundance of AOX proteins as well as
NDB2 protein were investigated in mitochondrial preparations isolated from salt-
stressed and non-stressed root and shoot tissues of cultivar Nipponbare.
4.3.3.1 Changes in AOX protein abundance
The abundance of AOX protein was estimated by immunoblotting mitochondrial
proteins with a monoclonal antibody (AOA) raised against AOX from the aroid lily
(Sauromatum guttatum), which can recognize AOX subunits in a variety of plant
species (Elthon et al., 1989; Finnegan et al., 1999). It has been documented that AOX
protein is present as a homodimer and capable of existing in either an oxidized or
reduced form. When participating monomeric subunits in the dimer are covalently
linked by an intermolecular disulphide bond, the protein is inactive (oxidized form).
The reduction of this disulphide bond to its component sulfhydryl converts it to a form
that can be activated by keto-acids such as pyruvate (Umbach and Siedow, 1993;
Siedow and Umbach, 2000). These forms of AOX can be interconverted by the
treatment with reductants such as dithiothreitol (DTT) or diamide and visualized on a
membrane where the oxidized form has a molecular mass twice that of the reduced
form (Umbach and Siedow, 1993).
Consistent with previous findings, both oxidized and reduced forms of the AOX protein
were detected in mitochondrial proteins isolated from rice roots as well as from shoots
(Figures 4.6B and 4.7). The oxidized form of the protein was detected close to the
75 KD band of the molecular weight marker while the reduced form was detected
close to the 37 KD band, which is the calculated molecular weight of rice AOX proteins
based on their peptide sequences. When protein samples from roots were treated
with reducing agents (DTT), only the reduced form of the protein was detected on the
membrane (Figure 4.6A).

Chapter 4
131
Figure 4.6 Detection of rice AOX protein in mitochondria isolated from salt-treated and control roots by the monoclonal AOA antibody
Immunoblots of the AOX protein present in mitochondria isolated from salt-treated and
non-treated (control) roots harvested 9 days after the start of salt application. (A)-samples
treated with reductant (DTT) and (B) samples not treated with reductants. Pre-stained markers
were imaged with white light and aligned with chemiluminescent images to determine
molecular weights of bands. Duplicate blots were prepared, probed with porin antibody and
visualized by chemiluminescence to indicate the equal loading of samples. KD-kilodaltons.

Chapter 4
132
Figure 4.7 Detection of rice AOX protein in mitochondria isolated from salt-treated and control shoots by the monoclonal AOA antibody
An immunoblot of the AOX protein present in mitochondria isolated from salt-treated and
non-treated (control) shoots harvested 9 days after the star of salt application Pre-stained
markers were imaged with white light and aligned with chemiluminescent images to determine
molecular weights of bands. Duplicate blots were prepared, probed with porin antibody and
visualized by chemiluminescence to indicate the equal loading of samples. KD-kilodaltons.
While transcript abundance of AOX genes tended to increase in shoots of Nipponbare
under salt stress (Figure 4.8), total protein abundance of AOX (using an antibody that
does not distinguish between AOX isoforms) was approximately the same in
mitochondria isolated from control and salt-treated plants (Figures 4.6B and 4.7).
However, in mitochondria from salt-stressed plants, AOX protein was predominately
in the reduced (active) form while in mitochondria from control plants it was largely in
the oxidised (inactive) form (Figures 4.6B and 4.7). This suggests that post-
translational regulation of AOX may be more important for that protein per se in rice.

Chapter 4
133
Figure 4.8 Transcript abundance of AOX isoforms in salt-treated and non-treated roots and shoots of cv Nipponbare over a period of 15 days
Seedlings (cv Nipponbare) grown on hydroponic cultures were exposed to 120 mM NaCl and
transcript levels were determined in salt-treated or control tissues 6, 9, 12 and 15 days after
the start of salt application. Transcript data were normalized against the geometric mean of
three reference genes. Data are shown as the mean relative gene expression ± SEM of three
biological replicates. Tissues for qRT-PCR and protein assay were sampled from the same
experiment.

Chapter 4
134
4.3.3.2 Changes in NDB2 protein abundance
The abundance of NDB2 protein in salt-treated and control tissues was also
investigated by immunoblotting with mitochondria isolated from salt-treated and non-
treated tissues harvested 9 days after the start of salt application. Affinity purified
polyclonal antibodies were synthesized against NDB2 peptide (Biomatik,
http://www.biomatik.com) and the concentration of NDB2 specific antibody was
titrated against dilutions of unconjugated peptide antigen by dot blot analysis to
determine the antibody dilution suitable for use in immunoblotting (not shown). Before
being tested with experimental samples, NDB2 specific antibodies were tested with
purified mitochondria isolated from etiolated rice seedlings. Immunoblots of
mitochondria from etiolated rice seedlings produced a sharp band at around the
predicted molecular weight of rice NDB2 (~64 KD). (Image of the pre-stained protein
marker run parallel to samples was aligned with the blot to estimate the size of the
band) (Figure 4.9).
Figure 4.9 Detection of NDB2 protein in seedling mitochondria
Immunoblot image showing the detection of the peptide recognition sequence of NDB2 protein
in purified mitochondria isolated form etiolated rice seedlings, by the polyclonal antibody
developed during the current study. The blot shows probing of three technical replicates of the
sample with 1:10000 dilution of antibody.

Chapter 4
135
Using the antibody tested above, immunoblots showed that NDB2 protein abundance
in mitochondria isolated from salt-treated shoots was higher than that in mitochondria
from control shoots (Figure 4.10). It is interesting to note that no bands were detected
in mitochondria from the roots of either set of plants, even though porin controls
showed that the loading of mitochondrial protein was equivalent to that of shoot
mitochondria (Figure 4.10) and transcript abundance in both shoots and roots was
very similar at 9 days after treatment (Figure 4.11). This was unexpected and a
second experiment also showed the same results. However, qRT-PCR analysis
showed that transcript abundance in roots did not increase in salt-treated plants until
12 days after treatment, in contrast to the situation in shoots, where NDB2 transcripts
were higher in stressed plants from the beginning of the treatment (Figure 4.11).
Further investigation is needed to determine why NDB2 protein is so low in root
mitochondria, but the results suggest that post-translational events may be different
between roots and shoots.

Chapter 4
136
Figure 4.10 Detection of rice NDB2 protein in mitochondria isolated from salt-treated and control shoots by the polyclonal NDB2 antibody developed during the current study
An immunoblot of the NDB2 protein present in mitochondria isolated from salt-treated and
control shoots harvested 9 days after the start of salt application. Pre-stained markers were
imaged with white light and aligned with chemiluminescent images to determine molecular
weights of bands. Duplicate blots were prepared, probed with porin antibody and visualized
by chemiluminescence to indicate the equal loading of samples. KD – kilodaltons.
CR-control roots; TR-treated roots; CS-control shoots; TS-treated shoots

Chapter 4
137
Figure 4.11 Transcript abundance of NDB2 in salt-treated and non-treated roots and shoots from cv Nipponbare over a period of 15 days
Seedlings (cv Nipponbare) grown on hydroponic cultures were exposed to 120 mM NaCl and
transcript levels were determined in salt-treated or control tissues 6, 9, 12 and 15 days after
the start of salt application. Transcript data were normalized against the geometric mean of
three reference genes. Data are shown as the mean relative gene expression ± SEM of three
biological replicates. Tissues for qRT-PCR and protein assay were sampled from the same
experiment.

Chapter 4
138
4.3.4 Alternative respiratory pathway enzyme activity in response to salinity stress
The same mitochondria preparations used in the immunoblot analysis were used in
enzyme activity assays immediately after the purification of mitochondria. Oxygen
uptake rates were used to determine cytochrome pathway, AOX, Ca2+ dependent and
Ca2+ independent external NAD(P)H dehydrogenase activities in a Clark-type oxygen
electrode.
4.3.4.1 Changes in oxygen consumption rates across cytochrome and AOX pathway in response to salinity stress
Figure 4.12 Average oxygen consumption rates for mitochondria isolated from salt-treated and non-treated shoot and root tissues
Oxygen consumption rates across cytochrome and AOX pathway were determined for mitochondria isolated from salt-treated and non-treated shoot and root tissues using a Clark-type oxygen electrode. Data are shown as average oxygen uptake rates (nmol O2/min/mg mitochondrial protein) from two independent experiments. Total oxygen consumption rate was measured in the presence of 10 mM succinate, 5 mM pyruvate, 1 mM NADH, 1mM ATP, 1 mM ADP, 5 mM DTT in final concentrations. The cyanide resistant and the residual oxygen consumption rates were determined in the presence of 1 mM KCN and 250 nM OG (Octyl Gallate) in final concentrations, respectively. CR-control root; TR-treated root; CS-control shoot; TS-treated shoot.
When comparing the inhibitory effect of high salinity on seedling respiration,
cytochrome pathway and cyanide resistant (AOX) pathway showed different
sensitivities (Figure 4.12). AOX pathway showed an increased activity in both root
and shoot tissues compared to their controls. But, though there was a slight increase
in activity of cytochrome pathway in roots, it was definitely reduced in shoots

Chapter 4
139
(Figure 4.12). Overall, there was a slight increase of total respiration in roots in
response to salinity level tested while it was reduced significantly in shoots (P<0.03).
It is also worthwhile to note that the increased activity of AOX enzyme in response to
salinity stress in shoots corresponded to responses detected at the protein level as
well as the transcriptional level. However, in roots, transcript levels did not correlate
with protein and activity measurements.
4.3.4.2 Changes in NAD(P)H oxidation in response to salinity stress
Figure 4.13 NAD(P)H oxidation in mitochondria isolated from salt-treated and non-treated root and shoot tissues
Oxygen consumption rates were determined for mitochondria isolated from salt-treated and
non-treated root and shoot tissues using a Clark-type oxygen electrode. NADPH and NADH
oxidation were determined in the presence and absence of Ca2+. Data are shown as average
oxygen uptake rates (nmol O2/min/mg mitochondrial protein) from two independent
experiments. CR-control root; TR-treated root; CS-control shoot; TS-treated shoot.
Both Ca2+ dependent and Ca2+ independent NADPH oxidation were increased in salt-
treated roots compared to their controls while those in salt-treated shoots were
reduced in response to salinity stress (Figure 4.13). For NADH oxidation, the Ca2+
dependent NADH oxidation in roots was induced while Ca2+ independent NADH
oxidation was inhibited by the high salinity compared to their controls. There was only
a slight reduction of both Ca2+ dependent and independent NADH oxidation in shoots
in response to salinity stress (Figure 4.13).

Chapter 4
140
4.4 Discussion
A number of previous studies have documented the induction of AOXs in rice under
environmental stresses, such as low temperature (Ito et al., 1997) and high salt (Ohtsu
et al., 2002; Feng et al., 2010b; Feng et al., 2013). However, no work has been
reported so far on the responses of rice NDHs under environmental stresses. Here, a
comparative study of transcriptional level responses of alternative respiratory pathway
genes, AOXs and NDHs, has been undertaken in two contrasting rice cultivars under
salinity stress and extended investigation of the alteration of AP genes at protein and
enzyme activity level in response to salinity stress.
Consistent with previously documented studies, a significant growth reduction in salt-
treated seedlings from both cultivars compared to their controls was observed,
showing that the seedlings were stressed. Shoots from Nipponbare store more Na+
than Langi, while roots from both cultivars accumulated less Na+ compared to shoots.
Interestingly, the ratio of Na+/K+ in roots was higher than that of shoots in both cultivars
suggesting the capability of acquiring K+ was higher in shoots compared to that of
roots. However, Nipponbare showed a higher relative growth in both shoots and roots
compared to Langi under the tested salinity stress, suggesting that Nipponbare was
more capable of withstanding salt stress. These results demonstrated that there is a
cultivar specific variability in salinity tolerance responses in rice. The genetic variation
that exists among cultivars can be used to identify the underlying mechanisms and
molecular components that create cultivar-specific responses to salinity stress
(Kavitha et al., 2012).
The study of expression of AP genes in the two contrasting rice cultivars
demonstrated that some genes were up-regulated while others were down-regulated
in response to salinity stress. It is also interesting to note that though expression
patterns of alternative dehydrogenases varied substantially between the two cultivars,
the expression of AOXs, especially AOX1a and AOX1b, showed a very similar

Chapter 4
141
expression pattern in different tissue types from the two cultivars, with a gradual
increase of transcript abundance in shoots and a gradual decrease of transcript
abundance in roots (Figure 4.3). The current results with shoots are coincident with
those of Ohtsu et al. (2002) and Feng et al. (2010b). With roots, Feng et al. (2013)
reported an increase of transcript abundance of AOX1a and AOX1b when roots were
exposed to 200 mM and 300 mM salt stress for 12 h. On the other hand, Ohtsu et al.
(2002) reported that there was greater transcript abundance of AOX1a and AOX1b in
roots 6 h after the treatment with 250 mM salt, which then decreased gradually, similar
to my results. During the current study, assessment of transcript levels was started a
day after the salt treatment and a gradual decrease of transcript abundance in AOX
isoforms was observed throughout the testing period showing a similar trend as
observed by Ohtsu et al. (2002) in the expression of AOX isoforms in salt-stressed
rice roots. An analysis of microarray data on “Genevestigator” database
(https://genevestigator.com/) further confirmed the consistency of presented results
on transcriptional level expression of AOX isoforms in rice shoots and roots in
response to salinity stress (Figure 4.14).
The microarray data from Genevestigator database clearly demonstrate the tissue-
specific nature of AOX1 expression in rice in response to salinity stress and the
patterns of AOX1a and AOX1b genes in different tissue types from different cultivars
are consistent with my observations. In particular, there was a reduction of AOX1a
and AOX1b transcriptional abundance in roots from the cultivars Pokkali, IR63731,
IR29 and FL478, which were assessed 8 days after the salt application (Figure 4.14).
Collectively, all of these findings suggest that there was an immediate increase of
AOX1a and AOX1b at the transcriptional level in roots in response to salinity stress
followed by a decrease. Overall, while increases in transcript abundance of the
different AOX genes were seen at various times in shoots and roots, there were not
significant differences between the salt-sensitive and salt-tolerant rice cultivars.

Chapter 4
142
Figure 4.14 Transcriptional level expression of AOX isoforms in different rice cultivars in response to salinity stress (extracted from Genevestigator database) Data illustrate the fold-change expression of AOX1a, AOX1b and AOX1c in salt-treated tissues compared to their controls in different rice cultivars. Data clearly
demonstrate the tissue-specific nature of gene expression and the similar expression pattern of AOX1a and AOX1b in different tissue types (whole seedlings, roots
and growing point/crown tissue) from different cultivars. Comparatively AOX1c is less responsive to the salt stress. Different experimental conditions were applied to
different rice cultivars. The cultivars Pokkali, IR63731, IR29 and FL478 were subjected to ~60 mM salt for 8 days and roots and crown tissues were used for the
transcriptional analysis. The cultivar IR64 and RIL lines were subjected to 200 mM salt for 3 h and 150 mM salt for 24 h respectively and whole seedling was used for
the transcriptional analysis (https://genevestigator.com/).

Chapter 4
143
AOX was also followed at the protein level in Nipponbare. Measurements of AOX
protein levels showed that while they were similar in total between control and
stressed plants, the latter had much more of the protein in its reduced (monomer)
active form. Activity assays were consistent with this. It therefore seems that AOX is
regulated at both the transcriptional and post-translational levels in rice.
There are a number of documented studies on changes in rice AOXs at enzyme
activity level measured using slices of leaf or root tissues. These studies reported that
the capacity of AOX respiration was significantly increased in leaves when seedlings
were treated with 300 mM salt for 24 h without significant changes to the total
respiration compared to their controls (Feng et al., 2010b). Feng et al. (2013) also
observed a significant increase of CN-resistant/AOX respiration and significant
decrease in the total respiration in response to 200 mM salt. They further observed
that increase of salt concentration up to 300 mM further decrease the level of total
respiration but CN-resistant respiration did not show any significant changes
compared to the control. Although the observations made during the present study on
CN-resistant respiration is consistent with the documented results, contrasting
observations were made on the changes of total respiration in response to salinity
stress. The present data demonstrated that there was a slight increase of total
respiration rate in mitochondria isolated from salt-treated roots while the total
respiration rate in salt-treated shoots was reduced dramatically due to the reduction
of cytochrome respiration rate (Figure 4.12). Similar observations on the responses
of total respiration and cytochrome respiration were made by Jolivet et al. (1990) in
mitochondria isolated from salt-treated (400 mM for 72 h) barley leaves compared to
their controls, but AOX respiratory rates remained unchanged. The same authors
further reported that leaf slices also showed the same responses in total respiration
and cytochrome respiration but there was an increase of AOX respiration.
Collectively, it can be concluded that there is an induction of AOXs in rice at
transcriptional and enzyme activity levels in both shoot and root tissues in response

Chapter 4
144
to salinity stress, but the latter seems to be due to post-translational regulation via
protein oxidation.
Co-expression of AOXs and NDHs has been reported in a number of plant species
under abiotic stresses (Clifton et al., 2005; Smith et al., 2009), which could be a result
of co-regulation of these genes by common sequence elements present in the up-
stream promoter regions (Clifton et al., 2005; Ho et al., 2008). Co-expression of
number of rice NDHs have been observed during the current study when the
cytochrome pathway was inhibited either by AA or KCN (Chapter 3). Data from
Chapter 3 further revealed that up-stream promoter regions of these co-expressed
genes share common sequence elements that have been identified as regulatory
elements responsible for the stress tolerance in Arabidopsis AtAOX1a and AtNDB2,
suggesting that these co-expressed genes could be co-regulated under chemical
stress. Verification of this is required through functional analysis of the promoter
region of the respective genes. To confirm whether NDHs are co-expressed under
the environmental stress conditions and to explore the expression diversity of NDHs
in different rice cultivars, a comparative study of transcriptional alteration of NDHs
were carried out.
The results demonstrated that a number of rice NDHs were also responsive to salt
stress, confirming that in rice NDHs and AOXs co-expressed under environmental
stresses like salinity. Due to its response to ETC inhibition (Chapter 3), NDB2 was
further investigated at the protein level and enzyme activity level. There is no
documented work so far on expression patterns of rice NDHs at protein or enzyme
activity levels or even at transcriptional levels except the microarray data available on
the Genevestigator database. The expression of NDHs exhibited much more variation
between the two cultivars. Some NDHs were up-regulated while others were down-
regulated in response to salinity. The microarray data available on Genevestigator
database demonstrated a similar pattern of expression of rice NDHs, with up- and

Chapter 4
145
down-regulation in response to salinity, as also seen for AOXs (Figure 4.14, 4.15 and
4.16), which is consistent with current observations. My results demonstrated a
cultivar- and tissue-specific variation in NDHs expression between japonica and
indica rice. This diversity was not so evident in microarray data, which could be due
to all investigated cultivars being from the same rice group of indica. However,
cultivars IR64 and Pokkali showed contrasting expression of NDHs in root and
seedling tissues. The expression of NDA1, NDA2, NDB2, and NDB3 was up-
regulated in IR64 while NDB1 and NDC1 were down-regulated in seedling tissues. In
contrast, the expression of NDA1, NDA2, NDB2, and NDB3 were down-regulated in
Pokkali while NDB1 and NDC1 showed the same pattern of expression as in IR64
(Figure 4.15 and 4.16), suggesting a tissue-type variation even within the same rice
group as detected in the current study.
The analysis of transcriptional changes with changes in mitochondrial NAD(P)H
oxidation activities and NDB2 protein in roots and shoots, appears to give conflicting
evidence. Salt-treatment resulted in an increase in NADPH and calcium-dependent
NADH oxidation rates in mitochondria isolated from root tissue and a decline of
NADPH oxidation in salt-treated shoot mitochondria (Figure 4.13). In tissue collected
at 9 days after salt stress there was no change in NDB2 transcript in roots and slightly
higher in shoots (Figure 4.11). Additionally, no change in the amount of NDB2 protein
content in roots. It may be that these activity changes are mediated by products of
other genes rather than NDB2. For example NDB1 and NDB3 transcript levels both
increase earlier in salt stress ( Figures 4.4A and 4.4C), in potato and Arabidopsis
NDB1 protein has been linked to NADPH oxidation in mitochondria (Michalecka et al.,
2004; Geisler et al., 2007) and the antibody designed for OsNDB2 protein would not
interact with OsNDB1 or OsNDB3.

Chapter 4
146
In conclusion, rice AP genes, including both AOX and NDH, were responsive to
salinity stress. There was a cultivar- and tissue-specific variation in expression
patterns, which will be further investigated in the next Chapter using a number of salt-
tolerant and sensitive cultivars representing both japonica and indica groups.
Consistent with previous findings with other plant species, it appears that rice AOX
also can exists as a homodimer, which can be reduced or oxidized and an increase
of the reduced (active) form of the protein was detected in salt-treated tissues, as was
an increase in AOX activity. During the study, a polyclonal antibody was developed to
specifically bind to rice NDB2. As the peptide recognition sequence of this particular
antibody shares high similarity with other cereals, it could be useful in investigating
NDB2 protein from number of other cereals, including wheat and barley.

Chapter 4
147
Figure 4.15 Transcriptional level expression of NDB isoforms in different rice cultivars in response to salinity stress (extracted from Genevestigator database)
Data illustrate the fold-change expression of NDB1, NDB2 and NDB3 in salt-treated tissues compared to their controls in different rice cultivars. Data demonstrate a
less cultivar variation in the expression of NDB isoforms among cultivars from indica rice. Different experimental conditions were applied to different rice cultivars. The
cultivars Pokkali, IR63731, IR29 and FL478 were subjected to ~60 mM salt for 8 days and roots and crown tissues were used for the transcriptional analysis. The
cultivar IR64 and RIL lines were subjected to 200 mM salt for 3 h and 150 mM salt for 24 h respectively and whole seedling was used for the transcriptional analysis
(https://genevestigator.com/).

Chapter 4
148
igure 4.13 Transcriptional level expression of AOX isoforms in different rice cvs in response to salinity stress (extracted from Genevestigator database)
Data illustrate the fold-change expression of AOX1a, AOX1b and AOX1c in salt-treated tissues compared to their controls in different rice cvs. Data clearly demonstrate
the tissue specific nature of gene expression and the similar expression pattern of AOX1a and AOX1b in different tissue types (whole seedlings, roots and growing
point/crown tissue) from different cvs. Comparatively AOX1c is less responsive to salt stress. Different experimental conditions were applied to different rice cvs. The
cvs Pokkali, IR63731, IR29 and FL478 were subjected to ~ 60 mM salt for 8 days and roots and crown tissues were used for the transcriptional analysis. The cv IR64
and RIL lines were subjected to 200 mM salt for 3 h and 150 mM salt for 24 h respectively and whole seedling was used for the transcriptional analysis
(https://genevestigator.com/).
Figure 4.16 Transcriptional level expression of NDA isoforms and NDC1 in different rice cultivars in response to salinity stress (extracted from Genevestigator database)
Data illustrate the fold-change expression of NDA1, NDA2 and NDC1 in salt-treated tissues compared to their controls in different rice cultivars. Data demonstrate a
less cultivar variation in the expression of NDA and NDC isoforms among cultivars from indica rice. Comparatively, NDC1 was less responsive to the salt stress.
Different experimental conditions were applied to different rice cultivars. The cultivars Pokkali, IR63731, IR29 and FL478 were subjected to ~60 mM salt for 8 days
and roots and crown tissues were used for the transcriptional analysis. The cultivar IR64 and RIL lines were subjected to 200 mM salt for 3 h and 150 mM salt for
24 h respectively and whole seedling was used for the transcriptional analysis (https://genevestigator.com/).

Chapter 5
149
5 Differential sensitivity of rice cultivars to salinity stress and cultivar variation in the expression of alternative respiratory pathway genes
5.1 Introduction
Salinity tolerance in plants greatly varies among species and even cultivars within a
species, as reflected in their different growth responses (Munns and Tester, 2008;
Rajendran et al., 2009). It ranges from highly salt-sensitive glycophytes to highly
salt-tolerant halophytes (Figure 5.1).
Figure 5.1 The differential sensitivity of plant species to elevated salinity
Salinity tolerance is shown as increases in shoot dry matter after growth in solution or sand
culture containing NaCl for at least 3 weeks, relative to plant growth in the absence of NaCl
(Munns and Tester, 2008).
Rice (O. sativa) is the most salt-sensitive species of the cereals while barley
(Hordeum vulgare) is the most tolerant. Tall wheatgrass (Thinopyrum ponticum) is
one of the most salt-tolerant of the monocotyledonous species and is a halophytic
relative of wheat (Figure 5.1) (Munns and Tester, 2008). Dicotyledonous species
show greater variance in salinity tolerance compared to monocotyledonous species.

Chapter 5
150
Some species, such as Arabidopsis, are more sensitive while legumes like alfalfa
(Medicago sativa) are very tolerant. Saltbush (Atriplex spp.), a halophyte, is able to
grow well in salinities greater than that of sea water (Figure 5.1) (Aslam et al., 1986;
Munns and Tester, 2008).
Salinity tolerance is a genetically and physiologically complex trait, which exhibits
quantitative inheritance. This trait is complex as it is a combined result of number of
factors such as plant level and cell level ion compartmentation, minimizing Na+ uptake
by roots, secretion through glands etc. It shows continuous variation and also is highly
affected by the environment (Koyama et al., 2001; Kumar et al., 2015). The phenotype
of a quantitative trait or characteristic is a collective result of the interaction of many
genes (polygenic) and all genes together contribute towards the overall phenotype of
the plant despite environmental disturbances (Bartley et al., 2013).
Cultivated rice was domesticated from a common ancestor of wild rice. But, as a result
of both natural and human selection, there exists large genetic diversity across
thousands of varieties. As described in Section 1.1, rice cultivars are grouped into two
subspecies, japonica and indica, with marked differences in plant architecture,
agronomic and physiological features (Khush, 1997). As japonica and indica cultivars
exhibit clear variation in genome sequences as well as in their morphological and
physiological characteristics, it is worthwhile to study the molecular and physiological
response variations between japonica and indica rice to environmental stresses,
which will be helpful in identifying the mechanism of tolerance.
Rice shows differential sensitivity to salinity stress during its life cycle. Generally, it is
considered that rice plants are more sensitive to salt at the young seedling stage and
less sensitive at the reproductive stage (Flowers and Yeo, 1981). Nevertheless, there
is still a high impact on rice yield when plants are exposed to salinity stress during
early reproductive stages, such as panicle initiation or during pollination (Zeng et al.,
2001). There is a great variation in salt content and survival rate of individual rice

Chapter 5
151
plants at seedling stage within the same variety as well as between varieties grown
under salt stress (Flowers and Yeo, 1981). Differential varietal responses to salinity
stress were not limited to seedling stage, but also clearly seen in plants growing at
reproductive stage (Mohammadi-Nejad et al., 2010). Ferdose et al. (2015) reported
that growth inhibition by salt stress was more prominent at early seedling stage than
in the developed seedling stage. They also reported that the growth performances
were cultivar dependant and significantly negatively correlated with the Na+ content
and Na+/K+ ratio in root and shoot tissues in both developmental stages. Growth
reduction under salinity stress was significantly lower in indica rice compared to
japonica (Lee et al., 2003). They noticed that indica varieties were good Na+ excluders
and absorb high amount of K+ to maintain low Na+/K+ ratio in shoots. Despite whether
they are salt-tolerant or sensitive, cultivars from both O. sativa and O. glaberrima
showed vast diversity in salt tolerance. However, the majority of salt-tolerant cultivars
belong to the indica rice group (Platten et al., 2013).
Rice shows considerable genetic variation for salt-tolerance within the cultivated
genotypes (Walia et al., 2005; Platten et al., 2013). Comparative transcriptional
profiling using shoots of two contrasting indica genotypes showed that a greater
number of genes were induced by the salt-sensitive genotype (IR 29) in response to
salt stress, compared to a salt-tolerant genotype (FL 478) (Walia et al., 2005). A
complementary study on cultivar FL 478 and IR 29 looking at the response in roots
revealed that, in contrast to shoots, a greater number of genes were induced by salt-
tolerant FL 478 in response to salt stress compared to salt-sensitive cultivar IR 29
(Cotsaftis et al., 2011). Genetic variation in salt-tolerant and susceptible rice
genotypes was also observed by Xie et al. (2000) from the study, which investigated
the genetic diversity among salt-tolerant and salt-susceptible rice genotypes using
random amplified polymorphic DNAs (RAPDs). Their results showed that on the basis
of RADP markers, three salt-tolerant rice genotypes, Pokkali, Nona-Bokra and Bicol
differed from salt-sensitive IR29.

Chapter 5
152
An understanding of salinity effects on seedling growth and seed production of rice
would be beneficial to improve field management practices as well as to increase the
understanding of salt-tolerance mechanisms (Mohammadi-Nejad et al., 2010). The
current study explores the diversity in growth and molecular responses of different
rice cultivars representing both japonica and indica rice grown under salinity stress.
Rice seedlings grown as hydroponic cultures were exposed to 120 mM salt and
growth performance, Na+ and K+ accumulation patterns in root and shoot were studied
to explore the salt-tolerance mechanisms in different rice cultivars. The diversity of
expression of alternative respiratory pathway (AP) genes in selected rice cultivars
representing salt-sensitive and tolerant cultivars from both japonica and indica
varieties were studied to investigate whether there is a correlation between alternative
pathway gene expression, growth and ion accumulation in tissues, to explore the
potential use of AP genes as molecular markers for salt-tolerance in rice.
5.2 Materials and methods
5.2.1 Plant materials
Sixteen rice cultivars (Table 5.1), representing both japonica and indica rice were
used in the study. Seeds for all 16 cultivars were kindly provided by the Yanco
Agricultural Institute, Department of Primary Industries, New South Wales, Australia.
5.2.2 Salinity tolerance assay
Experiments for investigating salt-tolerance diversity of 16 different rice cultivars were
conducted in a PC2 greenhouse, School of Biological Sciences, Flinders University
of South Australia during July-August 2015. Growth conditions used were as
described in Section 2.1.1. Supplementary light (~400–500 µEm-2s-1) was supplied to
maintain a 12 h photoperiod as it was winter in South Australia.

Chapter 5
153
5.2.2.1 Screening for salt-tolerance
Screening for salt-tolerance was carried out using a hydroponic culture system. Seed
sterilization, germination and establishment of hydroponic cultures were carried out
as described in Sections 2.1.2 and 2.1.3, respectively. Rice seedlings were exposed
to salt stress 3 weeks after transplanting to hydroponic cultures. Salt was applied in
two increments (50 mM NaCl + 0.75 mM CaCl2 and 70 mM NaCl + 1.0 mM CaCl2) to
achieve a final concentration of 120 mM. The second salt application was added 2
days after the first and salt stress was maintained for 12 days. CaCl2 was added
together with NaCl to maintain constant Ca2+ activity in the growth solution. Five
biological replicates were collected from each cultivar per treatment (salt-treated and
control) for the determination of growth and tissue ion accumulation.
5.2.2.2 Measurements of biomass and tissue ion concentration
Destructive sampling was performed to determine root and shoot biomass of
seedlings grown under salt-stressed and non-stressed conditions. Data were
collected for fresh weight (FW), dry weight (DW) and Na+ and K+ accumulation in
whole shoot and whole root tissues as described in Section 2.1.4. Biomass data were
presented as means of five biological replicates as a percentage relative to their
controls and represented as relative dry weight.
5.2.3 Gene expression analysis
Based on the growth performance of 16 different rice cultivars, 7 cultivars representing
salt-tolerant and sensitive cultivars from both japonica and indica rice were selected
for gene expression analysis. The experiment was conducted under the same growth
conditions as for screening for salt-tolerance and hydroponic culture establishment
and salt application were carried out as described in Section 5.2.2.1. Two youngest
leaves and root samples were collected from three biological replicates for RNA
extraction after 9 days of salt application. RNA extraction and cDNA synthesis was
carried out as described in Sections 2.2.1.1 and 2.2.4, respectively. The expression
levels of AP genes and anti-oxidative enzyme genes in leaf and root tissues were

Chapter 5
154
evaluated by qRT-PCR as explained in Section 2.3.4. The expression data were
normalized to the geometric mean expression of three stable reference genes,
OsActin, OsElF1 and OsPlase, selected out of a set of 6 (Sections 2.3.5 and 3.3.10).
Table 5.1 Details of rice genotypes/cultivars used in the study
Rice cultivar/genotype Cultivar/genotype description
Lemont Tropical japonica variety originated in USA, semi-dwarf, long grain variety.
Doongara Australian long grain japonica variety, semi-dwarf, very resistant to water lodging, hard cooking variety grown in Australia with low glycaemic index.
Li-Jiang_Xin_Tuan_Hei_Gu (LTH)
Landrace Japonica rice from Yunnan province, China.
Takiminori Upland japonica variety originated in Japan.
IR 64
Moderate salinity tolerant indica variety developed by IRRI, wide adaptability and high yielding potential, it is also Known as a “Mega variety” because of its huge cultivated area in Asia. Commonly used in salinity testing studies.
Pandang wong-7 Tropical javonica type japonica variety originated in Indonesia.
Pokkali
Traditional indica variety originated from India. Salt-tolerant, commonly grown in coastal areas, poor yielding potential and poor grain quality, susceptible to water lodging. Commonly used in salinity testing studies.
Phka Rumduol Fragrant rice variety with jasmine type aroma, long slender grain, indica variety originated in Cambodia.
Tequing Taiwanese tropical japonica.
Kyeema Australian long grain japonica variety, tall strawed and prone to fall over before harvesting, poor seedling vigour, low yielding fragrant variety.
Milang 23 Korean Tongil type japonica (Tongil is an interesting blend of indica/japonica), high yielding variety.
Reiziq Australian japonica variety, semi-dwarf, medium grain variety commonly grown in Australia.
Topaz Australian long grain japonica variety released in 2014, fragrant rice variety commonly grown in Australia.
Nipponbare Japonica type rice variety originated in Japan. Medium grain, common cultivar used in salinity testing studies.
Koshihikari Japonica type, tall strawed, and susceptible to water lodging, short grain Japanese quality, low yielding commonly grown in Australia, originated in Japan.
Sherpa
Australian japonica variety, semi-dwarf, medium grain, cold-tolerant variety with good yield potential, released in 2011 and commonly grown in Australia.

Chapter 5
155
5.2.4 Statistical analysis
Where appropriate, results were statistically analysed for differences or correlations
using GraphPad statistical software. Data on Na+ and K+ concentrations in shoots and
roots were subjected to analysis of variance at p<0.05 and the differences from the
cultivar Nipponbare were statistically analysed using Bonferroni multiple comparison
test. A multiple t-test was performed to find statistically significant changes in gene
expression in treated vs. non-treated samples at 95% confidence level. Pearson’s
correlation coefficient between the variables was computed to measure the degree of
linear relationships between AP gene expression and Na+ content, K+ content, ratio of
Na+/K+ or relative growth (Ferdose et al., 2015).
5.3 Results
5.3.1 Differential responses of rice cultivars to salt stress
Differential sensitivity of 16 different rice cultivars was characterized in terms of their
biomass production and tissue ion accumulation under salt stress (120 mM) and
control (0 mM NaCl) conditions. Rice seedlings were grown on hydroponic culture
system and seedlings were exposed to salinity stress at their early seedling stage
(~4 weeks old). The salt-stressed plants showed obvious growth reduction compared
to plants grown under control conditions (0 mM NaCl). Stressed plants also initially
showed senescence of leaf tips, which is a characteristic symptom of ion toxicity
(Figure 5.2). There was a variation in symptom severity across genotypes depending
on the individual’s vigour to withstand salt stress. Yeo et al (1990) also demonstrated
that vigour was the most significantly correlated physiological characteristic of rice
genotypes with the survival of seedlings grown under salinity stress using a large
scale salt screening study involving 200 rice genotypes. The responses of different
rice cultivars/genotypes to salt stress were further evaluated by measuring their
biomass production and tissue Na+ and K+ accumulation patterns.
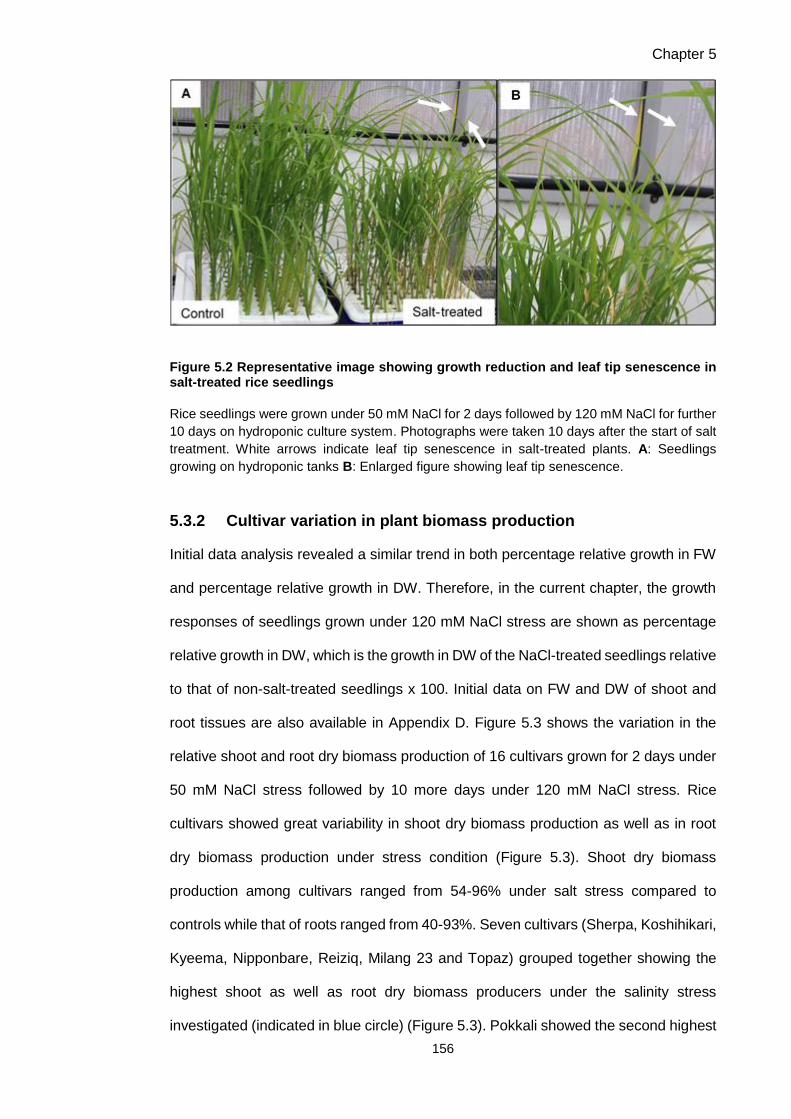
Chapter 5
156
Figure 5.2 Representative image showing growth reduction and leaf tip senescence in salt-treated rice seedlings
Rice seedlings were grown under 50 mM NaCl for 2 days followed by 120 mM NaCl for further
10 days on hydroponic culture system. Photographs were taken 10 days after the start of salt
treatment. White arrows indicate leaf tip senescence in salt-treated plants. A: Seedlings
growing on hydroponic tanks B: Enlarged figure showing leaf tip senescence.
5.3.2 Cultivar variation in plant biomass production
Initial data analysis revealed a similar trend in both percentage relative growth in FW
and percentage relative growth in DW. Therefore, in the current chapter, the growth
responses of seedlings grown under 120 mM NaCl stress are shown as percentage
relative growth in DW, which is the growth in DW of the NaCl-treated seedlings relative
to that of non-salt-treated seedlings x 100. Initial data on FW and DW of shoot and
root tissues are also available in Appendix D. Figure 5.3 shows the variation in the
relative shoot and root dry biomass production of 16 cultivars grown for 2 days under
50 mM NaCl stress followed by 10 more days under 120 mM NaCl stress. Rice
cultivars showed great variability in shoot dry biomass production as well as in root
dry biomass production under stress condition (Figure 5.3). Shoot dry biomass
production among cultivars ranged from 54-96% under salt stress compared to
controls while that of roots ranged from 40-93%. Seven cultivars (Sherpa, Koshihikari,
Kyeema, Nipponbare, Reiziq, Milang 23 and Topaz) grouped together showing the
highest shoot as well as root dry biomass producers under the salinity stress
investigated (indicated in blue circle) (Figure 5.3). Pokkali showed the second highest

Chapter 5
157
0
20
40
60
80
100
120
30 40 50 60 70 80 90 100
Rel
ativ
e sh
oo
t gr
ow
th in
dry
wei
ght
(% o
f co
ntr
ol)
Relative root growth in dry weight (% of control) )
Sherpa Koshihikari Nipponbare Reiziq Takiminori Topaz
Doongara Kyeema LTH Milang 23 Pandang Tequing
IR 64 Phka Rumduol Pokkali Lemont
shoot and root dry biomass production (76.68% and 82.03% respectively) while
Lemont showed the lowest shoot dry biomass production (54.44%). Doongara
recorded the lowest root dry biomass production (40.59%) out of the 16 cultivars
tested. It is interesting to note that although the shoot dry biomass production of
cultivars Takiminori, Phka Rumduol, Pandang, Tequing, IR 64 and LTH varied in a
very narrow range (65-72%), their root dry biomass production showed higher
variation ranging from 48-65% (Figure 5.3).
Figure 5.3 Cultivar variation in relative shoot and root dry biomass production of rice seedlings grown under salt stress
Rice seedlings were grown under 50 mM NaCl for 2 days followed by 120 mM NaCl for further
10 days on hydroponic culture system and plants were harvested for measurements. Results
are shown as percentage relative dry weight compared to the control.

Chapter 5
158
5.3.3 Tissue and cultivar variation in Na+ and K+ accumulation
The ion accumulation patterns of root and shoot tissues from 16 rice cultivars were
investigated to explore the diversity of K+ and Na+ retaining ability of tissues under
salt stress and to study the cultivar variation in salt-tolerant mechanisms. The
concentrations of Na+ and K+ in tissues were calculated based on their FW as well as
based on their DW. Evaluation of results from both calculation methods showed
positive correlation and therefore data presented in this chapter was based on the
DW based calculation method. The japonica rice cultivar Nipponbare was used as the
standard cultivar to compare ion accumulation in seedling tissues.
5.3.3.1 Tissue and cultivar variation in K+ accumulation
The responses of rice cultivars grown on salinized nutrient solution showed extreme
variability in terms of K+ accumulation in roots compared to shoots (Figures 5.4A and
B). The accumulation of K+ in roots ranged from 0.088-0.478 mmols/g DW. The lowest
K+ concentration in roots was recorded in Nipponbare. The root K+ concentration was
significantly higher in the cultivars Sherpa, Lemont, Tequing, LTH, IR 64, Milang 23,
Pandang, Pokkali and Phka Rumduol compared to Nipponbare (Figure 5.4A). The
accumulation of K+ in shoots showed less variability compared to roots ranging from
0.704-1.184 mmols/g DW. The cultivar Nipponbare recorded shoot K+ content of
0.789 mmols/g DW which was significantly lower compared to Pokkali (1.184 mmols/g
DW) (Figure 5.4B).

Chapter 5
159
(A)
(B)
Figure 5.4 K+ accumulation in roots (A) and shoots (B) from 16 different cultivars grown under 50 mM NaCl for 2 days followed by 120 mM NaCl for further 10 days on hydroponic culture system
Data are shown as mean + SEM from five biological replicates. * and *** represent significant difference from the cultivar Nipponbare at p<0.01and p<0.0001 respectively by Bonferroni multiple comparisons test.

Chapter 5
160
5.3.3.2 Tissue and cultivar variation in Na+ accumulation
The responses of rice cultivars grown on salinized nutrient solution showed extreme
variability in terms of Na+ accumulation in shoots compared to roots (Figures 5.5A
and B). There was less variation in root Na+ concentration among cultivars ranging
from 0.624-1.104 mmols/g DW compared to the variation observed in shoots. The
root Na+ concentration in cultivars Milang 23, Lemont, Pokkali, IR 64, Tequing, and
Pandang was significantly higher compared to Nipponbare (Figure 5.5A). In contrast
to roots, seedling shoots showed higher variability in Na+ accumulation ranging from
0.614-3.276 mmols/g DW (Figure 5.5B). The lowest shoot Na+ content (0.614
mmols/g DW) was recorded in Pokkali and was significantly lower compared to
Nipponbare (2.074 mmols/g DW). The highest shoot Na+ content (3.276 mmols/g DW)
was recorded in Doongara and was significantly higher compared to Nipponbare. In
addition to the cultivar Pokkali, significantly lower shoot Na+ contents were recorded
by cultivars Reiziq (0.80 mmols/g DW), Sherpa (0.89 mmols/g DW), Milang 23 (0.99
mmols/g DW) and Koshihikari (1.19 mmols/g DW) compared to Nipponbare.

Chapter 5
161
(A)
(B)
Figure 5.5 Na+ accumulation in roots (A) and shoots (B) from 16 different cultivars grown under 50 mM NaCl for 2 days followed by 120 mM NaCl for further 10 days on hydroponic culture system
Data are shown as mean + SEM from five biological replicates. *, ** and *** represent
significant difference from the cultivar Nipponbare at p<0.01, p<0.001 and p<0.0001
respectively by Bonferroni multiple comparisons test.

Chapter 5
162
5.3.4 Cultivar variation in growth responses to tissue ion accumulation
The study was further extended to explore the correlation between tissue ion
accumulation and their biomass production. There was a large cultivar variation in
biomass production and tissue ion accumulation in rice seedlings grown under
120 mM salt stress.
5.3.4.1 Cultivar variation in root growth and Na+ accumulation
Figure 5.6 Effect of Na+ accumulation on root growth of seedlings grown under 50 mM NaCl for 2 days followed by 120 mM NaCl for further 10 days on hydroponic culture system
Nipponbare, Milang 23, Topaz, Koshihikari, Reiziq, Kyeema, Sherpa and Pokkali
were the cultivars that showed the highest relative root dry biomass production (over
80%) against the Na+ content out of 16 cultivars examined (Figure 5.6). It is also
interesting to note that though all these cultivars were able to maintain the root
biomass production in the same range, there was a cultivar variation in root Na+
accumulation ranging from 0.62-1.04 mmols/g DW. The root Na+ content in Doongara
0
20
40
60
80
100
120
0.0 0.2 0.4 0.6 0.8 1.0 1.2
Rel
ativ
e ro
ot
gro
wth
in d
ry w
eigh
t(%
of
con
tro
l)
Na+ content in root (mmols/g DW)
Sherpa Koshihikari Nipponbare Reiziq Takiminori Topaz
Doongara Kyeema LTH Milang 23 Pandang Tequing
IR 64 Phka Rumduol Pokkali Lemont

Chapter 5
163
was 0.86 mmols/g DW and recorded the lowest root relative growth of 40.59% while
Reiziq was one of the highest root dry biomass producers under salt stress tested and
retained the same concentration of Na+ in roots (Figure 5.6). Similarly, cultivars Milang
23 and Lemont had similar root Na+ accumulation but the relative dry biomass
production of Lemont was 57.37% while it was 91.33% for Milang 23. Thus Milang 23
can tolerate higher Na+ content in the roots, indicating the use of different mechanisms
to avoid salt stress.
5.3.4.2 Cultivar variation in shoot growth and Na+ accumulation
Figure 5.7 Effect of Na+ accumulation on shoot growth of seedlings grown under 50 mM NaCl for 2 days followed by 120 mM NaCl for further 10 days on hydroponic culture system

Chapter 5
164
Similar to root growth responses, the same group of cultivars (Nipponbare, Milang 23,
Topaz, Koshihikari, Reiziq, Kyeema, and Sherpa) showed the highest relative shoot
dry biomass production out of 16 cultivars examined (Figure 5.7). All these cultivars
(indicated by the circle), were able to maintain over 90% of shoot growth under salt
stress. Interestingly, while these cultivars maintained dry biomass production in the
same range, there was a great cultivar variation in shoot Na+ accumulation ranging
from 0.8-2.08 mmols/g DW. The cultivars that had the highest shoot Na+ (Doongara
3.28 mmols/g DW; Lemont 2.56 mmols/g DW) had the poorest shoot growth
(Figure 5.7). Interestingly, Pokkali had the lowest shoot Na+ content but did not show
the highest growth (Figure 5.7).
5.3.5 Cultivar variation in plant growth and Na+/K+ ratio
Generally, it is considered that cytosolic Na+/K+ ratio is a key determinant of plant
survival in saline environments (Asch et al., 2000; Pires et al., 2015). The Na+/K+ ratio
in shoot and root tissues of the 16 cultivars was determined to explore the correlation
of Na+/K+ ratio and the biomass production of seedlings exposed to 120 mM NaCl
stress for 12 days.

Chapter 5
165
5.3.5.1 Cultivar variation in shoot growth and Na+/K+ ratio
Figure 5.8 Cultivar variation in shoot growth and Na+/K+ of 16 cultivars grown under 50 mM NaCl for 2 days followed by 120 mM NaCl for further 10 days on hydroponic culture system
Cultivar Pokkali had the lowest shoot Na+/K+ ratio (0.52) but only maintained 76.68% of
shoot growth under the salt stress tested. Doongara recorded the highest shoot
Na+/K+ ratio of 4.14 and was restricted to approximately 63% of control shoot growth
(Figure 5.8). It is interesting to note that the shoot Na+/K+ ratio of the cultivars Milang
23, Topaz, Koshihikari, Reiziq, Kyeema and Sherpa (indicated as “Group A”) and the
cultivars Pandang, Phka Rumduol, IR 64, Tequing and LTH (indicated as “Group B”)
were in the same level ranging from 1-2, but the two groups showed quite distinct
differences in shoot biomass, 91-96% and 66-71%, respectively (Figure 5.8).
Cultivar Nipponbare recorded over 90% of dry biomass production, which was in the
similar range as Group “A” cultivars, but its Na+/K+ ratio (2.62) was higher (Figure 5.8).
Similarly, Lemont recorded a lower shoot Na+/K+ ratio of 3.12 compared to that of

Chapter 5
166
0
20
40
60
80
100
120
0.5 2.5 4.5 6.5 8.5 10.5
Rela
tive r
oot
gro
wth
in d
ry w
eig
ht
(% o
f contr
ol)
Root Na+/K+ ratio
Sherpa Koshihikari Nipponbare Reiziq Takiminori Topaz
Doongara Kyeema LTH Milang 23 Pandang Tequing
IR 64 Phka Rumduol Pokkali Lemont
Doongara (4.14), but its shoot dry biomass was lower. These results indicate that the
Na+/K+ ratio in tissues per se is not indicative of the survival of rice seedlings under
salt stress.
5.3.5.2 Cultivar variation in root growth and Na+/K+ ratio
Figure 5.9 Cultivar variation in root growth and Na+/K+ of 16 cultivars grown under 50 mM NaCl for 2 days followed by 120 mM NaCl for further 10 days on hydroponic culture system
The importance of tolerance mechanisms in the survival of rice seedlings as opposed
to tissue ion accumulation is further supported by the behaviour of the cultivar
Nipponbare. Nipponbare recorded the highest Na+/K+ ratio (8.44) in roots, but still
maintained the highest root biomass production (93.44%) out of the 16 cultivars under
NaCl stress (Figure 5.9). The growth of Doongara, on the other hand, with a similar
Na+/K+ ratio of 7.99, was severely restricted. Although cultivars Nipponbare and
Doongara recorded almost identical Na+/K+ ratios, Nipponbare maintained twice the
root growth than Doongara (Figure 5.9). Likewise, cultivars Takiminori and Topaz

Chapter 5
167
recorded 48.39% and 85.69% of root biomass production, respectively, but the root
Na+/K+ ratio in both cultivars was the same (~5.4).
5.3.6 Cultivar variation in the expression of alternative pathway genes under salinity stress
Based on the growth performances, seven rice cultivars representing salt-sensitive
and salt-tolerant cultivars, were selected for gene expression analysis. The selected
group included both indica and japonica rice types. Seedlings were grown
hydroponically under the same experimental conditions as the previous growth and
ion analysis, as described in Section 5.2.2.1, and were exposed to 50 mM NaCl for 2
days followed by 120 mM NaCl for a further 7 days and the abundance of alternative
pathway genes were investigated using qRT-PCR. Two major genes responsible for
detoxification of ROS, MnSOD, which scavenges superoxide dismutating it into O2
and H2O2, and CAT-A, which breaks down H2O2 to O2 and water (Moller, 2001), were
also included in the study.
5.3.6.1 Cultivar variation in the expression of AOX1 isoforms
Substantial genotypic variation was observed in the expression of AOX1 isoforms,
AOX1a, AOX1b and AOX1c, regardless of the tissue type or the treatment. AOX1c
transcript abundance was higher in leaves of all rice cultivars investigated under
control conditions compared to AOX1a and AOX1b. No further significant induction of
leaf AOX1c transcripts was observed upon salt treatment in any of the cultivars,
except Phka Rumduol, which significantly (p<0.04) increased AOX1c transcript
abundance in response to salinity stress (Figure 5.10A). Doongara showed a
significant (p<0.001) increase in transcript levels of both AOX1a and AOX1b in leaves
of plants grown under salt-treated conditions compared to their controls
(Figure 5.10A), while cultivars Kyeema (p<0.04) and Phka Rumduol (p<0.02)
recorded significantly higher leaf AOX1b transcript levels compared to their controls.
Though it was not significant, cultivars Nipponbare, Kyeema and Phka Rumduol also
showed an increase in leaf AOX1a transcript abundance in response to salt treatment.

Chapter 5
168
Non-stressed Salt-stressed
(A)
(B)
Non-stressed Salt-stressed
**,*
***,***
*
***
Figure 5.10 Comparative transcriptional study of AOX1 isoforms in non-stressed and salt-stressed tissues from selected rice cultivars grown on hydroponic culture system for nine days under treatment
Relative expression pattern of alternative pathway genes AOX1a, AOX1b and AOX1c was
investigated in leaves (A) and roots (B) of seven rice cultivars under control (0 mM NaCl) and
salt-stressed (120 mM NaCl) conditions. Transcript levels were determined by qRT-PCR and
normalized against the geometric mean of three reference genes. Data are shown as mean
+ SEM from three biological replicates. Significant differences with control response at p<0.04,
p<0.02 and p<0.001 are indicated by *, ** and ***, respectively by multiple t-test.

Chapter 5
169
The majority of cultivars showed a slight decrease in root AOX1 isoforms transcript
abundance in response to salinity stress except cultivar Phka Rumduol, which
showed a significant (p<0.001) increase in AOX1b transcript abundance compared to
control roots (Figure 5.10B). Cultivar Kyeema also recorded a higher AOX1b
transcript level in salt-stressed roots compared to control roots (Figure 5.10B).
5.3.6.2 Cultivar variation in the expression of NDB isoforms
There was significant cultivar variation in the expression of NDB isoforms in leaves
compared to roots in the cultivars examined. Some isoforms showed a significant
increase of their transcript abundance while others showed reductions in response to
salinity stress. Out of the three NDB isoforms found in rice, the expression level of
NDB1 was very low in both leaf and root tissues compared to NDB2 and NDB3,
regardless of whether the plants were under stress (Figures 5.11 A and B). Statistical
analysis showed that leaf NDB1 transcript abundance in Phka Rumduol significantly
(p<0.02) increased while in Pokkali it significantly decreased (p<0.02) when seedlings
were exposed to 120 mM salt stress. None of the other cultivars showed significant
induction or reduction of NDB1 transcript levels in roots in response to salinity stress,
except Pokkali, which recorded a significant (p<0.01) reduction, as detected in leaves
(Figure 5.11A and B).
There was a large cultivar variation in transcript abundance of NDB2 in both roots and
shoots (Figures 5.11A and B). It is interesting to note that there was an up-regulation
of leaf NDB2 transcript levels in some cultivars while others were down-regulated in
response to salinity stress (Figure 5.11A).

Chapter 5
170
Non-stressed Salt-stressed
(A)
Non-stressed Salt-stressed
(B)
*
***
***,***
*
Figure 5.11 Comparative transcriptional study of NDB isoforms in non-stressed and salt-stressed tissues from selected rice cultivars grown on hydroponic culture system for nine days under treatment
Relative expression pattern of alternative pathway genes NDB1, NDB2 and NDB3 were
investigated in leaves (A) and roots (B) of seven rice cultivars under control (0 mM NaCl) and
salt-stressed (120 mM NaCl) conditions. Transcript levels were determined by qRT-PCR and
normalized against geometric mean of three reference genes. Data are shown as mean + SEM
from three biological replicates. Significant differences with control response at p<0.03 and
p<0.001 are indicated by * and ***, respectively by multiple t-test.

Chapter 5
171
The abundance of leaf NDB2 transcript was very high in Doongara grown under
non-stressed conditions compared to all other rice cultivars investigated and it
significantly decreased (p<0.001) in response to salinity stress (Figure 5.11A). In
contrast to Doongara, Nipponbare recorded a significant (p<0.03) increase of leaf
NDB2 transcripts and cultivars Kyeema and Phka Rumduol showed non-significant
increases. Cultivars Milang 23, IR 64 and Pokkali recorded a non-significant decrease
of leaf NDB2 transcript levels in response to salinity stress (Figure 5.11A).
There was a higher abundance of root NDB2 transcripts in Pokkali under control
conditions and with the exposure of seedlings to salt, transcript level was significantly
(p<0.001) decreased (Figure 5.11B). Cultivars Kyeema, Milang 23 and IR 64 also
recorded a slight reduction of root NDB2 transcript levels in response to salinity stress
while cultivars Nipponbare, Doongara and Phka Rumduol grown under salt stress
showed slight increase of root NDB2 transcript levels (Figure 5.11B).
None of the other cultivars, other than Pokkali, recorded significant changes in the
NDB3 transcript abundance in response to salinity stress in both tissue types tested.
Pokkali showed a significant decrease in transcript levels in leaves (p<0.03) as well
as roots (p<0.001) when seedlings were exposed to salt stress. It is interesting to note
that expression of NDB isoforms in leaves as well as in roots in Pokkali was inhibited
when seedlings were exposed to salinity stress.
5.3.6.3 Cultivar variation in expression of NDA isoforms and NDC1
Out of two NDA isoforms, expression level of NDA2 was very low compared to the
expression level of NDA1 in both leaves and roots regardless whether plants were
under stressed or non-stressed condition, and didn’t show any significant changes in
response to salinity stress tested.

Chapter 5
172
Figure 5.12 Comparative transcriptional study of NDA isoforms and NDC1 in non- stressed and salt-stressed tissues from selected rice cultivars grown on hydroponic culture system for nine days under treatment
Relative expression pattern of alternative pathway genes NDA1, NDA2 and NDC1 were
investigated in leaves (A) and roots (B) of seven rice cultivars under control (0 mM NaCl) and
salt-stressed (120 mM NaCl) conditions. Transcript levels were determined by qRT-PCR and
normalized against geometric mean of three reference genes. Data are shown as mean
+ SEM from three biological replicates. Significant differences with control response at p<0.03
and p<0.01 are indicated by * and **, respectively by multiple t-test.

Chapter 5
173
It is interesting that in some cultivars leaf NDA1 transcript level was higher in control
condition while it was low in others. In response to salt stress, the cultivars which had
higher transcript abundance showed reduction while those had lower transcript levels
showed further induction (Figures 5.12A and B). Cultivars Doongara, IR 64 and
Pokkali showed higher leaf NDA1 transcript abundance under control condition
compared to the other cultivars tested (Figure 5.12A), and it was lowered significantly
(p<0.03) in Doongara and non-significantly in IR 64 and Pokkali. In contrast, leaf
NDA1 transcript levels in cultivars Nipponbare, Kyeema and Phka Rumduol were
increased when seedlings were exposed to salt (Figure 5.12A). Milang 23 didn’t show
any noticeable change when seedlings were treated with salt. Likewise in leaves, the
transcript abundance of root NDA1 was increased in Nipponbare. In contrast to
leaves, root NDA1 transcript level in Doongara was increased when seedlings were
exposed salinity stress (Figure 5.12A and B). Higher expression of root NDA1 was
observed in two cultivars, Milang 23 and Pokkali under non-treated conditions and it
was down-regulated significantly (p<0.01) in Pokkali and non-significantly in Milang
23 when seedling were treated with salt (Figure 5.12B).
There was a significant (p<0.01) increase in leaf NDC1 transcript level in Phka
Rumduol when seedlings were treated with 120 mM NaCl. In contrast, there was a
significant (p<0.01) reduction both leaf and root NDC1 transcript level in Pokkali.

Chapter 5
174
5.3.7 Cultivar variation in the expression of antioxidant defence genes MnSOD and CAT-A under salinity stress
Expression of two selected antioxidant defence genes (MnSOD and CAT-A), which
regulate the increased accumulation of ROS during oxidative stress (Moller, 2001),
were also investigated in seven rice cultivars under non-stressed and salt-stressed
conditions to explore whether there is any correlation between the expression of
antioxidant genes and the expression of alternative pathway genes.
Expression level of MnSOD was very low compared to that of CAT-A in leaves and
roots of rice seedlings under stressed as well as non-stressed conditions. Cultivar
Milang 23 showed a significant reduction of MnSOD transcript level in shoots in
response to the NaCl stress applied. Other than that, no noticeable changes were
observed in MnSOD abundance in leaves or roots (Figures 5.13A and B).
Comparatively higher leaf CAT-A transcript levels were observed in cultivars
Doongara and Kyeema in non-treated seedling compared to other cultivars
investigated and reduced non-significantly in response to salinity stress. In contrast,
Phka Rumduol showed a further increase of CAT-A transcript abundance in salt-
stressed leaves (Figure 5.13A).
In roots, CAT-A transcript was significantly increased in cultivars Doongara (p<0.05)
and decreased in Kyeema (p<0.005) while all other cultivars had non-significant
increase (Nipponbare, Phka Rumduol, Pokkali) or decrease (Milang 23) in response
to salinity stress (Figure 5.13B).

Chapter 5
175
Figure 5.13 Comparative transcriptional study of antioxidant defence genes in non- stressed and salt-stressed tissues from selected rice cultivars grown on hydroponic culture system for nine days under treatment
Relative expression of two antioxidant defence genes encoding mitochondrial manganese
superoxide dismutase (MnSOD) and catalase A (CAT-A) enzymes were investigated in leaves
(A) and roots (B) of seven rice cultivars under control (0 mM NaCl) and salt-stressed (120
mM NaCl) conditions. Transcript levels were determined by qRT-PCR and normalized against
geometric mean of three reference genes. Data are shown as mean + SEM from three
biological replicates. Significant differences with control response at p<0.05 and p<0.005 are
indicated by * and ***, respectively by multiple t-test.

Chapter 5
176
5.3.8 Correlation between the expression of AP genes, tissue ion accumulation and relative growth
Pearson’s correlation coefficient (r) was computed between the expression of AP
genes and the tissue Na+ content, K+ content and Na+/K+ to check whether there was
a correlation between AP gene expression and tissue ion accumulation. Strength of
the correlation was described following the guidelines suggested by Mukaka (2012).
The expression of three AP genes, AOX1a, NDB3 and NDA2 showed a strong
(positive or negative) correlation with the accumulation of ion in seedling tissues while
all others had very weak or no correlation (Table 5.2). The expression of AOX1a in
leaves showed a significant positive correlation with tissue Na+ content (r=0.85) and
with Na+/K+ ratio (r=0.85) while it had weak positive correlation with tissue K+ content
(r=0.46) (Table 5.2). In contrast, expression of AOX1a in roots showed moderate
negative correlation with tissue Na+ content (r=-0.58) and very poor positive
correlation with tissue K+ content (r=0.12) and negative correlation with Na+/K+ ratio
(r=-0.26). The expression of AOX1b in leaves showed moderate positive correlation
with tissue Na+ content (r=0.64) and Na+/K+ ratio (r=0.67) while it was very weak with
K+ content (r=0.21). Although the expression of AOX1c showed a moderate negative
correlation with leaf K+ content, it had very weak correlation with Na+ content and ratio
of Na+/K+ (Table 5.2).
Out of NDHs, NDA2 showed a strong correlation with tissue Na+ content (r=0.86) and
Na+/K+ ratio (r=0.83) in leaves. Interestingly, in roots, the expression of NDA2 had
very strong positive correlation (r=0.91) with Na+/K+ ratio but the negative association
with Na+ concentration was weak (r=-0.39). There was a moderate positive correlation
of leaf NDA2 and K+ content but in roots it was strong negative correlation (Table 5.2).
Similar association pattern was observed in leaf NDB3 expression and tissue ion
contents. It showed moderate positive correlation with tissue Na+ (r=0.66), K+ (r=0.54)
and ratio of Na+/K+ (r=0.65), but, in contrast to NDA2, in roots, NDB3 had very strong

Chapter 5
177
negative correlation with the ratio of Na+/K+ (r=-0.9) and strong positive relationship
with tissue K+ concentration (r= 0.82).
Expression of some isoforms of AP genes showed little correlation with percentage
increase in growth after 12 days exposure to stress under saline conditions (Table
5.2). There were moderate correlations of expression of NDB2 and NDB3 with relative
shoot growth (r=0.5 and r=-0.51, respectively) and strong negative correlations of
AOX1c and NDB2 with relative root growth (r=0.86 and 0.87, respectively).
5.3.9 Correlation between the expression of alternative respiratory pathway genes and the antioxidant defence genes
The association of the expression of the AP genes and antioxidant defence genes
was checked by calculating Pearson’s correlation coefficient. Results demonstrated
that there was a weak negative correlation between the expression of AOX1a and the
expression of CAT-A in both leaf and roots (r=-0.36 and -0.43, respectively). Though
there was a moderate negative relationship between expression of AOX1a and
MnSOD in roots (r=-0.35), it was negligible in leaves (r=0.027) (Table 5.3). The
association between expression of AOX1b and antioxidant genes were negligible in
both leaves and roots while AOX1c recorded a strong positive correlation with MnSOD
in leaves (r=0.89) and moderate negative correlation in roots (r=-0.56).
Expression of NDB1 had very strong positive correlation (r=0.93) with CAT-A in
leaves while it was moderate in roots (r=0.35). Although, the induction of NDB2 had
moderate positive correlation with CAT-A in leaves (r=0.50) and in roots (r=0.46), no
association with the expression of MnSOD. It is interesting to note that NDA1 had
strong positive correlation with CAT-A in both leaves (r=0.84) and roots (r=0.70), but
NDA2 did not show any correlation with antioxidant genes. There was a significant
positive correlation between NDC1 and CAT-A in leaves (r=0.98) while it was
moderate in roots (r=0.35). The moderate association between MnSOD and NDC1 in
leaves was positive while it was negative in roots (Table 5.3).

Chapter 5
178
Table 5.2 Correlation of the expression of alternative respiratory pathway genes and tissue ion accumulation of seven rice cultivars grown under 120 mM salinity stress for 9 days The values indicate the Pearson’s correlation coefficient (r) computed using GraphPad statistical software. * and ** indicate the significant correlation at P<0.05 and P<0.01 respectively.
Leaf
AOX1a AOX1b AOX1c NDB1 NDB2 NDB3 NDA1 NDA2 NDC1
K+ content 0.46 0.21 -0.52 -0.53 0.28 0.54 -0.34 0.67 -0.39
Na+ content 0.85 * 0.64 -0.27 -0.15 0.11 0.66 -0.09 0.86 * -0.07
Na+/K+ 0.85 * 0.67 -0.19 0.0035 0.085 0.65 0.014 0.83 * 0.06
Relative growth in DW (%)
-0.29 -0.37 0.022 -0.13 0.5 -0.51 0.28 0.022 0.021
Root
K+ content 0.12 0.25 0.061 0.21 0.053 0.82* -0.32 -0.81 * 0.21
Na+ content -0.58 -0.4 -0.33 0.16 -0.073 0.24 0.31 -0.39 0.16
Na+/K+ -0.26 -0.26 -0.011 -0.15 0.12 -0.9 ** 0.55 0.91 ** -0.15
Relative growth in DW (%)
-0.082 -0.38 -0.86 * -0.74 -0.87 * 0.18 -0.52 -0.0064 -0.74

Chapter 5
179
Table 5.3 Correlation of the expression of alternative pathway genes and the expression of antioxidant defence genes, MnSOD and CAT-A of seven rice cultivars grown under 120 mM salinity stress for 9 days The values indicate the Pearson’s correlation coefficient (r) computed using GraphPad statistical software. *, ** and *** ind icate the significant correlation at P<0.01, P<0.002 and P<0.0002 respectively.
Leaf
AOX1a AOX1b AOX1c NDB1 NDB2 NDB3 NDA1 NDA2 NDC1
CAT-A -0.36 -0.19 0.18 0.93 ** 0.5 0.096 0.84 * -0.042 0.98 ***
MnSOD -0.027 0.17 0.89 ** 0.36 -0.26 -0.14 -0.028 -0.25 0.44
Root
CAT-A -0.43 -0.21 0.25 0.35 0.46 -0.13 0.7 -0.073 0.35
MnSOD -0.35 -0.11 -0.56 -0.39 0.035 0.16 0.088 0.26 -0.39

Chapter 5
180
5.4 Discussion
Plants exhibit a number of physiological and molecular responses in order to survive
under the osmotic and ion toxicity imposed by elevated salinity, and these responses
vary greatly within plant species/cultivar (Walia et al., 2005; Munns and Tester, 2008;
Platten et al., 2013) and even among individual plants within the same cultivar
(Flowers and Yeo, 1981). The current study evaluated the physiological responses of
16 different rice cultivars, representing indica and japonica rice, to salinity stress at
early seedling stage using a hydroponic culture system. Based on growth
performance under salinity stress, seven cultivars representing salt-tolerant and salt-
sensitive cultivars, were selected for further transcriptional analysis. The study
demonstrated contrasting cultivar variations in the physiological as well as molecular
responses in response to salinity stress. Out of 16 cultivars used in the current study,
the cultivars Pokkali, IR 64 and Nipponbare have been commonly used in salinity
tolerance studies (Kumari et al., 2009; Cotsaftis et al., 2011; Kavitha et al., 2012;
Ferdose et al., 2015). However, comparative growth and molecular responses of
other cultivars, especially Australian japonica rice, to salinity stress have not yet been
reported.
During the current study, a great variation between cultivars was observed in shoot
as well as in root biomass production under the salinity stress imposed. A group of
seven japonica rice cultivars (Sherpa, Koshihikari, Kyeema, Nipponbare, Reiziq,
Milang 23 and Topaz), which mostly consisted of Australian japonica rice cultivars,
showed the highest biomass production in terms of both shoots and roots (Figure 5.3).
Doongara, which is also an Australian japonica cultivar, showed the lowest root
biomass production while Lemont (USA tropical japonica) had the lowest shoot
biomass production (Figure 5.3). While shoot biomass production of some cultivars,
Takiminori, Phka Rumduol, IR 64, Pandang and LTH, which represent both japonica

Chapter 5
181
and indica rice cultivars, was found to be in a similar range but these cultivars showed
a large variation in root biomass production (Figure 5.3). Generally, rice is considered
to be the most salt-sensitive cereal crop especially at the early seedling stage (Munns
and Tester, 2008; Ferdose et al., 2015). My results demonstrate that despite this, rice
shows contrasting genotypic as well as tissue-wide variation in the sensitivity to
salinity stress as reflected by growth performance. Such variation in salinity tolerance
among accessions from cultivated Oryza species, O. sativa and O. glaberrima, has
been reported earlier (Platten et al., 2013). These authors showed that, despite the
diverse origin and relationships of the accessions, salinity tolerance in almost all
accessions from both O. sativa and O. glaberrima correlated with leaf Na+
accumulation. They suggested that the mechanisms proposed to influence Na+
concentrations in leaves, such as Na+ exclusion from roots, sequestration of Na+ in
roots, stems and leaf sheath, partitioning of Na+ from leaf to leaf and dilution of Na+
content in a large biomass, can all play a major role in salinity tolerance. Lee et al.
(2003) also observed extreme cultivar variability between indica and japonica rice
groups in response to salinity stress at the seedling stage. These varietal differences
in salinity tolerance were highly significant in the context of plant growth (height, shoot
weight, root weight) as well as tissue ion accumulation. Remarkable sensitivity
differences to salinity stress were reported even within closely related indica cultivars
(Walia et al., 2005; Kumari et al., 2009). It has been observed that rice plants with
more biomass had more inherent vigour which allows them to tolerate salinity stress
better than smaller plants (Yeo and Flowers, 1986). Therefore, plant size might also
be important when comparing salinity tolerance between a number of genotypes with
very different plant biomass (Pires et al., 2015). But, the current study did not
investigate the effect of plant size on salinity tolerance.
The results presented also demonstrated the existence of extreme cultivar variation
in ion accumulation in tissues. Pokkali recorded the lowest concentration of shoot Na+

Chapter 5
182
out of 16 cultivars tested, which was significantly lower than that of Nipponbare
(Figure 5.5B). In contrast, the root Na+ concentration of Pokkali was significantly
higher compared to that of Nipponbare (Figure 5.5A), yet both cultivars were able to
maintain over 75% of relative root and shoot biomass production under 120 mM salt
over 12 days (Figures 5.6 and 5.7). These results indicate that the two different
cultivars use different tolerance mechanisms to survive under saline conditions.
Cotsaftis et al. (2011), who obtained similar results in cultivar Pokkali, suggested that
the possible mechanisms used by this cultivar could be sequestration of Na+ in root
tissues, preventing transfer to shoot tissues, or reduction of Na+ transport to shoots.
Pokkali is generally a large biomass producer compared to others, which may have
increased Na+ dilution in the shoot tissue (Yeo et al., 1990; Platten et al., 2013).
Nipponbare is a poor Na+ excluder and accumulates substantial Na+ in its tissues,
probably sequestered in vacuoles since its relative biomass production was
maintained. Doongara recorded the highest Na+ accumulation in shoots while Lemont
was the second highest, they also had the lowest relative shoot biomass production,
suggesting that these two cultivars were not only poor Na+ excluders but probably
accumulated Na+ in cells, possibly in the cytoplasm, which inhibited normal cell
functions, that is, they had poor tolerance mechanisms.
It is a widely known fact that high concentrations of Na+ in the cytoplasm creates
metabolic toxicity in cells, possibly as a result of its ability to compete with K+ for
binding sites essential of cellular functions (Tester and Davenport, 2003). K+ is
required for the activation of some enzymes and Na+ cannot substitute. Protein
synthesis also requires high concentrations of K+. Therefore, high levels of Na+ or a
high Na+/K+ ratio, disrupt cellular enzymatic processes including protein synthesis
(Tester and Davenport, 2003), which in turn has a negative effect on plant growth and
development. The Na+/K+ ratio in a plant is considered to be one of the most important

Chapter 5
183
factors in deciding the tolerance of a plant to salinity stress (Asch et al., 2000; Pires
et al., 2015). The data presented here show significant variation in Na+/K+ ratios
among the 16 rice cultivars. The traditional salt-tolerant indica cultivar, Pokkali,
recorded the lowest Na+/K+ ratio in shoots (Figure 5.8) and maintained comparatively
higher (~80%) relative shoot dry biomass production. Doongara lost ~40% of shoot
and ~60% and root biomass production as a consequence of higher Na+/K+ ratio in
tissues (Figure 5.8 and 5.9), in line with it being a salt-sensitive cultivar. In contrast to
these two cultivars, Nipponbare had higher Na+/K+ ratios in both shoots and roots but
maintained over 90% of relative dry matter production in both tissue types, showing
that it can tolerate higher Na+ levels in its tissues, probably by sequestering Na+ in
shoots and roots away from the cytoplasm.
Comparing physiological and transcriptional parameters in rice cultivars with
divergent level of salinity tolerance can improve our knowledge of salt-tolerance
mechanisms (Senadheera et al., 2009). There are a number of studies which focused
on the genotypic variations in transcriptional and physiological responses of rice
cultivars to salinity stress (Walia et al., 2005; Senadheera et al., 2009; Cotsaftis et al.,
2011). Transcriptional analysis in most of these studies was based on genome-wide
gene expression analysis to explore the genes that are up-regulated or down-
regulated in response to salinity stress and mostly focused on indica rice cultivars. In
the current study, seven cultivars, representing diverse rice germplasm (both indica
and japonica rice were included), were selected for transcriptional analysis based on
their initial physiological characterization. Unlike other studies, this study compared
the expression of alternative respiratory pathway genes, AOXs and NDHs, using qRT-
PCR. To my knowledge, this is the first such study in cultivars with divergent
germplasm variation to salinity stress. The data presented here demonstrate that
there is a wide variation between cultivars in alternative pathway gene expression

Chapter 5
184
under control as well as salt-treated conditions. Some genes were activated under
non-salt-treated condition and inhibited in response to salinity stress while others
were induced further. For example, AOX1a and AOX1b in Doongara were significantly
induced in response to salinity stress while AOX1c expression was inhibited (Figure
5.10A). Likewise, there was a higher abundance of shoot NDB2 transcripts in
Doongara under control conditions but it was dramatically decreased in response to
salinity stress. In contrast, the abundance of NDB2 transcript in roots was less under
control conditions and increased in salt-treated roots (Figure 5.11). Cultivar variation
and tissue-specificity of other transcriptional responses of rice in response to salinity
stress have been reported previously (Walia et al., 2005; Cotsaftis et al., 2011). Walia
et al. (2005) observed that a relatively large number of genes were expressed in the
shoots of sensitive indica cultivar, IR 29, compared to tolerant indica type, FL478, in
response to salinity stress. In contrast, Cotsaftis et al. (2011) observed the expression
of large number of genes in the roots of salt-tolerant cultivar, FL478 compared to the
salt-sensitive IR 29 under the same experimental conditions, showing the tissue-
specific nature of transcriptional responses.
Other studies have shown that tolerant cultivars maintain higher transcript levels of
genes related to salt-tolerance even under non-stressed conditions, to be “well
prepared” for the subsequent stress (Kumar et al., 2009). Kumari et al. (2009)
reported that the salt-tolerant rice cultivar, Pokkali maintained high level of expression
of stress inducible genes in the absence of stress, which in turn resulted in expression
of fewer genes in response to salinity stress compared to IR 64. Similarly, current
results also revealed high level of transcript abundance of some AP genes (NDA1,
NDB2, and NDC1) in Pokkali in the absence of stress, and down-regulated in
response to salinity stress while some other cultivars (Nipponbare, Kyeema and
Milang 23) had low level of expression of these genes in the absence of stress and

Chapter 5
185
up-regulated in response to high salt (Figure 5.12). But, in contrast, salt-sensitive
cultivars like Doongara and even IR 64 also maintained high levels of expression of
NDA1, NDB2 and NDC1 in non-stressed tissues, and down-regulated in response to
elevated salinity.
Although expression of AOX1a and NDA2 in leaf tissues showed a strong positive
correlation with tissue Na+ content, there was no correlation between AP gene
expression and shoot growth. In fact, the expression of AOX1c and NDB2 in roots
revealed strong negative correlation with relative growth of roots. It must be kept in
mind that this study has only determine gene expression levels and not protein levels
or activity. As AOX can be post-transcriptionally regulated it is still possible that
alternative pathway components may play a role in salt-tolerance in some cultivars,
the data presented here imply that AP gene expression levels may not be good
molecular markers for salt-tolerance in general in rice.

Chapter 6
186
6 Generation and characterization of transgenic rice carrying salt-responsive Arabidopsis alternative respiratory genes, AtAOX1a and AtNDB2
6.1 Introduction
The application of genetic methods has the potential to upgrade existing crops and to
provide incremental improvements. Therefore, plant genetic engineering has become
one of the important molecular tools in molecular breeding of crops (Sah et al., 2014).
Once the genes responsible for controlling mechanisms of abiotic stresses have been
identified, they can be manipulated to develop improved crop varieties using genetic
recombination technology. Overexpression of stress responsive alternative
respiratory genes has been shown to improve growth and to reduce ROS production
under stress conditions compared to their wild types. Li et al (2013) showed that
overexpression of OsAOX1a gene in rice could strongly increase the growth
performance, especially the root growth, of rice seedlings grown under cold stress
due to the reduction of ROS generation within cells and thereby minimizing oxidative
damage. Smith et al (2009) provided evidence that overexpression of AtAOX1a in
Arabidopsis seedlings improved the growth of seedlings under salt stress by reducing
the production of ROS within tissues. And also they further showed that AtNDB4
knockdown lines of Arabidopsis showed the increased expression of AtAOX1a and
AtNDB2 genes in seedlings grown under salinity stress giving evidences that
Arabidopsis AOX1a and NDB2 are playing a role during salinity stress (Smith et al.,
2011).
Overexpression of dicot stress responsive genes in cereals provided enhanced
tolerance to respective stress conditions. Schilling et al. (2014) showed that
transgenic barley expressing Arabidopsis vacuolar H+ pyrophosphatase (AVP1) gene
produced a larger shoot biomass when grown in soil with 150 mM NaCl. And also
these transgenic barley produced a greater grain yield per plant when grown in a

Chapter 6
187
saline field compared to their wild type. Transgenic rice co-expressing Suaeda salsa
vacuolar membrane Na+/H+ antiporter (SsNHX1) and Arabidopsis AVP1 also showed
enhanced salt-tolerance during 3 days of 300 mM NaCl treatment under outdoor
growth conditions (Zhao et al., 2006). In contrast, there are some reports which use
the model plant Arabidopsis to study the function of monocot genes under abiotic
stresses. Sugie et al (2006) developed a system to study the functions of wheat
AOX1a gene under low temperature by cloning wheat AOX1a into Arabidopsis. They
noticed that there was rapid recovery of total respiration capacity of transgenic plants
as well as decreased levels of ROS under low temperature stress compared to their
wild type.
The main objective of this chapter is to test the potential of applying the knowledge
gained through the model system Arabidopsis, to improve cereal crop productivity
under salinity stress using rice as model cereal. The chapter discusses an attempt
towards generating transgenic rice with improved salinity tolerance by inserting salt-
responsive AtNDB2 and AtAOX1a genes under the control of rice actin-1 promoter.
The work here describes the molecular cloning of two plasmid constructs carrying
salt-responsive Arabidopsis AOX1a or NDB2 genes into the pIPKb003
overexpression vector and the subsequent process of producing transgenic rice
carrying AtAOX1a or AtNDB2 through Agrobacterium-mediated transformation. The
chapter will further describe the preliminary evaluation and characterization of
putative salt-tolerant transgenic rice under greenhouse conditions by exposing to
environmentally realistic salt concentrations (eg 30 mM) during panicle initiation
stage.

Chapter 6
188
6.2 Materials and methods
The processes of developing genetic constructs, generating transgenic rice plants
and their evaluation studies were carried out in the OGTR (Office of the Gene
Technology Regulator) licensed PC2 laboratory and plant facility at Flinders university
of South Australia.
6.2.1 Plasmid vectors used in the study
Gateway® entry clones carrying the AtAOX1a gene and AtNDB2 gene (Flinders
University) and the pIPKb003 overexpression/destination vector (Himmelbach et al.,
2007) were used as plasmid vectors in the generation of two genetic constructs, either
an AtAOX1a or an AtNDB2 overexpression/destination clone, to transform rice
scutellum-derived embryogenic calli. The Gateway® entry clone carrying the
AtAOX1a gene was generated by insertion of the AtAOX1a coding DNA sequence
(CDS) (1065 bp) into the pDONR™207 donor vector via the Gateway® BP reaction,
which carries a gentamycin resistance gene as a bacterial selection marker (Figure
6.1). The Gateway® entry clone carrying AtNDB2 gene was generated by insertion of
the AtNDB2 CDS sequence (1749 bp) into the pDONR™221 donor vector via the
Gateway® BP reaction. It carries a kanamycin resistance gene as a bacterial
selection marker (Figure 6.2). pIPKb003 overexpression vector (Acc. EU161569),
which carries a spectinomycin resistance gene for bacterial selection and a
hygromycin resistance gene for plant selection, was used as the destination vector
(Figure 6.3). This plasmid vector was specifically designed for cereal transformation
and was Gateway® compatible.

Chapter 6
189
Figure 6.1 Schematic representation of Gateway® entry clone carrying AtAOX1a gene (created with PlasMapper - http://wishart.biology.ualberta.ca/PlasMapper/)
A gateway entry clone carrying the AtAOX1a gene (At3g22370) was used to generate an
AtAOX1a overexpression clone in the current study. The entry clone was generated by
insertion of the AtAOX1a CDS sequence (1065 bp) into the pDONR™207 donor vector via
Gateway® BP reaction. The entry clone backbone consisted of gentamycin resistance marker
gene (gent marker) for the selection of plasmid in E.coli, transcription termination sequences
(rrnB_T1term and rrnB_T2 term), CDS sequence of Arabidopsis AOX1a gene (AtAOX1a),
Gateway recombination sites (attL1 and attL2), and pBR322 origin of replication for high
plasmid yield.

Chapter 6
190
Figure 6.2 Schematic representation of Gateway® entry clone carrying AtNDB2 gene (created with PlasMapper - http://wishart.biology.ualberta.ca/PlasMapper/)
A gateway® entry clone carrying the AtNDB2 gene (At4g05020) was used to generate an
AtNDB2 overexpression clone in the study. The entry clone was generated by insertion of the
Arabidopsis NDB2 CDS sequence (1749 bp) into the pDONR™221 entry vector via Gateway®
BP reaction. The clone backbone consisted of the kanamycin resistance marker gene (kan2
marker) for the selection of plasmid in E.coli, transcription termination sequences
(rrnB_T1term and rrnB_T2 term), CDS sequence of Arabidopsis NDB2 gene (AtNDB2),
Gateway recombination sites (attL1 and attL2), and pBR322 origin of replication for high
plasmid yield.

Chapter 6
191
Figure 6.3 Schematic representation of pIPKb003 overexpression/destination vector (created with PlasMapper - http://wishart.biology.ualberta.ca/PlasMapper/)
The pIPKb003 overexpression vector (binary vector), specifically designed for cereal
transformation (Himmelbach et al., 2007), was used as the destination vector. It is Gateway
compatible and the vector backbone consisted of the following components: Gateway
recombination sites (attR1 and attR2), which facilitate the exchange of a gene sequence of
interest (GOI) between an appropriate entry vector and an IPKb003 destination vector using
the Gateway recombination system, a chloramphenicol resistance gene (CmR marker) for
selection of bacteria, ccdB toxin gene for negative selection of bacteria, E. coli origin of
replication (ColE1), Agrobacterium origin of replication (pVS1), a spectinomycin resistance
gene for selection of bacteria (spec marker), hygromycin resistance gene (hygroB marker)
controlled by maize ubiquitin 1 promoter (maize Ubi-1 promoter) for plant selection, rice actin-
1 promoter to control the expression of inserted GOI, CaMV 35S and nopaline synthase (NOS)
terminators.

Chapter 6
192
6.2.2 Identity verification of plasmid vectors
Colony PCR and/or analytical/diagnostic restriction digestion were performed to verify
the identity of the Gateway® entry vector carrying AtNDB2 gene, the Gateway® entry
vector carrying AtAOX1a and the pIPKb003 overexpression vector before being used
in Gateway LR cloning reaction.
6.2.2.1 Identity verification of Gateway® entry clone carrying AtAOX1a
Gateway® entry clones carrying the AtAOX1a gene maintained in E. coli strain DH5α
cells, were streaked on LB selection plates supplemented with 25 µg/ml of gentamycin
and incubated at 37oC for 16-20 hrs. Several single colonies were selected and colony
PCR was performed with gene-specific primers (Section 2.2.6). PCR positive colonies
were used to establish 10 ml LB liquid cultures in Falcon tubes and incubated
overnight at 37oC with shaking. Plasmid DNA was isolated and purified as described
in Section 2.2.7 and plasmid identity was verified by diagnostic restriction digestion
(Section 2.2.8) with BseR1. Digests were run on 0.8% agarose gel and compared with
expected DNA fragment pattern. Cut sites and length of expected DNA fragments
were determined using NEB Cutter V2.0 (http://tools.neb.com/NEBcutter2/).
6.2.2.2 Identity verification of Gateway® entry clone carrying AtNDB2
Gateway® entry clones carrying the AtNDB2 gene maintained in E. coli strain DH5α
cells, were streaked on LB plates supplemented with 25 µg/ml of kanamycin and
incubated at 37oC for 16-20 hrs. Several single colonies were selected and colony
PCR was performed with gene-specific primers (Section 2.2.6). PCR positive colonies
were used to establish 10 ml LB liquid cultures in Falcon tubes and incubated
overnight at 37oC with shaking. Plasmid DNA was isolated and purified as described
in Section 2.2.7 and plasmid identity was verified by diagnostic restriction digestion
(Section 2.2.8) with EcoRV. Products were run on 0.8% agarose gel and compared
with the expected banding pattern determined by NEB Cutter V2.0
(http://tools.neb.com/NEBcutter2/).

Chapter 6
193
6.2.2.3 Identity verification of pIPKb003 overexpression vector
The pIPKb003 (Acc. EU161569) plasmid vector maintained in E.coli strain in DB3.1
cells was streaked on to LB selection media plates containing 50 µg/ml spectinomycin
and incubated at 37oC for 16-20 hrs. Several single colonies were selected and 10 ml
LB liquid cultures in Falcon tubes were inoculated and incubated overnight at 37oC
with shaking. Plasmid DNA was isolated and purified as described in Section 2.2.7
and plasmid was digested (Section 2.2.8) with Pst1 and products were visualized on
0.8% agarose gel. Identity of the plasmid DNA was verified by comparing the resulted
DNA banding pattern with the expected banding pattern determined by NEB Cutter
V2.0 (http://tools.neb.com/NEBcutter2/).
6.2.3 Generation of genetic constructs via LR cloning
LR cloning (Section 2.2.10) was performed to transfer the Arabidopsis salt-responsive
AtAOX1a gene from the Gateway® entry clone into the pIPKb003 binary vector and
to generate a Gateway® overexpression clone carrying an AtAOX1a gene
(Figure 6.6). E.coli strain DH10B cells were transformed with the plasmid construct
through electroporation (Section 2.2.11). Resulting DH10B cells were grown on LB
selection media plates containing 100 µg/ml of spectinomycin at 37oC to select single
transformed colonies. Colony PCR was performed with gene-specific primers with
selected colonies (Section 2.2.6) and confirmed the presence of the AtAOX1a genetic
construct. LB liquid cultures in 10 ml Falcon tubes were inoculated with colony PCR
positive cells and incubated at 37oC with shaking. Plasmid DNA was isolated and
purified as described in Section 2.2.7. Identity of plasmid DNA was verified by
diagnostic restriction digestion with PstI run on 0.8% agarose gel and by sequencing
with vector-specific forward and reverse primers (Section 2.2.13). The same
procedure was carried out to generate and to verify identity of the Gateway®
overexpression clone carrying AtNDB2 gene (Figure 6.7). Identity validated plasmid
constructs were maintained in glycerol stocks at -80oC for future use.

Chapter 6
194
6.2.4 Generation of transgenic rice carrying AtAOX1a and AtNDB2
6.2.4.1 Callus induction and proliferation
Embryogenic callus (scutellum-derived callus) was generated from mature seeds of
O. sativa L spp japonica cv Nipponbare using N6D medium (Appendix E). Seeds were
dehusked and surface sterilized following the steps described in Section 2.1.2. The
sterilized seeds were inoculated, facing embryo up, on callus induction (N6D) medium
solidified with 0.4% Gelrite and incubated under continuous light at 32oC for 2 weeks.
Proliferating calli arising from the scutellum were transferred to fresh N6D medium
and allowed to grow for a further week before being used in the transformation
process.
6.2.4.2 Production and selection of transgenic rice carrying AtAOX1a
Agrobacterium-mediated rice transformation was carried out following the methods
described by Hiei et al. (1997) and Toki (1997) with minor modifications.
Agrobacterium strain, AGL1, harbouring the pIPKb003+AtAOX1a expression clone
(Figure 6.6), was cultured on AB medium (Appendix E) supplemented with 20 µg/mg
rifampicin and 100 µg/mg spectinomycin solidified with 1.5% agar and incubated for
3 days at 30oC in the dark. One large loop of Agrobacterium culture was scraped from
the plates and suspended in AAM medium (Appendix E) to yield an OD600 of
approximately 0.1. Proliferating calli were immersed in the Agrobacterium suspension
by gentle shaking for 1.5 min, then calli were blotted dry with a sterilized filter paper
to remove excess bacteria.
These calli were transferred on to a sterilized filter paper (9 cm diameter) that had
been moistened with 0.5 ml of AAM medium and placed on 2N6-AS medium
(Appendix E) solidified with 0.4% Gelrite. After 3 days of co-cultivation at 25oC in the
dark, calli were washed five times in sterilized water and then washed once in
sterilized water containing 150 µg/ml timentin to suppress the growth of
Agrobacterium. The calli were rapidly blotted dry on a sterilized filter paper and further

Chapter 6
195
cultured on N6D selection medium containing 50 µg/ml hygromycin B (to select
transformed calli) and 150 µg/ml timentin (to suppress the growth of Agrobacterium)
under continuous light at 32oC for 2 weeks. Healthy proliferating calli were transferred
to regeneration medium (Appendix E) containing 50 µg/ml hygromycin B and 150
µg/ml timentin for plantlet regeneration. Individual plantlets were acclimatized in tap
water for a day at room temperature before being transferred to soil. Confirmation of
transgene integration into the rice genome was done by performing PCR (Section
2.2.2) using rice genomic DNA isolated from T0 plants; and the expression of the gene
of interest (AtAOX1a) in rice plants was confirmed by performing RT-PCR (Section
2.2.5) with cDNA synthesized from RNA isolated from T0 plants. In both PCR and
RT-PCR reactions, gene-specific primers were used (Table 2.1).
6.2.4.3 Production and selection of transgenic rice carrying AtNDB2
The same procedure was followed as described in Section 6.2.4.2 to generate
AtNDB2 transgenes starting with Agrobacterium strain, AGL1, harbouring the
pIPKb003+AtNDB2 expression clone (Figure 6.7). The integration of the transgene
into the rice genome was confirmed by performing PCR (Section 2.2.2) using rice
genomic DNA isolated from T0 plants and the expression of the gene of interest
(AtNDB2) in rice plants was confirmed by performing RT-PCR (Section 2.2.5) with
cDNA synthesized from RNA isolated fromT0 plants. In both PCR and RT-PCR
reactions the same gene-specific primers were used (Table 2.1).
6.2.5 Segregation analysis of putative T1 transgenic rice
The inheritance of the gene of interest (AtAOX1a or AtNDB2) into the T1 generation
was tested by performing PCR (Section 2.2.2) with genomic DNA isolated from leaves
of T1 plants with respective gene-specific primers. In order to perform Mendelian
segregation analysis, the number of PCR positive plants was counted and Mendelian
inheritance pattern was evaluated by the Chi-square test (Goodness of Fit test) at
0.05 probability level.

Chapter 6
196
6.2.6 Evaluation of transgenic rice carrying AtAOX1a or AtNDB2 genes under salt stress
Evaluation of transgenic rice under salt stress was done by applying NaCl (30 mM) to
growing seedlings at their panicle initiation stage. Three independent transgenic lines
from each transgenic rice group (plants carrying AtAOX1a or AtNDB2) were selected
for the evaluation studies. T1 transgenic rice seeds were surface sterilized and
germinated on wet filter papers in Petri dishes as described in Section 2.1.2.
Approximately 10 days after sowing, healthy seedlings were transferred to 180 mm
plastic pots containing potting mix supplemented with Osmocote fertilizer which
consisted of N, P, K (19.4 : 1.6 : 5) and other trace elements (Scotts Australia Pty
Ltd). The pots were placed in containers filled with tap water (∼2–3 cm below the soil
level in pots) and allowed to grow to maturity. Then the pots were transferred to big
plastic tanks filled with half strength nutrient/growth medium (Section 2.1.3) and
allowed to grow several weeks while maintaining the nutrient medium level ∼2 cm
above the soil level (Figure 6.4). Water level was topped up with tap water and new
growth medium was added weekly. Salt application was started when panicle
emergence was noticed in 4-5 plants. Salt was applied into the surrounding nutrient
solution in two increments (15 mM each time, the 2nd application was done 2 days
after the first) to reach the final concentration of 30 mM and maintained up to one
month. During the salt application period, the water level in tanks was maintained by
adding tap water. Leaf samples were collected for the measurement of Na+ and K+
content after one month of salt application and ion contents were measured as
described in Section 2.1.4.

Chapter 6
197
Figure 6.4 Experimental set up for the evaluation of transgenic rice under salinity stress in controlled (greenhouse) conditions
30 mM NaCl was applied to seedlings at their panicle initiation stage and they were allowed
to grow under salt-stressed conditions for one month. Then the seedlings were released from
the stress and grown under normal conditions until maturity. Data related to yield
performances were recorded at harvesting.
After one month of treatment, salt solution was replaced with half strength nutrient
solution and seedlings were allowed to grow until harvesting time. In the meantime,
the water level in tanks was maintained as explained above and fresh nutrient medium
was added weekly. The number of panicles per plant, number of tillers per plant,
number of filled and unfilled (empty) seeds per panicle and seed weight per panicle,
were recorded at harvesting to evaluate the effect of salt stress on plant growth and
seed yield.

Chapter 6
198
6.3 Results
6.3.1 Identities of Gateway® entry clones and pIPKb003 overexpression vector were confirmed by both colony PCR and diagnostic restriction digestion
Before starting molecular cloning of Arabidopsis salt-responsive genes into the
pIPKb003 overexpression vector, the identity of all plasmid vectors was verified by
colony PCR and/or analytical/diagnostic restriction digestion. Gateway® entry clones
carrying AtAOX1a were digested with BseR1 (GAGGAG(N)8 NN ) while the AtNDB2
entry clone was digested with EcoRV (GAT ATC). As determined by NEB Cutter V2.0
(http://tools.neb.com/NEBcutter2/), digestion of the AtAOX1a entry clone plasmid
DNA resulted in three DNA fragments of 2864 bp, 1281 bp and 290 bp, confirming
the identity of plasmid DNA (Figure 6.5 A). The AtNDB2 entry clone contained only
one EcoRV cut site, which resulted in one DNA fragment when digested products
were run on the 0.8% agarose gels (Figure 6.5 B). Digestion of the overexpression
vector (pIPKb003) with PstI resulted in the expected band pattern, confirming the
presence of correct plasmid DNA of pIPKb003 (Figure 6.5 C). The pIPKb003
overexpression vector backbone has six cut sites for PstI (C TGCA G) and resulted
in six DNA fragments at lengths of 9027 bp, 1591 bp, 1501 bp, 921 bp, 452 bp and
366 bp, as determined by NEB Cutter V2.0 (http://tools.neb.com/NEBcutter2/). These
verified plasmid DNAs were used to generate overexpression/destination clones
carrying salt-responsive Arabidopsis AtAOX1a or AtNDB2 overexpression clones
(Figure 6.6 or 6.7) via Gateway LR reaction.

Chapter 6
199
(A)
(B)
(C)
Resulted DNA band pattern Predicted DNA band pattern
Figure 6.5 Diagnostic restriction digests of entry clones and pIPKb003 overexpression vector used to generate genetic constructs
A: Digests of AtAOX1a entry clone run on 0.8% agarose gel. Lane M: molecular weight marker
in bp; Lane 1-4: plasmid DNA from four different single bacterial colonies carrying AtAOX1a
entry clone cut with BseR1.
B: Digests of AtNDB2 entry clone run on 0.8% agarose gel. Lane M: molecular weight marker
in bp; Lane 1-4: plasmid DNA from four different single bacterial colonies carrying AtNDB2
entry clone cut with EcoRV.
C: Digests of pIPKb003 empty overexpression vector. Lane M: molecular weight marker in bp;
Lane 1–4: plasmid DNA from four different single bacterial colonies carrying empty pIPKb003
overexpression vector cut with PstI. Cut sites and lengths of expected DNA fragments were
determined using NEB Cutter V2.0 (http://tools.neb.com/NEBcutter2/).
PstI

Chapter 6
200
6.3.2 Identities of genetic constructs carrying Arabidopsis salt-responsive genes were confirmed by colony PCR, diagnostic restriction digestion as well as by sequencing
The identity of both genetic constructs was verified initially by colony PCR, analytical
restriction digestion and finally by sequencing prior to the transformation for
confirmation of fidelity. AtAOX1a and AtNDB2 from Arabidopsis were cloned into
pIPKb003 overexpression vector via Gateway® LR reactions. E. coli strain DH10B
cells were transformed with plasmid constructs resulting from LR cloning, via
electroporation. Transformed E. coli cells carrying plasmid DNA with either AtAOX1a
or AtNDB2 resulted in single colonies when cultured on LB selection plates
supplemented with 100 µg/ml of spectinomycin. Initially, colony PCR was carried out
to select bacterial colonies carrying AtAOX1a or AtNDB2 gene with the relevant gene-
specific primers. Colony PCR positive single colonies were selected for further
verification with diagnostic restriction digestion and sequencing. Digestion of AtNDB2
overexpression clone plasmid DNA with PstI resulted in 5 bands with sizes of 9027
bp, 2144 bp, 1501 bp, 921 bp, and 366 bp as determined by NEB Cutter V2.0
(http://tools.neb.com/NEBcutter2/) confirming the identity of the AtNDB2
overexpression clone (Figure 6.8 A). Digestion of the AtAOX1a overexpression clone
plasmid DNA with PstI resulted in 5 bands with sizes of 9027 bp, 1501 bp, 1460 bp,
921 bp and 366 bp as expected, verifying its identity (Figure 6.8B). Complete CDS of
both genes of interest were sequenced with both vector-specific forward and reverse
primers. The resulting sequences further confirmed the insertion of the correct CDS
sequences of AtAOX1a or AtNDB2 into the relevant overexpression clones.
Overexpression clones in which the identity of the whole CDS sequence was verified
by sequencing, were used to transform rice embryogenic calli through Agrobacterium-
mediated transformation.

Chapter 6
201
Figure 6.6 Schematic representation of AtAOX1a overexpression/destination clone (created with PlasMapper 2.0 (http://wishart.biology.ualberta.ca/PlasMapper/)
CDS sequence of Arabidopsis AOX1a gene was inserted into the pIPKb003 overexpression
vector replacing the GATEWAY destination cassettes, R1 (attR1 recombination attachment
site), CmR (chloramphenicol acetyltransferase gene), ccdB (negative selection marker), and
R2 (attR2 recombination attachment site) sequences, during LR reaction. Identity verified
AtAOX1a overexpression/destination clones were used for the subsequent Agrobacterium-
mediated transformation of rice embryogenic calli.

Chapter 6
202
Figure 6.7 Schematic representation of AtNDB2 overexpression/destination clone (created using PlasMapper 2.0 (http://wishart.biology.ualberta.ca/PlasMapper/)
CDS sequence of Arabidopsis NDB2 gene was inserted into the pIPKb003 overexpression
vector replacing the GATEWAY destination cassettes, R1 (attR1 recombination attachment
site), CmR (chloramphenicol acetyltransferase gene), ccdB (negative selection marker), and
R2 (attR2 recombination attachment site) sequences, during LR reaction. Identity verified
AtNDB2 overexpression/destination clones were used for the subsequent Agrobacterium-
mediated transformation of rice embryogenic calli.

Chapter 6
203
(A)
(B)
Resulted DNA band pattern Predicted DNA band pattern
Figure 6.8 Diagnostic restriction digests to confirm the identity of genetic constructs/destination clones used in Agrobacterium transformation of rice
A: Digests of AtNDB2 overexpression clone run on 0.8% agarose gel. Lane M: molecular
weight marker in bp; Lane 1-4: plasmid DNA from 4 different single bacterial colonies carrying
AtNDB2 cut with PstI; Lane 5: pIPKb003 empty vector plasmid DNA cut with PstI
B: Digests of AtAOX1a overexpression clone run on 0.8% agarose gel. M: molecular weight
marker in bp; Lane 1-4: plasmid DNA from 4 different single bacterial colonies carrying
AtAOX1a cut with PstI; Lane 5: pIPKb003 empty vector plasmid DNA cut with PstI
Cut sites and length of expected DNA fragments were determined using NEB Cutter V2.0
(http://tools.neb.com/NEBcutter2/). Insertion of complete CDS sequences of AtNDB2 or
AtAOX1a genes into genetic constructs were further confirmed by sequencing with
vector-specific forward and reverse primers. Identity verified genetic constructs were used in
the Agrobacterium-mediated transformation of rice.

Chapter 6
204
6.3.3 Transgenic rice carrying Arabidopsis salt-responsive genes were generated and confirmed by PCR
Nipponbare mature seeds inoculated on N6D medium and grown for about 2-3 weeks
at 32oC and continuous light showed callus induction rates of 100%. There was no
contamination of in-vitro cultures during the process. Induced calli were transferred to
fresh N6D medium after two weeks for further proliferation and these secondary calli
were used for transformation. Non-transformed calli turned brown and black while
transformed calli further grew into globular white and yellowish calli in the medium
supplemented with hygromycin B which then regenerated into plantlets (Figure 6.9).
Seven independent transgenic lines (generated from seven independently infected
calli) with the AtAOX1a transgene and 22 independent transgenic lines (generated
from 22 independently infected calli) with the AtNDB2 transgene, were generated with
11.7% and 36.7% transformation efficiency (calculated as the number of regenerated
T0 plants recovered on hygromycin (later confirmed with PCR) and grown to maturity
divided by the original number of callus infected by respective AGL1 x 100),
respectively. A total of 32 putative transgenic plants carrying AtAOX1a and 107
putative transgenic plants carrying AtANDB2 were produced during the study.

Chapter 6
205
Figure 6.9 Steps in generation of transgenic rice through tissue culture
A: Callus induction from rice scutellum on N6D medium B: Proliferating calli growing on
N6D selection medium containing 50 µg/ml of hygromycin after infection with Agrobacterium
strain AGL1 habouring the AtNDB2 genetic construct. C: Successfully transformed calli were
further proliferated and formed globular white/yellowish calli and regenerated transgenic rice
seedlings. Non-transformed calli were turned brown/black and failed to generate seedlings.
D: Transgenic rice at seedling stage E: Transgenic rice bearing mature panicles.

Chapter 6
206
6.3.3.1 Integration and expression of transgenes in T0 plants were confirmed by PCR and RT-PCR
The integration of AtNDB2 and AtAOX1a into the rice genome was confirmed by
performing PCR with respective gene-specific primers (Figures 6.10A and B). The
expression of AtAOX1a or AtNDB2 genes in T0 plants were examined by RT-PCR
and results showed that 100% of PCR positive transgenic lines have the gene of
interest expressed in both AtAOX1a and AtNDB2 transgenic lines (Figures 6.11A and
B). Only PCR and RT-PCR positive plants were used for further seed production
Figure 6.10A Representative gel images showing PCR analyses of T0 plants carrying AtNDB2 to confirm the presence of transgene
PCR was performed with gDNA isolated from leaves of T0 plants and with AtNDB2 gene-
specific primers at 62oC annealing temperature for 37 cycles. M: 100 bp molecular weight
marker; WT: gDNA from wild type Nipponbare; +ve: positive control (plasmid DNA from
AtNDB2 destination clone).
Figure 6.10B Representative gel image showing PCR analyses of T0 plants carrying AtAOX1a to confirm the presence of transgene
PCR was performed with gDNA isolated from leaves of T0 plants and with AtAOX1a gene-
specific primers at 62oC annealing temperature for 39 cycles. M: 100 bp molecular weight
marker; WT: gDNA from wild type Nipponbare; +ve: positive control (plasmid DNA from
AtAOX1a destination clone).

Chapter 6
207
Figure 6.11A Representative gel image showing expression analyses of T0 plants carrying AtNDB2 to confirm the expression of transgene
The cDNAs were synthesized from total RNA extracted from leaf tissues of T0 plants and used
as templates for RT-PCR analyses. RT-PCR was performed with AtNDB2 gene-specific
primers at 62oC annealing temperature for 37 cycles. M: 100 bp molecular weight marker; WT:
cDNA from wild type Nipponbare; +ve: positive control (plasmid DNA from AtNDB2 destination
clone).
Figure 6.11B Representative gel image showing expression analyses of T0 plants carrying AtAOX1a to confirm the expression of transgene
The cDNAs were synthesized from total RNA extracted from leaf tissues of T0 plants and used
as templates for RT-PCR analyses. RT-PCR was performed with AtAOX1a gene-specific
primers at 62oC annealing temperature for 39 cycles. M: 100 bp molecular weight marker; WT:
cDNA from wild type Nipponbare; +ve: positive control (plasmid DNA from AtAOX1a
destination clone).

Chapter 6
208
6.3.3.2 The majority of transgenic rice lines showed normal phenotype similar to wild type under normal growth conditions
The transgenic plants expressing Arabidopsis salt-responsive AtAOX1a or AtNDB2
genes were grown under normal growth conditions in a PC2 greenhouse to reveal
any differences in morphology between the plants at the seedling and the reproductive
stages. Out of 22 independent lines of AtDNB2 transgenic rice, 4 lines (~18%) were
completely sterile. Almost all fertile transgenic lines showed a normal phenotype very
similar to their wild type (WT) under normal growth conditions at both developmental
stages, vegetative and reproductive. Seedlings from some lines showed undesirable
panicle characteristics, such as less number of filled seeds per a panicle and bearing
panicles with seeds at different developmental stages compared to the WT
(Figure 6.12A). Out of 7 lines of AtAOX1a transgenic rice, 2 lines (~28%) were
complete sterile and produced only empty seeds. Fertile lines of AtAOX1a transgenic
rice didn’t show any significant growth difference when compared to their WT during
seedling stage but during reproductive stage, production of albino seeds in a panicle
was observed in one plant from AtAOX1a transgenic group (Figure 6.12B). But with
the maturity panicle became normal (Figure 6.12C). As observed in AtNDB2 lines,
panicles with less number of seeds and the presence of seeds with mature and
immature stage in panicles were common to AtAOX1a transgenic lines also. Other
than the above-mentioned abnormalities, the majority of plants grew without apparent
phenotypic variations and produced viable seeds for further studies (Figure 6.12D).

Chapter 6
209
Figure 6.12 Phenotypes of transgenic rice plants transformed with Arabidopsis alternative pathway genes, AOX1a and NDB2
A: Panicles with seeds at different developmental stages, matured, browned and immature,
green – observed in both types of transgenic plants B and C: Albino seeds were observed in
an immature panicle from an AtAOX1a inserted plant and then turned into normal with maturity
D: Majority of plants grew without showing any apparent phenotypic variations from the wild
type Nipponbare and produced seeds for further studies.

Chapter 6
210
6.3.4 Inheritance of transgenes into T1 generation was confirmed by PCR analysis
The three best performed (those that produced the highest number of healthy seeds)
independent lines from each transgenic group (AtAOX1a or AtNDB2 inserted) were
selected for further analyses. During seed germination, one AtAOX1a inserted line
(NB_ATAOX1a_2_4 – not used for further analysis) showed 26.8% of albino plant
production indicating potential somaclonal changes during tissue culture or
destruction of genes related to chlorophyll biosynthesis during the insertion of the
transgene into the rice genome. Other than that the growth and development of plants
didn’t show any distinguishable change in their phenotype under normal growth
conditions compared to WT.
PCR was performed with respective gene-specific primers and gDNA from leaves
from T1 plants as template to confirm the inheritance of transgenes into T1 plants
(Figures 6.13 and 6.14) and for segregation analysis.
Figure 6.13 Representative gel images showing PCR analyses of T1 plants carrying AtNDB2 to confirm the presence of transgene
PCR was performed with gDNA isolated from leaves of T1 plants and with AtNDB2 gene-
specific primers at 62oC annealing temperature for 37 cycles. M: 100 bp molecular weight
marker; WT: gDNA from wild type Nipponbare; +ve: positive control (plasmid DNA from
AtNDB2 destination clone); -ve: negative control (water); empty lanes with gDNA represent
null segregants.

Chapter 6
211
Figure 6.14 Representative gel images showing PCR analyses of T1 plants carrying AtAOX1a to confirm the presence of transgene
PCR was performed with gDNA isolated from leaves of T1 plants and with AtAOX1a gene-
specific primers at 62oC annealing temperature for 39 cycles. M: 100 bp molecular weight
marker; WT: gDNA from wild type Nipponbare; -ve: negative control (water); +ve: positive
control (plasmid DNA from AtAOX1a destination clone); empty lanes with gDNA represent null
segregants.
Table 6.1 Segregation analysis of T1 generation of AtNDB2 and AtAOX1a transgenic lines based on PCR
Transgenic line Total no. of
plants tested No. of plants
PCR +ve No. of null- segregants
X2 value
NB_AtNDB2_1_3 24 22 2 3.56*
NB_AtNDB2_10_2 22 19 3 1.52*
NB_AtNDB2_13_2 24 18 6 0*
NB_AtAOX1a_1_6 22 13 9 2.97*
NB_AtAOX1a_5_1 24 8 16 22.22
NB_AtAOX1a_6_1 19 5 14 24.02
* accept the Null hypothesis, data fit 3:1 segregation ratio df=1, p<0.05

Chapter 6
212
Segregation analyses based on PCR results showed a range of segregation ratios
(Table 6.1). However, the results showed that all three lines from AtNDB2 insertions
showed Mendelian segregation of 3:1 suggesting single gene insertion. Out of three
lines with AtAOX1a insertion, only one line showed 3:1 Mendelian segregation fashion
while the other two lines had segregation in T1 generation suggesting more complex
integration (Table 6.1).
6.3.5 Transgenic rice showed a tendency towards the improvement of grain yield under salinity stress
Segregating T1 seeds produced by T0 parent lines were used as the starting material
for the evaluation studies on transgenic rice carrying AtNDB2 or AtAOX1a. T1 seeds
were germinated on wet filter papers and healthy plants were transferred to soil and
allowed to grow until panicle initiation stage. In the meantime, the presence of the
transgene was determined by performing PCR with gDNA isolated from leaves of
growing seedlings. The effect of 30 mM NaCl on further growth of transgenic plants
was evaluated in terms of seed production compared to the wild type Nipponbare and
the relevant null-segregants grown at the same time under the same growth
conditions as the transgenic lines. Three selected lines from each transgenic rice
group (transgenes carrying AtNDB2 or AtAOX1a) were evaluated.
Growth and yield analysis of transgenic plants in the T1 generation demonstrated that
there was a significant reduction in the number of empty seeds produced per plant in
one of transgenic lines carrying AtAOX1a (NB_ATAOX1a_1_6) compared to the salt-
stressed WT Nipponbare. But, it was non-significant reduction compared to their null-
segregants (Table 6.2). Though the transgenic line carrying AtAOX1a also showed
an increase in number of filled seeds produced per plant compared to both controls
(WT and null-segregants), it was not significant. Likewise, there was a non-significant
increase of seed weight per plants compared to both controls, WT and null-segregants
(Table 6.2). Though it is hard to come to a firm conclusion with the results obtained
from a still segregating population, there appears to be a trend of improved seed yield

Chapter 6
213
in transgenic rice lines carrying AtAOX1a genes under the tested salt stress compared
to their controls.
There were two lines from the transgenic rice group carrying AtNDB2
(NB_AtNDB2_1_3 and NB_AtNDB2_10_2) which recorded a significant reduction of
empty seeds produced per plant compared to WT. Interestingly, one of these
transgenic lines (NB_AtNDB2_1_3) showed this significant reduction compared to
both controls, WT and null-segregants suggesting that the change is not merely
because of a change which occurred during the tissue culture process but due to the
inserted gene (Table 6.2). Two transgenic lines carrying the AtNDB2
(NB_AtNDB2_1_3 and NB_AtNDB2_13_2) recorded a higher seed weight as well as
higher number of filled seeds per plant compared to those of WT, while the transgenic
line NB_AtNDB2_10_2 showed a lower seed weight per plant which resulted from the
lower number of filled grains produced per plant compared to that of WT (Table 6.2).

Chapter 6
214
Table 6.2 Growth and yield analysis of transgenic lines carrying Arabidopsis salt-responsive genes AtAOX1a or AtNDB2 under 30 mM NaCl stress applied with the start of panicle initiation Seedlings were grown under stress for one month and corresponding wild type (WT) and null-segregants (Nulls) were used as controls. Data represent means of 5-9 biological replicates ± SEM. * and ** indicate significant difference from the WT/Nulls (salt-treated) or from both salt-treated WT and Nulls respectively at p<0.05 by Student’s t-test.
No. of tillers/plant No. of panicles/plant No. of filled grains/plant No. of empty grains/plant grain weight/plant (g)
non-salt salt non-salt salt non-salt salt non-salt salt non-salt salt
NB_AtAOX1a_1_6 12.40 ± 2.93 9.33 ± 2.09 10.60 ± 2.84 7.00 ± 1.57 66.40 ± 16.10 22.50 ± 4.26 166.20 ± 36.18 99.17 ± 15.53* 1.25 ± 0.31 0.41 ± 0.07
NB_AtAOX1a_5_1 5.50 ± 2.50 13.00 ± 1.22 5.00 ± 2.00 9.75 ± 1.25 34.00 ± 7.00 54.50 ± 13.23 74.50 ± 23.50 154.50 ± 34.65 0.87 ± 0.14 1.05 ± 0.26
NB_AtAOX1a_6_1 11.67 ± 2.33 6.50 ± 1.50 8.00 ± 1.15 6.00 ± 2.00 59.00 ± 18.72 26.50 ± 9.50 197.33 ± 47.42 120.00 ± 34.00 1.18 ± 0.40 0.47 ± 0.15
Nulls 12.67 ± 1.57 9.33 ± 1.26 9.22 ± 1.39 6.67 ± 0.87 45.67 ± 2.81 19.44 ± 5.74 178.00 ± 37.90 131.56 ± 23.90 0.79 ± 0.04 0.37 ± 0.11
WT 6.50 ± 1.32 7.80 ± 0.97 6.00 ± 1.22 7.20 ± 0.97 88.25 ± 14.94 16.60 ± 8.12 95.00 ± 19.85 150.80 ± 23.29 1.92 ± 0.23 0.28 ± 0.12
NB_AtNDB2_1_3 8.43 ± 1.34 7.71 ± 0.97 7.00 ± 0.69 6.29 ± 0.78 78.14 ± 13.96 30.43 ± 6.78 101.14 ± 14.89 106.67 ± 14.22** 1.59 ± 0.30 0.62 ± 0.14
NB_AtNDB2_10_2 12.83 ± 2.39 11.43 ± 1.59 9.50 ± 1.98 6.86 ± 1.26 32.17 ± 6.01 13.57 ± 4.77 137.20 ± 26.66 127.00 ± 17.18* 0.63 ± 0.12 0.25 ± 0.09
NB_AtNDB2_13_2 14.13 ± 1.39 24.00 ± 4.93 12.00 ± 1.25 11.25 ± 2.17 58.75 ± 12.14 48.00 ± 15.43 232.88 ± 20.81 202.25 ± 41.98 1.17 ± 0.26 0.98 ± 0.34
Nulls 17.75 ± 5.15 12.00 ± 2.97 15.50± 4.94 9.50 ±2.50 83.25 ± 28.76 46.00 ± 16.67 230.33 ± 94.12 211.33 ± 36.27 1.68 ± 0.55 0.95± 0.37
WT 6.50 ± 1.32 7.80 ± 0.97 6.00 ± 1.22 7.20 ± 0.97 88.25 ± 14.94 16.60 ± 8.12 95.00 ± 19.85 150.80 ± 23.29 1.92 ± 0.23 0.28 ± 0.12

Chapter 6
215
Comparison of Na+ and K+ accumulation in leaves didn’t show any significant
differences among transgenic lines and their controls (Table 6.3). Almost similar K+
concentrations were recorded from all transgenic lines except NB_AtNDB2_13_2 line
which recorded lower concentration of 0.476 mmol/g DW. But, there was a tendency
of decreased accumulation of Na+ in transgenic lines from both transgenic groups
compared to their controls.
Table 6.3 Leaf Na+ and K+ accumulation in seedlings grown under 30 mM NaCl stress for one month Salt stress was applied when seedlings were at panicle initiation stage. Data represent mean ± SEM of 5-9 biological replicates.
Transgenic line Na+ (mmol/g DW) K+ (mmol/g DW)
NB_AtAOX1a_1_6 0.025 ± 0.014 0.781 ± 0.070
NB_AtAOX1a_5_1 0.029 ± 0.014 0.785 ± 0.049
NB_AtAOX1a_6_1 0.005 ± 0.001 0.702 ± 1.00
Nulls 0.042 ± 0.003 0.731 ± 0.048
WT 0.097 ± 0.048 0.613 ± 0.143
NB_AtNDB2_1_3 0.010 ± 0.001 0.813 ± 0.036
NB_AtNDB2_10_2 0.025 ± 0.016 0.818 ± 0.032
NB_AtNDB2_13_2 0.013 ± 0.005 0.476 ± 0.037
Nulls 0.143 ± 0.031 0.791 ± 0.234
WT 0.097 ± 0.048 0.613 ± 0.143

Chapter 6
216
6.4 Discussion
The current study succeeded in obtaining regenerated transformed plants of rice
cultivar Nipponbare carrying salt-responsive AtAOX1a or AtNDB2 via Agrobacterium-
mediated transformation using secondary calli derived from the scutellum of mature
seeds. Numerous reports are available on the use of Agrobacterium-mediated
transformation to generate transgenic rice for functional analysis of genome or crop
improvement Hiei and Komari (2008) reported that the Agrobacterium-mediated
transformation technique was used in more than 80% of studies out of 300
publications which were focused on transformation of rice. Agrobacterium-mediated
transformation has become more popular than other techniques because of the high
efficiency of transformation and integration of small numbers of copies of transfer DNA
(T-DNA) into the chromosome (Hiei and Komari, 2008). In the present study,
transgenic lines carrying AtAOX1a showed lower transformation frequency of 11.7%
compared to that for transgenic lines carrying AtNDB2 (36.7%). However, both
transgenic groups produced a number of independent transgenic lines (7 carrying
AtAOX1a and 22 carrying AtNDB2), which ultimately produced sufficient seedlings
and then seeds for subsequent studies. A range of factors contribute to the
transformation efficiency of plants, including genotype, composition of the medium,
gelling agents, strength of antibiotic used and exposure time of calli to the antibiotic,
conditions for co-cultivation, starting material etc.(Hiei et al., 1994; Hiei et al., 1997;
Opabode, 2006). However, Agrobacterium-mediated transformation of three different
japonica varieties, Tsukinohikari, Asanohikari and Koshihikari resulted in 10-30% of
transformation efficiency when scutellum derived secondary calli were used as the
starting material (Hiei et al., 1994) which is comparable with my results. In contrast,
Toki et al. (2006) has established an efficient Agrobacterium-mediated transformation
system for rice cultivar Nipponbare with 95-98% transformation efficiency using
scutellum derived primary calli.

Chapter 6
217
The occurrence of somaclonal variation is one of the drawbacks of tissue culture
techniques due to in-vitro culture of dedifferentiated cells in artificial culture media for
prolonged periods (Hirochika et al., 1996; Toki et al., 2006). Toki et al. (2006)
suggested that these genetic changes could be minimized by shortening the period
of tissue culture. They established an efficient rice transformation system by early
infection of rice scutellum tissue with Agrobacterium harbouring genes of interest,
which induced rapid proliferation of calli and thereby minimized the length of tissue
culture phase. During the current study, the same methodology was followed to see
if transformed plants could be obtained using primary calli derived from mature seeds
of Nipponbare and 5-day-old calli were infected with Agrobacterium harbouring genes
of interest (AtAOX1a or AtANDB2). However, calli didn’t grow further when transferred
on to N6D selection medium supplemented with 50 µg/ml hygromycin and 150 µg/ml
timentin. Therefore, the early infection of rice scutellum suggested by Toki et al.
(2006) was not successful during the current study.
Detailed analysis of the cloned gene sequences by PCR, analytical restriction digests
and sequencing, confirmed the amplification and recombination of the transgenes
(AtAOX1a or AtNDB2) into the destination vector plasmids was complete and error
free. Transgenic plant lines were successfully generated from the molecular cloning
and transformation of rice callus tissue with these constructs containing AtAOX1a or
AtNDB2 driven by the rice actin-1 constitutive promoter. The presence and expression
of transgenes in the T0 plants was confirmed by PCR and RT-PCR with the relevant
gene-specific primers. Although the regenerated T0 plants didn’t show any other
apparent phenotypic abnormalities, completely sterile lines were observed in both
transgenic groups. The transgenic lines carrying AtAOX1a produced ~28% sterile
lines while the transgenic lines carrying AtNDB2 produced ~18% sterile lines.
Similarly, a variation in fertility from completely sterile to fully fertile was observed in
regenerated rice plants from cultivars, Tsukinohikari, Asanohikari and Koshihikari

Chapter 6
218
(Hiei et al., 1994). In contrast, transgenic rice regenerated from indica rice showed
similar fertility as non-transformed plants (Rashid et al., 1996).
Although, the selection on the antibiotic containing media ensured the presence of at
least one copy of the construct harbouring the transgene, molecular and segregation
analysis could give the copy number of each line. The inheritance and the presence
of transgenes in the T1 generation was confirmed by PCR with gene-specific primers.
The majority of transgenic lines showed a clear segregation of PCR-positive and
PCR-negative plants following Mendelian segregation fashion of 3:1 suggesting
single copy insertion. However, two lines carrying the AtAOX1a transgene didn’t show
simple transmission of DNA to the T1 progeny. This pattern of segregation was also
reported by Hiei et al. (1994) in their rice transformants and they suggested that
chimerism in the T0 progeny could affect the segregation ratios. Chimerism in
transgenic tobacco plants generated via Agrobacterium-mediated transformation has
also been observed (Schmülling and Schell, 1993). Therefore, the copy number
estimates through segregation analysis can give unreliable estimates in transgenic
lines. It is worthwhile to estimate the copy number of transgene in regenerated lines
using other methods such as Southern blot or quantitative PCR on genomic DNA.
This task couldn’t be fulfilled during the current study due to time limitations.
Application of knowledge gained through model systems to improve crop productivity
using molecular biological tools is not new to the agriculture industry. Transgenic
Arabidopsis plants overexpressing AVP1, type 1 vacuolar H+ pyrophosphatase (which
is responsible for the activation of vacuolar Na+/H+ antiporters) has been shown to
improve both salinity and drought tolerance compared to wild types grown under
similar conditions (Gaxiola et al., 2001). Studies conducted to check whether the
same strategy could apply to other plant species such as barley (Schilling et al., 2014),
cotton (Pasapula et al., 2011), creeping bentgrass (Agrostis stolonifera L.) (Li et al.,

Chapter 6
219
2010b) as well as rice (Zhao et al., 2006) have shown promising results. During the
current study, an attempt was made to apply the same strategy to generate improved
rice varieties with potential salt-tolerance by cloning Arabidopsis salt-responsive
alternative respiratory genes. Transgenic Arabidopsis overexpressing AtAOX1a,
which plays a regulatory role in controlling ROS production and thereby modulating
the oxidative stress in cells, has been shown to reduce the accumulation of ROS in
Arabidopsis plant cells and improve the biomass production compared to their
controls (Smith et al., 2009). Further, altered expression of AtNDB4 in Arabidopsis
resulted in increased expression of AtAOX1a and AtNDB2 when plants were exposed
to salt stress and these plants showed lower ROS accumulation in cells compared to
their wild types (Smith et al., 2011) confirming that AtAOX1a and AtNDB2 were
playing a role in controlling ROS production in salt-stressed plants.
To test whether the overexpression of these genes could improve the performances
of rice under salt stress, transgenic rice lines expressing AtAOX1a or AtNDB2 were
generated. Preliminary performance evaluation of transgenic rice was carried out with
a still-segregating T1 population under greenhouse conditions by exposing plants to
30 mM NaCl at their panicle initiation stage. Interestingly, out of six lines tested,
3 lines (one line carrying AtAOX1a and 2 lines carrying AtNDB2) showed significant
reduction of empty seed production per plant under salt stress compared to their
controls. Also, there was a trend of increased production of filled seeds per plant,
leading to an increase in grain yield in individual plants showing potential improvement
in overall crop yield in transgenic lines compared to wild type under salt stress.
However, the potential for these genes to improve the salinity tolerance in rice needs
to be evaluated with a non-segregating population with the homozygote transgene.
It should be noted that so far, only transgenics overexpressing just a single gene have
been generated; expression of more than one gene simultaneously would be

Chapter 6
220
desirable (Gaxiola et al., 2001). A good example for this is the co-expression of
SsNHX1 (Na+/H+ antiporter) from Suaeda salsa and AVP1 from Arabidopsis in salt-
sensitive rice cultivar Zhonghua conferred higher salt-tolerance than in transgenic
plants overexpressed only SsNHX1 (Zhao et al., 2006). In Arabidopsis, when plants
were exposed to salt stress, increased co-expression of AtAOX1a and AtNDB2 was
reported (Clifton et al., 2005; Smith et al., 2009) suggesting a co-regulation of them
under abiotic stresses (Clifton et al., 2005; Elhafez et al., 2006). These findings
suggest that AtAOX1a and AtNDB2 could work together to create a favourable
environment for cell functions under stressed conditions. Therefore, the co-
expression of both AtAOX1a and AtNDB2 in rice could confer higher salt-tolerance in
transgenic plants than transgenic lines overexpressing AtAOX1a and AtNDB2
individually. This can be achieved by crossing of the single transformants in a future
study.
In summary, the current study succeeded in the development of two genetic
constructs harbouring AtAOX1a or AtNDB2 driven by the rice actin-1 promoter via
Gateway cloning and regeneration of transgenic lines carrying AtAOX1a or AtNDB2
constructs. Most of the transgenic rice lines demonstrated normal growth and
development as for non-transgenic plants while a few lines showed some deviations.
Preliminary studies on the performance evaluation under salt stress demonstrated
that transgenic lines have improved grain yield per plant under salt stress and lower
Na+ levels in shoots compared to controls suggesting overexpression of salt-
responsive AtAOX1a or AtNDB2 in rice could provide a potential option for increasing
grain production in cereals including rice under saline conditions.

Chapter 7
221
7 General discussion
The overall aim of the study was to explore whether the modifications in the alternative
pathway of plant respiration can confer tolerance to abiotic stresses in agriculturally
important crops, using rice as a model cereal. A number of molecular and
physiological approaches have been taken to achieve this target with significant
outcomes. The main objectives of this project were: identification and characterization
of alternative respiratory pathway (AP) genes in rice, screening for stress responsive
genes, exploring their expression diversity in a range of rice genotypes to
environmental stresses using high salinity as an example, and generation of
transgenic rice overexpressing stress-responsive genes and assessing their stress
tolerance and impact on seed yield.
7.1 Summary and major findings
7.1.1 Rice alternative pathway for respiration consists of AOXs and NDHs that are responsive to oxidative stress induced by the disruption of mETC
Database screening of the rice genome revealed the presence of four gene
sequences homologues to Arabidopsis AOX1-type and six sequences homologous to
NDHs. AOX2-type is absent in rice as reported in other monocots (Considine et al.,
2002). Two rice sub-species, japonica and indica shared a very high sequence
similarity as well as similar exon-intron organization, except for NDB3. Rice NDH
homologs group into three distinct families, NDA (2 genes), NDB (3 genes) and NDC
(1 gene). Out of six members, NDA2, NDB1, NDB2 are predicted to be dual targeted
to mitochondria and peroxisomes while NDC1 is predicted be dual targeted to
mitochondria and chloroplasts, which also has been experimentally shown by Xu et
al. (2013). The unique EF-hand motif present in Arabidopsis NDB proteins is
conserved in all three NDBs from indica rice group but is absent from japonica NDB3

Chapter 7
222
as a result of truncation. The current study didn’t investigate why/how this gene was
truncated or the effect of truncation on the function of the gene. However, a detailed
study of this matter could be beneficial to understand how the gene performs it
proposed role without an EF-hand motif, an important part required for Ca2+ binding.
Screening of rice databases showed that this truncated NDB3 protein is present only
in japonica sub-species out of 11 rice species investigated. NDB3 from all other tested
rice species shares a similar exon-intron structure to Arabidopsis, with 10 exons
interrupted by 9 introns, and the resulting protein length is 580 aa. Although similar
information was available on japonica NDB3 in three different databases (Gramene,
Rice Genome Annotation Project, PLAZA 3), it is worthwhile to consider whether this
is the real situation with japonica NDB3 or rather an error in sequence annotation.
Comparison of gene structures revealed that rice AOXs share similar exon-intron
organization with Arabidopsis except AOX1b, which consists of three exons
separated by two introns (Considine et al., 2002). It has been found that this is the
predominant structure of AOX1b in a wide range of rice germplasm (8 species),
including cultivated species as well as wild types (Figure 3.25). In contrast, AOX1a
showed a high degree of polymorphism. Although the gene structural polymorphism
in rice AOXs has been studied earlier (Considine et al., 2002; Pu et al., 2015), no work
has been reported on rice NDHs until now. The current study on structural
organization of rice NDA1 revealed that three exons separated by two introns is
conserved amongst rice cultivars tested (10 species), which is completely different
from the Arabidopsis NDA group as well as from rice NDA2 (Figure 3.26). An
extended study could be carried out on AOX1b and NDA1 from other monocots,
especially on agriculturally important crop species and their relatives, to check
whether they also share the same gene structure for AOX1b and NDA1, which could
be important in evolutionary studies.

Chapter 7
223
Although the responses of rice AOXs under different environmental stresses have
been reported, less attention has been paid to NDHs. In the present study, expression
patterns of AOXs as well as NDHs were investigated in response to oxidative stress
created by disrupting mETC. In Arabidopsis, induction of AOX1a has been reported
under a variety of stress treatments, and co-induction of NDB2 was also observed in
almost all cases of AOX1a induction (Clifton et al., 2005; Elhafez et al., 2006),
suggesting that AOX1a and NDB2 are likely to be co-regulated sharing common cis-
acting regulatory elements (CAREs), which play a role during abiotic stress tolerance
(Ho et al., 2008). The current results demonstrated that in rice, a number of NDHs
(NDA1, NDA2, NDB2, and NDB3) are co-induced with AOXs (AOX1a and AOX1b)
either in roots or roots. Analysis of promoter regions of these genes predicted that rice
AOXs share a majority of the CAREs functional in Arabidopsis while NDHs share all
six CAREs functional in AtNDB2, except NDA1 which had only 5 of them. However,
the current study didn’t cover the functional analysis of these CAREs and it is certainly
worthwhile to continue investigations to identify CAREs that are functioning in rice,
which would be very important outcome for tracing regulatory mechanisms of rice AP
genes under abiotic stress conditions.
7.1.2 Rice alternative respiratory genes are responsive to environmental stresses like high salinity and show tissue specific expression
The main objective of the experiments described in Chapter 4 was to screen for rice
AP genes that are responsive to environmental stresses, taking high salinity as an
example. Growth and gene expression responses were investigated in two
contrasting rice cultivars exposed to salinity stress at their seedling stage. Variation
in salt-tolerance responses was revealed, particularly in their ability to manage Na+ in
their tissues, which is important in understanding mechanisms of tolerance. For
example, the concentration of shoot Na+ was higher in cultivar Nipponbare compared

Chapter 7
224
to Langi, but it was still capable of maintaining higher shoot growth, suggesting the
restriction of Na+ to the vacuole with minimum interruption to cellular functions or
cytoplasmic osmotic adjustment.
There was an obvious tissue-specific and genotypic variation in gene expression,
which paved the way to extend the research to compare gene expression in a range
of rice cultivars together with variation in salt-tolerance (Chapter 5). However, no
significant difference in gene expression was observed in roots or shoots of two
cultivars differing in salt-tolerance. Gene expression could be studied at different
developmental stages as well as at different salinity levels as the sensitivity of rice to
salinity stress varies with the growth stage (Ferdose et al., 2015).
Rice AOXs also exists as homodimers as reported for other plant species (Umbach
and Siedow, 1993). The reduced (active) form predominated in mitochondria from
salt-stressed tissues while the oxidized (inactive) form was more abundant in non-
stressed tissues, suggesting that post-translational regulation of AOX may be
important in rice. There was a co-expression of rice NDHs and AOXs in response to
salinity stress as observed under chemical stress (Chapter 3). The expression of
these co-induced genes also showed tissue specificity and cultivar variation as seen
for AOXs. Development of a polyclonal antibody to detect NDB2 is one of the
important outcomes of this research. The results in current study revealed that the
abundance of NDB2 protein was higher in salt-treated shoots than non-treated shoots
suggesting that NDB2 might be important in salinity tolerance responses. However,
in contrast to shoots, corresponding bands were not detected in salt-treated or non-
treated roots, although transcriptional level responses were detected. Further
investigation is needed to determine why the NDB2 protein is undetectable in roots.
However, results suggest that post-translational regulation of NDB2 may be different
between shoots and roots in rice. Therefore, the changes in NDB2 protein in response

Chapter 7
225
to salinity stress could be studied at different time points and at different salinity levels,
together with transcriptional responses, to get a clearer picture on gene responses at
protein level, as gene activation may occur at earlier or later stages of the stress
period and might be depend on the strength of the stress.
7.1.3 Contrasting genotypic and tissue-specific variation exists in physiological and molecular responses amongst rice cultivars in response to salinity stress
Unlike most other studies, this study evaluated the comparative salinity tolerance of
16 rice cultivars representing traditional and cultivated rice from both japonica and
indica types. A significant tissue-wise and cultivar variation in terms of growth as well
as tissue ion accumulation were revealed, suggesting that different mechanisms of
salt-tolerance operate within the investigated germplasm groups. Although a number
of tolerance mechanisms were proposed based on Na+ and K+ accumulation patterns
in roots and shoots, further in-depth tissue analysis would be beneficial in confirming
the current observations.
A group of cultivars from japonica rice showed similar shoot biomass production
despite varying tissue Na+ concentrations, showing that some cultivars can maintain
shoot growth even with high tissue Na+, suggesting the operation of tolerance
mechanisms (vacuolar storage or osmotic adjustment of the cytoplasm) (Cotsaftis et
al., 2011), while others maintain low Na+ by exclusion (Figure 5.7). This suggests that
tolerance mechanisms can vary even within cultivars from a particular sub-species,
which strongly support the necessity of enhanced germplasm screening for tolerance
mechanisms. At the same time, results clearly show that cultivars with similar genetic
background generally share similar tolerance mechanisms, and biomass production
also depends on the innate vigour of cultivars. It has been shown that the level of salt-
tolerance of cultivar Nipponbare is greater than the well reputed traditional indica
cultivar Pokkali, confirming the suitability of Nipponbare in studies related to salt stress

Chapter 7
226
as well as for improving crops’ tolerance to salt stress through genetic engineering.
Due to constraints in time and resources, only biomass production and Na+ and K+
accumulation in roots and shoots were considered in determining tolerance
mechanisms. More physiological traits such as chlorophyll content, net photosynthetic
rate, CO2 assimilation rates, transpiration rate, stomatal conductance etc. could be
measured along with plant survival rates to get a clearer picture of tolerance
mechanisms. Also, it is recommended to assess plants at different salinity levels as
well as at different growth stages, to check the consistency of results.
A strong positive correlation between the expression of AOX1a and NDA2 and shoot
Na+ content and a strong negative correlation between the expression of AOX1c and
NDB2 and relative root growth were revealed. Apart from that, although, it is possible
that some alternative pathway components play a certain role in salinity tolerance in
some cultivars, the current results suggest that AP genes may not be good molecular
markers at gene expression level for salt-tolerance in rice. However, transcriptome
changes at different time points could be studied to capture more transcriptional level
responses of AP genes as they could be active at different stages of the stress period.
Further, gene expression could be assessed in a range of salinity levels and at
different growth stages as gene responses might vary with the stress level as well as
the developmental stage of plants, before confirming the current conclusion. In
addition, the effect of other environmental stresses such as cold, drought, high
temperature etc. and a combination of these stresses could also be studied, which
might reveal the multi-stress responsive component of the alternative respiratory
pathway. Another direction of future study is that expression of AP genes in response
to salinity stress could be studied together with genes responsible for controlling Na+
accumulation in rice, such as high affinity K+ transporter (HKT) or plasma membrane
Na+/K+ antiporter (SOS1).

Chapter 7
227
7.1.4 Transgenic rice overexpressing AtAOX1a and AtNDB2 were successfully generated
The main objective of this part of the study (Chapter 6) was to test whether the
knowledge gained from the model system, Arabidopsis, could be applied to improve
agriculturally important crop species. Overexpression of AtAOX1a in Arabidopsis
improved the growth under salinity stress by reducing ROS production (Smith et al.,
2009) while AtNDB4 knock-down lines showed co-induction of AtAOX1a and AtNDB2
when grown under salt stress, suggesting the two genes are playing a role in salinity
tolerance in Arabidopsis (Smith et al., 2011). Transgenic rice plants overexpressing
AtAOX1a or AtNDB2, driven by the rice actin-1 promoter, were successfully
generated via Agrobacterium-mediated transformation (Chapter 6). Although,
overexpression of wheat AOX1a in Arabidopsis has been reported for the functional
analysis under low temperature (Sugie et al., 2006), cereal transformation with
exogenous alternative respiratory genes has not been performed previously. Out of
seven independent transgenic lines generated overexpressing AtAOX1a, two lines
were found to be completely sterile while 4 lines out of 22 were completely sterile from
the AtNDB2 transformed lines. However, all fertile lines grew without apparent
phenotypic differences to wild type Nipponbare under greenhouse conditions and
produced enough seeds for subsequent analysis. Three transgenic lines from each
group were evaluated for yield performances under environmentally realistic salt
stress (30 mM) applied during the panicle initiation stage. Several transgenic lines
performed better than wild type and segregated non-transgenic plants (null-
segregants), showing a potential improvement of salinity tolerance. In particular, two
lines carrying AtNDB2 (NB_AtNDB2_1_3 and NB_AtNDB2_10_2) and one line
carrying AtAOX1a (NB_AtAOX1a_1_6) significantly reduced the production of empty
seeds compared to their controls (Chapter 6), suggesting overexpression of AtAOX1a
and AtNDB2 could be a potential avenue for improving rice for salinity tolerance.

Chapter 7
228
Ideally, evaluation of more independently transformed lines is necessary to support
this finding. Moreover, copy number estimation of these transgenic lines was merely
based on Mendelian segregation and further confirmation is needed by Southern blot
or qRT-PCR analysis. Further, due to time limitations, the screening was performed
on a still segregating T1 generation, which is not ideal for phenotyping as they lack
transgene stability, and also the quality of seeds from T1 plant plants was not as good
as those produced from primary transgenic plants. Normally, in the literature, in most
studies later generations of transgenic plants have been used for phenotyping (Zhao
et al., 2006; Li et al., 2013b; Schilling et al., 2014). Therefore, it is imperative to
evaluate the T2 or T3 generations of same transgenic rice lines generated in this
project.
A number of independent transgenic lines developed in this study has yet to be
characterized. Only three from each independent transgenic line overexpressing gene
of interest were characterized due to time restrictions. To get reliable results as well
as to identify lines with better characteristics, evaluation of more independent lines
certainly would be beneficial. Although the AtAOX1a transformation resulted in only a
few independent lines, AtNDB2 transformation produced a number of independent
transformation events, which could be supportive for a detailed study. As a ready to
use overexpression vector carrying AtAOX1a is available, additional independent
lines could be generated through repeated rounds of plant transformation.
Expression levels of exogenous and endogenous AOX1a and NDB2 need to be
evaluated under salt-stressed and control conditions in the transgenic plants.
Changes in expression levels of both exogenous and endogenous genes could be
investigated in transformed plants, under stressed and control conditions at different
developmental stages as well as in a range of salinity levels, to better understand of
the gene responses and their mechanisms in response to salinity stress. Further,

Chapter 7
229
transgenic lines could be evaluated for other abiotic stresses such as drought, heat,
nutrient deficiency and for combination of stresses, which normally plants experience
in a natural environment.
7.2 Conclusions
This study has identified components of the alternative pathway of mETC in rice,
explored the structural polymorphism of them, and examined their responses to
chemical stress and salinity. It has also identified cultivars with varying responses to
salinity and the tissue specificity and genotypic specificity in their responses. The
study also demonstrated the genotypic- and tissue-specific variation in the expression
of AP genes under salinity stress. Although the present study suggested that AP gene
expression levels may not be good molecular markers for salt-tolerance in general in
rice, as AOX1a showed strong positive correlation with leaf Na+ content and ratio of
Na+/K+, it is still possible that AP components such as AOX may play a role at protein
or activity level in salt-tolerance in some cultivars. It is expected that information
gathered by investigating a large range of germplasm will contribute to studies on
identification of salt-tolerance mechanisms in rice. The study also has generated
transgenic plants constitutively expressing Arabidopsis AP components. It is hoped
that additional experiments with these plants will further elucidate the role of
mitochondria in stress tolerance in this important crop plant.

Appendix
230
Appendix
Appendix A: Pairwise alignment of AOX protein sequences from japonica
and indica rice
Supplementary Figure A1: Pairwise sequence alignment of full length AOX1a protein
from japonica and indica rice
AOX1a from japonica rice shares 100% of amino acid residue identity with indica rice.
Japo_AOX1a :
Indi_AOX1a :
* 20 * 40 * 60
MSSRMAGSAILRHVGGVRLFTASATSPAAAAAAAARPFLAGGEAVPGVWGLRLMSTSSVA
MSSRMAGSAILRHVGGVRLFTASATSPAAAAAAAARPFLAGGEAVPGVWGLRLMSTSSVA
MSSRMAGSAILRHVGGVRLFTASATSPAAAAAAAARPFLAGGEAVPGVWGLRLMSTSSVA
: 60
: 60
Japo_AOX1a :
Indi_AOX1a :
* 80 * 100 * 120
STEAAAKAEAKKADAEKEVVVNSYWGIEQSKKLVREDGTEWKWSCFRPWETYTADTSIDL
STEAAAKAEAKKADAEKEVVVNSYWGIEQSKKLVREDGTEWKWSCFRPWETYTADTSIDL
STEAAAKAEAKKADAEKEVVVNSYWGIEQSKKLVREDGTEWKWSCFRPWETYTADTSIDL
: 120
: 120
Japo_AOX1a :
Indi_AOX1a :
* 140 * 160 * 180
TKHHVPKTLLDKIAYWTVKSLRFPTDIFFQRRYGCRAMMLETVAAVPGMVGGMLLHLRSL
TKHHVPKTLLDKIAYWTVKSLRFPTDIFFQRRYGCRAMMLETVAAVPGMVGGMLLHLRSL
TKHHVPKTLLDKIAYWTVKSLRFPTDIFFQRRYGCRAMMLETVAAVPGMVGGMLLHLRSL
: 180
: 180
Japo_AOX1a :
Indi_AOX1a :
* 200 * 220 * 240
RRFEQSGGWIRTLLEEAENERMHLMTFMEVANPKWYERALVITVQGVFFNAYFLGYLLSP
RRFEQSGGWIRTLLEEAENERMHLMTFMEVANPKWYERALVITVQGVFFNAYFLGYLLSP
RRFEQSGGWIRTLLEEAENERMHLMTFMEVANPKWYERALVITVQGVFFNAYFLGYLLSP
: 240
: 240
Japo_AOX1a :
Indi_AOX1a :
* 260 * 280 * 300
KFAHRVVGYLEEEAIHSYTEFLKDLEAGKIDNVPAPAIAIDYWRLPANATLKDVVTVVRA
KFAHRVVGYLEEEAIHSYTEFLKDLEAGKIDNVPAPAIAIDYWRLPANATLKDVVTVVRA
KFAHRVVGYLEEEAIHSYTEFLKDLEAGKIDNVPAPAIAIDYWRLPANATLKDVVTVVRA
: 300
: 300
Japo_AOX1a :
Indi_AOX1a :
* 320 *
DEAHHRDVNHFASDIHYQGMELKQTPAPIGYH*
DEAHHRDVNHFASDIHYQGMELKQTPAPIGYH-
DEAHHRDVNHFASDIHYQGMELKQTPAPIGYH
: 332
: 332

Appendix
231
Supplementary Figure A2: Pairwise sequence alignment of full length AOX1b protein
from japonica and indica rice
AOX1b from japonica rice shares 100% of amino acid residue identity with indica rice.
Japo_AOX1b :
Indi_AOX1b :
* 20 * 40 * 60
MSSRMAGATLLRHLGPRLFAAEPVYSGLAASARGVMPAAARIFPARMASTSSAGADVKEG
MSSRMAGATLLRHLGPRLFAAEPVYSGLAASARGVMPAAARIFPARMASTSSAGADVKEG
MSSRMAGATLLRHLGPRLFAAEPVYSGLAASARGVMPAAARIFPARMASTSSAGADVKEG
: 60
: 60
Japo_AOX1b :
Indi_AOX1b :
* 80 * 100 * 120
AAEKLPEPAATAAAAATDPQNKKAVVSYWGIQPPKLVKEDGTEWKWLSFRPWDTYTSDTS
AAEKLPEPAATAAAAATDPQNKKAVVSYWGIQPPKLVKEDGTEWKWLSFRPWDTYTSDTS
AAEKLPEPAATAAAAATDPQNKKAVVSYWGIQPPKLVKEDGTEWKWLSFRPWDTYTSDTS
: 120
: 120
Japo_AOX1b :
Indi_AOX1b :
* 140 * 160 * 180
IDVTKHHEPKGLPDKLAYWTVRSLAVPRDLFFQRRHASHALLLETVAGVPGMVGGMLLHL
IDVTKHHEPKGLPDKLAYWTVRSLAVPRDLFFQRRHASHALLLETVAGVPGMVGGMLLHL
IDVTKHHEPKGLPDKLAYWTVRSLAVPRDLFFQRRHASHALLLETVAGVPGMVGGMLLHL
: 180
: 180
Japo_AOX1b :
Indi_AOX1b :
* 200 * 220 * 240
RSLRRFEQSGGWIRALLEEAENERMHLMTFLEVMQPRWWERALVLAAQGVFFNAYFVGYL
RSLRRFEQSGGWIRALLEEAENERMHLMTFLEVMQPRWWERALVLAAQGVFFNAYFVGYL
RSLRRFEQSGGWIRALLEEAENERMHLMTFLEVMQPRWWERALVLAAQGVFFNAYFVGYL
: 240
: 240
Japo_AOX1b :
Indi_AOX1b :
* 260 * 280 * 300
VSPKFAHRFVGYLEEEAVSSYTEYLKDLEAGKIENTPAPAIAIDYWRLPADATLKDVVTV
VSPKFAHRFVGYLEEEAVSSYTEYLKDLEAGKIENTPAPAIAIDYWRLPADATLKDVVTV
VSPKFAHRFVGYLEEEAVSSYTEYLKDLEAGKIENTPAPAIAIDYWRLPADATLKDVVTV
: 300
: 300
Japo_AOX1b :
Indi_AOX1b :
* 320 *
IRADEAHHRDLNHFASDIQQQGMKLKDTPAPIGYH
IRADEAHHRDLNHFASDIQQQGMKLKDTPAPIGYH
IRADEAHHRDLNHFASDIQQQGMKLKDTPAPIGYH
: 335
: 335

Appendix
232
Japo_AOX1c :
Indi_AOX1c :
* 20 * 40 * 60
MGSRAAGSVLLRHLCPRVSSSTSAAAHAHAQRPPLAGAGGGGVALWARLLSTSAAAAKEE
MGSRAAGSVLLRHLCPRVSSSTSAAAHAHAQRPPLAGAGGGGVALWARLLSTSAAAAKEE
MGSRAAGSVLLRHLCPRVSSSTSAAAHAHAQRPPLAGAGGGGVALWARLLSTSAAAAKEE
: 60
: 60
Japo_AOX1c :
Indi_AOX1c :
* 80 * 100 * 120
TAASKENTGSTAAAKAEATKAAKEGPASATASPVASSYWGIEASKLASKDGVEWKWSCFR
TAASKENTGSTAAAKAEATKAAKEGPASATASPVASSYWGIEASKLASKDGVEWKWSCFR
TAASKENTGSTAAAKAEATKAAKEGPASATASPVASSYWGIEASKLASKDGVEWKWSCFR
: 120
: 120
Japo_AOX1c :
Indi_AOX1c :
* 140 * 160 * 180
PWETYSPDTTIDLKKHHEPKVLLDKVAYWTVKALRVPTDIFFQRRYGCRAMMLETVAAVP
PWETYSPDTTIDLKKHHEPKVLLDKVAYWTVKALRVPTDIFFQRRYGCRAMMLETVAAVP
PWETYSPDTTIDLKKHHEPKVLLDKVAYWTVKALRVPTDIFFQRRYGCRAMMLETVAAVP
: 180
: 180
Japo_AOX1c :
Indi_AOX1c :
* 200 * 220 * 240
GMVGGMLLHLRSLRRFEHSGGWIRALLEEAENERMHLMTFMEVAKPRWYERALVLAVQGV
GMVGGMLLHLRSLRRFEHSGGWIRALLEEAENERMHLMTFMEVAKPRWYERALVLAVQGV
GMVGGMLLHLRSLRRFEHSGGWIRALLEEAENERMHLMTFMEVAKPRWYERALVLAVQGV
: 240
: 240
Japo_AOX1c :
Indi_AOX1c :
* 260 * 280 * 300
FFNAYFLGYLLSPKLAHRVVGYLEEEAIHSYTEYLKDIEAGKIENVPAPPIAIDYWRLPA
FFNAYFLGYLLSPKLAHRVVGYLEEEAIHSYTEYLKDIEAGKIENVPAPPIAIDYWRLPA
FFNAYFLGYLLSPKLAHRVVGYLEEEAIHSYTEYLKDIEAGKIENVPAPPIAIDYWRLPA
: 300
: 300
Japo_AOX1c :
Indi_AOX1c :
* 320 * 340
GATLKDVVVVVRADEAHHRDVNHFASDVHFQGMDLKDIPAPLDYH
GATLKDVVVVVRADEAHHRDVNHFASDVHFQGMDLKDIPAPLDYH
GATLKDVVVVVRADEAHHRDVNHFASDVHFQGMDLKDIPAPLDYH
: 345
: 345
Supplementary Figure A3: Pairwise sequence alignment of full length AOX1c protein
from japonica and indica rice
AOX1c from japonica rice shares 100% of amino acid residue identity with indica rice.

Appendix
233
Supplementary Figure A4: Pairwise sequence alignment of full length AOX1d protein
from japonica and indica rice
AOX1d from japonica rice shares 99.7% of amino acid residue identity with indica rice.
Japo_AOX1d :
Indi_AOX1d :
* 20 * 40 * 60
MALVQSARRAAGPAASRLFSTASVAAAGRSPVAGLPKALPRPAISSLWMVGAAAPPRRFA
MALVQSARRAAGPAASRLFSTASVAAAGRSPVAGLPKALPQPAISSLWMVGAAAPPRRFA
MALVQSARRAAGPAASRLFSTASVAAAGRSPVAGLPKALP PAISSLWMVGAAAPPRRFA
: 60
: 60
Japo_AOX1d :
Indi_AOX1d :
* 80 * 100 * 120
GTAAVGGVDVTAPTATPPPAKKEESEKEAASYWGVAPTRLVKEDGTVWKWSCFRPWDTYE
GTAAVGGVDVTAPTATPPPAKKEESEKEAASYWGVAPTRLVKEDGTVWKWSCFRPWDTYE
GTAAVGGVDVTAPTATPPPAKKEESEKEAASYWGVAPTRLVKEDGTVWKWSCFRPWDTYE
: 120
: 120
Japo_AOX1d :
Indi_AOX1d :
* 140 * 160 * 180
ADVAIDLTKHHNPATLGDKVARWTVKSLRWPVDLFFQRRYGCRAMMLETVAAVPGMVAGA
ADVAIDLTKHHNPATLGDKVARWTVKSLRWPVDLFFQRRYGCRAMMLETVAAVPGMVAGA
ADVAIDLTKHHNPATLGDKVARWTVKSLRWPVDLFFQRRYGCRAMMLETVAAVPGMVAGA
: 180
: 180
Japo_AOX1d :
Indi_AOX1d :
* 200 * 220 * 240
VLHLRSLRRFEHSGGWIRALLEEAENERMHLMTFMEVSQPRWYERALVVAVQGAFFNAYL
VLHLRSLRRFEHSGGWIRALLEEAENERMHLMTFMEVSQPRWYERALVVAVQGAFFNAYL
VLHLRSLRRFEHSGGWIRALLEEAENERMHLMTFMEVSQPRWYERALVVAVQGAFFNAYL
: 240
: 240
Japo_AOX1d :
Indi_AOX1d :
* 260 * 280 * 300
ASYLLSPRFAHRIVGYLEEEAVHSYTEFLRDLDAGKIDDVPAPAIAIDYWRLPADATLRD
ASYLLSPRFAHRIVGYLEEEAVHSYTEFLRDLDAGKIDDVPAPAIAIDYWRLPADATLRD
ASYLLSPRFAHRIVGYLEEEAVHSYTEFLRDLDAGKIDDVPAPAIAIDYWRLPADATLRD
: 300
: 300
Japo_AOX1d :
Indi_AOX1d :
* 320 *
VVMVVRADEAHHRDVNHYASDIHYQGHALREVAAPLGYH
VVMVVRADEAHHRDVNHYASDIHYQGHALREVAAPLGYH
VVMVVRADEAHHRDVNHYASDIHYQGHALREVAAPLGYH
: 339
: 339

Appendix
234
Appendix B: Pairwise alignment of NDH protein sequences from japonica
and indica rice
Supplementary Figure B1: Pairwise sequence alignment of full length NDA1 protein
from japonica and indica rice
NDA1 from japonica rice shares 99.7% of amino acid residue identity with indica rice.
Japon_NDA1 :
Indic_NDA1 :
* 20 * 40 * 60
MAWSRIARGSQLTQPLSRILAEGNAAATPAAYALRNAAALGQRASSASASSSFHSLALAG
MAWSRIARGSQLTQPLSRILAEGNAAATPAAYALRNAAALGQRASSASASSSFHSLALAG
MAWSRIARGSQLTQPLSRILAEGNAAATPAAYALRNAAALGQRASSASASSSFHSLALAG
: 60
: 60
Japon_NDA1 :
Indic_NDA1 :
* 80 * 100 * 120
LADKYAAGAAGRLQPSRGISTTSPALRPAAEAAARVVECSDAADEAAAAAAVPDLGPTRP
LADKYAAGAAGRLQPSRGISTTSPALRPAAEAAARVVECSDAADEAA-AAAVPDLGPTRP
LADKYAAGAAGRLQPSRGISTTSPALRPAAEAAARVVECSDAADEAA AAAVPDLGPTRP
: 120
: 119
Japon_NDA1 :
Indic_NDA1 :
* 140 * 160 * 180
GEKPRVVVLGTGWAACRFLKDVDTRAYDVVCISPRNHMVFTPLLASTCVGTLEFRSVVEP
GEKPRVVVLGTGWAACRFLKDVDTRAYDVVCISPRNHMVFTPLLASTCVGTLEFRSVVEP
GEKPRVVVLGTGWAACRFLKDVDTRAYDVVCISPRNHMVFTPLLASTCVGTLEFRSVVEP
: 180
: 179
Japon_NDA1 :
Indic_NDA1 :
* 200 * 220 * 240
VSRIQSALATRPGSYFFLASCTGIDTGRHEVHCTAADGDGLPANPYNFKVSYDKLVIASG
VSRIQSALATRPGSYFFLASCTGIDTGRHEVHCTAADGDGLPANPYNFKVSYDKLVIASG
VSRIQSALATRPGSYFFLASCTGIDTGRHEVHCTAADGDGLPANPYNFKVSYDKLVIASG
: 240
: 239
Japon_NDA1 :
Indic_NDA1 :
* 260 * 280 * 300
SEPLTFGIKGVAENAIFLREVSHAQEIRRKLLTNLMLSENPGLSEEEKKRLLHCVVVGGG
SEPLTFGIKGVAENAIFLREVSHAQEIRRKLLTNLMLSENPGLSEEEKKRLLHCVVVGGG
SEPLTFGIKGVAENAIFLREVSHAQEIRRKLLTNLMLSENPGLSEEEKKRLLHCVVVGGG
: 300
: 299
Japon_NDA1 :
Indic_NDA1 :
* 320 * 340 * 360
PTGVEFSGELSDFITRDVRERYAHVKDYVKVTLIEANEILSSFDVGLRQYATDHLSKYGV
PTGVEFSGELSDFITRDVRERYAHVKDYVKVTLIEANEILSSFDVGLRQYATDHLSKYGV
PTGVEFSGELSDFITRDVRERYAHVKDYVKVTLIEANEILSSFDVGLRQYATDHLSKYGV
: 360
: 359
Japon_NDA1 :
Indic_NDA1 :
* 380 * 400 * 420
NLVRGVVKEVKPREIELSDGSRVPYGVLVWSTGVGPSEFVRSLPLPKSPGGRIGVDEWLR
NLVRGVVKEVKPREIELSDGSRVPYGVLVWSTGVGPSEFVRSLPLPKSPGGRIGVDEWLR
NLVRGVVKEVKPREIELSDGSRVPYGVLVWSTGVGPSEFVRSLPLPKSPGGRIGVDEWLR
: 420
: 419
Japon_NDA1 :
Indic_NDA1 :
* 440 * 460 * 480
VPSVEDVFALGDCAGFLEGTGRAVLPALAQVAEREGRYLARVMSRIAAQDGGRAGRAVGS
VPSVEDVFALGDCAGFLEGTGRAVLPALAQVAEREGRYLARVMSRIAAQDGGRAGRAVGS
VPSVEDVFALGDCAGFLEGTGRAVLPALAQVAEREGRYLARVMSRIAAQDGGRAGRAVGS
: 480
: 479
Japon_NDA1 :
Indic_NDA1 :
* 500 * 520 * 540
AELGEPFVYKHIGSMASVGRYKALVDLRENKDARGVSMAGFVSWLMWRSAYLTRVVSWRN
AELGEPFVYKHIGSMASVGRYKALVDLRENKDARGVSMAGFVSWLMWRSAYLTRVVSWRN
AELGEPFVYKHIGSMASVGRYKALVDLRENKDARGVSMAGFVSWLMWRSAYLTRVVSWRN
: 540
: 539
Japon_NDA1 :
Indic_NDA1 :
* 560
RFYVAVNWATTLVFGRDNTRIG
RFYVAINWATTLVFGRDNTRIG
RFYVA6NWATTLVFGRDNTRIG
: 562
: 561

Appendix
235
Supplementary Figure B2: Pairwise sequence alignment of full length NDA2 protein
from japonica and indica rice
NDA2 from japonica rice shares 99.8% of amino acid residue identity with indica rice.
Japon_NDA2 :
Indic_NDA2 :
* 20 * 40 * 60
MAASSLLRSLSRISRRGCVGGAGPSPFHHSRLPYSPFSTAAADAVERRGFAGLGPTAKGE
MAASSLLRSLSRISRRGCVGGAGPSPFHHSRLPYSPFSTAAADAVERRGFAGLGPTAKGE
MAASSLLRSLSRISRRGCVGGAGPSPFHHSRLPYSPFSTAAADAVERRGFAGLGPTAKGE
: 60
: 60
Japon_NDA2 :
Indic_NDA2 :
* 80 * 100 * 120
KARVVVLGTGWAGSRLMKDIDTTGYEVVCVSPRNHMVFTPLLASTCVGTLEFRSVAEPLA
KARVVVLGTGWAGSRLMKDIDTTGYEGVCVSPRNHMVFTPLLASTCVGTLEFRSVAEPLA
KARVVVLGTGWAGSRLMKDIDTTGYE VCVSPRNHMVFTPLLASTCVGTLEFRSVAEPLA
: 120
: 120
Japon_NDA2 :
Indic_NDA2 :
* 140 * 160 * 180
RIQPAVSKSPGSYFLLARCTAVDPDAHTIDCETVTEGEKDTLKPWKFKVAYDKLVFACGA
RIQPAVSKSPGSYFLLARCTAVDPDAHTIDCETVTEGEKDTLKPWKFKVAYDKLVFACGA
RIQPAVSKSPGSYFLLARCTAVDPDAHTIDCETVTEGEKDTLKPWKFKVAYDKLVFACGA
: 180
: 180
Japon_NDA2 :
Indic_NDA2 :
* 200 * 220 * 240
EASTFGIRGVTDHAIFLREVHHAQEIRRKLLLNLMLSDVPGISEEEKRRLLHCVVVGGGP
EASTFGIRGVTDHAIFLREVHHAQEIRRKLLLNLMLSDVPGISEEEKRRLLHCVVVGGGP
EASTFGIRGVTDHAIFLREVHHAQEIRRKLLLNLMLSDVPGISEEEKRRLLHCVVVGGGP
: 240
: 240
Japon_NDA2 :
Indic_NDA2 :
* 260 * 280 * 300
TGVEFSGELSDFIIRDVKQRYSHVKDYIHVTLIEANEILSSFDVRLRQYATNQLTKSGVR
TGVEFSGELSDFIIRDVKQRYSHVKDYIHVTLIEANEILSSFDVRLRQYATNQLTKSGVR
TGVEFSGELSDFIIRDVKQRYSHVKDYIHVTLIEANEILSSFDVRLRQYATNQLTKSGVR
: 300
: 300
Japon_NDA2 :
Indic_NDA2 :
* 320 * 340 * 360
LVRGIVKDVQPNKLILDNGEEVPYGLLVWSTGVGPSSFVKSLPFPKSPGGRIGVDEWLRV
LVRGIVKDVQPNKLILDNGEEVPYGLLVWSTGVGPSSFVKSLPFPKSPGGRIGVDEWLRV
LVRGIVKDVQPNKLILDNGEEVPYGLLVWSTGVGPSSFVKSLPFPKSPGGRIGVDEWLRV
: 360
: 360
Japon_NDA2 :
Indic_NDA2 :
* 380 * 400 * 420
PSARDVFAIGDCSGFLESTGKDVLPALAQVAERQGKYLAHLLNHVMKAGGGHANCEIDVD
PSARDVFAIGDCSGFLESTGKDVLPALAQVAERQGKYLAHLLNHVMKAGGGHANCEIDVD
PSARDVFAIGDCSGFLESTGKDVLPALAQVAERQGKYLAHLLNHVMKAGGGHANCEIDVD
: 420
: 420
Japon_NDA2 :
Indic_NDA2 :
* 440 * 460 * 480
LGPAFVYKHLGSMATVGRYKALVDLRQSKESKGISLAGFVSWFIWRSAYLTRVVSWRNRF
LGPAFVYKHLGSMATVGRYKALVDLRQSK--AGISLAGFVSWFIWRSAYLTRVVSWRNRF
LGPAFVYKHLGSMATVGRYKALVDLRQSK GISLAGFVSWFIWRSAYLTRVVSWRNRF
: 480
: 478
Japon_NDA2 :
Indic_NDA2 :
*
YVAINWLTTLLFGRDISRI
YVAINWLTTLLFGRDISRI
YVAINWLTTLLFGRDISRI
: 499
: 497

Appendix
236
Supplementary Figure B3: Pairwise sequence alignment of full length NDB1 protein
from japonica and indica rice
NDB1 from japonica rice shares 100% of amino acid residue identity with indica rice.
Japon_NDB1 :
Indic_NDB1 :
* 20 * 40 * 60
MGFFFFASRAAARFLGEARIIHPGVSTAALLVAAASGGGLVAYADSAGENASSETSQEAP
MGFFFFASRAAARFLGEARIIHPGVSTAALLVAAASGGGLVAYADSAGENASSETSQEAP
MGFFFFASRAAARFLGEARIIHPGVSTAALLVAAASGGGLVAYADSAGENASSETSQEAP
: 60
: 60
Japon_NDB1 :
Indic_NDB1 :
* 80 * 100 * 120
RKKKVVVLGTGWAGTSFLKDLDCSKYEVKVISPRNYFAFTPLLPSVTCGTVEARSIVEPI
RKKKVVVLGTGWAGTSFLKDLDCSKYEVKVISPRNYFAFTPLLPSVTCGTVEARSIVEPI
RKKKVVVLGTGWAGTSFLKDLDCSKYEVKVISPRNYFAFTPLLPSVTCGTVEARSIVEPI
: 120
: 120
Japon_NDB1 :
Indic_NDB1 :
* 140 * 160 * 180
RKMLEKKRKDVAFYEAECFKIDASKKAVHCRSAVGTNFDGNGDFMVDYDYLVVALGATVN
RKMLEKKRKDVAFYEAECFKIDASKKAVHCRSAVGTNFDGNGDFMVDYDYLVVALGATVN
RKMLEKKRKDVAFYEAECFKIDASKKAVHCRSAVGTNFDGNGDFMVDYDYLVVALGATVN
: 180
: 180
Japon_NDB1 :
Indic_NDB1 :
* 200 * 220 * 240
TFNTPGVMENCYFLKEVEDAQKIRRNVIDCFEKASLPNISEEEKRKILHFVIIGGGPTGV
TFNTPGVMENCYFLKEVEDAQKIRRNVIDCFEKASLPNISEEEKRKILHFVIIGGGPTGV
TFNTPGVMENCYFLKEVEDAQKIRRNVIDCFEKASLPNISEEEKRKILHFVIIGGGPTGV
: 240
: 240
Japon_NDB1 :
Indic_NDB1 :
* 260 * 280 * 300
EFAAEMHDFLVEDLVKLYPAIQDFVKITIIQSGEHILNMFDQRIATFAEMKFQRDGIEVN
EFAAEMHDFLVEDLVKLYPAIQDFVKITIIQSGEHILNMFDQRIATFAEMKFQRDGIEVN
EFAAEMHDFLVEDLVKLYPAIQDFVKITIIQSGEHILNMFDQRIATFAEMKFQRDGIEVN
: 300
: 300
Japon_NDB1 :
Indic_NDB1 :
* 320 * 340 * 360
TGFRVVKVSDDLITMKSKSLGEVSVPYGMAVWSAGIGTRPVIMDFMQQIGQTNRRVLATN
TGFRVVKVSDDLITMKSKSLGEVSVPYGMAVWSAGIGTRPVIMDFMQQIGQTNRRVLATN
TGFRVVKVSDDLITMKSKSLGEVSVPYGMAVWSAGIGTRPVIMDFMQQIGQTNRRVLATN
: 360
: 360
Japon_NDB1 :
Indic_NDB1 :
* 380 * 400 * 420
EWLRVHECDNIYAIGDCASITQRKIMDDISTVFKMADKDNSGTLTLKEINDVLEDICIRY
EWLRVHECDNIYAIGDCASITQRKIMDDISTVFKMADKDNSGTLTLKEINDVLEDICIRY
EWLRVHECDNIYAIGDCASITQRKIMDDISTVFKMADKDNSGTLTLKEINDVLEDICIRY
: 420
: 420
Japon_NDB1 :
Indic_NDB1 :
* 440 * 460 * 480
PQVELYMKSMHMLDIRDLIKDAIGDSHKESMVVNIEEFKKALSHVDSQVKSIPATAQVAA
PQVELYMKSMHMLDIRDLIKDAIGDSHKESMVVNIEEFKKALSHVDSQVKSIPATAQVAA
PQVELYMKSMHMLDIRDLIKDAIGDSHKESMVVNIEEFKKALSHVDSQVKSIPATAQVAA
: 480
: 480
Japon_NDB1 :
Indic_NDB1 :
* 500 * 520 * 540
QQGHYLAECFNKMDQCKEHPEGPLRMTGTGSGRHNFRPFRYKHLGQFAPLGGEQAAAELP
QQGHYLAECFNKMDQCKEHPEGPLRMTGTGSGRHNFRPFRYKHLGQFAPLGGEQAAAELP
QQGHYLAECFNKMDQCKEHPEGPLRMTGTGSGRHNFRPFRYKHLGQFAPLGGEQAAAELP
: 540
: 540
Japon_NDB1 :
Indic_NDB1 :
* 560 * 580
GDWVSMGHSTQWLWYSVYASKQVSWRTRMLVVSDWTRRFIFGRDSSRI
GDWVSMGHSTQWLWYSVYASKQVSWRTRMLVVSDWTRRFIFGRDSSRI
GDWVSMGHSTQWLWYSVYASKQVSWRTRMLVVSDWTRRFIFGRDSSRI
: 588
: 588

Appendix
237
Supplementary Figure B4: Pairwise sequence alignment of full length NDB2 protein
from japonica and indica rice
NDB2 from japonica rice shares 100% of amino acid residue identity with indica rice.
Japon_NDB2 :
Indic_NDB2 :
* 20 * 40 * 60
MSASGGLSLVRRAVEAARRTPRWQKRLLVLTAGVGSLTYACQDNQVLQINDGTGKKRVVI
MSASGGLSLVRRAVEAARRTPRWQKRLLVLTAGVGSLTYACQDNQVLQINDGTGKKRVVI
MSASGGLSLVRRAVEAARRTPRWQKRLLVLTAGVGSLTYACQDNQVLQINDGTGKKRVVI
: 60
: 60
Japon_NDB2 :
Indic_NDB2 :
* 80 * 100 * 120
VGTGWAGASFLRNIDTSLYDVHVVSPRNYFTFTPLLPSVTCGTVEARSIVEPIRNIVRKR
VGTGWAGASFLRNIDTSLYDVHVVSPRNYFTFTPLLPSVTCGTVEARSIVEPIRNIVRKR
VGTGWAGASFLRNIDTSLYDVHVVSPRNYFTFTPLLPSVTCGTVEARSIVEPIRNIVRKR
: 120
: 120
Japon_NDB2 :
Indic_NDB2 :
* 140 * 160 * 180
GGAFRFWEAECYKIDPTNKKIHCRSDSDGNSEFVVDYDYLVVSVGARPNTFNTPGVVENC
GGAFRFWEAECYKIDPTNKKIHCRSDSDGNSEFVVDYDYLVVSVGARPNTFNTPGVVENC
GGAFRFWEAECYKIDPTNKKIHCRSDSDGNSEFVVDYDYLVVSVGARPNTFNTPGVVENC
: 180
: 180
Japon_NDB2 :
Indic_NDB2 :
* 200 * 220 * 240
HFLKEVEDAQKIRKSVLKCFERASLPNLTEEERKKNLHFVVIGGGPTGVEFAAELHDFVN
HFLKEVEDAQKIRKSVLKCFERASLPNLTEEERKKNLHFVVIGGGPTGVEFAAELHDFVN
HFLKEVEDAQKIRKSVLKCFERASLPNLTEEERKKNLHFVVIGGGPTGVEFAAELHDFVN
: 240
: 240
Japon_NDB2 :
Indic_NDB2 :
* 260 * 280 * 300
EDLAKLYPDVKKYANISVIEAGDHILTMFDKRITQFAEDKFKRTGIDLKTNFKVVKVSDK
EDLAKLYPDVKKYANISVIEAGDHILTMFDKRITQFAEDKFKRTGIDLKTNFKVVKVSDK
EDLAKLYPDVKKYANISVIEAGDHILTMFDKRITQFAEDKFKRTGIDLKTNFKVVKVSDK
: 300
: 300
Japon_NDB2 :
Indic_NDB2 :
* 320 * 340 * 360
AITMTNSATGEIAVPYGMAVWSTGIGTRPLIMDFMKQVGQANRRVLATDEWLRVHGCDDV
AITMTNSATGEIAVPYGMAVWSTGIGTRPLIMDFMKQVGQANRRVLATDEWLRVHGCDDV
AITMTNSATGEIAVPYGMAVWSTGIGTRPLIMDFMKQVGQANRRVLATDEWLRVHGCDDV
: 360
: 360
Japon_NDB2 :
Indic_NDB2 :
* 380 * 400 * 420
YALGDCATITQRKVMEDIASIFRVADKDNSGSLTVKKIKNVLGDIYERYPQVELYLKTNQ
YALGDCATITQRKVMEDIASIFRVADKDNSGSLTVKKIKNVLGDIYERYPQVELYLKTNQ
YALGDCATITQRKVMEDIASIFRVADKDNSGSLTVKKIKNVLGDIYERYPQVELYLKTNQ
: 420
: 420
Japon_NDB2 :
Indic_NDB2 :
* 440 * 460 * 480
MKDFHDLLKDSDGNAIKESKELNIEEFKKALARVDSQVKMLPATAQVASQEGAYLANCFN
MKDFHDLLKDSDGNAIKESKELNIEEFKKALARVDSQVKMLPATAQVASQEGAYLANCFN
MKDFHDLLKDSDGNAIKESKELNIEEFKKALARVDSQVKMLPATAQVASQEGAYLANCFN
: 480
: 480
Japon_NDB2 :
Indic_NDB2 :
* 500 * 520 * 540
KMKYCEENPEGPLRIRGTGRHRFKPFRYRHLGQFAPLGGEQTAAQLPGDWIHVGHSTQWL
KMKYCEENPEGPLRIRGTGRHRFKPFRYRHLGQFAPLGGEQTAAQLPGDWIHVGHSTQWL
KMKYCEENPEGPLRIRGTGRHRFKPFRYRHLGQFAPLGGEQTAAQLPGDWIHVGHSTQWL
: 540
: 540
Japon_NDB2 :
Indic_NDB2 :
* 560 *
WYSVYASKQFSWRTRMLVVSDWGRRFIYGRDSSSL
WYSVYASKQFSWRTRMLVVSDWGRRFIYGRDSSSL
WYSVYASKQFSWRTRMLVVSDWGRRFIYGRDSSSL
: 575
: 575

Appendix
238
Supplementary Figure B5: Pairwise sequence alignment of full length NDB3 protein
from japonica and indica rice
NDB3 from japonica rice shares 98.8% of amino acid residue identity with indica rice covering
353 aa. However, japonica NDB3 protein sequence (357 aa) is shorter than indica (580 aa)
due to truncation.
Japon_NDB3 :
Indic_NDB3 :
* 20 * 40 * 60
MRWTAFMWEGASRAFNHRPTFTNLVLVLGAASSGGLVAYADSNSDDVVGKPQGPPKKKIV
MRWTAFMWEGASRAFNHRPTFTNLVLVLGAASSGGLVAYADSNSDDVVGKPQGPPKKKIV
MRWTAFMWEGASRAFNHRPTFTNLVLVLGAASSGGLVAYADSNSDDVVGKPQGPPKKKIV
: 60
: 60
Japon_NDB3 :
Indic_NDB3 :
* 80 * 100 * 120
VLGTGWGGTTFLRNLDSRLYDVQVISPRNYFAFTPLLPSVTCGTVEPRSVVEPIRRILEK
VLGTGWGGTTFLRNLDSRLYDVQVISPRNYFAFTPLLPSVTCGTVEPRSVVEPIRRILEK
VLGTGWGGTTFLRNLDSRLYDVQVISPRNYFAFTPLLPSVTCGTVEPRSVVEPIRRILEK
: 120
: 120
Japon_NDB3 :
Indic_NDB3 :
* 140 * 160 * 180
KGGDIKFWEAECFKIDSSNKKIHCRSNIGTNLDGNGEFLVDYDYLVIAVGARSNTFNTPG
KGGDIKFWEAECFKIDSSNKKIHCRSNIGTNLDGNGEFLVDYDYLVIAVGARSNTFNTPG
KGGDIKFWEAECFKIDSSNKKIHCRSNIGTNLDGNGEFLVDYDYLVIAVGARSNTFNTPG
: 180
: 180
Japon_NDB3 :
Indic_NDB3 :
* 200 * 220 * 240
VEENCFFLKEVEDAQKIRRNVMDCFERASLPYLDEEERKKNLHFVVVGGGPTGVEFAAEL
VEENCFFLKEVEDAQKIRRNVMDCFERASLPYLDEEERKKNLHFVVVGGGPTGVEFAAEL
VEENCFFLKEVEDAQKIRRNVMDCFERASLPYLDEEERKKNLHFVVVGGGPTGVEFAAEL
: 240
: 240
Japon_NDB3 :
Indic_NDB3 :
* 260 * 280 * 300
HDFVTEDLSKLYPSIQHLVKISLIEAADHILTMFDKRITEFAEDKFGRDGIDVKTGYKVV
HDFVTEDLSKLYPSIQHLVKISLIEAADHILTMFDKRITEFAEDKFGRDGIDVKTGYKVV
HDFVTEDLSKLYPSIQHLVKISLIEAADHILTMFDKRITEFAEDKFGRDGIDVKTGYKVV
: 300
: 300
Japon_NDB3 :
Indic_NDB3 :
* 320 * 340 * 360
KVAKDAITMQNPATGDIAVPYGMAVWSTGIGTRPFISEFMKQIGQVPSKKLSSTL-----
KVAKDAITMQNPATGDIAVPYGMAVWSTGIGTRPFISEFMKQIGQGKRRVLATDEWLRVR
KVAKDAITMQNPATGDIAVPYGMAVWSTGIGTRPFISEFMKQIGQ 4 L 3
: 355
: 360
Japon_NDB3 :
Indic_NDB3 :
* 380 * 400 * 420
-CS---------------------------------------------------------
ECDGVYAVGDCATINQRRVMDDISEIFRVADKDNSGTLTVKEIQDVLDDIYVRYPQVELY
C
: 357
: 420
Japon_NDB3 :
Indic_NDB3 :
* 440 * 460 * 480
------------------------------------------------------------
LKSRQMNGIADLVRTAKGDAEKESVELNIEEFKKALSLVDSQVKNLPATAQVASQQGQYL
: -
: 480
Japon_NDB3 :
Indic_NDB3 :
* 500 * 520 * 540
------------------------------------------------------------
ARCFNKMKDAEENPEGPIRIRGEGRHRFRPFRYRHLGQFAPLGGEQTAAQLPGDWISIGH
: -
: 540
Japon_NDB3 :
Indic_NDB3 :
* 560 * 580
----------------------------------------
STQWLWYSVYATKQISWRTRALVISDWSRRFIFGRDSSCI
: -
: 580

Appendix
239
Supplementary Figure B6: Pairwise sequence alignment of full length NDC1 protein
from japonica and indica rice
NDC1 from japonica rice shares 99.4% of amino acid residue identity with indica rice.
Japon_NDC1 :
Indic_NDC1 :
* 20 * 40 * 60
MSCRAAPWGRPSLPGGRPSPGSARQRGPFGGLNVWRNSILNNSWRLGGTPMKFGLPSRLF
MSCRAAPWGRPSLPGGRPSPGSARQRGPFGVLNVWRNSILNNSWSLGGTPMKFGLPSRLF
MSCRAAPWGRPSLPGGRPSPGSARQRGPFG LNVWRNSILNNSW LGGTPMKFGLPSRLF
: 60
: 60
Japon_NDC1 :
Indic_NDC1 :
* 80 * 100 * 120
RLMASSSSGDGGFSRPSSTDEGPMPIYSWPDKQRPRVCILGGGFGGLYTALRLESLVWPN
RLMASSSSGDGGFSRPSSTDEGPMPIYSWPDKQRPRVCILGGGFGGLYTALSLESLVWPN
RLMASSSSGDGGFSRPSSTDEGPMPIYSWPDKQRPRVCILGGGFGGLYTAL LESLVWPN
: 120
: 120
Japon_NDC1 :
Indic_NDC1 :
* 140 * 160 * 180
DKKPQVMLVDQSDRFVFKPMLYELLSGEVDVWEIAPSFTELLKNTSVQFVKDSVKLLRPS
DKKPQVMLVDQSDRFVFKPMLYELLSGEVDVWEIAPSFTELLKNTSVQFVKDSVKLLRPS
DKKPQVMLVDQSDRFVFKPMLYELLSGEVDVWEIAPSFTELLKNTSVQFVKDSVKLLRPS
: 180
: 180
Japon_NDC1 :
Indic_NDC1 :
* 200 * 220 * 240
DHFRRDSGGSCTGGVVHLESGTVIEYDWLVLALGAEAKIDVVPGSAEYAIPFTTLDDALK
DHFRRDSGGSCTGGVVHLESGTVIEYDWLVLALGAEAKIDVVPGSAEYAIPFTTLDDALK
DHFRRDSGGSCTGGVVHLESGTVIEYDWLVLALGAEAKIDVVPGSAEYAIPFTTLDDALK
: 240
: 240
Japon_NDC1 :
Indic_NDC1 :
* 260 * 280 * 300
VESQLKMLERRRFGKNSPDIQVAIVGLGYSGVELAATISERLKNKGIVQAINVQTTICPS
VESQLKMLERRRFGKNSPDIQVAIVGLGYSGVELAATISERLKNKGIVQAINVQTTICPS
VESQLKMLERRRFGKNSPDIQVAIVGLGYSGVELAATISERLKNKGIVQAINVQTTICPS
: 300
: 300
Japon_NDC1 :
Indic_NDC1 :
* 320 * 340 * 360
APPGNRDAALKVLESRNIQLFLGYFVNCIREASASEDSSSMVTDAKEVNGDHKKLLLELQ
APPGNRDAALKVLESRNIQLFLGYFVNCIREASASEDSSSMVTDAKEVNGDHKKLLLELQ
APPGNRDAALKVLESRNIQLFLGYFVNCIREASASEDSSSMVTDAKEVNGDHKKLLLELQ
: 360
: 360
Japon_NDC1 :
Indic_NDC1 :
* 380 * 400 * 420
PAQRGIQSQVLEADMVLWTVGSTSQIPRLQPPDAPYVIPLNGRGQVETEETLQVKGHPRT
PAQRGIQSQVLEADMVLWTVGSTSQIPRLQPPDAPYVIPLNGRGQVETEETLQVKGHPRT
PAQRGIQSQVLEADMVLWTVGSTSQIPRLQPPDAPYVIPLNGRGQVETEETLQVKGHPRT
: 420
: 420
Japon_NDC1 :
Indic_NDC1 :
* 440 * 460 * 480
FAIGDSAALRDPSGKLLPATAQVAFQQADFAGWNLWAAINDRPLLPFRFQNLGEMMTLGR
FAIGDSAALRDPSGKLLPATAQVAFQQADFAGWNLWAAINDRPLLPFRFQNLGEMMTLGR
FAIGDSAALRDPSGKLLPATAQVAFQQADFAGWNLWAAINDRPLLPFRFQNLGEMMTLGR
: 480
: 480
Japon_NDC1 :
Indic_NDC1 :
* 500 * 520 * 540
SDAAITASFIEGLTLEGPLGHAARKIVYCLRMPTDEHRVKVGISWFTKTAVDSLASLQNA
SDAAITASFIEGLTLEGPLGHAARKIVYCLRMPTDEHRVKVGISWFTKTAVDSLASLQNA
SDAAITASFIEGLTLEGPLGHAARKIVYCLRMPTDEHRVKVGISWFTKTAVDSLASLQNA
: 540
: 540
Japon_NDC1 :
Indic_NDC1 :
VSSMLTSP
VSSMLTSP
VSSMLTSP
: 548
: 548

Appendix
240
Appendix C: Changes in transcript abundance of alternative respiratory
pathway genes in response to chemical inhibition of mETC
Supplementary Figure C1: Changes in transcript abundance of AOX1a, AOX1b
and AOX1c in roots and shoots in response to antimycin A
Changes in transcript abundance of alternative respiratory genes, AOX1a, AOX1b and AOX1c
were studies in response to the inhibition of Complex III of mETC by antimycin A (AA) and
compared with their respective controls. RNA was extracted from AA-treated and non-treated
2-week old seedlings at 0, 6 and 24 hrs after the treatment and transcript abundance was
assessed by qRT-PCR. Data are shown as relative transcript abundance (relative to geometric
mean of three stable reference genes) of three biological replicates with + SEM. *** and **
represent the significant difference from the respective controls at p<0.001 and p<0.01
respectively according to t-test.

Appendix
241
Supplementary Figure C2: Changes in transcript abundance of NDB1, NDB2
and NDB3 in roots and shoots in response to antimycin A
Changes in transcript abundance of alternative respiratory genes, NDB1, NDB2 and NDB3
were studies in response to the inhibition of Complex III of mETC by antimycin A (AA) and
compared with their respective controls. RNA was extracted from AA-treated and non-treated
2-week old seedlings at 0, 6 and 24 hrs after the treatment and transcript abundance was
assessed by qRT-PCR. Data are shown as relative transcript abundance (relative to geometric
mean of three stable reference genes) of three biological replicates with + SEM. ***, ** and *
represent the significant difference from the respective controls at p<0.001, p<0.002 and
p<0.01 respectively according to t-test.

Appendix
242
Supplementary Figure C3: Changes in transcript abundance of NDA1, NDA2
and NDC1 in roots and shoots in response to antimycin A
Changes in transcript abundance of alternative respiratory genes, NDA1, NDA2 and NDC1
were studies in response to the inhibition of Complex III of mETC by antimycin A (AA) and
compared with their respective controls. RNA was extracted from AA-treated and non-treated
2-week old seedlings at 0, 6 and 24 hrs after the treatment and transcript abundance was
assessed by qRT-PCR. Data are shown as relative transcript abundance (relative to geometric
mean of three stable reference genes) of three biological replicates with + SEM. *** and **
represent the significant difference from the respective controls at p<0.001 and p<0.003
respectively according to t-test.

Appendix
243
Supplementary Figure C4: Changes in transcript abundance of AOX1a, AOX1b
and AOX1c in roots and shoots in response to KCN
Changes in transcript abundance of alternative respiratory genes, AOX1a, AOX1b and AOX1c
were studies in response to the inhibition of Complex IV of mETC by potassium cyanide (KCN)
and compared with their respective controls. RNA was extracted from CN-treated and non-
treated 2-week old seedlings at 0, 6 and 24 hrs after the treatment and transcript abundance
was assessed by qRT-PCR. Data are shown as relative transcript abundance (relative to
geometric mean of three stable reference genes) of three biological replicates with + SEM. ***,
** and * represent the significant difference from the respective controls at p<0.001, p<0.004
and p<0.01 respectively according to t-test.

Appendix
244
Supplementary Figure C5: Changes in transcript abundance of NDB1, NDB2
and NDB3 in roots and shoots in response to KCN
Changes in transcript abundance of alternative respiratory genes, NDB1, NDB2 and NDB3
were studies in response to the inhibition of Complex IV of mETC by potassium cyanide (KCN)
and compared with their respective controls. RNA was extracted from CN-treated and non-
treated 2-week old seedlings at 0, 6 and 24 hrs after the treatment and transcript abundance
was assessed by qRT-PCR. Data are shown as relative transcript abundance (relative to
geometric mean of three stable reference genes) of three biological replicates with + SEM. ***,
and ** represent the significant difference from the respective controls at p<0.001 and p<0.005
respectively according to t-test.

Appendix
245
Supplementary Figure C6: Changes in transcript abundance of NDA1, NDA2
and NDC1 in roots and shoots in response to KCN
Changes in transcript abundance of alternative respiratory genes, NDA1, NDA2 and NDC1
were studies in response to the inhibition of Complex IV of mETC by potassium cyanide (KCN)
and compared with their respective controls. RNA was extracted from CN-treated and non-
treated 2-week old seedlings at 0, 6 and 24 hrs after the treatment and transcript abundance
was assessed by qRT-PCR. Data are shown as relative transcript abundance (relative to
geometric mean of three stable reference genes) of three biological replicates with + SEM. ***
represents the significant difference from the respective controls at p<0.001 according to
t-test.

Appendix
246
Appendix D:
Supplementary Table D1: Fresh weight and dry weight of seedlings tissues from 16 cultivars grown under control and salt-treated conditions
Rice seedlings were grown under 50 mM NaCl for 2 days followed by 120 mM NaCl for further 10 days on hydroponic culture system and plants were harvested for
measurements. Data are shown as mean ± SEM of five biological replicates.
Cultivar Control Salt-treated
Shoot FW (g) Root FW (g) Shoot DW (g) Root DW (g) Shoot FW (g) Root FW (g) Shoot DW (g) Root DW (g)
Sherpa 0.8032 ± 0.06 0.7029 ± 0.04 0.2214 ± 0.01 0.0819 ± 0.004 0.7991 ± 0.03 0.5380 ± 0.02 0.2038 ± 0.01 0.0762 ± 0.002
Koshihikari 0.6563 ± 0.05 0.4399 ± 0.07 0.1679 ± 0.01 0.0630 ± 0.01 0.6466 ± 0.07 0.4335 ± 0.04 0.1584 ± 0.02 0.0588 ± 0.01
Nipponbare 0.5120 ± 0.03 0.3063 ± 0.014 0.1605 ± 0.01 0.0369 ± 0.003 0.4653 ± 0.02 0.2972 ± 0.01 0.1456 ± 0.01 0.0345 ± 0.002
Reiziq 1.1732 ± 0.07 0.8195 ± 0.05 0.2563 ± 0.02 0.1029 ± 0.01 1.0179 ± 0.07 0.8117 ± 0.03 0.2477 ± 0.01 0.0960 ± 0.01
Takiminori 1.9596 ± 0.08 0.9662 ± 0.07 0.4878 ± 0.02 0.1226 ± 0.01 1.0215 ± 0.06 0.5536 ± 0.04 0.3528 ± 0.02 0.0594 ± 0.003
Topaz 0.8438 ± 0.05 0.8651 ± 0.01 0.2011 ± 0.02 0.1006 ± 0.02 0.7574 ± 0.04 0.8295 ± 0.03 0.1895 ± 0.01 0.0862 ± 0.01
Doongara 2.2070 ± 0.12 1.1570 ± 0.05 0.5249 ± 0.03 0.1419 ± 0.01 1.0434 ± 0.06 0.5845 ± 0.06 0.3307 ± 0.02 0.0576 ± 0.005
Kyeema 0.6406 ± 0.03 0.5375 ± 0.03 0.1524 ± 0.01 0.0576 ± 0.003 0.5095 ± 0.02 0.5258 ± 0.05 0.1466 ± 0.01 0.0537 ± 0.004
LTH 1.8779 ± 0.14 0.5782 ± 0.08 0.3394 ± 0.02 0.0734 ± 0.01 0.9644 ± 0.17 0.4449 ± 0.03 0.2239 ± 0.03 0.0576 ± 0.01
Milang 23 0.8959 ± 0.05 0.4205 ± 0.01 0.1809 ± 0.01 0.0449 ± 0.003 0.7321 ± 0.07 0.4097 ± 0.04 0.1657 ± 0.01 0.0411 ± 0.004
Pandang Wong-7 1.6150 ± 0.15 0.7199 ± 0.09 0.3084 ± 0.03 0.0837 ± 0.01 0.9269 ± 0.06 0.5458 ± 0.05 0.2173 ± 0.01 0.0539 ± 0.004
Tequing 1.1335 ± 0.04 0.4993 ± 0.03 0.2310 ± 0.01 0.0569 ± 0.004 0.7577 ± 0.05 0.4158 ± 0.04 0.1640 ± 0.01 0.0396 ± 0.004
IR 64 2.1857 ± 0.15 0.8449 ± 0.04 0.4167 ± 0.03 0.0933 ± 0.005 1.2313 ± 0.09 0.8079 ± 0.04 0.2831 ± 0.02 0.0709 ± 0.004
Phka Rumduol 2.4306 ± 0.08 1.0025 ± 0.02 0.4547 ± 0.01 0.1121 ± 0.003 1.4459 ± 0.11 0.6818 ± 0.06 0.3270 ± 0.02 0.0638 ± 0.004
Pokkali 3.2037 ± 0.14 1.0162 ± 0.13 0.5437 ± 0.02 0.1089 ± 0.01 1.8829 ± 0.07 0.9387 ± 0.09 0.4169 ± 0.01 0.0893 ± 0.008
Lemont 1.7720 ± 0.19 0.7171 ± 0.07 0.3440 ± 0.03 0.0735 ± 0.01 0.7987 ± 0.08 0.4989 ± 0.06 0.1873 ± 0.02 0.0421 ± 0.01

Appendix
247
Appendix E: Media used in tissue culture and transformation
of rice
Culture media were sterilized by autoclaving at 121oC and 15 psi for 15 min.
Stock solutions of phytohormones were filter sterilized before adding to
sterilized media.
N6D medium (Callus induction & subculture medium) (Toki et al., 2006)
Composition mg/l
N6 basal salt mixture with vitamins (Chu, 1978) 3990
Casamino acid (or Casein hydrolysate) 300
Glycine 2.0
myo-inositol 100
L-Proline 2878
Sucrose 30,000
pH 5.8
Gelrite (0.4%) 4,000
Phytohormones
2,4-D* 2.0
* 2, 4-Dichlorophenoxyacetic acid
AB medium (Toki et al., 2006)
Composition mg/l
K2HPO4 3,000 NaH2PO4.2H2O 1,300 NH4Cl 1,000 CaCl2.2H2O 10 FeSO4.7H2O 2.5 KCl 150 MgSO4.7H2O 296 Glucose 5,000
PH 7.2

Appendix
248
AAM medium (Toki et al., 2006)
Composition mg/l Major salts MgSO4.7H2O 250 CaCl2.2H2O 150 NaH2PO4.2H2O 150 KCl 3,000 Minor salts Fe-EDTA 40 MnSO4.4H2O 10 ZnSO4.7H2O 2.0 CuSO4.5H2O 0.025 CoCl2.6H2O 0.025 KI 0.75 H3BO3 3.0 Na2MoO4.2H2O 0.25 Organics Casamino acid 500 Glycine 7.5 L-Arginine 176.7 L-Glutamine 900 L-Aspartic acid 300 myo-inositol 100 Nicotinic acid 1.0 Pyridoxine HCL 1.0 Thiamine HCL 10.0 Sucrose 68,500 Glucose 36,000 pH 5.2 Phytohormones Acetosyringone 20.0

Appendix
249
2N6-AS medium (Co-culture medium) (Hiei et al., 1994)
N6 basal salt mixture with vitamins (Chu, 1978) 3990
Casamino acid (or Casein hydrolysate) 300
myo-inositol 100
Sucrose 30,000
Glucose 10.0g
Gelrite (0.4%) 4,000
pH 5.2
Phytohormones
2,4-D* 2.0
Acetosyringone 20.0
* 2, 4-Dichlorophenoxyacetic acid
RE III medium (Regeneration medium) (Toki et al., 2006)
Composition mg/l
MS basal salt (Murashige and Skoog, 1962) 4330
MS vitamins 1000x 1mL
Casamino acid (or Casein hydrolysate) 2,000
Sucrose 30,000
Sorbitol 30,000
Gelrite (0.4%) 4,000
pH 5.8
Phytohprmones
NAA** 0.05
Kinetin 2.5
** 1-Naphthylacetic acid

Bibliography
250
Bibliography
Abe, F., Kitashiba, H., Kishitani, S., & Toriyama, K. (1997). Isolation of a cDNA clone
encoding the alternative oxidase expressed in rice anthers. Sexual Plant
Reproduction, 10(6), 374-375.
Abe, F., Saito, K., Miura, K., & Toriyama, K. (2002). A single nucleotide polymorphism
in the alternative oxidase gene among rice varieties differing in low
temperature tolerance. FEBS Letters, 527(1-3), 181-185.
Abe, F., & Toriyama, K. (2003). Alternation of the accumulation of alternative oxidase
by introducing sense and antisense OsAOX1a in rice. Plant Biotechnology,
20, 339-341.
Abogadallah, G. M. (2010). Antioxidative defense under salt stress. Plant Signaling &
Behavior, 5(4), 369-374.
Amirsadeghi, S., Robson, C. A., & Vanlerberghe, G. C. (2007). The role of the
mitochondrion in plant responses to biotic stress. Physiologia Plantarum,
129(1), 253-266.
Arnholdt-Schmitt, B., Costa, J. H., & de Melo, D. F. (2006). AOX - a functional marker
for efficient cell reprogramming under stress? Trends in Plant Sciences, 11(6),
281-287.
Armstrong, A. F., Badger, M. R., Day, D. A., Barthet, M. M., Smith, P., Millar, A. H., .
. . Atkin, O. K. (2008). Dynamic changes in the mitochondrial electron transport
chain underpinning cold acclimation of leaf respiration. Plant, Cell &
Environment, 31(8), 1156-1169.
Arumuganathan, K., & Earle, E. D. (1991). Nuclear DNA content of some important
plant species. Plant Molecular Biology Reporter, 9(4), 415-415.
Asch, F., Dingkuhn, M., Dorffling, K., & Miezan, K. (2000). Leaf K/Na ratio predicts
salinity induced yield loss in irrigated rice. Euphytica, 113, 109-118.

Bibliography
251
Aslam, Z., Jeschke, W., Barrett‐Lennard, E., Setter, T., Watkin, E., & Greenway, H.
(1986). Effects of external NaCl on the growth of Atriplex amnicola and the ion
relations and carbohydrate status of the leaves. Plant, Cell & Environment,
9(7), 571-580.
Badawi, G. H., Yamauchi, Y., Shimada, E., Sasaki, R., Kawano, N., Tanaka, K., &
Tanaka, K. (2004). Enhanced tolerance to salt stress and water deficit by
overexpressing superoxide dismutase in tobacco (Nicotiana tabacum)
chloroplasts. Plant Science, 166(4), 919-928.
Balkan, A., Genctan, T., Bilgin, O., & Ulukan, H. (2015). Response of rice (Oryza
sativa L.) to salinity stress at germination and early seedling stage. Pakistan
Journal of Agricultural Sciences, 52(2), 455-461.
Bartley, L., Wu, Y., Saathoff, A., & Sarath, G. (2013). Switchgrass genetics and
breeding challenges. Bioenergy Feedstocks: Breeding and Genetics, 7-31.
Bartoli, C. G., Gomez, F., Gergoff, G., Guiamet, J. J., & Puntarulo, S. (2005). Up-
regulation of the mitochondrial alternative oxidase pathway enhances
photosynthetic electron transport under drought conditions. Journal of
Experimental Botany, 56(415), 1269-1276.
Bennetzen, J. L., Ma, J., & Devos, K. M. (2005). Mechanisms of recent genome size
variation in flowering plants. Annals of Botany, 95(1), 127-132.
Bogacki, P., Peck, D. M., Ramakrishnan, M. N., Howie, J., & Klaus, H. O. (2013).
Genetic analysis of tolerance to boron toxicity in the legume Medicago
truncatula. BMC Plant Biology, 13, 54-64.
Brar, D., & Khush, G. (1997). Alien introgression in rice. Plant Molecular Biology, 35,
35-47.
Butow, R. A., & Avadhani, N. G. (2004). Mitochondrial Signaling: The Retrograde
Response. Molecular Cell, 14(1), 1-15.
Caicedo, A. L., Williamson, S. H., Hernandez, R. D., Boyko, A., Fledel-Alon, A., York,
T. L., . . . Purugganan, M. D. (2007). Genome-wide patterns of nucleotide
polymorphism in domesticated rice. PLoS Genetics, 3(9), e163.

Bibliography
252
Cao, J. (2016). Analysis of the Prefoldin Gene Family in 14 Plant Species. Frontiers
in Plant Science, 7, 317. http://doi.org/10.3389/fpls.2016.00317.
Carillo, P., Annunziata, M. G., Pontecorvo, G., Fuggi, A., & Woodrow, P. (2011).
Salinity Stress and Salt Tolerance. Abiotic Stress Plants-Mech. Adapt. 21-38.
Carrie, C., Murcha, M. W., Kuehn, K., Duncan, O., Barthet, M., Smith, P. M., . . .
Whelan, J. (2008). Type II NAD(P)H dehydrogenases are targeted to
mitochondria and chloroplasts or peroxisomes in Arabidopsis thaliana. FEBS
Letters, 582(20), 3073-3079.
Chagné, D., Batley, J., Edwards, D., & Forster, J. W. (2007). Single Nucleotide
Polymorphism Genotyping in Plants. Association Mapping in Plants, 77-94.
New York.
Chang, T. T. (2003). Origin, domestication, and diversification. Rice: origin, history,
technology, and production. New Jersey USA: J. Wiley and Sons, Inc, 3-25.
Chomczynski, P., & Sacchi, N. (2006). The single-step method of RNA isolation by
acid guanidinium thiocyanate–phenol–chloroform extraction: twenty-
something years on. Nature protocols, 1(2), 581-585.
Chu, C. C. (1975). Establishment of an efficient medium for anther culture of rice
through comparative experiments on the nitrogen sources. Scientia sinica, 18,
659-668.
Clifton, R., Lister, R., Parker, K. L., Sappl, P. G., Elhafez, D., Millar, A. H., . . . Whelan,
J. (2005). Stress-induced co-expression of alternative respiratory chain
components in Arabidopsis thaliana. Plant Molecular Biology, 58(2), 193-212.
Considine, M. J., Holtzapffel, R. C., Day, D. A., Whelan, J., & Millar, A. H. (2002).
Molecular distinction between alternative oxidase from monocots and dicots.
Plant Physiology, 129(3), 949-953.
Considine, M. J., María Sandalio, L., & Helen Foyer, C. (2015). Unravelling how plants
benefit from ROS and NO reactions, while resisting oxidative stress. Annals
of Botany, 116(4), 469-473.

Bibliography
253
Costa, J. H., McDonald, A. E., Arnholdt-Schmitt, B., & Fernandes de Melo, D. (2014).
A classification scheme for alternative oxidases reveals the taxonomic
distribution and evolutionary history of the enzyme in angiosperms.
Mitochondrion, 19, 172-183.
Cotsaftis, O., Plett, D., Johnson, A. A. T., Walia, H., Wilson, C., Ismail, A. M., . . .
Baumann, U. (2011). Root-Specific Transcript Profiling of Contrasting Rice
Genotypes in Response to Salinity Stress. Molecular Plant, 4(1), 25-41.
Cvetkovska, M., & Vanlerberghe, G. C. (2012). Alternative oxidase modulates leaf
mitochondrial concentrations of superoxide and nitric oxide. New Phytologist,
195(1), 32-39.
Das, K., & Roychoudhury, A. (2014). Reactive oxygen species (ROS) and response
of antioxidants as ROS-scavengers during environmental stress in plants.
Frontiers in Environmental Science, 2, 53. doi: 10.3389/fenvs.2014.00053.
Das, P., Nutan, K. K., Singla-Pareek, S. L., & Pareek, A. (2015). Oxidative
environment and redox homeostasis in plants: Dissecting out significant
contribution of major cellular organelles. Frontiers in Environmental Science,
2, 70. doi: 10.3389/fenvs.2014.00070.
Del Rio, L. A. (2015). ROS and RNS in plant physiology: an overview. Journal of
Experimental Botany, 66(10), 2827-2837.
Delseny, M., Salses, J., Cooke, R., Sallaud, C., Regad, F., Lagoda, P., . . .
Ghesquière, A. (2001). Rice genomics: Present and future. Plant Physiology
and Biochemistry, 39(3-4), 323-334.
Dojcinovic, D., Krosting, J., Harris, A., Wagner, D., & Rhoads, D. (2005). Identification
of a region of the Arabidopsis AtAOX1a promoter necessary for mitochondrial
retrograde regulation of expression. Plant Molecular Biology, 58(2), 159-175.
Druka, A., Potokina, E., Luo, Z., Jiang, N., Chen, X., Kearsey, M., & Waugh, R. (2010).
Expression quantitative trait loci analysis in plants. Plant Biotechnology
Journal, 8(1), 10-27.

Bibliography
254
Elhafez, D., Murcha, M. W., Clifton, R., Soole, K. L., Day, D. A., & Whelan, J. (2006).
Characterization of mitochondrial alternative NAD(P)H dehydrogenases in
Arabidopsis: intraorganelle location and expression. Plant and Cell
Physiology, 47(1), 43-54.
Elthon, T. E., & McIntosh, L. (1987). Identification of the alternative terminal oxidase
of higher plant mitochondria. Proceedings of the National Academy of
Sciences, 84(23), 8399-8403.
Elthon, T. E., Nickels, R. L., & McIntosh, L. (1989). Monoclonal antibodies to the
alternative oxidase of higher plant mitochondria. Plant Physiology, 89(4),
1311-1317.
Eynard, A., Lal, R., & Wiebe, K. (2005). Crop Response in Salt-Affected Soils. Journal
of Sustainable Agriculture, 27(1), 5-50.
Fan, C., Ma, J., Guo, Q., Li, X., Wang, H., & Lu, M. (2013). Selection of reference
genes for quantitative real-time PCR in bamboo (Phyllostachys edulis). Plos
One, 8(2), e56573.
FAO. (2009). Declaration of the World Summit on Food Security. World Summit on
Food Security: Food and Agriculture Organization of the United Nations
Rome. 16-18 November 2009. www.fao.org/wsfs/world-summit/en/.
Feng, H. Q., Hou, X. L., Li, X., Sun, K., Wang, R. F., Zhang, T. G., & Ding, Y. P.
(2013). Cell death of rice roots under salt stress may be mediated by cyanide-
resistant respiration. Zeitschrift Fur Naturforschung Section C-a Journal of
Biosciences, 68(1-2), 39-46.
Feng, H. Q., Li, H. Y., Li, X., Duan, J. G., Liang, H. G., Zhi, D. J., & Ma, J. (2007). The
flexible interrelation between AOX respiratory pathway and photosynthesis in
rice leaves. Plant Physiology and Biochemistry, 45(3-4), 228-235.
Feng, H. Q., Li, H. Y., & Sun, K. (2009). Enhanced Expression of Alternative Oxidase
Genes Is Involved in the Tolerance of Rice (Oryza sativa L.) Seedlings to
Drought Stress. Zeitschrift Fur Naturforschung Section C-a Journal of
Biosciences, 64(9-10), 704-710.

Bibliography
255
Feng, H. Q., Sun, K., Li, M. Q., Li, H. Y., Li, X., Li, Y., & Wang, Y. F. (2010a). The
expression, function and regulation of mitochondrial alternative oxidase under
biotic stresses. Molecular Plant Pathology, 11(3), 429-440.
Feng, H. Q., Wang, Y. F., Li, H. Y., Wang, R. F., Sun, K., & Jia, L. Y. (2010b). Salt
stress-induced expression of rice AOX1a is mediated through an
accumulation of hydrogen peroxide. Biologia, 65(5), 868-873.
Ferdose, J., Kawasaki, M., Taniguchi, M., & Miyake, H. (2015). Differential Sensitivity
of Rice Cultivars to Salinity and Its Relation to Ion Accumulation and Root Tip
Structure. Plant Production Science, 12(4), 453-461. doi: 10.1626/pps.12.453.
Ferreira, A. L., Arrabaca, J. D., Vaz-Pinto, V., & Lima-Costa, M. E. (2008). Induction
of alternative oxidase chain under salt stress conditions. Biologia Plantarum,
52(1), 66-71.
Finnegan, P. M., Soole, K. L., & Umbach, A. L. (2004 ). Alternative mitochondrial
electron transport proteins in higher plants. In David A. Day, Harvey Millar &
J. Whelan (Eds.), Plant Mitochondria: from Genome to Function (pp. 163-230).
Springer Netherlands.
Finnegan, P. M., Wooding, A. R., & Day, D. A. (1999). An alternative oxidase
monoclonal antibody recognises a highly conserved sequence among
alternative oxidase subunits. FEBS Letters, 447(1), 21-24.
Flowers, T., & Yeo, A. (1981). Variability in the resistance of sodium chloride salinity
within rice (Oryza sativa L.) varieties. New Phytologist, 88(2), 363-373.
Florenz‐Sarasa, I., Flexas, J., Rasmusson, A. G., Umbach, A. L., Siedow, J. N., &
Ribas‐Carbo, M. (2011). In vivo cytochrome and alternative pathway
respiration in leaves of Arabidopsis thaliana plants with altered alternative
oxidase under different light conditions. Plant, Cell & Environment, 34(8),
1373-1383.
Frederico, A. M., Zavattieri, M. A., Campos, M. D., Cardoso, H. G., McDonald, A. E.,
& Arnholdt-Schmitt, B. (2009). The gymnosperm Pinus pinea contains both
AOX gene subfamilies, AOX1 and AOX2. Physiologia Plantarum, 137(4), 566-
577.

Bibliography
256
Garris, A. J., Tai, T. H., Coburn, J., Kresovich, S., & McCouch, S. (2005). Genetic
structure and diversity in Oryza sativa L. Genetics, 169(3), 1631-1638.
Gaxiola, R. A., Li, J., Undurraga, S., Dang, L. M., Allen, G. J., Alper, S. L., & Fink, G.
R. (2001). Drought-and salt-tolerant plants result from overexpression of the
AVP1 H+-pump. Proceedings of the National Academy of Sciences, 98(20),
11444-11449.
Geisler, D. A., Broselid, C., Hederstedt, L., & Rasmusson, A. G. (2007). Ca2+-binding
and Ca2+-independent respiratory NADH and NADPH dehydrogenases of
Arabidopsis thaliana. Journal of Biological Chemistry, 282(39), 28455-28464.
Geisler, D. A., Johansson, F. I., Svensson, Å. S., & Rasmusson, A. G. (2004).
Antimycin A treatment decreases respiratory internal rotenone-insensitive
NADH oxidation capacity in potato leaves. BMC Plant Biology, 4, 8-8.
Gill, S. S., & Tuteja, N. (2010). Reactive oxygen species and antioxidant machinery
in abiotic stress tolerance in crop plants. Plant Physiology and Biochemistry,
48(12), 909-930.
Gilliland, A. (2003). Genetic Modification of Alternative Respiration Has Differential
Effects on Antimycin A-Induced versus Salicylic Acid-Induced Resistance to
Tobacco mosaic virus. Plant Physiology, 132(3), 1518-1528.
Giraud, E., Ho, L. H. M., Clifton, R., Carroll, A., Estavillo, G., Tan, Y. F., . . . Whelan,
J. (2008). The absence of alternative oxidase1a in Arabidopsis results in acute
sensitivity to combined light and drought stress. Plant Physiology, 147(2), 595-
610.
Giraud, E., Van Aken, O., Ho, L. H., & Whelan, J. (2009). The transcription factor ABI4
is a regulator of mitochondrial retrograde expression of ALTERNATIVE
OXIDASE1a. Plant Physiololy, 150(3), 1286-1296.
Goff, S. A., Ricke, D., Lan, T. H., Presting, G., Wang, R., Dunn, M., . . . Briggs, S.
(2002). A draft sequence of the rice genome (Oryza sativa L. ssp. japonica).
Science, 296(5565), 92-100.

Bibliography
257
Grativol, C., Hemerly, A. S., & Ferreira, P. C. G. (2012). Genetic and epigenetic
regulation of stress responses in natural plant populations. Biochimica et
Biophysica Acta (BBA)-Gene Regulatory Mechanisms, 1819(2), 176-185.
Guenin, S., Mauriat, M., Pelloux, J., Van Wuytswinkel, O., Bellini, C., & Gutierrez, L.
(2009). Normalization of qRT-PCR data: the necessity of adopting a
systematic, experimental conditions-specific, validation of references. Journal
of Experimental Botany, 60(2), 487-493.
Halliwell, B. (2006). Reactive species and antioxidants. Redox biology is a
fundamental theme of aerobic life. Plant Physiology, 141(2), 312-322.
Hammond, J. P., Mayes, S., Bowen, H. C., Graham, N. S., Hayden, R. M., Love, C.
G., . . . Broadley, M. R. (2011). Regulatory hotspots are associated with plant
gene expression under varying soil phosphorus supply in Brassica rapa. Plant
Physiology, 156(3), 1230-1241.
Hekimi, S., Lapointe, J., & Wen, Y. (2011). Taking a “good” look at free radicals in the
aging process. Trends in Cell Biology, 21(10), 569-576.
Hiei, Y., & Komari, T. (2008). Agrobacterium-mediated transformation of rice using
immature embryos or calli induced from mature seed. Nature Protocols, 3(5),
824-834.
Hiei, Y., Komari, T., & Kubo, T. (1997). Transformation of rice mediated by
Agrobacterium tumefaciens. Plant Molecular Biology, 35(1-2), 205-218.
Hiei, Y., Ohta, S., Komari, T., & Kumashiro, T. (1994). Efficient transformation of rice
(Oryza sativa L.) mediated by Agrobacterium and sequence analysis of the
boundaries of the T‐DNA. The Plant Journal, 6(2), 271-282.
Himmelbach, A., Zierold, U., Hensel, G., Riechen, J., Douchkov, D., Schweizer, P., &
Kumlehn, J. (2007). A set of modular binary vectors for transformation of
cereals. Plant Physiology, 145(4), 1192-1200.
Hirochika, H., Sugimoto, K., Otsuki, Y., Tsugawa, H., & Kanda, M. (1996).
Retrotransposons of rice involved in mutations induced by tissue culture.
Proceedings of the National Academy of Sciences, 93(15), 7783-7788.

Bibliography
258
Ho, L. H., Giraud, E., Uggalla, V., Lister, R., Clifton, R., Glen, A., . . . Whelan, J. (2008).
Identification of regulatory pathways controlling gene expression of stress-
responsive mitochondrial proteins in Arabidopsis. Plant Physiology, 147(4),
1858-1873.
Horie, T., Karahara, I., & Katsuhara, M. (2012). Salinity tolerance mechanisms in
glycophytes: An overview with the central focus on rice plants. Rice, 5(1), 11.
doi: 10.1186/1939-8433-5-11.
IRGSP. (2005). The map-based sequence of the rice genome. Nature, 436(7052),
793-800. International Rice Genome sequencing Project.
IRRI. (2000). “Bigger Harvest a Cleaner Planet.”. Journal of Food Distribution
Research, 35(1). International Rice Research Institute. doi:
http://www.irri.org/publications/annual/pdfs/ar2000/biggerharvests.pdf.
Ismail, A., Takeda, S., & Nick, P. (2014). Life and death under salt stress: same
players, different timing? Journal of Experimental Botany, 65(12), 2963-2979.
Ito, Y., Saisho, D., Nakazono, M., Tsutsumi, N., & Hirai, A. (1997). Transcript levels
of tandem-arranged alternative oxidase genes in rice are increased by low
temperature. Gene, 203(2), 121-129.
Jacoby, R. P., Li, L., Huang, S. B., Lee, C., Millar, A. H., & Taylor, N. L. (2012).
Mitochondrial Composition, Function and Stress Response in Plants. Journal
of Integrative Plant Biology, 54(11), 887-906.
Jacoby, R. P., Taylor, N. L., & Millar, A. H. (2011). The role of mitochondrial respiration
in salinity tolerance. Trends in Plant Science, 16(11), 614-623.
Jamil, A., Riaz, S., Ashraf, M., & Foolad, M. (2011). Gene expression profiling of
plants under salt stress. Critical Reviews in Plant Sciences, 30(5), 435-458.
Jayaraman, A., Puranik, S., Rai, N. K., Vidapu, S., Sahu, P. P., Lata, C., & Prasad,
M. (2008). cDNA-AFLP analysis reveals differential gene expression in
response to salt stress in foxtail millet (Setaria italica L.). Molecular
Biotechnology, 40(3), 241-251.

Bibliography
259
Jolivet, Y., Pireaux, J.-C., & Dizengremel, P. (1990). Changes in properties of barley
leaf mitochondria isolated from NaCl-treated plants. Plant Physiology, 94(2),
641-646.
Juszczuk, I. M., & Rychter, A. M. (2003). Alternative oxidase in higher plants. Acta
Biochemica Polonica-English Edition, 50(4), 1257-1272.
Karpova, O. V. (2002). Differential Expression of Alternative Oxidase Genes in Maize
Mitochondrial Mutants. The Plant Cell Online, 14(12), 3271-3284.
Kavitha, P. G., Miller, A. J., Mathew, M. K., & Maathuis, F. J. (2012). Rice cultivars
with differing salt tolerance contain similar cation channels in their root cells.
Journal of Experimental Botany, 63(8), 3289-3296.
Keunen, E., Remans, T., Bohler, S., Vangronsveld, J., & Cuypers, A. (2011). Metal-
induced oxidative stress and plant mitochondria. International Journal of
Molecular Sciences, 12(10), 6894-6918.
Key, S., Ma, J. K., & Drake, P. M. (2008). Genetically modified plants and human
health. Journal of the Royal Society of Medicine, 101(6), 290-298.
Khush, G. S. (1997). Origin, dispersal, cultivation and variation of rice Oryza: From
molecule to plant (pp. 25-34): Springer Netherlands.
Kim, B. R., Nam, H. Y., Kim, S. U., Kim, S. I., & Chang, Y. J. (2003). Normalization of
reverse transcription quantitative-PCR with housekeeping genes in rice.
Biotechnology Letters, 25(21), 1869-1872.
Kovach, M. J., Calingacion, M. N., Fitzgerald, M. A., & McCouch, S. R. (2009). The
origin and evolution of fragrance in rice (Oryza sativa L.). Proceedings of the
National Academy of Sciences, 106(34), 14444-14449.
Kovach, M. J., Sweeney, M. T., & McCouch, S. R. (2007). New insights into the history
of rice domestication. Trends in Genetics, 23(11), 578-587.
Koyama, M. L., Levesley, A., Koebner, R. M. D., Flowers, T. J., & Yeo, A. R. (2001).
Quantitative trait loci for component physiological traits determining salt
tolerance in rice. Plant Physiology, 125(1), 406-422.

Bibliography
260
Krishnamurthy, A., & Rathinasabapathi, B. (2013a). Auxin and its transport play a role
in plant tolerance to arsenite-induced oxidative stress in Arabidopsis thaliana.
Plant, Cell & Environment, 36(10), 1838-1849.
Krishnamurthy, A., & Rathinasabapathi, B. (2013b). Oxidative stress tolerance in
plants: novel interplay between auxin and reactive oxygen species signalling.
Plant Signaling & Behavior, 8(10), e25761.
Kristensen, B. K., Askerlund, P., Bykova, N. V., Egsgaard, H., & Moller, I. M. (2004).
Identification of oxidised proteins in the matrix of rice leaf mitochondria by
immunoprecipitation and two-dimensional liquid chromatography-tandem
mass spectrometry. Phytochemistry, 65(12), 1839-1851.
Kubo, M., & Purevdorj, M. (2004). The Future of Rice Production and Consumption.
Journal of Food Distribution Research, 35(1), 128-142.
Kuhn, K., Yin, G., Duncan, O., Law, S. R., Kubiszewski-Jakubiak, S., Kaur, P., . . .
Whelan, J. (2015). Decreasing electron flux through the cytochrome and/or
alternative respiratory pathways triggers common and distinct cellular
responses dependent on growth conditions. Plant Physiology, 167(1), 228-
250.
Kumar, G., Purty, R. S., Singla-Pareek, S. L., & Pareek, A. (2009). Maintenance of
stress related transcripts in tolerant cultivar at a level higher than sensitive one
appears to be a conserved salinity response among plants. Plant Signaling &
Behavior, 4(5), 431-434.
Kumar, V., Singh, A., Mithra, S. V., Krishnamurthy, S. L., Parida, S. K., Jain, S., . . .
Mohapatra, T. (2015). Genome-wide association mapping of salinity tolerance
in rice (Oryza sativa). DNA Research, 22(2), 133-145.
Kumari, S., Sabharwal, V. P., Kushwaha, H. R., Sopory, S. K., Singla-Pareek, S. L.,
& Pareek, A. (2009). Transcriptome map for seedling stage specific salinity
stress response indicates a specific set of genes as candidate for saline
tolerance in Oryza sativa L. Functional & Integrative Genomics, 9(1), 109-123.
Lee, K. S., Choi, W. Y., Ko, J. C., Kim, T. S., & Gregorio, G. B. (2003). Salinity
tolerance of japonica and indica rice (Oryza sativa L.) at the seedling
stage. Planta, 216(6), 1043-1046.

Bibliography
261
Lee, Y. P., Kim, S. H., Bang, J. W., Lee, H. S., Kwak, S. S., & Kwon, S. Y. (2007).
Enhanced tolerance to oxidative stress in transgenic tobacco plants
expressing three antioxidant enzymes in chloroplasts. Plant Cell
Reports, 26(5), 591-598.
Lei, T., Feng, H., Sun, X., Dai, Q. L., Zhang, F., Liang, H. G., & Lin, H. H. (2010). The
alternative pathway in cucumber seedlings under low temperature stress was
enhanced by salicylic acid. Plant Growth Regulation, 60(1), 35-42.
Li, C. J., Liang, H. G., Du, L. F., & Wang, R. (2000). The relationship between the
activity of cyanide-resistant respiration and the expression of alternative
oxidase in different organs of mung bean seedlings. Acta Botanica Sinica,
42(6), 646-648.
Li, C. R., Liang, D. D., Li, J., Duan, Y. B., Li, H., Yang, Y. C., . . . Yang, J. B. (2013a).
Unravelling mitochondrial retrograde regulation in the abiotic stress induction
of rice ALTERNATIVE OXIDASE 1 genes. Plant, Cell & Environment, 36(4),
775-788.
Li, C. R., Liang, D. D., Xu, R. F., Li, H., Zhang, Y. P., Qin, R. Y., . . . Yang, J. B.
(2013b). Overexpression of an alternative oxidase gene, OsAOX1a, improves
cold tolerance in Oryza sativa L. Genetics and Mololecular Research, 12(4),
5424-5432.
Li, J., Liu, Y., Kim, T., Min, R., & Zhang, Z. (2010a). Gene Expression Variability within
and between Human Populations and Implications toward Disease
Susceptibility. PLoS Computational Biology 6(8): e1000910.
Li, Z., Baldwin, C. M., Hu, Q., Liu, H., & Luo, H. (2010b). Heterologous expression of
Arabidopsis H+‐pyrophosphatase enhances salt tolerance in transgenic
creeping bentgrass (Agrostis stolonifera L.). Plant, Cell & Environment, 33(2),
272-289.
Liu, F., Xu, W., Wei, Q., Zhang, Z., Xing, Z., & etal. (2010). Gene Expression Profiles
Deciphering Rice Phenotypic Variation between Nipponbare (Japonica) and
93-11 (Indica) during Oxidative Stress. PLoS ONE 5(1): e8632.
Liu, Z., & Butow, R. A. (2006). Mitochondrial retrograde signaling. Annual Review of
Genetics, 40, 159-185.

Bibliography
262
Lu, B. R., Zheng, K. L., Qian, H. R., & Zhuang, J. Y. (2002). Genetic differentiation of
wild relatives of rice as assessed by RFLP analysis. Theoretical and Applied
Genetics, 106(1), 101-106.
Luttik, M. A. H., Overkamp, K. M., Kotter, P., de Vries, S., van Dijken, J. P., & Pronk,
J. T. (1998). The Saccharomyces cerevisiae NDE1 and NDE2 genes encode
separate mitochondrial NADH dehydrogenases catalyzing the oxidation of
cytosolic NADH. Journal of Biological Chemistry, 273(38), 24529-24534.
Ma, X., Jin, M., Cai, Y., Xia, H., Long, K., Liu, J., . . . Yuan, J. (2011). Mitochondrial
electron transport chain complex III is required for antimycin A to inhibit
autophagy. Chemistry and Biology, 18(11), 1474-1481.
Machado, H. E., & Cruzan, M. B. (2010). Intraspecific variation in gene expression
under prolonged drought in Piriqueta hybrids and their parental taxa. Plant
Science, 178(5), 429-439.
Maclean, J. L., Dawe, D. C., Hardy, B., & Hettel, G. P. (2002). Rice almanac: Source
book for the most important economic activity on earth: International Rice
Research Institute.
Maxwell, D. P., Wang, Y., & McIntosh, L. (1999). The alternative oxidase lowers
mitochondrial reactive oxygen production in plant cells. Proceedings of the
National Academy of Sciences, 96(14), 8271-8276.
McCabe, T. C., Finnegan, P. M., Millar, A. H., Day, D. A., & Whelan, J. (1998).
Differential expression of alternative oxidase genes in soybean cotyledons
during postgerminative development. Plant Physiology, 118(2), 675-682.
McCouch, S. R. (2008). Gene Nomenclature System for Rice. Rice, 1(1), 72-84.
McDonald, A., Amirsadeghi, S., & Vanlerberghe, G. (2003). Prokaryotic orthologues
of mitochondrial alternative oxidase and plastid terminal oxidase. Plant
Molecular Biology, 53(6), 865-876.
McDonald, A. E. (2008). Alternative oxidase: an inter-kingdom perspective on the
function and regulation of this broadly distributed 'cyanide-resistant' terminal
oxidase. Functional Plant Biology, 35(7), 535-552.

Bibliography
263
McDonald, A. E. (2009). Alternative oxidase: what information can protein sequence
comparisons give us? Physiologia Plantarum, 137(4), 328-341.
McDonald, A. E., & Vanlerberghe, G. C. (2004). Branched mitochondrial electron
transport in the animalia: Presence of alternative oxidase in several animal
phyla. IUBMB Life, 56(6), 333-341.
McDonald, A. E., & Vanlerberghe, G. C. (2006). Origins, evolutionary history, and
taxonomic distribution of alternative oxidase and plastoquinol terminal
oxidase. Comparative Biochemistry and Physiology Part D: Genomics and
Proteomics, 1(3), 357-364.
McKersie, B. D., Bowley, S. R., Harjanto, E., & Leprince, O. (1996). Water-deficit
tolerance and field performance of transgenic alfalfa overexpressing
superoxide dismutase. Plant Physiology, 111(4), 1177-1181.
Mhadhbi, H., Fotopoulos, V., Mylona, P. V., Jebara, M., Aouani, M. E., & Polidoros,
A. N. (2013). Alternative oxidase 1 (Aox1) gene expression in roots of
Medicago truncatula is a genotype-specific component of salt stress tolerance.
Journal of Plant Physiology, 170(1), 111-114.
Mhadhbi, H., Fotopoulos, V., Mylona, P. V., Jebara, M., Elarbi Aouani, M., &
Polidoros, A. N. (2011). Antioxidant gene-enzyme responses in Medicago
truncatula genotypes with different degree of sensitivity to salinity. Physiologia
Plantarum, 141(3), 201-214.
Michalecka, A. M., Agius, S. C., Møller, I. M., & Rasmusson, A. G. (2004).
Identification of a mitochondrial external NADPH dehydrogenase by
overexpression in transgenic Nicotiana sylvestris. The Plant Journal, 37(3),
415-425.
Michalecka, A. M., Svensson, A. S., Johansson, F. I., Agius, S. C., Johanson, U.,
Brennicke, A., . . . Rasmusson, A. G. (2003). Arabidopsis genes encoding
mitochondrial type II NAD(P)H dehydrogenases have different evolutionary
orgin and show distinct responses to light. Plant Physiology, 133(2), 642-652.
Millar, A. H., Whelan, J., Soole, K. L., & Day, D. A. (2011). Organization and
Regulation of Mitochondrial Respiration in Plants. Annual Review of Plant
Biology, Vol 62, 62, 79-104.

Bibliography
264
Mizuno, N., Sugie, A., Kobayashi, F., & Takumi, S. (2008). Mitochondrial alternative
pathway is associated with development of freezing tolerance in common
wheat. Journal of Plant Physiology, 165(4), 462-467.
Mohammadi-Nejad, G., Singh, R., Arzani, A., Rezaie, A., Sabouri, H., & Gregorio, G.
(2012). Evaluation of salinity tolerance in rice genotypes. International Journal
of Plant Production, 4(3),199-208.
Molina, J., Sikora, M., Garud, N., Flowers, J. M., Rubinstein, S., Reynolds, A., . . .
Purugganan, M. D. (2011). Molecular evidence for a single evolutionary origin
of domesticated rice. Proceedings of the National Academy of Sciences,
108(20), 8351-8356.
Moller, I. M. (2001). Plant mitochondria and oxidative stress: Electron transport,
NADPH turnover, and metabolism of reactive oxygen species. Annual Review
of Plant Physiology and Plant Molecular Biology, 52, 561-591.
Moller, I. M., & Kristensen, B. K. (2004). Protein oxidation in plant mitochondria as a
stress indicator. Photochemical & Photobiological Sciences, 3(8), 730-735.
Mukaka, M. (2012). A guide to appropriate use of correlation coefficient in medical
research. Malawi Medical Journal, 24(3), 69-71.
Munns, R. (1993). Physiological processes limiting plant growth in saline soils: some
dogmas and hypotheses. Plant, Cell & Environment, 16(1), 15-24.
Munns, R., & Tester, M. (2008). Mechanisms of salinity tolerance Annual Review of
Plant Biology, 59, 651-681.
Murakami, Y., & Toriyama, K. (2008). Enhanced high temperature tolerance in
transgenic rice seedlings with elevated levels of alternative oxidase,
OsAOX1a. Plant Biotechnology, 25(4), 361-364.
Murashige, T., & Skoog, F. (1962). A revised medium for rapid growth and bio assays
with tobacco tissue cultures. Physiologia Plantarum, 15(3), 473-497.

Bibliography
265
Ng, S., De Clercq, I., Van Aken, O., Law, S. R., Ivanova, A., Willems, P., . . . Whelan,
J. (2014). Anterograde and retrograde regulation of nuclear genes encoding
mitochondrial proteins during growth, development, and stress. Mololecular
Plant, 7(7), 1075-1093.
NLWRA. (2001). National Land & Water Resources Audit & Natural Heritage Trust
(Australia), NLWRA, Canberra. http://lwa.gov.au/programs/.
Ohtsu, K., Ito, Y., Saika, H., Nakazono, M., Tsutsumi, N., & Hirai, A. (2002). ABA-
Independent Expression of Rice Alternative Oxidase Genes under
Environmental Stresses. Plant Biotechnology, 19(3), 187-190.
Oka, H. I. (1974). Experimental studies on the origin of cultivated rice. Genetics, 78(1),
475-486.
Opabode, J. T. (2006). Agrobacterium-mediated transformation of plants: emerging
factors that influence efficiency. Biotechnology and Molecular Biology
Reviews, 1(1), 12-20.
Orozco, L. D., Cokus, S. J., Ghazalpour, A., Ingram-Drake, L., Wang, S., van Nas, A.,
. . . Lusis, A. J. (2009). Copy number variation influences gene expression and
metabolic traits in mice. Human Molecular Genetics, 18(21), 4118-4129.
Pallotta, M. A., Warner, P., Fox, R. L., Kuchel, H., Jefferies, S. J., & Langridge, P.
(2003, September). Marker assisted wheat breeding in the southern region of
Australia. Proceedings of 10th International Wheat Genetics Symposium,
Paestum, Italy (pp. 1-6).
Panda, S. K., Sahoo, L., Katsuhara, M., & Matsumoto, H. (2013). Overexpression of
Alternative Oxidase Gene Confers Aluminum Tolerance by Altering the
Respiratory Capacity and the Response to Oxidative Stress in Tobacco Cells.
Molecular Biotechnology, 54(2), 551-563.
Pandey, S., Byerlee, D., Dawe, D., Dobermann, A., Mohanty, S., Rozelle, S., & Hardy,
B. (2010). Rice in the global economy: strategic research and policy issues for
food security. The International Rice Research Institute.
http://irri.org/resources/publications/books/.

Bibliography
266
Pasapula, V., Shen, G., Kuppu, S., Paez-Valencia, J., Mendoza, M., Hou, P., . . .
Payton, P. (2011). Expression of an Arabidopsis vacuolar H+-
pyrophosphatase gene (AVP1) in cotton improves drought- and salt-tolerance
and increases fibre yield in the field conditions. Plant Biotechnology Journal,
9(1), 88-99.
Pires, I. S., Negrao, S., Oliveira, M. M., & Purugganan, M. D. (2015). Comprehensive
phenotypic analysis of rice (Oryza sativa) response to salinity stress.
Physiologia Plantarum, 155(1), 43-54.
Platten, J. D., Egdane, J. A., & Ismail, A. M. (2013). Salinity tolerance, Na+ exclusion
and allele mining of HKT1;5 in Oryza sativa and O. glaberrima: many sources,
many genes, one mechanism? BMC Plant Biology, 13(1), 1-16.
Polidoros, A. N., Mylona, P. V., & Arnholdt-Schmitt, B. (2009). AOX gene structure,
transcript variation and expression in plants. Physiologia Plantarum, 137(4),
342-353.
Pu, X. J., Lv, X., & Lin, H. H. (2015). Unraveling the evolution and regulation of the
alternative oxidase gene family in plants. Development Genes and Evolution,
225(6), 331-339.
Purugganan, M. D. (2014). An evolutionary genomic tale of two rice species. Nature
Genetics, 46(9), 931-932.
Rad, H., Aref, F., & Rezaei, M. (2012). Response of rice to different salinity levels
during different growth stages. Research Journal of Applied Sciences,
Engineering and Technology, 4, 3040-3047.
Rajendran, K., Tester, M., & Roy, S. J. (2009). Quantifying the three main components
of salinity tolerance in cereals. Plant, Cell & Environment, 32(3), 237-249.
Rakshit, S., Rakshit, A., Matsumura, H., Takahashi, Y., Hasegawa, Y., Ito, A., . . .
Terauchi, R. (2007). Large-scale DNA polymorphism study of Oryza sativa
and O. rufipogon reveals the origin and divergence of Asian rice. Theoretical
and Applied Genetics, 114(4), 731-743.

Bibliography
267
Ranawake, A. L., Mori, N., & Nakamura, C. (2012). Expression profiles of stress
responsive genes in rice (Oryza sativa L.) under abiotic
stresses. Biotechnology & Biotechnological Equipment, 26(2), 2838-2843.
Rashid, H., Yokoi, S., Toriyama, K., & Hinata, K. (1996). Transgenic plant production
mediated by Agrobacterium in indica rice. Plant Cell Reports, 15(10), 727-730.
Rasmusson, A. G., & Agius, S. C. (2001). Rotenone-insensitive NAD(P)H
dehydrogenases in plants: Immunodetection and distribution of native proteins
in mitochondria. Plant Physiology and Biochemistry, 39(12), 1057-1066.
Rasmusson, A. G., & Moller, I. M. (1991). Effect of calcium ions and inhibitors on
internal NAD (P) H dehydrogenases in plant mitochondria. European Journal
of Biochemistry, 202(2), 617-623.
Rasmusson, A. G., Soole, K. L., & Elthon, T. E. (2004). Alternative NAD(P)H
dehydrogenases of plant mitochondria. Annual Review of Plant Biology, 55,
23-39.
Rasmusson, A. G., Svensson, A. S., Knoop, V., Grohmann, L., & and Brennicke, A.
(1999). Homologues of yeast and bacterial rotonone-insensitive NADH
dehydrogenases in higher eukaryotes: two enzymes are present in potato
mitochondria. The Plant Journal, 20(1), 79.87.
Rasmusson, A. G., & Wallstrom, S. V. (2010). Involvement of mitochondria in the
control of plant cell NAD(P)H reduction levels. Biochemical Society
Transactions, 38(2), 661-666.
Reguera, M., Peleg, Z., & Blumwald, E. (2012). Targeting metabolic pathways for
genetic engineering abiotic stress-tolerance in crops. Biochimica et
Biophysica Acta (BBA)-Gene Regulatory Mechanisms, 1819(2), 186-194.
Rengasamy, P. (2006). World salinization with emphasis on Australia. Journal of
Experimental Botany, 57(5), 1017-1023.
Rhoads, D., & Vanlerberghe, G. (2004). Mitochondria-Nucleus Interactions: Evidence
for Mitochondrial Retrograde Communication in Plant Cells. In D. Day, A. H.
Millar & J. Whelan (Eds.), Plant Mitochondria: from Genome to Function (pp.
83-106): Springer Netherlands.

Bibliography
268
Rhoads, D. M., & Subbaiah, C. C. (2007). Mitochondrial retrograde regulation in
plants. Mitochondrion, 7(3), 177-194.
Rhoads, D. M., Umbach, A. L., Subbaiah, C. C., & Siedow, J. N. (2006). Mitochondrial
reactive oxygen species. Contribution to oxidative stress and interorganellar
signaling. Plant Physiology, 141(2), 357-366.
Roberts, T. H., Fredlund, K. M., & Moller, I. M. (1995). Direct evidence for the
prsesence of 2 external NAD(P)H dehydrogenases coupled to the electron-
transport chain in plant-mitochondria. FEBS Letters, 373(3), 307-309.
Roy, S., & Chakraborty, U. (2014). Salt tolerance mechanisms in Salt Tolerant
Grasses (STGs) and their prospects in cereal crop improvement. Botanical
Studies, 55(1), 31.
Ruiz-Carrasco, K., Antognoni, F., Coulibaly, A. K., Lizardi, S., Covarrubias, A.,
Martinez, E. A., . . . Zurita-Silva, A. (2011). Variation in salinity tolerance of
four lowland genotypes of quinoa (Chenopodium quinoa Willd.) as assessed
by growth, physiological traits, and sodium transporter gene expression. Plant
Physiology and Biochemistry, 49(11), 1333-1341.
Sah, S. K., Kaur, A., Kaur, G., & Cheema, G. S. (2014). Genetic Transformation of
Rice: Problems, Progress and Prospects. Journal of Rice Research, 3:132.
doi: 10.4172/2375-4338.1000132.
Saika, H., Ohtsu, K., Hamanaka, S., Nakazono, M., Tsutsumi, N., & Hirai, A. (2002a).
AOX1c, a novel rice gene for alternative oxidase; comparison with rice AOX1a
and AOX1b. Genes & Genetic Systems, 77(1), 31-38.
Saika, H., Tsutsumi, N., Hirai, A., & and Nakazono, M. (2002b). Transcript level of rice
alternative oxidase-1a gene increases by treatment with sodium azide, an
inhibitor of cytochrome c oxidaseeases.
www.gramene.org/newsletters/rice_genetics/
Sairam, R. K., & Tyagi, A. (2004). Physiology and molecular biology of salinity stress
tolerance in plants. Current Science-Bangalore, 86(3), 407-421.

Bibliography
269
Saisho, D., Nambara, E., Naito, S., Tsutsumi, N., Hirai, A., & Nakazono, M. (1997).
Characterization of the gene family for alternative oxidase from Arabidopsis
thaliana. Plant Molecular Biology, 35(5), 585-596.
Saitou, N., & Nei, M. (1987). The neighbor-joining method: a new method for
reconstructing phylogenetic trees. Molecular Biology and Evolution, 4(4), 406-
425.
Sasaki, T., & Sederoff, R. R. (2003). Genome studies and molecular genetics: the rice
genome and comparative genomics of higher plants. Current Opinion in Plant
Biology, 6(2), 97-100.
Schilling, R. K., Marschner, P., Shavrukov, Y., Berger, B., Tester, M., Roy, S. J., &
Plett, D. C. (2014). Expression of the Arabidopsis vacuolar H(+)-
pyrophosphatase gene (AVP1) improves the shoot biomass of transgenic
barley and increases grain yield in a saline field. Plant Biotechnology Journal,
12(3), 378-386.
Schmülling, T., & Schell, J. (1993). Transgenic tobacco plants regenerated from leaf
disks can be periclinal chimeras. Plant Molecular Biology, 21(4), 705-708.
Schwarzlander, M., Fricker, M. D., & Sweetlove, L. J. (2009). Monitoring the in vivo
redox state of plant mitochondria: effect of respiratory inhibitors, abiotic stress
and assessment of recovery from oxidative challenge. Biochimica et
Biophysica Acta (BBA)-Bioenergetics, 1787(5), 468-475.
Senadheera, P., Singh, R. K., & Maathuis, F. J. M. (2009). Differentially expressed
membrane transporters in rice roots may contribute to cultivar dependent salt
tolerance. Journal of Experimental Botany, 60(9), 2553-2563.
Sharma, P., Jha, A. B., Dubey, R. S., & Pessarakli, M. (2012). Reactive Oxygen
Species, Oxidative Damage, and Antioxidative Defense Mechanism in Plants
under Stressful Conditions. Journal of Botany, 2012, 1-26.
Shavrukov, Y., Genc, Y., & Hayes, J. (2012). The use of hydroponics in abiotic stress
tolerance research. In D. T. Asao (Ed.), Hydroponics - A Standard
Methodology for Plant Biological Researches (pp. 39-66).

Bibliography
270
Shiba, T., Kido, Y., Sakamoto, K., Inaoka, D. K., Tsuge, C., Tatsumi, R., . . . Kita, K.
(2013). Structure of the trypanosome cyanide-insensitive alternative oxidase.
Proceedings of the National Academy of Sciences, 110(12), 4580-4585.
Shimamoto, K., & Kyozuka, J. (2002). Rice as a model for comparative genomics of
plants. Annual Review of Plant Biology, 53, 399-419.
Siedow, J. N., & Day, D. A. (2000). Respiration and photorespiration. Biochemistry
and molecular biology of plants. American Society of Plant Physiologists,
Rockville, MD, 676-728.
Siedow, J. N., & Umbach, A. L. (2000). The mitochondrial cyanide-resistant oxidase:
structural conservation amid regulatory diversity. Biochimica et Biophysica
Acta (BBA)-Bioenergetics, 1459(2-3), 432-439.
Smith, C., Barthet, M., Melino, V., Smith, P., Day, D., & Soole, K. (2011). Alterations
in the Mitochondrial Alternative NAD(P)H Dehydrogenase NDB4 Lead to
Changes in Mitochondrial Electron Transport Chain Composition, Plant
Growth and Response to Oxidative Stress. Plant and Cell Physiology, 52(7),
1222-1237.
Smith, C. A., Melino, V. J., Sweetman, C., & Soole, K. L. (2009). Manipulation of
alternative oxidase can influence salt tolerance in Arabidopsis thaliana.
Physiologia Plantarum, 137(4), 459-472.
Sorrells, M. E., La Rota, M., Bermudez-Kandianis, C. E., Greene, R. A., Kantety, R.,
Munkvold, J. D., . . . Qualset, C. O. (2003). Comparative DNA Sequence
Analysis of Wheat and Rice Genomes. Genome Research, 13(8), 1818-1827.
Steduto, P., Faurès, J., Hoogeveen, J., Winpenny, J., & Burke, J. (2012). Coping with
water scarcity: an action framework for agriculture and food security. Food and
Agriculture Organization of the United Nations: Rome, Italy.
Sugie, A., Naydenov, N., Mizuno, N., Nakamura, C., & Takumi, S. (2006).
Overexpression of wheat alternative oxidase gene Waox1a alters respiration
capacity and response to reactive oxygen species under low temperature in
transgenic Arabidopsis. Genes & Genetic Systems, 81(5), 349-354.

Bibliography
271
Svensson, A. S., Johnsson, F. I., Moller, I. M., & Rasmusson, A. G. (2002). Cold stress
decreases the capacity for respiratory NADH oxidation in potato leaves. FEBS
Letters, 517(1-3), 79-82.
Svensson, A. S., & Rasmusson, A. G. (2001). Light-dependent gene expression for
proteins in the respiratory chain of potato leaves. The Plant Journal, 28(1), 73-
82.
Takumi, S., Tomioka, M., Eto, K., Naydenov, N., & Nakamura, C. (2002).
Characterization of two non-homoeologous nuclear genes encoding
mitochondrial alternative oxidase in common wheat. Genes & Genetic
Systems, 77(2), 81-88.
Tamura, K., Stecher, G., Peterson, D., Filipski, A., & Kumar, S. (2013). MEGA6:
molecular evolutionary genetics analysis version 6.0. Molecular Biology and
Evolution, mst197.
Tanudji, M., Djajanegara, I. N., Daley, D. O., McCabe, T. C., Finnegan, P. M., Day, D.
A., & Whelan, J. (1999). The multiple alternative oxidase proteins of
soybean. Functional Plant Biology, 26(4), 337-344.
Tester, M., & Davenport, R. (2003). Na+ tolerance and Na+ transport in higher plants.
Annals of Botany, 91(5), 503-527.
Tester, M., & Langridge, P. (2010). Breeding technologies to increase crop production
in a changing world. Science, 327(5967), 818-822.
Thirkettle-Watts, D., McCabe, T. C., Clifton, R., Moore, C., Finnegan, P. M., Day, D.
A., & Whelan, J. (2003). Analysis of the alternative oxidase promoters from
soybean. Plant Physiology, 133(3), 1158-1169.
Todaka, D., Nakashima, K., Shinozaki, K., & Yamaguchi-Shinozaki, K. (2012).
Toward understanding transcriptional regulatory networks in abiotic stress
responses and tolerance in rice. Rice, 5(1), 6. doi: 10.1186/1939-8433-5-6.
Toki, S. (1997). Rapid and efficient Agrobacterium-mediated transformation in rice.
Plant Molecular Biology Reporter, 15(1), 16-21.

Bibliography
272
Toki, S., Hara, N., Ono, K., Onodera, H., Tagiri, A., Oka, S., & Tanaka, H. (2006).
Early infection of scutellum tissue with Agrobacterium allows high-speed
transformation of rice. The Plant Journal, 47(6), 969-976.
Umbach, A. L., Ng, V. S., & Siedow, J. N. (2006). Regulation of plant alternative
oxidase activity: A tale of two cysteines. Biochimica et Biophysica Acta (BBA)-
Bioenergetics, 1757(2), 135-142.
Umbach, A. L., & Siedow, J. N. (1993). Covalent and noncovalent dimers of the
cyanide-resistant alternative oxidase protein in higher plant mitochondria and
their relationship to enzyme activity. Plant Physiology, 103(3), 845-854.
Umbach, A. L., Zarkovic, J., Yu, J., Ruckle, M. E., McIntosh, L., Hock, J. J., . . .
Rhoads, D. M. (2012). Comparison of intact Arabidopsis thaliana leaf
transcript profiles during treatment with inhibitors of mitochondrial electron
transport and TCA cycle. Plos One, 7(9), e44339.
Van Aken, O., Giraud, E., Clifton, R., & Whelan, J. (2009). Alternative oxidase: a target
and regulator of stress responses. Physiologia Plantarum, 137(4), 354-361.
Vandesompele, J., De Preter, K., Pattyn, F., Poppe, B., Van Roy, N., De Paepe, A.,
& Speleman, F. (2002). Accurate normalization of real-time quantitative RT-
PCR data by geometric averaging of multiple internal control genes. Genome
Biology, 3(7). doi: 10.1186/gb-2002-3-7-research0034.
Vanlerberghe, G. C. (2013). Alternative oxidase: a mitochondrial respiratory pathway
to maintain metabolic and signaling homeostasis during abiotic and biotic
stress in plants. International Journal of Molecular Sciences, 14(4), 6805-
6847.
Vanlerberghe, G. C., Cvetkovska, M., & Wang, J. (2009). Is the maintenance of
homeostatic mitochondrial signaling during stress a physiological role for
alternative oxidase? Physiologia Plantarum, 137(4), 392-406.
Vanlerberghe, G. C., & McIntosh, L. (1997). Alternative oxidase: From gene to
function. Annual Review of Plant Physiology and Plant Molecular Biology, 48,
703-734.

Bibliography
273
Vanlerberghe, G. C., & Mclntosh, L. (1996). Signals Regulating the Expression of the
Nuclear Gene Encoding Alternative Oxidase of Plant Mitochondria. Plant
Physiology, 111(2), 589-595.
Vanlerberghe, G. C., Vanlerberghe, A. E., & McIntosh, L. (1994). Molecular genetic
alteration of plant respiration: silencing and overexpression of alternative
oxidase in transgenic tobacco. Plant Physiology, 106(4), 1503-1510.
Vincze, T., Posfai, J., & Roberts, R. J. (2003). NEBcutter: a program to cleave DNA
with restriction enzymes. Nucleic Acids Research, 31(13), 3688-3691.
Wagner, A. M., & Moore, A. L. (1997). Structure and function of the plant alternative
oxidase: Its putative role in the oxygen defence mechanism. Bioscience
Reports, 17(3), 319-333.
Walia, H., Wilson, C., Condamine, P., Liu, X., Ismail, A. M., Zeng, L. H., . . . Close, T.
J. (2005). Comparative transcriptional profiling of two contrasting rice
genotypes under salinity stress during the vegetative growth stage. Plant
Physiology, 139(2), 822-835.
Wang, J., Rajakulendran, N., Amirsadeghi, S., & Vanlerberghe, G. C. (2011). Impact
of mitochondrial alternative oxidase expression on the response of Nicotiana
tabacum to cold temperature. Physiologia Plantarum, 142(4), 339-351.
Wang, X., Zhang, Z. W., Tu, S. H., Feng, W. Q., Xu, F., Zhu, F., . . . Lin, H. H. (2013).
Comparative study of four rice cultivars with different levels of cadmium
tolerance. Biologia, 68(1), 74-81.
Weiss, H., Jagow, G., Klingenberg, M., & Bücher, T. (1970). Characterization of
Neurospora crassa Mitochondria Prepared with a Grind‐Mill. European
Journal of Biochemistry, 14(1), 75-82.
Whelan, J., Millar, A. H., & Day, D. A. (1996). The alternative oxidase is encoded in a
multigene family in soybean. Planta, 198(2), 197-201.
Xiao, M., Ma, J., Li, H. Y., Jin, H., & Feng, H. Q. (2010). Effects of Hydrogen Sulfide
on Alternative Pathway Respiration and Induction of Alternative Oxidase Gene
Expression in Rice Suspension Cells. Zeitschrift Fur Naturforschung Section
C-a Journal of Biosciences, 65(7-8), 463-471.

Bibliography
274
Xie, J., Zapata-Arias, F., Shen, M., & Afza, R. (2000). Salinity tolerant performance
and genetic diversity of four rice varieties. Euphytica, 116(2), 105-110.
Xiong, L., & Zhu, J. K. (2002). Molecular and genetic aspects of plant responses to
osmotic stress. Plant, Cell & Environment, 25(2), 131-139.
Xu, L., Law, S. R., Murcha, M. W., Whelan, J., & Carrie, C. (2013). The dual targeting
ability of type II NAD(P)H dehydrogenases arose early in land plant evolution.
BMC Plant Biology, 13(1),100.
Yang, J., Zhang, M., & Yu, J. (2008). Mitochondrial retrograde regulation tuning fork
in nuclear genes expressions of higher plants. Journal of Genetics and
Genomics, 35(2), 65-71.
Yeo, A. R., & Flowers, T. J. (1986). Salinity resistance in rice (Oryza sativa L.) and a
pyramiding approach to breeding varieties for saline soils. Functional Plant
Biology, 13(1), 161-173.
Yeo, A. R., Yeo, M. E., Flowers, S. A., & Flowers, T. J. (1990). Screening of rice
(Oryza sativa L.) genotypes for physiological characters contributing to salinity
resistance, and their relationship to overall performance. Theoretical and
Applied Genetics, 79(3), 377-384.
Zeng, L., Shannon, M. C., & Lesch, S. M. (2001). Timing of salinity stress affects rice
growth and yield components. Agricultural Water Management, 48(3), 191-
206.
Zhang, L., Oh, Y., Li, H., Baldwin, I. T., & Galis, I. (2012). Alternative oxidase in
resistance to biotic stresses: Nicotiana attenuata AOX contributes to
resistance to a pathogen and a piercing-sucking insect but not Manduca sexta
larvae. Plant physiology, 160(3), 1453-1467.
Zhang, Y., Xi, D., Wang, J., Zhu, D., & Guo, X. (2009). Functional analysis reveals
effects of tobacco alternative oxidase gene (NtAOX1a) on regulation of
defence responses against abiotic and biotic stresses. Bioscience reports,
29(6), 375-383.

Bibliography
275
Zhao, F.-Y., Zhang, X.-J., Li, P.-H., Zhao, Y.-X., & Zhang, H. (2006). Co-expression
of the Suaeda salsa SsNHX1 and Arabidopsis AVP1 confer greater salt
tolerance to transgenic rice than the single SsNHX1. Molecular Breeding,
17(4), 341-353.
Zhao, F. Y., & Zhang, H. (2006). Salt and paraquat stress tolerance results from co-
expression of the Suaeda salsa glutathione S-transferase and catalase in
transgenic rice. Plant Cell Tissue and Organ Culture, 86(3), 349-358.
Zhao, K., Wright, M., Kimball, J., Eizenga, G., McClung, A., Kovach, M., . . . McCouch,
S. R. (2010). Genomic diversity and introgression in O. sativa reveal the
impact of domestication and breeding on the rice genome. Plos One, 5(5),
e10780.
Zhu, J. K., Hasegawa, P. M., & Bressan, R. A. (1997). Molecular aspects of osmotic
stress in plants. Critical Reviews in Plant Sciences, 16(3), 253-277.


![Characterization of Stress-Responsive CIPK Genes...Characterization of Stress-Responsive CIPK Genes in Rice for Stress Tolerance Improvement1[W] Yong Xiang, Yuemin Huang, and Lizhong](https://img.pdfslide.us/doc/110x75/5f0eef497e708231d441a96d/characterization-of-stress-responsive-cipk-characterization-of-stress-responsive.jpg)