Embed Size (px)
Citation preview
Alternative Measures of Income Poverty and the Anti-poverty Effects of Taxes and Transfers
by
Daniel H. Weinberg
Chief Economist and Chief, Center for Economic Studies
U.S. Census Bureau
Washington, DC 20233-8500 USA
June 13, 2005
[E-mail: [email protected]]
ABSTRACT
The Census Bureau prepared a number of alternative income-based measures of poverty to illustrate the distributional impacts of several alternatives to the official measure. The paper examines five income variants for two different units of analysis (families and households) for two different assumptions about inflation (the historical Consumer Price Index and a “Research Series” alternative that uses current methods) for two different sets of thresholds (official and a formula-based alternative base on three parameters). The poverty rate effects are analyzed for the total population, the distributional effects are analyzed using poverty shares, and the anti-poverty effects of taxes and transfers are analyzed using a percentage reduction in poverty rates. Suggestions for future research are included.
ACKNOWLEDGEMENTS
This paper is based on a presentation to a University of Maryland-American Enterprise Institute seminar on “Revisiting the Federal Poverty Measure,” May 10, 2005. This paper is released to inform interested parties of research and to encourage discussion. The views expressed on technical issues are those of the author and not necessarily those of the U.S. Census Bureau. The author would like to acknowledge and thank Douglas Besharov, Rebecca Blank, Nancy Gordon, Gordon Green, David Hornick, Charles Nelson, Robert Rector, Robert Reischauer, and Kathleen Short for their comments and suggestions; they bear no responsibility for any errors that remain. I also wish to thank Joseph Dalaker of the Census Bureau and John Coder of Sentier Research for carrying out the tabulations presented here.
2
Alternative Measures of Income Poverty and the Anti-poverty Effects of Taxes and Transfers
In July 2004, at the invitation of several federal agencies and with the funding of the U.S. Census
Bureau, the University of Maryland’s Welfare Reform Academy began a series of seminars on
“Revisiting the Federal Poverty Measure” held at the American Enterprise Institute. As noted in
the project’s prospectus (Besharov and Germanis, 2004), despite its wide use as a measure of
material well-being, numerous commentators have identified flaws in the construction of the
official measure of poverty (see for example, Citro and Michael, 1995; Ruggles, 1990). The
purpose of the project was to establish a “strongly diverse ‘research seminar’ to explore the
limitations of the current federal poverty measure and identify alternative approaches for gauging
the well-being of low-income Americans” [Besharov and Germanis, 2004, p. 2].
In response to a request from the seminar organizers, the Census Bureau prepared a number of
alternative income-based measures of poverty to illustrate the distributional impacts of those
alternatives and suggest a method for gauging the impact of taxes and transfers on poverty. This
paper discusses those alternatives in four sections. The first section describes the measures being
calculated. The second section discusses pre-transfer poverty and its distribution. The third
section discusses the anti-poverty effect of taxes and transfers. The fourth section presents some
findings on the effect of adjustments for unreported income.
In keeping with Census Bureau policy, no recommendations are made, though some further
directions for research are indicated in the final section. The Office of Management and Budget
(OMB) is responsible for any changes to the official measure of poverty.
3
I. Background
Five key decisions must be made for any income-based poverty measure:
• What is the income concept to be employed?
• What “unit of analysis” should be used?
• What threshold levels and equivalence scale should be used to designate poverty?
• What adjustment for inflation is appropriate?
• What data source should be used for the calculations?
(See Weinberg, 2004b, for a discussion of some other issues and approaches to measuring
poverty.)
At the request of the seminar organizers, information is presented on five income variants (see
Table 1 for a more complete description of the income sources included in each definition):
• Money income (used in official measure);
• Pre-tax pre-means-tested-transfer income: money income excluding means-tested cash
transfers (this income measure thus includes income from non-means-tested transfers like
Social Security and could be referred to as post-social insurance income);
• Pre-tax pre-means-tested-transfer income that includes an imputed return to home equity;
• Post-tax, post-transfer income: money income plus realized capital gains, plus non-cash
transfers, plus the Earned Income Tax Credit (EITC), minus income and payroll taxes; and
• Post-tax, post-transfer income that includes an imputed return to home equity, minus property
taxes.
4
These five variants are designed to investigate two issues: First, whether there are distributional
effects of changing the definition, especially geographic effects, and second, can one use such
measures to assess the effects of means-tested government programs and taxes on poverty.
Note that these income variants differ in three significant ways from the recommendations of the
National Academy of Sciences (NAS) panel on poverty measurement (Citro and Michael, 1995):
(1) there is no subtraction from income for work expenses (such as childcare and transportation)
or for medical out-of-pocket expenses; (2) there is no geographic adjustment of thresholds to
account for differences in cost-of-living (mainly housing costs); and (3) an imputed return to
home equity is included as an alternative.
These income variants were computed for two definitions of the “unit of analysis”: (1) families
and unrelated individuals, and (2) households.1 A family is a group of two or more people who
reside together and who are related by birth, marriage, or adoption. A household includes all the
people who occupy a housing unit as their usual place of residence. Not all households contain
families since a household may comprise a group of unrelated people or one person living alone.
In determining the threshold level for a unit’s income to be compared against, one has to make
several decisions. First, what is the level for a reference unit? Second, what is the relationship
between units of different sizes and compositions (termed the “equivalence scale”)? Third, how
do these thresholds get updated over time to reflect inflation?
1 To improve the comparability of the tabulations for households presented here with the official poverty measure, neither includes unrelated children under 15; any official poverty measure based on household income would likely include such children.
5
The official thresholds were based on work by Orshansky (1963) and were adopted by the
federal government for use in the 1960s War on Poverty and reflected the equivalence scales
implicit in her analysis of household food consumption and minimally adequate diets. These
have been widely criticized and a three-parameter scale has been developed that eliminates the
anomalies present in the official thresholds.2 For this analysis, the level of the threshold for a
two-adult two-child family was set equal to the level of the official threshold, and the
relationships inherent in the thresholds were then applied to determine the appropriate levels for
other families. Some have suggested setting the threshold level for an alternative such that the
overall poverty rate is set equal to the official poverty rate for some reference year or years. The
NAS panel suggested setting the threshold at a specified fraction of median expenditure for food,
clothing, shelter, and utilities, and updating that threshold for changes in median expenditures
(Citro and Michael, 1995).
In its Statistical Policy Directive 14, OMB set the inflation adjustment to be used to update the
poverty thresholds from one year to the next as the official Consumer Price Index (now called
the Consumer Price Index for Urban Consumers, or CPI-U). As the analysis in this paper is
confined to one calendar year (2002), one might think that the choice of an inflation adjustment
would be irrelevant. But it is linked to the levels of the thresholds in the following way. Two
alternative levels were chosen for analysis, based on two alternative choices of inflation factors.
The first was the historical CPI-U and the thresholds were scaled to the level in the official
thresholds for 2002. The second uses the methodology adopted by the Bureau of Labor Statistics
2 The three-parameter scale used in these calculations was developed by David Johnson of the Bureau of Labor Statistics and others. The scale for a single adult is set at 1.00, the scale for two adults is set at 1.41, the scale for single parents is [1.8+0.5*(children-1)]0.7, and the scale for other families is [adults+0.5*children]0.7.
6
(BLS) for the CPI-U in 2002, and backcast by them in a research series (called CPI-U-RS), to
1977. The alternative reference level is then the official thresholds as they existed in 1977,
inflated using the CPI-U-RS to 2002.3 As an illustration of the differences in the threshold levels,
note the values as shown in Table 2.
While the Survey of Income and Program Participation could be used to calculate these
alternatives (and is even recommended by two National Academy of Sciences panels; see Citro
and Kalton, 1993, and Citro and Michael, 1995), the organizers requested that the data source
used to calculate the official measures be the source of these alternative estimates. Thus, these
tabulations are based on the 2003 Current Population Survey (CPS) Annual Social and Economic
Supplement (ASEC), which collected income for calendar year 2002. In that year, official
poverty for the overall population was calculated at 12.1 percent.
There are a few measurement issues to note. First, the Census Bureau was unable to partition all
income sources into means-tested and non-means tested parts. A small component of Veterans'
payments is means-tested, as is a small component of educational assistance (such as Pell
Grants). These, as well as any means-tested transfers reported as part of “other income” will be
included in the pre-tax/pre-means-tested transfer poverty measure. In addition, improved
methods for valuing noncash benefits like housing assistance have not yet been implemented.
3 There was also a substantial change in the CPI-U methodology in 1983, when the BLS adopted a “rental equivalence” method for housing costs. They issued an “experimental” series that backcast the CPI to 1968, denoted CPI-U-X1. That further adjustment is not used in this analysis. See <http://www.census.gov/hhes/www/income/income03/cpiurs.html> for the CPI-U-RS series that also incorporates the CPI-U-X1 adjustments.
7
No significance tests have been performed. Because all these estimates are from the same
dataset, conventional measures of sampling error do not apply. The reader will have to use his or
her own judgment as to the importance of the findings. As a basis for an assessment of these
differences, note that to find that a year-to-year change in the overall poverty rate is significant at
the 90-percent confidence level requires a 0.3 percentage point difference.
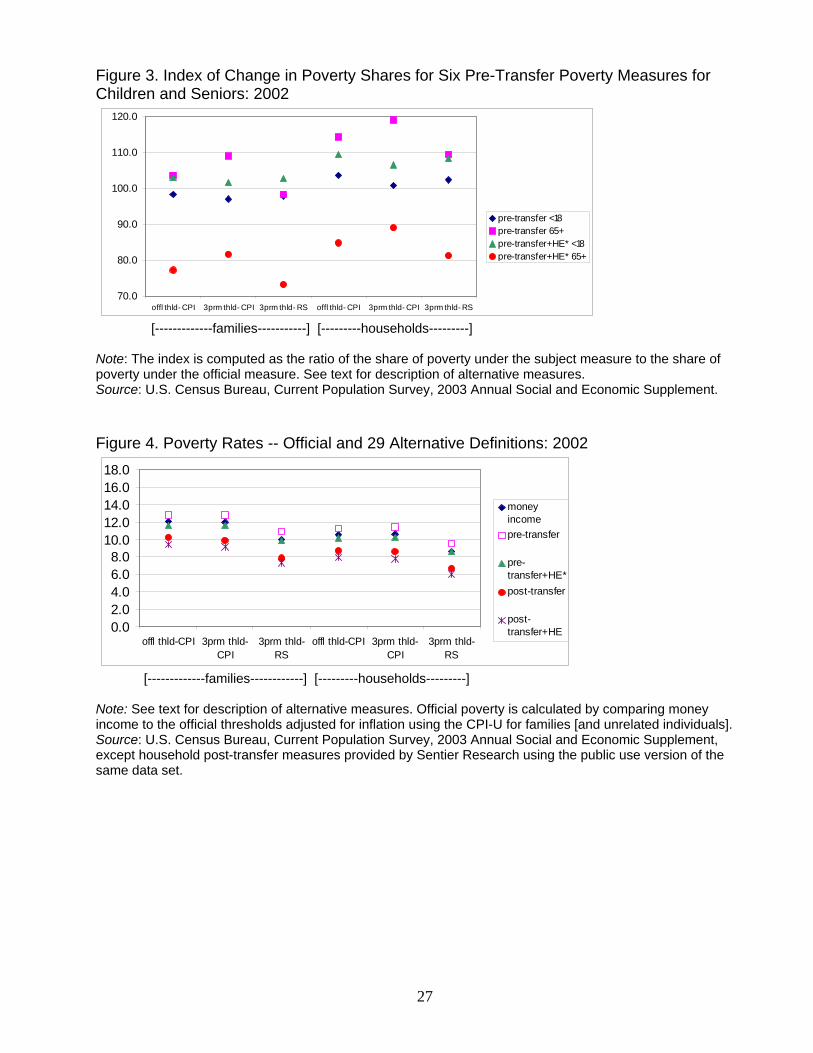
II. Money Income and Pre-Transfer Poverty
Table 3 presents the overall poverty rates for the official poverty measure (unit of analysis:
families and unrelated individuals; official thresholds; historical CPI[-U] inflation adjustment)
and 29 alternatives. Detailed tables for each measure showing variation in poverty rate estimates
by demographic characteristic are presented in the Appendix.
The first issue is how the choice of income variant affects pre-transfer poverty (the next section
focuses on post-transfer poverty). Looking across the first row of Table 3, the pre-means-tested
transfer pre-tax poverty rate (hereinafter called the pre-transfer rate) is 0.7 percentage points
higher than the official rate (12.8 percent compared to 12.1 percent). Counting imputed return to
home equity reduces pre-transfer poverty by 1.2 percentage points (12.8 percent to 11.6 percent).
Variations in the other three dimensions affect pre-transfer poverty as well. Using the three-
parameter compared to the official thresholds has basically no effect on overall poverty (compare
line 1 in the first column of Table 3 with line 2, or line 4 with 5). Using the current (RS)
methodology instead of the historical CPI[-U] reduces poverty rates by about 2 percentage points
(12.0 percent to 10.0 percent -- line 2 compared to 3 -- or 10.6 percent to 8.6 percent -- line 5
8
compared to 6). Using a household-based measure rather than a family-based one reduces
poverty by about 1½ percentage points (compare lines 1 and 4, 2 and 5, or 3 and 6). Regardless
of which rows or columns one examines, these effects seem to be more-or-less independent and
additive, though the reduction due to the RS is slightly lower for the pre-transfer measure that
accounts for home equity.
To make investigation of the effects of these alternative measures on the distribution of poverty
easier to understand, a single statistic has been computed that shows the distributional effect.
This index compares the percentage in poverty under the subject measure with the percentage of
the same group in official poverty. Here is one example that illustrates the index for people in
poverty in California. Under the official measure of poverty, 4.605 of the total 34.570 million in
poverty were in California (13.32 percent). Using pre-transfer pre-tax income including imputed
return to home equity, for people in households, using the three-parameter thresholds adjusted
for inflation using the CPI-U-RS measure, 3.305 of the total 24.418 million in poverty were in
California (13.54 percent). The index of the change in poverty shares is the ratio of 13.54 to
13.32, for an index of 101.6. Think about this number as follows: People in poverty in California
are a larger percentage of all those in poverty when this particular alternative measure is used
than when the official poverty measure is used (their share is 1.6 percent larger).
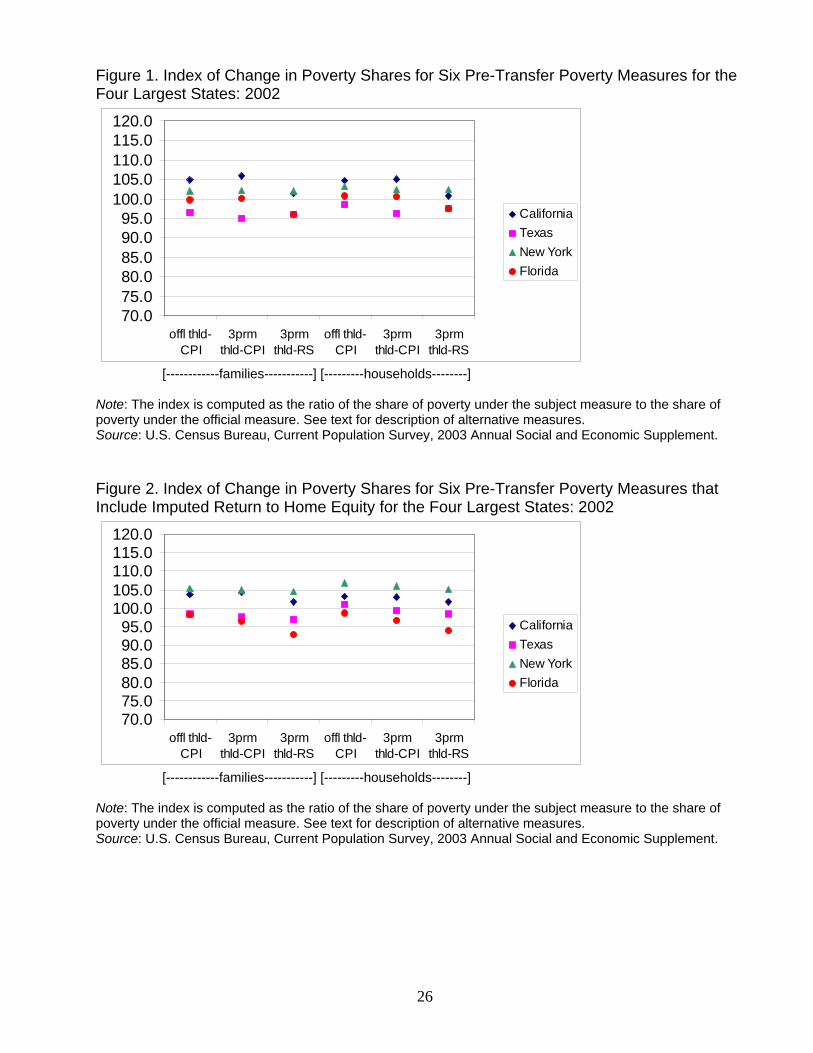
Tables 4 and 5 present the indexes of the change in poverty shares for all 50 states and the
District of Columbia for families and households, respectively. Rather than discussing all 51
jurisdictions for all six measures and all five income variants, Figures 1 and 2 present these
indexes for the four largest states -- California, Texas, New York, and Florida – for both pre-
9
transfer measures. California and New York appear to have increased shares of pre-transfer
poverty, Texas a reduced share, and Florida a slightly reduced share when the RS inflation
adjustment is used. Counting an imputed return to home equity affects these ratios some,
especially in New York and Florida.
There’s a fairly wide range for these effects – especially for the household measures. Examining
only the three-parameter RS pre-transfer measures for families without home equity, there were
three states where the share increased 10 percent or more -- the District of Columbia,
Connecticut, and Hawaii (Hawaii’s index was 115.4) -- and two whose share decreased 10
percent or more – Missouri and Idaho (Idaho’s index was 88.6) (see Table 4). Under the
comparable household measure, several more states showed large changes – the shares for West
Virginia, South Carolina, Mississippi, Louisiana, and the District of Columbia (DC’s index was
120.1) increased 10 percent or more, and the shares for Washington, Idaho, Nevada, Vermont,
Delaware, Alaska, and Minnesota (Minnesota’s index was 71.4) decreased 10 percent or more
(see Table 5).
Another interesting distributional effect is shown in Figure 3, where the poverty share change
index is shown for children (people under 18) and seniors (people 65 and older); the estimates
are shown in Table 6 for several age groups. Children’s pre-transfer poverty is not much
affected, though their share when home equity is accounted for is higher than when it is not
(especially for household measures). Seniors have, in some cases, a much larger share of pre-
transfer poverty unless imputed return to home equity is accounted for – counting an imputed
return to home equity reduces their share by 25 to 30 percent compared to not counting it
10
III. Post-transfer Poverty
Both post-transfer post-tax measures include cash and non-cash transfers, realized capital gains,
and the Earned Income Tax Credit, and subtract income and payroll taxes. As Table 3
demonstrates, including means-tested transfers and subtracting taxes cut about 2½ percentage
points off the pre-transfer poverty rates (12.8 percent to 10.2 percent – column 4 compared to 2 –
or 11.6 percent to 9.4 percent – column 5 compared to 3).4 Effects of the three “vertical” changes
is about 3-3½ percentage points (for example 12.8 percent to 9.5 percent) – that is, when
changing from families to households, official thresholds to three-parameter thresholds, and from
CPI-U to CPI-U-RS indexing, poverty rates are reduced by 3-3½ percentage points. The effect of
the “horizontal” changes -- going from the pre-transfer income variant excluding any
consideration of home equity to the post-transfer income variant that includes return to home
equity and subtracts property taxes -- is also about 3-3½ percentage points (for example, 12.8 to
9.4 percent). Together all these changes amount to nearly a 7 percentage point reduction in
poverty (12.8 percent to 6.0 percent). These are illustrated in Figure 4.
One can use these estimates to compute the percentage reduction in pre-transfer poverty rates (as
defined here) due to taxes and means-tested transfers. Overall, for families, the range for
reductions is from 19.0 percent (the percentage reduction for the official threshold CPI measure
that includes home equity) to 27.5 percent (the percentage reduction for the three-parameter RS
4 The household post-transfer poverty rates in Table 3 were computed by Sentier Research using the public use version of the CPS ASEC. Examination of comparable measures suggests that this alternative differs from the calculations that use internal Census Bureau files by at most 0.1 percentage point, except where the public use file deliberately has less detail than the internal files (for metropolitan and non-metropolitan residence).
11
measure that excludes home equity). For households, the reductions are in the same range: from
21.0 percent to 30.1 percent.5
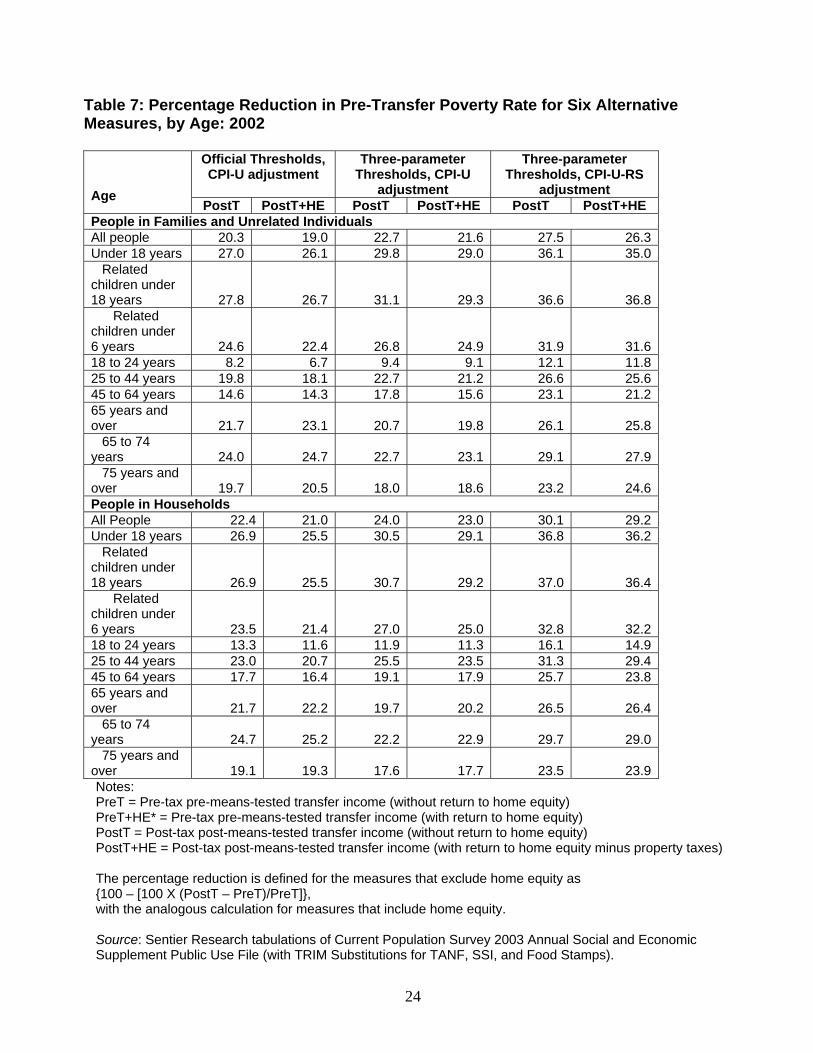
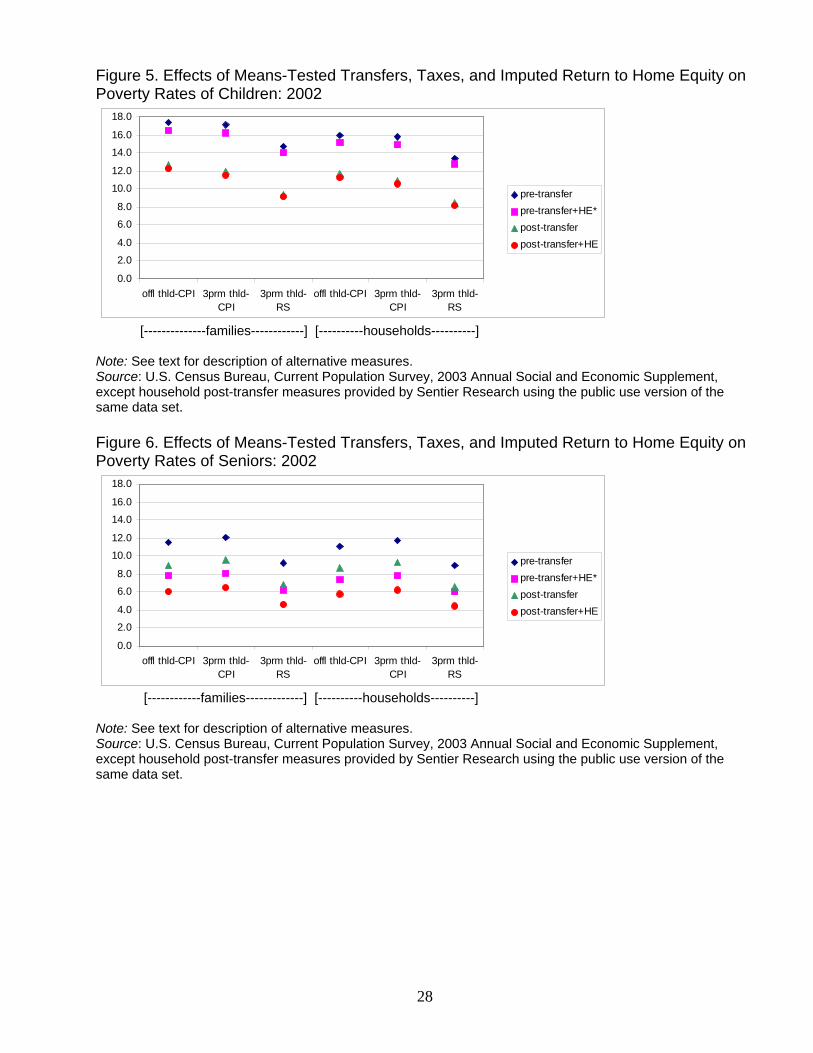
Figures 5 and 6 show both pre- and post-transfer poverty rates for children and seniors,
respectively; the estimates of the percentage reduction in their pre-transfer poverty rates due to
taxes and means-tested transfers are shown in Table 7 for several age groups. Children are
advantaged by government intervention – their poverty rates are lower: for family-based
measures, the percentage reduction in poverty rates due to transfers and taxes ranges from a 26
percent to a 36 percent reduction. There’s not much effect of home equity on the poverty rates
for children.
Turning to seniors, it was demonstrated above that counting imputed return to home equity has a
huge effect on seniors’ poverty shares – Figure 6 confirms the effects on the rates themselves. As
was true for children, pre-transfer poverty rates for seniors are substantially reduced by transfers
(recall that Social Security is counted in both measures).
As was done for pre-transfer poverty, one can look at post-transfer poverty shares by state (see
Tables 4 and 5). Among the four largest states, California and New York have a reduced share of
post-transfer poverty. The variation among states in post-transfer poverty shares is larger than for
pre-transfer poverty – many more states have changes of more than 10 percent. Again just
focusing on the three-parameter RS measures, for families there were five states whose index of
5 To ensure consistency, the estimates of the percentage reduction in poverty rates due to taxes and transfers for households are based solely on the rates calculated by Sentier Research; as noted in footnote 4, these differ only slightly from the estimates prepared by the Census Bureau (see the Appendix tables marked [SR] for the appropriate pre-transfer poverty rates).
12
change in poverty shares increased 10 percent or more -- Nebraska, Indiana, Illinois, Ohio, and
New Mexico (New Mexico’s index was 113.2), and six states whose share decreased 10 percent
or more -- Nevada, Massachusetts, Maine, Alaska, Kansas, and Connecticut (Connecticut’s index
was 83.1). There were similar increases in the numbers for households. Eight states had a share
that increased 10 percent or more -- Ohio, North Carolina, Indiana, Tennessee, South Carolina,
Illinois, New Mexico, and Louisiana (Louisiana’s index was 122.6) – and 12 states whose share
decreased 10 percent or more -- Kansas, Hawaii, Utah, Wash., Nevada, Idaho, Massachusetts,
Maine, Vermont, Delaware, Connecticut, and Minnesota (Minnesota’s index was 70.1).
IV. The Effect of Imputations for Unreported Income
As reported in Weinberg (2004a), there is a substantial gap between the amount of income
reported by household respondents to the CPS ASEC and the amount of income included in the
National Income Accounts. Weinberg cited a Ruser, Pilot, and Nelson (2004) study that
compared U.S. Bureau of Economic Analysis (BEA) State Personal Income (SPI) with CPS
ASEC money income for 2001. The BEA estimate of aggregate income was $8.670 trillion while
the CPS estimate for the same calendar year was $6.446 trillion, for a difference of $2.233
trillion. However, adjustments to BEA SPI are needed to derive a concept consistent with CPS
ASEC (for example, excluding the income of non-profit enterprises). Once those adjustments are
made, the remaining gap is $806 billion, about half of which is due to adjustments BEA makes in
its SPI estimates for unreported earnings (wages, salaries, and self-employment income).
The key areas of CPS response error are four:
• Wages and Salaries: 3 percent underreporting accounts for $158 billion of the gap;
13
• Self-Employment income: 48 percent underreporting accounts for $302 billion of the gap;
• Interest and Dividends: 32 percent underreporting accounts for $132 billion of the gap;
and
• Transfer Programs: 23 percent underreporting accounts for $199 billion of the gap.
Little research has been done on developing comprehensive models for imputing the missing
income to the CPS ASEC for the income sources noted as key. However, the Urban Institute,
with the support of the Department of Health and Human Services Office of the Assistant
Secretary for Planning and Evaluation, has developed adjustment models for three transfer
programs: Temporary Assistance for Needy Families (TANF), Supplemental Security Income
(SSI), and Food Stamps. Census Bureau analysts are unfamiliar with the adjustment methods
used by the Urban Institute for its TRIM microsimulation model, so these adjustments were
implemented by Sentier Research using the CPS ASEC public use file. There are two concerns
that limit the generalizability of the findings that use these imputations, however. First, there is a
concern that undercoverage of the low-income population by the CPS might affect the reliability
of such an imputation. In effect, if the CPS has undercoverage that is not corrected for
appropriately by weighting, then the missing income could be imputed to too few families and
reduce the poverty rate too much. Second, there are income sources for which imputation is not
made that might well affect the distribution of poverty (such as income and dividends, which
would presumably affect the poverty of seniors who tend to own more assets than those who are
younger); if possible, imputation should be made throughout the income distribution.
14
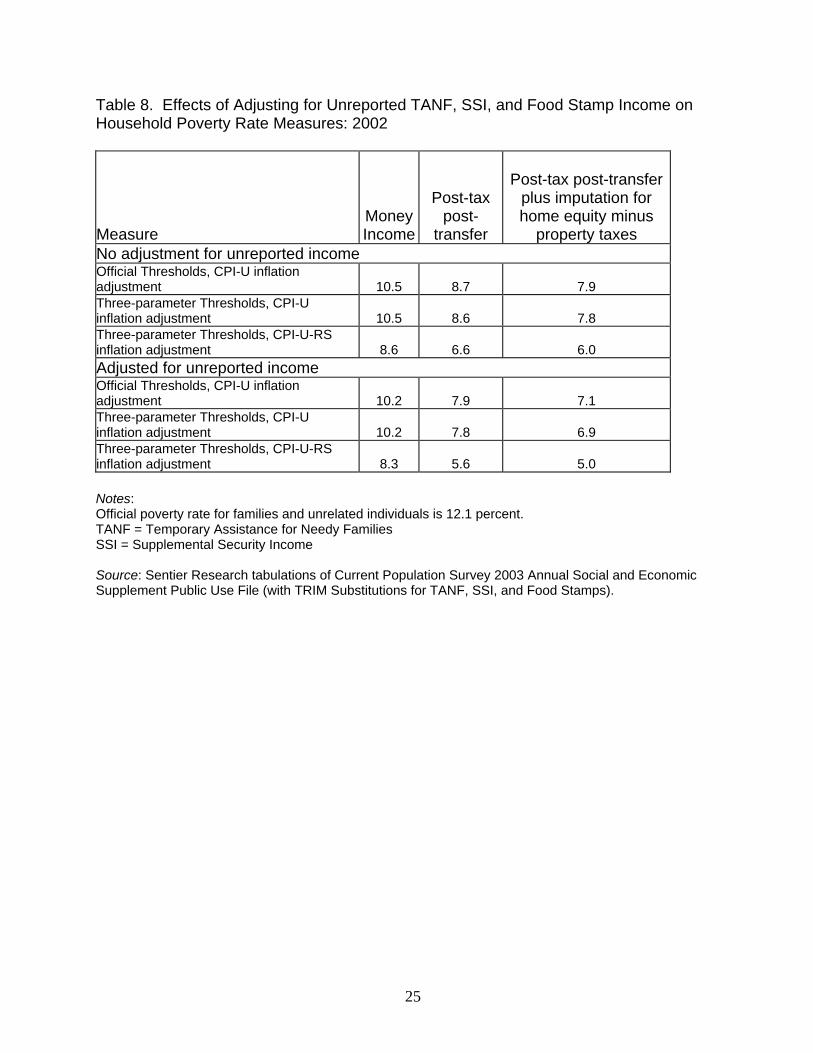
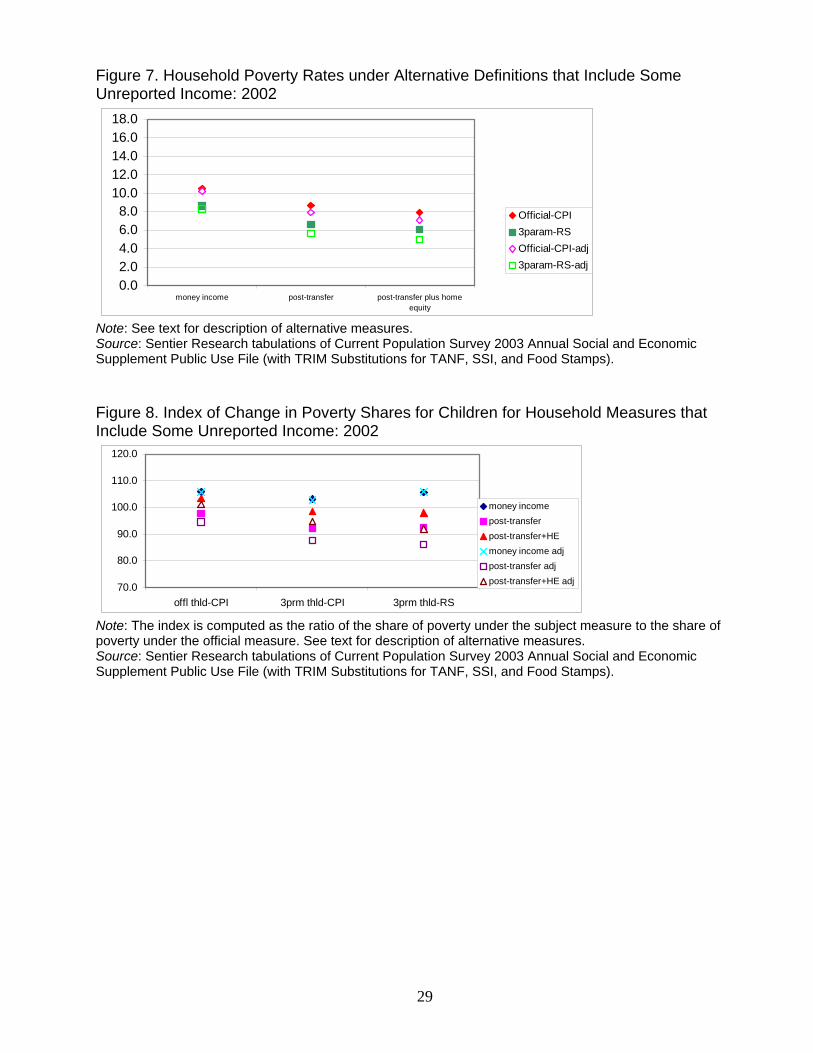
Table 8 presents one estimate of the effects of adjusting income for unreported TANF, SSI, and
Food Stamp income on household poverty rate measures.6 Imputation for unreported TANF and
SSI money income reduces poverty by about 0.3 percentage points (compare the money income-
based estimates) but counting all three transfer program imputations reduces post-transfer
poverty by about 1 percentage point (for example from 6.0 to 5.0 percent). Although it appears
that unreported Food Stamps has the largest effect, that is only because it is the last program
counted. The only valid conclusion is that the three programs in combination reduce poverty
rates by about 1 percentage point. These effects are illustrated in Figure 7.
The effects of counting unreported income on the poverty shares of children are shown in Figure
8. Counting unreported transfer income reduces the poverty shares of children noticeably.
V. Further Research
There are a few technical issues that might benefit from additional work. These include:
1. Tables for a pre-transfer measure that also excludes all non-means-tested cash transfers
(such as Social Security). Such a table would enable calculation of the full effect of
government taxes and transfers.
2. Inclusion of estimates of state sales taxes since several states use that revenue source to
substitute for income taxes. (Note that inclusion of local income and sales taxes is not
feasible because it would preclude issuance of public use files due to confidentiality
concerns.)
6 All these estimates use the public use file-based estimates to show the marginal effect of imputing unreported income.
15
3. An exploration of the impact of using both CPI-U-RS and CPI-U-X1 indexing on the
current levels of the thresholds.
4. More research on the intra-household sharing of resources to determine the value of
accepting a household compared to a family definition of the unit of analysis. It might be
possible with enough research to make a reasonable distinction between cohabitors (who
are romantically involved) and co-residents (who merely share housing expenses).
5. Examination of the reduction in the poverty gap (the difference between a unit’s income
and its poverty threshold) due to taxes and transfers.
16
References
Besharov, Douglas J. and Peter Germanis. 2004. “Reconsidering the Federal Poverty Measure: Project Description.” June 14. Citro, Constance F. and Graham Kalton (eds.). 1993. The Future of the Survey of Income and Program Participation. Washington, DC: National Academy Press. Citro, Constance F. And Robert T. Michael (eds.). 1995. Measuring Poverty: A New Approach. Washington, DC: National Academy Press. Orshansky, Mollie. 1963. “Children of the Poor.” Social Security Bulletin v. 26 (July), pp. 3-13. Ruggles, Patricia. 1990. Drawing the Line. Washington, D.C.: Urban Institute Press. Ruser, John, Adrienne Pilot, and Charles Nelson. 2004. “Alternative Measures of Household Income: BEA Personal Income, CPS Money Income, and Beyond.” Paper prepared for the Federal Economic Statistics Advisory Committee, May <http:www.bls.gov/bls/fesacp1061104.pdf>. Weinberg, Daniel H. 2004[a]. “Income Data Quality Issues in the Annual Social and Economic Supplement to the Current Population Survey.” Paper prepared for the University of Maryland-American Enterprise Seminar on Reconsidering the Federal Poverty Measure, October <http://www.census.gov/hhes/www/income/cpsdataquality101504.pdf>.
Weinberg, Daniel H. 2004[b]. “Measuring Poverty: Issues and Approaches.” In C. Michael Henry (ed.) Race, Poverty, and Domestic Policy. New Haven, CT: Yale University Press. U.S. Census Bureau. 1988. “Measuring the Effect of Benefits and Taxes on Income and Poverty: 1986.” Current Population Reports P60 No. 164-RD-1. December.
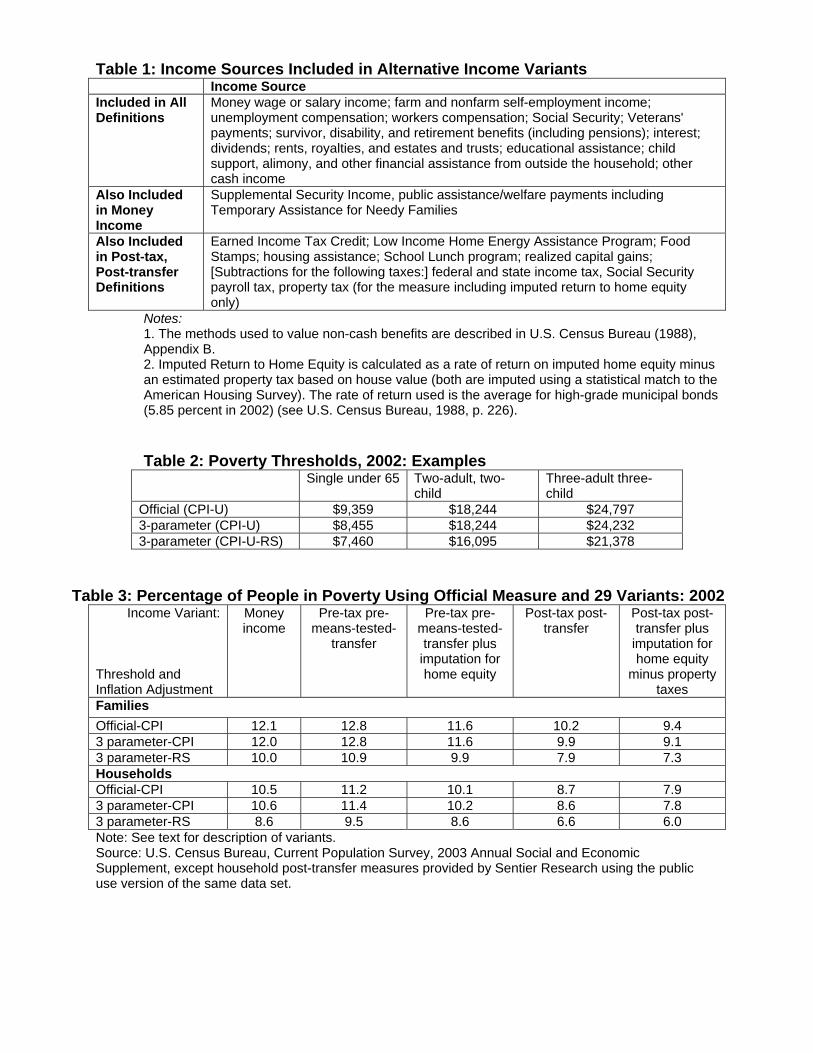
Table 1: Income Sources Included in Alternative Income Variants Income Source Included in All Definitions
Money wage or salary income; farm and nonfarm self-employment income; unemployment compensation; workers compensation; Social Security; Veterans' payments; survivor, disability, and retirement benefits (including pensions); interest; dividends; rents, royalties, and estates and trusts; educational assistance; child support, alimony, and other financial assistance from outside the household; other cash income
Also Included in Money Income
Supplemental Security Income, public assistance/welfare payments including Temporary Assistance for Needy Families
Also Included in Post-tax, Post-transfer Definitions
Earned Income Tax Credit; Low Income Home Energy Assistance Program; Food Stamps; housing assistance; School Lunch program; realized capital gains; [Subtractions for the following taxes:] federal and state income tax, Social Security payroll tax, property tax (for the measure including imputed return to home equity only)
Notes: 1. The methods used to value non-cash benefits are described in U.S. Census Bureau (1988), Appendix B. 2. Imputed Return to Home Equity is calculated as a rate of return on imputed home equity minus an estimated property tax based on house value (both are imputed using a statistical match to the American Housing Survey). The rate of return used is the average for high-grade municipal bonds (5.85 percent in 2002) (see U.S. Census Bureau, 1988, p. 226).
Table 2: Poverty Thresholds, 2002: Examples Single under 65 Two-adult, two-
child Three-adult three-child
Official (CPI-U) $9,359 $18,244 $24,797 3-parameter (CPI-U) $8,455 $18,244 $24,232 3-parameter (CPI-U-RS) $7,460 $16,095 $21,378
Table 3: Percentage of People in Poverty Using Official Measure and 29 Variants: 2002 Income Variant:
Threshold and Inflation Adjustment
Money income
Pre-tax pre-means-tested-
transfer
Pre-tax pre-means-tested-transfer plus imputation for home equity
Post-tax post- transfer
Post-tax post-transfer plus imputation for home equity
minus property taxes
Families Official-CPI 12.1 12.8 11.6 10.2 9.4 3 parameter-CPI 12.0 12.8 11.6 9.9 9.1 3 parameter-RS 10.0 10.9 9.9 7.9 7.3 Households Official-CPI 10.5 11.2 10.1 8.7 7.9 3 parameter-CPI 10.6 11.4 10.2 8.6 7.8 3 parameter-RS 8.6 9.5 8.6 6.6 6.0 Note: See text for description of variants. Source: U.S. Census Bureau, Current Population Survey, 2003 Annual Social and Economic Supplement, except household post-transfer measures provided by Sentier Research using the public use version of the same data set.
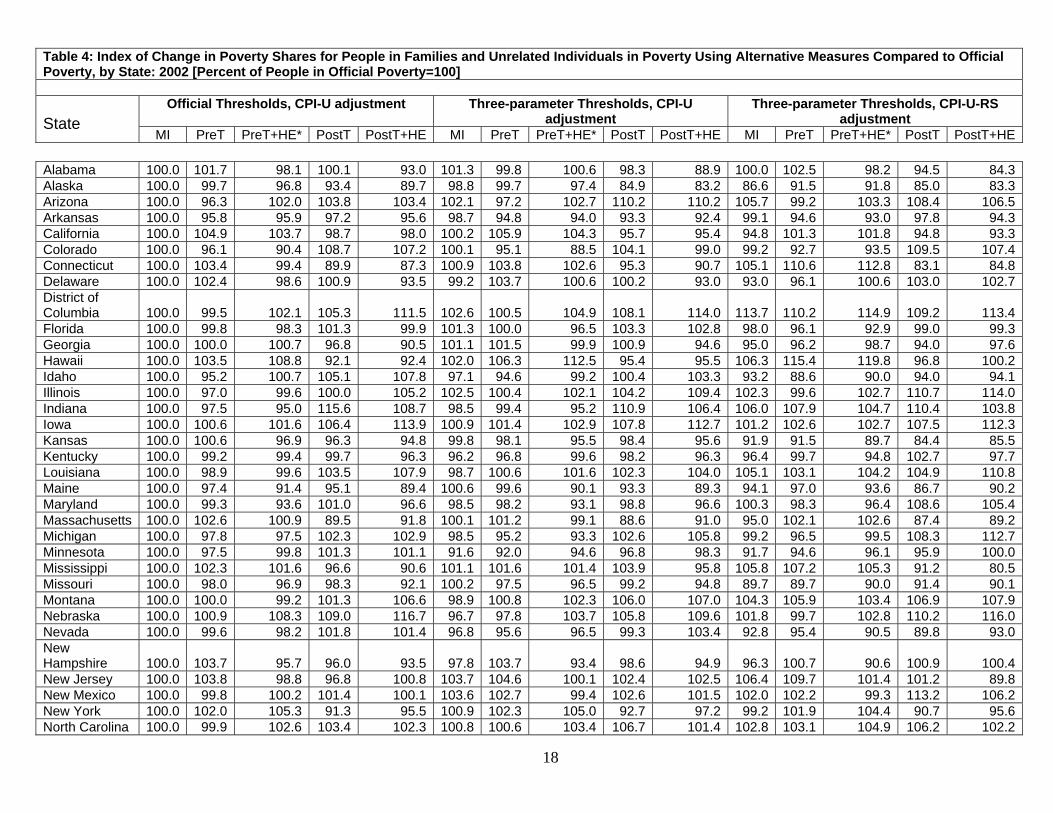
Table 4: Index of Change in Poverty Shares for People in Families and Unrelated Individuals in Poverty Using Alternative Measures Compared to Official Poverty, by State: 2002 [Percent of People in Official Poverty=100]
Official Thresholds, CPI-U adjustment Three-parameter Thresholds, CPI-U adjustment
Three-parameter Thresholds, CPI-U-RS adjustment
State
MI PreT PreT+HE* PostT PostT+HE MI PreT PreT+HE* PostT PostT+HE MI PreT PreT+HE* PostT PostT+HE
18
Alabama 100.0 101.7 98.1 100.1 93.0 101.3 99.8 100.6 98.3 88.9 100.0 102.5 98.2 94.5 84.3 Alaska 100.0 99.7 96.8 93.4 89.7 98.8 99.7 97.4 84.9 83.2 86.6 91.5 91.8 85.0 83.3 Arizona 100.0 96.3 102.0 103.8 103.4 102.1 97.2 102.7 110.2 110.2 105.7 99.2 103.3 108.4 106.5 Arkansas 100.0 95.8 95.9 97.2 95.6 98.7 94.8 94.0 93.3 92.4 99.1 94.6 93.0 97.8 94.3 California 100.0 104.9 103.7 98.7 98.0 100.2 105.9 104.3 95.7 95.4 94.8 101.3 101.8 94.8 93.3 Colorado 100.0 96.1 90.4 108.7 107.2 100.1 95.1 88.5 104.1 99.0 99.2 92.7 93.5 109.5 107.4 Connecticut 100.0 103.4 99.4 89.9 87.3 100.9 103.8 102.6 95.3 90.7 105.1 110.6 112.8 83.1 84.8 Delaware 100.0 102.4 98.6 100.9 93.5 99.2 103.7 100.6 100.2 93.0 93.0 96.1 100.6 103.0 102.7 District of Columbia 100.0 99.5 102.1 105.3 111.5 102.6 100.5 104.9 108.1 114.0 113.7 110.2 114.9 109.2 113.4 Florida 100.0 99.8 98.3 101.3 99.9 101.3 100.0 96.5 103.3 102.8 98.0 96.1 92.9 99.0 99.3 Georgia 100.0 100.0 100.7 96.8 90.5 101.1 101.5 99.9 100.9 94.6 95.0 96.2 98.7 94.0 97.6 Hawaii 100.0 103.5 108.8 92.1 92.4 102.0 106.3 112.5 95.4 95.5 106.3 115.4 119.8 96.8 100.2 Idaho 100.0 95.2 100.7 105.1 107.8 97.1 94.6 99.2 100.4 103.3 93.2 88.6 90.0 94.0 94.1 Illinois 100.0 97.0 99.6 100.0 105.2 102.5 100.4 102.1 104.2 109.4 102.3 99.6 102.7 110.7 114.0 Indiana 100.0 97.5 95.0 115.6 108.7 98.5 99.4 95.2 110.9 106.4 106.0 107.9 104.7 110.4 103.8 Iowa 100.0 100.6 101.6 106.4 113.9 100.9 101.4 102.9 107.8 112.7 101.2 102.6 102.7 107.5 112.3 Kansas 100.0 100.6 96.9 96.3 94.8 99.8 98.1 95.5 98.4 95.6 91.9 91.5 89.7 84.4 85.5 Kentucky 100.0 99.2 99.4 99.7 96.3 96.2 96.8 99.6 98.2 96.3 96.4 99.7 94.8 102.7 97.7 Louisiana 100.0 98.9 99.6 103.5 107.9 98.7 100.6 101.6 102.3 104.0 105.1 103.1 104.2 104.9 110.8 Maine 100.0 97.4 91.4 95.1 89.4 100.6 99.6 90.1 93.3 89.3 94.1 97.0 93.6 86.7 90.2 Maryland 100.0 99.3 93.6 101.0 96.6 98.5 98.2 93.1 98.8 96.6 100.3 98.3 96.4 108.6 105.4 Massachusetts 100.0 102.6 100.9 89.5 91.8 100.1 101.2 99.1 88.6 91.0 95.0 102.1 102.6 87.4 89.2 Michigan 100.0 97.8 97.5 102.3 102.9 98.5 95.2 93.3 102.6 105.8 99.2 96.5 99.5 108.3 112.7 Minnesota 100.0 97.5 99.8 101.3 101.1 91.6 92.0 94.6 96.8 98.3 91.7 94.6 96.1 95.9 100.0 Mississippi 100.0 102.3 101.6 96.6 90.6 101.1 101.6 101.4 103.9 95.8 105.8 107.2 105.3 91.2 80.5 Missouri 100.0 98.0 96.9 98.3 92.1 100.2 97.5 96.5 99.2 94.8 89.7 89.7 90.0 91.4 90.1 Montana 100.0 100.0 99.2 101.3 106.6 98.9 100.8 102.3 106.0 107.0 104.3 105.9 103.4 106.9 107.9 Nebraska 100.0 100.9 108.3 109.0 116.7 96.7 97.8 103.7 105.8 109.6 101.8 99.7 102.8 110.2 116.0 Nevada 100.0 99.6 98.2 101.8 101.4 96.8 95.6 96.5 99.3 103.4 92.8 95.4 90.5 89.8 93.0 New Hampshire 100.0 103.7 95.7 96.0 93.5 97.8 103.7 93.4 98.6 94.9 96.3 100.7 90.6 100.9 100.4 New Jersey 100.0 103.8 98.8 96.8 100.8 103.7 104.6 100.1 102.4 102.5 106.4 109.7 101.4 101.2 89.8 New Mexico 100.0 99.8 100.2 101.4 100.1 103.6 102.7 99.4 102.6 101.5 102.0 102.2 99.3 113.2 106.2 New York 100.0 102.0 105.3 91.3 95.5 100.9 102.3 105.0 92.7 97.2 99.2 101.9 104.4 90.7 95.6 North Carolina 100.0 99.9 102.6 103.4 102.3 100.8 100.6 103.4 106.7 101.4 102.8 103.1 104.9 106.2 102.2
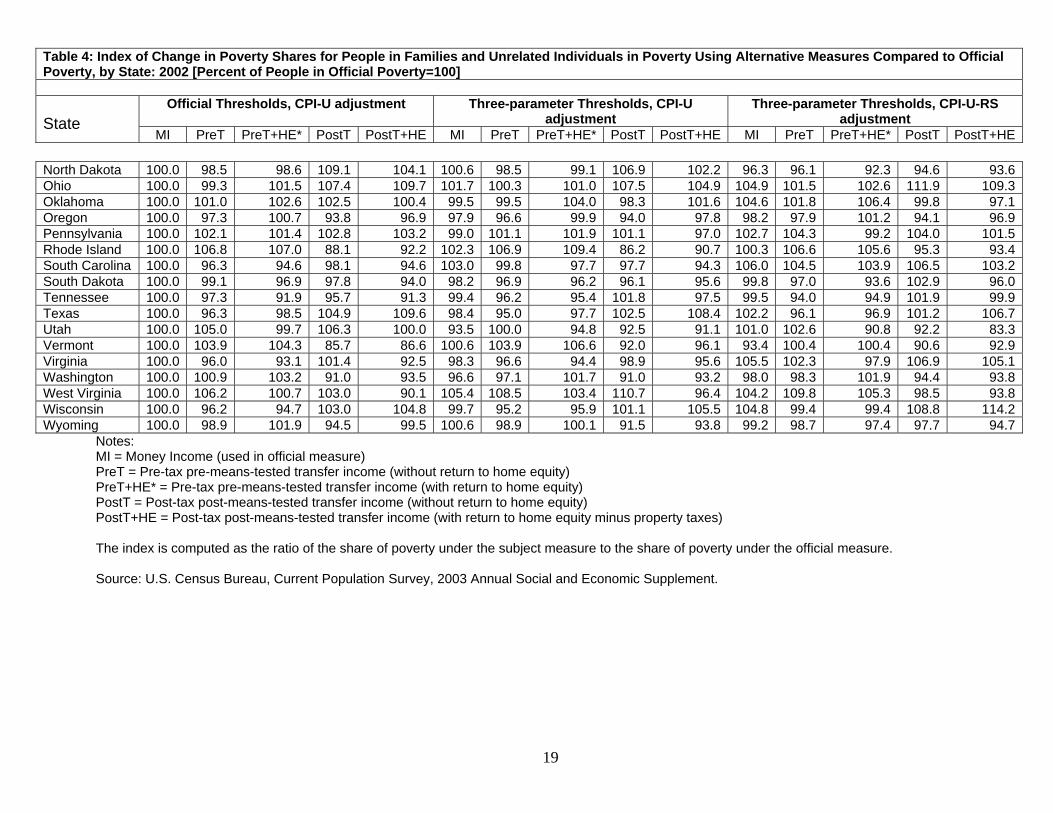
Table 4: Index of Change in Poverty Shares for People in Families and Unrelated Individuals in Poverty Using Alternative Measures Compared to Official Poverty, by State: 2002 [Percent of People in Official Poverty=100]
Official Thresholds, CPI-U adjustment Three-parameter Thresholds, CPI-U adjustment
Three-parameter Thresholds, CPI-U-RS adjustment
State
MI PreT PreT+HE* PostT PostT+HE MI PreT PreT+HE* PostT PostT+HE MI PreT PreT+HE* PostT PostT+HE
19
North Dakota 100.0 98.5 98.6 109.1 104.1 100.6 98.5 99.1 106.9 102.2 96.3 96.1 92.3 94.6 93.6 Ohio 100.0 99.3 101.5 107.4 109.7 101.7 100.3 101.0 107.5 104.9 104.9 101.5 102.6 111.9 109.3 Oklahoma 100.0 101.0 102.6 102.5 100.4 99.5 99.5 104.0 98.3 101.6 104.6 101.8 106.4 99.8 97.1 Oregon 100.0 97.3 100.7 93.8 96.9 97.9 96.6 99.9 94.0 97.8 98.2 97.9 101.2 94.1 96.9 Pennsylvania 100.0 102.1 101.4 102.8 103.2 99.0 101.1 101.9 101.1 97.0 102.7 104.3 99.2 104.0 101.5 Rhode Island 100.0 106.8 107.0 88.1 92.2 102.3 106.9 109.4 86.2 90.7 100.3 106.6 105.6 95.3 93.4 South Carolina 100.0 96.3 94.6 98.1 94.6 103.0 99.8 97.7 97.7 94.3 106.0 104.5 103.9 106.5 103.2 South Dakota 100.0 99.1 96.9 97.8 94.0 98.2 96.9 96.2 96.1 95.6 99.8 97.0 93.6 102.9 96.0 Tennessee 100.0 97.3 91.9 95.7 91.3 99.4 96.2 95.4 101.8 97.5 99.5 94.0 94.9 101.9 99.9 Texas 100.0 96.3 98.5 104.9 109.6 98.4 95.0 97.7 102.5 108.4 102.2 96.1 96.9 101.2 106.7 Utah 100.0 105.0 99.7 106.3 100.0 93.5 100.0 94.8 92.5 91.1 101.0 102.6 90.8 92.2 83.3 Vermont 100.0 103.9 104.3 85.7 86.6 100.6 103.9 106.6 92.0 96.1 93.4 100.4 100.4 90.6 92.9 Virginia 100.0 96.0 93.1 101.4 92.5 98.3 96.6 94.4 98.9 95.6 105.5 102.3 97.9 106.9 105.1 Washington 100.0 100.9 103.2 91.0 93.5 96.6 97.1 101.7 91.0 93.2 98.0 98.3 101.9 94.4 93.8 West Virginia 100.0 106.2 100.7 103.0 90.1 105.4 108.5 103.4 110.7 96.4 104.2 109.8 105.3 98.5 93.8 Wisconsin 100.0 96.2 94.7 103.0 104.8 99.7 95.2 95.9 101.1 105.5 104.8 99.4 99.4 108.8 114.2 Wyoming 100.0 98.9 101.9 94.5 99.5 100.6 98.9 100.1 91.5 93.8 99.2 98.7 97.4 97.7 94.7
Notes: MI = Money Income (used in official measure) PreT = Pre-tax pre-means-tested transfer income (without return to home equity) PreT+HE* = Pre-tax pre-means-tested transfer income (with return to home equity) PostT = Post-tax post-means-tested transfer income (without return to home equity) PostT+HE = Post-tax post-means-tested transfer income (with return to home equity minus property taxes) The index is computed as the ratio of the share of poverty under the subject measure to the share of poverty under the official measure. Source: U.S. Census Bureau, Current Population Survey, 2003 Annual Social and Economic Supplement.
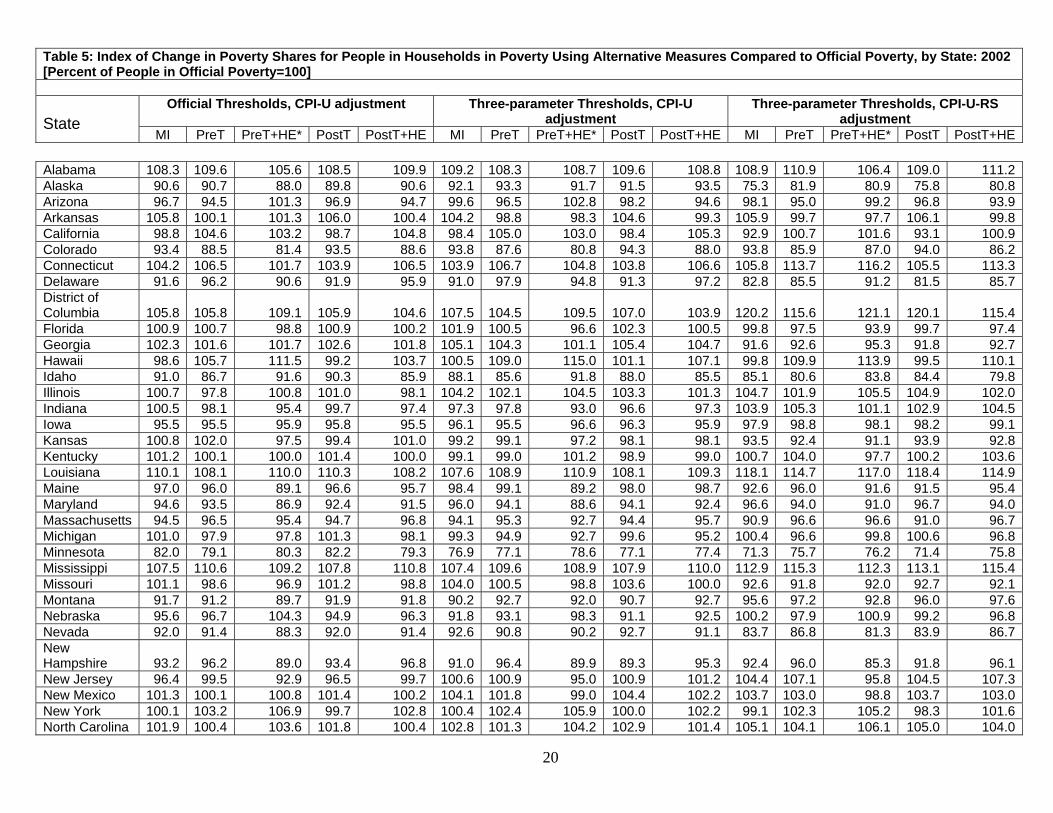
Table 5: Index of Change in Poverty Shares for People in Households in Poverty Using Alternative Measures Compared to Official Poverty, by State: 2002 [Percent of People in Official Poverty=100]
Official Thresholds, CPI-U adjustment Three-parameter Thresholds, CPI-U adjustment
Three-parameter Thresholds, CPI-U-RS adjustment
State
MI PreT PreT+HE* PostT PostT+HE MI PreT PreT+HE* PostT PostT+HE MI PreT PreT+HE* PostT PostT+HE
20
Alabama 108.3 109.6 105.6 108.5 109.9 109.2 108.3 108.7 109.6 108.8 108.9 110.9 106.4 109.0 111.2 Alaska 90.6 90.7 88.0 89.8 90.6 92.1 93.3 91.7 91.5 93.5 75.3 81.9 80.9 75.8 80.8 Arizona 96.7 94.5 101.3 96.9 94.7 99.6 96.5 102.8 98.2 94.6 98.1 95.0 99.2 96.8 93.9 Arkansas 105.8 100.1 101.3 106.0 100.4 104.2 98.8 98.3 104.6 99.3 105.9 99.7 97.7 106.1 99.8 California 98.8 104.6 103.2 98.7 104.8 98.4 105.0 103.0 98.4 105.3 92.9 100.7 101.6 93.1 100.9 Colorado 93.4 88.5 81.4 93.5 88.6 93.8 87.6 80.8 94.3 88.0 93.8 85.9 87.0 94.0 86.2 Connecticut 104.2 106.5 101.7 103.9 106.5 103.9 106.7 104.8 103.8 106.6 105.8 113.7 116.2 105.5 113.3 Delaware 91.6 96.2 90.6 91.9 95.9 91.0 97.9 94.8 91.3 97.2 82.8 85.5 91.2 81.5 85.7 District of Columbia 105.8 105.8 109.1 105.9 104.6 107.5 104.5 109.5 107.0 103.9 120.2 115.6 121.1 120.1 115.4 Florida 100.9 100.7 98.8 100.9 100.2 101.9 100.5 96.6 102.3 100.5 99.8 97.5 93.9 99.7 97.4 Georgia 102.3 101.6 101.7 102.6 101.8 105.1 104.3 101.1 105.4 104.7 91.6 92.6 95.3 91.8 92.7 Hawaii 98.6 105.7 111.5 99.2 103.7 100.5 109.0 115.0 101.1 107.1 99.8 109.9 113.9 99.5 110.1 Idaho 91.0 86.7 91.6 90.3 85.9 88.1 85.6 91.8 88.0 85.5 85.1 80.6 83.8 84.4 79.8 Illinois 100.7 97.8 100.8 101.0 98.1 104.2 102.1 104.5 103.3 101.3 104.7 101.9 105.5 104.9 102.0 Indiana 100.5 98.1 95.4 99.7 97.4 97.3 97.8 93.0 96.6 97.3 103.9 105.3 101.1 102.9 104.5 Iowa 95.5 95.5 95.9 95.8 95.5 96.1 95.5 96.6 96.3 95.9 97.9 98.8 98.1 98.2 99.1 Kansas 100.8 102.0 97.5 99.4 101.0 99.2 99.1 97.2 98.1 98.1 93.5 92.4 91.1 93.9 92.8 Kentucky 101.2 100.1 100.0 101.4 100.0 99.1 99.0 101.2 98.9 99.0 100.7 104.0 97.7 100.2 103.6 Louisiana 110.1 108.1 110.0 110.3 108.2 107.6 108.9 110.9 108.1 109.3 118.1 114.7 117.0 118.4 114.9 Maine 97.0 96.0 89.1 96.6 95.7 98.4 99.1 89.2 98.0 98.7 92.6 96.0 91.6 91.5 95.4 Maryland 94.6 93.5 86.9 92.4 91.5 96.0 94.1 88.6 94.1 92.4 96.6 94.0 91.0 96.7 94.0 Massachusetts 94.5 96.5 95.4 94.7 96.8 94.1 95.3 92.7 94.4 95.7 90.9 96.6 96.6 91.0 96.7 Michigan 101.0 97.9 97.8 101.3 98.1 99.3 94.9 92.7 99.6 95.2 100.4 96.6 99.8 100.6 96.8 Minnesota 82.0 79.1 80.3 82.2 79.3 76.9 77.1 78.6 77.1 77.4 71.3 75.7 76.2 71.4 75.8 Mississippi 107.5 110.6 109.2 107.8 110.8 107.4 109.6 108.9 107.9 110.0 112.9 115.3 112.3 113.1 115.4 Missouri 101.1 98.6 96.9 101.2 98.8 104.0 100.5 98.8 103.6 100.0 92.6 91.8 92.0 92.7 92.1 Montana 91.7 91.2 89.7 91.9 91.8 90.2 92.7 92.0 90.7 92.7 95.6 97.2 92.8 96.0 97.6 Nebraska 95.6 96.7 104.3 94.9 96.3 91.8 93.1 98.3 91.1 92.5 100.2 97.9 100.9 99.2 96.8 Nevada 92.0 91.4 88.3 92.0 91.4 92.6 90.8 90.2 92.7 91.1 83.7 86.8 81.3 83.9 86.7 New Hampshire 93.2 96.2 89.0 93.4 96.8 91.0 96.4 89.9 89.3 95.3 92.4 96.0 85.3 91.8 96.1 New Jersey 96.4 99.5 92.9 96.5 99.7 100.6 100.9 95.0 100.9 101.2 104.4 107.1 95.8 104.5 107.3 New Mexico 101.3 100.1 100.8 101.4 100.2 104.1 101.8 99.0 104.4 102.2 103.7 103.0 98.8 103.7 103.0 New York 100.1 103.2 106.9 99.7 102.8 100.4 102.4 105.9 100.0 102.2 99.1 102.3 105.2 98.3 101.6 North Carolina 101.9 100.4 103.6 101.8 100.4 102.8 101.3 104.2 102.9 101.4 105.1 104.1 106.1 105.0 104.0
Table 5: Index of Change in Poverty Shares for People in Households in Poverty Using Alternative Measures Compared to Official Poverty, by State: 2002 [Percent of People in Official Poverty=100]
Official Thresholds, CPI-U adjustment Three-parameter Thresholds, CPI-U adjustment
Three-parameter Thresholds, CPI-U-RS adjustment
State
MI PreT PreT+HE* PostT PostT+HE MI PreT PreT+HE* PostT PostT+HE MI PreT PreT+HE* PostT PostT+HE
21
North Dakota 102.7 102.1 100.5 102.8 101.8 102.0 102.3 103.0 102.8 102.8 102.0 103.0 97.0 102.8 102.7 Ohio 98.8 98.4 102.0 98.9 98.7 101.8 102.1 103.9 102.1 102.5 102.2 98.9 100.4 102.3 99.1 Oklahoma 103.3 103.6 105.8 103.6 103.9 104.0 103.0 107.7 104.4 103.4 108.1 104.0 109.1 108.4 104.1 Oregon 98.3 95.0 98.1 97.7 94.5 95.3 93.8 96.4 95.6 94.0 98.0 96.6 99.8 98.2 96.9 Pennsylvania 99.2 100.5 99.9 99.0 100.2 97.5 99.6 101.2 97.3 99.6 101.1 102.4 98.2 101.3 102.6 Rhode Island 100.4 103.4 103.7 100.4 103.9 101.7 105.7 107.0 101.7 105.4 101.8 104.4 102.5 102.4 104.8 South Carolina 105.8 101.0 98.2 106.0 101.2 107.5 103.3 101.3 107.9 103.7 112.8 110.4 109.9 113.0 110.5 South Dakota 96.3 96.6 93.4 96.3 96.5 95.7 95.4 94.1 96.0 95.8 99.2 96.0 89.9 97.9 94.9 Tennessee 104.1 101.4 97.8 104.3 101.5 103.7 100.2 100.2 104.0 100.6 106.7 100.3 102.4 106.9 100.5 Texas 102.7 98.4 101.1 103.0 98.6 100.6 96.2 99.3 100.7 96.3 105.1 97.5 98.4 105.3 97.7 Utah 101.2 107.1 100.7 101.5 107.4 91.5 99.2 93.2 91.9 99.5 100.5 101.7 89.4 100.4 101.9 Vermont 90.8 93.9 94.6 90.5 94.2 90.2 94.4 95.9 90.3 94.4 82.9 87.8 85.9 82.7 87.7 Virginia 95.9 91.4 87.4 96.1 91.6 92.9 91.2 87.7 93.3 91.5 99.7 98.2 92.2 100.0 98.5 Washington 90.2 91.6 93.2 90.5 91.9 90.9 91.6 95.7 90.6 91.3 89.2 92.9 95.9 89.5 93.1 West Virginia 104.7 114.3 107.5 104.9 114.6 110.7 115.8 111.2 111.2 116.3 110.3 118.8 114.5 110.4 119.0 Wisconsin 88.4 86.5 83.7 87.7 85.4 88.3 85.9 85.9 87.9 84.8 91.8 88.2 89.1 90.9 87.4 Wyoming 91.7 93.3 92.9 92.7 92.4 91.1 92.1 89.5 92.2 91.3 89.4 89.8 90.1 91.1 91.1
Notes: MI = Money Income (used in official measure) PreT = Pre-tax pre-means-tested transfer income (without return to home equity) PreT+HE* = Pre-tax pre-means-tested transfer income (with return to home equity) PostT = Post-tax post-means-tested transfer income (without return to home equity) PostT+HE = Post-tax post-means-tested transfer income (with return to home equity minus property taxes) The index is computed as the ratio of the share of poverty under the subject measure to the share of poverty under the official measure. Source: U.S. Census Bureau, Current Population Survey, 2003 Annual Social and Economic Supplement, except household post-transfer measures provided by Sentier Research using the public use version of the same data set.
22
Table 6: Index of Change in Poverty Shares for 15 Alternative Measures Compared to Official Poverty, by Age: 2002 [Percent of People in Official Poverty=100]
Official Thresholds, CPI-U adjustment Three-parameter Thresholds, CPI-U adjustment
Three-parameter Thresholds, CPI-U-RS adjustment
Age
MI PreT PreT+HE* PostT PostT+HE MI PreT PreT+HE* PostT PostT+HE MI PreT PreT+HE* PostT PostT+HE People in Families and Unrelated Individuals Under 18 years 100.0 98.5 103.2 90.1 94.3 98.6 97.0 101.7 87.4 92.0 100.3 97.9 102.9 86.9 90.7 Related children under 18 years 100.0 98.6 103.0 89.2 93.2 98.5 97.0 101.5 86.4 90.8 99.8 97.6 102.3 85.1 88.6 Related children under 6 years 100.0 97.7 103.3 92.8 98.7 99.4 97.1 103.0 91.8 97.9 102.0 98.3 104.6 92.0 97.5 18 to 24 years 100.0 97.8 104.2 113.0 120.1 100.2 97.8 104.5 114.1 121.2 105.3 100.5 106.4 121.3 128.4 25 to 44 years 100.0 99.9 104.5 100.0 105.6 99.2 99.4 103.6 98.9 104.0 100.2 100.0 104.4 100.1 105.4 45 to 64 years 100.0 102.7 97.2 109.6 103.9 100.2 103.3 98.5 109.6 105.2 100.7 105.0 98.8 111.3 105.8 65 years and over 100.0 103.8 77.4 101.9 74.2 106.1 109.2 81.7 112.4 82.2 90.8 98.5 73.2 99.7 73.4 65 to 74 years 100.0 104.8 81.0 99.7 75.4 106.5 110.7 86.9 111.1 85.4 93.8 102.5 79.3 100.0 77.7 75 years and over 100.0 102.9 74.1 104.0 73.2 105.7 107.8 77.2 113.6 79.5 88.1 94.9 67.7 99.3 69.6 People in Households Under 18 years 105.9 103.7 109.6 105.8 103.7 103.1 101.0 106.7 103.2 101.0 105.4 102.4 108.5 105.5 102.4 Related children under 18 years 108.8 106.5 112.4 108.7 106.4 105.9 103.7 109.5 106.0 103.7 108.1 105.0 111.3 108.2 105.1 Related children under 6 years 107.3 104.2 111.1 107.3 104.3 105.4 102.5 109.4 105.5 102.6 108.4 104.0 112.1 108.5 104.1 18 to 24 years 80.4 78.7 83.8 80.5 78.8 83.3 81.4 86.7 83.4 81.6 85.6 81.7 86.5 85.7 81.7 25 to 44 years 96.2 96.5 101.1 96.2 96.5 96.3 96.8 101.2 96.0 96.5 96.9 96.8 101.3 96.8 96.7 45 to 64 years 102.0 105.5 100.2 102.0 105.5 102.1 105.8 101.3 102.0 105.8 103.7 108.7 102.5 103.5 108.5 65 years and over 110.9 114.4 85.0 111.1 114.5 116.6 119.1 89.1 116.9 119.4 101.8 109.5 81.3 102.0 109.6 65 to 74 years 108.1 113.3 87.0 108.3 113.4 114.4 118.7 92.8 114.5 118.9 102.8 112.0 86.4 102.9 112.1 75 years and over 113.4 115.4 83.2 113.6 115.6 118.7 119.4 85.7 119.1 119.8 100.9 107.3 76.7 101.1 107.5
23
Table 6, continued Notes: MI = Money Income (used in official measure) PreT = Pre-tax pre-means-tested transfer income (without return to home equity) PreT+HE* = Pre-tax pre-means-tested transfer income (with return to home equity) PostT = Post-tax post-means-tested transfer income (without return to home equity) PostT+HE = Post-tax post-means-tested transfer income (with return to home equity minus property taxes). The index is computed as the ratio of the share of poverty under the subject measure to the share of poverty under the official measure. Source: U.S. Census Bureau, Current Population Survey, 2003 Annual Social and Economic Supplement, except household post-transfer measures provided by Sentier Research using the public use version of the same data set.
24
Table 7: Percentage Reduction in Pre-Transfer Poverty Rate for Six Alternative Measures, by Age: 2002
Official Thresholds, CPI-U adjustment
Three-parameter Thresholds, CPI-U
adjustment
Three-parameter Thresholds, CPI-U-RS
adjustment
Age
PostT PostT+HE PostT PostT+HE PostT PostT+HE People in Families and Unrelated Individuals All people 20.3 19.0 22.7 21.6 27.5 26.3 Under 18 years 27.0 26.1 29.8 29.0 36.1 35.0 Related children under 18 years 27.8 26.7 31.1 29.3 36.6 36.8 Related children under 6 years 24.6 22.4 26.8 24.9 31.9 31.6 18 to 24 years 8.2 6.7 9.4 9.1 12.1 11.8 25 to 44 years 19.8 18.1 22.7 21.2 26.6 25.6 45 to 64 years 14.6 14.3 17.8 15.6 23.1 21.2 65 years and over 21.7 23.1 20.7 19.8 26.1 25.8 65 to 74 years 24.0 24.7 22.7 23.1 29.1 27.9 75 years and over 19.7 20.5 18.0 18.6 23.2 24.6 People in Households All People 22.4 21.0 24.0 23.0 30.1 29.2 Under 18 years 26.9 25.5 30.5 29.1 36.8 36.2 Related children under 18 years 26.9 25.5 30.7 29.2 37.0 36.4 Related children under 6 years 23.5 21.4 27.0 25.0 32.8 32.2 18 to 24 years 13.3 11.6 11.9 11.3 16.1 14.9 25 to 44 years 23.0 20.7 25.5 23.5 31.3 29.4 45 to 64 years 17.7 16.4 19.1 17.9 25.7 23.8 65 years and over 21.7 22.2 19.7 20.2 26.5 26.4 65 to 74 years 24.7 25.2 22.2 22.9 29.7 29.0 75 years and over 19.1 19.3 17.6 17.7 23.5 23.9 Notes: PreT = Pre-tax pre-means-tested transfer income (without return to home equity) PreT+HE* = Pre-tax pre-means-tested transfer income (with return to home equity) PostT = Post-tax post-means-tested transfer income (without return to home equity) PostT+HE = Post-tax post-means-tested transfer income (with return to home equity minus property taxes) The percentage reduction is defined for the measures that exclude home equity as {100 – [100 X (PostT – PreT)/PreT]}, with the analogous calculation for measures that include home equity.
Source: Sentier Research tabulations of Current Population Survey 2003 Annual Social and Economic Supplement Public Use File (with TRIM Substitutions for TANF, SSI, and Food Stamps).
25
Table 8. Effects of Adjusting for Unreported TANF, SSI, and Food Stamp Income on Household Poverty Rate Measures: 2002
Measure Money Income
Post-tax post-
transfer
Post-tax post-transfer
plus imputation for home equity minus
property taxes No adjustment for unreported income Official Thresholds, CPI-U inflation adjustment 10.5 8.7 7.9 Three-parameter Thresholds, CPI-U inflation adjustment 10.5 8.6 7.8 Three-parameter Thresholds, CPI-U-RS inflation adjustment 8.6 6.6 6.0 Adjusted for unreported income Official Thresholds, CPI-U inflation adjustment 10.2 7.9 7.1 Three-parameter Thresholds, CPI-U inflation adjustment 10.2 7.8 6.9 Three-parameter Thresholds, CPI-U-RS inflation adjustment 8.3 5.6 5.0 Notes: Official poverty rate for families and unrelated individuals is 12.1 percent. TANF = Temporary Assistance for Needy Families SSI = Supplemental Security Income Source: Sentier Research tabulations of Current Population Survey 2003 Annual Social and Economic Supplement Public Use File (with TRIM Substitutions for TANF, SSI, and Food Stamps).
26
Figure 1. Index of Change in Poverty Shares for Six Pre-Transfer Poverty Measures for the Four Largest States: 2002
70.075.080.085.090.095.0
100.0105.0110.0115.0120.0
offl thld-CPI
3prmthld-CPI
3prmthld-RS
offl thld-CPI
3prmthld-CPI
3prmthld-RS
CaliforniaTexasNew YorkFlorida
[------------families-----------] [---------households--------] Note: The index is computed as the ratio of the share of poverty under the subject measure to the share of poverty under the official measure. See text for description of alternative measures. Source: U.S. Census Bureau, Current Population Survey, 2003 Annual Social and Economic Supplement. Figure 2. Index of Change in Poverty Shares for Six Pre-Transfer Poverty Measures that Include Imputed Return to Home Equity for the Four Largest States: 2002
70.075.080.085.090.095.0
100.0105.0110.0115.0120.0
offl thld-CPI
3prmthld-CPI
3prmthld-RS
offl thld-CPI
3prmthld-CPI
3prmthld-RS
CaliforniaTexasNew YorkFlorida
[------------families-----------] [---------households--------] Note: The index is computed as the ratio of the share of poverty under the subject measure to the share of poverty under the official measure. See text for description of alternative measures. Source: U.S. Census Bureau, Current Population Survey, 2003 Annual Social and Economic Supplement.
27
Figure 3. Index of Change in Poverty Shares for Six Pre-Transfer Poverty Measures for Children and Seniors: 2002
70.0
80.0
90.0
100.0
110.0
120.0
offl thld- CPI 3prm thld- CPI 3prm thld- RS offl thld- CPI 3prm thld- CPI 3prm thld- RS
pre-transfer <18pre-transfer 65+pre-transfer+HE* <18pre-transfer+HE* 65+
[-------------families-----------] [---------households---------] Note: The index is computed as the ratio of the share of poverty under the subject measure to the share of poverty under the official measure. See text for description of alternative measures. Source: U.S. Census Bureau, Current Population Survey, 2003 Annual Social and Economic Supplement. Figure 4. Poverty Rates -- Official and 29 Alternative Definitions: 2002
0.02.04.06.08.0
10.012.014.016.018.0
offl thld-CPI 3prm thld-CPI
3prm thld-RS
offl thld-CPI 3prm thld-CPI
3prm thld-RS
moneyincomepre-transfer
pre-transfer+HE*post-transfer
post-transfer+HE
[-------------families------------] [---------households---------] Note: See text for description of alternative measures. Official poverty is calculated by comparing money income to the official thresholds adjusted for inflation using the CPI-U for families [and unrelated individuals]. Source: U.S. Census Bureau, Current Population Survey, 2003 Annual Social and Economic Supplement, except household post-transfer measures provided by Sentier Research using the public use version of the same data set.
28
Figure 5. Effects of Means-Tested Transfers, Taxes, and Imputed Return to Home Equity on Poverty Rates of Children: 2002
0.0
2.0
4.0
6.0
8.0
10.0
12.0
14.0
16.0
18.0
offl thld-CPI 3prm thld-CPI
3prm thld-RS
offl thld-CPI 3prm thld-CPI
3prm thld-RS
pre-transferpre-transfer+HE*post-transferpost-transfer+HE
[--------------families------------] [----------households----------] Note: See text for description of alternative measures. Source: U.S. Census Bureau, Current Population Survey, 2003 Annual Social and Economic Supplement, except household post-transfer measures provided by Sentier Research using the public use version of the same data set. Figure 6. Effects of Means-Tested Transfers, Taxes, and Imputed Return to Home Equity on Poverty Rates of Seniors: 2002
0.0
2.0
4.0
6.0
8.0
10.0
12.0
14.0
16.0
18.0
offl thld-CPI 3prm thld-CPI
3prm thld-RS
offl thld-CPI 3prm thld-CPI
3prm thld-RS
pre-transferpre-transfer+HE*post-transferpost-transfer+HE
[------------families-------------] [----------households----------] Note: See text for description of alternative measures. Source: U.S. Census Bureau, Current Population Survey, 2003 Annual Social and Economic Supplement, except household post-transfer measures provided by Sentier Research using the public use version of the same data set.
29
Figure 7. Household Poverty Rates under Alternative Definitions that Include Some Unreported Income: 2002
0.02.04.06.08.0
10.012.014.016.018.0
money income post-transfer post-transfer plus homeequity
Official-CPI3param-RSOfficial-CPI-adj3param-RS-adj
Note: See text for description of alternative measures. Source: Sentier Research tabulations of Current Population Survey 2003 Annual Social and Economic Supplement Public Use File (with TRIM Substitutions for TANF, SSI, and Food Stamps). Figure 8. Index of Change in Poverty Shares for Children for Household Measures that Include Some Unreported Income: 2002
70.0
80.0
90.0
100.0
110.0
120.0
offl thld-CPI 3prm thld-CPI 3prm thld-RS
money incomepost-transferpost-transfer+HEmoney income adjpost-transfer adjpost-transfer+HE adj
Note: The index is computed as the ratio of the share of poverty under the subject measure to the share of poverty under the official measure. See text for description of alternative measures. Source: Sentier Research tabulations of Current Population Survey 2003 Annual Social and Economic Supplement Public Use File (with TRIM Substitutions for TANF, SSI, and Food Stamps).