Embed Size (px)
Citation preview

STRICTLY PRIVATE AND CONFIDENTIAL
For conference attendees of
Invest‟11 only
© NomuraSeptember 2011
Alternative Investments –
Trends in Strategies & Structures
Sandy Rattray
Chief Investment Officer
Man Systematic Strategies

DISCLAIMER
Important notes
This material is communicated by Man Investments AG (the „Company‟), which is regulated and authorised by the Swiss Financia l Market Supervisory Authority (FINMA).
This material is for educational purposes only and should not be relied upon for any other purpose. This material includes facts, views and opinions of global economic markets
deemed of interest.
This material is only to be communicated to investment professionals and professional clients only and should not be relied upon by any other person.
The information is submitted on a confidential basis to the attendees only and may not be reproduced to anyone else other than the attendees.
This material is proprietary information of the Company and its affiliates and may not be reproduced or otherwise disseminated in whole or in part without prior written consent
from the Company. The Company believes its data and text services to be reliable, but accuracy is not warranted or guaranteed. We do not assume any liability in the case of
incorrectly reported or incomplete information.
Information contained herein is provided from the Man database except where otherwise stated. Please be aware that investment products involve investment risks, including
the possible loss of the principal amount invested. Alternative investments can involve significant risks and the value of an investment may go down as well as up. Returns may
increase or decrease as a result of currency fluctuations. The data used herein constitutes the latest data available at the time of production.
The Company and/or any of its affiliates may have an investment in the described investment products.
Benchmarks and financial indices are shown only for illustrative purposes. There are inherent limitations in any comparison between a managed portfolio and a passive index.
Each index is unmanaged and does not incur management fees, transaction costs and other expenses associated with a managed portfolio.
In preparing this material, we have relied upon and assumed, without independent verification, the accuracy and completeness of all information available from public sources
or which was provided to us or otherwise reviewed by us. Some statements contained in these materials concerning goals, strategies, outlook or other non-historical matters
may be “forward-looking statements” and are based on current indicators and expectations. These forward-looking statements speak only as of the date on which they are
made, and The Company undertakes no obligation to update or revise any forward-looking statements. These forward-looking statements are subject to risks and uncertainties
that may cause actual results to differ materially from those contained in the statements.
This material is not suitable for US persons.
www.maninvestments.com

Source: Man database.
1. As at 30 June 2011 (Unaudited final figures).
2. As at 30 June 2011 (permanent employees).
3. As at 30 June 2011.
An independent alternative asset manager able to draw on the backing of a robust balance sheet
Offering a comprehensive range of transparent trading strategies across the liquidity spectrum, with US$71.0bn
under management1
Benefits from an extensive pool of talented professionals, with approximately 1,600 employees2 worldwide
Serves a highly-diversified and global client base through a powerful distribution network
A constituent of the FTSE 100 Index (UK: EMG) with a market capitalisation of US$7.0bn3
Strength through size, capital position, independence and global presence
Introduction to Man
2

1. Please note that Nephila is Man affiliated manager but is not wholly owned by Man Group.
Integrating world-leading investment talent in a single asset management entity
Introduction to Man
AHL GLG Multi-managerSingle manager
platform
Quantitative managed
futures manager
Multi-strategy global
alternative investment
specialist
Credit and convertibles
Long-only funds
FoHFs
Structured products
Managed accounts
Advisory solutions
Convertible bonds
Man Systematic Strategies
Nephila¹
Regulated in 17 jurisdictions worldwide
US
Cayman Is.
UKUAESwitzerlandNetherlands Singapore
Guernsey Hong Kong Ireland
LuxembourgJapan
Australia
Uruguay
ItalyCanadaBermuda
3

HF industry recovery from financial crisis
Investors’ search for transparency and liquidity
Success through innovation in systematic strategies

Source: HFR Global Hedge Fund Industry Report Q2 2011.
Industry AuM January 01, 1990 – June 30, 2011
HF industry recovery from financial crisis
0
200,000
400,000
600,000
800,000
1,000,000
1,200,000
1,400,000
1,600,000
1,800,000
2,000,000
2,200,000
1990 1991 1992 1993 1994 1995 1996 1997 1998 1999 2000 2001 2002 2003 2004 2005 2006 2007 2008 2009 2010 Q1 2011
Q2 2011
Hedge fund industry AuM (USD million)
4

HF industry recovery from financial crisis
Source: Bloomberg.
There is no guarantee of trading performance and past or projected performance is not a reliable indicator of future performance. Please note that the HFRI data over the last four months may be subject to change.
Hedge funds: HFRI Fund Weighted Composite Index. World stocks: MSCI World (USD, NDTR) Hedged. World bonds: Citigroup World Government Bond Index hedged to USD (Total return).
The core proposition of hedge funds reinforced
5
January 01, 1994 – January 31, 2011
0
1,000
2,000
3,000
4,000
5,000
6,000
1994 1995 1996 1997 1998 1999 2000 2001 2002 2003 2004 2005 2006 2007 2008 2009 2010 2011
Index value (US$)
End value
US$2,532
End value
US$4,882
End value
US$2,824
HFRI fund weighted composite index World stocks World bonds

(600)
(400)
(200)
0
200
400
600
1,300
1,400
1,500
1,600
1,700
1,800
1,900
2,000
2,100
2006 2007 2008 2009 2010 Q1 2011
Net flow Net performance Estimated assets
HF industry recovery from financial crisis
As at March 31, 2011.
Source: HFR, Q1 2011 report.
Flows dominated by $1bn+ firms, but still
a place for niche
Part of broader 2011 move across assets
into risk, out of low yield/cash
2011 industry flows show healthy demand for liquid alternatives
2006 – Q1 2011 Hedge fund industry flows trajectory
6
Industry rebuilds
through performanceFlow pick
up
(AUM US$bn) Net asset
increase

HF industry recovery from financial crisis
Investors’ search for transparency and liquiditySuccess through innovation in systematic strategies

Source: SEI Knowledge Partnership and Greenwich Associates, „The Era of the Investor: New Rules of Institutional Hedge Fund Investing‟, January 2011.
Investors’ search for transparency and liquidity
0 5 10 15 20 25
Educating board
Headline risk/bad press
Manager selection
Understanding risk
Earning non-correlated returns
Liquidity
Fees/value for money
Meeting performance expectations
Transparency
Respondents (%)
7
Single most important challenge faced, respondents (%)

What kind of portfolio information will you require from hedge fund managers?
Investors’ search for transparency and liquidity/2
2009 Deutsche Bank Alternative Investment Survey. Source: Deutsche Bank.
0
10
20
30
40
50
60
70
80
90
100
Performance Risk exposures Asset classes Regional breakdown Industry breakdown Largest positions Full position transparency
Respondents (%)
2008 2009
Even though with fewer importance than other aspects of transparency, investors‟ interest in full position transparency has increased
the most
8

Investors’ search for transparency and liquidity
Performance paramount, but confidence and understanding the key to rebuilding trust
Investor preferences Industry outcomes
Provide me with controlled, transparent and
flexible investment outcomes
Deliver my investment in formats I
know and trust
Re-assure me that the investment manager’s
business model is sustainable
Liquid strategies, un-benchmark constrained, with low
correlations to traditional allocations
MACs
Standalone allocations, completion portfolios, overlay
strategies
UCITS
Daily pricing, detailed reporting
Asset flow to managers demonstrating
– Financial and regulatory strength
– Transparency
– Resources to invest in people, systems and research
9

Do you use managed accounts?
Investors’ search for transparency and liquidity
2009 Deutsche Bank Alternative Investment Survey. Source: Deutsche Bank.
0
10
20
30
40
50
60
70
2004 2005 2008 2009
Respondents (%)
Yes No N/A
Managed accounts offer considerable transparency, liquidity and reporting benefits
10
Appetite for managed account investments has increased steadily

Investors’ search for transparency and liquidity
Regulatory trends taking greater shape
Enhanced manager regulation
Changing capital requirements for banks
Trading increasingly centralised and on-
exchange
Workable outcomes for scale managers
Depth of resources and breadth of offering key
Less crowded trading
Opportunities to capture spin-out teams
Increasing opportunity and efficiency
Premium on operational capability
11

Regulatory trends across the world
Investors’ search for transparency and liquidity
Cost to comply estimated at €5bn in Europe alone
Migration from consultation
to implementation
Different speeds and approaches
Deep regulatory expertise and
relationships a must have
Global themes
New regulatory architecture
AIFM Directive reached workable
compromise, detail to come
UCITS IV and V
OTC derivative trading review
and more…
Europe
Dodd-Frank: Challenge of
rule-making
OTC derivatives trading reform: US
6–12 months ahead of Europe
Volcker rule and spin out of hedge
teams and prop desks
US
Focus on selling process
and understanding
Product key information sheets and
enhanced risk disclosure
Classification of derivative products
Asia-Pacific
12

HF industry recovery from financial crisis
Investors’ search for transparency and liquidity
Success through innovation in systematic strategies

Equity hedged (%) Relative value (%) Event driven (%) Global macro (%) Managed futures (%)
1994 2.61 4.00 6.00 (4.30) (6.13)
1995 31.04 15.66 25.11 29.32 16.23
1996 21.75 14.49 24.84 9.32 18.18
1997 23.41 15.93 21.23 18.82 16.37
1998 15.98 2.81 1.70 6.19 12.94
1999 44.22 14.73 24.33 17.62 (4.37)
2000 9.09 13.41 6.74 1.97 7.20
2001 0.40 8.92 12.18 6.87 3.97
2002 (4.71) 5.44 (4.30) 7.44 26.67
2003 20.54 9.72 25.33 21.42 16.93
2004 7.68 5.58 15.01 4.63 3.39
2005 10.60 6.02 7.29 6.79 (1.95)
2006 11.71 12.37 15.33 8.15 6.20
2007 10.48 8.94 6.61 11.11 5.68
2008 (26.65) (18.04) (21.82) 4.83 17.45
2009 24.57 25.81 25.04 4.34 (7.55)
2010 10.45 11.43 11.86 8.06 13.27
Rank Best 2 3 4 5
Different hedge fund styles perform well in different time periods
Success through innovation in systematic strategies
13
Equity hedged: HFRI Equity Hedge (Total) Index. Relative value: HFRI Relative Value (Total) Index. Event driven: HFRI Event-Driven (Total) Index. Global macro: HFRI Macro (Total) Index. Managed futures: Stark 300 Trader Index.
The Stark 300 Trader index is 1.7 times levered to reflect Man‟s investment approach to managed futures.
Please note that the HFRI index data over the past 4 months may be subject to change.
Source: Bloomberg & Stark & Co, Inc.

Success through innovation in systematic strategies
Source: Article «What Happened To The Quants In August 2007?» written by Amir E. Khandani and Andrew W Lo.
A number of quantitative long/short equity hedge funds experienced unprecedented losses during the week of August 6, 2007
Hypothesis: Losses initiated by the rapid “unwind” of one or more sizeable quantitative equity-market neutral portfolios
Likely the result of a forced liquidation by a multi-strategy fund or a proprietary trading desk
Initial losses put further pressure on broader set of equity portfolios, causing further losses by triggering stop/loss and
de-leveraging policies
Significant rebound in these strategies on August 10th
What happened to the quants in August 2007? (A. E. Khandani and A. Lo)
14
-15%
-10%
-5%
0%
5%
10%
15%
20%
25%
08/06/07 08/07/07 08/08/07 08/09/07 08/10/07 08/13/07 08/14/07 08/15/07
Leveraged Contrarian Strategy S&P 500 S&P 600 (Small Cap) Lehman Corp-Gov
Unique factors
Innovative models
Long run experience
Solution

Performance of GLG broker ideas vs. ALL analyst recommendations from ALL brokers in Europe
Success through innovation in systematic strategies
Buy ideas provided to GLG by brokers have outperformed the market consistently
Ideas provided to GLG generally perform better than the average of all broker recommendations in the market
GLG specifically requests medium-term (60–90 day) ideas
0.0
0.5
1.0
1.5
2.0
0 10 20 30 40 50 60 70Business days after announcement day close
GLG buy recommendations IBES buy recommendations
Outperformance vs. market (%)
GLG
alpha
GLG typically reacts here
Long-only manager typically reacts here
Long-only
manager
alpha
Recommendation alpha slows
Performance of GLG broker ideas vs. ALL analyst recommendations from ALL brokers in Europe
15
Source: Source: GLG Partners LP, data as at Q4 2010
We have shown excess performance to the market, using the D J STOXX Large, Mid or Small cap index depending on the market cap of the stock. Performance is set at zero on the close of the day the recommendation is made.
IBES is the Institutional Brokers‟ Estimate System which collects, analyses and redistributes broker forecast estimates and recommendations for companies across the globe and is publicly available
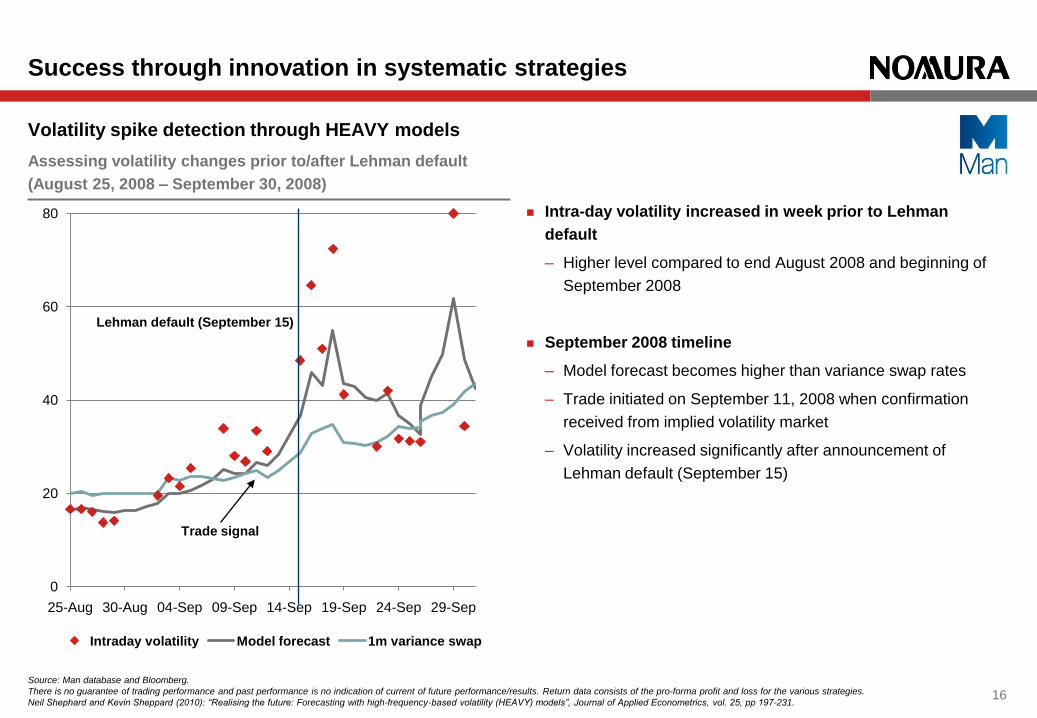
Intra-day volatility increased in week prior to Lehman
default
– Higher level compared to end August 2008 and beginning of
September 2008
September 2008 timeline
– Model forecast becomes higher than variance swap rates
– Trade initiated on September 11, 2008 when confirmation
received from implied volatility market
– Volatility increased significantly after announcement of
Lehman default (September 15)
Success through innovation in systematic strategies
Source: Man database and Bloomberg.
There is no guarantee of trading performance and past performance is no indication of current of future performance/results. Return data consists of the pro-forma profit and loss for the various strategies.
Neil Shephard and Kevin Sheppard (2010): “Realising the future: Forecasting with high-frequency-based volatility (HEAVY) models”, Journal of Applied Econometrics, vol. 25, pp 197-231.
Volatility spike detection through HEAVY models
0
20
40
60
80
25-Aug 30-Aug 04-Sep 09-Sep 14-Sep 19-Sep 24-Sep 29-Sep
Intraday volatility Model forecast 1m variance swap
Assessing volatility changes prior to/after Lehman default
(August 25, 2008 – September 30, 2008)
Lehman default (September 15)
Trade signal
16
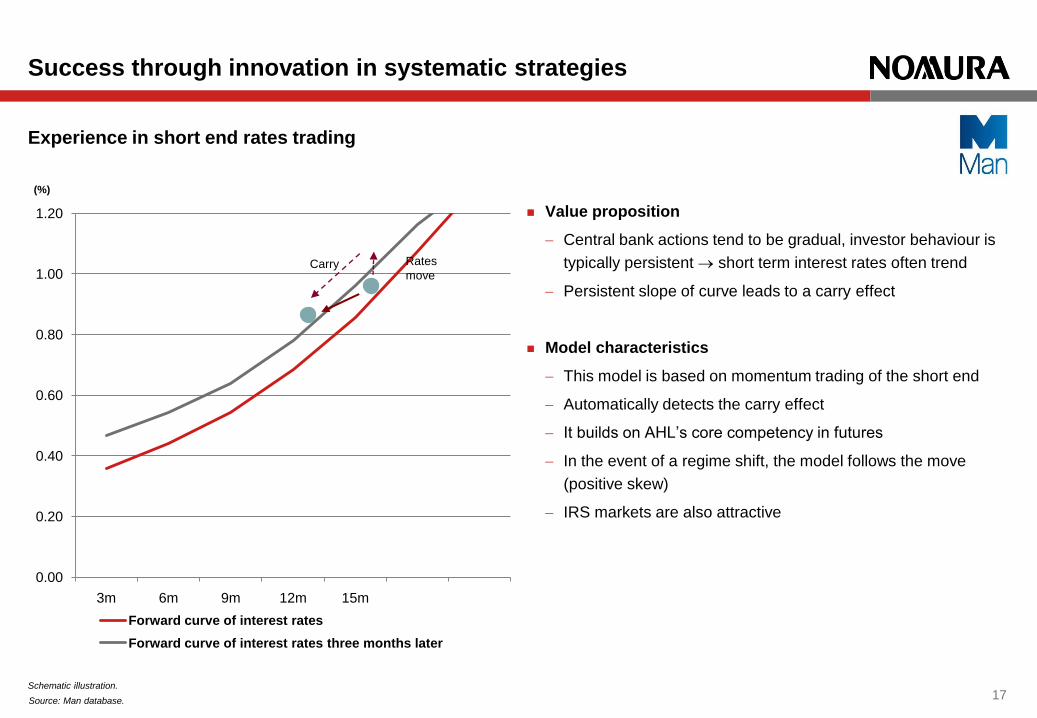
Value proposition
Central bank actions tend to be gradual, investor behaviour is
typically persistent short term interest rates often trend
Persistent slope of curve leads to a carry effect
Model characteristics
This model is based on momentum trading of the short end
Automatically detects the carry effect
It builds on AHL‟s core competency in futures
In the event of a regime shift, the model follows the move
(positive skew)
IRS markets are also attractive
Success through innovation in systematic strategies
Experience in short end rates trading
0.00
0.20
0.40
0.60
0.80
1.00
1.20
3m 6m 9m 12m 15m
Forward curve of interest rates
Forward curve of interest rates three months later
(%)
17Schematic illustration.
Source: Man database.
Carry Rates
move

The mean reversion challenge
– Deviation from the mean: Bet on reversion
– Further deviation: Increase bet (bigger opportunity) or reduce bet (regime shift)?
Systematic risk reduction in mean reversion strategies
Success through innovation in systematic strategies
Solution
– Mean reversion is parameterised by volatility, σ, and strength of mean reversion, λ.
– Markowitz, Kelly, Control theory all argue for a bet proportional to λ/σ^2
– In a regime shift: σ typically increases; λ decreases so positions decrease and losses are capped
– Cap positions by expected sharpe of the position
Ra
te
Tenorwingbodywing
18Schematic illustration.
Source: Man database.

Simple carry strategy
– On average, investors get paid for holding EM currencies
– Flight to quality gives occasional deep drawdowns, negative skew
Making carry trading robust
Success through innovation in systematic strategies
Carry + regime detection
– Reduce/close/short carry positions during flight to quality
– Reduced drawdowns, small positive skew (5%)
15%
35%
55%
2001 2002 2003 2004 2005 2006 2007 2008 2009 2010 2011
19
MSS FX active carry
Source: Man database.
The simulated past performance of the Man Systematic Fixed Income portfolio is based on the weighted returns of its constituting underlying funds, including estimated transaction costs but excluding management and performance
fees. Simulated past performance means performance that has been calculated for a period for which no actual performance information for the is available. Actual performance results may differ, and may differ substantially, from
such simulated past performance. The simulated past performance is for information purposes only.

A systematic fixed income product
Success through innovation in systematic strategies
(25)
25
75
125
175
225
2001 2002 2003 2004 2005 2006 2007 2008 2009 2010 2011
Cumulative returns
FX active carry Yield curve shape Short end rates Total return
20
Source: Man database.
The simulated past performance of the Man Systematic Fixed Income portfolio is based on the weighted returns of its constituting underlying funds, including estimated transaction costs but excluding management and performance
fees. Simulated past performance means performance that has been calculated for a period for which no actual performance information for the is available. Actual performance results may differ, and may differ substantially, from
such simulated past performance. The simulated past performance is for information purposes only.

STRICTLY PRIVATE AND CONFIDENTIAL
For conference attendees of
Invest‟11 only
© Nomura
This presentation has been prepared by Man Investments AG and Nomura takes no responsibility for the contents. Nomura International plc is authorised and regulated by UK Financial Services Authority (FSA). This presentation is
intended only for investors who are "eligible market counterparties" or "professional clients" as defined by FSA. This presentation is not intended for retail clients and should not be distributed as such. You may not without the prior written
consent of NIplc distribute, reproduce, in whole or in part, summarise, quote from or otherwise publicly refer to the contents of this presentation. This presentation is for discussion purposes only. This presentation does not constitute an offer
to sell, or the solicitation of an offer to purchase, any securities. All opinions and estimates included in this document constitute NIplc's judgment as of this date and are subject to change without notice. There can be no assurance, nor is
there any guarantee (implied or otherwise), that any opinions contained in this document related to any forecasts will be met. The information contained herein is believed to be accurate in all respects, but no representation or warranty,
expressed or implied, as to its accuracy or completeness is made by any party. Nothing contained herein should be relied upon as a promise or representation as to the future. Information contained in this presentation is not intended to
provide, and should not be relied upon for, accounting, legal, or tax advice or investment recommendations. It does not constitute a personal recommendation as defined by the FSA, or take into account the particular investment objectives,
financial situations, or needs of individual investors. You should consult your tax, legal and accounting advisers about the issues discussed herein and you shall be responsible for evaluating the risks and merits involved in any investment
described in this presentation. Information on any particular tax treatment may not be applicable to your individual circumstance and may be subject to change in the future. NIplc gives no assurance or guarantee that forecasts contained in
this presentation will be met. Figures presented in this document may refer to the past or simulated past performance. Past and simulated past performance is not a reliable indicator of future performance.