Embed Size (px)
Citation preview
Alternative Fuels Study Configuration Review
Prepared For Alberta Energy Research Institute & Alberta Environment
December 2008
For Jacobs Consultancy Mike Armstrong Ian Buchanan December 2008
Alternative Fuels Study Configuration Review
(Volume 2)
Prepared For
Alberta Energy Research Institute & Alberta Environment
525 W. Monroe, Suite 1350 Chicago, Illinois 60661 USA fax: +312.655.9706
This report was prepared based in part on information not within the control of the consultant, Jacobs Consultancy Inc. Jacobs Consultancy has not made an analysis, verified, or rendered an independent judgment of the validity of the information provided by others. While it is believed that the information contained herein will be reliable under the conditions and subject to the limitations set forth herein, Jacobs Consultancy does not guarantee the accuracy thereof. Use of this report or any information contained therein shall constitute a release and contract to defend and indemnify Jacobs Consultancy from and against any liability (including but not limited to liability for special, indirect or consequential damages) in connection with such use. Such release from and indemnification against liability shall apply in contract, tort (including negligence of such party, whether active, passive, joint or concurrent), strict liability or other theory of legal liability, provided, however, such release limitation and indemnity provisions shall be effective to, and only to, the maximum extent, scope, or amount allowed by law. The Alberta Energy Research Institute and Her Majesty the Queen in right of Alberta make no warranty, express or implied, nor assume any legal liability or responsibility for the accuracy, completeness, or usefulness of any information, contained in this publication, nor that use thereof will not infringe on privately owned rights. The views and opinions of the author expressed herein do not necessarily reflect those of the Alberta Energy Research Institute or Her Majesty the Queen in right of Alberta. The Government of Alberta, its officers, employees, agents and consultants are exempted, excluded and absolved from all liability for damage or injury, howsoever caused, to any person in connection with or arising out of the use by that person for any purpose of this publication or its contents.
Table of Contents
Section Page
- i -
A Introduction ..............................................................................................................1 B Methodology & Assumptions..................................................................................3 Methodology...............................................................................................................4 Assumptions...............................................................................................................5 Environmental Standards ..................................................................................7 C Configuration Descriptions .....................................................................................9 Common Facilities....................................................................................................10 Reservoir and Well Pads .................................................................................10 Oil Treating Section .........................................................................................11 De-Oiling and Water Treating..........................................................................11 Steam Generation ...........................................................................................11 Case 1—Natural Gas Configuration.........................................................................12 Case 2—Natural Gas Combustion with Carbon Capture .........................................13 Case 3—Bitumen ATB Combustion .........................................................................14 Case 4—Bitumen Combustion with Carbon Capture ...............................................15 Case 5—Petcoke Combustion .................................................................................15 Case 6—Petcoke Combustion with Carbon Capture ...............................................16 Case 7—Bitumen Gasification .................................................................................16 Case 8—ATB Gasification with Carbon Capture......................................................19 Case 9—Petcoke Gasification..................................................................................19 Case 10—Solid Gasification with Carbon Capture...................................................19 CO2 Emissions Summary.........................................................................................20 D Economic Analyses ...............................................................................................22 Economic Assumption and Qualifications ................................................................23 Feed and Product Pricing ................................................................................23 CAPEX ............................................................................................................23 OPEX...............................................................................................................24 Capital Expenditures ................................................................................................25 Operating Expenditures............................................................................................27 Economic Return......................................................................................................29 Emission Control Costs ............................................................................................36
Table of Contents
Section Page
- ii -
E Configuration Sensitivities....................................................................................39 Retrofit ................................................................................................................40 Reduced Scale Facilities ..........................................................................................41 Carbon Capture Technology ....................................................................................42 Oxyfuel Combustion ........................................................................................42 Chilled Ammonia Carbon Capture...................................................................43 Economic Comparison ....................................................................................44 Capital Cost Escalation ............................................................................................45 Bitumen Price Ratio..................................................................................................46 F Decision Matrix Analysis .......................................................................................48 Decision Matrix Methodology ...................................................................................49 G Areas for Future Study ..........................................................................................54 Strategic Considerations ..........................................................................................55 Address Water Treating Considerations..........................................................55 Improve Gasification Capital Costs .................................................................55 Reduce Energy Costs of Carbon Capture .......................................................55 Investigate Alternative Methods of Petcoke Transport ....................................55 Consider Transport of Stranded Liquid Fuels..................................................56 Reduce CO2 Emissions by Improving SAGD Efficiency..................................56 Technologies to Be Investigated ..............................................................................56 Circulating Dry Scrubbing................................................................................56 Improved Gasification......................................................................................57 MSAR Technology...........................................................................................57 Chilled Ammonia .............................................................................................57 Downhole Pump Technologies........................................................................57 H Conclusions............................................................................................................58
Appendices
1 Assay Information 2 Block Flow Diagrams 3 Decision Matrix Analysis
- 1 -
This document, and the opinions, analysis, evaluations, or recommendations contained herein are for the sole use and benefit of the contracting parties. There are no intended third party beneficiaries, and Jacobs Consultancy shall have no liability whatsoever to third parties for any defect, deficiency, error, omission in any statement contained in or in any way related to this document or the services provided. Use of this report or any information contained therein shall constitute a release and contract to defend, indemnify and hold Jacobs Consultancy Inc. harmless from and against any liability (including but not limited to liability for special, indirect or consequential damages) arising in connection with such use to the maximum extent, scope or amount allowed by law.
Section A.
Introduction
- 2 -
This document, and the opinions, analysis, evaluations, or recommendations contained herein are for the sole use and benefit of the contracting parties. There are no intended third party beneficiaries, and Jacobs Consultancy shall have no liability whatsoever to third parties for any defect, deficiency, error, omission in any statement contained in or in any way related to this document or the services provided. Use of this report or any information contained therein shall constitute a release and contract to defend, indemnify and hold Jacobs Consultancy Inc. harmless from and against any liability (including but not limited to liability for special, indirect or consequential damages) arising in connection with such use to the maximum extent, scope or amount allowed by law.
With the progression of fields in the Alberta Oil Sands region, producers are increasingly relying on in-situ methods of recovery, particularly for deposits too far down to allow mining methods. The most common method of bitumen recovery is Steam Assisted Gravity Draining (SAGD), which currently consumes large amounts of natural gas in the production of steam. In fact, natural gas makes up nearly two-thirds of the entire operating expense of a SAGD facility. Producers are looking for a more economic alternative, while regulatory bodies such as Alberta Environment (AENV) would like to encourage producers to reduce usage of this relatively clean energy source. Alberta Energy Research Institute (AERI) and Alberta Environment (AENV) commissioned Jacobs Consultancy Inc. (“Jacobs Consultancy”) to conduct this alternative fuels study to better understand the economic and environmental implications of alternative fuel sources. The first phase of the study (documented in Volume 1 of 2) was a general review of all technologies related to combustion or gasification of alternative fuels for use in SAGD bitumen production. In the second phase, the project team assembled technologies selected from the first phase to create a production facility configuration. The configuration study is documented in this report (Volume 2 of 2). Modeling of the Alternative Fuels Process Configuration is intended to achieve the following:
1. Establish a basis by which to compare natural gas combustion with alternative fuels in terms of economic performance.
2. Define expected externalities such as foot print, air emissions, solid wastes, and waste water generation for the different fuel types.
3. Verify Capital Expenditure (CAPEX) and Operating Expense (OPEX) assumptions posited for different technologies in Phase 1 of this study.
The results of the configuration study were used both to serve as a basis for a decision matrix analysis and to allow economic comparisons of the technologies. Comparisons are intended to provide an indication of the relative incentives to producers for alternative fuels and establish the marginal costs of emission controls.

- 3 -
This document, and the opinions, analysis, evaluations, or recommendations contained herein are for the sole use and benefit of the contracting parties. There are no intended third party beneficiaries, and Jacobs Consultancy shall have no liability whatsoever to third parties for any defect, deficiency, error, omission in any statement contained in or in any way related to this document or the services provided. Use of this report or any information contained therein shall constitute a release and contract to defend, indemnify and hold Jacobs Consultancy Inc. harmless from and against any liability (including but not limited to liability for special, indirect or consequential damages) arising in connection with such use to the maximum extent, scope or amount allowed by law.
Section B.
Methodology & Assumptions
- 4 -
This document, and the opinions, analysis, evaluations, or recommendations contained herein are for the sole use and benefit of the contracting parties. There are no intended third party beneficiaries, and Jacobs Consultancy shall have no liability whatsoever to third parties for any defect, deficiency, error, omission in any statement contained in or in any way related to this document or the services provided. Use of this report or any information contained therein shall constitute a release and contract to defend, indemnify and hold Jacobs Consultancy Inc. harmless from and against any liability (including but not limited to liability for special, indirect or consequential damages) arising in connection with such use to the maximum extent, scope or amount allowed by law.
Methodology Jacobs Consultancy has performed multiple Bitumen production and upgrading configuration studies that are generally intended to provide a method for producers to evaluate alternative technologies to burning natural gas, without commissioning a more detailed engineering study. The following are the key features of a Configuration Study:
• Block Flow Diagrams—Block Flow Diagrams (BFDs) are a means of creating a graphical representation of a SAGD facility without showing individual pieces of equipment. For this level of study, we do not delineate equipment; rather, we represent costs, utility requirements, feeds and products for plants or blocks. A BFD will show key feed and product flow rates along with utility requirements, but will generally not indicate intermediate streams or ancillary service flows.
• Utility Balances—A critical portion of the economics involve accounting for heat inputs as well as other utility requirements such as raw water, cooling water, power and steam.
• CAPEX calculations—Jacobs Consultancy has significant experience with engineering and construction of SAGD and bitumen upgrading facilities. We have a database of costs that can be used to represent the costs of similarly sized facilities by means of exponential curves.
• Economic Comparison—Based on the inputs from the BFD and Utility Balances, the economics of the cases (competing technology configurations) are compared side-by-side against each other and the natural gas base case.
• Decision Matrix Analysis—Failure Modes and Effects Analysis (FMEA) is a Six Sigma-based tool that is used to rank technologies by key parameters, both financial and non-financial, to determine the relative benefits of each configuration towards meeting project objectives.
• Sensitivities—Configurations are made up of several small parts or blocks, and it is sometimes effective to analyze a change to a given block without reconstructing the whole configuration. Using sensitivity analysis, we recalculate the cash flow by adjusting a small number of parameters reflecting changes associated with an alternative configuration. As an example, to determine the economic impact of wet versus dry flue gas scrubbing, we would adjust the capital and operating costs associated with flue gas desulphurization and recalculate the cash flow.
- 5 -
This document, and the opinions, analysis, evaluations, or recommendations contained herein are for the sole use and benefit of the contracting parties. There are no intended third party beneficiaries, and Jacobs Consultancy shall have no liability whatsoever to third parties for any defect, deficiency, error, omission in any statement contained in or in any way related to this document or the services provided. Use of this report or any information contained therein shall constitute a release and contract to defend, indemnify and hold Jacobs Consultancy Inc. harmless from and against any liability (including but not limited to liability for special, indirect or consequential damages) arising in connection with such use to the maximum extent, scope or amount allowed by law.
Assumptions Key assumptions in the creation of configurations independent of prices and other economic bases are as follows:
• Facility Size—For purposes of this study we have defined the plant as a SAGD facility feeding an upgrader. Based on past experience we defined the size of the upgrader to be 200 KBPD. We further assumed three SAGD facilities would supply the upgrader, making each SAGD facility 66 KBPD. The equipment required to burn or gasify alternative fuels are complex and expensive, and lend themselves more to a larger facility (>50 kbpd).
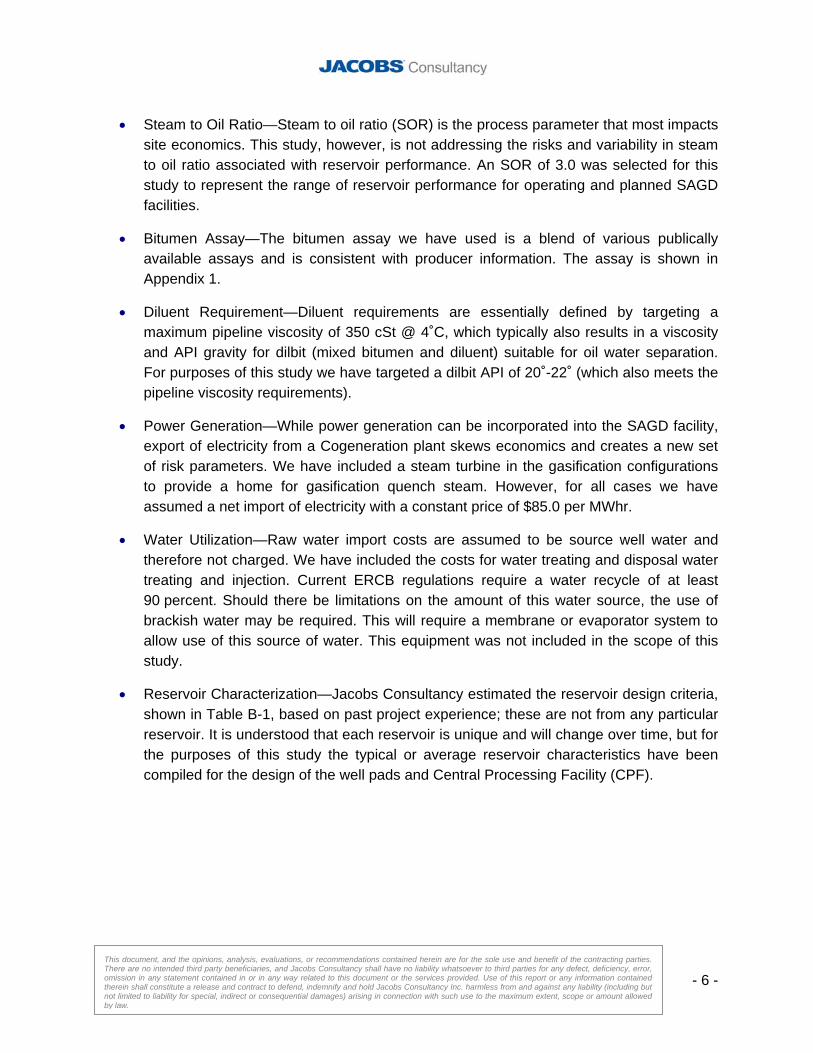
• Facility Scope—The objective of this study is to investigate alternative energy sources for SAGD steam generation facilities. As such, we have ignored the upgrading piece, assuming instead that the bitumen (as dilbit) will be sold to the local market. We selected to eliminate co-location (i.e., onsite upgrading) and cogeneration from the scope. Thus, facility imports include bitumen (from the reservoir), utilities (water, steam, electricity), and diluent (see Figure B-1). The exports include any net energy (steam or power), syngas (carbon monoxide and hydrogen), hydrogen, flue gas, waste materials, and dilbit.
Figure B-1. Facility Imports
Steam Generation Facilities- Natural Gas Boiler- Liquid Boiler- Liquid Gasifier- Solid Gasifier- Fluid Bed Boiler
Imported Fuels
(Natural Gas, Coal, etc.)
HP Steam SAGDProduction
Water Import
Waste Water
Syngas / H2
Electricity Production/Upgrader/
Grid
Upgrader
Upgrader Products(Petcoke,
Pitch, Fuel Oil)
Solid Wastes
Gas Emissions? SOX? NOX? Particulates? Carbon Dioxide
Combustion Air
- 6 -
This document, and the opinions, analysis, evaluations, or recommendations contained herein are for the sole use and benefit of the contracting parties. There are no intended third party beneficiaries, and Jacobs Consultancy shall have no liability whatsoever to third parties for any defect, deficiency, error, omission in any statement contained in or in any way related to this document or the services provided. Use of this report or any information contained therein shall constitute a release and contract to defend, indemnify and hold Jacobs Consultancy Inc. harmless from and against any liability (including but not limited to liability for special, indirect or consequential damages) arising in connection with such use to the maximum extent, scope or amount allowed by law.
• Steam to Oil Ratio—Steam to oil ratio (SOR) is the process parameter that most impacts site economics. This study, however, is not addressing the risks and variability in steam to oil ratio associated with reservoir performance. An SOR of 3.0 was selected for this study to represent the range of reservoir performance for operating and planned SAGD facilities.
• Bitumen Assay—The bitumen assay we have used is a blend of various publically available assays and is consistent with producer information. The assay is shown in Appendix 1.
• Diluent Requirement—Diluent requirements are essentially defined by targeting a maximum pipeline viscosity of 350 cSt @ 4˚C, which typically also results in a viscosity and API gravity for dilbit (mixed bitumen and diluent) suitable for oil water separation. For purposes of this study we have targeted a dilbit API of 20˚-22˚ (which also meets the pipeline viscosity requirements).
• Power Generation—While power generation can be incorporated into the SAGD facility, export of electricity from a Cogeneration plant skews economics and creates a new set of risk parameters. We have included a steam turbine in the gasification configurations to provide a home for gasification quench steam. However, for all cases we have assumed a net import of electricity with a constant price of $85.0 per MWhr.
• Water Utilization—Raw water import costs are assumed to be source well water and therefore not charged. We have included the costs for water treating and disposal water treating and injection. Current ERCB regulations require a water recycle of at least 90 percent. Should there be limitations on the amount of this water source, the use of brackish water may be required. This will require a membrane or evaporator system to allow use of this source of water. This equipment was not included in the scope of this study.
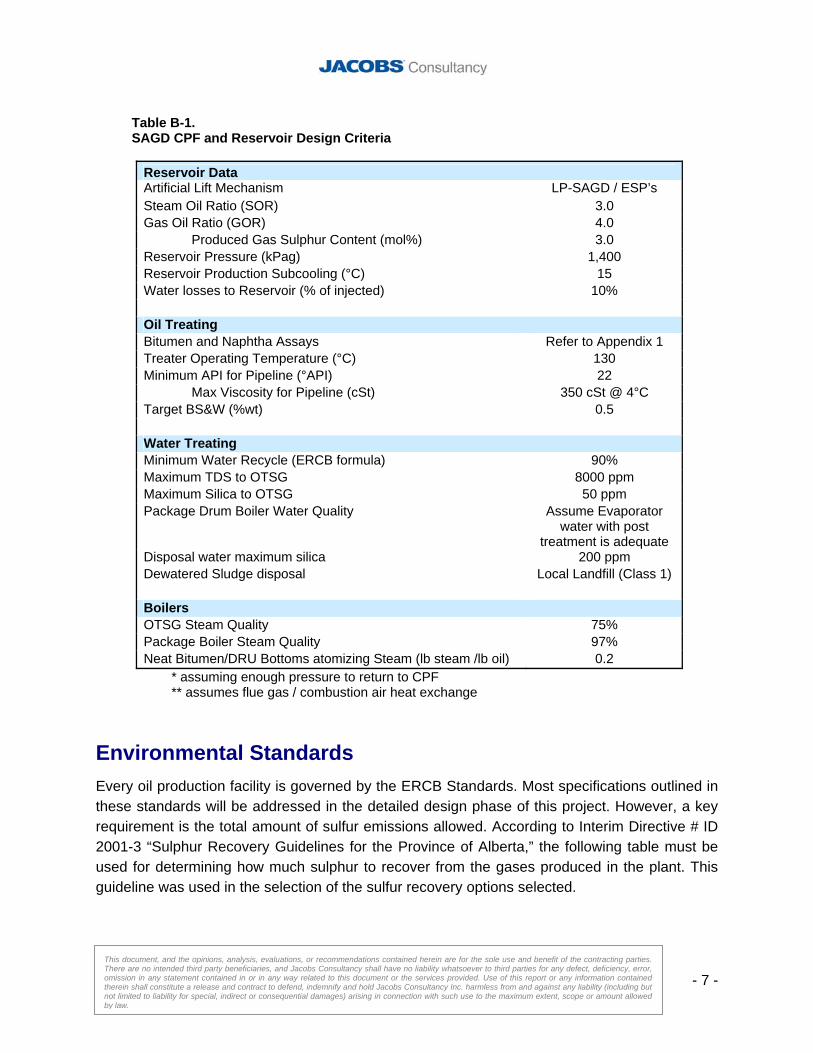
• Reservoir Characterization—Jacobs Consultancy estimated the reservoir design criteria, shown in Table B-1, based on past project experience; these are not from any particular reservoir. It is understood that each reservoir is unique and will change over time, but for the purposes of this study the typical or average reservoir characteristics have been compiled for the design of the well pads and Central Processing Facility (CPF).
- 7 -
This document, and the opinions, analysis, evaluations, or recommendations contained herein are for the sole use and benefit of the contracting parties. There are no intended third party beneficiaries, and Jacobs Consultancy shall have no liability whatsoever to third parties for any defect, deficiency, error, omission in any statement contained in or in any way related to this document or the services provided. Use of this report or any information contained therein shall constitute a release and contract to defend, indemnify and hold Jacobs Consultancy Inc. harmless from and against any liability (including but not limited to liability for special, indirect or consequential damages) arising in connection with such use to the maximum extent, scope or amount allowed by law.
Table B-1. SAGD CPF and Reservoir Design Criteria
Reservoir Data Artificial Lift Mechanism LP-SAGD / ESP’s Steam Oil Ratio (SOR) 3.0 Gas Oil Ratio (GOR) 4.0
Produced Gas Sulphur Content (mol%) 3.0 Reservoir Pressure (kPag) 1,400 Reservoir Production Subcooling (°C) 15 Water losses to Reservoir (% of injected) 10% Oil Treating Bitumen and Naphtha Assays Refer to Appendix 1 Treater Operating Temperature (°C) 130 Minimum API for Pipeline (°API) 22
Max Viscosity for Pipeline (cSt) 350 cSt @ 4°C Target BS&W (%wt) 0.5 Water Treating Minimum Water Recycle (ERCB formula) 90% Maximum TDS to OTSG 8000 ppm Maximum Silica to OTSG 50 ppm Package Drum Boiler Water Quality Assume Evaporator
water with post treatment is adequate
Disposal water maximum silica 200 ppm Dewatered Sludge disposal Local Landfill (Class 1) Boilers OTSG Steam Quality 75% Package Boiler Steam Quality 97% Neat Bitumen/DRU Bottoms atomizing Steam (lb steam /lb oil) 0.2
* assuming enough pressure to return to CPF ** assumes flue gas / combustion air heat exchange
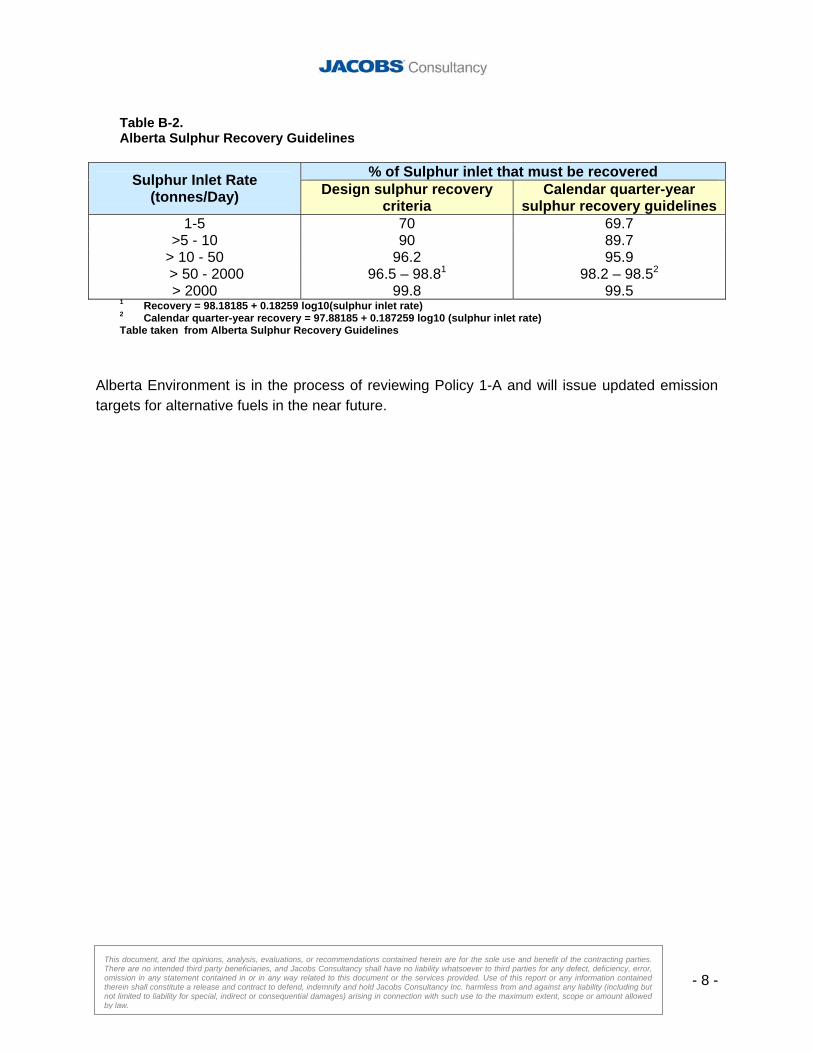
Environmental Standards Every oil production facility is governed by the ERCB Standards. Most specifications outlined in these standards will be addressed in the detailed design phase of this project. However, a key requirement is the total amount of sulfur emissions allowed. According to Interim Directive # ID 2001-3 “Sulphur Recovery Guidelines for the Province of Alberta,” the following table must be used for determining how much sulphur to recover from the gases produced in the plant. This guideline was used in the selection of the sulfur recovery options selected.
- 8 -
This document, and the opinions, analysis, evaluations, or recommendations contained herein are for the sole use and benefit of the contracting parties. There are no intended third party beneficiaries, and Jacobs Consultancy shall have no liability whatsoever to third parties for any defect, deficiency, error, omission in any statement contained in or in any way related to this document or the services provided. Use of this report or any information contained therein shall constitute a release and contract to defend, indemnify and hold Jacobs Consultancy Inc. harmless from and against any liability (including but not limited to liability for special, indirect or consequential damages) arising in connection with such use to the maximum extent, scope or amount allowed by law.
Table B-2. Alberta Sulphur Recovery Guidelines
% of Sulphur inlet that must be recovered Sulphur Inlet Rate
(tonnes/Day) Design sulphur recovery criteria
Calendar quarter-year sulphur recovery guidelines
1-5 70 69.7 >5 - 10 90 89.7
> 10 - 50 96.2 95.9 > 50 - 2000 96.5 – 98.81 98.2 – 98.52
> 2000 99.8 99.5 1 Recovery = 98.18185 + 0.18259 log10(sulphur inlet rate) 2 Calendar quarter-year recovery = 97.88185 + 0.187259 log10 (sulphur inlet rate) Table taken from Alberta Sulphur Recovery Guidelines
Alberta Environment is in the process of reviewing Policy 1-A and will issue updated emission targets for alternative fuels in the near future.

- 9 -
This document, and the opinions, analysis, evaluations, or recommendations contained herein are for the sole use and benefit of the contracting parties. There are no intended third party beneficiaries, and Jacobs Consultancy shall have no liability whatsoever to third parties for any defect, deficiency, error, omission in any statement contained in or in any way related to this document or the services provided. Use of this report or any information contained therein shall constitute a release and contract to defend, indemnify and hold Jacobs Consultancy Inc. harmless from and against any liability (including but not limited to liability for special, indirect or consequential damages) arising in connection with such use to the maximum extent, scope or amount allowed by law.
Section C.
Configuration Descriptions
- 10 -
This document, and the opinions, analysis, evaluations, or recommendations contained herein are for the sole use and benefit of the contracting parties. There are no intended third party beneficiaries, and Jacobs Consultancy shall have no liability whatsoever to third parties for any defect, deficiency, error, omission in any statement contained in or in any way related to this document or the services provided. Use of this report or any information contained therein shall constitute a release and contract to defend, indemnify and hold Jacobs Consultancy Inc. harmless from and against any liability (including but not limited to liability for special, indirect or consequential damages) arising in connection with such use to the maximum extent, scope or amount allowed by law.
Block flow diagrams and utility balances for all cases are shown in Appendix 2.
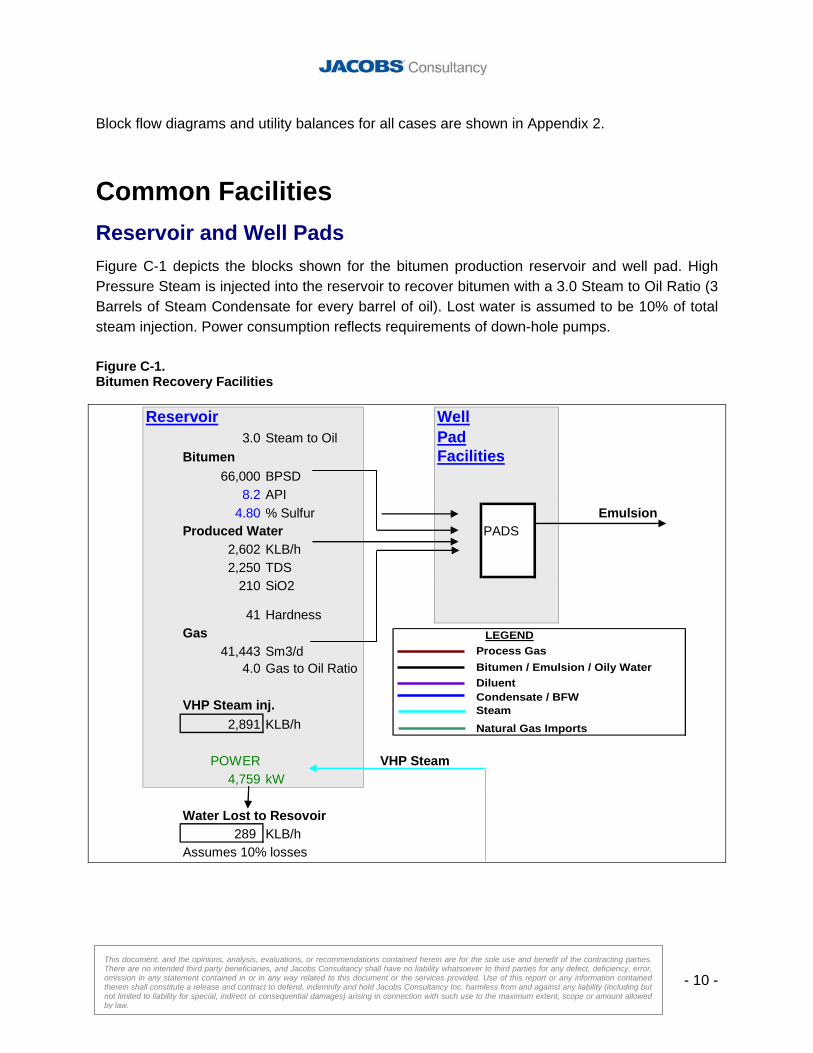
Common Facilities Reservoir and Well Pads Figure C-1 depicts the blocks shown for the bitumen production reservoir and well pad. High Pressure Steam is injected into the reservoir to recover bitumen with a 3.0 Steam to Oil Ratio (3 Barrels of Steam Condensate for every barrel of oil). Lost water is assumed to be 10% of total steam injection. Power consumption reflects requirements of down-hole pumps. Figure C-1. Bitumen Recovery Facilities
Reservoir Well3.0 Steam to Oil Pad
Bitumen Facilities66,000 BPSD
8.2 API4.80 % Sulfur Emulsion
Produced Water PADS2,602 KLB/h2,250 TDS
210 SiO2
41 HardnessGas
41,443 Sm3/d4.0 Gas to Oil Ratio
VHP Steam inj.2,891 KLB/h
POWER VHP Steam4,759 kW
Water Lost to Resovoir289 KLB/h
Assumes 10% losses
LEGENDProcess GasBitumen / Emulsion / Oily WaterDiluentCondensate / BFWSteamNatural Gas Imports
- 11 -
This document, and the opinions, analysis, evaluations, or recommendations contained herein are for the sole use and benefit of the contracting parties. There are no intended third party beneficiaries, and Jacobs Consultancy shall have no liability whatsoever to third parties for any defect, deficiency, error, omission in any statement contained in or in any way related to this document or the services provided. Use of this report or any information contained therein shall constitute a release and contract to defend, indemnify and hold Jacobs Consultancy Inc. harmless from and against any liability (including but not limited to liability for special, indirect or consequential damages) arising in connection with such use to the maximum extent, scope or amount allowed by law.
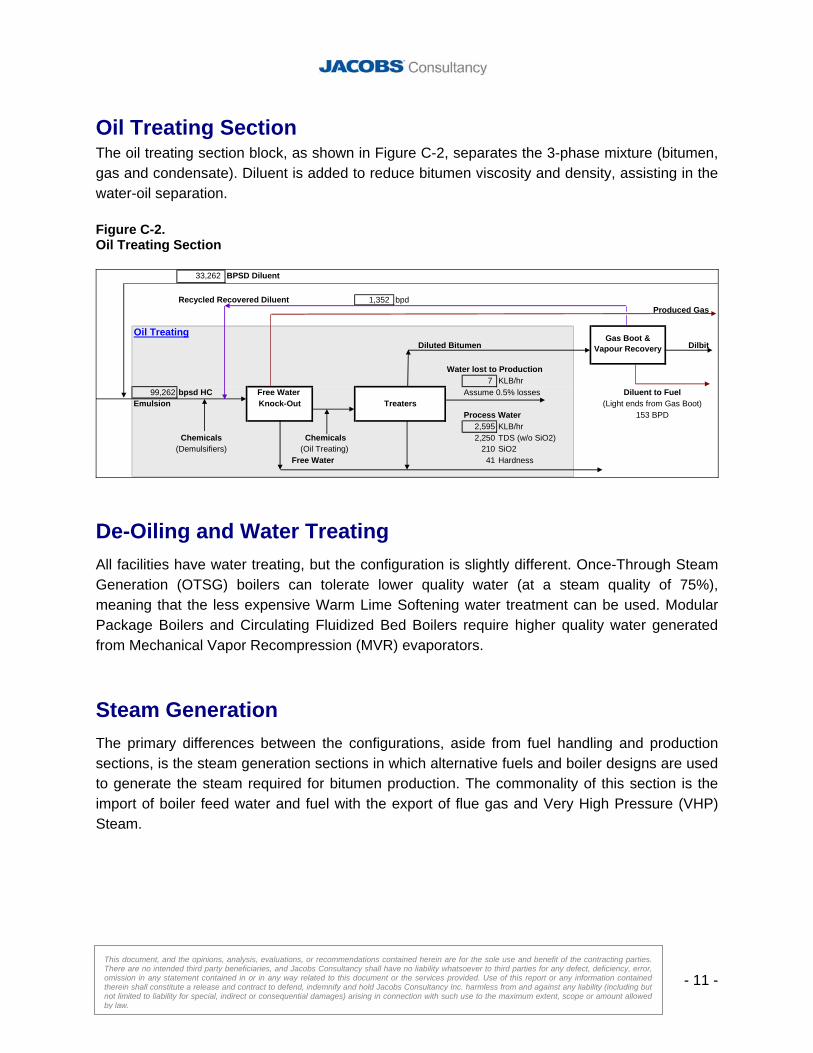
Oil Treating Section The oil treating section block, as shown in Figure C-2, separates the 3-phase mixture (bitumen, gas and condensate). Diluent is added to reduce bitumen viscosity and density, assisting in the water-oil separation. Figure C-2. Oil Treating Section
33,262 BPSD Diluent
Recycled Recovered Diluent 1,352 bpdProduced Gas
Oil TreatingDiluted Bitumen Dilbit
Water lost to Production7 KLB/hr
99,262 bpsd HC Free Water Assume 0.5% losses Diluent to FuelEmulsion Knock-Out Treaters (Light ends from Gas Boot)
Process Water 153 BPD2,595 KLB/hr
Chemicals Chemicals 2,250 TDS (w/o SiO2)(Demulsifiers) (Oil Treating) 210 SiO2
Free Water 41 Hardness
Gas Boot & Vapour Recovery
De-Oiling and Water Treating All facilities have water treating, but the configuration is slightly different. Once-Through Steam Generation (OTSG) boilers can tolerate lower quality water (at a steam quality of 75%), meaning that the less expensive Warm Lime Softening water treatment can be used. Modular Package Boilers and Circulating Fluidized Bed Boilers require higher quality water generated from Mechanical Vapor Recompression (MVR) evaporators.
Steam Generation The primary differences between the configurations, aside from fuel handling and production sections, is the steam generation sections in which alternative fuels and boiler designs are used to generate the steam required for bitumen production. The commonality of this section is the import of boiler feed water and fuel with the export of flue gas and Very High Pressure (VHP) Steam.
- 12 -
This document, and the opinions, analysis, evaluations, or recommendations contained herein are for the sole use and benefit of the contracting parties. There are no intended third party beneficiaries, and Jacobs Consultancy shall have no liability whatsoever to third parties for any defect, deficiency, error, omission in any statement contained in or in any way related to this document or the services provided. Use of this report or any information contained therein shall constitute a release and contract to defend, indemnify and hold Jacobs Consultancy Inc. harmless from and against any liability (including but not limited to liability for special, indirect or consequential damages) arising in connection with such use to the maximum extent, scope or amount allowed by law.
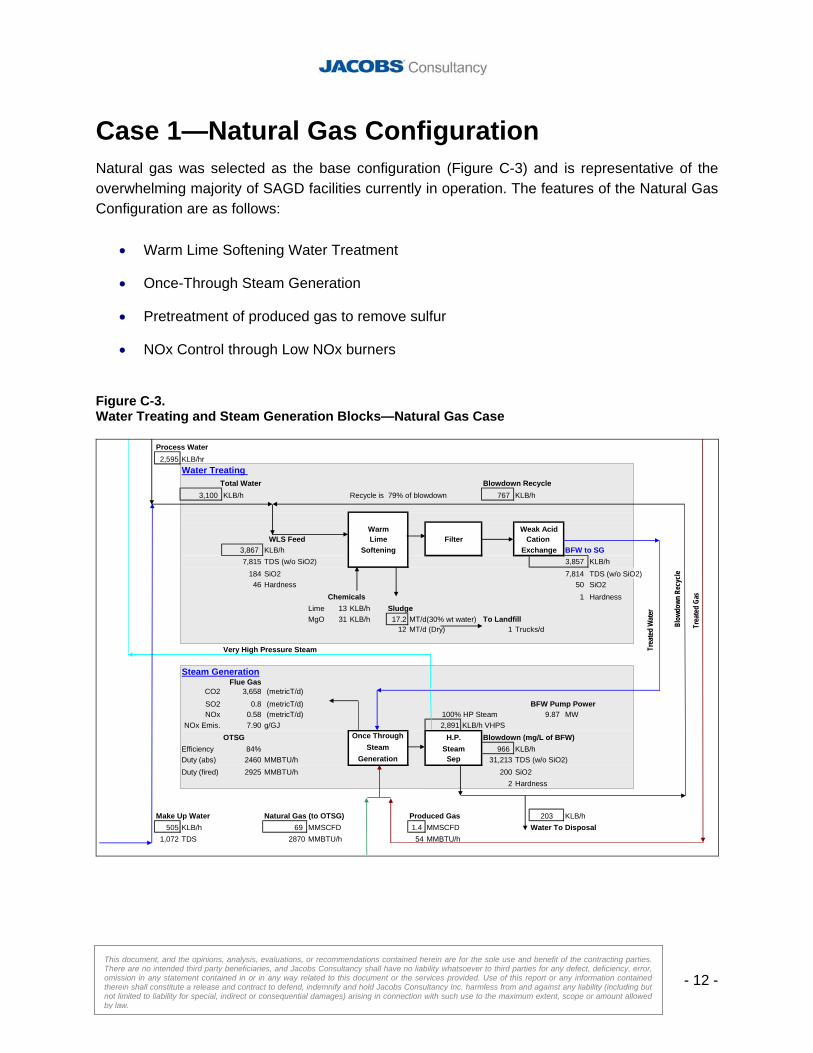
Case 1—Natural Gas Configuration Natural gas was selected as the base configuration (Figure C-3) and is representative of the overwhelming majority of SAGD facilities currently in operation. The features of the Natural Gas Configuration are as follows:
• Warm Lime Softening Water Treatment
• Once-Through Steam Generation
• Pretreatment of produced gas to remove sulfur
• NOx Control through Low NOx burners
Figure C-3. Water Treating and Steam Generation Blocks—Natural Gas Case
Process Water2,595 KLB/hr
Water Treating Total Water Blowdown Recycle
3,100 KLB/h Recycle is 79% of blowdown 767 KLB/h
Warm Weak AcidWLS Feed Lime Filter Cation
3,867 KLB/h Softening Exchange BFW to SG7,815 TDS (w/o SiO2) KLB/h
184 SiO2 TDS (w/o SiO2)46 Hardness SiO2
Chemicals HardnessLime 13 KLB/h SludgeMgO 31 KLB/h 17.2 MT/d(30% wt water) To Landfill
12 MT/d (Dry) 1 Trucks/d
Very High Pressure Steam
Steam GenerationFlue Gas
CO2 3,658 (metricT/d)
SO2 0.8 (metricT/d) BFW Pump PowerNOx 0.58 (metricT/d) 100% HP Steam 9.87 MW
NOx Emis. 7.90 g/GJ 2,891 KLB/h VHPSOTSG Once Through H.P.
Efficiency 84% Steam Steam 966 KLB/hDuty (abs) 2460 MMBTU/h Generation Sep 31,213 TDS (w/o SiO2)Duty (fired) 2925 MMBTU/h 200 SiO2
2 Hardness
Make Up Water Natural Gas (to OTSG) Produced Gas 203 KLB/h505 KLB/h 69 MMSCFD 1.4 MMSCFD Water To Disposal
1,072 TDS 2870 MMBTU/h 54 MMBTU/h
Blowdown (mg/L of BFW)
7,814 50 1
3,857
Blow
down
Rec
ycle
Trea
ted
Wat
er
Trea
ted
Gas
- 13 -
This document, and the opinions, analysis, evaluations, or recommendations contained herein are for the sole use and benefit of the contracting parties. There are no intended third party beneficiaries, and Jacobs Consultancy shall have no liability whatsoever to third parties for any defect, deficiency, error, omission in any statement contained in or in any way related to this document or the services provided. Use of this report or any information contained therein shall constitute a release and contract to defend, indemnify and hold Jacobs Consultancy Inc. harmless from and against any liability (including but not limited to liability for special, indirect or consequential damages) arising in connection with such use to the maximum extent, scope or amount allowed by law.
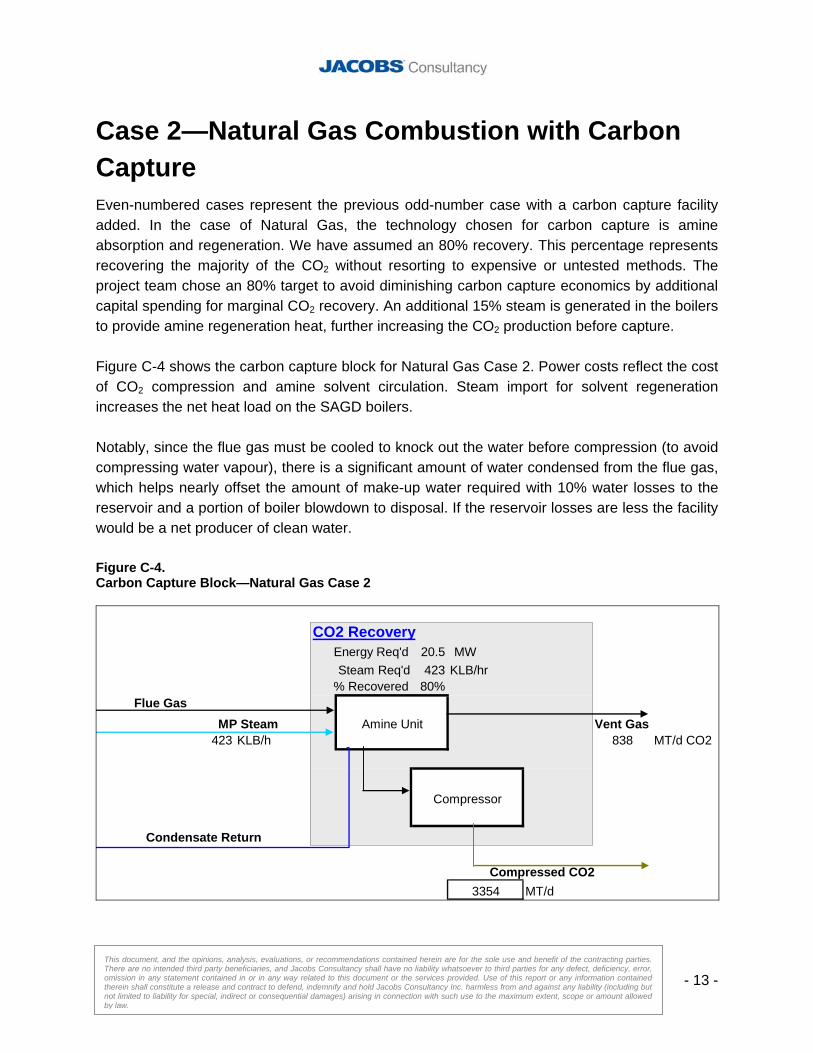
Case 2—Natural Gas Combustion with Carbon Capture Even-numbered cases represent the previous odd-number case with a carbon capture facility added. In the case of Natural Gas, the technology chosen for carbon capture is amine absorption and regeneration. We have assumed an 80% recovery. This percentage represents recovering the majority of the CO2 without resorting to expensive or untested methods. The project team chose an 80% target to avoid diminishing carbon capture economics by additional capital spending for marginal CO2 recovery. An additional 15% steam is generated in the boilers to provide amine regeneration heat, further increasing the CO2 production before capture. Figure C-4 shows the carbon capture block for Natural Gas Case 2. Power costs reflect the cost of CO2 compression and amine solvent circulation. Steam import for solvent regeneration increases the net heat load on the SAGD boilers. Notably, since the flue gas must be cooled to knock out the water before compression (to avoid compressing water vapour), there is a significant amount of water condensed from the flue gas, which helps nearly offset the amount of make-up water required with 10% water losses to the reservoir and a portion of boiler blowdown to disposal. If the reservoir losses are less the facility would be a net producer of clean water. Figure C-4. Carbon Capture Block—Natural Gas Case 2
CO2 RecoveryEnergy Req'd 20.5 MWSteam Req'd 423 KLB/hr
% Recovered 80%Flue Gas
MP Steam Amine Unit Vent Gas423 KLB/h 838 MT/d CO2
Compressor
Condensate Return
Compressed CO23354 MT/d
- 14 -
This document, and the opinions, analysis, evaluations, or recommendations contained herein are for the sole use and benefit of the contracting parties. There are no intended third party beneficiaries, and Jacobs Consultancy shall have no liability whatsoever to third parties for any defect, deficiency, error, omission in any statement contained in or in any way related to this document or the services provided. Use of this report or any information contained therein shall constitute a release and contract to defend, indemnify and hold Jacobs Consultancy Inc. harmless from and against any liability (including but not limited to liability for special, indirect or consequential damages) arising in connection with such use to the maximum extent, scope or amount allowed by law.
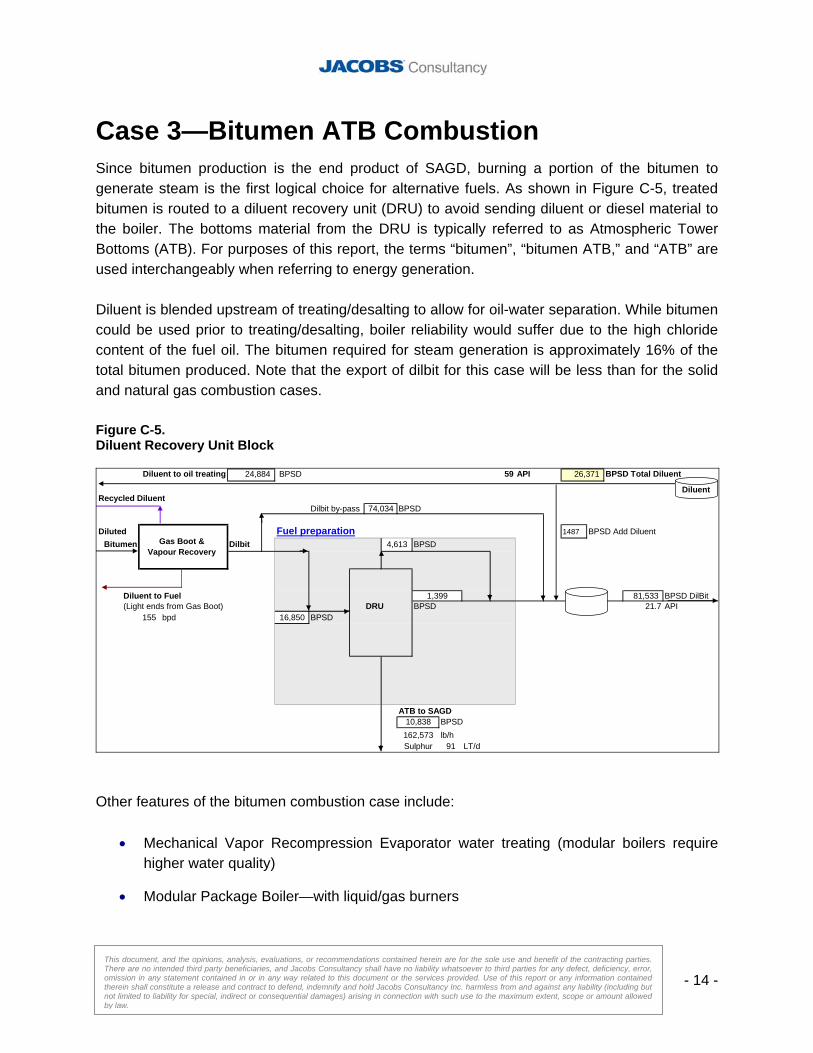
Case 3—Bitumen ATB Combustion Since bitumen production is the end product of SAGD, burning a portion of the bitumen to generate steam is the first logical choice for alternative fuels. As shown in Figure C-5, treated bitumen is routed to a diluent recovery unit (DRU) to avoid sending diluent or diesel material to the boiler. The bottoms material from the DRU is typically referred to as Atmospheric Tower Bottoms (ATB). For purposes of this report, the terms “bitumen”, “bitumen ATB,” and “ATB” are used interchangeably when referring to energy generation. Diluent is blended upstream of treating/desalting to allow for oil-water separation. While bitumen could be used prior to treating/desalting, boiler reliability would suffer due to the high chloride content of the fuel oil. The bitumen required for steam generation is approximately 16% of the total bitumen produced. Note that the export of dilbit for this case will be less than for the solid and natural gas combustion cases. Figure C-5. Diluent Recovery Unit Block
Diluent to oil treating 59 API 26,371 BPSD Total Diluent
Recycled DiluentDilbit by-pass BPSD
Diluted Fuel preparation 1487 BPSD Add DiluentBitumen Dilbit BPSD
Diluent to Fuel 81,533 BPSD DilBit(Light ends from Gas Boot) DRU BPSD 21.7 API
155 bpd BPSD
ATB to SAGD BPSDlb/h
91 LT/d
BPSD24,884
16,850
74,034
Sulphur162,573
1,399
4,613
10,838
Gas Boot & Vapour Recovery
Diluent
Other features of the bitumen combustion case include:
• Mechanical Vapor Recompression Evaporator water treating (modular boilers require higher water quality)
• Modular Package Boiler—with liquid/gas burners
- 15 -
This document, and the opinions, analysis, evaluations, or recommendations contained herein are for the sole use and benefit of the contracting parties. There are no intended third party beneficiaries, and Jacobs Consultancy shall have no liability whatsoever to third parties for any defect, deficiency, error, omission in any statement contained in or in any way related to this document or the services provided. Use of this report or any information contained therein shall constitute a release and contract to defend, indemnify and hold Jacobs Consultancy Inc. harmless from and against any liability (including but not limited to liability for special, indirect or consequential damages) arising in connection with such use to the maximum extent, scope or amount allowed by law.
• Wet Limestone Scrubber for Flue Gas Desulphurization (FGD)
• NOx control through Selective Catalytic Reduction (SCR)
Case 4—Bitumen ATB Combustion with Carbon Capture As for natural gas, we have assumed the post combustion carbon capture for bitumen to be amine absorption (refer to Figure C-4). Some amine solvents may be less tolerant to SOx and therefore require increased flue gas desulphurization, but the project team has assumed that a suitable amine composition can be found for this application. An additional 23% steam must be generated in the boilers to provide amine regeneration heat, increasing the CO2 production before capture. There are potential savings in heat integration with carbon capture facilities that need to be considered as part of the initial design. This factor will make carbon capture retro-fits more costly and less efficient.
Case 5—Petcoke Combustion Petcoke, or coke produced from petroleum refining, was selected as a solid fuel because of the number of cokers being used locally for bitumen upgrading. Upgrading is primarily about carbon rejection to increase the quality of the synthetic crude, and coking is the oldest and best understood carbon rejection method. Combustion of coke is similar to coal combustion, except that the contaminants, particularly sulfur and nitrogen, are typically in a higher concentration. A major complication to coke combustion in production areas is transport. With no train lines it will be necessary to truck in coke, potentially from the Suncor Upgrader sites or other locations in Edmonton. The amount of coke required to generate steam for a 66 KBPD bitumen facility will be 2,400 tons per day requiring 60 Super B (40 MT/load) trucks a day to supply. In addition, limestone supply for flue gas desulphurization will require twenty-one trucks a day. This large traffic increase will impact the environment (spills and noise) and road safety. The circulating fluidized bed has a number of advantages over modular boiler technology, particularly regarding emissions. NOx emissions are substantially limited through distributing the burning zone throughout the bed, though nitrogen in the fuel may still oxidize. Limestone is added to the combustion bed, reducing SOx emissions, and making post combustion dry scrubbing (with at least 98% recovery) possible even with high sulphur petcokes.
- 16 -
This document, and the opinions, analysis, evaluations, or recommendations contained herein are for the sole use and benefit of the contracting parties. There are no intended third party beneficiaries, and Jacobs Consultancy shall have no liability whatsoever to third parties for any defect, deficiency, error, omission in any statement contained in or in any way related to this document or the services provided. Use of this report or any information contained therein shall constitute a release and contract to defend, indemnify and hold Jacobs Consultancy Inc. harmless from and against any liability (including but not limited to liability for special, indirect or consequential damages) arising in connection with such use to the maximum extent, scope or amount allowed by law.
Other features of the CFB Boiler configuration include:
• Mechanical Vapor Recompression (MVR) Evaporator Water Treating
• SNCR facilities for NOx control • Fabric filters (baghouse) to control particulate matter
• No additional emissions control required for SOx and NOx
Case 6—Petcoke Combustion with Carbon Capture Petcoke carbon capture can be the same as that for bitumen and natural gas, i.e. an amine flue gas scrubber with steam solvent regeneration. An additional 37% more steam (Case 5) is required for amine regeneration to achieve the 80% reduction in CO2 emissions. As a consequence this case also produces 37% more CO2 (before capture) than the non capture Case 5. Note that since the CFB is a single boiler, to retrofit CO2 capture the producer must either design the boiler with excess capacity or cut facility production. Adding a second boiler for carbon capture will further reduce economic return. This case also has the highest electrical power consumption for combustion cases because of the evaporator compressors and the CO2 compressors. It is a total of 96 MW of power consumption between the two blocks, which is equivalent to an additional 2.2 MT/D of indirect CO2 emissions.
Case 7—Bitumen Gasification Gasification technologies are detailed in Volume 1. The advantage to gasification in energy generation is that the resulting syngas (Carbon Monoxide and Hydrogen) can be easily desulphurized and burned as with natural gas. Thus, SOx, NOx and particulate emissions are much lower than for liquid or solid combustion. A significant disadvantage to gasification is that equipment requirements are much more significant than those for liquid or solid combustion. There is also a large power consumption to produce oxygen for the gasification step. For bitumen gasification the feed supply has been assumed to be the same as for bitumen (atmospheric resid) combustion. Heavier liquids such as Solvent De-Asphalting pitch are more typical gasification feeds, but generating this material
- 17 -
This document, and the opinions, analysis, evaluations, or recommendations contained herein are for the sole use and benefit of the contracting parties. There are no intended third party beneficiaries, and Jacobs Consultancy shall have no liability whatsoever to third parties for any defect, deficiency, error, omission in any statement contained in or in any way related to this document or the services provided. Use of this report or any information contained therein shall constitute a release and contract to defend, indemnify and hold Jacobs Consultancy Inc. harmless from and against any liability (including but not limited to liability for special, indirect or consequential damages) arising in connection with such use to the maximum extent, scope or amount allowed by law.
was not considered for this high level study. The gasification process being used is the Entrained Flow gasifier, which can be used for both liquid and solid gasification. Features of the gasification step include:
• Air Supply Unit
• Gasification Reactor
• Syngas Cooling and Treating
• Acid Gas Removal and Sulfur Production (Amine Contacting with SuperClaus®)
• Power Recovery Turbine
The power recovery turbine is required because syngas cooling from the gasification step requires higher quality water than the WLS can deliver. This condensate is segregated from high solids water used for OTSG. Generating internal power reduces import power demand and keeps quench water treating costs low.
- 18 -
This document, and the opinions, analysis, evaluations, or recommendations contained herein are for the sole use and benefit of the contracting parties. There are no intended third party beneficiaries, and Jacobs Consultancy shall have no liability whatsoever to third parties for any defect, deficiency, error, omission in any statement contained in or in any way related to this document or the services provided. Use of this report or any information contained therein shall constitute a release and contract to defend, indemnify and hold Jacobs Consultancy Inc. harmless from and against any liability (including but not limited to liability for special, indirect or consequential damages) arising in connection with such use to the maximum extent, scope or amount allowed by law.
Figure C-6. Bitumen ATB Gasification Block
Bitumen ATB from DRU12,372 BPSD
lb/h2,227 ST/day
ATB Gasification
HP steam142 KLB/hr 363 KLB/hr
Quench water(part.)
Steam Gasifier Syngas Cooling Syngas treatment Syngas79KLB/hr
O2O2 198 KLB/h Slag Waste Water
2373 ST/d 0.19 KLB/hr 189 KLB/hr
N2 ASU
(Air sep Unit)Steam turbine
36.1 MW Make-up Water
185,591
99.5%
The steam generation and water treating facility for gasification are the same as for natural gas combustion (Case 1) including:
• Warm Lime Softening
• Once-Through Steam Generators
• Low NOx burners with recirculation for NOx control
- 19 -
This document, and the opinions, analysis, evaluations, or recommendations contained herein are for the sole use and benefit of the contracting parties. There are no intended third party beneficiaries, and Jacobs Consultancy shall have no liability whatsoever to third parties for any defect, deficiency, error, omission in any statement contained in or in any way related to this document or the services provided. Use of this report or any information contained therein shall constitute a release and contract to defend, indemnify and hold Jacobs Consultancy Inc. harmless from and against any liability (including but not limited to liability for special, indirect or consequential damages) arising in connection with such use to the maximum extent, scope or amount allowed by law.
Case 8—ATB Gasification with Carbon Capture We did not produce a block flow diagram for the gasification carbon capture cases. The carbon separation facility is integrated with the acid gas removal amine system. A solvent, such as Selexol or Rectisol, can typically be used to absorb Carbon Dioxide and Acid Gas after shifting Carbon Monoxide and water to make hydrogen. Recovery capital and energy costs are reduced from those of post combustion or oxyfuel capture technologies. Costs for carbon capture are significantly less for gasification than combustion for the following reasons:
• Syngas can be shifted to a mixture of carbon dioxide and hydrogen, which is much more easily separated than a mixture of nitrogen, oxygen, water vapor and carbon dioxide.
• Solvents used for syngas separation (Selexol, Rectisol, etc.) can absorb and regenerate at higher pressures, reducing compression costs.
• Energy input for solvent regeneration is much lower for these solvents.
Case 9—Petcoke Gasification Solids gasification is similar in configuration, energy requirements and process conditions to the bitumen gasification cases. As with petcoke combustion, a major challenge to implementing petcoke gasification is related to supply and the massive increase in plant site truck traffic. Since gasification is less efficient than combustion, the amount of coke supply increases, as does carbon dioxide generation. While capital costs are higher and thermal efficiency is lower for solids gasification than liquid gasification, the gross margin is higher because all bitumen recovered is sold as dilbit. As with petcoke combustion, gasification of petcoke at a remote site will require extensive infrastructure and transport to supply the required fuel.
Case 10—Solid Gasification with Carbon Capture As with Case 8, the carbon capture block is integrated with the process. More CO2 will be produced for petcoke gasification, and power requirements for disposal will be slightly higher. Still the energy requirements and net carbon emissions are much lower for petcoke gasification than the petcoke combustion case with capture.
- 20 -
This document, and the opinions, analysis, evaluations, or recommendations contained herein are for the sole use and benefit of the contracting parties. There are no intended third party beneficiaries, and Jacobs Consultancy shall have no liability whatsoever to third parties for any defect, deficiency, error, omission in any statement contained in or in any way related to this document or the services provided. Use of this report or any information contained therein shall constitute a release and contract to defend, indemnify and hold Jacobs Consultancy Inc. harmless from and against any liability (including but not limited to liability for special, indirect or consequential damages) arising in connection with such use to the maximum extent, scope or amount allowed by law.
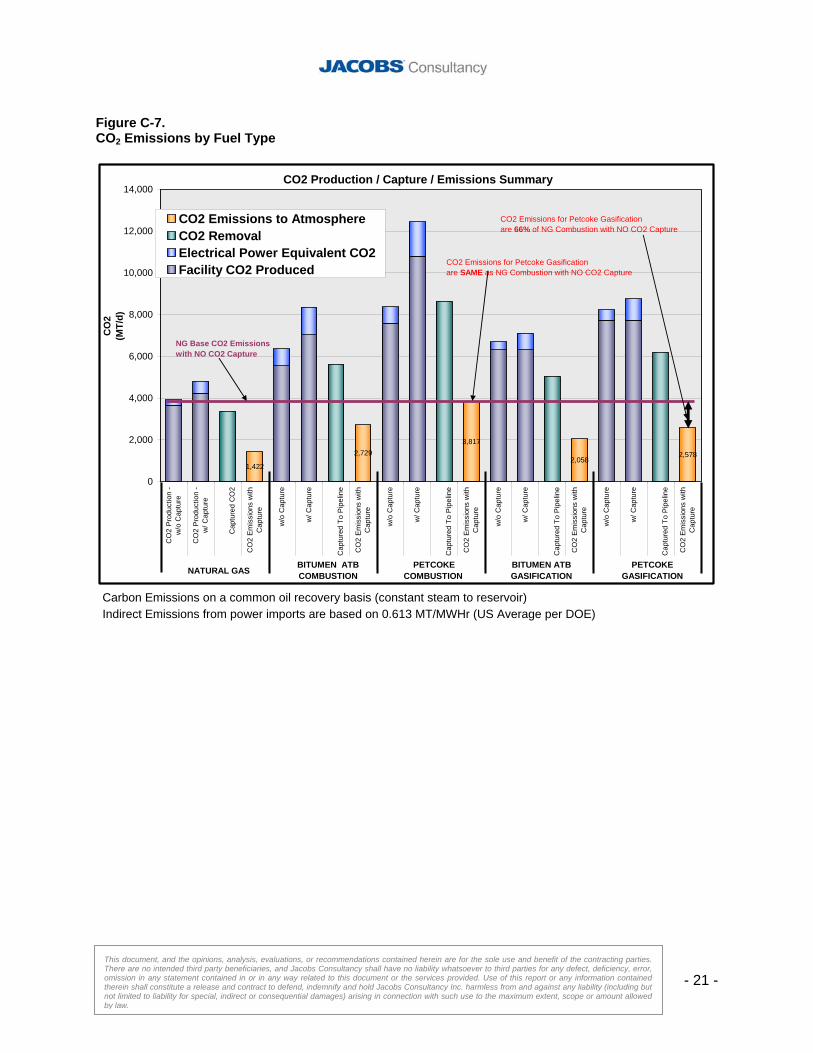
CO2 Emissions Summary Figure C-7 shows the direct and indirect CO2 generated for each type of fuel along with the recovered CO2 for the carbon capture cases. It is clear from the above graph that alternative fuels produce much more CO2 than natural gas to generate the same amount of steam, which is a function of the hydrogen content of the fuels. One striking result, demonstrated in Figure C-7, is that even with 80% carbon capture, the total emissions of petcoke in a CFB are the same as burning natural gas WITHOUT carbon capture. Similarly, the petcoke gasification case has 66% of burning natural gas WITHOUT carbon capture. It should also be noted that the amount of CO2 that must be pipelined and sequestered for petcoke gasification is roughly double the amount for natural gas. ATB is roughly 66% more CO2 captured than natural gas. CO2 transport and storage costs (not considered for this study) are normally small compared to capture costs, but these costs will further reduce the return for alternative fuels.
- 21 -
This document, and the opinions, analysis, evaluations, or recommendations contained herein are for the sole use and benefit of the contracting parties. There are no intended third party beneficiaries, and Jacobs Consultancy shall have no liability whatsoever to third parties for any defect, deficiency, error, omission in any statement contained in or in any way related to this document or the services provided. Use of this report or any information contained therein shall constitute a release and contract to defend, indemnify and hold Jacobs Consultancy Inc. harmless from and against any liability (including but not limited to liability for special, indirect or consequential damages) arising in connection with such use to the maximum extent, scope or amount allowed by law.
Figure C-7. CO2 Emissions by Fuel Type
CO2 Production / Capture / Emissions Summary
1,422
2,7293,817
2,0582,578
0
2,000
4,000
6,000
8,000
10,000
12,000
14,000
CO
2 P
rodu
ctio
n -
w/o
Cap
ture
CO
2 P
rodu
ctio
n -
w/ C
aptu
re
Cap
ture
d C
O2
CO
2 Em
issi
ons
with
Cap
ture
w/o
Cap
ture
w/ C
aptu
re
Cap
ture
d To
Pip
elin
e
CO
2 Em
issi
ons
with
Cap
ture
w/o
Cap
ture
w/ C
aptu
re
Cap
ture
d To
Pip
elin
e
CO
2 Em
issi
ons
with
Cap
ture
w/o
Cap
ture
w/ C
aptu
re
Cap
ture
d To
Pip
elin
e
CO
2 Em
issi
ons
with
Cap
ture
w/o
Cap
ture
w/ C
aptu
re
Cap
ture
d To
Pip
elin
e
CO
2 Em
issi
ons
with
Cap
ture
CO
2 (M
T/d)
CO2 Emissions to AtmosphereCO2 RemovalElectrical Power Equivalent CO2Facility CO2 Produced
NG Base CO2 Emissionswith NO CO2 Capture
CO2 Emissions for Petcoke Gasificationare 66% of NG Combustion with NO CO2 Capture
NATURAL GASBITUMEN ATB COMBUSTION
PETCOKE COMBUSTION
BITUMEN ATB GASIFICATION
PETCOKE GASIFICATION
CO2 Emissions for Petcoke Gasificationare SAME as NG Combustion with NO CO2 Capture
Carbon Emissions on a common oil recovery basis (constant steam to reservoir) Indirect Emissions from power imports are based on 0.613 MT/MWHr (US Average per DOE)
- 22 -
This document, and the opinions, analysis, evaluations, or recommendations contained herein are for the sole use and benefit of the contracting parties. There are no intended third party beneficiaries, and Jacobs Consultancy shall have no liability whatsoever to third parties for any defect, deficiency, error, omission in any statement contained in or in any way related to this document or the services provided. Use of this report or any information contained therein shall constitute a release and contract to defend, indemnify and hold Jacobs Consultancy Inc. harmless from and against any liability (including but not limited to liability for special, indirect or consequential damages) arising in connection with such use to the maximum extent, scope or amount allowed by law.
Section D.
Economic Analyses
- 23 -
This document, and the opinions, analysis, evaluations, or recommendations contained herein are for the sole use and benefit of the contracting parties. There are no intended third party beneficiaries, and Jacobs Consultancy shall have no liability whatsoever to third parties for any defect, deficiency, error, omission in any statement contained in or in any way related to this document or the services provided. Use of this report or any information contained therein shall constitute a release and contract to defend, indemnify and hold Jacobs Consultancy Inc. harmless from and against any liability (including but not limited to liability for special, indirect or consequential damages) arising in connection with such use to the maximum extent, scope or amount allowed by law.
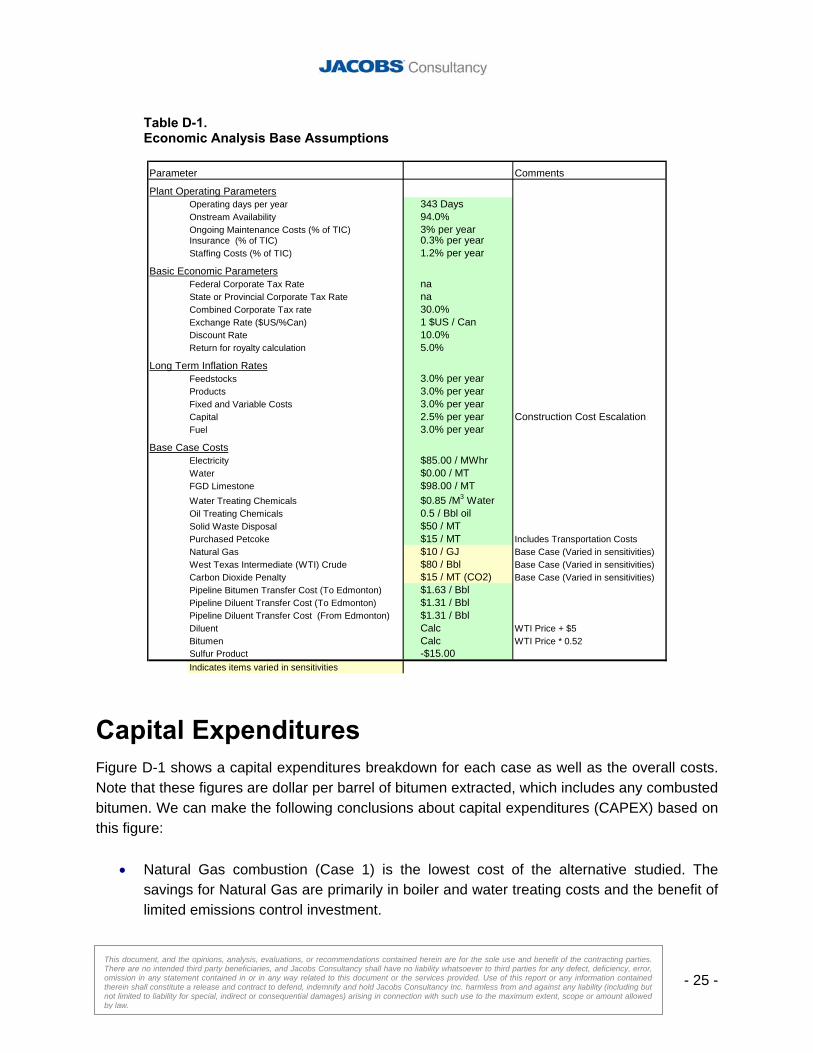
Economic Assumptions and Qualifications Economic assumptions are summarized in Table D-1. Information is provided with the following qualifications.
• All costs are presented on a 2008 basis, assuming construction in Fort McMurray with start-up in 2013. Cost figures are highly variable and should not be used for purposes other than technology and fuel type comparison.
• Capital Expenditures are over 4 years, ending in 2013.
• Cash Flow Discounted at 10 percent.
• Royalties, Depreciation, and Taxes included in Cash Flow (refer to Table D-1).
• All costs are curve costs developed from Jacobs’ projects and should be considered +50% / - 25% in accuracy.
• Economic calculations are based on a 35-year plant life with zero terminal value.
• All figures are presented in Canadian dollars. An exchange rate of 1.0 USD per Canadian Dollar has been used in all calculations.
Feed and Product Pricing Hydrocarbon prices are calculated from the following:
• Bitumen = 0.52 * WTI—This basis is low basis current market conditions, reflecting the best economic conditions for alternative fuels combustion.
• Diluent = WTI + $5
• Purchased Coke $15 / MT including transport costs. Coke price is assumed independent of natural gas and bitumen price (i.e. excess supply in region).
• Base Prices: Natural Gas = $10 / MMBtu; WTI = $80 / Bbl
• CO2 Penalty = $15 / MT (Basis Alberta Government guidelines).
CAPEX • TIC (SAGD Steam Generation and Production) based on Jacobs Curve Costs
- 24 -
This document, and the opinions, analysis, evaluations, or recommendations contained herein are for the sole use and benefit of the contracting parties. There are no intended third party beneficiaries, and Jacobs Consultancy shall have no liability whatsoever to third parties for any defect, deficiency, error, omission in any statement contained in or in any way related to this document or the services provided. Use of this report or any information contained therein shall constitute a release and contract to defend, indemnify and hold Jacobs Consultancy Inc. harmless from and against any liability (including but not limited to liability for special, indirect or consequential damages) arising in connection with such use to the maximum extent, scope or amount allowed by law.
• OSBL, EPCM, Owner Costs Based on Factors
• 25% Contingency has been applied to all capital numbers
OPEX • Utility and Chemical Prices (Oil Treating, water treating, etc.) developed from 2008
pricing data and technology utility balances.
• Ongoing Maintenance based on CAPEX
• Fixed Costs (Salaries, Insurance, Taxes) factored from CAPEX
- 25 -
This document, and the opinions, analysis, evaluations, or recommendations contained herein are for the sole use and benefit of the contracting parties. There are no intended third party beneficiaries, and Jacobs Consultancy shall have no liability whatsoever to third parties for any defect, deficiency, error, omission in any statement contained in or in any way related to this document or the services provided. Use of this report or any information contained therein shall constitute a release and contract to defend, indemnify and hold Jacobs Consultancy Inc. harmless from and against any liability (including but not limited to liability for special, indirect or consequential damages) arising in connection with such use to the maximum extent, scope or amount allowed by law.
Table D-1. Economic Analysis Base Assumptions
Parameter Comments
Plant Operating ParametersOperating days per year 343 DaysOnstream Availability 94.0%Ongoing Maintenance Costs (% of TIC) 3% per yearInsurance (% of TIC) 0.3% per yearStaffing Costs (% of TIC) 1.2% per year
Basic Economic ParametersFederal Corporate Tax Rate naState or Provincial Corporate Tax Rate naCombined Corporate Tax rate 30.0%Exchange Rate ($US/%Can) 1 $US / CanDiscount Rate 10.0%Return for royalty calculation 5.0%
Long Term Inflation RatesFeedstocks 3.0% per yearProducts 3.0% per yearFixed and Variable Costs 3.0% per yearCapital 2.5% per year Construction Cost EscalationFuel 3.0% per year
Base Case CostsElectricity $85.00 / MWhrWater $0.00 / MTFGD Limestone $98.00 / MTWater Treating Chemicals $0.85 /M3 WaterOil Treating Chemicals 0.5 / Bbl oilSolid Waste Disposal $50 / MTPurchased Petcoke $15 / MT Includes Transportation CostsNatural Gas $10 / GJ Base Case (Varied in sensitivities)West Texas Intermediate (WTI) Crude $80 / Bbl Base Case (Varied in sensitivities)Carbon Dioxide Penalty $15 / MT (CO2) Base Case (Varied in sensitivities)Pipeline Bitumen Transfer Cost (To Edmonton) $1.63 / BblPipeline Diluent Transfer Cost (To Edmonton) $1.31 / BblPipeline Diluent Transfer Cost (From Edmonton) $1.31 / BblDiluent Calc WTI Price + $5Bitumen Calc WTI Price * 0.52Sulfur Product -$15.00Indicates items varied in sensitivities
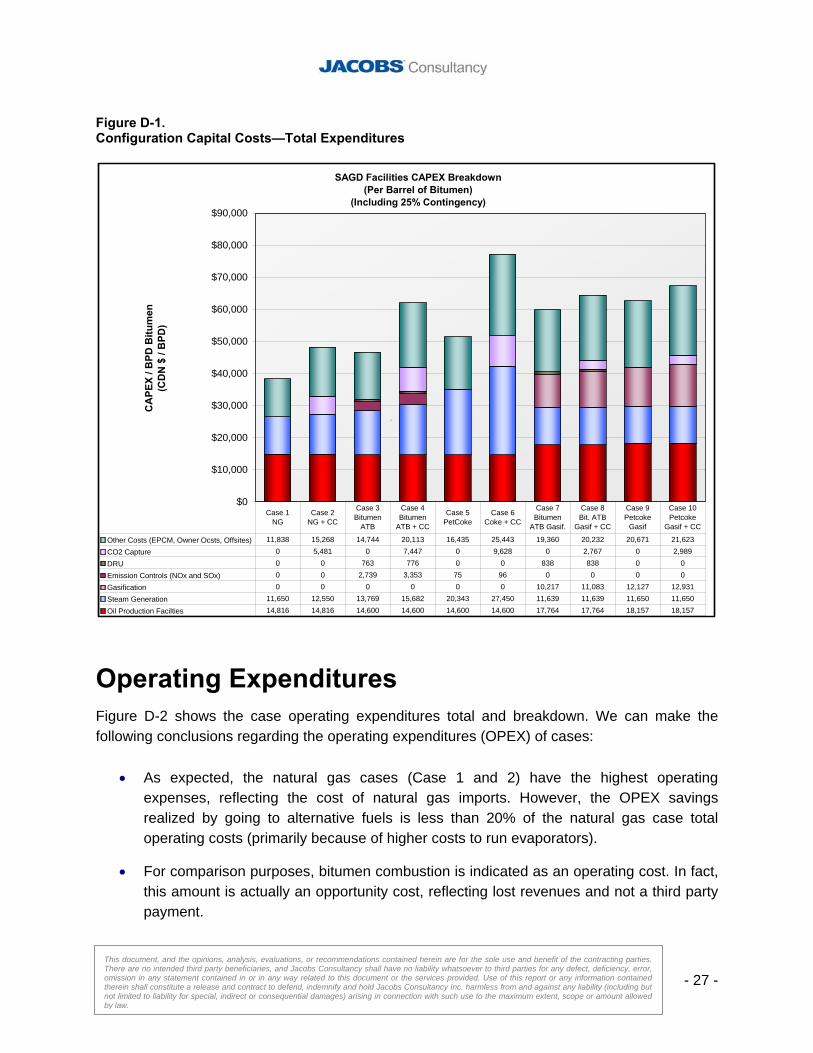
Capital Expenditures Figure D-1 shows a capital expenditures breakdown for each case as well as the overall costs. Note that these figures are dollar per barrel of bitumen extracted, which includes any combusted bitumen. We can make the following conclusions about capital expenditures (CAPEX) based on this figure:
• Natural Gas combustion (Case 1) is the lowest cost of the alternative studied. The savings for Natural Gas are primarily in boiler and water treating costs and the benefit of limited emissions control investment.
- 26 -
This document, and the opinions, analysis, evaluations, or recommendations contained herein are for the sole use and benefit of the contracting parties. There are no intended third party beneficiaries, and Jacobs Consultancy shall have no liability whatsoever to third parties for any defect, deficiency, error, omission in any statement contained in or in any way related to this document or the services provided. Use of this report or any information contained therein shall constitute a release and contract to defend, indemnify and hold Jacobs Consultancy Inc. harmless from and against any liability (including but not limited to liability for special, indirect or consequential damages) arising in connection with such use to the maximum extent, scope or amount allowed by law.
• Of the combustion technologies, petcoke combustion (Case 5) is the most expensive, with most of the cost differential in the more expensive CFB boiler.
• Gasification costs (Cases 7 and 9) are more expensive than the combustion technologies without carbon capture, attributable primarily to high gasifier costs.
• Costs to integrate carbon capture are much lower for gasification. When comparing carbon capture cases, solids gasification is less expensive than petcoke (CFB) combustion.
• Carbon capture facility costs increase notably for combustion technologies depending on the amount of carbon generated (i.e. higher costs for coke combustion). Carbon capture is based on capturing 80% of the produced CO2.
• Costs for Carbon capture are broken out as a separate line item. In addition to these direct costs, other parts of the facility (Steam Generation, water treating, etc.) have to increase in size to meet the heat requirements of carbon capture.
• Oil treating costs for gasification are higher because of the inclusion of the Acid Gas Removal facilities.
• Flue gas emissions control costs are included for petcoke and bitumen combustion. The costs for CFB petcoke combustion are small as desulphurization and NOX control are incorporated into the boiler.
• Emission control costs for bitumen combustion are significant, but removing these costs will not make costs comparable to the natural gas OTSG costs.
- 27 -
This document, and the opinions, analysis, evaluations, or recommendations contained herein are for the sole use and benefit of the contracting parties. There are no intended third party beneficiaries, and Jacobs Consultancy shall have no liability whatsoever to third parties for any defect, deficiency, error, omission in any statement contained in or in any way related to this document or the services provided. Use of this report or any information contained therein shall constitute a release and contract to defend, indemnify and hold Jacobs Consultancy Inc. harmless from and against any liability (including but not limited to liability for special, indirect or consequential damages) arising in connection with such use to the maximum extent, scope or amount allowed by law.
Figure D-1. Configuration Capital Costs—Total Expenditures
SAGD Facilities CAPEX Breakdown (Per Barrel of Bitumen)
(Including 25% Contingency)
$0
$10,000
$20,000
$30,000
$40,000
$50,000
$60,000
$70,000
$80,000
$90,000
CA
PEX
/ BPD
Bitu
men
(CD
N $
/ B
PD)
Other Costs (EPCM, Owner Ocsts, Offsites) 11,838 15,268 14,744 20,113 16,435 25,443 19,360 20,232 20,671 21,623
CO2 Capture 0 5,481 0 7,447 0 9,628 0 2,767 0 2,989
DRU 0 0 763 776 0 0 838 838 0 0
Emission Controls (NOx and SOx) 0 0 2,739 3,353 75 96 0 0 0 0
Gasification 0 0 0 0 0 0 10,217 11,083 12,127 12,931
Steam Generation 11,650 12,550 13,769 15,682 20,343 27,450 11,639 11,639 11,650 11,650
Oil Production Facilties 14,816 14,816 14,600 14,600 14,600 14,600 17,764 17,764 18,157 18,157
Case 1NG
Case 2NG + CC
Case 3Bitumen
ATB
Case 4Bitumen
ATB + CC
Case 5PetCoke
Case 6Coke + CC
Case 7Bitumen
ATB Gasif.
Case 8Bit. ATB
Gasif + CC
Case 9Petcoke
Gasif
Case 10Petcoke
Gasif + CC
.
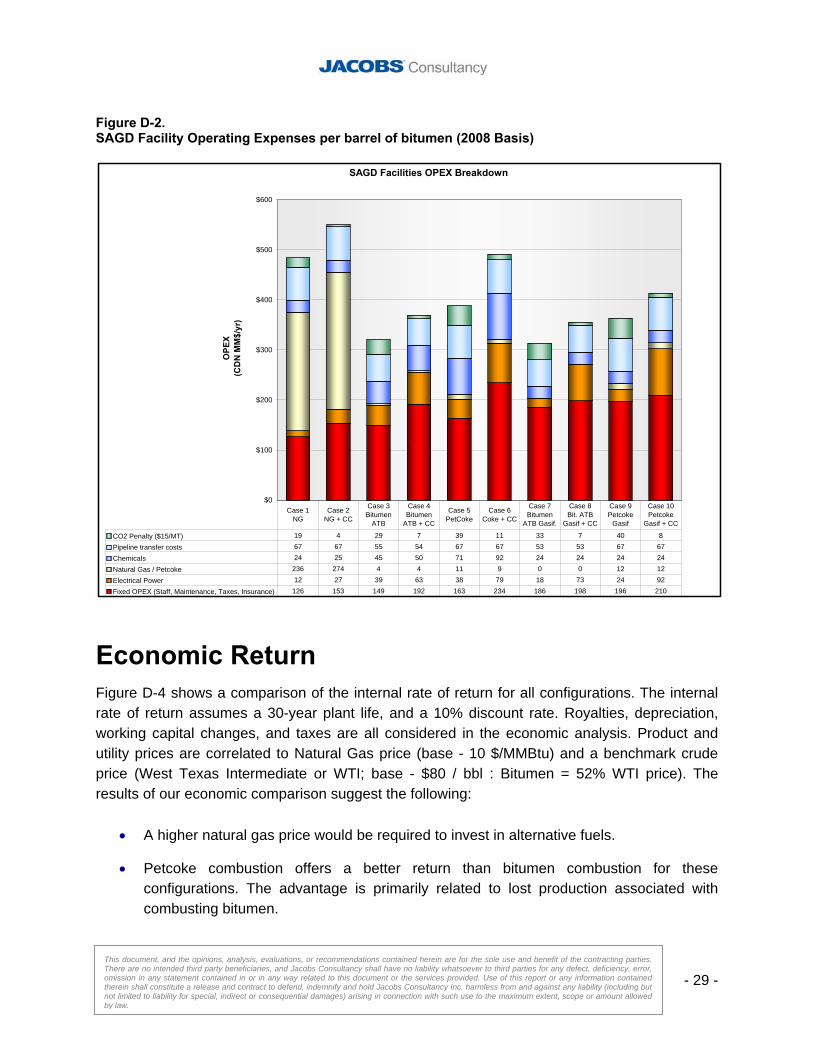
Operating Expenditures Figure D-2 shows the case operating expenditures total and breakdown. We can make the following conclusions regarding the operating expenditures (OPEX) of cases:
• As expected, the natural gas cases (Case 1 and 2) have the highest operating expenses, reflecting the cost of natural gas imports. However, the OPEX savings realized by going to alternative fuels is less than 20% of the natural gas case total operating costs (primarily because of higher costs to run evaporators).
• For comparison purposes, bitumen combustion is indicated as an operating cost. In fact, this amount is actually an opportunity cost, reflecting lost revenues and not a third party payment.
- 28 -
This document, and the opinions, analysis, evaluations, or recommendations contained herein are for the sole use and benefit of the contracting parties. There are no intended third party beneficiaries, and Jacobs Consultancy shall have no liability whatsoever to third parties for any defect, deficiency, error, omission in any statement contained in or in any way related to this document or the services provided. Use of this report or any information contained therein shall constitute a release and contract to defend, indemnify and hold Jacobs Consultancy Inc. harmless from and against any liability (including but not limited to liability for special, indirect or consequential damages) arising in connection with such use to the maximum extent, scope or amount allowed by law.
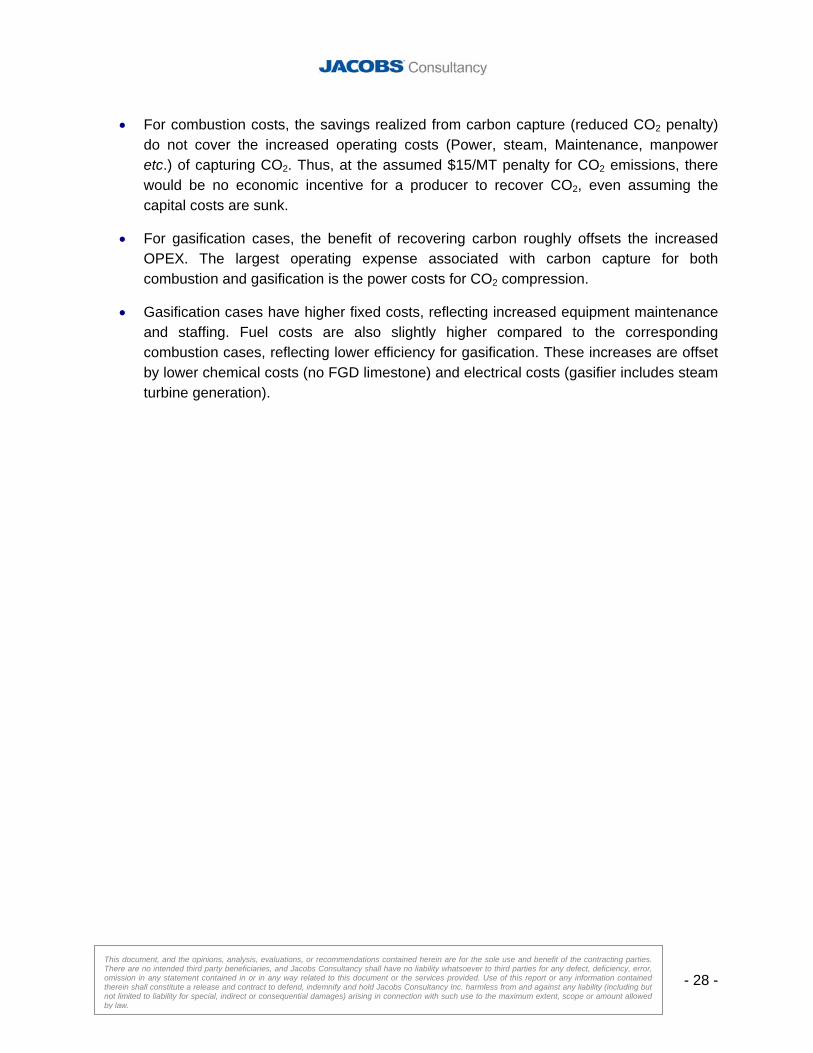
• For combustion costs, the savings realized from carbon capture (reduced CO2 penalty) do not cover the increased operating costs (Power, steam, Maintenance, manpower etc.) of capturing CO2. Thus, at the assumed $15/MT penalty for CO2 emissions, there would be no economic incentive for a producer to recover CO2, even assuming the capital costs are sunk.
• For gasification cases, the benefit of recovering carbon roughly offsets the increased OPEX. The largest operating expense associated with carbon capture for both combustion and gasification is the power costs for CO2 compression.
• Gasification cases have higher fixed costs, reflecting increased equipment maintenance and staffing. Fuel costs are also slightly higher compared to the corresponding combustion cases, reflecting lower efficiency for gasification. These increases are offset by lower chemical costs (no FGD limestone) and electrical costs (gasifier includes steam turbine generation).
- 29 -
This document, and the opinions, analysis, evaluations, or recommendations contained herein are for the sole use and benefit of the contracting parties. There are no intended third party beneficiaries, and Jacobs Consultancy shall have no liability whatsoever to third parties for any defect, deficiency, error, omission in any statement contained in or in any way related to this document or the services provided. Use of this report or any information contained therein shall constitute a release and contract to defend, indemnify and hold Jacobs Consultancy Inc. harmless from and against any liability (including but not limited to liability for special, indirect or consequential damages) arising in connection with such use to the maximum extent, scope or amount allowed by law.
Figure D-2. SAGD Facility Operating Expenses per barrel of bitumen (2008 Basis)
SAGD Facilities OPEX Breakdown
$0
$100
$200
$300
$400
$500
$600
OPE
X (C
DN
MM
$/yr
)
CO2 Penalty ($15/MT) 19 4 29 7 39 11 33 7 40 8
Pipeline transfer costs 67 67 55 54 67 67 53 53 67 67
Chemicals 24 25 45 50 71 92 24 24 24 24
Natural Gas / Petcoke 236 274 4 4 11 9 0 0 12 12
Electrical Power 12 27 39 63 38 79 18 73 24 92
Fixed OPEX (Staff, Maintenance, Taxes, Insurance) 126 153 149 192 163 234 186 198 196 210
Case 1NG
Case 2NG + CC
Case 3Bitumen
ATB
Case 4Bitumen
ATB + CC
Case 5PetCoke
Case 6Coke + CC
Case 7Bitumen
ATB Gasif.
Case 8Bit. ATB
Gasif + CC
Case 9Petcoke
Gasif
Case 10Petcoke
Gasif + CC
.
Economic Return Figure D-4 shows a comparison of the internal rate of return for all configurations. The internal rate of return assumes a 30-year plant life, and a 10% discount rate. Royalties, depreciation, working capital changes, and taxes are all considered in the economic analysis. Product and utility prices are correlated to Natural Gas price (base - 10 $/MMBtu) and a benchmark crude price (West Texas Intermediate or WTI; base - $80 / bbl : Bitumen = 52% WTI price). The results of our economic comparison suggest the following:
• A higher natural gas price would be required to invest in alternative fuels.
• Petcoke combustion offers a better return than bitumen combustion for these configurations. The advantage is primarily related to lost production associated with combusting bitumen.
- 30 -
This document, and the opinions, analysis, evaluations, or recommendations contained herein are for the sole use and benefit of the contracting parties. There are no intended third party beneficiaries, and Jacobs Consultancy shall have no liability whatsoever to third parties for any defect, deficiency, error, omission in any statement contained in or in any way related to this document or the services provided. Use of this report or any information contained therein shall constitute a release and contract to defend, indemnify and hold Jacobs Consultancy Inc. harmless from and against any liability (including but not limited to liability for special, indirect or consequential damages) arising in connection with such use to the maximum extent, scope or amount allowed by law.
• Bitumen combustion and gasification offer poor returns compared to other fuels. Gasification of liquids usually requires a less valuable product (e.g. Solvent De-asphalted pitch) to be economic. Pitch gasification was considered for this study, but economics for pitch must either include pipeline costs from Edmonton (currently non-existent) or the addition of a Solvent De-asphalting facility, both of which are outside this study scope.
Figure D-3. Configuration Net Present Value
Petcoke Gasification
Bitumen Gasification
Petcoke Combustion
Bitumen ATB Combustion
Natural Gas-1500
-1000
-500
0
500
1000
Net
Pre
sent
Val
ue (C
$ M
il)
w/o CO2 Capturewith CO2 Capture
WTI = $80 /bblBitumen = 0.52 x WTI Nat Gas = $10/GJCO2 Penalty = $15/GJProduction (SAGD) Only10% Discount Rate
A summary of economics at base conditions is shown in Table D-2. These results are highly dependent on the assumptions outlined in Table D-1 and will shift as these parameters, particularly crude and natural gas prices, are adjusted.
- 31 -
This document, and the opinions, analysis, evaluations, or recommendations contained herein are for the sole use and benefit of the contracting parties. There are no intended third party beneficiaries, and Jacobs Consultancy shall have no liability whatsoever to third parties for any defect, deficiency, error, omission in any statement contained in or in any way related to this document or the services provided. Use of this report or any information contained therein shall constitute a release and contract to defend, indemnify and hold Jacobs Consultancy Inc. harmless from and against any liability (including but not limited to liability for special, indirect or consequential damages) arising in connection with such use to the maximum extent, scope or amount allowed by law.
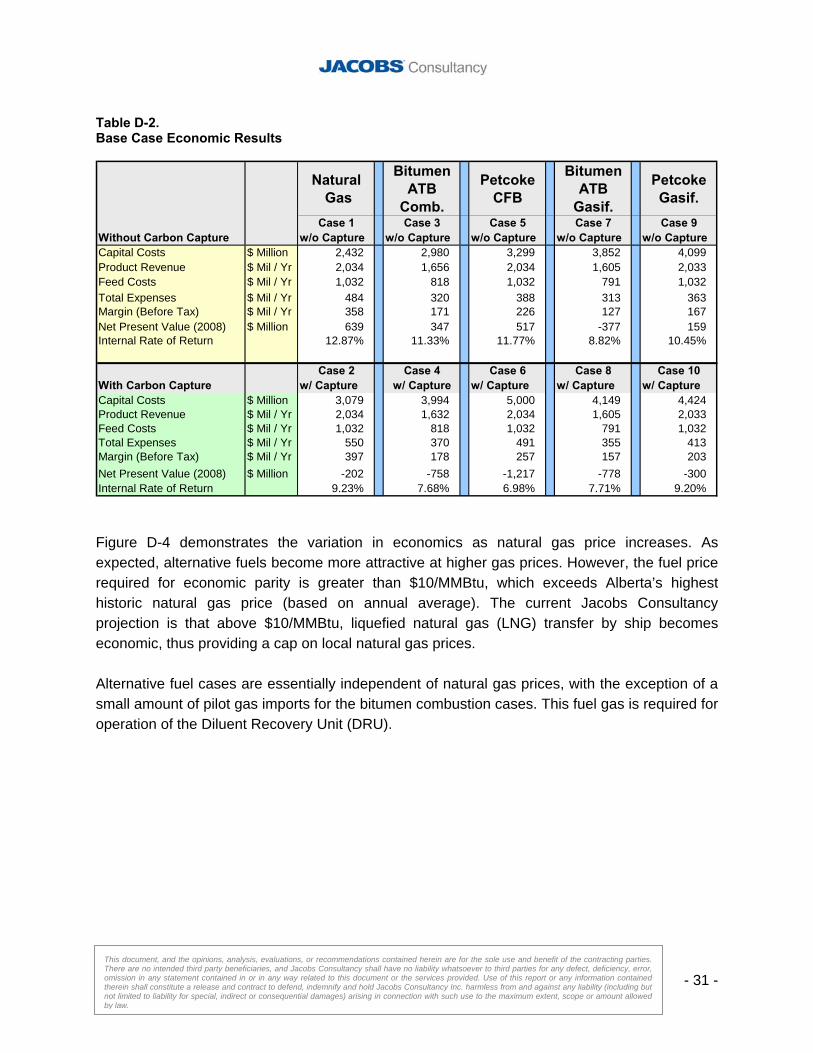
Table D-2. Base Case Economic Results
Natural Gas
Bitumen ATB
Comb.
Petcoke CFB
Bitumen ATB
Gasif.
Petcoke Gasif.
Case 1 Case 3 Case 5 Case 7 Case 9Without Carbon Capture w/o Capture w/o Capture w/o Capture w/o Capture w/o CaptureCapital Costs $ Million 2,432 2,980 3,299 3,852 4,099Product Revenue $ Mil / Yr 2,034 1,656 2,034 1,605 2,033Feed Costs $ Mil / Yr 1,032 818 1,032 791 1,032Total Expenses $ Mil / Yr 484 320 388 313 363Margin (Before Tax) $ Mil / Yr 358 171 226 127 167Net Present Value (2008) $ Million 639 347 517 -377 159Internal Rate of Return 12.87% 11.33% 11.77% 8.82% 10.45%
Case 2 Case 4 Case 6 Case 8 Case 10With Carbon Capture w/ Capture w/ Capture w/ Capture w/ Capture w/ CaptureCapital Costs $ Million 3,079 3,994 5,000 4,149 4,424Product Revenue $ Mil / Yr 2,034 1,632 2,034 1,605 2,033Feed Costs $ Mil / Yr 1,032 818 1,032 791 1,032Total Expenses $ Mil / Yr 550 370 491 355 413Margin (Before Tax) $ Mil / Yr 397 178 257 157 203Net Present Value (2008) $ Million -202 -758 -1,217 -778 -300Internal Rate of Return 9.23% 7.68% 6.98% 7.71% 9.20%
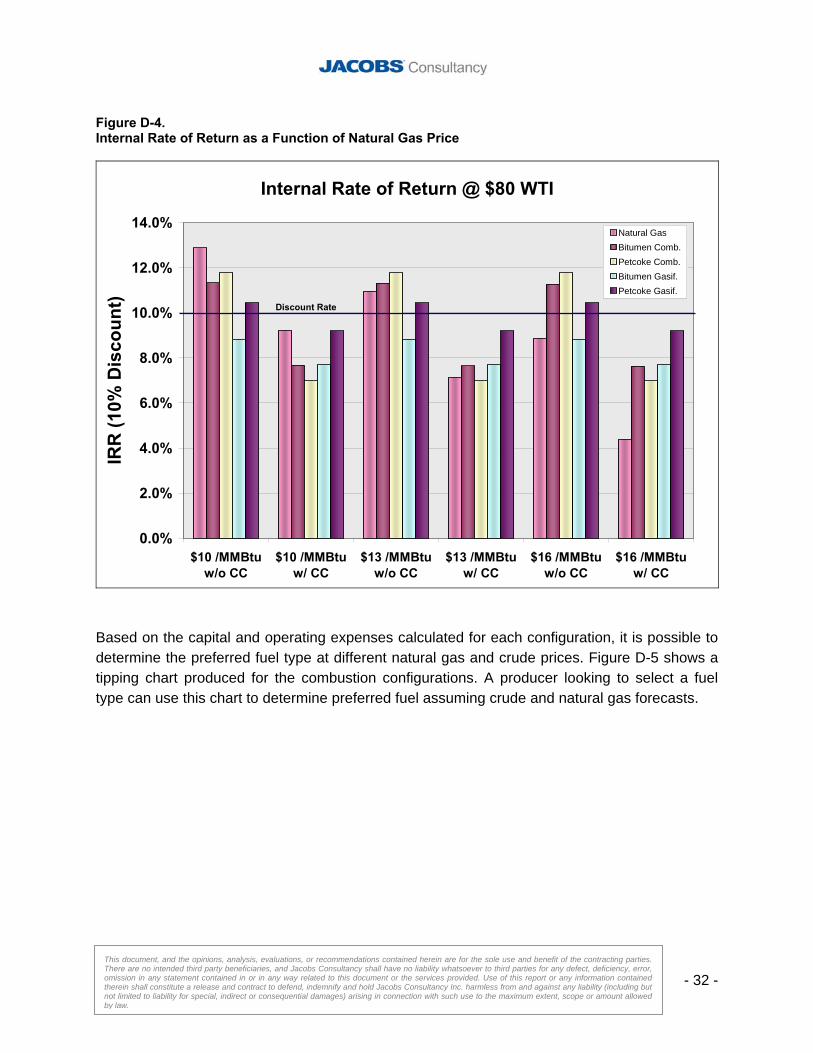
Figure D-4 demonstrates the variation in economics as natural gas price increases. As expected, alternative fuels become more attractive at higher gas prices. However, the fuel price required for economic parity is greater than $10/MMBtu, which exceeds Alberta’s highest historic natural gas price (based on annual average). The current Jacobs Consultancy projection is that above $10/MMBtu, liquefied natural gas (LNG) transfer by ship becomes economic, thus providing a cap on local natural gas prices. Alternative fuel cases are essentially independent of natural gas prices, with the exception of a small amount of pilot gas imports for the bitumen combustion cases. This fuel gas is required for operation of the Diluent Recovery Unit (DRU).
- 32 -
This document, and the opinions, analysis, evaluations, or recommendations contained herein are for the sole use and benefit of the contracting parties. There are no intended third party beneficiaries, and Jacobs Consultancy shall have no liability whatsoever to third parties for any defect, deficiency, error, omission in any statement contained in or in any way related to this document or the services provided. Use of this report or any information contained therein shall constitute a release and contract to defend, indemnify and hold Jacobs Consultancy Inc. harmless from and against any liability (including but not limited to liability for special, indirect or consequential damages) arising in connection with such use to the maximum extent, scope or amount allowed by law.
Figure D-4. Internal Rate of Return as a Function of Natural Gas Price
Internal Rate of Return @ $80 WTI
0.0%
2.0%
4.0%
6.0%
8.0%
10.0%
12.0%
14.0%
$10 /MMBtuw/o CC
$10 /MMBtuw/ CC
$13 /MMBtuw/o CC
$13 /MMBtuw/ CC
$16 /MMBtuw/o CC
$16 /MMBtuw/ CC
IRR
(10%
Dis
coun
t)
Natural GasBitumen Comb.Petcoke Comb.Bitumen Gasif.Petcoke Gasif.
Discount Rate
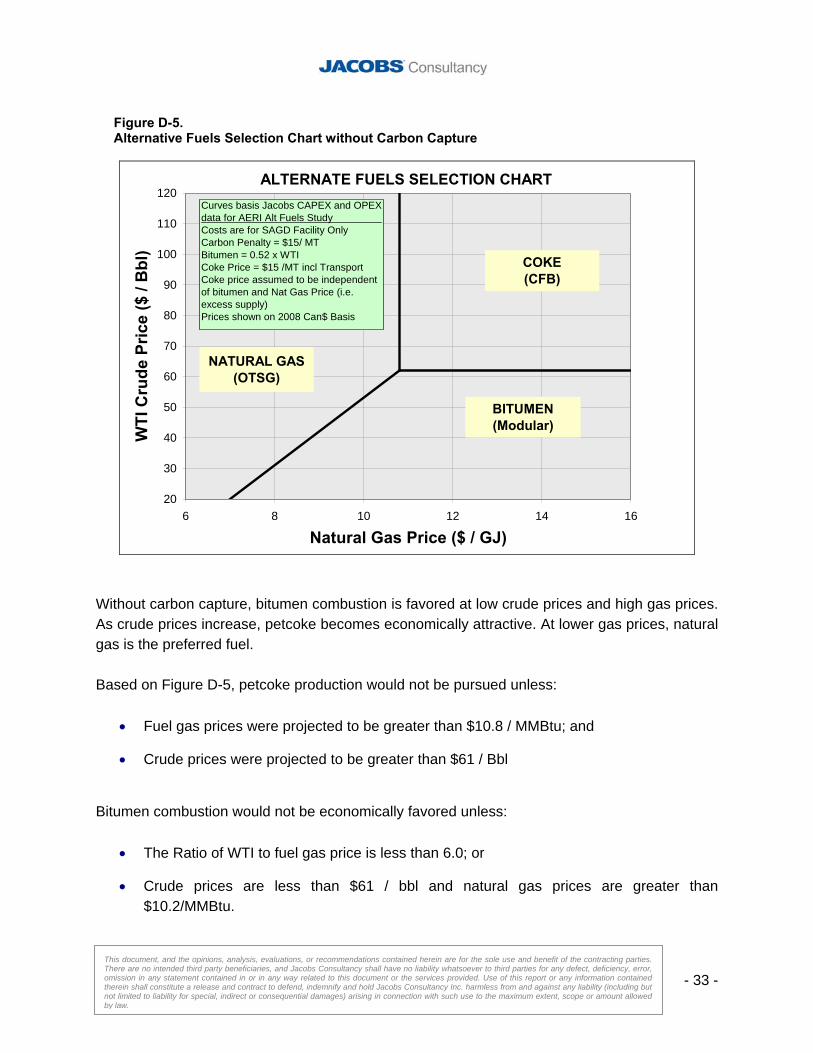
Based on the capital and operating expenses calculated for each configuration, it is possible to determine the preferred fuel type at different natural gas and crude prices. Figure D-5 shows a tipping chart produced for the combustion configurations. A producer looking to select a fuel type can use this chart to determine preferred fuel assuming crude and natural gas forecasts.
- 33 -
This document, and the opinions, analysis, evaluations, or recommendations contained herein are for the sole use and benefit of the contracting parties. There are no intended third party beneficiaries, and Jacobs Consultancy shall have no liability whatsoever to third parties for any defect, deficiency, error, omission in any statement contained in or in any way related to this document or the services provided. Use of this report or any information contained therein shall constitute a release and contract to defend, indemnify and hold Jacobs Consultancy Inc. harmless from and against any liability (including but not limited to liability for special, indirect or consequential damages) arising in connection with such use to the maximum extent, scope or amount allowed by law.
Figure D-5. Alternative Fuels Selection Chart without Carbon Capture
ALTERNATE FUELS SELECTION CHART
20
30
40
50
60
70
80
90
100
110
120
6 8 10 12 14 16
Natural Gas Price ($ / GJ)
WTI
Cru
de P
rice
($ /
Bbl
)
COKE(CFB)
BITUMEN(Modular)
NATURAL GAS(OTSG)
Curves basis Jacobs CAPEX and OPEX data for AERI Alt Fuels Study Costs are for SAGD Facility OnlyCarbon Penalty = $15/ MTBitumen = 0.52 x WTICoke Price = $15 /MT incl Transport Coke price assumed to be independent of bitumen and Nat Gas Price (i.e. excess supply)Prices shown on 2008 Can$ Basis
Without carbon capture, bitumen combustion is favored at low crude prices and high gas prices. As crude prices increase, petcoke becomes economically attractive. At lower gas prices, natural gas is the preferred fuel. Based on Figure D-5, petcoke production would not be pursued unless:
• Fuel gas prices were projected to be greater than $10.8 / MMBtu; and
• Crude prices were projected to be greater than $61 / Bbl
Bitumen combustion would not be economically favored unless:
• The Ratio of WTI to fuel gas price is less than 6.0; or
• Crude prices are less than $61 / bbl and natural gas prices are greater than $10.2/MMBtu.
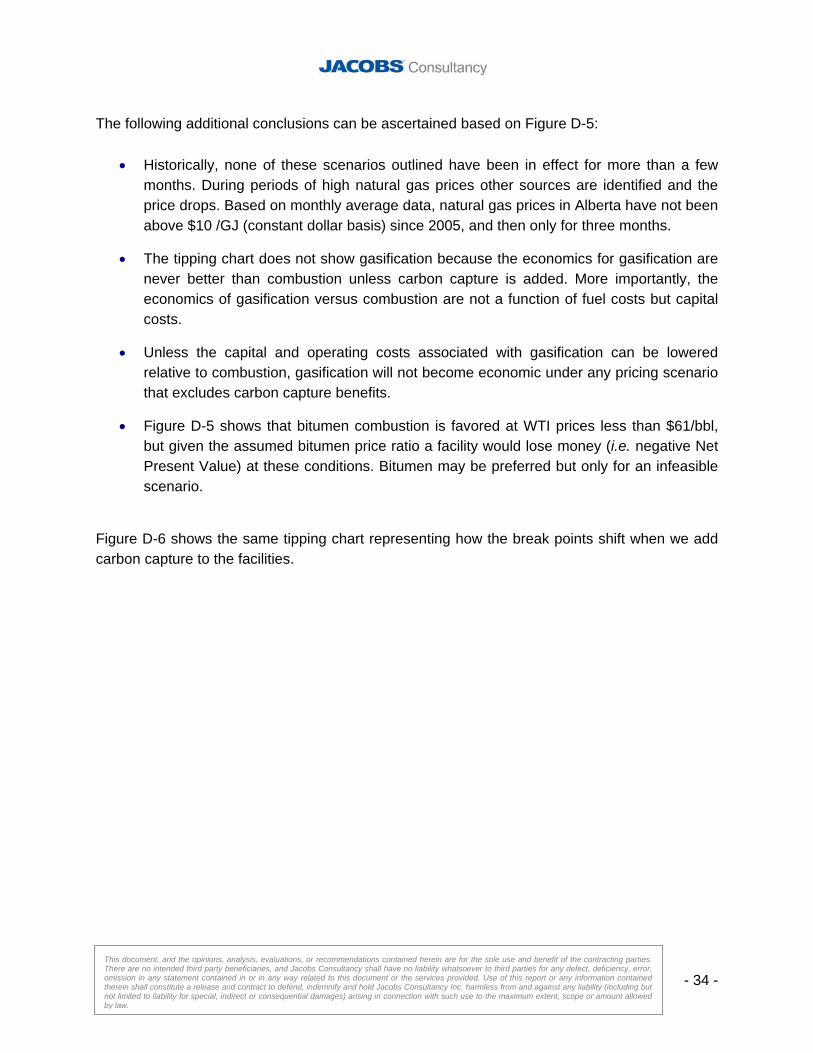
- 34 -
This document, and the opinions, analysis, evaluations, or recommendations contained herein are for the sole use and benefit of the contracting parties. There are no intended third party beneficiaries, and Jacobs Consultancy shall have no liability whatsoever to third parties for any defect, deficiency, error, omission in any statement contained in or in any way related to this document or the services provided. Use of this report or any information contained therein shall constitute a release and contract to defend, indemnify and hold Jacobs Consultancy Inc. harmless from and against any liability (including but not limited to liability for special, indirect or consequential damages) arising in connection with such use to the maximum extent, scope or amount allowed by law.
The following additional conclusions can be ascertained based on Figure D-5:
• Historically, none of these scenarios outlined have been in effect for more than a few months. During periods of high natural gas prices other sources are identified and the price drops. Based on monthly average data, natural gas prices in Alberta have not been above $10 /GJ (constant dollar basis) since 2005, and then only for three months.
• The tipping chart does not show gasification because the economics for gasification are never better than combustion unless carbon capture is added. More importantly, the economics of gasification versus combustion are not a function of fuel costs but capital costs.
• Unless the capital and operating costs associated with gasification can be lowered relative to combustion, gasification will not become economic under any pricing scenario that excludes carbon capture benefits.
• Figure D-5 shows that bitumen combustion is favored at WTI prices less than $61/bbl, but given the assumed bitumen price ratio a facility would lose money (i.e. negative Net Present Value) at these conditions. Bitumen may be preferred but only for an infeasible scenario.
Figure D-6 shows the same tipping chart representing how the break points shift when we add carbon capture to the facilities.
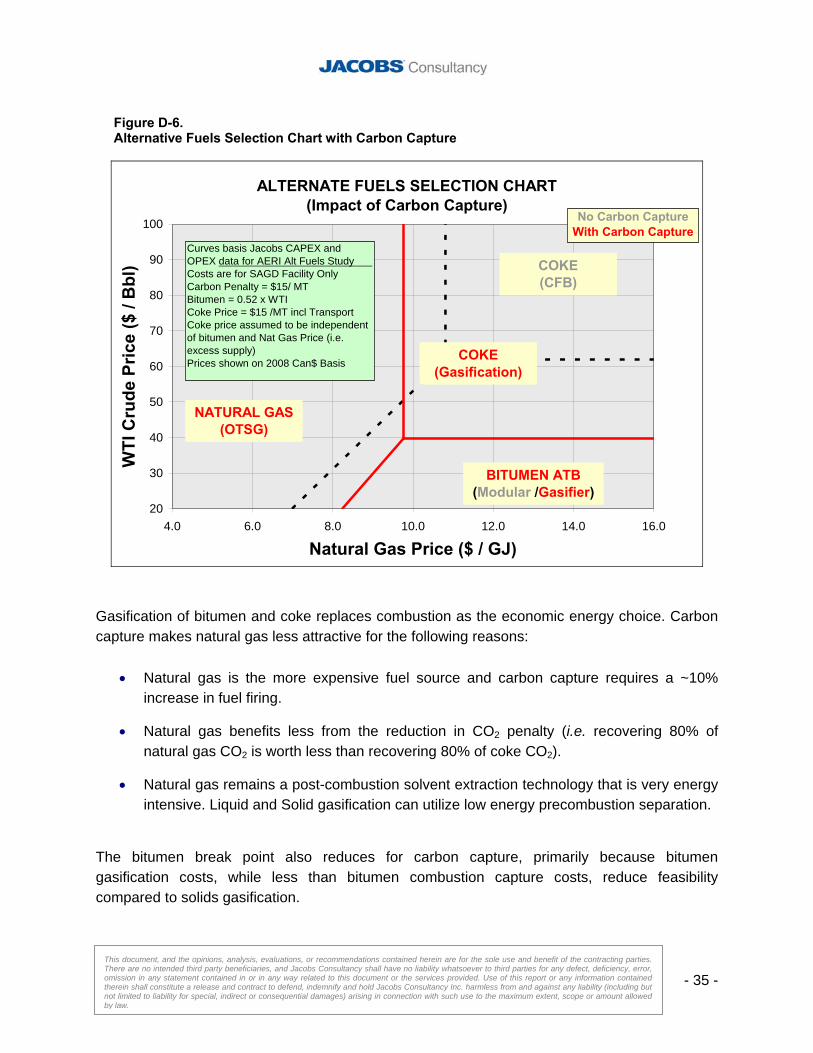
- 35 -
This document, and the opinions, analysis, evaluations, or recommendations contained herein are for the sole use and benefit of the contracting parties. There are no intended third party beneficiaries, and Jacobs Consultancy shall have no liability whatsoever to third parties for any defect, deficiency, error, omission in any statement contained in or in any way related to this document or the services provided. Use of this report or any information contained therein shall constitute a release and contract to defend, indemnify and hold Jacobs Consultancy Inc. harmless from and against any liability (including but not limited to liability for special, indirect or consequential damages) arising in connection with such use to the maximum extent, scope or amount allowed by law.
Figure D-6. Alternative Fuels Selection Chart with Carbon Capture
ALTERNATE FUELS SELECTION CHART(Impact of Carbon Capture)
20
30
40
50
60
70
80
90
100
4.0 6.0 8.0 10.0 12.0 14.0 16.0
Natural Gas Price ($ / GJ)
WTI
Cru
de P
rice
($ /
Bbl
) COKE(CFB)
BITUMEN ATB(Modular /Gasifier)
NATURAL GAS(OTSG)
No Carbon CaptureWith Carbon Capture
COKE(Gasification)
Curves basis Jacobs CAPEX and OPEX data for AERI Alt Fuels Study Costs are for SAGD Facility OnlyCarbon Penalty = $15/ MTBitumen = 0.52 x WTICoke Price = $15 /MT incl Transport Coke price assumed to be independent of bitumen and Nat Gas Price (i.e. excess supply)Prices shown on 2008 Can$ Basis
Gasification of bitumen and coke replaces combustion as the economic energy choice. Carbon capture makes natural gas less attractive for the following reasons:
• Natural gas is the more expensive fuel source and carbon capture requires a ~10% increase in fuel firing.
• Natural gas benefits less from the reduction in CO2 penalty (i.e. recovering 80% of natural gas CO2 is worth less than recovering 80% of coke CO2).
• Natural gas remains a post-combustion solvent extraction technology that is very energy intensive. Liquid and Solid gasification can utilize low energy precombustion separation.
The bitumen break point also reduces for carbon capture, primarily because bitumen gasification costs, while less than bitumen combustion capture costs, reduce feasibility compared to solids gasification.
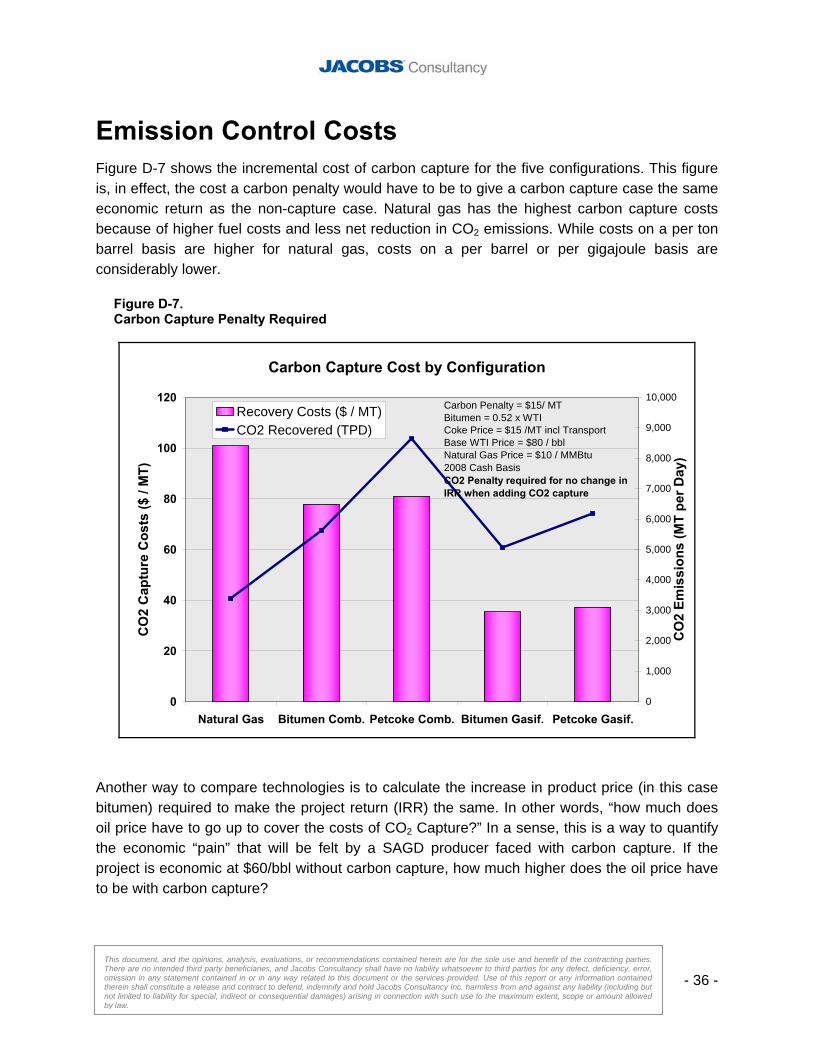
- 36 -
This document, and the opinions, analysis, evaluations, or recommendations contained herein are for the sole use and benefit of the contracting parties. There are no intended third party beneficiaries, and Jacobs Consultancy shall have no liability whatsoever to third parties for any defect, deficiency, error, omission in any statement contained in or in any way related to this document or the services provided. Use of this report or any information contained therein shall constitute a release and contract to defend, indemnify and hold Jacobs Consultancy Inc. harmless from and against any liability (including but not limited to liability for special, indirect or consequential damages) arising in connection with such use to the maximum extent, scope or amount allowed by law.
Emission Control Costs Figure D-7 shows the incremental cost of carbon capture for the five configurations. This figure is, in effect, the cost a carbon penalty would have to be to give a carbon capture case the same economic return as the non-capture case. Natural gas has the highest carbon capture costs because of higher fuel costs and less net reduction in CO2 emissions. While costs on a per ton barrel basis are higher for natural gas, costs on a per barrel or per gigajoule basis are considerably lower.
Figure D-7. Carbon Capture Penalty Required
Carbon Capture Cost by Configuration
0
20
40
60
80
100
120
Natural Gas Bitumen Comb. Petcoke Comb. Bitumen Gasif. Petcoke Gasif.
CO
2 C
aptu
re C
osts
($ /
MT)
0
1,000
2,000
3,000
4,000
5,000
6,000
7,000
8,000
9,000
10,000
CO
2 Em
issi
ons
(MT
per D
ay)
Recovery Costs ($ / MT)CO2 Recovered (TPD)
Carbon Penalty = $15/ MTBitumen = 0.52 x WTICoke Price = $15 /MT incl Transport Base WTI Price = $80 / bblNatural Gas Price = $10 / MMBtu2008 Cash BasisCO2 Penalty required for no change in IRR when adding CO2 capture
Another way to compare technologies is to calculate the increase in product price (in this case bitumen) required to make the project return (IRR) the same. In other words, “how much does oil price have to go up to cover the costs of CO2 Capture?” In a sense, this is a way to quantify the economic “pain” that will be felt by a SAGD producer faced with carbon capture. If the project is economic at $60/bbl without carbon capture, how much higher does the oil price have to be with carbon capture?
- 37 -
This document, and the opinions, analysis, evaluations, or recommendations contained herein are for the sole use and benefit of the contracting parties. There are no intended third party beneficiaries, and Jacobs Consultancy shall have no liability whatsoever to third parties for any defect, deficiency, error, omission in any statement contained in or in any way related to this document or the services provided. Use of this report or any information contained therein shall constitute a release and contract to defend, indemnify and hold Jacobs Consultancy Inc. harmless from and against any liability (including but not limited to liability for special, indirect or consequential damages) arising in connection with such use to the maximum extent, scope or amount allowed by law.
Figure D-8 shows the cost of carbon capture in terms of the required increase in bitumen price. Thus, to maintain economic return for natural gas with carbon capture, bitumen price must increase by $8 per barrel. With reference to Table D-2, to increase Case 2 IRR from 9.2% to the Case 1 return of 12.9%, the product margin for Case 2 must be $8 per barrel higher. Assuming a 0.52 ratio, this delta corresponds to a WTI price increase of $15/bbl to $95/bbl. The cost increases significantly for alternative fuel combustion, reflecting the higher carbon dioxide generation per barrel of bitumen. As expected, the crude price increase required for the gasification cases is much less, but this ignores the higher initial cost for gasification. Bitumen gasification cost to implement carbon capture is the smallest, but this increment is to maintain a rate of return that is already less than the discount rate of 10 percent. Figure D-8. Carbon Capture Costs Basis Product Price Differential
Carbon Capture Incremental Costs
0
2
4
6
8
10
12
14
16
18
Natural Gas Bitumen Comb. Petcoke Comb. Bitumen Gasif. Petcoke Gasif.
Incr
emen
tal B
itum
en P
rice
($ /
Bbl
)
Carbon Penalty = $15/ MTBitumen = 0.52 x WTICoke Price = $15 /MT incl Transport Base WTI Price = $80 / bblNatural Gas Price = $10 / MMBtu2008 Cash BasisIncreased margin required to maintain IRR with Base Case
Fuel Base IRRNatural Gas 12.9%
Bitumen Comb. 11.3%Petcoke CFB 11.8%
Bit. Gasif. 8.8%Petcoke Gasif. 10.5%
- 38 -
This document, and the opinions, analysis, evaluations, or recommendations contained herein are for the sole use and benefit of the contracting parties. There are no intended third party beneficiaries, and Jacobs Consultancy shall have no liability whatsoever to third parties for any defect, deficiency, error, omission in any statement contained in or in any way related to this document or the services provided. Use of this report or any information contained therein shall constitute a release and contract to defend, indemnify and hold Jacobs Consultancy Inc. harmless from and against any liability (including but not limited to liability for special, indirect or consequential damages) arising in connection with such use to the maximum extent, scope or amount allowed by law.
In a similar fashion, it is possible to isolate emission treating requirements. Figure D-9 shows the relative costs of emission treating used for the bitumen ATB combustion case. Compared to carbon capture, controlling SOx and NOx is relatively inexpensive if they are viewed in terms of the overall facility construction. Adding an SCR to the project scope creates an incremental cost of $0.02/bbl bitumen. Flue Gas Desulphurization costs are higher, primarily because of the chemical costs for the limestone. However, the costs of going from a dry scrubber to a wet FGD is relatively small, requiring a bitumen price increase of less than a dollar per barrel. Emission control costs and rate of return impact will be a much larger portion of the total economics for a revamp case (refer to Section E). Figure D-9. Emission Control Costs Basis Product Price
Dry Scrubber Wet Scrubber SCR
$0.0
$1.0
$2.0
$3.0
$4.0
Incr
emen
tal M
argi
n C
osts
($ /
Bar
rel o
f Bitm
en)
Incremental Costs of Emissions Control for Bitumen Combustion
Δ% Return
Incremental Cost ($ / Bbl)
Dry FGD 0.82% $2.57
Wet FGD 1.14% $3.35SCR 0.08% $0.20Base WTI = $80 / BblBitumen = 0.52 * WTIDiscount Rate = 10%Deltas based on Bitumen Combustionin a modular boiler (Case 3)

- 39 -
This document, and the opinions, analysis, evaluations, or recommendations contained herein are for the sole use and benefit of the contracting parties. There are no intended third party beneficiaries, and Jacobs Consultancy shall have no liability whatsoever to third parties for any defect, deficiency, error, omission in any statement contained in or in any way related to this document or the services provided. Use of this report or any information contained therein shall constitute a release and contract to defend, indemnify and hold Jacobs Consultancy Inc. harmless from and against any liability (including but not limited to liability for special, indirect or consequential damages) arising in connection with such use to the maximum extent, scope or amount allowed by law.
Section E.
Configuration Sensitivities
- 40 -
This document, and the opinions, analysis, evaluations, or recommendations contained herein are for the sole use and benefit of the contracting parties. There are no intended third party beneficiaries, and Jacobs Consultancy shall have no liability whatsoever to third parties for any defect, deficiency, error, omission in any statement contained in or in any way related to this document or the services provided. Use of this report or any information contained therein shall constitute a release and contract to defend, indemnify and hold Jacobs Consultancy Inc. harmless from and against any liability (including but not limited to liability for special, indirect or consequential damages) arising in connection with such use to the maximum extent, scope or amount allowed by law.
Retrofit As natural gas prices increase, producers may consider retrofitting natural gas boilers to burn alternative fuels. To address this scenario, we looked at retrofitting a typical natural gas SAGD facility to burn bitumen. We assumed that the OTSG boilers can be converted to bitumen ATB combustion, though this process has not been proven at scale. The retrofit configuration includes the DRU, the Wet Gas Scrubber, and the SCR NOx treating facility. Costs for emissions treating are increased in recognition of the additional labor and shutdown time required for a major SAGD retrofit. Likewise, some costs are included for boiler changes (new burners, repiping, controls, etc.). Figure E-1. Bitumen ATB Retrofit Economic Break-Even Point
Retrofit Break-even Pricing (Natural Gas OTSG Retrofit to Bitumen)
Grass Roots Bitumen Boiler
Break Point
40.0
50.0
60.0
70.0
80.0
90.0
100.0
110.0
120.0
130.0
10.0 11.0 12.0 13.0 14.0 15.0 16.0 17.0
Nat Gas Price ($ / MMBtu)
WTI
Pric
e ($
/ B
bl)
Retain Natural Gas Retrofit Bitumen
Combustion
Bitumen Retrofit Zero NPV
(Break-Even Line)
Retrofit CAPEX ~ 25% of Nat Gas Facility Costs40% of the costs are for emission control
Figure E-1 shows the economic breakpoint for a retrofit (i.e. the crude and natural gas price necessary for a zero Net Present Value). The break-even WTI:NG price ratio for the retrofit case is approximately 5.5-6.0 (i.e. at a WTI price of $60, gas prices would need to be $10-
- 41 -
This document, and the opinions, analysis, evaluations, or recommendations contained herein are for the sole use and benefit of the contracting parties. There are no intended third party beneficiaries, and Jacobs Consultancy shall have no liability whatsoever to third parties for any defect, deficiency, error, omission in any statement contained in or in any way related to this document or the services provided. Use of this report or any information contained therein shall constitute a release and contract to defend, indemnify and hold Jacobs Consultancy Inc. harmless from and against any liability (including but not limited to liability for special, indirect or consequential damages) arising in connection with such use to the maximum extent, scope or amount allowed by law.
$11/MMBtu). This is similar to the break point for a new unit (refer Figure D-5). Typically, economics for retrofitting are less favorable than for a new facility (i.e. a lower crude price to gas price is required) because:
• Capital costs for a retrofit are higher than capital costs for a new unit.
• To make a retrofit economic, a producer would have to retain existing capacity and reduce operating costs sufficiently to cover the capital investment.
• Burning bitumen reduces production, so the improvement in operating costs has to cover lost production.
Economics for retrofitting in this case are improved by assuming an OTSG can be used as opposed to the modular boiler used in Case 3. Given that the current spot market bitumen-to-crude price ratio is much higher than we have used (>0.7 vs. 0.52 used in the study), it is difficult to see how a retrofit to burn bitumen can make economic sense. Even if treating requirements are eliminated, a retrofit to bitumen would not be economic in the current environment. Retrofitting an OTSG facility to burn other alternative fuels (e.g. petcoke or coal) are well beyond current technical capabilities.
Reduced Scale Facilities In past configuration and facility studies Jacobs Consultancy has conducted within and outside the Oils Sands region and for all major oil producers; the one consistent conclusion has been that bigger is usually better. Economies of scale strongly favor increasing facility sizes to a practical maximum, either in terms of upgrader capacity or oil handling capability. Figure E-2 demonstrates this conclusion and the level of lost return caused by selecting a facility half the size (33,000 BPD) as compared to Case 3 Bitumen ATB combustion. At base conditions there is a penalty of 1.83%, which is equivalent to an $11 differential in crude price. This means that for a smaller facility to be profitable, crude price needs to be substantially higher than for a larger facility.
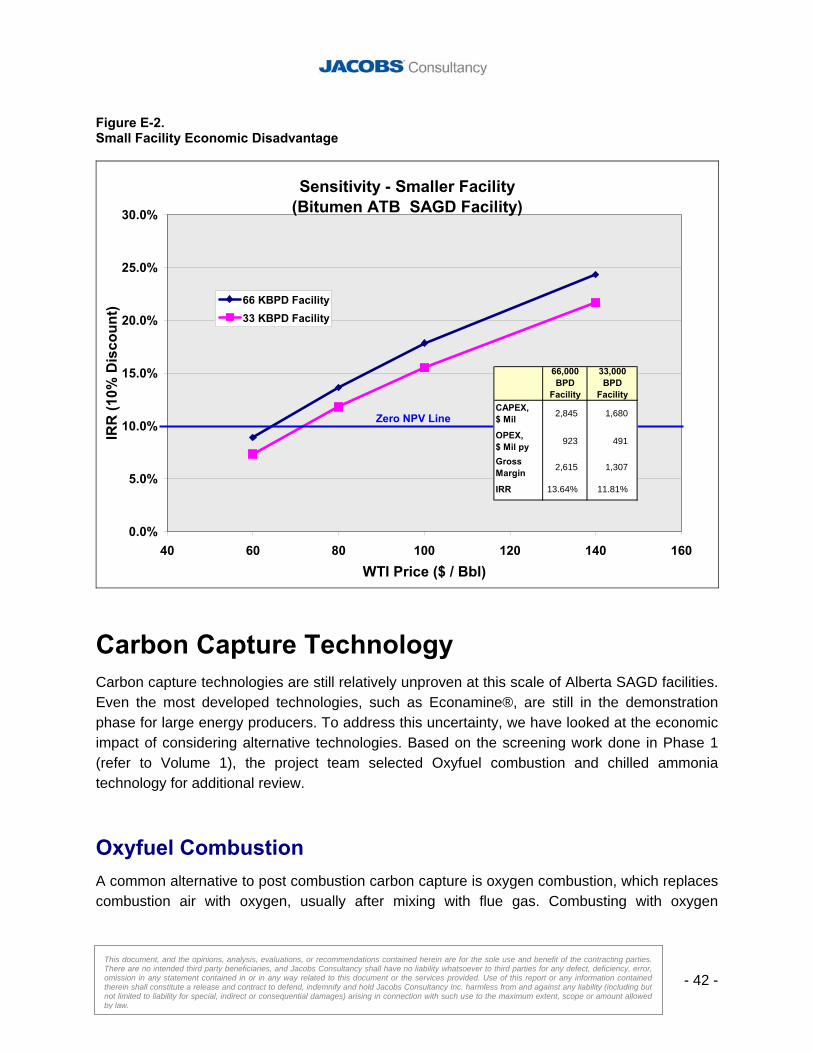
- 42 -
This document, and the opinions, analysis, evaluations, or recommendations contained herein are for the sole use and benefit of the contracting parties. There are no intended third party beneficiaries, and Jacobs Consultancy shall have no liability whatsoever to third parties for any defect, deficiency, error, omission in any statement contained in or in any way related to this document or the services provided. Use of this report or any information contained therein shall constitute a release and contract to defend, indemnify and hold Jacobs Consultancy Inc. harmless from and against any liability (including but not limited to liability for special, indirect or consequential damages) arising in connection with such use to the maximum extent, scope or amount allowed by law.
Figure E-2. Small Facility Economic Disadvantage
Sensitivity - Smaller Facility(Bitumen ATB SAGD Facility)
0.0%
5.0%
10.0%
15.0%
20.0%
25.0%
30.0%
40 60 80 100 120 140 160WTI Price ($ / Bbl)
IRR
(10%
Dis
coun
t)
66 KBPD Facility33 KBPD Facility
66,000 BPD
Facility
33,000 BPD
FacilityCAPEX,$ Mil 2,845 1,680
OPEX, $ Mil py 923 491
Gross Margin 2,615 1,307
IRR 13.64% 11.81%
Zero NPV Line
Carbon Capture Technology Carbon capture technologies are still relatively unproven at this scale of Alberta SAGD facilities. Even the most developed technologies, such as Econamine®, are still in the demonstration phase for large energy producers. To address this uncertainty, we have looked at the economic impact of considering alternative technologies. Based on the screening work done in Phase 1 (refer to Volume 1), the project team selected Oxyfuel combustion and chilled ammonia technology for additional review.
Oxyfuel Combustion A common alternative to post combustion carbon capture is oxygen combustion, which replaces combustion air with oxygen, usually after mixing with flue gas. Combusting with oxygen
- 43 -
This document, and the opinions, analysis, evaluations, or recommendations contained herein are for the sole use and benefit of the contracting parties. There are no intended third party beneficiaries, and Jacobs Consultancy shall have no liability whatsoever to third parties for any defect, deficiency, error, omission in any statement contained in or in any way related to this document or the services provided. Use of this report or any information contained therein shall constitute a release and contract to defend, indemnify and hold Jacobs Consultancy Inc. harmless from and against any liability (including but not limited to liability for special, indirect or consequential damages) arising in connection with such use to the maximum extent, scope or amount allowed by law.
increases the concentration of CO2 in flue gas to the point where condensing water and removing the trace contaminants (SOx and NOx) leaves a concentrated CO2 stream suitable for compression and sequestration. Power requirements are significantly higher for the Air Separation Unit, but because there is no solvent regeneration requiring additional steam, bitumen combustion (and thus production) remains the same as in the non-capture case. For coke and natural gas facilities the savings would be in reduced fuel costs. The large uncertainty in Oxyfuel combustion is the capital cost relative to amine flue gas treating. Air separation units are expensive, as are pressurized boilers and flue gas condensers. However, if the lower flue gas rate can be translated to reduced boiler size and increased CO2 compressor suction pressure, there could be significant CAPEX and OPEX savings. Also, it may be possible to eliminate flue gas treating, recovering SOx and NOx as weak acids. Based on discussions with vendors there may not be significant boiler savings for oxyfuel combustion due to the need to maintain a maximum of 25% oxygen concentration at the boiler mixing point.
Chilled Ammonia Carbon Capture Chilled ammonia carbon capture is a post combustion absorption technology similar to amine contacting but using chilled ammonia as a CO2 solvent. This technology, offered by boiler manufacturer Alstom, offers the following advantages over amine absorption:
• Chilled ammonia requires less regeneration energy than amine absorption.
• Chilled ammonia can be regenerated at higher pressures, substantially reducing CO2 compression capital and operating costs.
• Chilling costs in Alberta will be much lower than in the US, further increasing the OPEX advantage relative to amine technologies.
• Reduced heat requirements reduce boiler load, lowering net facility capital and operating costs.
• Power consumption and capital costs are lower for Carbon Capture. There is also a potential to integrate chilled ammonia carbon capture with flue gas desulphurization, utilizing the ammonia desulphurization technology.
Chilled Ammonia technology has a few issues that must be addressed before implementing in a full-scale SAGD facility:
- 44 -
This document, and the opinions, analysis, evaluations, or recommendations contained herein are for the sole use and benefit of the contracting parties. There are no intended third party beneficiaries, and Jacobs Consultancy shall have no liability whatsoever to third parties for any defect, deficiency, error, omission in any statement contained in or in any way related to this document or the services provided. Use of this report or any information contained therein shall constitute a release and contract to defend, indemnify and hold Jacobs Consultancy Inc. harmless from and against any liability (including but not limited to liability for special, indirect or consequential damages) arising in connection with such use to the maximum extent, scope or amount allowed by law.
• Ammonia slip—Loss of ammonia with stack gas needs to be controlled to avoid safety and environmental issues.
• Ammonia Handling—Delivery and storage of anhydrous ammonia always poses a significant safety hazard. However, fertilizer and petrochemical facilities throughout the world deal with this risk year round.
Economic Comparison Table E-1 compares the economics of Oxyfuel and chilled ammonia against the base amine capture technology. According to an EPRI./ DOE study,1 chilled ammonia can be installed for less than 50% of the capital costs of an Econamine® facility of the same capacity; however, the net capital savings are less since there is still a requirement for energy generation. Capital savings for Oxyfuel are even greater, because there is no additional heat load imposed on the steam system. However, Oxyfuel combustion has substantially higher operating costs, primarily for oxygen generation in the air separation unit. Based on making the appropriate adjustments to the Case 4 cash flow statement, we were able to calculate the impact these changes would have on project return and net present value.
1 Chilled-Ammonia Post Combustion CO2 Capture System, Electric Power Research Institute – Nov 2006
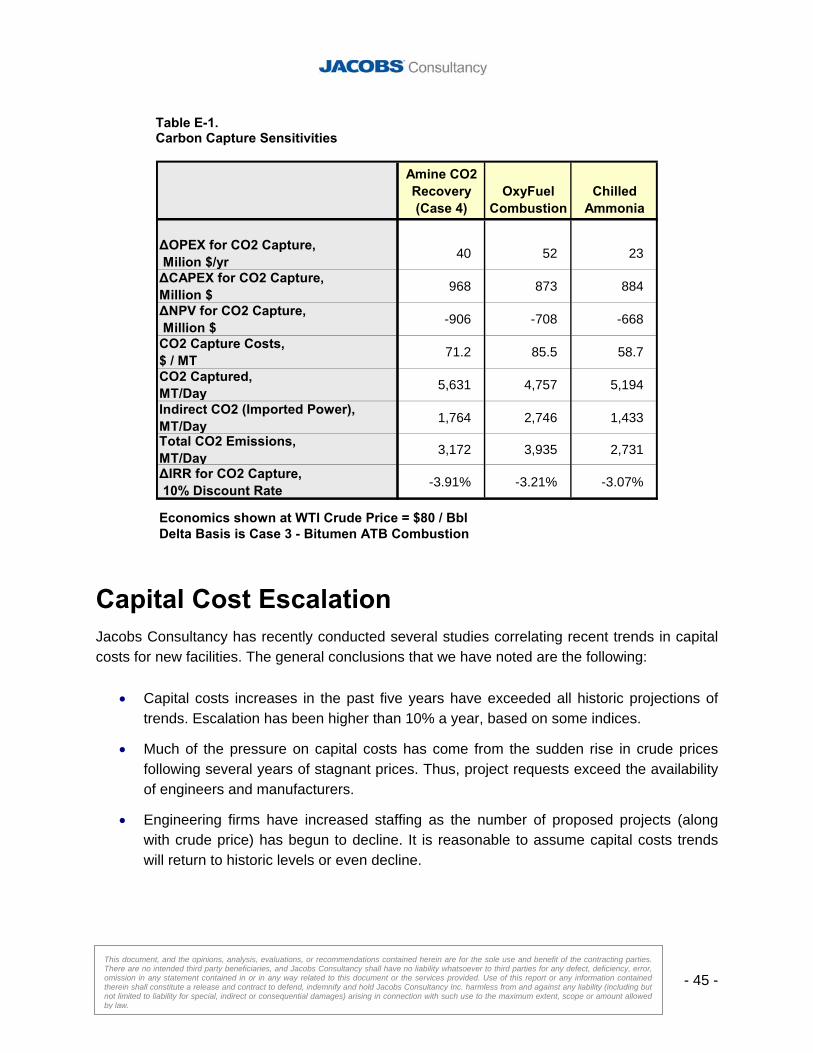
- 45 -
This document, and the opinions, analysis, evaluations, or recommendations contained herein are for the sole use and benefit of the contracting parties. There are no intended third party beneficiaries, and Jacobs Consultancy shall have no liability whatsoever to third parties for any defect, deficiency, error, omission in any statement contained in or in any way related to this document or the services provided. Use of this report or any information contained therein shall constitute a release and contract to defend, indemnify and hold Jacobs Consultancy Inc. harmless from and against any liability (including but not limited to liability for special, indirect or consequential damages) arising in connection with such use to the maximum extent, scope or amount allowed by law.
Table E-1. Carbon Capture Sensitivities
Amine CO2 Recovery (Case 4)
OxyFuel Combustion
Chilled Ammonia
ΔOPEX for CO2 Capture, Milion $/yr 40 52 23
ΔCAPEX for CO2 Capture, Million $ 968 873 884
ΔNPV for CO2 Capture, Million $ -906 -708 -668
CO2 Capture Costs,$ / MT 71.2 85.5 58.7
CO2 Captured,MT/Day 5,631 4,757 5,194
Indirect CO2 (Imported Power),MT/Day 1,764 2,746 1,433
Total CO2 Emissions,MT/Day 3,172 3,935 2,731
ΔIRR for CO2 Capture, 10% Discount Rate -3.91% -3.21% -3.07%
Economics shown at WTI Crude Price = $80 / BblDelta Basis is Case 3 - Bitumen ATB Combustion
Capital Cost Escalation Jacobs Consultancy has recently conducted several studies correlating recent trends in capital costs for new facilities. The general conclusions that we have noted are the following:
• Capital costs increases in the past five years have exceeded all historic projections of trends. Escalation has been higher than 10% a year, based on some indices.
• Much of the pressure on capital costs has come from the sudden rise in crude prices following several years of stagnant prices. Thus, project requests exceed the availability of engineers and manufacturers.
• Engineering firms have increased staffing as the number of proposed projects (along with crude price) has begun to decline. It is reasonable to assume capital costs trends will return to historic levels or even decline.
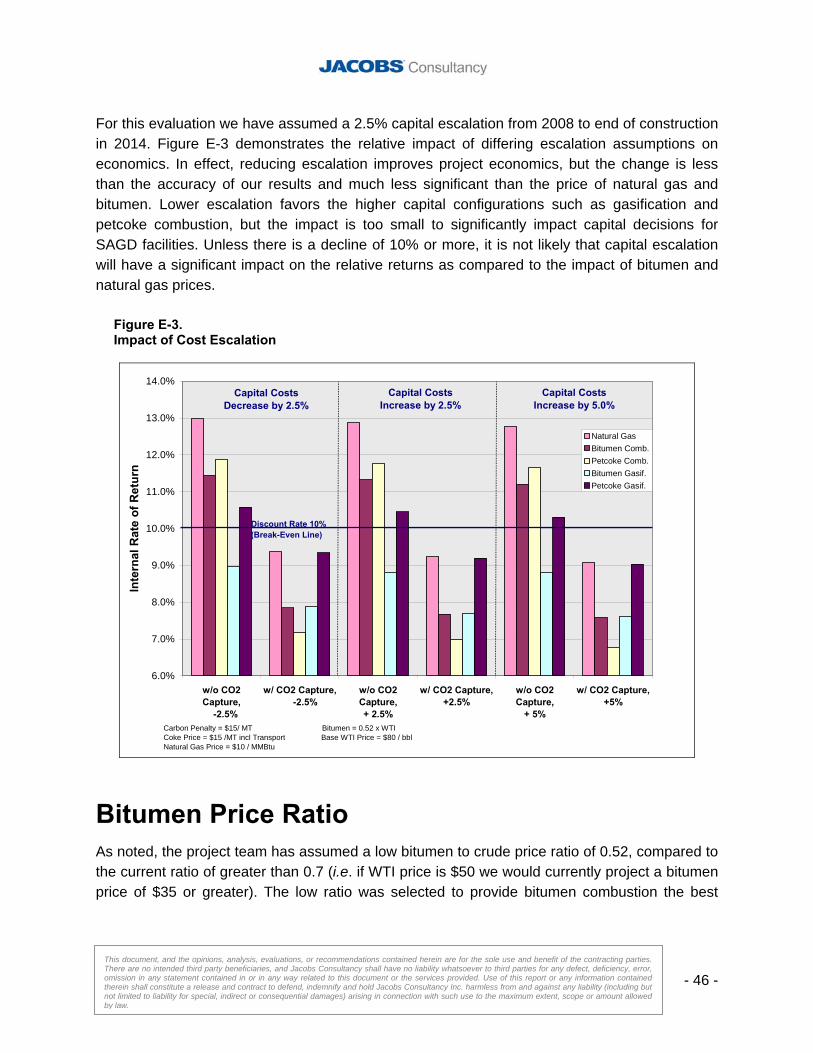
- 46 -
This document, and the opinions, analysis, evaluations, or recommendations contained herein are for the sole use and benefit of the contracting parties. There are no intended third party beneficiaries, and Jacobs Consultancy shall have no liability whatsoever to third parties for any defect, deficiency, error, omission in any statement contained in or in any way related to this document or the services provided. Use of this report or any information contained therein shall constitute a release and contract to defend, indemnify and hold Jacobs Consultancy Inc. harmless from and against any liability (including but not limited to liability for special, indirect or consequential damages) arising in connection with such use to the maximum extent, scope or amount allowed by law.
For this evaluation we have assumed a 2.5% capital escalation from 2008 to end of construction in 2014. Figure E-3 demonstrates the relative impact of differing escalation assumptions on economics. In effect, reducing escalation improves project economics, but the change is less than the accuracy of our results and much less significant than the price of natural gas and bitumen. Lower escalation favors the higher capital configurations such as gasification and petcoke combustion, but the impact is too small to significantly impact capital decisions for SAGD facilities. Unless there is a decline of 10% or more, it is not likely that capital escalation will have a significant impact on the relative returns as compared to the impact of bitumen and natural gas prices.
Figure E-3. Impact of Cost Escalation
6.0%
7.0%
8.0%
9.0%
10.0%
11.0%
12.0%
13.0%
14.0%
w/o CO2Capture, -2.5%
w/ CO2 Capture, -2.5%
w/o CO2Capture,+ 2.5%
w/ CO2 Capture,+2.5%
w/o CO2Capture,
+ 5%
w/ CO2 Capture,+5%
Inte
rnal
Rat
e of
Ret
urn
Natural GasBitumen Comb.Petcoke Comb.Bitumen Gasif.Petcoke Gasif.
Capital Costs Decrease by 2.5%
Capital Costs Increase by 2.5%
Capital Costs Increase by 5.0%
Carbon Penalty = $15/ MT Bitumen = 0.52 x WTICoke Price = $15 /MT incl Transport Base WTI Price = $80 / bblNatural Gas Price = $10 / MMBtu
Discount Rate 10%(Break-Even Line)
Bitumen Price Ratio As noted, the project team has assumed a low bitumen to crude price ratio of 0.52, compared to the current ratio of greater than 0.7 (i.e. if WTI price is $50 we would currently project a bitumen price of $35 or greater). The low ratio was selected to provide bitumen combustion the best
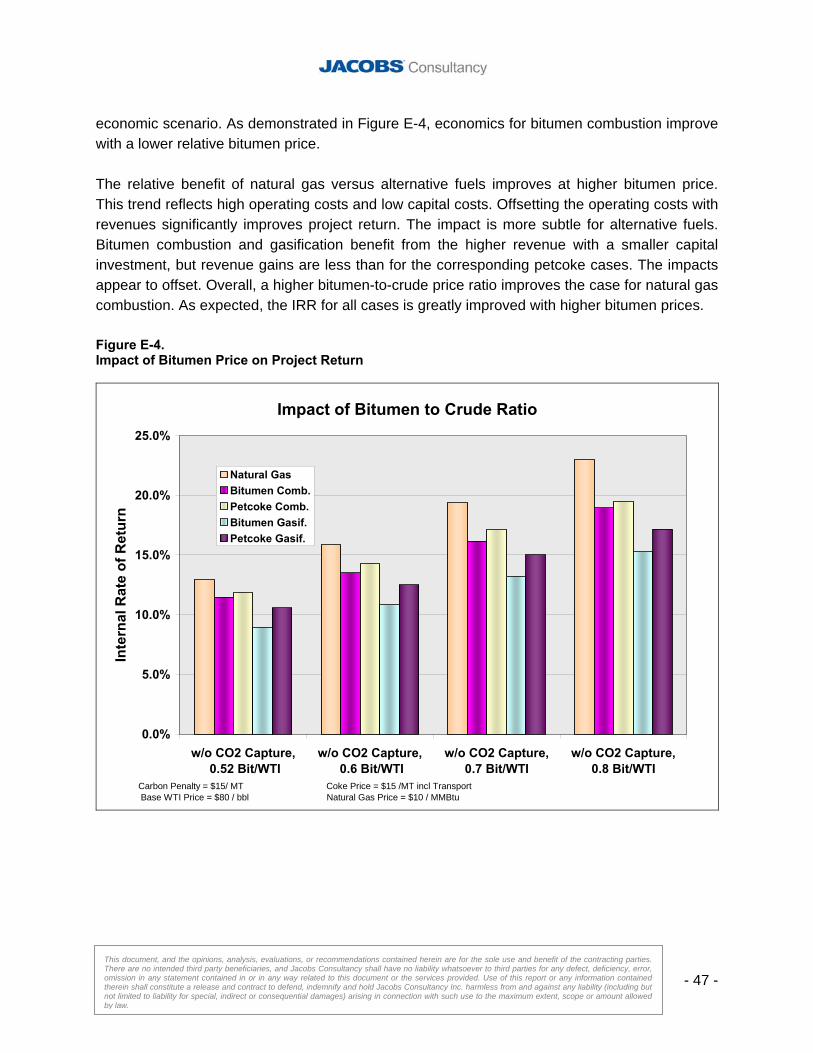
- 47 -
This document, and the opinions, analysis, evaluations, or recommendations contained herein are for the sole use and benefit of the contracting parties. There are no intended third party beneficiaries, and Jacobs Consultancy shall have no liability whatsoever to third parties for any defect, deficiency, error, omission in any statement contained in or in any way related to this document or the services provided. Use of this report or any information contained therein shall constitute a release and contract to defend, indemnify and hold Jacobs Consultancy Inc. harmless from and against any liability (including but not limited to liability for special, indirect or consequential damages) arising in connection with such use to the maximum extent, scope or amount allowed by law.
economic scenario. As demonstrated in Figure E-4, economics for bitumen combustion improve with a lower relative bitumen price. The relative benefit of natural gas versus alternative fuels improves at higher bitumen price. This trend reflects high operating costs and low capital costs. Offsetting the operating costs with revenues significantly improves project return. The impact is more subtle for alternative fuels. Bitumen combustion and gasification benefit from the higher revenue with a smaller capital investment, but revenue gains are less than for the corresponding petcoke cases. The impacts appear to offset. Overall, a higher bitumen-to-crude price ratio improves the case for natural gas combustion. As expected, the IRR for all cases is greatly improved with higher bitumen prices. Figure E-4. Impact of Bitumen Price on Project Return
Impact of Bitumen to Crude Ratio
0.0%
5.0%
10.0%
15.0%
20.0%
25.0%
w/o CO2 Capture, 0.52 Bit/WTI
w/o CO2 Capture, 0.6 Bit/WTI
w/o CO2 Capture,0.7 Bit/WTI
w/o CO2 Capture,0.8 Bit/WTI
Inte
rnal
Rat
e of
Ret
urn
Natural GasBitumen Comb.Petcoke Comb.Bitumen Gasif.Petcoke Gasif.
Carbon Penalty = $15/ MT Coke Price = $15 /MT incl Transport Base WTI Price = $80 / bbl Natural Gas Price = $10 / MMBtu
- 48 -
This document, and the opinions, analysis, evaluations, or recommendations contained herein are for the sole use and benefit of the contracting parties. There are no intended third party beneficiaries, and Jacobs Consultancy shall have no liability whatsoever to third parties for any defect, deficiency, error, omission in any statement contained in or in any way related to this document or the services provided. Use of this report or any information contained therein shall constitute a release and contract to defend, indemnify and hold Jacobs Consultancy Inc. harmless from and against any liability (including but not limited to liability for special, indirect or consequential damages) arising in connection with such use to the maximum extent, scope or amount allowed by law.
Section F.
Decision Matrix Analysis
- 49 -
This document, and the opinions, analysis, evaluations, or recommendations contained herein are for the sole use and benefit of the contracting parties. There are no intended third party beneficiaries, and Jacobs Consultancy shall have no liability whatsoever to third parties for any defect, deficiency, error, omission in any statement contained in or in any way related to this document or the services provided. Use of this report or any information contained therein shall constitute a release and contract to defend, indemnify and hold Jacobs Consultancy Inc. harmless from and against any liability (including but not limited to liability for special, indirect or consequential damages) arising in connection with such use to the maximum extent, scope or amount allowed by law.
Decision Matrix Methodology The project team used the Failure Means and Effects Analysis (FMEA) to create a decision matrix ranking of the alternative fuels configurations (Refer Figure F-1). The purposes in ranking were to establish a preferred configuration as well as the criteria to be used as evaluating future configurations. The Decision Matrix process consists of the following steps:
• Assemble Team—Assemble a multi-disciplinary audit team composed of stake-holders and technical experts, both from within and outside the client organization. It is critical to include as many people directly involved with the project facility as possible. The goal is both to create buy-in among stake-holders and to identify and address concerns surrounding the project.
• Define Key Impacts—Considering the proposed scope of the project, the team should define all parameters that could have an impact on any part of the organization environment as a whole. The project team will provide the majority of these impacts with the audit team adding any additional concern.
• Assign Importance Ranking to Impacts—The audit team will rank the importance of each impact relative to the refinery and organizational culture. This step is critical to identifying issues that are most important to a specific site. For purposes of this analysis, the numeric scale was as follows:
Must Have Project must meet this criteria 10 Considered critical to project success 7 Important to the site but not critical
4 Somewhat important to the site 1 Not of importance to the site
• Rate Each Project for Each Impact—Independent of the importance, criteria ratings are
to be determined for each impact. The criteria should be specific to the impact, quantifiable and capable of differentiating the projects. The rating criteria will be selected to create an appropriate spread in project ratings, and the more positive the criteria the higher the rating. The project with the lowest operating cost should have the highest ranking for OPEX impact.
• Calculate and Sum the Impacts—For each project, the project rating for an impact is multiplied by the site importance rating for that impact. These products are then summed to determine the total rating for the project
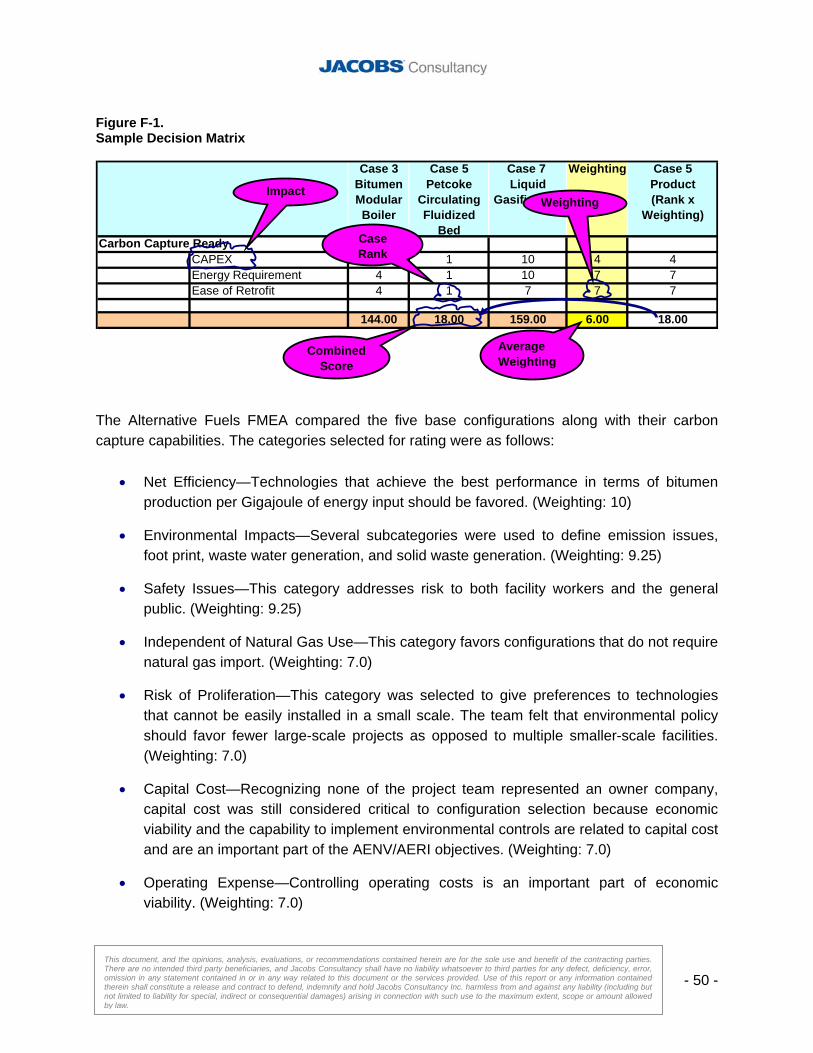
- 50 -
This document, and the opinions, analysis, evaluations, or recommendations contained herein are for the sole use and benefit of the contracting parties. There are no intended third party beneficiaries, and Jacobs Consultancy shall have no liability whatsoever to third parties for any defect, deficiency, error, omission in any statement contained in or in any way related to this document or the services provided. Use of this report or any information contained therein shall constitute a release and contract to defend, indemnify and hold Jacobs Consultancy Inc. harmless from and against any liability (including but not limited to liability for special, indirect or consequential damages) arising in connection with such use to the maximum extent, scope or amount allowed by law.
Figure F-1. Sample Decision Matrix
Case 3 Case 5 Case 7 Weighting Case 5
Bitumen Modular Boiler
Petcoke Circulating Fluidized
Bed
Liquid Gasification
Product(Rank x
Weighting)
Carbon Capture ReadyCAPEX 4 1 10 4 4Energy Requirement 4 1 10 7 7Ease of Retrofit 4 1 7 7 7
144.00 18.00 159.00 6.00 18.00
Weighting
Case Rank
Impact
CombinedScore
Average Weighting
The Alternative Fuels FMEA compared the five base configurations along with their carbon capture capabilities. The categories selected for rating were as follows:
• Net Efficiency—Technologies that achieve the best performance in terms of bitumen production per Gigajoule of energy input should be favored. (Weighting: 10)
• Environmental Impacts—Several subcategories were used to define emission issues, foot print, waste water generation, and solid waste generation. (Weighting: 9.25)
• Safety Issues—This category addresses risk to both facility workers and the general public. (Weighting: 9.25)
• Independent of Natural Gas Use—This category favors configurations that do not require natural gas import. (Weighting: 7.0)
• Risk of Proliferation—This category was selected to give preferences to technologies that cannot be easily installed in a small scale. The team felt that environmental policy should favor fewer large-scale projects as opposed to multiple smaller-scale facilities. (Weighting: 7.0)
• Capital Cost—Recognizing none of the project team represented an owner company, capital cost was still considered critical to configuration selection because economic viability and the capability to implement environmental controls are related to capital cost and are an important part of the AENV/AERI objectives. (Weighting: 7.0)
• Operating Expense—Controlling operating costs is an important part of economic viability. (Weighting: 7.0)
- 51 -
This document, and the opinions, analysis, evaluations, or recommendations contained herein are for the sole use and benefit of the contracting parties. There are no intended third party beneficiaries, and Jacobs Consultancy shall have no liability whatsoever to third parties for any defect, deficiency, error, omission in any statement contained in or in any way related to this document or the services provided. Use of this report or any information contained therein shall constitute a release and contract to defend, indemnify and hold Jacobs Consultancy Inc. harmless from and against any liability (including but not limited to liability for special, indirect or consequential damages) arising in connection with such use to the maximum extent, scope or amount allowed by law.
• Operational Complexity—More complex configurations will have higher requirements for operating, maintenance and technical support, and are more prone to safety and environmental incidents. (Weighting: 7.0)
• Reliability—Facility reliability (estimated by equipment number and technical risk) refers to the capability of a configuration to meet target capacity while avoiding unplanned shutdowns. (Weighting: 6.0)
• Infrastructure Requirements—Recognizing that most oil sands projects are located in remote areas of Alberta, technologies requiring minimal infrastructure (roads, electrical supply, pipelines, etc.) are favored. (Weighting: 5.8)
• Carbon Capture Ready—Subcategories including CAPEX and ease of retrofit were selected to rank the capability of a given configuration to be adapted for carbon capture. (Weighting: 5.5)
Utilizing these categories, each configuration was ranked (note Carbon Capture cases were considered a category defining each case and therefore were not ranked independently). The full decision matrix is shown in Appendix 4. Figure F-2 shows the results of the ranking summing all categories. In effect, we give each subcategory full weighting as assigned by the FMEA team.
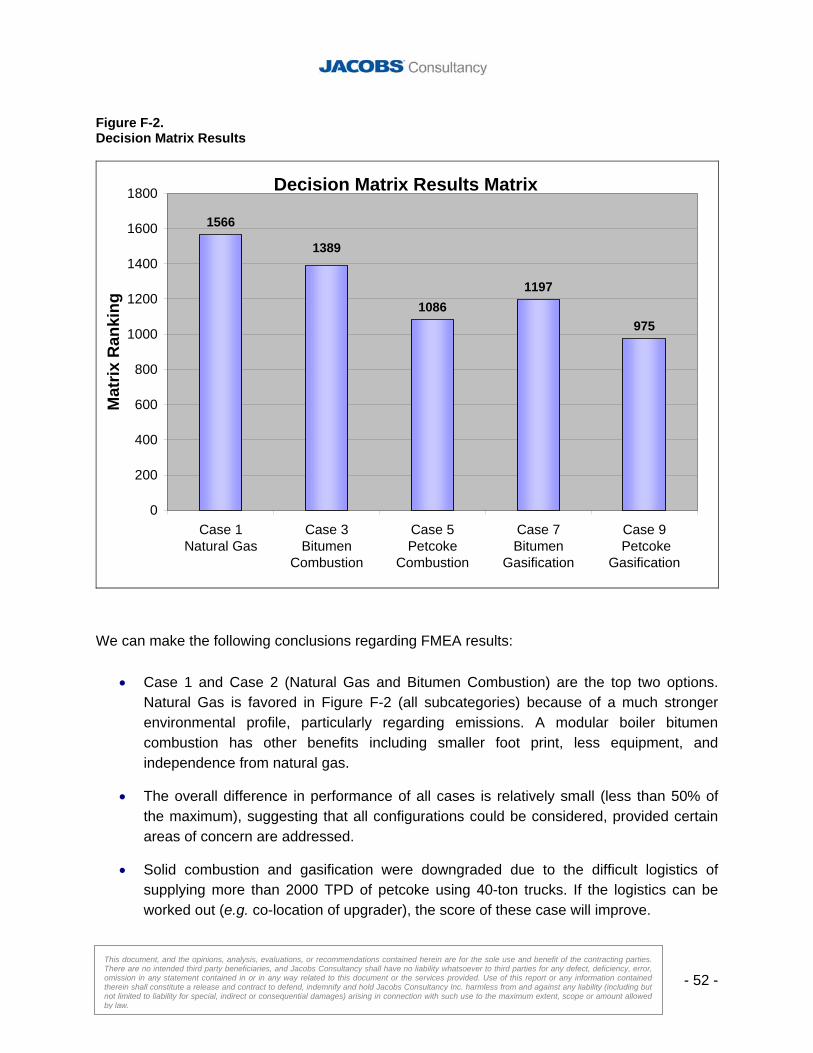
- 52 -
This document, and the opinions, analysis, evaluations, or recommendations contained herein are for the sole use and benefit of the contracting parties. There are no intended third party beneficiaries, and Jacobs Consultancy shall have no liability whatsoever to third parties for any defect, deficiency, error, omission in any statement contained in or in any way related to this document or the services provided. Use of this report or any information contained therein shall constitute a release and contract to defend, indemnify and hold Jacobs Consultancy Inc. harmless from and against any liability (including but not limited to liability for special, indirect or consequential damages) arising in connection with such use to the maximum extent, scope or amount allowed by law.
Figure F-2. Decision Matrix Results
Decision Matrix Results Matrix
1197
975
1389
1086
1566
0
200
400
600
800
1000
1200
1400
1600
1800
Case 1Natural Gas
Case 3Bitumen
Combustion
Case 5Petcoke
Combustion
Case 7Bitumen
Gasification
Case 9 Petcoke
Gasification
Mat
rix R
anki
ng
We can make the following conclusions regarding FMEA results:
• Case 1 and Case 2 (Natural Gas and Bitumen Combustion) are the top two options. Natural Gas is favored in Figure F-2 (all subcategories) because of a much stronger environmental profile, particularly regarding emissions. A modular boiler bitumen combustion has other benefits including smaller foot print, less equipment, and independence from natural gas.
• The overall difference in performance of all cases is relatively small (less than 50% of the maximum), suggesting that all configurations could be considered, provided certain areas of concern are addressed.
• Solid combustion and gasification were downgraded due to the difficult logistics of supplying more than 2000 TPD of petcoke using 40-ton trucks. If the logistics can be worked out (e.g. co-location of upgrader), the score of these case will improve.
- 53 -
This document, and the opinions, analysis, evaluations, or recommendations contained herein are for the sole use and benefit of the contracting parties. There are no intended third party beneficiaries, and Jacobs Consultancy shall have no liability whatsoever to third parties for any defect, deficiency, error, omission in any statement contained in or in any way related to this document or the services provided. Use of this report or any information contained therein shall constitute a release and contract to defend, indemnify and hold Jacobs Consultancy Inc. harmless from and against any liability (including but not limited to liability for special, indirect or consequential damages) arising in connection with such use to the maximum extent, scope or amount allowed by law.
• Gasification technologies, both liquid and solid, scored poorly in some categories because of their complexity and higher capital cost.
• The Carbon Capture category favors liquid gasification because of the relative ease of implementation and lower parasitic energy costs.
It should be noted that FMEA does not suggest that a technology or configuration is implicitly better, but instead points out the limitations of that configuration relative to other alternatives. The results should be with regard to the criteria that established the rankings. Rather than saying that a Petcoke CFB is not as desirable as a bitumen boiler, the FMEA should be used to identify the shortcomings of the CFB (carbon emissions, road traffic, etc.) and look into ways to correct these problems.

- 54 -
This document, and the opinions, analysis, evaluations, or recommendations contained herein are for the sole use and benefit of the contracting parties. There are no intended third party beneficiaries, and Jacobs Consultancy shall have no liability whatsoever to third parties for any defect, deficiency, error, omission in any statement contained in or in any way related to this document or the services provided. Use of this report or any information contained therein shall constitute a release and contract to defend, indemnify and hold Jacobs Consultancy Inc. harmless from and against any liability (including but not limited to liability for special, indirect or consequential damages) arising in connection with such use to the maximum extent, scope or amount allowed by law.
Section G.
Areas for Future Study
- 55 -
This document, and the opinions, analysis, evaluations, or recommendations contained herein are for the sole use and benefit of the contracting parties. There are no intended third party beneficiaries, and Jacobs Consultancy shall have no liability whatsoever to third parties for any defect, deficiency, error, omission in any statement contained in or in any way related to this document or the services provided. Use of this report or any information contained therein shall constitute a release and contract to defend, indemnify and hold Jacobs Consultancy Inc. harmless from and against any liability (including but not limited to liability for special, indirect or consequential damages) arising in connection with such use to the maximum extent, scope or amount allowed by law.
Strategic Considerations Results of this study have shown that there is not a strong economic incentive to drive new SAGD facilities to alternative fuels until natural gas prices rise to historical highs (above $10/GJ). Emission treating is a relatively small part of the extra cost, and reducing the capital and operating expense of emissions control will have little impact on the economic viability of alternative fuels, especially when compared to the impact of natural gas and crude oil pricing. To reduce dependence on natural gas, the following high level issues will need to be investigated.
Address Water Treating Considerations While evaporative water treating costs are higher than once-through steam generation, the waste water generation is less. Encouraging the industry (e.g. tax incentives, waste water reduction targets) to adopt evaporative water technologies will reduce waste water and improve the economics of alternative fuels.
Improve Gasification Capital Costs Gasification has a number of positive environmental advantages such as removal of sulfur in elemental form and easier integration of CO2 Capture. However, capital costs and complexity make it uncompetitive. Making gasification less expensive through technology research and centralization of facilities will be an important step towards implementing a government alternative fuels strategy.
Reduce Energy Costs of Carbon Capture Even for natural gas facilities, the energy costs for carbon capture are currently more than the economic incentive to recover CO2 (assumed $15/MT) meaning most producers will chose to pay the penalties. Technologies that can reduce regeneration and compression costs for CO2 will be required to make carbon capture compatible with alternative fuels combustion.
Investigate Alternative Methods of Petcoke Transport Based on projections of natural gas and crude prices, it is probable that petcoke will be the most economic fuel in the near future, especially if capital costs come down. To make large-scale
- 56 -
This document, and the opinions, analysis, evaluations, or recommendations contained herein are for the sole use and benefit of the contracting parties. There are no intended third party beneficiaries, and Jacobs Consultancy shall have no liability whatsoever to third parties for any defect, deficiency, error, omission in any statement contained in or in any way related to this document or the services provided. Use of this report or any information contained therein shall constitute a release and contract to defend, indemnify and hold Jacobs Consultancy Inc. harmless from and against any liability (including but not limited to liability for special, indirect or consequential damages) arising in connection with such use to the maximum extent, scope or amount allowed by law.
utilization of petcoke or other solid fuels, a suitable means of transport must be determined. Potential solutions to be investigated are rail-lines, gasification at a central facility, and a slurry pipeline.
Consider Transport of Stranded Liquid Fuels While bitumen combustion can be competitive, reducing product exports greatly diminishes facility profitability. An alternative method of liquid combustion is to transfer low value liquid products (e.g. SDA pitch, unconverted hydrocracker bottoms) from the upgraders in the industrial heartland to Oil Sands SAGD facilities. Like petcoke combustion, identifying lower cost fuels will improve the viability of alternative fuels.
Reduce CO2 Emissions by Improving SAGD Efficiency The SAGD process rejects significant amounts of “waste heat,” the heat with temperatures below what can be recovered in a useful form. The key to increasing heat recovery is to increase the temperature of the waste heat. New technologies, including reservoir operation, have made this step possible, and likely economically feasible. Further study is required to evaluate and rank these technologies and configurations.
Technologies to Be Investigated Consistent with improving the viability of alternative fuels and increasing the efficiency of SAGD facilities, AERI and AENV should encourage research and implementation of the following technologies:
Circulating Dry Scrubbing Wet scrubbing is technically and economically feasible, but the reliability in Alberta has not been established. There is a high potential for line freezing in sub-zero weather. Traditional dry scrubbing will not guarantee the recovery required for high sulfur fuels. Circulating dry scrubbing (CDS) may offer the increased recovery of wet scrubbing without the high water circulation risks. CDS is a commercial technology, but the facilities are few in number and have not demonstrated the reliability expected of other scrubbing technologies.
- 57 -
This document, and the opinions, analysis, evaluations, or recommendations contained herein are for the sole use and benefit of the contracting parties. There are no intended third party beneficiaries, and Jacobs Consultancy shall have no liability whatsoever to third parties for any defect, deficiency, error, omission in any statement contained in or in any way related to this document or the services provided. Use of this report or any information contained therein shall constitute a release and contract to defend, indemnify and hold Jacobs Consultancy Inc. harmless from and against any liability (including but not limited to liability for special, indirect or consequential damages) arising in connection with such use to the maximum extent, scope or amount allowed by law.
Improved Gasification Several gasification technologies in development, such as Rocketdyne and Bluegas™, have the potential to greatly reduce the costs and reliability issues of gasification systems.
MSAR Technology MSAR technology, licensed by Quadrise, has been shown to dramatically improve NOX emissions from liquid fuels, reducing emissions up to 50 percent. MSAR can also facilitate the transfer of low quality or stranded fuel oils to SAGD facilities, and may also allow producers to burn bitumen in OTSG facilities.
Chilled Ammonia The key to improving the economics of carbon capture will be the ability to minimize parasitic energy costs, namely solvent regeneration and CO2 compression. Chilled ammonia is a technology that can reduce both of these costs. Furthermore, chilling costs in Alberta will be significantly less than other locations, providing additional reductions in OPEX and CAPEX. .
Downhole Pump Technologies While not specific to alternative fuels, improvements in the reliability of downhole pumps will improve the overall energy efficiency of SAGD facilities, reducing the amount of waste heat lost to the atmosphere.

- 58 -
This document, and the opinions, analysis, evaluations, or recommendations contained herein are for the sole use and benefit of the contracting parties. There are no intended third party beneficiaries, and Jacobs Consultancy shall have no liability whatsoever to third parties for any defect, deficiency, error, omission in any statement contained in or in any way related to this document or the services provided. Use of this report or any information contained therein shall constitute a release and contract to defend, indemnify and hold Jacobs Consultancy Inc. harmless from and against any liability (including but not limited to liability for special, indirect or consequential damages) arising in connection with such use to the maximum extent, scope or amount allowed by law.
Section H.
Conclusions
- 59 -
This document, and the opinions, analysis, evaluations, or recommendations contained herein are for the sole use and benefit of the contracting parties. There are no intended third party beneficiaries, and Jacobs Consultancy shall have no liability whatsoever to third parties for any defect, deficiency, error, omission in any statement contained in or in any way related to this document or the services provided. Use of this report or any information contained therein shall constitute a release and contract to defend, indemnify and hold Jacobs Consultancy Inc. harmless from and against any liability (including but not limited to liability for special, indirect or consequential damages) arising in connection with such use to the maximum extent, scope or amount allowed by law.
From our alternative fuels configuration study, we can make the following conclusions about the use of alternative fuels in Oil Sands production applications:
1. Alternative fuels combustion is economically feasible (i.e. yields a return greater than 10%) if product price is sufficiently high, but natural gas combustion will be favored in most pricing scenarios, based on historical trends.
2. Natural gas has the lowest air emissions and capital costs of all the configurations evaluated.
3. Bitumen combustion achieves many of the AERI and AENV objectives (Independent of Natural Gas, Lower Capital Costs, etc.) and can be retrofit with existing natural gas facilities. However, economic returns are less than natural gas and petcoke combustion because of lost revenue from burning bitumen. Currently bitumen price is high relative to crude and natural gas, which makes the economics of bitumen combustion difficult to justify. In effect, the bitumen configuration is squeezed between low bitumen prices where returns are too low to justify investment and high prices when other fuels (petcoke and natural gas) offer better returns.
4. Petcoke combustion in a CFB will become competitive with natural gas at higher crude and natural gas prices. Fuel transport logistics will be a major challenge to petcoke utilization.
5. Petcoke combustion produces double the CO2 of natural gas while bitumen combustion produces 55% more CO2 than natural gas. Even with 80% carbon capture, the petcoke combustion case has similar CO2 emissions to the natural gas case without capture.
6. Gasification is not economically competitive with combustion technologies unless carbon capture is a requirement. In addition, increased plant complexity and capital costs will make it difficult to implement in Oil Sands production facilities.
7. For new plants, air emission control investments do not significantly impact economics.
8. Carbon capture has the equivalent impact of an $8/bbl drop in the price of bitumen for a natural gas SAGD facility. The drop increases to $12 for bitumen combustion and $16/bbl for petcoke combustion. CO2 capture configurations, gasification and combustion are all economically infeasible (below a 10% IRR at $80/bbl WTI).
9. The assumed economic penalty for CO2 emissions ($15 per MT) does not cover the increased operating expense associated with carbon capture.
The following steps can be taken to make alternative fuel combustion more competitive:
- 60 -
This document, and the opinions, analysis, evaluations, or recommendations contained herein are for the sole use and benefit of the contracting parties. There are no intended third party beneficiaries, and Jacobs Consultancy shall have no liability whatsoever to third parties for any defect, deficiency, error, omission in any statement contained in or in any way related to this document or the services provided. Use of this report or any information contained therein shall constitute a release and contract to defend, indemnify and hold Jacobs Consultancy Inc. harmless from and against any liability (including but not limited to liability for special, indirect or consequential damages) arising in connection with such use to the maximum extent, scope or amount allowed by law.
1. Investigate alternative supply methods for bringing liquid and solid fuels to the Oil Sands production areas.
2. Encourage research into lower energy-intensive methods of carbon capture such as chilled ammonia scrubbing and Oxyfuel combustion.
3. Test Circulating Dry Scrubbers in Alberta flue gas treating applications to determine their effectiveness and reliability relative to wet flue gas scrubbers.
4. Evaluate technology to make gasification more cost effective and less complex relative to combustion.
5. Study process and operating modifications to improve the overall energy efficiency of steam generation and bitumen production.
While escalation did not shift comparative results, lower capital costs will substantially improve economic viability. Government and the industry can best meet objectives for conserving natural gas resources by encouraging and coordinating alternative fuels investment during economic downturns, when labor rates and equipment prices are more reasonable.
Appendix 1.
Assay Information
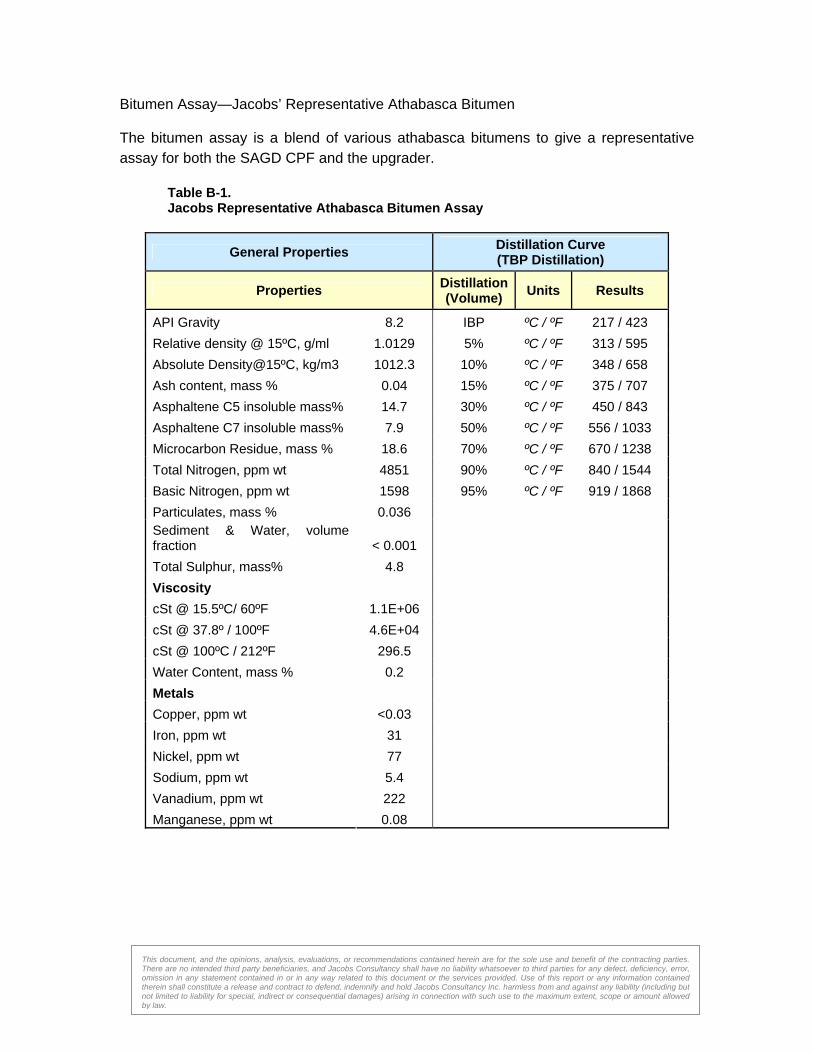
This document, and the opinions, analysis, evaluations, or recommendations contained herein are for the sole use and benefit of the contracting parties. There are no intended third party beneficiaries, and Jacobs Consultancy shall have no liability whatsoever to third parties for any defect, deficiency, error, omission in any statement contained in or in any way related to this document or the services provided. Use of this report or any information contained therein shall constitute a release and contract to defend, indemnify and hold Jacobs Consultancy Inc. harmless from and against any liability (including but not limited to liability for special, indirect or consequential damages) arising in connection with such use to the maximum extent, scope or amount allowed by law.
Bitumen Assay—Jacobs’ Representative Athabasca Bitumen The bitumen assay is a blend of various athabasca bitumens to give a representative assay for both the SAGD CPF and the upgrader.
Table B-1. Jacobs Representative Athabasca Bitumen Assay
General Properties Distillation Curve (TBP Distillation)
Properties Distillation(Volume) Units Results
API Gravity 8.2 IBP ºC / ºF 217 / 423 Relative density @ 15ºC, g/ml 1.0129 5% ºC / ºF 313 / 595 Absolute Density@15ºC, kg/m3 1012.3 10% ºC / ºF 348 / 658 Ash content, mass % 0.04 15% ºC / ºF 375 / 707 Asphaltene C5 insoluble mass% 14.7 30% ºC / ºF 450 / 843 Asphaltene C7 insoluble mass% 7.9 50% ºC / ºF 556 / 1033 Microcarbon Residue, mass % 18.6 70% ºC / ºF 670 / 1238 Total Nitrogen, ppm wt 4851 90% ºC / ºF 840 / 1544 Basic Nitrogen, ppm wt 1598 95% ºC / ºF 919 / 1868 Particulates, mass % 0.036 Sediment & Water, volume fraction < 0.001 Total Sulphur, mass% 4.8 Viscosity cSt @ 15.5ºC/ 60ºF 1.1E+06 cSt @ 37.8º / 100ºF 4.6E+04 cSt @ 100ºC / 212ºF 296.5 Water Content, mass % 0.2 Metals Copper, ppm wt <0.03 Iron, ppm wt 31 Nickel, ppm wt 77 Sodium, ppm wt 5.4 Vanadium, ppm wt 222 Manganese, ppm wt 0.08
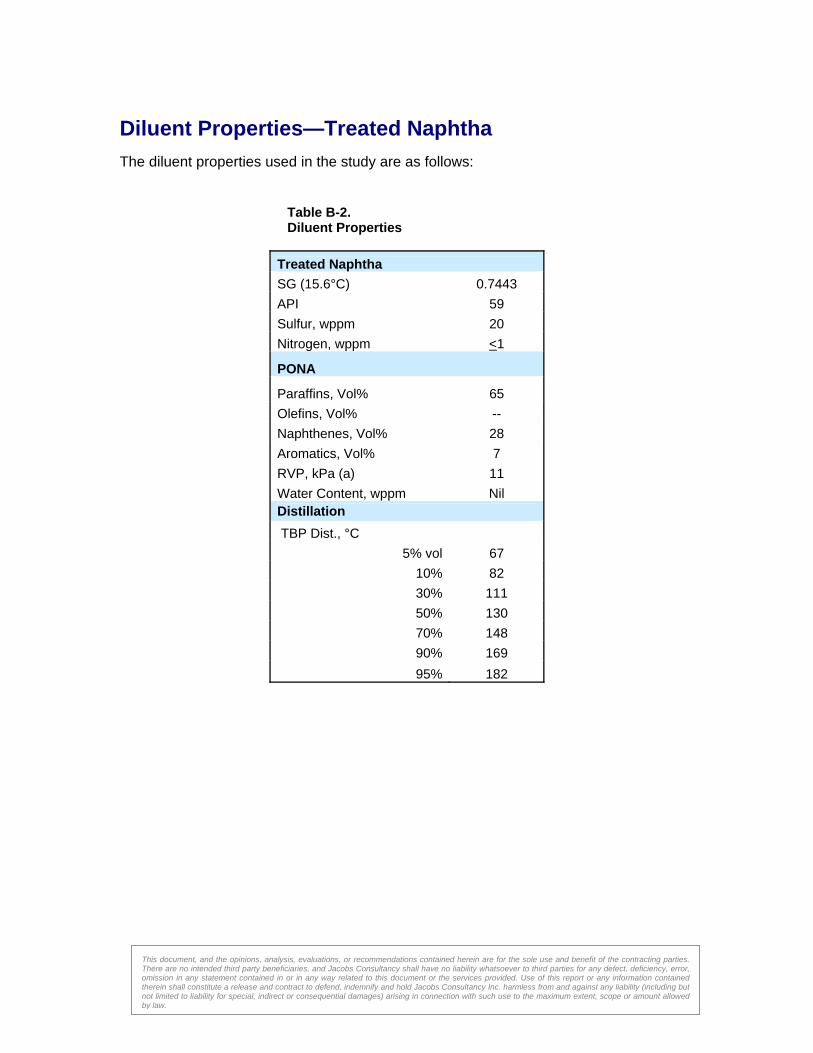
This document, and the opinions, analysis, evaluations, or recommendations contained herein are for the sole use and benefit of the contracting parties. There are no intended third party beneficiaries, and Jacobs Consultancy shall have no liability whatsoever to third parties for any defect, deficiency, error, omission in any statement contained in or in any way related to this document or the services provided. Use of this report or any information contained therein shall constitute a release and contract to defend, indemnify and hold Jacobs Consultancy Inc. harmless from and against any liability (including but not limited to liability for special, indirect or consequential damages) arising in connection with such use to the maximum extent, scope or amount allowed by law.
Diluent Properties—Treated Naphtha The diluent properties used in the study are as follows:
Table B-2. Diluent Properties
Treated Naphtha SG (15.6°C) 0.7443 API 59 Sulfur, wppm 20 Nitrogen, wppm <1
PONA
Paraffins, Vol% 65 Olefins, Vol% -- Naphthenes, Vol% 28 Aromatics, Vol% 7 RVP, kPa (a) 11 Water Content, wppm Nil Distillation TBP Dist., °C
5% vol 67 10% 82 30% 111 50% 130 70% 148 90% 169 95% 182
Appendix 2.
Block Flow Diagrams
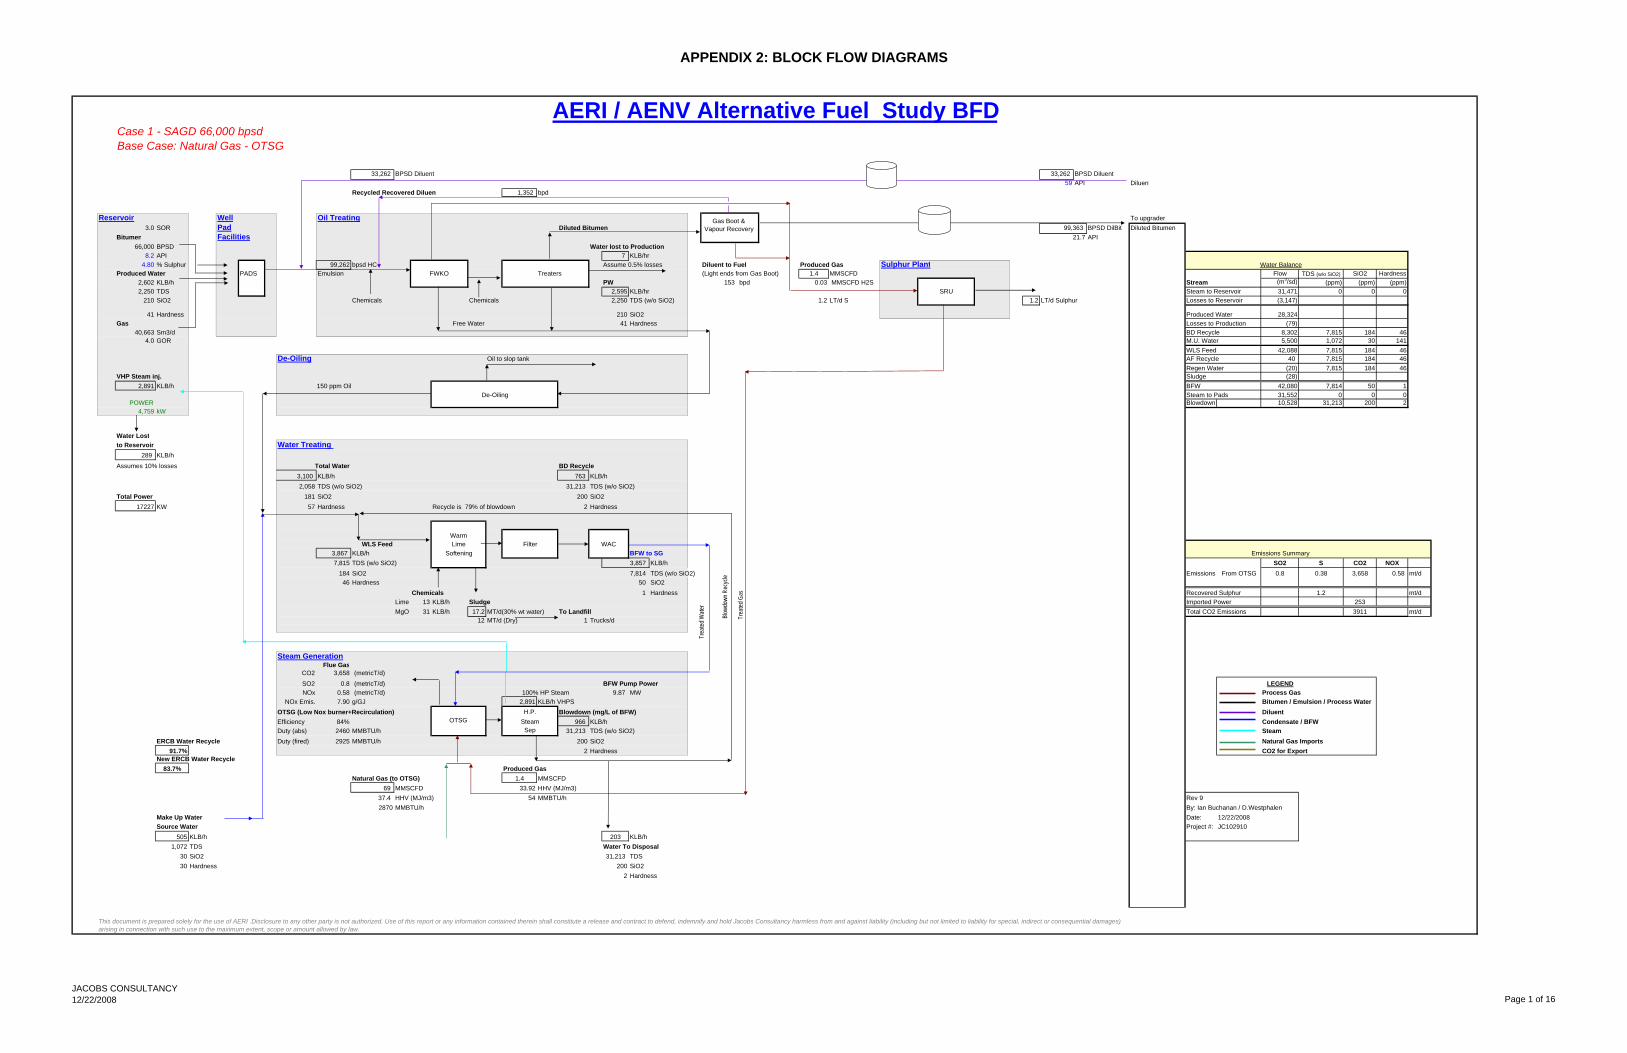
APPENDIX 2: BLOCK FLOW DIAGRAMS
Case 1 - SAGD 66,000 bpsdBase Case: Natural Gas - OTSG
33,262 BPSD Diluent 33,262 BPSD Diluent59 API Diluent
Recycled Recovered Diluent 1,352 bpd
Reservoir Well Oil Treating To upgrader3.0 SOR Pad Diluted Bitumen 99,363 BPSD DilBit Diluted Bitumen
Bitumen Facilities API 66,000 BPSD Water lost to Production
8.2 API 7 KLB/hr4.80 % Sulphur 99,262 bpsd HC Assume 0.5% losses Diluent to Fuel Produced Gas Sulphur Plant Water Balance
Produced Water PADS Emulsion FWKO Treaters (Light ends from Gas Boot) 1.4 MMSCFD Flow TDS (w/o SiO2) SiO2 Hardness2,602 KLB/h PW 153 bpd 0.03 MMSCFD H2S Stream (m3/sd) (ppm) (ppm) (ppm)2,250 TDS 2,595 KLB/hr SRU Steam to Reservoir 31,471 0 0 0
210 SiO2 Chemicals Chemicals 2,250 TDS (w/o SiO2) 1.2 LT/d S 1.2 LT/d Sulphur Losses to Reservoir (3,147)
41 Hardness 210 SiO2 Produced Water 28,324Gas Free Water 41 Hardness Losses to Production (79)
40,663 Sm3/d BD Recycle 8,302 7,815 184 464.0 GOR M.U. Water 5,500 1,072 30 141
WLS Feed 42,088 7,815 184 46De-Oiling Oil to slop tank AF Recycle 40 7,815 184 46
Regen Water (20) 7,815 184 46VHP Steam inj. Sludge (28)
2,891 KLB/h 150 ppm Oil BFW 42,080 7,814 50 1De-Oiling Steam to Pads 31,552 0 0 0
POWER Blowdown 10,528 31,213 200 24,759 kW
Water Lostto Reservoir Water Treating
289 KLB/h
Assumes 10% losses Total Water BD Recycle3,100 KLB/h 763 KLB/h2,058 TDS (w/o SiO2) 31,213 TDS (w/o SiO2)
Total Power 181 SiO2 200 SiO217227 KW 57 Hardness Recycle is 79% of blowdown 2 Hardness
WarmWLS Feed Lime Filter WAC
3,867 KLB/h Softening BFW to SG Emissions Summary7,815 TDS (w/o SiO2) KLB/h SO2 S CO2 NOX
184 SiO2 TDS (w/o SiO2) Emissions From OTSG 0.8 0.38 3,658 0.58 mt/d46 Hardness SiO2
Chemicals Hardness Recovered Sulphur 1.2 mt/dLime 13 KLB/h Sludge Imported Power 253MgO 31 KLB/h 17.2 MT/d(30% wt water) To Landfill Total CO2 Emissions 3911 mt/d
12 MT/d (Dry) 1 Trucks/d
Steam GenerationFlue Gas
CO2 3,658 (metricT/d)
SO2 0.8 (metricT/d) BFW Pump Power LEGENDNOx 0.58 (metricT/d) 100% HP Steam 9.87 MW Process Gas
NOx Emis. 7.90 g/GJ 2,891 KLB/h VHPS Bitumen / Emulsion / Process WaterOTSG (Low Nox burner+Recirculation) H.P. DiluentEfficiency 84% OTSG Steam 966 KLB/h Condensate / BFWDuty (abs) 2460 MMBTU/h Sep 31,213 TDS (w/o SiO2) Steam
ERCB Water Recycle Duty (fired) 2925 MMBTU/h 200 SiO2 Natural Gas Imports91.7% 2 Hardness CO2 for Export
New ERCB Water Recycle83.7% Produced Gas
Natural Gas (to OTSG) 1.4 MMSCFD69 MMSCFD 33.92 HHV (MJ/m3)
37.4 HHV (MJ/m3) 54 MMBTU/h Rev 92870 MMBTU/h By: Ian Buchanan / D.Westphalen
Make Up Water Date: 12/22/2008Source Water Project #: JC102910
505 KLB/h 203 KLB/h1,072 TDS Water To Disposal
30 SiO2 31,213 TDS30 Hardness 200 SiO2
2 Hardness
21.7
3,857 7,814
This document is prepared solely for the use of AERI .Disclosure to any other party is not authorized. Use of this report or any information contained therein shall constitute a release and contract to defend, indemnify and hold Jacobs Consultancy harmless from and against liability (including but not limited to liability for special, indirect or consequential damages) arising in connection with such use to the maximum extent, scope or amount allowed by law.
Blowdown (mg/L of BFW)
50 1
0.0
AERI / AENV Alternative Fuel Study BFD
Blow
down
Rec
ycle
Trea
ted W
ater
Trea
ted G
as
Gas Boot & Vapour Recovery
JACOBS CONSULTANCY12/22/2008 Page 1 of 16
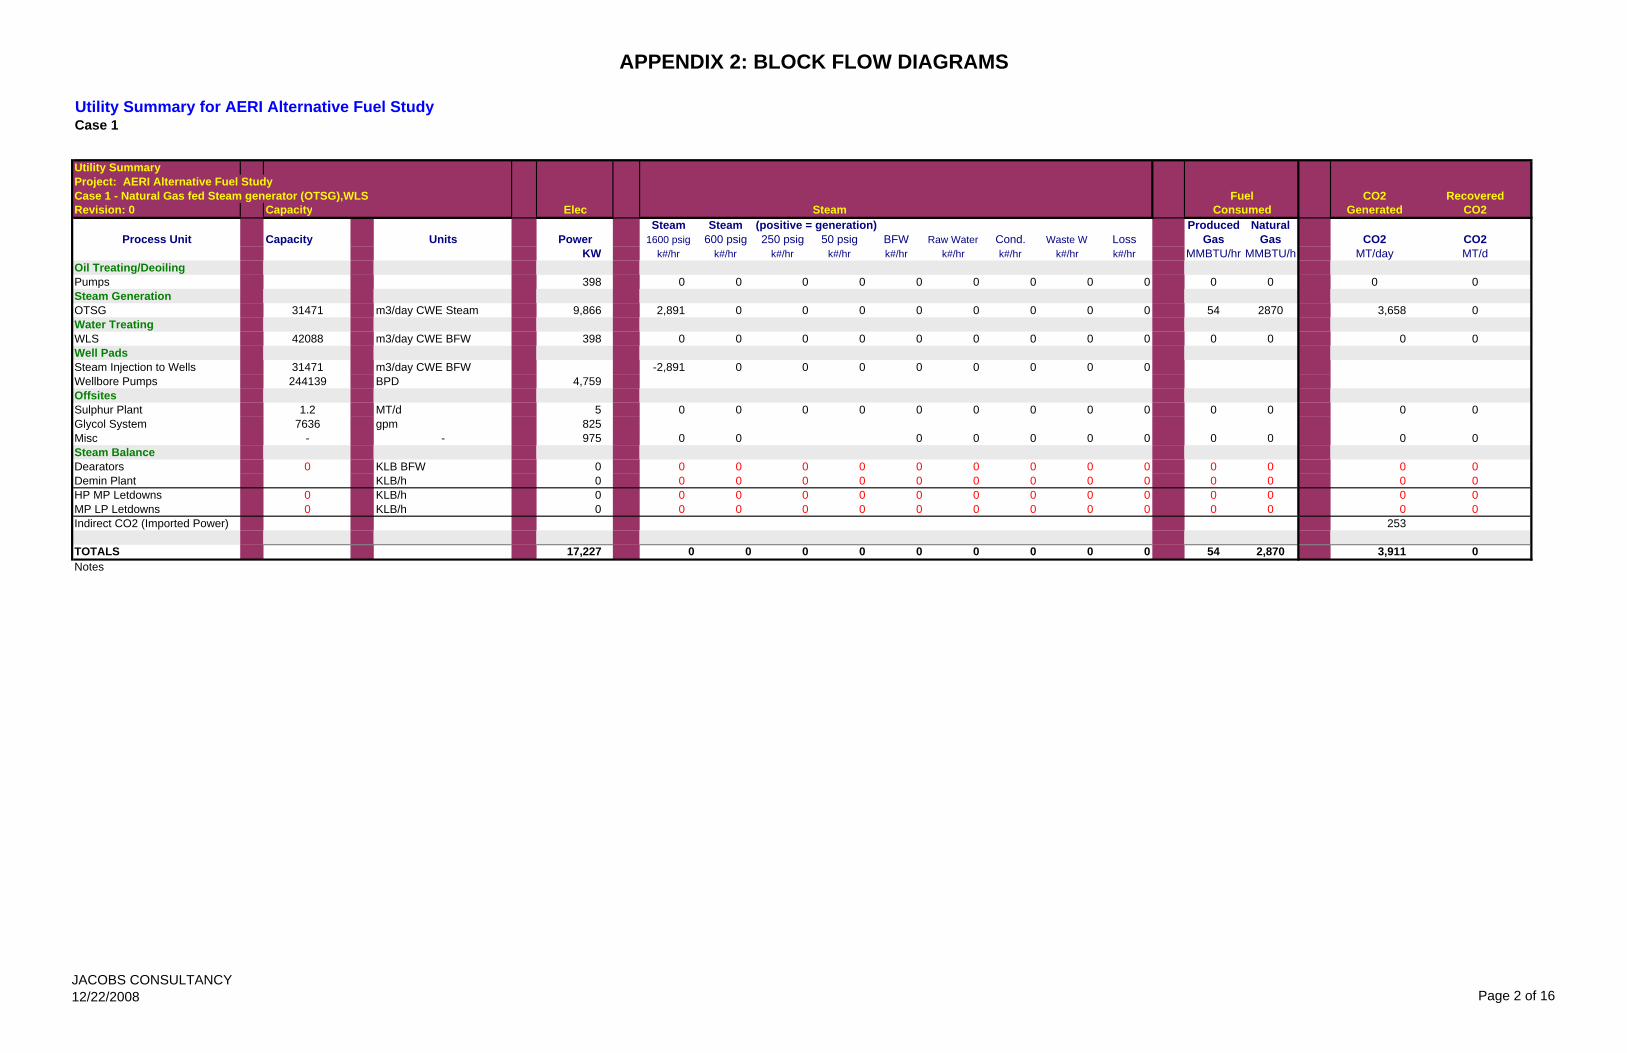
APPENDIX 2: BLOCK FLOW DIAGRAMS
Utility Summary for AERI Alternative Fuel Study Case 1
Utility SummaryProject: AERI Alternative Fuel StudyCase 1 - Natural Gas fed Steam generator (OTSG),WLS CO2 RecoveredRevision: 0 Capacity Elec Steam Generated CO2
Steam Steam (positive = generation) Produced NaturalProcess Unit Capacity Units Power 1600 psig 600 psig 250 psig 50 psig BFW Raw Water Cond. Waste W Loss Gas Gas CO2 CO2
KW k#/hr k#/hr k#/hr k#/hr k#/hr k#/hr k#/hr k#/hr k#/hr MMBTU/hr MMBTU/h MT/day MT/dOil Treating/DeoilingPumps 398 0 0 0 0 0 0 0 0 0 0 0 0 0Steam GenerationOTSG 31471 m3/day CWE Steam 9,866 2,891 0 0 0 0 0 0 0 0 54 2870 3,658 0Water TreatingWLS 42088 m3/day CWE BFW 398 0 0 0 0 0 0 0 0 0 0 0 0 0Well PadsSteam Injection to Wells 31471 m3/day CWE BFW -2,891 0 0 0 0 0 0 0 0Wellbore Pumps 244139 BPD 4,759Offsites Sulphur Plant 1.2 MT/d 5 0 0 0 0 0 0 0 0 0 0 0 0 0Glycol System 7636 gpm 825Misc - - 975 0 0 0 0 0 0 0 0 0 0 0Steam BalanceDearators 0 KLB BFW 0 0 0 0 0 0 0 0 0 0 0 0 0 0Demin Plant KLB/h 0 0 0 0 0 0 0 0 0 0 0 0 0 0HP MP Letdowns 0 KLB/h 0 0 0 0 0 0 0 0 0 0 0 0 0 0MP LP Letdowns 0 KLB/h 0 0 0 0 0 0 0 0 0 0 0 0 0 0Indirect CO2 (Imported Power) 253
TOTALS 17,227 0 0 0 0 0 0 0 0 0 54 2,870 3,911 0Notes
FuelConsumed
JACOBS CONSULTANCY12/22/2008 Page 2 of 16
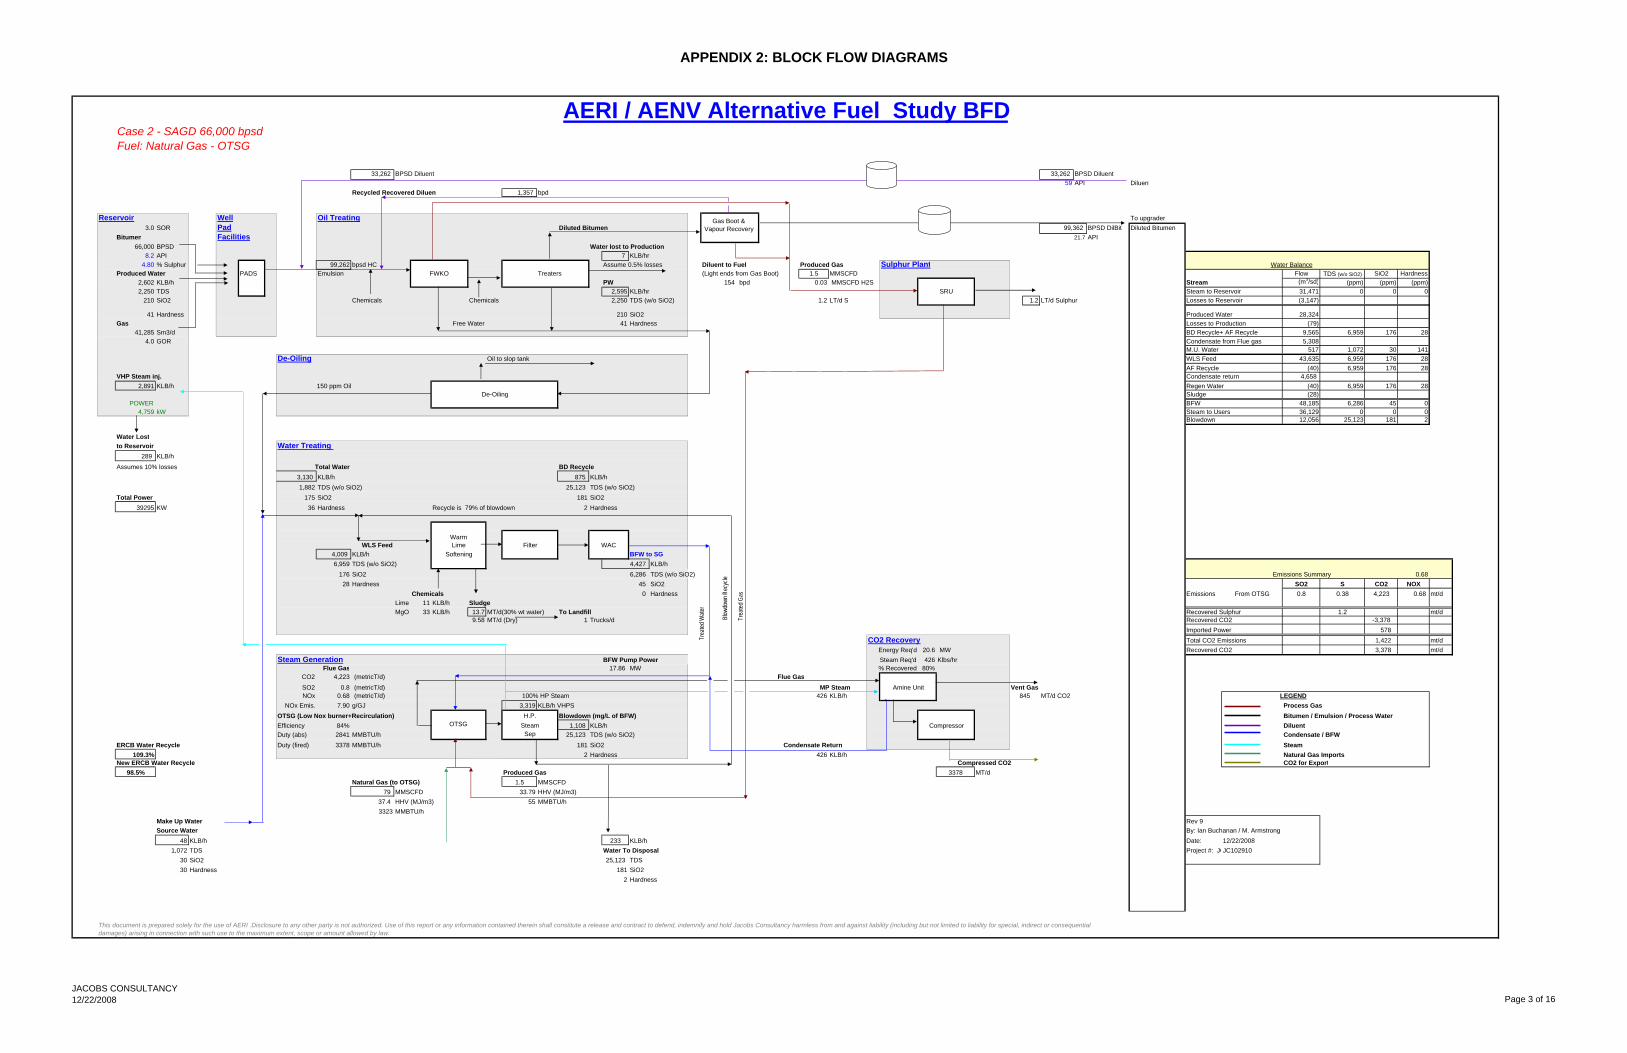
APPENDIX 2: BLOCK FLOW DIAGRAMS
Case 2 - SAGD 66,000 bpsdFuel: Natural Gas - OTSG
33,262 BPSD Diluent 33,262 BPSD Diluent59 API Diluent
Recycled Recovered Diluent 1,357 bpd
Reservoir Well Oil Treating To upgrader3.0 SOR Pad Diluted Bitumen 99,362 BPSD DilBit Diluted Bitumen
Bitumen Facilities API 66,000 BPSD Water lost to Production
8.2 API 7 KLB/hr4.80 % Sulphur 99,262 bpsd HC Assume 0.5% losses Diluent to Fuel Produced Gas Sulphur Plant Water Balance
Produced Water PADS Emulsion FWKO Treaters (Light ends from Gas Boot) 1.5 MMSCFD Flow TDS (w/o SiO2) SiO2 Hardness2,602 KLB/h PW 154 bpd 0.03 MMSCFD H2S Stream (m3/sd) (ppm) (ppm) (ppm)2,250 TDS 2,595 KLB/hr SRU Steam to Reservoir 31,471 0 0 0
210 SiO2 Chemicals Chemicals 2,250 TDS (w/o SiO2) 1.2 LT/d S 1.2 LT/d Sulphur Losses to Reservoir (3,147)
41 Hardness 210 SiO2 Produced Water 28,324Gas Free Water 41 Hardness Losses to Production (79)
41,285 Sm3/d BD Recycle+ AF Recycle 9,565 6,959 176 284.0 GOR 5,308
M.U. Water 517 1,072 30 141De-Oiling Oil to slop tank WLS Feed 43,635 6,959 176 28
AF Recycle (40) 6,959 176 28VHP Steam inj. Condensate return 4,658
2,891 KLB/h 150 ppm Oil Regen Water (40) 6,959 176 28De-Oiling Sludge (28)
POWER BFW 48,185 6,286 45 04,759 kW Steam to Users 36,129 0 0 0
Blowdown 12,056 25,123 181 2
Water Lostto Reservoir Water Treating
289 KLB/h
Assumes 10% losses Total Water BD Recycle3,130 KLB/h 875 KLB/h1,882 TDS (w/o SiO2) 25,123 TDS (w/o SiO2)
Total Power 175 SiO2 181 SiO239295 KW 36 Hardness Recycle is 79% of blowdown 2 Hardness
WarmWLS Feed Lime Filter WAC
4,009 KLB/h Softening BFW to SG6,959 TDS (w/o SiO2) KLB/h
176 SiO2 TDS (w/o SiO2) Emissions Summary 0.6828 Hardness SiO2 SO2 S CO2 NOX
Chemicals Hardness Emissions From OTSG 0.8 0.38 4,223 0.68 mt/dLime 11 KLB/h SludgeMgO 33 KLB/h 13.7 MT/d(30% wt water) To Landfill Recovered Sulphur 1.2 mt/d
9.58 MT/d (Dry) 1 Trucks/d Recovered CO2 -3,378Imported Power 578
CO2 Recovery Total CO2 Emissions 1,422 mt/dEnergy Req'd 20.6 MW Recovered CO2 3,378 mt/d
Steam Generation BFW Pump Power Steam Req'd 426 Klbs/hrFlue Gas 17.86 MW % Recovered 80%
CO2 4,223 (metricT/d) Flue GasSO2 0.8 (metricT/d) MP Steam Amine Unit Vent GasNOx 0.68 (metricT/d) 100% HP Steam 426 KLB/h 845 MT/d CO2 LEGEND
NOx Emis. 7.90 g/GJ 3,319 KLB/h VHPS Process GasOTSG (Low Nox burner+Recirculation) H.P. Bitumen / Emulsion / Process WaterEfficiency 84% OTSG Steam 1,108 KLB/h Compressor DiluentDuty (abs) 2841 MMBTU/h Sep 25,123 TDS (w/o SiO2) Condensate / BFW
ERCB Water Recycle Duty (fired) 3378 MMBTU/h 181 SiO2 Condensate Return Steam109.3% 2 Hardness 426 KLB/h Natural Gas Imports
New ERCB Water Recycle Compressed CO2 CO2 for Export98.5% Produced Gas 3378 MT/d
Natural Gas (to OTSG) 1.5 MMSCFD79 MMSCFD 33.79 HHV (MJ/m3)
37.4 HHV (MJ/m3) 55 MMBTU/h3323 MMBTU/h
Make Up Water Rev 9Source Water By: Ian Buchanan / M. Armstrong
48 KLB/h 233 KLB/h Date: 12/22/20081,072 TDS Water To Disposal Project #: JCJC102910
30 SiO2 25,123 TDS30 Hardness 181 SiO2
2 Hardness
21.7
AERI / AENV Alternative Fuel Study BFD
Blowdown (mg/L of BFW)
6,286 45 0
This document is prepared solely for the use of AERI .Disclosure to any other party is not authorized. Use of this report or any information contained therein shall constitute a release and contract to defend, indemnify and hold Jacobs Consultancy harmless from and against liability (including but not limited to liability for special, indirect or consequential damages) arising in connection with such use to the maximum extent, scope or amount allowed by law.
0.0
4,427
Condensate from Flue gas
Blow
down
Rec
ycle
Trea
ted W
ater
Trea
ted G
as
Gas Boot & Vapour Recovery
JACOBS CONSULTANCY12/22/2008 Page 3 of 16
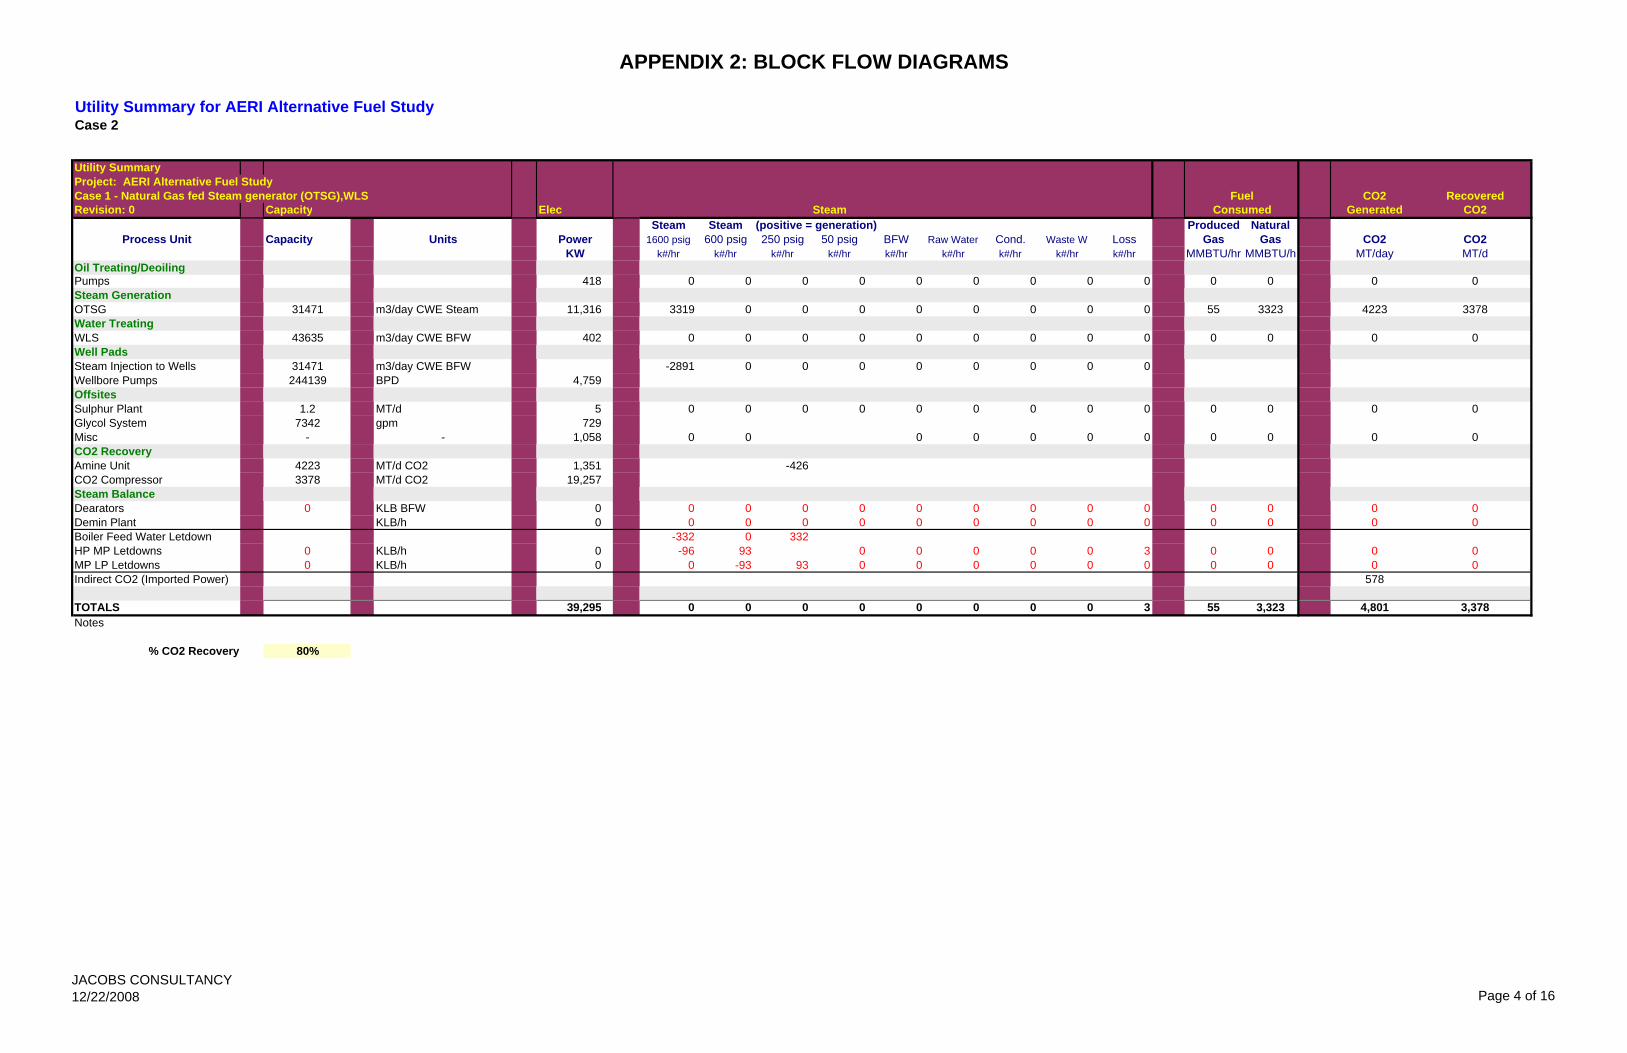
APPENDIX 2: BLOCK FLOW DIAGRAMS
Utility Summary for AERI Alternative Fuel Study Case 2
Utility SummaryProject: AERI Alternative Fuel StudyCase 1 - Natural Gas fed Steam generator (OTSG),WLS CO2 RecoveredRevision: 0 Capacity Elec Steam Generated CO2
Steam Steam (positive = generation) Produced NaturalProcess Unit Capacity Units Power 1600 psig 600 psig 250 psig 50 psig BFW Raw Water Cond. Waste W Loss Gas Gas CO2 CO2
KW k#/hr k#/hr k#/hr k#/hr k#/hr k#/hr k#/hr k#/hr k#/hr MMBTU/hr MMBTU/h MT/day MT/dOil Treating/DeoilingPumps 418 0 0 0 0 0 0 0 0 0 0 0 0 0Steam GenerationOTSG 31471 m3/day CWE Steam 11,316 3319 0 0 0 0 0 0 0 0 55 3323 4223 3378Water TreatingWLS 43635 m3/day CWE BFW 402 0 0 0 0 0 0 0 0 0 0 0 0 0Well PadsSteam Injection to Wells 31471 m3/day CWE BFW -2891 0 0 0 0 0 0 0 0Wellbore Pumps 244139 BPD 4,759Offsites Sulphur Plant 1.2 MT/d 5 0 0 0 0 0 0 0 0 0 0 0 0 0Glycol System 7342 gpm 729Misc - - 1,058 0 0 0 0 0 0 0 0 0 0 0CO2 RecoveryAmine Unit 4223 MT/d CO2 1,351 -426CO2 Compressor 3378 MT/d CO2 19,257Steam BalanceDearators 0 KLB BFW 0 0 0 0 0 0 0 0 0 0 0 0 0 0Demin Plant KLB/h 0 0 0 0 0 0 0 0 0 0 0 0 0 0Boiler Feed Water Letdown -332 0 332HP MP Letdowns 0 KLB/h 0 -96 93 0 0 0 0 0 3 0 0 0 0MP LP Letdowns 0 KLB/h 0 0 -93 93 0 0 0 0 0 0 0 0 0 0Indirect CO2 (Imported Power) 578
TOTALS 39,295 0 0 0 0 0 0 0 0 3 55 3,323 4,801 3,378Notes
% CO2 Recovery 80%
FuelConsumed
JACOBS CONSULTANCY12/22/2008 Page 4 of 16
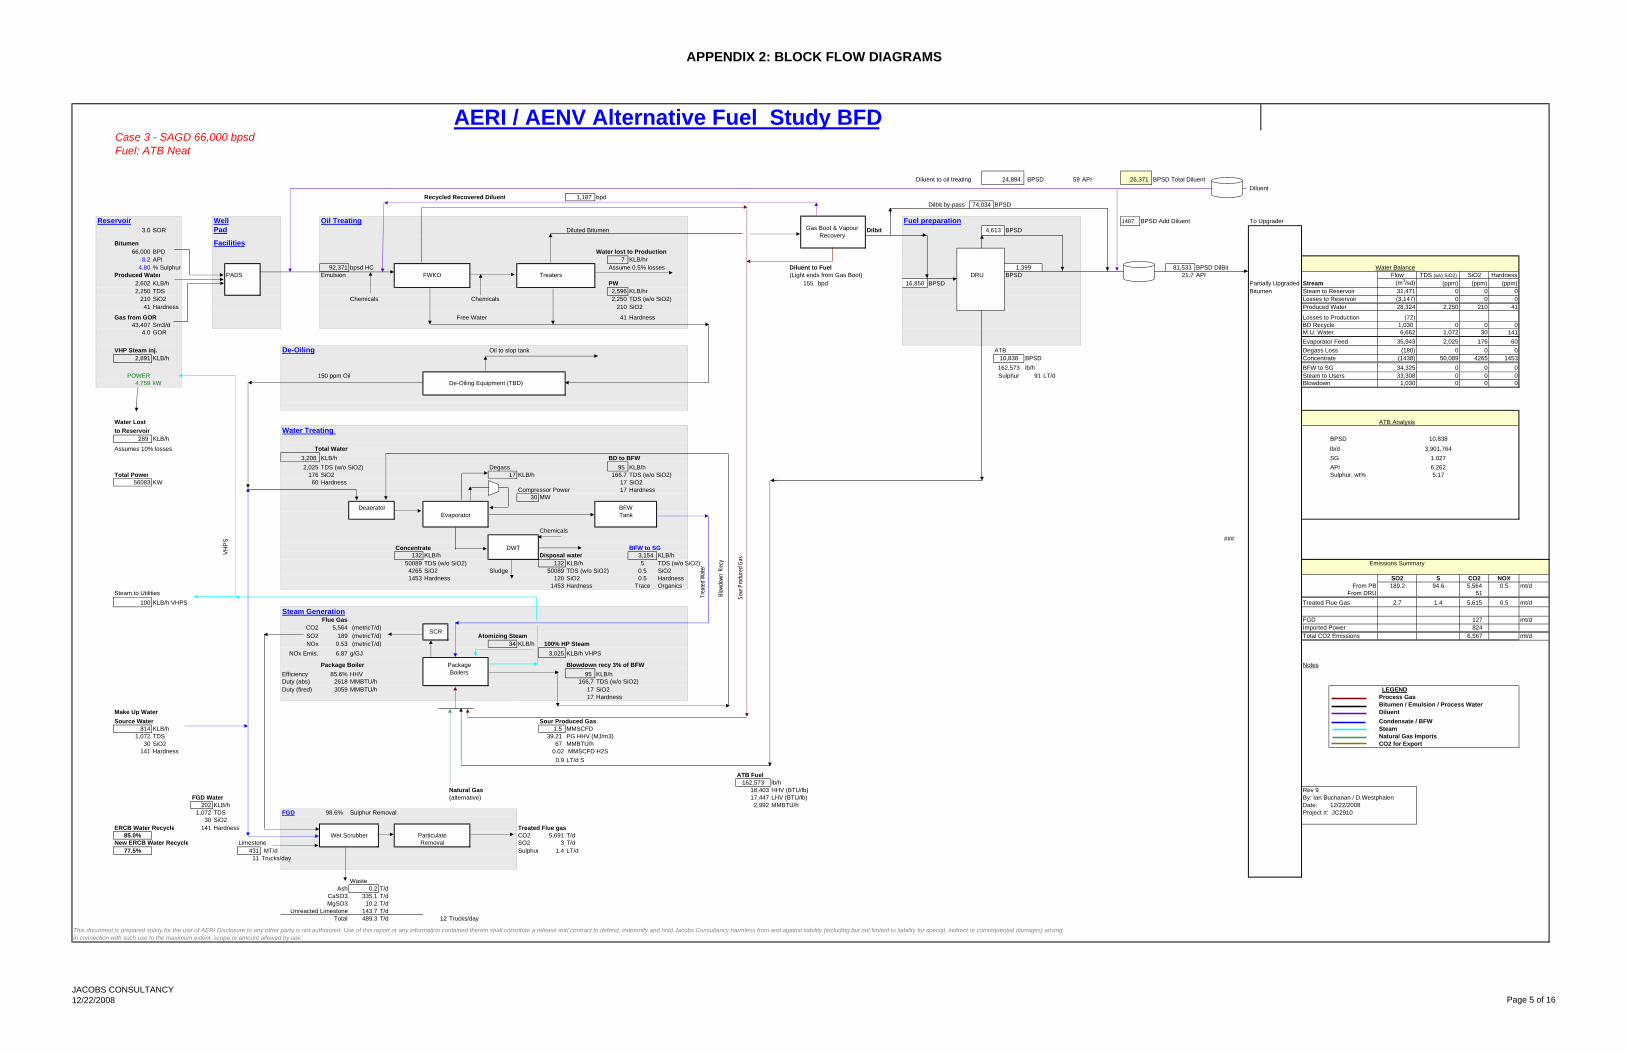
APPENDIX 2: BLOCK FLOW DIAGRAMS
Case 3 - SAGD 66,000 bpsdFuel: ATB Neat
Diluent to oil treating 59 API 26,371 BPSD Total Diluent Diluent
Recycled Recovered Diluent 1,187 bpdDilbit by-pass BPSD
Reservoir Well Oil Treating Fuel preparation 1487 BPSD Add Diluent To Upgrader3.0 SOR Pad Diluted Bitumen Dilbit BPSD
Bitumen Facilities66,000 BPD Water lost to Production
8.2 API 7 KLB/hr4.80 % Sulphur 92,371 bpsd HC Assume 0.5% losses Diluent to Fuel 81,533 BPSD DilBit Water Balance
Produced Water PADS Emulsion FWKO Treaters (Light ends from Gas Boot) DRU BPSD 21.7 API Flow TDS (w/o SiO2) SiO2 Hardness2,602 KLB/h PW 155 bpd BPSD Partially Upgraded Stream (m3/sd) (ppm) (ppm) (ppm)2,250 TDS 2,596 KLB/hr Bitumen Steam to Reservoir 31,471 0 0 0
210 SiO2 Chemicals Chemicals 2,250 TDS (w/o SiO2) Losses to Reservoir (3,147) 0 0 041 Hardness 210 SiO2 Produced Water 28,324 2,250 210 41
Gas from GOR Free Water 41 Hardness Losses to Production (72)43,407 Sm3/d BD Recycle 1,030 0 0 0
4.0 GOR M.U. Water 6,662 1,072 30 141Evaporator Feed 35,943 2,025 176 60
VHP Steam inj. De-Oiling Oil to slop tank ATB Degass Loss (180) 0 0 02,891 KLB/h BPSD Concentrate (1438) 50,089 4265 1453
lb/h BFW to SG 34,325 0 0 0POWER 150 ppm Oil 91 LT/d Steam to Users 33,308 0 0 0
4,759 kW De-Oiling Equipment (TBD) Blowdown 1,030 0 0 0
Water Lost ATB Analysisto Reservoir Water Treating
289 KLB/h BPSD 10,838Assumes 10% losses Total Water lb/d 3,901,764
3,208 KLB/h BD to BFW SG 1.0272,025 TDS (w/o SiO2) Degass 95 KLB/h API 6.262
Total Power 176 SiO2 17 KLB/h 166.7 TDS (w/o SiO2) Sulphur, wt% 5.1756083 KW 60 Hardness 17 SiO2
Compressor Power 17 Hardness30 MW
Deaerator BFWEvaporator Tank
Chemicals###
Concentrate DWT BFW to SG132 KLB/h Disposal water 3,154 KLB/h
50089 TDS (w/o SiO2) 132 KLB/h 5 TDS (w/o SiO2) Emissions Summary4265 SiO2 Sludge 50089 TDS (w/o SiO2) 0.5 SiO21453 Hardness 120 SiO2 0.5 Hardness SO2 S CO2 NOX
1453 Hardness Trace Organics From PB 189.2 94.6 5,564 0.5 mt/dSteam to Utilities From DRU 51
100 KLB/h VHPS Treated Flue Gas 2.7 1.4 5,615 0.5 mt/dSteam Generation
Flue Gas 127 mt/dCO2 5,564 (metricT/d) Imported Power 824SO2 189 (metricT/d) Atomizing Steam Total CO2 Emissions 6,567 mt/dNOx 0.53 (metricT/d) 34 KLB/h 100% HP Steam
NOx Emis. 6.87 g/GJ 3,025 KLB/h VHPS
Package Boiler Package NotesEfficiency 85.6% HHV Boilers 95 KLB/hDuty (abs) 2618 MMBTU/h 166.7 TDS (w/o SiO2)Duty (fired) 3059 MMBTU/h 17 SiO2 LEGEND
17 Hardness Process GasBitumen / Emulsion / Process Water
Make Up Water MMBTU/h DiluentSource Water Sour Produced Gas Condensate / BFW
814 KLB/h 1.5 MMSCFD Steam1,072 TDS 39.21 PG HHV (MJ/m3) Natural Gas Imports
30 SiO2 67 CO2 for Export141 Hardness 0.02 MMSCFD H2S
0.9 LT/d S
ATB FuelMMBTU/h 162,573 lb/h
Natural Gas 18,403 HHV (BTU/lb) Rev 9FGD Water (alternative) 17,447 LHV (BTU/lb) By: Ian Buchanan / D.Westphalen
202 KLB/h 2,992 MMBTU/h Date: 12/22/20081,072 TDS FGD 98.6% Sulphur Removal Project #: JC2910
30 SiO2ERCB Water Recycle 141 Hardness Treated Flue gas
85.0% Wet Scrubber Particulate CO2 5,691 T/dNew ERCB Water Recycle Limestone Removal SO2 3 T/d
77.5% 431 MT/d Sulphur 1.4 LT/d11 Trucks/day
WasteAsh 0.2
CaSO3 335.1MgSO3 10.2
Unreacted Limestone 143.7Total 489.3 12 Trucks/day
Sulphur162,573
1,399
4,613
10,838
AERI / AENV Alternative Fuel Study BFD
SCR
MMBTU/h
FGD
74,034
T/d
16,850
T/d
T/d
This document is prepared solely for the use of AERI Disclosure to any other party is not authorized. Use of this report or any information contained therein shall constitute a release and contract to defend, indemnify and hold Jacobs Consultancy harmless from and against liability (including but not limited to liability for special, indirect or consequential damages) arising in connection with such use to the maximum extent, scope or amount allowed by law.
T/d
T/d
BPSD24,884
0
Blowdown recy 3% of BFW
VHPS
Blow
down
Rec
y
Trea
ted W
ater
Sour
Pro
duce
d Gas
Gas Boot & Vapour Recovery
JACOBS CONSULTANCY12/22/2008 Page 5 of 16
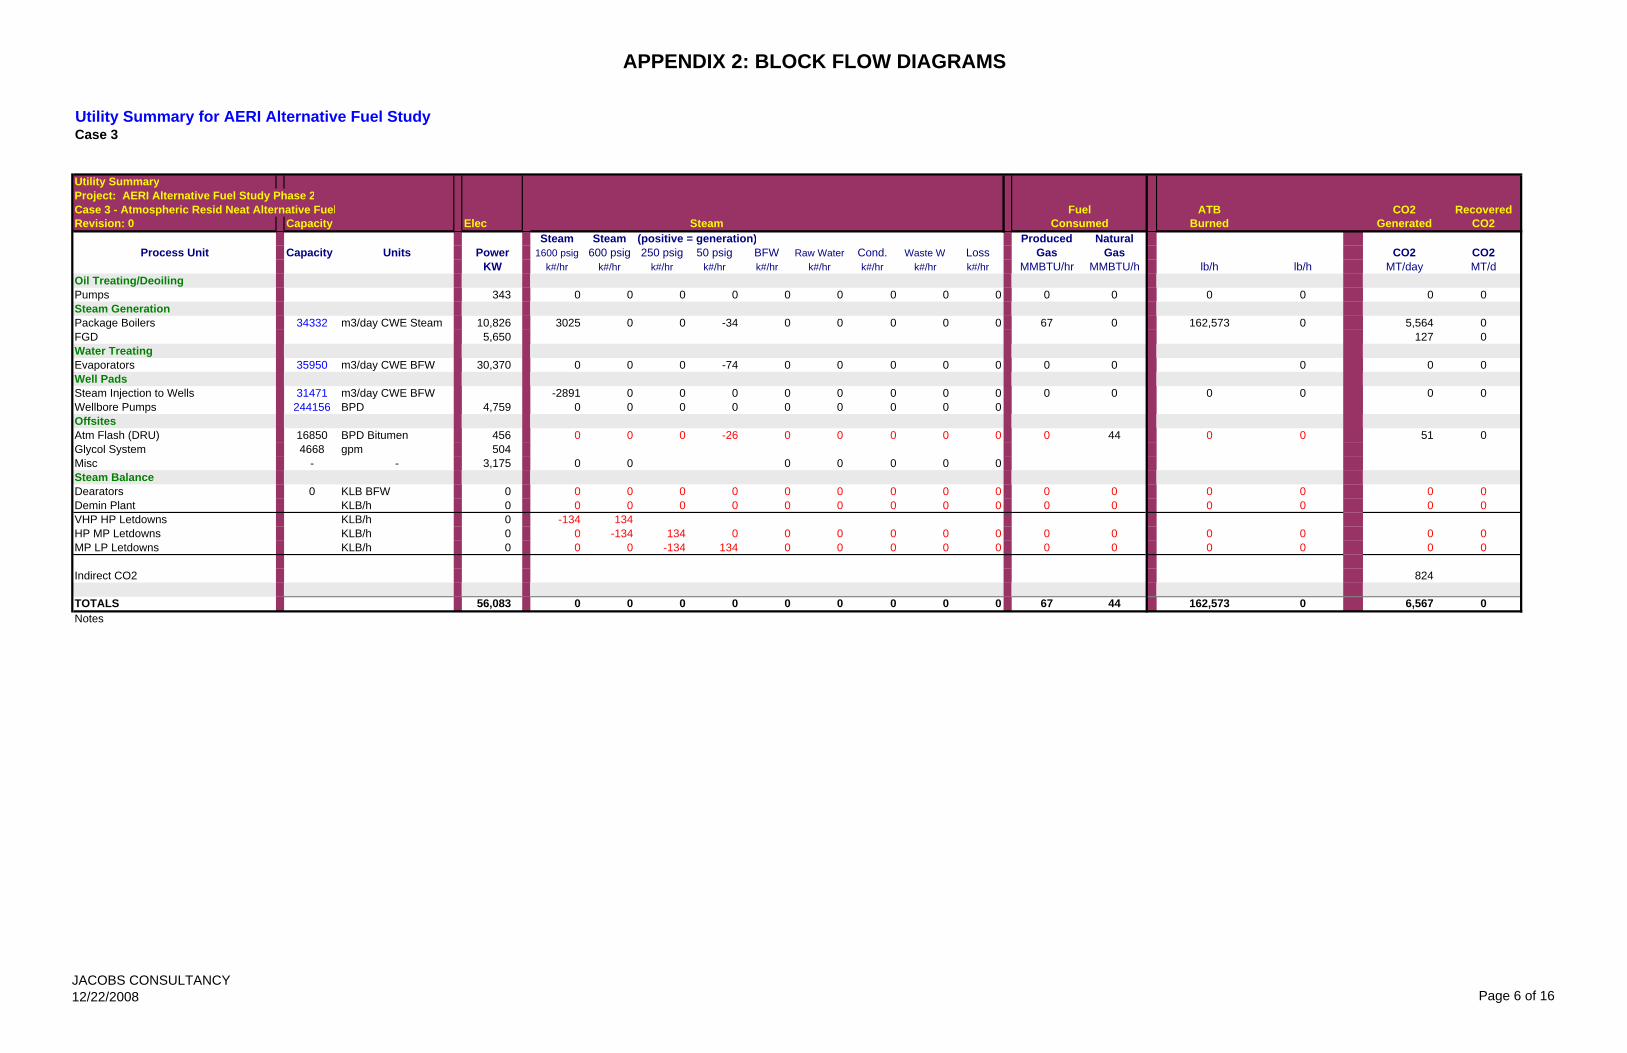
APPENDIX 2: BLOCK FLOW DIAGRAMS
Utility Summary for AERI Alternative Fuel Study Case 3
Utility SummaryProject: AERI Alternative Fuel Study Phase 2Case 3 - Atmospheric Resid Neat Alternative Fuel ATB CO2 RecoveredRevision: 0 Capacity Elec Steam Burned Generated CO2
Steam Steam (positive = generation) Produced NaturalProcess Unit Capacity Units Power 1600 psig 600 psig 250 psig 50 psig BFW Raw Water Cond. Waste W Loss Gas Gas CO2 CO2
KW k#/hr k#/hr k#/hr k#/hr k#/hr k#/hr k#/hr k#/hr k#/hr MMBTU/hr MMBTU/h lb/h lb/h MT/day MT/dOil Treating/DeoilingPumps 343 0 0 0 0 0 0 0 0 0 0 0 0 0 0 0Steam GenerationPackage Boilers 34332 m3/day CWE Steam 10,826 3025 0 0 -34 0 0 0 0 0 67 0 162,573 0 5,564 0FGD 5,650 127 0Water TreatingEvaporators 35950 m3/day CWE BFW 30,370 0 0 0 -74 0 0 0 0 0 0 0 0 0 0Well PadsSteam Injection to Wells 31471 m3/day CWE BFW -2891 0 0 0 0 0 0 0 0 0 0 0 0 0 0Wellbore Pumps 244156 BPD 4,759 0 0 0 0 0 0 0 0 0Offsites Atm Flash (DRU) 16850 BPD Bitumen 456 0 0 0 -26 0 0 0 0 0 0 44 0 0 51 0Glycol System 4668 gpm 504Misc - - 3,175 0 0 0 0 0 0 0Steam BalanceDearators 0 KLB BFW 0 0 0 0 0 0 0 0 0 0 0 0 0 0 0 0Demin Plant KLB/h 0 0 0 0 0 0 0 0 0 0 0 0 0 0 0 0VHP HP Letdowns KLB/h 0 -134 134HP MP Letdowns KLB/h 0 0 -134 134 0 0 0 0 0 0 0 0 0 0 0 0MP LP Letdowns KLB/h 0 0 0 -134 134 0 0 0 0 0 0 0 0 0 0 0
Indirect CO2 824
TOTALS 56,083 0 0 0 0 0 0 0 0 0 67 44 162,573 0 6,567 0Notes
FuelConsumed
JACOBS CONSULTANCY12/22/2008 Page 6 of 16
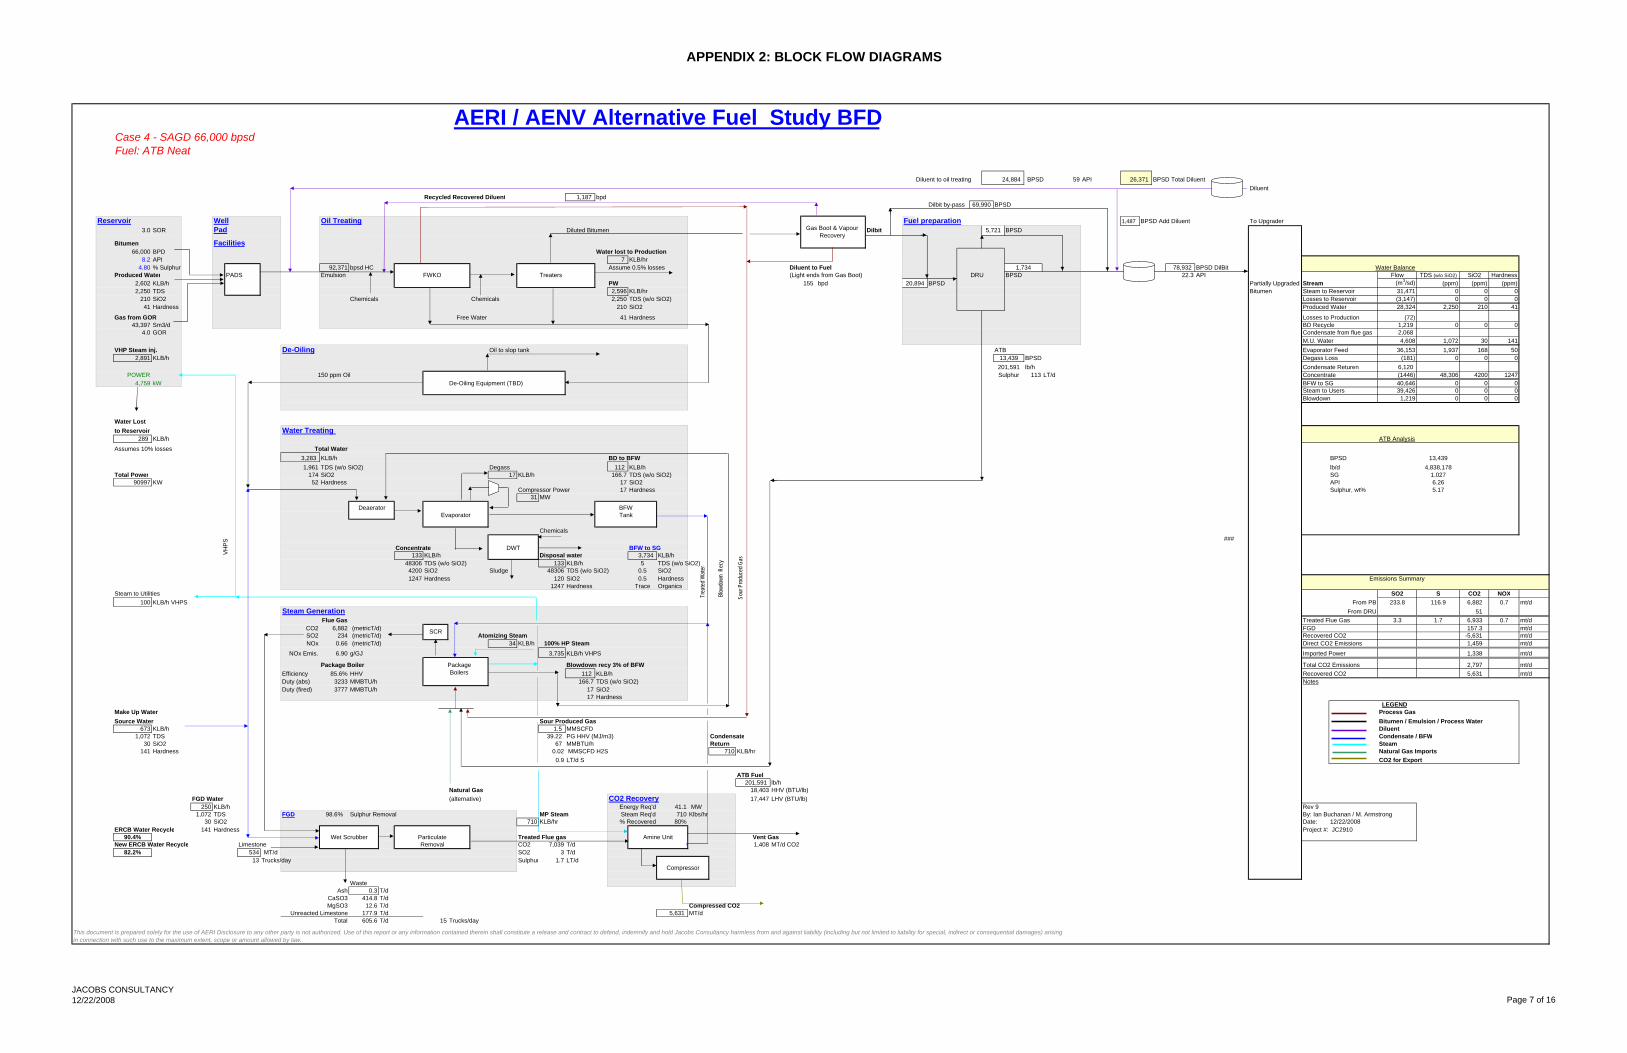
APPENDIX 2: BLOCK FLOW DIAGRAMS
Case 4 - SAGD 66,000 bpsdFuel: ATB Neat
Diluent to oil treating 59 API 26,371 BPSD Total Diluent Diluent
Recycled Recovered Diluent 1,187 bpdDilbit by-pass BPSD
Reservoir Well Oil Treating Fuel preparation 1,487 BPSD Add Diluent To Upgrader3.0 SOR Pad Diluted Bitumen Dilbit BPSD
Bitumen Facilities66,000 BPD Water lost to Production
8.2 API 7 KLB/hr4.80 % Sulphur 92,371 bpsd HC Assume 0.5% losses Diluent to Fuel 78,932 BPSD DilBit Water Balance
Produced Water PADS Emulsion FWKO Treaters (Light ends from Gas Boot) DRU BPSD 22.3 API Flow TDS (w/o SiO2) SiO2 Hardness2,602 KLB/h PW 155 bpd BPSD Partially Upgraded Stream (m3/sd) (ppm) (ppm) (ppm)2,250 TDS 2,596 KLB/hr Bitumen Steam to Reservoir 31,471 0 0 0
210 SiO2 Chemicals Chemicals 2,250 TDS (w/o SiO2) Losses to Reservoir (3,147) 0 0 041 Hardness 210 SiO2 Produced Water 28,324 2,250 210 41
Gas from GOR Free Water 41 Hardness Losses to Production (72)43,397 Sm3/d BD Recycle 1,219 0 0 0
4.0 GOR Condensate from flue gas 2,068 M.U. Water 4,608 1,072 30 141
VHP Steam inj. De-Oiling Oil to slop tank ATB Evaporator Feed 36,153 1,937 168 502,891 KLB/h BPSD Degass Loss (181) 0 0 0
lb/h Condensate Returen 6,120POWER 150 ppm Oil 113 LT/d Concentrate (1446) 48,306 4200 1247
4,759 kW De-Oiling Equipment (TBD) BFW to SG 40,646 0 0 0Steam to Users 39,426 0 0 0Blowdown 1,219 0 0 0
Water Lostto Reservoir Water Treating
289 KLB/h ATB AnalysisAssumes 10% losses Total Water
3,283 KLB/h BD to BFW BPSD 13,4391,961 TDS (w/o SiO2) Degass 112 KLB/h lb/d 4,838,178
Total Power 174 SiO2 17 KLB/h 166.7 TDS (w/o SiO2) SG 1.02790997 KW 52 Hardness 17 SiO2 API 6.26
Compressor Power 17 Hardness Sulphur, wt% 5.1731 MW
Deaerator BFWEvaporator Tank
Chemicals###
Concentrate DWT BFW to SG133 KLB/h Disposal water 3,734 KLB/h
48306 TDS (w/o SiO2) 133 KLB/h 5 TDS (w/o SiO2)4200 SiO2 Sludge 48306 TDS (w/o SiO2) 0.5 SiO21247 Hardness 120 SiO2 0.5 Hardness Emissions Summary
1247 Hardness Trace OrganicsSteam to Utilities SO2 S CO2 NOX
100 KLB/h VHPS From PB 233.8 116.9 6,882 0.7 mt/dSteam Generation From DRU 51
Flue Gas Treated Flue Gas 3.3 1.7 6,933 0.7 mt/dCO2 6,882 (metricT/d) 157.3 mt/dSO2 234 (metricT/d) Atomizing Steam -5,631 mt/dNOx 0.66 (metricT/d) 34 KLB/h 100% HP Steam Direct CO2 Emissions 1,459 mt/d
NOx Emis. 6.90 g/GJ 3,735 KLB/h VHPS Imported Power 1,338 mt/d
Package Boiler Package Total CO2 Emissions 2,797 mt/dEfficiency 85.6% HHV Boilers 112 KLB/h Recovered CO2 5,631 mt/dDuty (abs) 3233 MMBTU/h 166.7 TDS (w/o SiO2) NotesDuty (fired) 3777 MMBTU/h 17 SiO2
17 HardnessLEGEND
Make Up Water MMBTU/h Process GasSource Water Sour Produced Gas Bitumen / Emulsion / Process Water
673 KLB/h 1.5 MMSCFD Diluent1,072 TDS 39.22 PG HHV (MJ/m3) Condensate Condensate / BFW
30 SiO2 67 Return Steam141 Hardness 0.02 MMSCFD H2S 710 KLB/hr Natural Gas Imports
0.9 LT/d S CO2 for Export
ATB FuelMMBTU/h 201,591 lb/h
Natural Gas 18,403 HHV (BTU/lb)FGD Water (alternative) CO2 Recovery 17,447 LHV (BTU/lb)
250 KLB/h Energy Req'd 41.1 MW Rev 91,072 TDS FGD 98.6% Sulphur Removal MP Steam Steam Req'd 710 Klbs/hr By: Ian Buchanan / M. Armstrong
30 SiO2 710 KLB/hr % Recovered 80% Date: 12/22/2008ERCB Water Recycle 141 Hardness Project #: JC2910
90.4% Wet Scrubber Particulate Treated Flue gas Amine Unit Vent GasNew ERCB Water Recycle Limestone Removal CO2 7,039 T/d 1,408 MT/d CO2
82.2% 534 MT/d SO2 3 T/d13 Trucks/day Sulphur 1.7 LT/d
Compressor
WasteAsh 0.3
CaSO3 414.8MgSO3 12.6 Compressed CO2
Unreacted Limestone 177.9 5,631 MT/dTotal 605.6 15 Trucks/day
SCR
Blowdown recy 3% of BFW
20,894
BPSD24,884
T/dT/d
T/d
T/d
This document is prepared solely for the use of AERI Disclosure to any other party is not authorized. Use of this report or any information contained therein shall constitute a release and contract to defend, indemnify and hold Jacobs Consultancy harmless from and against liability (including but not limited to liability for special, indirect or consequential damages) arising in connection with such use to the maximum extent, scope or amount allowed by law.
T/d
69,990
201,591
1,734
5,721
13,439
MMBTU/h
Recovered CO2FGD
0
AERI / AENV Alternative Fuel Study BFD
Sulphur
VHPS
Blow
down
Rec
y
Trea
ted W
ater
Sour
Pro
duce
d Gas
Gas Boot & Vapour Recovery
JACOBS CONSULTANCY12/22/2008 Page 7 of 16
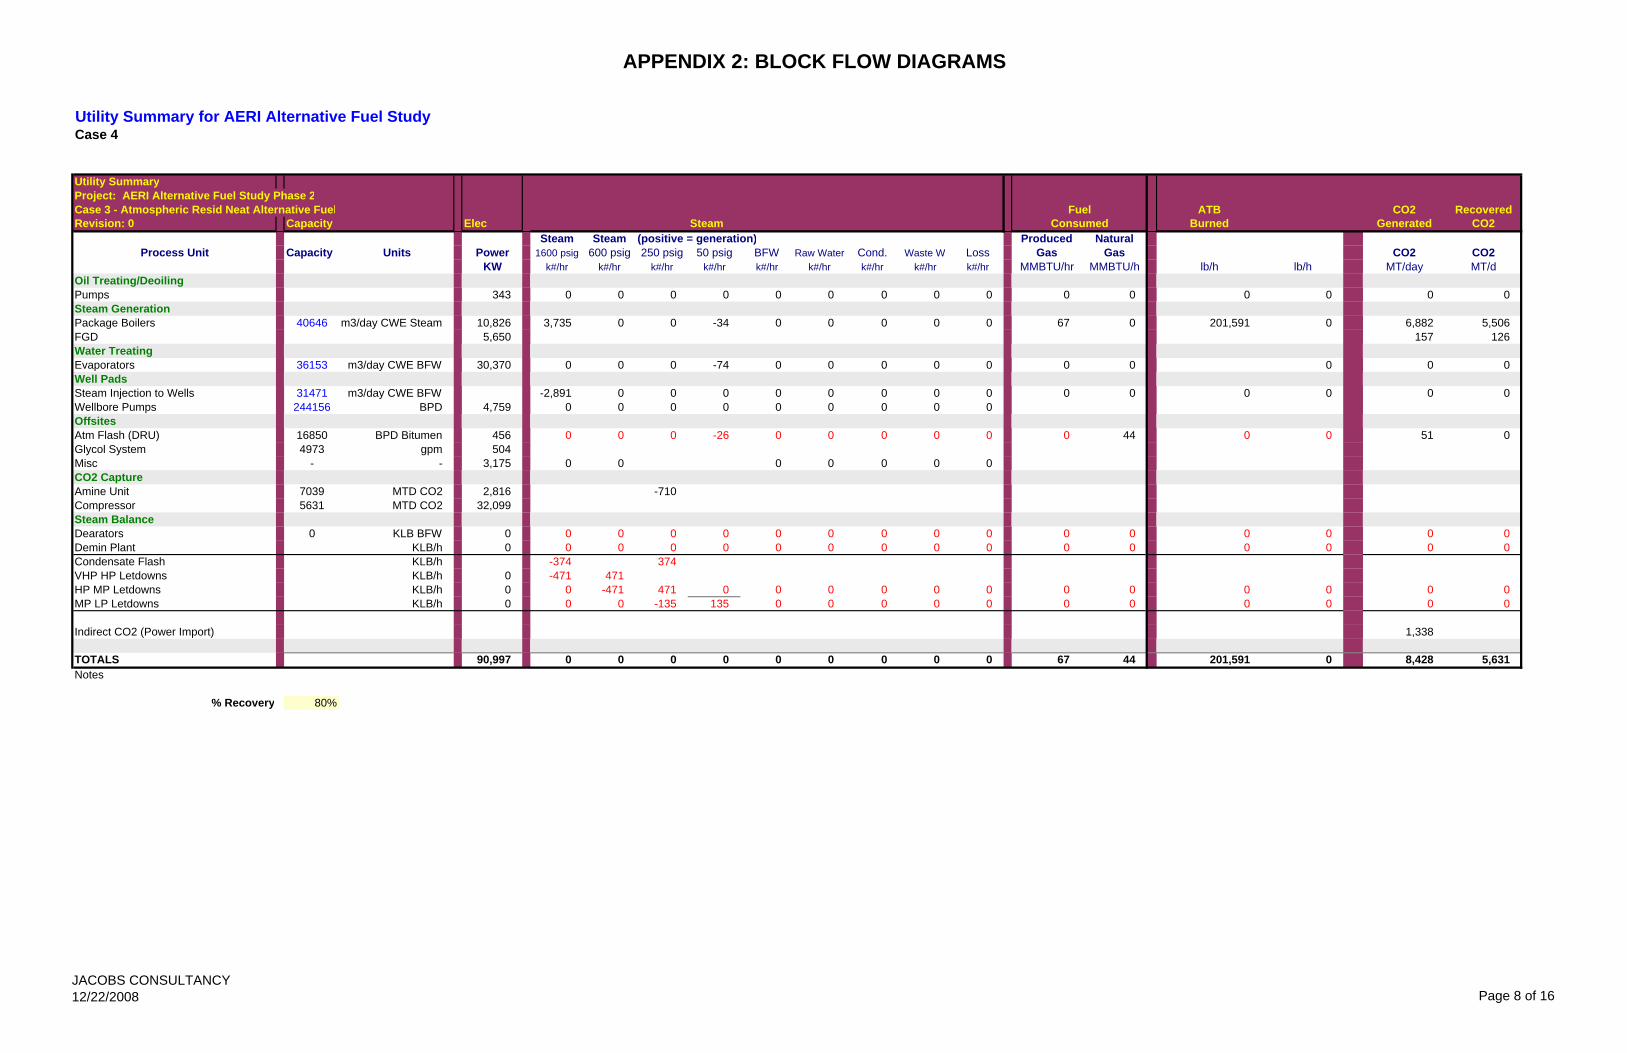
APPENDIX 2: BLOCK FLOW DIAGRAMS
Utility Summary for AERI Alternative Fuel Study Case 4
Utility SummaryProject: AERI Alternative Fuel Study Phase 2Case 3 - Atmospheric Resid Neat Alternative Fuel ATB CO2 RecoveredRevision: 0 Capacity Elec Steam Burned Generated CO2
Steam Steam (positive = generation) Produced NaturalProcess Unit Capacity Units Power 1600 psig 600 psig 250 psig 50 psig BFW Raw Water Cond. Waste W Loss Gas Gas CO2 CO2
KW k#/hr k#/hr k#/hr k#/hr k#/hr k#/hr k#/hr k#/hr k#/hr MMBTU/hr MMBTU/h lb/h lb/h MT/day MT/dOil Treating/DeoilingPumps 343 0 0 0 0 0 0 0 0 0 0 0 0 0 0 0Steam GenerationPackage Boilers 40646 m3/day CWE Steam 10,826 3,735 0 0 -34 0 0 0 0 0 67 0 201,591 0 6,882 5,506FGD 5,650 157 126Water TreatingEvaporators 36153 m3/day CWE BFW 30,370 0 0 0 -74 0 0 0 0 0 0 0 0 0 0Well PadsSteam Injection to Wells 31471 m3/day CWE BFW -2,891 0 0 0 0 0 0 0 0 0 0 0 0 0 0Wellbore Pumps 244156 BPD 4,759 0 0 0 0 0 0 0 0 0Offsites Atm Flash (DRU) 16850 BPD Bitumen 456 0 0 0 -26 0 0 0 0 0 0 44 0 0 51 0Glycol System 4973 gpm 504Misc - - 3,175 0 0 0 0 0 0 0CO2 CaptureAmine Unit 7039 MTD CO2 2,816 -710Compressor 5631 MTD CO2 32,099Steam BalanceDearators 0 KLB BFW 0 0 0 0 0 0 0 0 0 0 0 0 0 0 0 0Demin Plant KLB/h 0 0 0 0 0 0 0 0 0 0 0 0 0 0 0 0Condensate Flash KLB/h -374 374VHP HP Letdowns KLB/h 0 -471 471HP MP Letdowns KLB/h 0 0 -471 471 0 0 0 0 0 0 0 0 0 0 0 0MP LP Letdowns KLB/h 0 0 0 -135 135 0 0 0 0 0 0 0 0 0 0 0
Indirect CO2 (Power Import) 1,338
TOTALS 90,997 0 0 0 0 0 0 0 0 0 67 44 201,591 0 8,428 5,631Notes
% Recovery 80%
FuelConsumed
JACOBS CONSULTANCY12/22/2008 Page 8 of 16
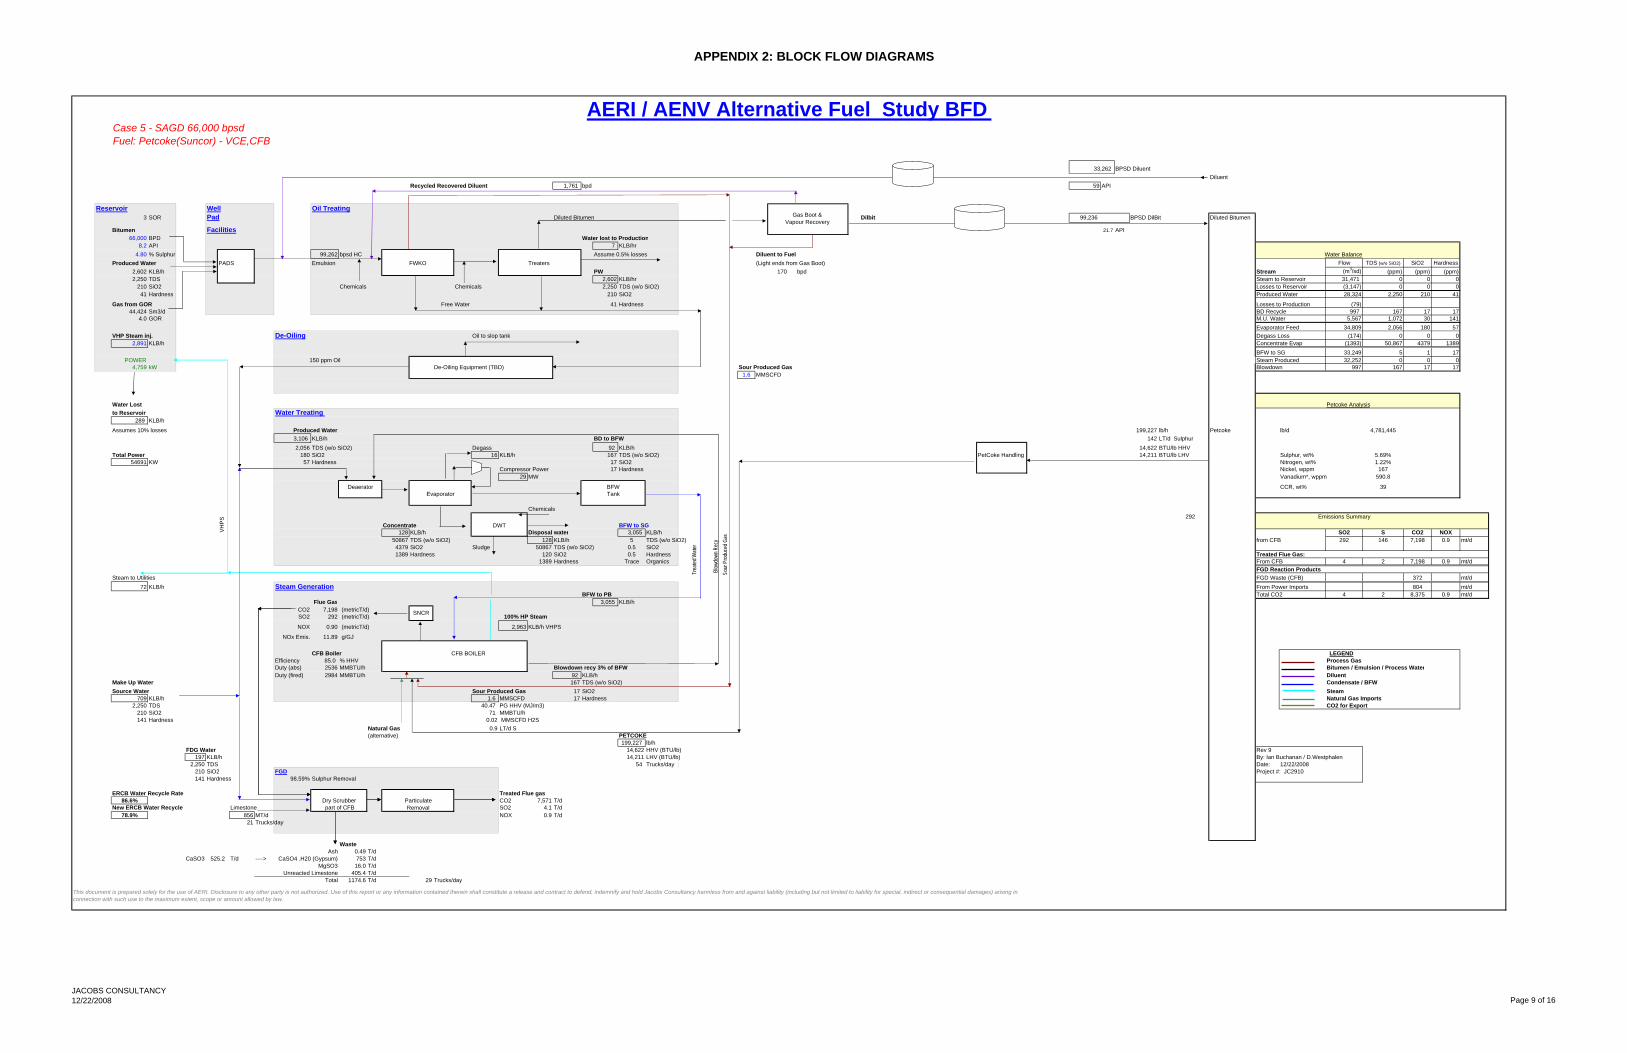
APPENDIX 2: BLOCK FLOW DIAGRAMS
Case 5 - SAGD 66,000 bpsdFuel: Petcoke(Suncor) - VCE,CFB
33,262 BPSD DiluentDiluent
Recycled Recovered Diluent 1,761 bpd 59 API
Reservoir Well Oil Treating3 SOR Pad Diluted Bitumen Dilbit 99,236 BPSD DilBit Diluted Bitumen
Bitumen Facilities 21.7 API 66,000 BPD Water lost to Production
8.2 API 7 KLB/hr4.80 % Sulphur 99,262 bpsd HC Assume 0.5% losses Diluent to Fuel Water Balance
Produced Water PADS Emulsion FWKO Treaters (Light ends from Gas Boot) Flow TDS (w/o SiO2) SiO2 Hardness2,602 KLB/h PW 170 bpd Stream (m3/sd) (ppm) (ppm) (ppm)2,250 TDS 2,602 KLB/hr Steam to Reservoir 31,471 0 0 0
210 SiO2 Chemicals Chemicals 2,250 TDS (w/o SiO2) Losses to Reservoir (3,147) 0 0 041 Hardness 210 SiO2 Produced Water 28,324 2,250 210 41
Gas from GOR Free Water 41 Hardness Losses to Production (79)44,424 Sm3/d BD Recycle 997 167 17 17
4.0 GOR M.U. Water 5,567 1,072 30 141Evaporator Feed 34,809 2,056 180 57
VHP Steam inj. De-Oiling Oil to slop tank Degass Loss (174) 0 0 02,891 KLB/h Concentrate Evap (1393) 50,867 4379 1389
BFW to SG 33,249 5 1 17POWER 150 ppm Oil Steam Produced 32,252 0 0 0
4,759 kW De-Oiling Equipment (TBD) Sour Produced Gas Blowdown 997 167 17 171.6 MMSCFD
Water Lost Petcoke Analysisto Reservoir Water Treating
289 KLB/h
Assumes 10% losses Produced Water 199,227 lb/h Petcoke lb/d 4,781,4453,106 KLB/h BD to BFW 142 LT/d Sulphur2,056 TDS (w/o SiO2) Degass 92 KLB/h 14,622 BTU/lb HHV
Total Power 180 SiO2 16 KLB/h 167 TDS (w/o SiO2) PetCoke Handling 14,211 BTU/lb LHV Sulphur, wt% 5.69%54691 KW 57 Hardness 17 SiO2 Nitrogen, wt% 1.22%
Compressor Power 17 Hardness Nickel, wppm 16729 MW Vanadium*, wppm 590.8
Deaerator BFW CCR, wt% 39Evaporator Tank
Chemicals292 Emissions Summary
Concentrate DWT BFW to SG128 KLB/h Disposal water 3,055 KLB/h SO2 S CO2 NOX
50867 TDS (w/o SiO2) 128 KLB/h 5 TDS (w/o SiO2) from CFB 292 146 7,198 0.9 mt/d4379 SiO2 Sludge 50867 TDS (w/o SiO2) 0.5 SiO21389 Hardness 120 SiO2 0.5 Hardness Treated Flue Gas:
1389 Hardness Trace Organics From CFB 4 2 7,198 0.9 mt/dFGD Reaction Products
Steam to Utilities FGD Waste (CFB) 372 mt/d72 KLB/h Steam Generation From Power Imports 804 mt/d
BFW to PB Total CO2 4 2 8,375 0.9 mt/dFlue Gas 3,055 KLB/h
CO2 7,198 (metricT/d)SO2 292 (metricT/d) 100% HP Steam
NOX 0.90 (metricT/d) 2,963 KLB/h VHPS
NOx Emis. 11.89 g/GJ
CFB Boiler LEGENDEfficiency 85.0 % HHV Process GasDuty (abs) 2536 MMBTU/h Blowdown recy 3% of BFW Bitumen / Emulsion / Process WaterDuty (fired) 2984 MMBTU/h 92 KLB/h Diluent
Make Up Water 167 TDS (w/o SiO2) Condensate / BFWSource Water Sour Produced Gas 17 SiO2 Steam
709 KLB/h 1.6 MMSCFD 17 Hardness Natural Gas Imports2,250 TDS 40.47 PG HHV (MJ/m3) CO2 for Export
210 SiO2 71 MMBTU/h141 Hardness 0.02 MMSCFD H2S
Natural Gas 0.9 LT/d S(alternative) PETCOKE
199,227 lb/h FDG Water 14,622 HHV (BTU/lb) Rev 9
197 KLB/h 14,211 LHV (BTU/lb) By: Ian Buchanan / D.Westphalen2,250 TDS 54 Trucks/day Date: 12/22/2008
210 SiO2 FGD Project #: JC2910141 Hardness 98.59% Sulphur Removal
ERCB Water Recycle Rate Treated Flue gas86.6% Dry Scrubber Particulate CO2 7,571 T/d
New ERCB Water Recycle Limestone Removal SO2 4.1 T/d78.9% 856 MT/d NOX 0.9 T/d
21 Trucks/day
WasteAsh 0.49 T/d
CaSO3 525.2 T/d ----> CaSO4 .H20 (Gypsum) 753 T/dMgSO3 16.0 T/d
Unreacted Limestone 405.4 T/dTotal 1174.6 T/d 29 Trucks/day
AERI / AENV Alternative Fuel Study BFD
This document is prepared solely for the use of AERI. Disclosure to any other party is not authorized. Use of this report or any information contained therein shall constitute a release and contract to defend, indemnify and hold Jacobs Consultancy harmless from and against liability (including but not limited to liability for special, indirect or consequential damages) arising in connection with such use to the maximum extent, scope or amount allowed by law.
part of CFB
CFB BOILER
SNCR
VH
PS
Blow
down
Rec
y
Trea
ted W
ater
Sour
Pro
duce
d Gas
Gas Boot & Vapour Recovery
JACOBS CONSULTANCY12/22/2008 Page 9 of 16

APPENDIX 2: BLOCK FLOW DIAGRAMS
Utility Summary for AERI Alternative Fuel Study Case 5
Utility SummaryProject: AERI Alternative Fuel Study Case 5 - Petcoke Alternative Fuel PETCOKE CO2 RecoveredRevision: 0 Capacity Elec Steam Burned Generated CO2
Steam Steam (positive = generation) Produced NaturalProcess Unit Capacity Units Power 1600 psig 600 psig 250 psig 50 psig BFW Raw Water Cond. Waste W Loss Gas Gas CO2 CO2
KW k#/hr k#/hr k#/hr k#/hr k#/hr k#/hr k#/hr k#/hr k#/hr MMBTU/hr MMBTU/h lb/h lb/h MT/day MT/dOil Treating/DeoilingPumps 403 0 0 0 0 0 0 0 0 0 0 0 0 0 0 0Steam GenerationCFB Boiler 33249 m3/day CWE Steam 10,827 2963 0 0 0 0 0 0 0 0 71 0 199,227 0 7,198 0FGD 5,650 372Water TreatingEvaporators 34816 m3/day CWE BFW 29,412 0 0 0 -72 0 0 0 0 0 0 0 0 0 0Well PadsSteam Injection to Wells 31471 m3/day CWE BFW -2891 0 0 0 0 0 0 0 0 0 0 0 0 0 0Wellbore Pumps 244156 BPD 4,759 0 0 0 0 0 0 0 0 0Offsites Atm Flash (DRU) 0 BPD Bitumen 0 0 0 0 0 0 0 0 0 0 0 0 0 0 0 0Glycol System 5032 gpm 544Misc - - 3,096 0 0 0 0 0 0 0Steam BalanceDearators 0 KLB BFW 0 0 0 0 0 0 0 0 0 0 0 0 0 0 0 0Demin Plant KLB/h 0 0 0 0 0 0 0 0 0 0 0 0 0 0 0 0VHP HP Letdowns KLB/h 0 -72 72HP MP Letdowns KLB/h 0 0 -72 72 0 0 0 0 0 0 0 0 0 0 0 0MP LP Letdowns KLB/h 0 0 0 -72 72 0 0 0 0 0 0 0 0 0 0 0
Indirect CO2 (Power Import) 804
TOTALS 54,691 0 0 0 0 0 0 0 0 0 71 0 199,227 0 8,375 0Notes
FuelConsumed
JACOBS CONSULTANCY12/22/2008 Page 10 of 16
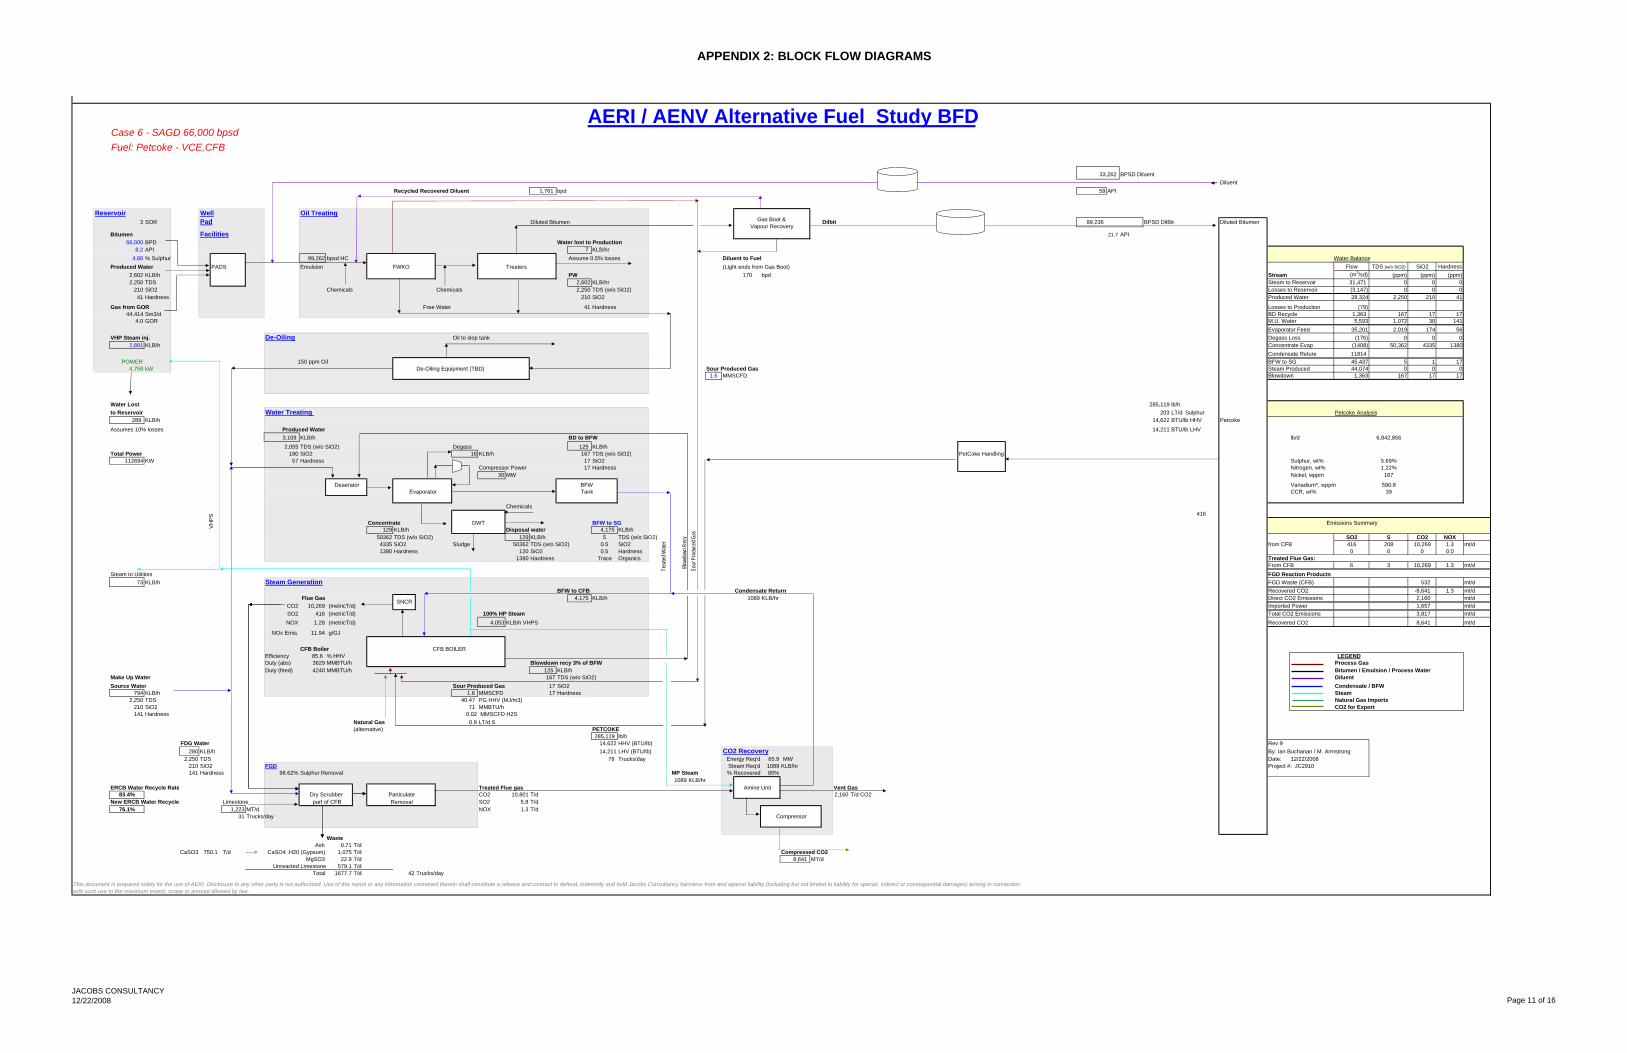
APPENDIX 2: BLOCK FLOW DIAGRAMS
AERI / AENV Alternative Fuel Study BFDCase 6 - SAGD 66,000 bpsdFuel: Petcoke - VCE,CFB
33,262 BPSD DiluentDiluent
Recycled Recovered Diluent 1,761 bpd 59 API
Reservoir Well Oil Treating3 SOR Pad Diluted Bitumen Dilbit 99,236 BPSD DilBit Diluted Bitumen
Bitumen Facilities 21.7 API 66,000 BPD Water lost to Production
8.2 API 7 KLB/hr4.80 % Sulphur 99,262 bpsd HC Assume 0.5% losses Diluent to Fuel Water Balance
Produced Water PADS Emulsion FWKO Treaters (Light ends from Gas Boot) Flow TDS (w/o SiO2) SiO2 Hardness2,602 KLB/h PW 170 bpd Stream (m3/sd) (ppm) (ppm) (ppm)2,250 TDS 2,602 KLB/hr Steam to Reservoir 31,471 0 0 0
210 SiO2 Chemicals Chemicals 2,250 TDS (w/o SiO2) Losses to Reservoir (3,147) 0 0 041 Hardness 210 SiO2 Produced Water 28,324 2,250 210 41
Gas from GOR Free Water 41 Hardness Losses to Production (79)44,414 Sm3/d BD Recycle 1,363 167 17 17
4.0 GOR M.U. Water 5,593 1,072 30 141Evaporator Feed 35,201 2,019 174 56
VHP Steam inj. De-Oiling Oil to slop tank Degass Loss (176) 0 0 02,891 KLB/h Concentrate Evap (1408) 50,362 4335 1380
Condensate Reture 11814POWER 150 ppm Oil BFW to SG 45,437 5 1 17
4,759 kW De-Oiling Equipment (TBD) Sour Produced Gas Steam Produced 44,074 0 0 01.6 MMSCFD Blowdown 1,363 167 17 17
Water Lost 285,119 lb/hto Reservoir Water Treating 203 LT/d Sulphur Petcoke Analysis
289 KLB/h 14,622 BTU/lb HHV Petcoke
Assumes 10% losses Produced Water 14,211 BTU/lb LHV3,109 KLB/h BD to BFW lb/d 6,842,8562,055 TDS (w/o SiO2) Degass 125 KLB/h
Total Power 180 SiO2 16 KLB/h 167 TDS (w/o SiO2) PetCoke Handling112694 KW 57 Hardness 17 SiO2 Sulphur, wt% 5.69%
Compressor Power 17 Hardness Nitrogen, wt% 1.22%30 MW Nickel, wppm 167
Deaerator BFW Vanadium*, wppm 590.8Evaporator Tank CCR, wt% 39
Chemicals416
Concentrate DWT BFW to SG Emissions Summary129 KLB/h Disposal water 4,175 KLB/h
50362 TDS (w/o SiO2) 129 KLB/h 5 TDS (w/o SiO2) SO2 S CO2 NOX4335 SiO2 Sludge 50362 TDS (w/o SiO2) 0.5 SiO2 from CFB 416 208 10,269 1.3 mt/d1380 Hardness 120 SiO2 0.5 Hardness 0 0 0 0.0
1380 Hardness Trace Organics Treated Flue Gas:From CFB 6 3 10,269 1.3 mt/d
Steam to Utilities FGD Reaction Products73 KLB/h Steam Generation FGD Waste (CFB) 532 mt/d
BFW to CFB Condensate Return Recovered CO2 -8,641 1.3 mt/dFlue Gas 4,175 KLB/h 1089 KLB/hr Direct CO2 Emissions 2,160 mt/d
CO2 10,269 (metricT/d) Imported Power 1,657 mt/dSO2 416 (metricT/d) 100% HP Steam Total CO2 Emissions 3,817 mt/dNOX 1.28 (metricT/d) 4,053 KLB/h VHPS Recovered CO2 8,641 mt/d
NOx Emis. 11.94 g/GJ
CFB BoilerEfficiency 85.6 % HHV LEGENDDuty (abs) 3629 MMBTU/h Blowdown recy 3% of BFW Process GasDuty (fired) 4240 MMBTU/h 125 KLB/h Bitumen / Emulsion / Process Water
Make Up Water 167 TDS (w/o SiO2) DiluentSource Water Sour Produced Gas 17 SiO2 Condensate / BFW
794 KLB/h 1.6 MMSCFD 17 Hardness Steam2,250 TDS 40.47 PG HHV (MJ/m3) Natural Gas Imports
210 SiO2 71 MMBTU/h CO2 for Export141 Hardness 0.02 MMSCFD H2S
Natural Gas 0.9 LT/d S(alternative) PETCOKE
285,119 lb/h FDG Water 14,622 HHV (BTU/lb) Rev 9
280 KLB/h 14,211 LHV (BTU/lb) CO2 Recovery By: Ian Buchanan / M. Armstrong2,250 TDS 78 Trucks/day Energy Req'd 65.9 MW Date: 12/22/2008
210 SiO2 FGD Steam Req'd 1089 KLB/hr Project #: JC2910141 Hardness 98.62% Sulphur Removal MP Steam % Recovered 80%
1089 KLB/hrERCB Water Recycle Rate Treated Flue gas Amine Unit Vent Gas
83.4% Dry Scrubber Particulate CO2 10,801 T/d 2,160 T/d CO2New ERCB Water Recycle Limestone Removal SO2 5.8 T/d
76.1% 1,223 MT/d NOX 1.3 T/d31 Trucks/day Compressor
WasteAsh 0.71 T/d
CaSO3 750.1 T/d ----> CaSO4 .H20 (Gypsum) 1,075 T/d Compressed CO2MgSO3 22.9 T/d 8,641 MT/d
Unreacted Limestone 579.1 T/dTotal 1677.7 T/d 42 Trucks/day
part of CFB
CFB BOILER
SNCR
This document is prepared solely for the use of AERI. Disclosure to any other party is not authorized. Use of this report or any information contained therein shall constitute a release and contract to defend, indemnify and hold Jacobs Consultancy harmless from and against liability (including but not limited to liability for special, indirect or consequential damages) arising in connection with such use to the maximum extent, scope or amount allowed by law.
VHPS
Blow
down
Rec
y
Trea
ted W
ater
Sour
Pro
duce
d Gas
Gas Boot & Vapour Recovery
JACOBS CONSULTANCY12/22/2008 Page 11 of 16
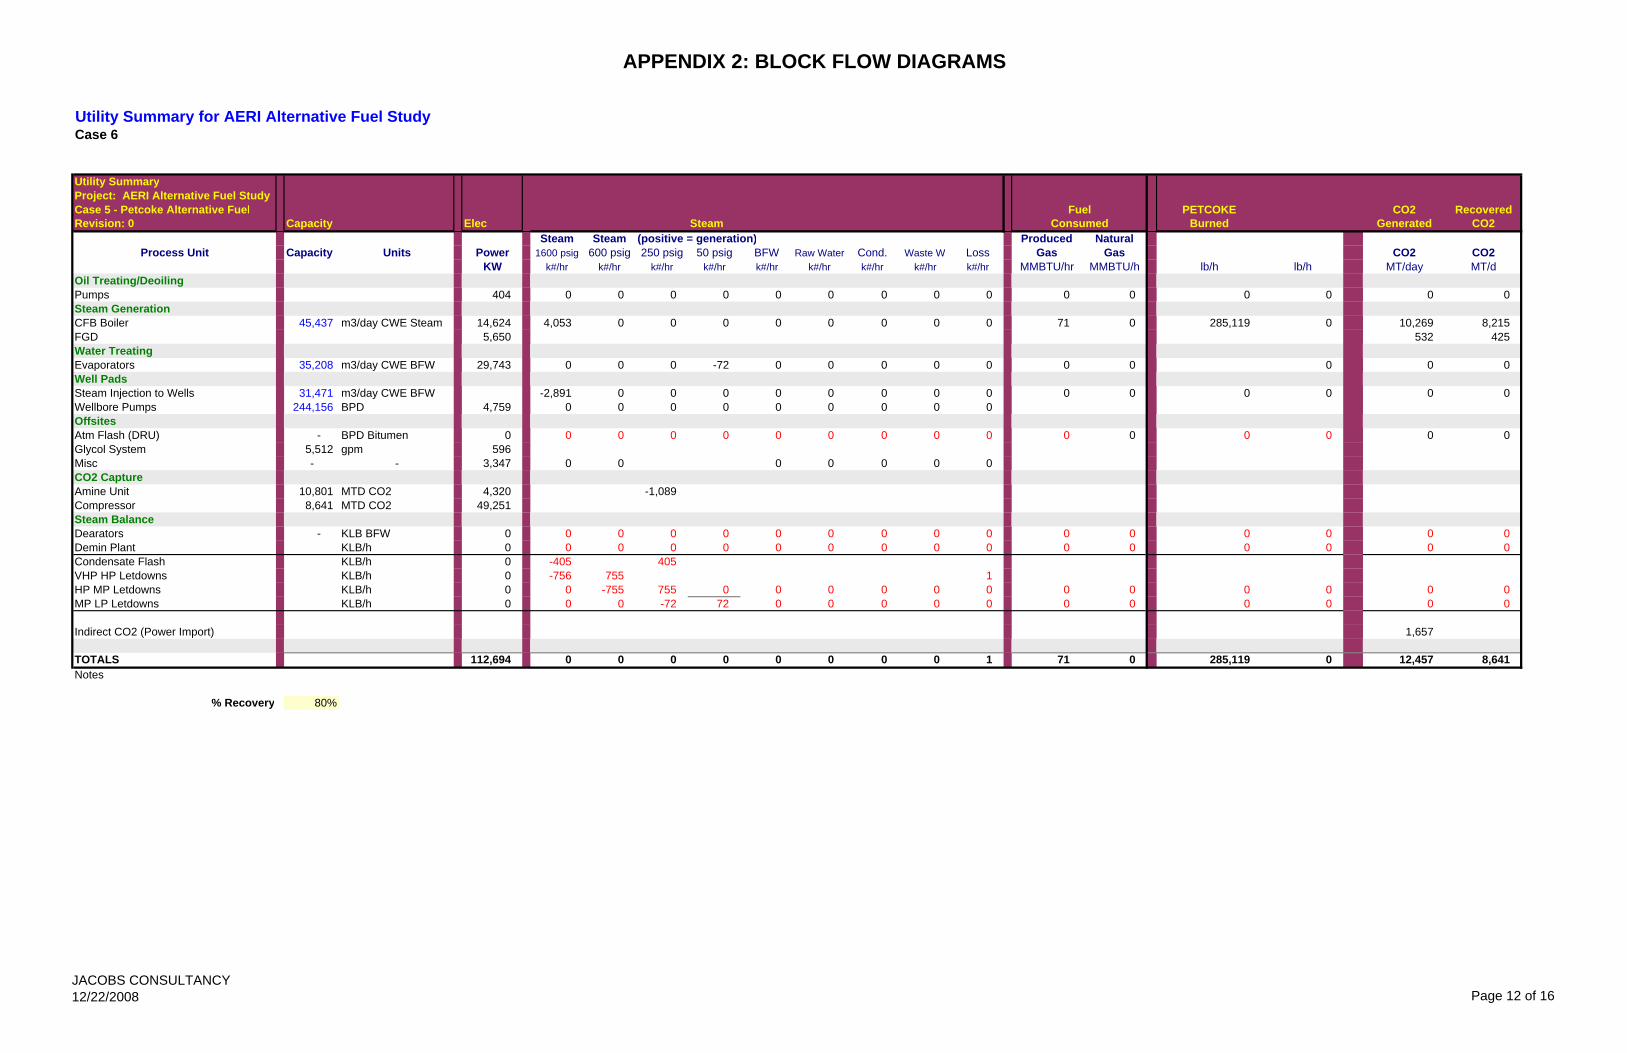
APPENDIX 2: BLOCK FLOW DIAGRAMS
Utility Summary for AERI Alternative Fuel Study Case 6
Utility SummaryProject: AERI Alternative Fuel Study Case 5 - Petcoke Alternative Fuel PETCOKE CO2 RecoveredRevision: 0 Capacity Elec Steam Burned Generated CO2
Steam Steam (positive = generation) Produced NaturalProcess Unit Capacity Units Power 1600 psig 600 psig 250 psig 50 psig BFW Raw Water Cond. Waste W Loss Gas Gas CO2 CO2
KW k#/hr k#/hr k#/hr k#/hr k#/hr k#/hr k#/hr k#/hr k#/hr MMBTU/hr MMBTU/h lb/h lb/h MT/day MT/dOil Treating/DeoilingPumps 404 0 0 0 0 0 0 0 0 0 0 0 0 0 0 0Steam GenerationCFB Boiler 45,437 m3/day CWE Steam 14,624 4,053 0 0 0 0 0 0 0 0 71 0 285,119 0 10,269 8,215FGD 5,650 532 425Water TreatingEvaporators 35,208 m3/day CWE BFW 29,743 0 0 0 -72 0 0 0 0 0 0 0 0 0 0Well PadsSteam Injection to Wells 31,471 m3/day CWE BFW -2,891 0 0 0 0 0 0 0 0 0 0 0 0 0 0Wellbore Pumps 244,156 BPD 4,759 0 0 0 0 0 0 0 0 0Offsites Atm Flash (DRU) - BPD Bitumen 0 0 0 0 0 0 0 0 0 0 0 0 0 0 0 0Glycol System 5,512 gpm 596Misc - - 3,347 0 0 0 0 0 0 0CO2 CaptureAmine Unit 10,801 MTD CO2 4,320 -1,089Compressor 8,641 MTD CO2 49,251Steam BalanceDearators - KLB BFW 0 0 0 0 0 0 0 0 0 0 0 0 0 0 0 0Demin Plant KLB/h 0 0 0 0 0 0 0 0 0 0 0 0 0 0 0 0Condensate Flash KLB/h 0 -405 405VHP HP Letdowns KLB/h 0 -756 755 1HP MP Letdowns KLB/h 0 0 -755 755 0 0 0 0 0 0 0 0 0 0 0 0MP LP Letdowns KLB/h 0 0 0 -72 72 0 0 0 0 0 0 0 0 0 0 0
Indirect CO2 (Power Import) 1,657
TOTALS 112,694 0 0 0 0 0 0 0 0 1 71 0 285,119 0 12,457 8,641Notes
% Recovery 80%
FuelConsumed
JACOBS CONSULTANCY12/22/2008 Page 12 of 16
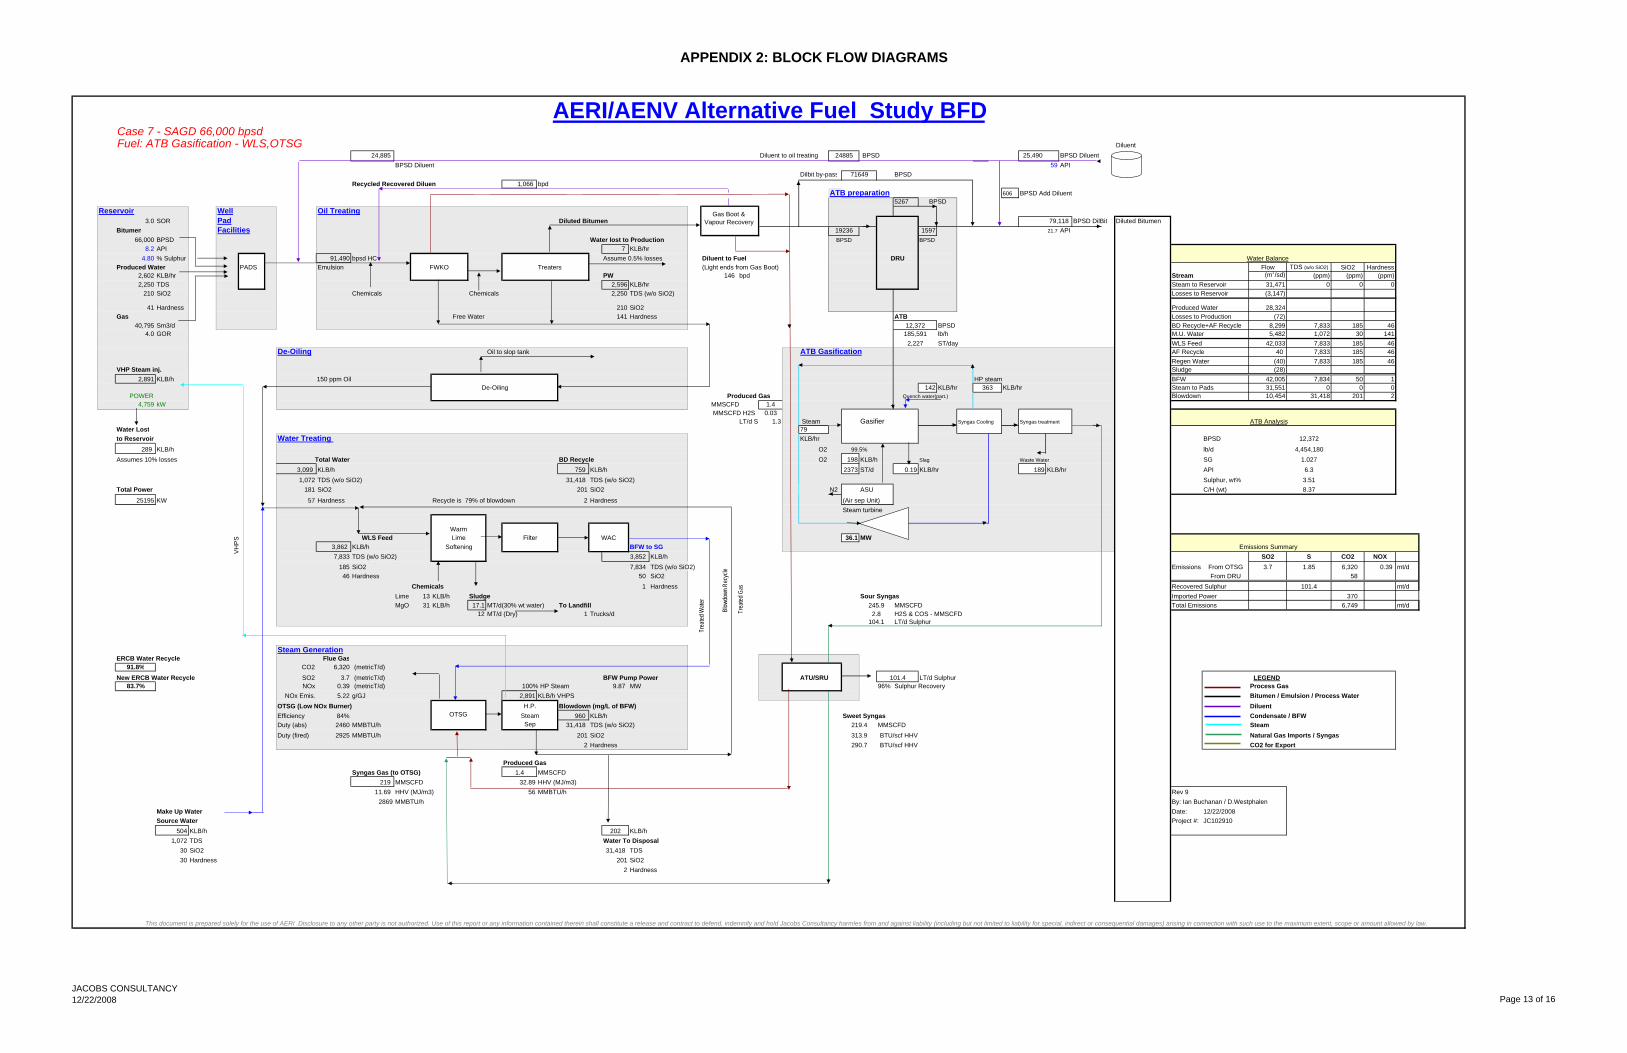
APPENDIX 2: BLOCK FLOW DIAGRAMS
Case 7 - SAGD 66,000 bpsdFuel: ATB Gasification - WLS,OTSG Diluent
24,885 Diluent to oil treating 25,490 BPSD DiluentBPSD Diluent 59 API
Dilbit by-pass BPSDRecycled Recovered Diluent 1,066 bpd
ATB preparation 606 BPSD Add Diluent5267 BPSD
Reservoir Well Oil Treating3.0 SOR Pad Diluted Bitumen 79,118 BPSD DilBit Diluted Bitumen
Bitumen Facilities 19236 1597 21.7 API 66,000 BPSD Water lost to Production BPSD
8.2 API 7 KLB/hr4.80 % Sulphur 91,490 bpsd HC Assume 0.5% losses Diluent to Fuel Water Balance
Produced Water PADS Emulsion FWKO Treaters (Light ends from Gas Boot) Flow TDS (w/o SiO2) SiO2 Hardness2,602 KLB/hr PW 146 bpd Stream (m3/sd) (ppm) (ppm) (ppm)2,250 TDS 2,596 KLB/hr Steam to Reservoir 31,471 0 0 0
210 SiO2 Chemicals Chemicals 2,250 TDS (w/o SiO2) Losses to Reservoir (3,147)
41 Hardness 210 SiO2 Produced Water 28,324Gas Free Water 141 Hardness ATB Losses to Production (72)
40,795 Sm3/d 12,372 BPSD BD Recycle+AF Recycle 8,299 7,833 185 464.0 GOR lb/h M.U. Water 5,482 1,072 30 141
2,227 ST/day WLS Feed 42,033 7,833 185 46De-Oiling Oil to slop tank ATB Gasification AF Recycle 40 7,833 185 46
Regen Water (40) 7,833 185 46VHP Steam inj. Sludge (28)
2,891 KLB/h 150 ppm Oil HP steam BFW 42,005 7,834 50 1De-Oiling 142 KLB/hr 363 KLB/hr Steam to Pads 31,551 0 0 0
POWER Produced Gas Quench water(part.) Blowdown 10,454 31,418 201 24,759 kW MMSCFD 1.4
MMSCFD H2S 0.03LT/d S 1.3 Steam Gasifier Syngas Cooling Syngas treatment ATB Analysis
Water Lost 79to Reservoir Water Treating KLB/hr BPSD 12,372
289 KLB/h O2 lb/d 4,454,180Assumes 10% losses Total Water BD Recycle O2 198 KLB/h Slag Waste Water SG 1.027
3,099 KLB/h 759 KLB/h 2373 ST/d 0.19 KLB/hr 189 KLB/hr API 6.31,072 TDS (w/o SiO2) 31,418 TDS (w/o SiO2) Sulphur, wt% 3.51
Total Power 181 SiO2 201 SiO2 N2 ASU C/H (wt) 8.37
25195 KW 57 Hardness Recycle is 79% of blowdown 2 Hardness (Air sep Unit)Steam turbine
WarmWLS Feed Lime Filter WAC 36.1 MW
3,862 KLB/h Softening BFW to SG Emissions Summary7,833 TDS (w/o SiO2) KLB/h SO2 S CO2 NOX
185 SiO2 TDS (w/o SiO2) Emissions From OTSG 3.7 1.85 6,320 0.39 mt/d46 Hardness SiO2 From DRU 58
Chemicals Hardness Recovered Sulphur 101.4 mt/dLime 13 KLB/h Sludge Sour Syngas Imported Power 370MgO 31 KLB/h 17.1 MT/d(30% wt water) To Landfill 245.9 MMSCFD Total Emissions 6,749 mt/d
12 MT/d (Dry) 1 Trucks/d H2S & COS - MMSCFD104.1 LT/d Sulphur
Steam GenerationERCB Water Recycle Flue Gas
91.8% CO2 6,320 (metricT/d)
New ERCB Water Recycle SO2 3.7 (metricT/d) BFW Pump Power ATU/SRU 101.4 LT/d Sulphur LEGEND83.7% NOx 0.39 (metricT/d) 100% HP Steam 9.87 MW 96% Sulphur Recovery Process Gas
NOx Emis. 5.22 g/GJ 2,891 KLB/h VHPS Bitumen / Emulsion / Process WaterOTSG (Low NOx Burner) H.P. DiluentEfficiency 84% OTSG Steam 960 KLB/h Sweet Syngas Condensate / BFWDuty (abs) 2460 MMBTU/h Sep 31,418 TDS (w/o SiO2) MMSCFD SteamDuty (fired) 2925 MMBTU/h 201 SiO2 BTU/scf HHV Natural Gas Imports / Syngas
2 Hardness BTU/scf HHV CO2 for Export
Produced GasSyngas Gas (to OTSG) 1.4 MMSCFD
219 MMSCFD 32.89 HHV (MJ/m3)11.69 HHV (MJ/m3) 56 MMBTU/h Rev 9
2869 MMBTU/h By: Ian Buchanan / D.WestphalenMake Up Water Date: 12/22/2008Source Water Project #: JC102910
504 KLB/h 202 KLB/h1,072 TDS Water To Disposal
30 SiO2 31,418 TDS30 Hardness 201 SiO2
2 Hardness
24885
This document is prepared solely for the use of AERI .Disclosure to any other party is not authorized. Use of this report or any information contained therein shall constitute a release and contract to defend, indemnify and hold Jacobs Consultancy harmles from and against liability (including but not limited to liability for special, indirect or consequential damages) arising in connection with such use to the maximum extent, scope or amount allowed by law.
0.0
2.8
99.5%
3,852
290.7
219.4313.9
Blowdown (mg/L of BFW)
7,834 50 1
AERI/AENV Alternative Fuel Study BFD
DRU
185,591
BPSD
71649
BPSD
Blow
down
Rec
ycle
Trea
ted W
ater
Trea
ted G
as
Gas Boot & Vapour Recovery
VH
PS
JACOBS CONSULTANCY12/22/2008 Page 13 of 16
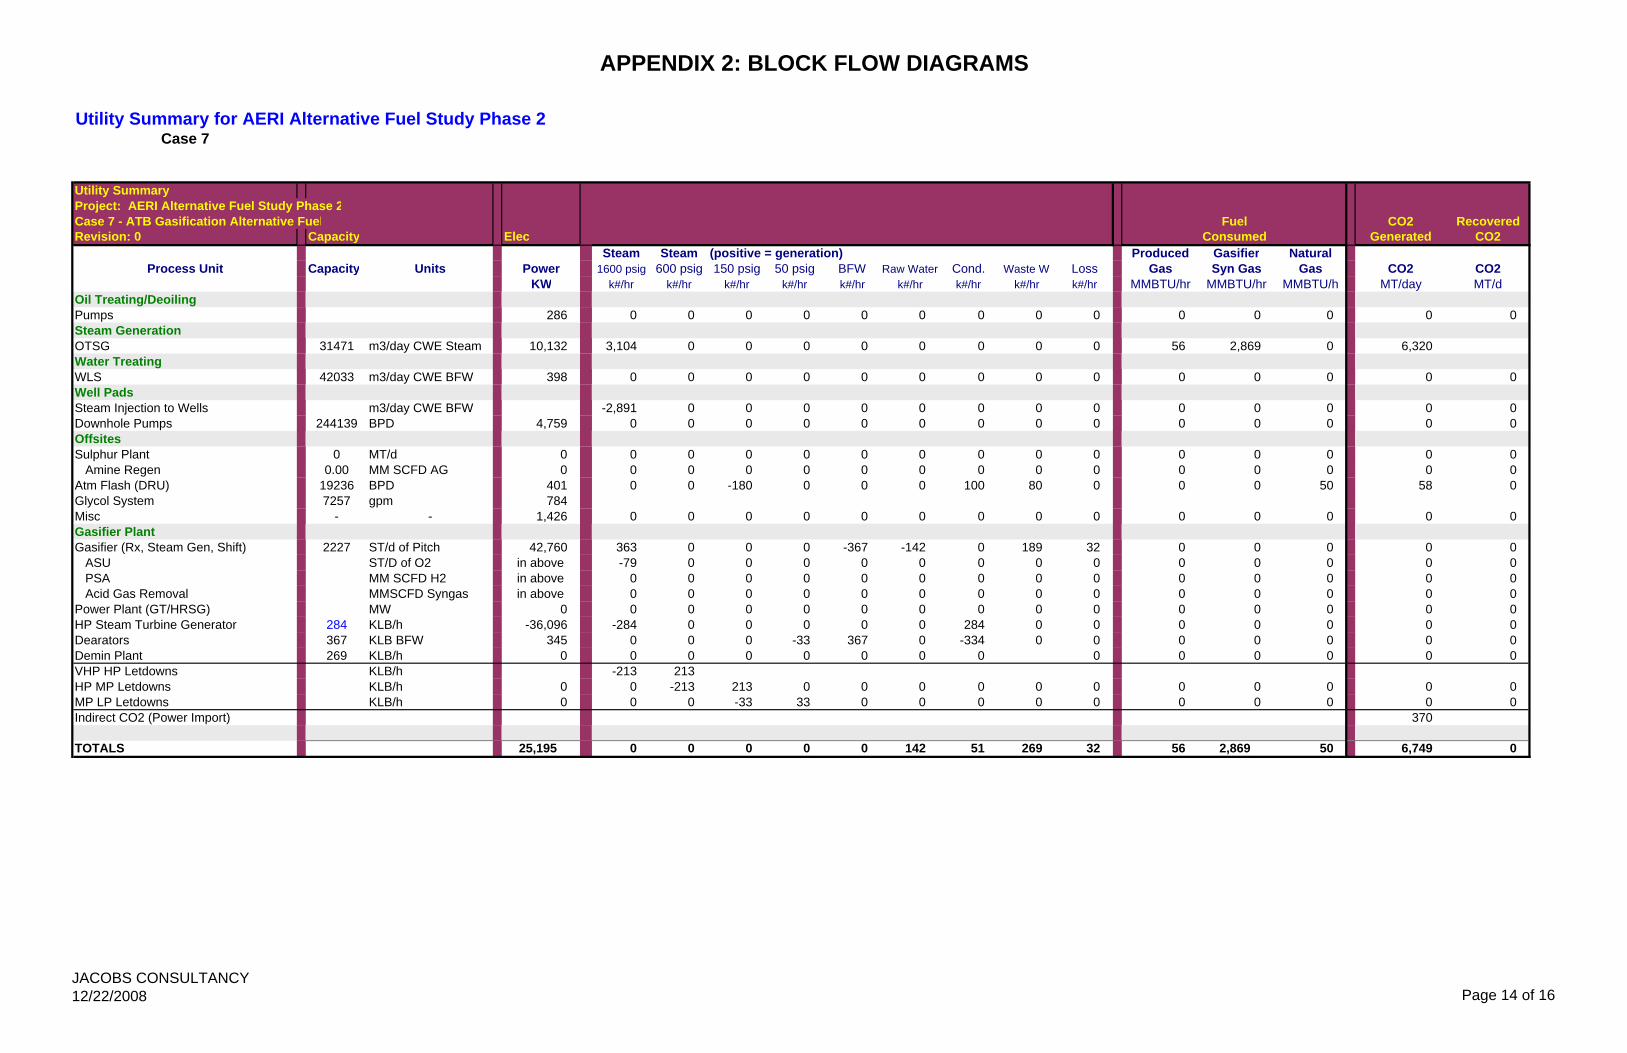
APPENDIX 2: BLOCK FLOW DIAGRAMS
Utility Summary for AERI Alternative Fuel Study Phase 2Case 7
Utility SummaryProject: AERI Alternative Fuel Study Phase 2Case 7 - ATB Gasification Alternative Fuel CO2 RecoveredRevision: 0 Capacity Elec Generated CO2
Steam Steam (positive = generation) Produced Gasifier NaturalProcess Unit Capacity Units Power 1600 psig 600 psig 150 psig 50 psig BFW Raw Water Cond. Waste W Loss Gas Syn Gas Gas CO2 CO2
KW k#/hr k#/hr k#/hr k#/hr k#/hr k#/hr k#/hr k#/hr k#/hr MMBTU/hr MMBTU/hr MMBTU/h MT/day MT/dOil Treating/DeoilingPumps 286 0 0 0 0 0 0 0 0 0 0 0 0 0 0Steam GenerationOTSG 31471 m3/day CWE Steam 10,132 3,104 0 0 0 0 0 0 0 0 56 2,869 0 6,320Water TreatingWLS 42033 m3/day CWE BFW 398 0 0 0 0 0 0 0 0 0 0 0 0 0 0Well PadsSteam Injection to Wells m3/day CWE BFW -2,891 0 0 0 0 0 0 0 0 0 0 0 0 0Downhole Pumps 244139 BPD 4,759 0 0 0 0 0 0 0 0 0 0 0 0 0 0Offsites Sulphur Plant 0 MT/d 0 0 0 0 0 0 0 0 0 0 0 0 0 0 0
Amine Regen 0.00 MM SCFD AG 0 0 0 0 0 0 0 0 0 0 0 0 0 0 0Atm Flash (DRU) 19236 BPD 401 0 0 -180 0 0 0 100 80 0 0 0 50 58 0Glycol System 7257 gpm 784Misc - - 1,426 0 0 0 0 0 0 0 0 0 0 0 0 0 0Gasifier PlantGasifier (Rx, Steam Gen, Shift) 2227 ST/d of Pitch 42,760 363 0 0 0 -367 -142 0 189 32 0 0 0 0 0
ASU ST/D of O2 in above -79 0 0 0 0 0 0 0 0 0 0 0 0 0PSA MM SCFD H2 in above 0 0 0 0 0 0 0 0 0 0 0 0 0 0Acid Gas Removal MMSCFD Syngas in above 0 0 0 0 0 0 0 0 0 0 0 0 0 0
Power Plant (GT/HRSG) MW 0 0 0 0 0 0 0 0 0 0 0 0 0 0 0HP Steam Turbine Generator 284 KLB/h -36,096 -284 0 0 0 0 0 284 0 0 0 0 0 0 0Dearators 367 KLB BFW 345 0 0 0 -33 367 0 -334 0 0 0 0 0 0 0Demin Plant 269 KLB/h 0 0 0 0 0 0 0 0 0 0 0 0 0 0VHP HP Letdowns KLB/h -213 213HP MP Letdowns KLB/h 0 0 -213 213 0 0 0 0 0 0 0 0 0 0 0MP LP Letdowns KLB/h 0 0 0 -33 33 0 0 0 0 0 0 0 0 0 0Indirect CO2 (Power Import) 370
TOTALS 25,195 0 0 0 0 0 142 51 269 32 56 2,869 50 6,749 0
FuelConsumed
JACOBS CONSULTANCY12/22/2008 Page 14 of 16
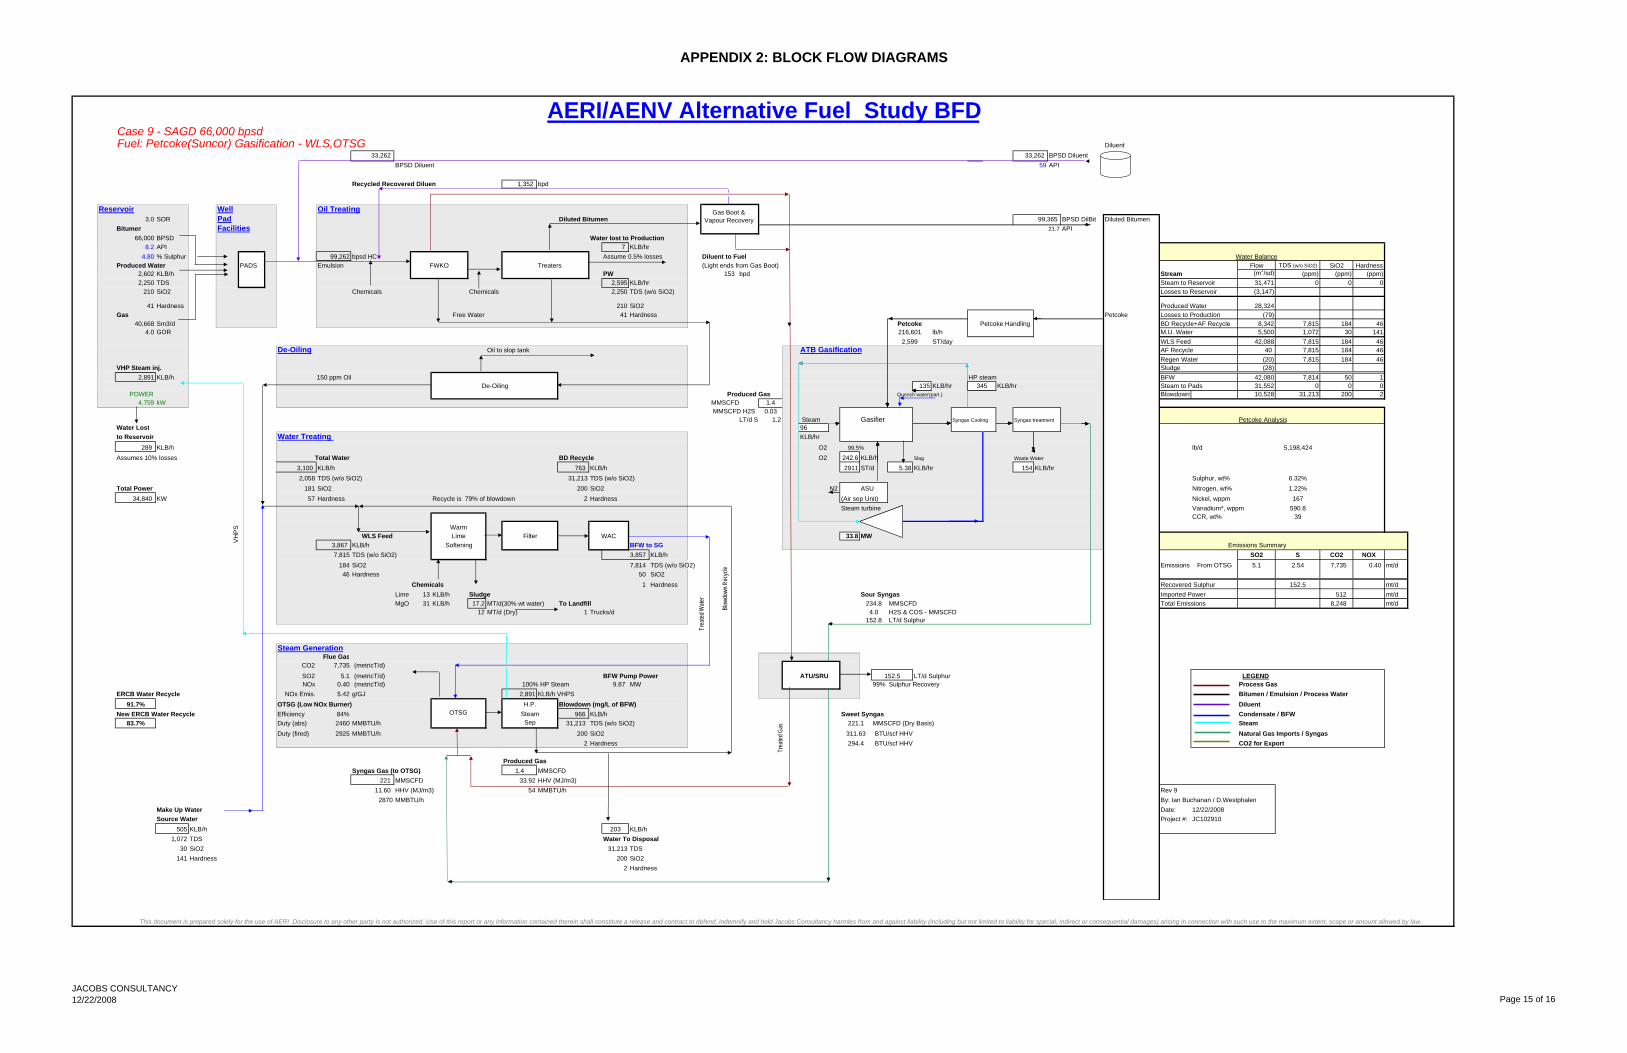
APPENDIX 2: BLOCK FLOW DIAGRAMS
Case 9 - SAGD 66,000 bpsdFuel: Petcoke(Suncor) Gasification - WLS,OTSG Diluent
33,262 BPSD DiluentBPSD Diluent 59 API
Recycled Recovered Diluent 1,352 bpd
Reservoir Well Oil Treating3.0 SOR Pad Diluted Bitumen 99,365 BPSD DilBit Diluted Bitumen
Bitumen Facilities API 66,000 BPSD Water lost to Production
8.2 API 7 KLB/hr4.80 % Sulphur 99,262 bpsd HC Assume 0.5% losses Diluent to Fuel Water Balance
Produced Water PADS Emulsion FWKO Treaters (Light ends from Gas Boot) Flow TDS (w/o SiO2) SiO2 Hardness2,602 KLB/h PW 153 bpd Stream (m3/sd) (ppm) (ppm) (ppm)2,250 TDS 2,595 KLB/hr Steam to Reservoir 31,471 0 0 0
210 SiO2 Chemicals Chemicals 2,250 TDS (w/o SiO2) Losses to Reservoir (3,147)
41 Hardness 210 SiO2 Produced Water 28,324Gas Free Water 41 Hardness Petcoke Losses to Production (79)
40,668 Sm3/d Petcoke Handling BD Recycle+AF Recycle 8,342 7,815 184 464.0 GOR 216,601 lb/h M.U. Water 5,500 1,072 30 141
2,599 ST/day WLS Feed 42,088 7,815 184 46De-Oiling Oil to slop tank ATB Gasification AF Recycle 40 7,815 184 46
Regen Water (20) 7,815 184 46VHP Steam inj. Sludge (28)
2,891 KLB/h 150 ppm Oil HP steam BFW 42,080 7,814 50 1De-Oiling 135 KLB/hr 345 KLB/hr Steam to Pads 31,552 0 0 0
POWER Produced Gas Quench water(part.) Blowdown 10,528 31,213 200 24,759 kW MMSCFD 1.4
MMSCFD H2S 0.03LT/d S 1.2 Steam Gasifier Syngas Cooling Syngas treatment Petcoke Analysis
Water Lost 96to Reservoir Water Treating KLB/hr
289 KLB/h O2 lb/d 5,198,424Assumes 10% losses Total Water BD Recycle O2 242.6 KLB/h Slag Waste Water
3,100 KLB/h 763 KLB/h 2911 ST/d 5.38 KLB/hr 154 KLB/hr2,058 TDS (w/o SiO2) 31,213 TDS (w/o SiO2) Sulphur, wt% 6.32%
Total Power 181 SiO2 200 SiO2 N2 ASU Nitrogen, wt% 1.22%34,840 KW 57 Hardness Recycle is 79% of blowdown 2 Hardness (Air sep Unit) Nickel, wppm 167
Steam turbine Vanadium*, wppm 590.8CCR, wt% 39
WarmWLS Feed Lime Filter WAC 33.8 MW
3,867 KLB/h Softening BFW to SG Emissions Summary7,815 TDS (w/o SiO2) KLB/h SO2 S CO2 NOX
184 SiO2 TDS (w/o SiO2) Emissions From OTSG 5.1 2.54 7,735 0.40 mt/d46 Hardness SiO2
Chemicals Hardness Recovered Sulphur 152.5 mt/dLime 13 KLB/h Sludge Sour Syngas Imported Power 512 mt/dMgO 31 KLB/h 17.2 MT/d(30% wt water) To Landfill MMSCFD Total Emissions 8,248 mt/d
12 MT/d (Dry) 1 Trucks/d H2S & COS - MMSCFDLT/d Sulphur
Steam GenerationFlue Gas
CO2 7,735 (metricT/d)
SO2 5.1 (metricT/d) BFW Pump Power ATU/SRU 152.5 LT/d Sulphur LEGENDNOx 0.40 (metricT/d) 100% HP Steam 9.87 MW 99% Sulphur Recovery Process Gas
ERCB Water Recycle NOx Emis. 5.42 g/GJ 2,891 KLB/h VHPS Bitumen / Emulsion / Process Water91.7% OTSG (Low NOx Burner) H.P. Diluent
New ERCB Water Recycle Efficiency 84% OTSG Steam 966 KLB/h Sweet Syngas Condensate / BFW83.7% Duty (abs) 2460 MMBTU/h Sep 31,213 TDS (w/o SiO2) MMSCFD (Dry Basis) Steam
Duty (fired) 2925 MMBTU/h 200 SiO2 BTU/scf HHV Natural Gas Imports / Syngas2 Hardness BTU/scf HHV CO2 for Export
Produced GasSyngas Gas (to OTSG) 1.4 MMSCFD
221 MMSCFD 33.92 HHV (MJ/m3)11.60 HHV (MJ/m3) 54 MMBTU/h Rev 9
2870 MMBTU/h By: Ian Buchanan / D.WestphalenMake Up Water Date: 12/22/2008Source Water Project #: JC102910
505 KLB/h 203 KLB/h1,072 TDS Water To Disposal
30 SiO2 31,213 TDS141 Hardness 200 SiO2
2 Hardness
AERI/AENV Alternative Fuel Study BFD
This document is prepared solely for the use of AERI .Disclosure to any other party is not authorized. Use of this report or any information contained therein shall constitute a release and contract to defend, indemnify and hold Jacobs Consultancy harmles from and against liability (including but not limited to liability for special, indirect or consequential damages) arising in connection with such use to the maximum extent, scope or amount allowed by law.
Blowdown (mg/L of BFW)
7,814 50 1
3,857
Petcoke
99.5%
294.4
221.1311.63
234.84.0
0.0
152.8
33,262
21.7
Blow
down
Rec
ycle
Trea
ted W
ater
Trea
ted G
as
Gas Boot & Vapour Recovery
VH
PS
JACOBS CONSULTANCY12/22/2008 Page 15 of 16
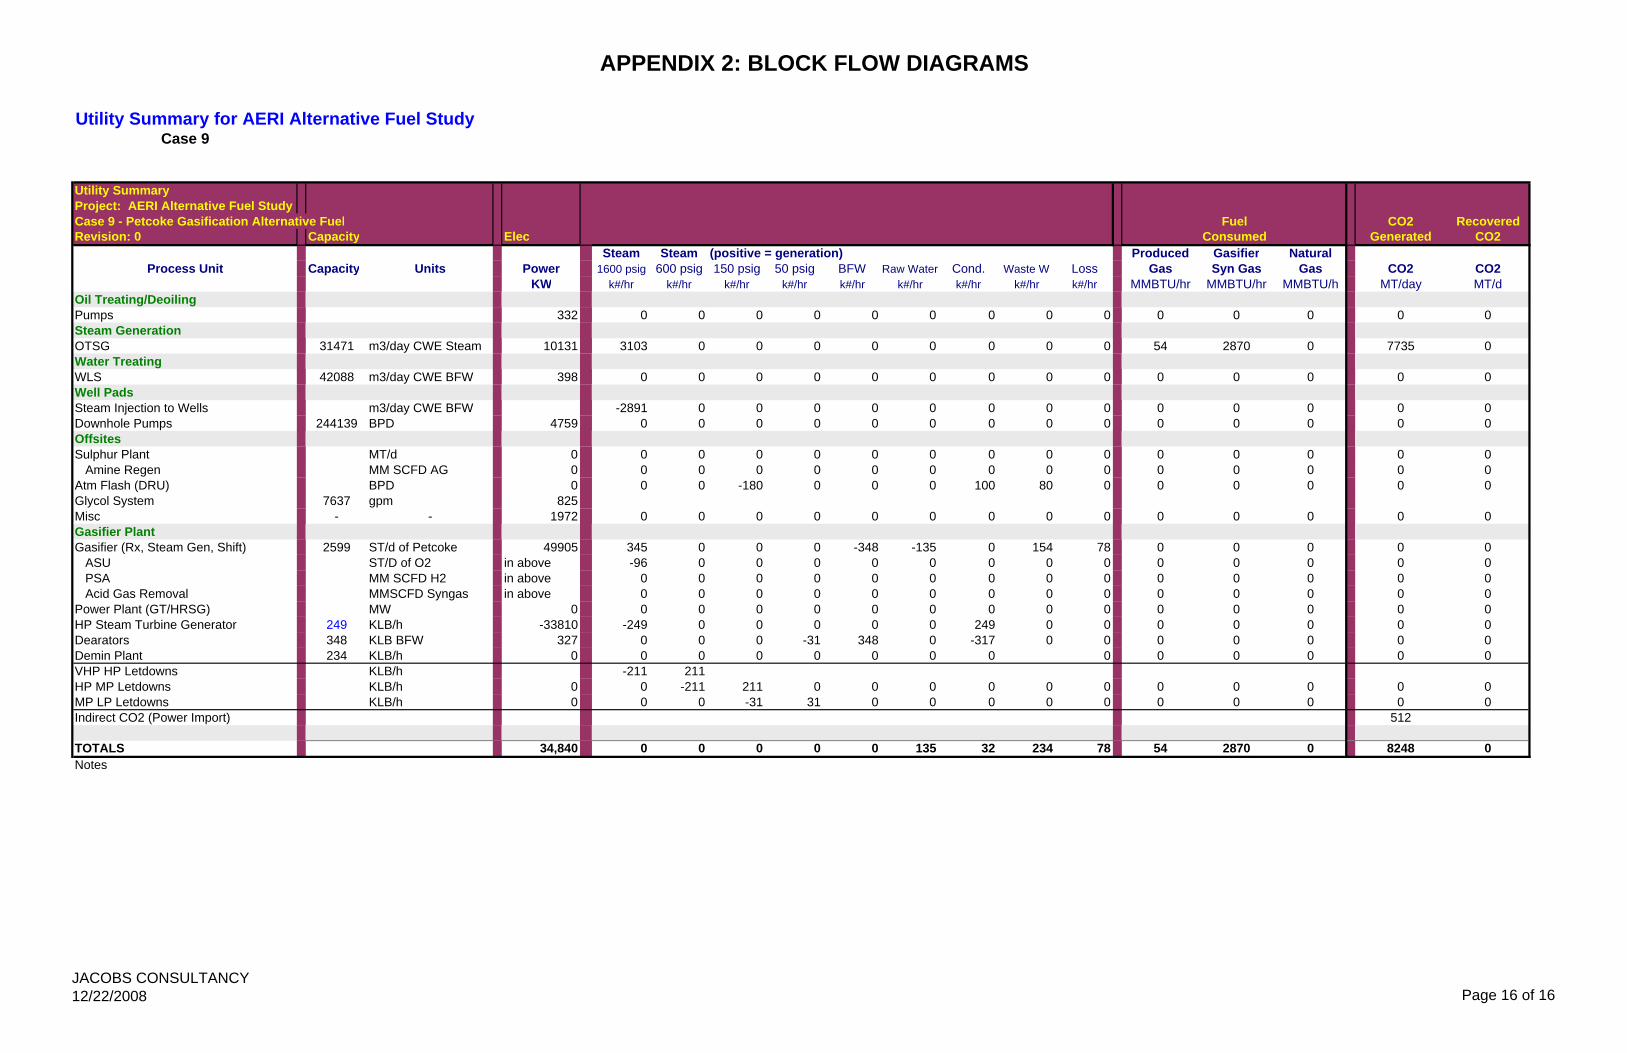
APPENDIX 2: BLOCK FLOW DIAGRAMS
Utility Summary for AERI Alternative Fuel StudyCase 9
Utility SummaryProject: AERI Alternative Fuel Study Case 9 - Petcoke Gasification Alternative Fuel CO2 RecoveredRevision: 0 Capacity Elec Generated CO2
Steam Steam (positive = generation) Produced Gasifier NaturalProcess Unit Capacity Units Power 1600 psig 600 psig 150 psig 50 psig BFW Raw Water Cond. Waste W Loss Gas Syn Gas Gas CO2 CO2
KW k#/hr k#/hr k#/hr k#/hr k#/hr k#/hr k#/hr k#/hr k#/hr MMBTU/hr MMBTU/hr MMBTU/h MT/day MT/dOil Treating/DeoilingPumps 332 0 0 0 0 0 0 0 0 0 0 0 0 0 0Steam GenerationOTSG 31471 m3/day CWE Steam 10131 3103 0 0 0 0 0 0 0 0 54 2870 0 7735 0Water TreatingWLS 42088 m3/day CWE BFW 398 0 0 0 0 0 0 0 0 0 0 0 0 0 0Well PadsSteam Injection to Wells m3/day CWE BFW -2891 0 0 0 0 0 0 0 0 0 0 0 0 0Downhole Pumps 244139 BPD 4759 0 0 0 0 0 0 0 0 0 0 0 0 0 0Offsites Sulphur Plant MT/d 0 0 0 0 0 0 0 0 0 0 0 0 0 0 0
Amine Regen MM SCFD AG 0 0 0 0 0 0 0 0 0 0 0 0 0 0 0Atm Flash (DRU) BPD 0 0 0 -180 0 0 0 100 80 0 0 0 0 0 0Glycol System 7637 gpm 825Misc - - 1972 0 0 0 0 0 0 0 0 0 0 0 0 0 0Gasifier PlantGasifier (Rx, Steam Gen, Shift) 2599 ST/d of Petcoke 49905 345 0 0 0 -348 -135 0 154 78 0 0 0 0 0
ASU ST/D of O2 in above -96 0 0 0 0 0 0 0 0 0 0 0 0 0PSA MM SCFD H2 in above 0 0 0 0 0 0 0 0 0 0 0 0 0 0Acid Gas Removal MMSCFD Syngas in above 0 0 0 0 0 0 0 0 0 0 0 0 0 0
Power Plant (GT/HRSG) MW 0 0 0 0 0 0 0 0 0 0 0 0 0 0 0HP Steam Turbine Generator 249 KLB/h -33810 -249 0 0 0 0 0 249 0 0 0 0 0 0 0Dearators 348 KLB BFW 327 0 0 0 -31 348 0 -317 0 0 0 0 0 0 0Demin Plant 234 KLB/h 0 0 0 0 0 0 0 0 0 0 0 0 0 0VHP HP Letdowns KLB/h -211 211HP MP Letdowns KLB/h 0 0 -211 211 0 0 0 0 0 0 0 0 0 0 0MP LP Letdowns KLB/h 0 0 0 -31 31 0 0 0 0 0 0 0 0 0 0Indirect CO2 (Power Import) 512
TOTALS 34,840 0 0 0 0 0 135 32 234 78 54 2870 0 8248 0Notes
FuelConsumed
JACOBS CONSULTANCY12/22/2008 Page 16 of 16
Appendix 3.
Decision Matrix Analysis
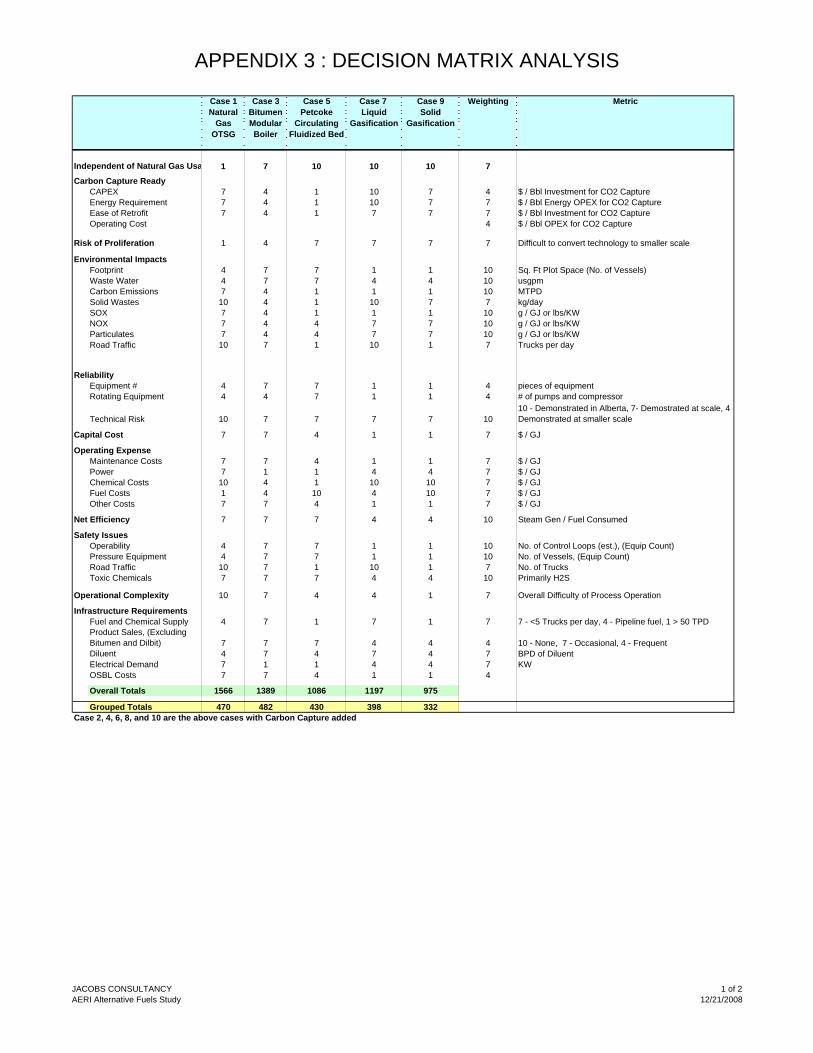
APPENDIX 3 : DECISION MATRIX ANALYSIS
Case 1 Case 3 Case 5 Case 7 Case 9 Weighting MetricNatural
Gas OTSG
Bitumen Modular Boiler
Petcoke Circulating
Fluidized Bed
Liquid Gasification
Solid Gasification
Independent of Natural Gas Usa 1 7 10 10 10 7
Carbon Capture ReadyCAPEX 7 4 1 10 7 4 $ / Bbl Investment for CO2 CaptureEnergy Requirement 7 4 1 10 7 7 $ / Bbl Energy OPEX for CO2 CaptureEase of Retrofit 7 4 1 7 7 7 $ / Bbl Investment for CO2 CaptureOperating Cost 4 $ / Bbl OPEX for CO2 Capture
Risk of Proliferation 1 4 7 7 7 7 Difficult to convert technology to smaller scale
Environmental ImpactsFootprint 4 7 7 1 1 10 Sq. Ft Plot Space (No. of Vessels)Waste Water 4 7 7 4 4 10 usgpmCarbon Emissions 7 4 1 1 1 10 MTPDSolid Wastes 10 4 1 10 7 7 kg/daySOX 7 4 1 1 1 10 g / GJ or lbs/KWNOX 7 4 4 7 7 10 g / GJ or lbs/KWParticulates 7 4 4 7 7 10 g / GJ or lbs/KWRoad Traffic 10 7 1 10 1 7 Trucks per day
ReliabilityEquipment # 4 7 7 1 1 4 pieces of equipmentRotating Equipment 4 4 7 1 1 4 # of pumps and compressor
Technical Risk 10 7 7 7 7 1010 - Demonstrated in Alberta, 7- Demostrated at scale, 4 -Demonstrated at smaller scale
Capital Cost 7 7 4 1 1 7 $ / GJ
Operating ExpenseMaintenance Costs 7 7 4 1 1 7 $ / GJPower 7 1 1 4 4 7 $ / GJChemical Costs 10 4 1 10 10 7 $ / GJFuel Costs 1 4 10 4 10 7 $ / GJOther Costs 7 7 4 1 1 7 $ / GJ
Net Efficiency 7 7 7 4 4 10 Steam Gen / Fuel Consumed
Safety IssuesOperability 4 7 7 1 1 10 No. of Control Loops (est.), (Equip Count)Pressure Equipment 4 7 7 1 1 10 No. of Vessels, (Equip Count)Road Traffic 10 7 1 10 1 7 No. of TrucksToxic Chemicals 7 7 7 4 4 10 Primarily H2S
Operational Complexity 10 7 4 4 1 7 Overall Difficulty of Process Operation
Infrastructure RequirementsFuel and Chemical Supply 4 7 1 7 1 7 7 - <5 Trucks per day, 4 - Pipeline fuel, 1 > 50 TPDProduct Sales, (Excluding Bitumen and Dilbit) 7 7 7 4 4 4 10 - None, 7 - Occasional, 4 - FrequentDiluent 4 7 4 7 4 7 BPD of DiluentElectrical Demand 7 1 1 4 4 7 KWOSBL Costs 7 7 4 1 1 4
Overall Totals 1566 1389 1086 1197 975
Grouped Totals 470 482 430 398 332Case 2, 4, 6, 8, and 10 are the above cases with Carbon Capture added
JACOBS CONSULTANCYAERI Alternative Fuels Study
1 of 212/21/2008
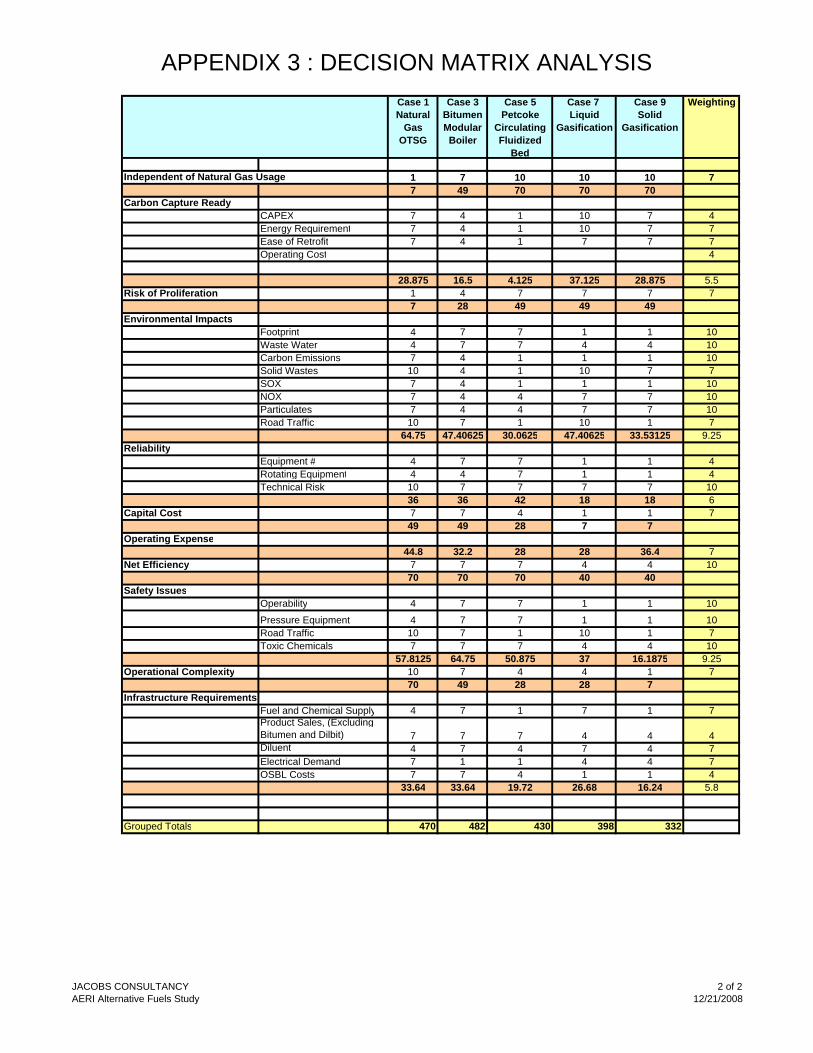
APPENDIX 3 : DECISION MATRIX ANALYSISCase 1 Case 3 Case 5 Case 7 Case 9 WeightingNatural
Gas OTSG
Bitumen Modular Boiler
Petcoke Circulating Fluidized
Bed
Liquid Gasification
Solid Gasification
Independent of Natural Gas Usage 1 7 10 10 10 77 49 70 70 70
Carbon Capture ReadyCAPEX 7 4 1 10 7 4Energy Requirement 7 4 1 10 7 7Ease of Retrofit 7 4 1 7 7 7Operating Cost 4
28.875 16.5 4.125 37.125 28.875 5.5Risk of Proliferation 1 4 7 7 7 7
7 28 49 49 49Environmental Impacts
Footprint 4 7 7 1 1 10Waste Water 4 7 7 4 4 10Carbon Emissions 7 4 1 1 1 10Solid Wastes 10 4 1 10 7 7SOX 7 4 1 1 1 10NOX 7 4 4 7 7 10Particulates 7 4 4 7 7 10Road Traffic 10 7 1 10 1 7
64.75 47.40625 30.0625 47.40625 33.53125 9.25Reliability
Equipment # 4 7 7 1 1 4Rotating Equipment 4 4 7 1 1 4Technical Risk 10 7 7 7 7 10
36 36 42 18 18 6Capital Cost 7 7 4 1 1 7
49 49 28 7 7Operating Expense
44.8 32.2 28 28 36.4 7Net Efficiency 7 7 7 4 4 10
70 70 70 40 40Safety Issues
Operability 4 7 7 1 1 10
Pressure Equipment 4 7 7 1 1 10Road Traffic 10 7 1 10 1 7Toxic Chemicals 7 7 7 4 4 10
57.8125 64.75 50.875 37 16.1875 9.25Operational Complexity 10 7 4 4 1 7
70 49 28 28 7Infrastructure Requirements
Fuel and Chemical Supply 4 7 1 7 1 7Product Sales, (Excluding Bitumen and Dilbit) 7 7 7 4 4 4Diluent 4 7 4 7 4 7Electrical Demand 7 1 1 4 4 7OSBL Costs 7 7 4 1 1 4
33.64 33.64 19.72 26.68 16.24 5.8
Grouped Totals 470 482 430 398 332
JACOBS CONSULTANCYAERI Alternative Fuels Study
2 of 212/21/2008

Jacobs Consultancy Member, Jacobs Engineering Group
United States Offices:
5995 Rogerdale RoadHouston, Texas 77072832.351.7800 (phone)
832.351.7887 (fax)
525 West MonroeSuite 1350
Chicago, Illinois 60661312.655.9207 (phone)
312.655.9706 (fax)
Canada Office:
205 Quarry Park Boulevard SECalgary, Alberta T2C 3E7 Canada
403.640.8007 (phone)403.385.1543 (fax)
United Kingdom Office:
16 Connaught PlaceLondon W2 2ES England
+44 (0) 20.7087.8700 (phone)+44 (0) 20.7706.7141 (fax)
Netherlands Office:
Plesmanlaan 100, 2332 CB LeidenP.O. Box 141, 2300 AC Leiden
The Netherlands+31.71.582.7111 (phone)
+31.71.582.7050 (fax)
www.jacobsconsultancy.com