Embed Size (px)
Citation preview
Alternative Energy and Agriculture:Perspectives on Cellulosic Feedstock and
Cellulosic Biorefineries
Francis Epplin
Department of Agricultural Economics
Oklahoma State University
Southern Association of Agricultural Sciences - Atlanta, GA
February 1 – 4, 2009
Collaborators
Plant & Soil SciencesCharles Taliaferro (Retired) – grass breeding Yanqi Wu – feedstock development
Biosystems & Agricultural EngineeringRay Huhnke – biomass harvest and storageDani Bellmer - gasificationTim Bowser - gasificationMark Wilkins - bioconversion
Chemical EngineeringA.J. Johannes – process engineeringRandy Lewis (BYU) – bioreactor, bioconversion
MicrobiologyRalph Tanner (OU) – microbial catalyst development
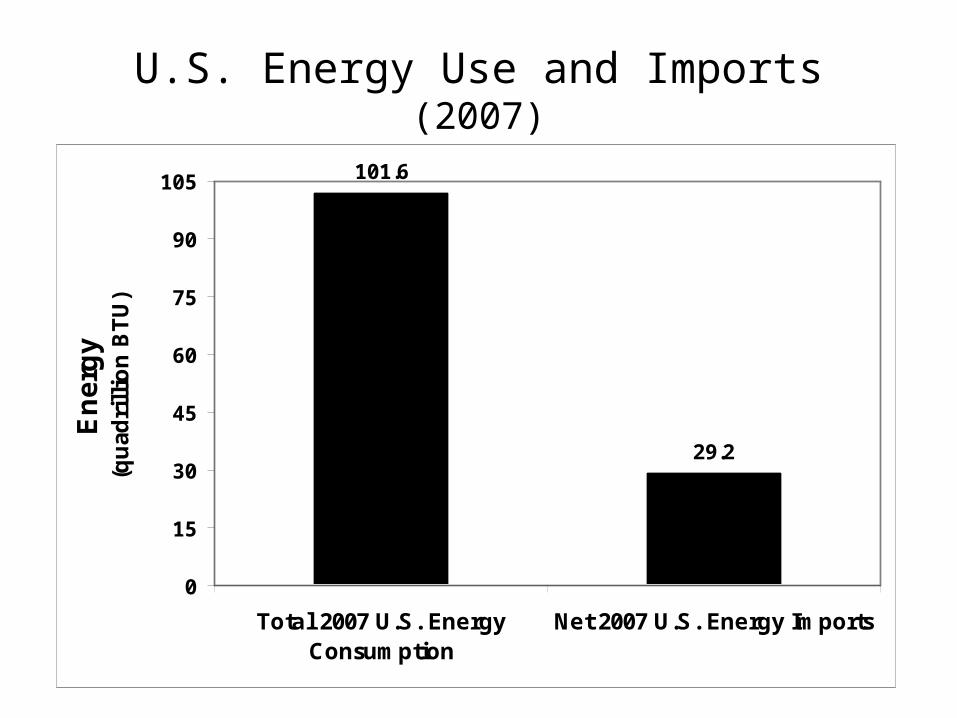
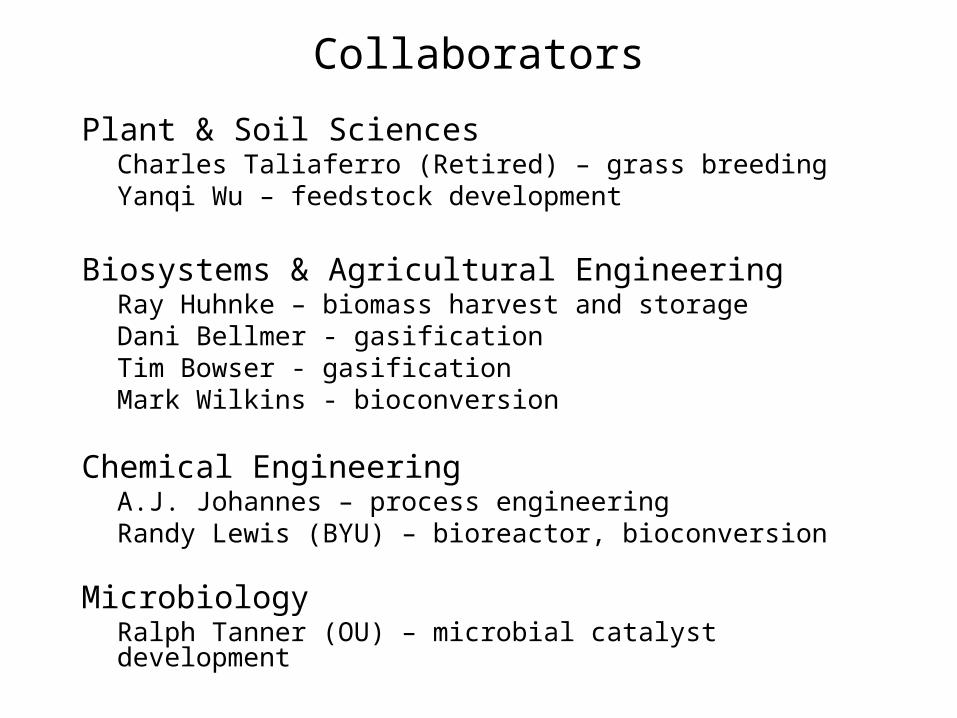
U.S. Energy Use and Imports (2007)
101.6
29.2
0
15
30
45
60
75
90
105
Total 2007 U.S. EnergyConsumption
Net 2007 U.S. Energy Imports
En
erg
y(q
uad
rill
ion
BT
U)
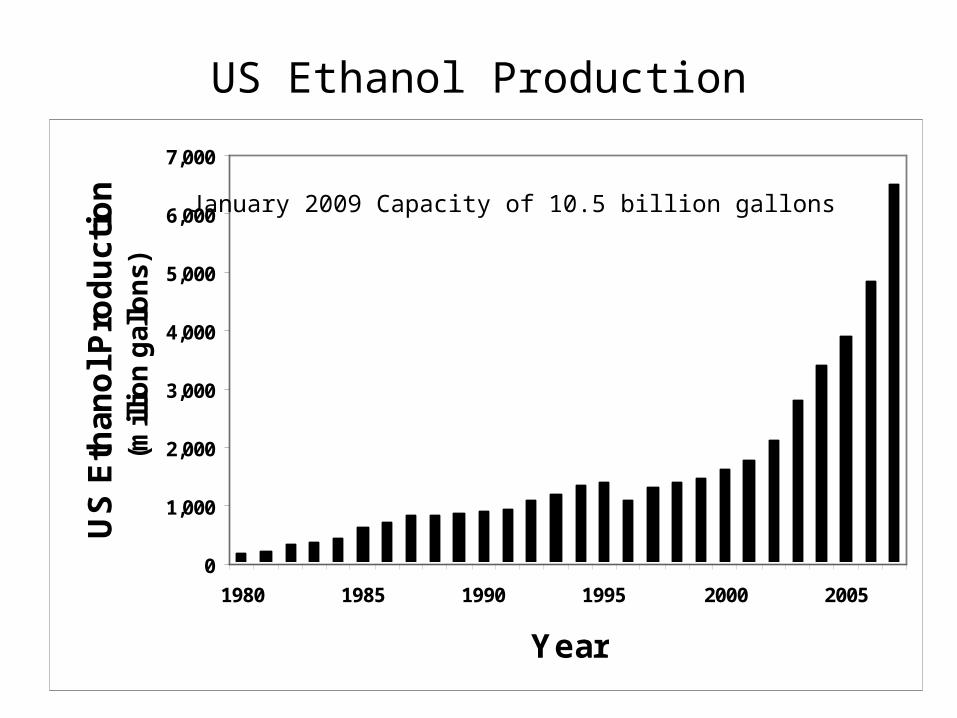
US Ethanol Production
0
1,000
2,000
3,000
4,000
5,000
6,000
7,000
1980 1985 1990 1995 2000 2005
Year
US
Eth
ano
l Pro
du
ctio
n(m
illio
n g
allo
ns)
January 2009 Capacity of 10.5 billion gallons
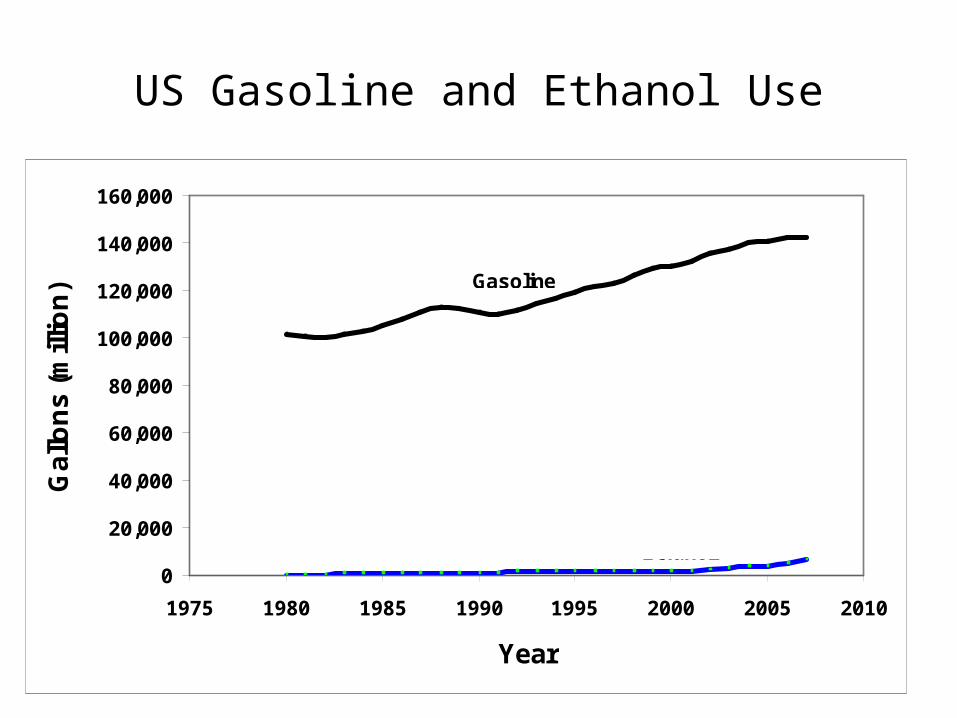
US Gasoline and Ethanol Use
0
20,000
40,000
60,000
80,000
100,000
120,000
140,000
160,000
1975 1980 1985 1990 1995 2000 2005 2010
Year
Ga
llon
s (
mill
ion
) Gasoline
Ethanol
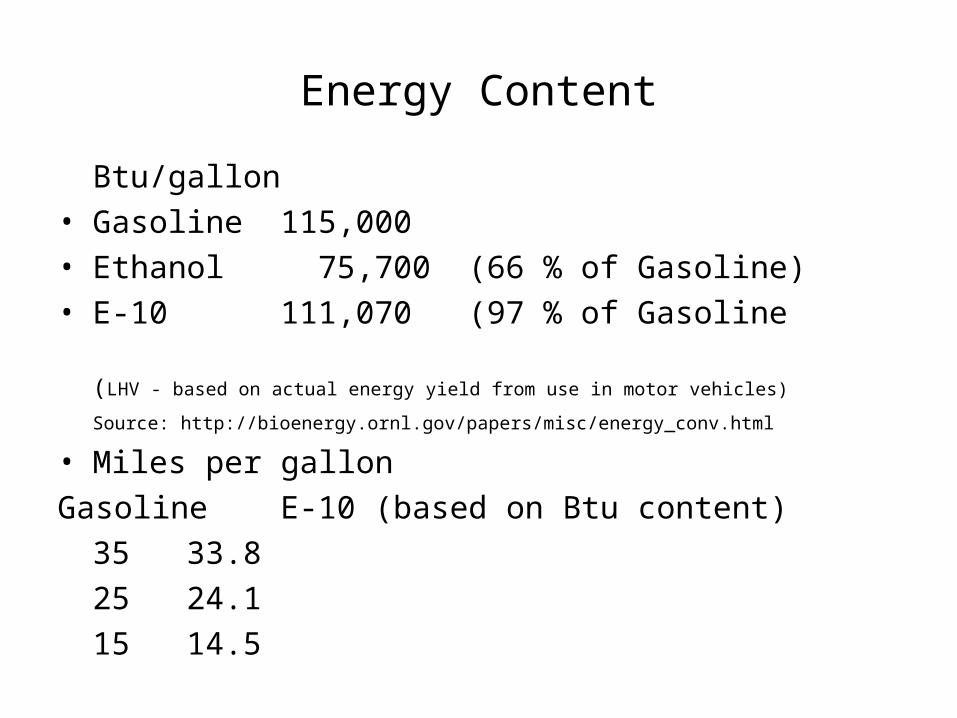
Energy Content
Btu/gallon• Gasoline 115,000 • Ethanol 75,700 (66 % of Gasoline)• E-10 111,070 (97 % of Gasoline
(LHV - based on actual energy yield from use in motor vehicles)
Source: http://bioenergy.ornl.gov/papers/misc/energy_conv.html
• Miles per gallon Gasoline E-10 (based on Btu content)
35 33.825 24.115 14.5
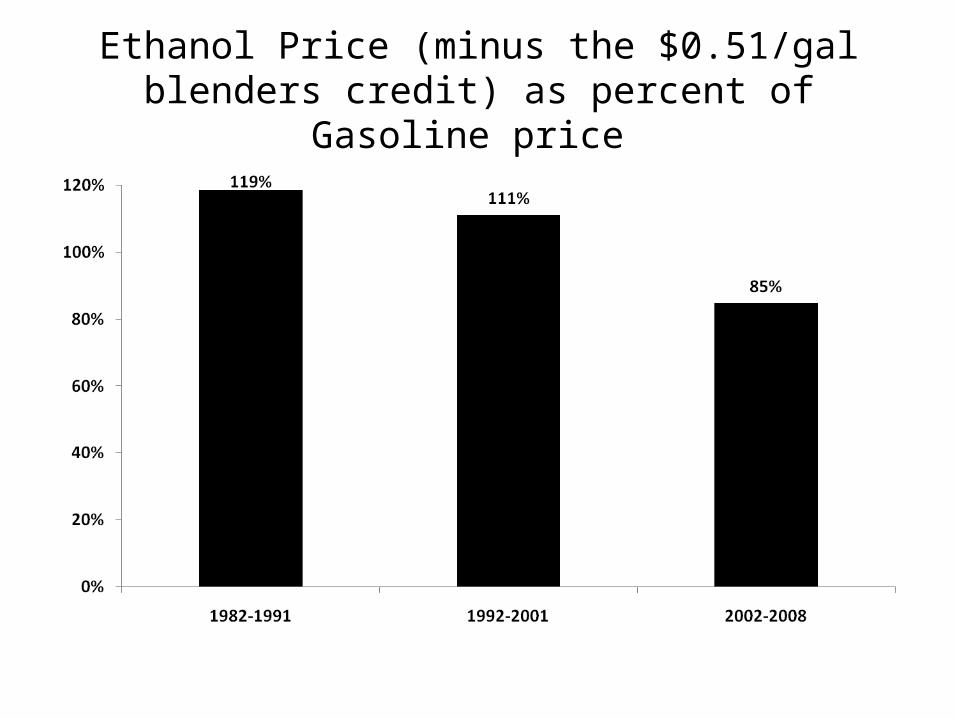
Ethanol Price (minus the $0.51/gal blenders credit) as percent of Gasoline price
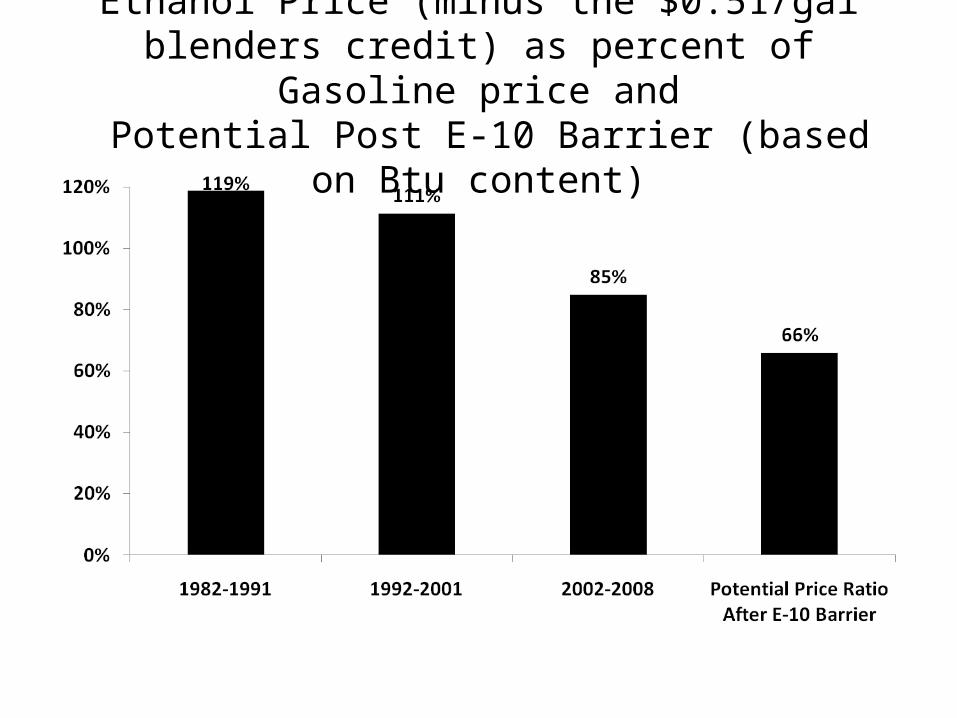
Ethanol Price (minus the $0.51/gal blenders credit) as percent of Gasoline price and
Potential Post E-10 Barrier (based on Btu content)
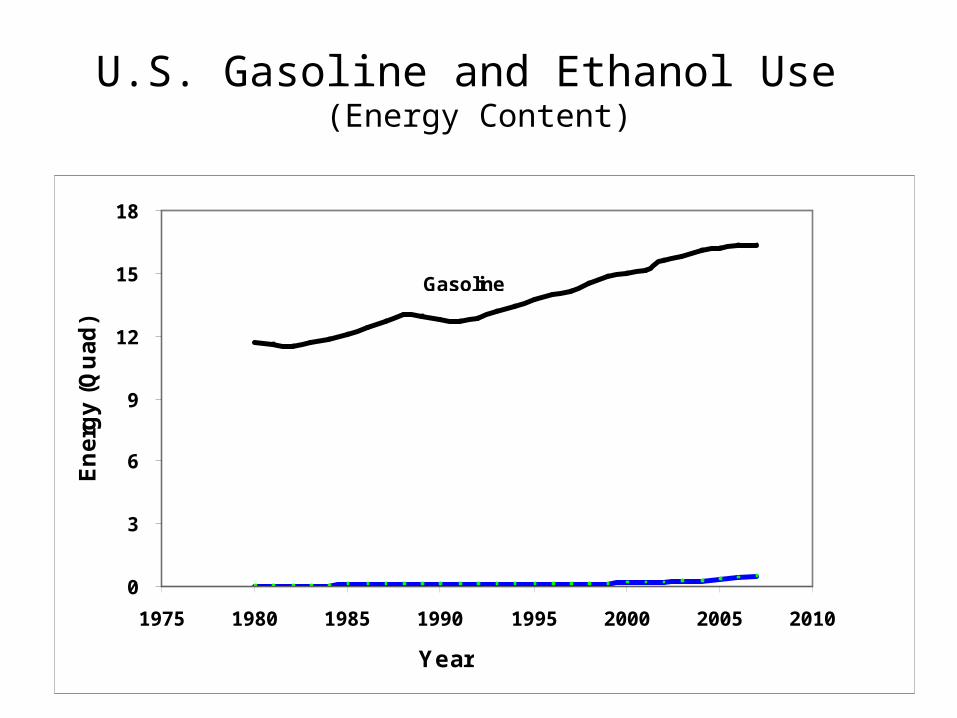
U.S. Gasoline and Ethanol Use (Energy Content)
0
3
6
9
12
15
18
1975 1980 1985 1990 1995 2000 2005 2010
Year
En
erg
y (
Qu
ad
)
Gasoline
Ethanol
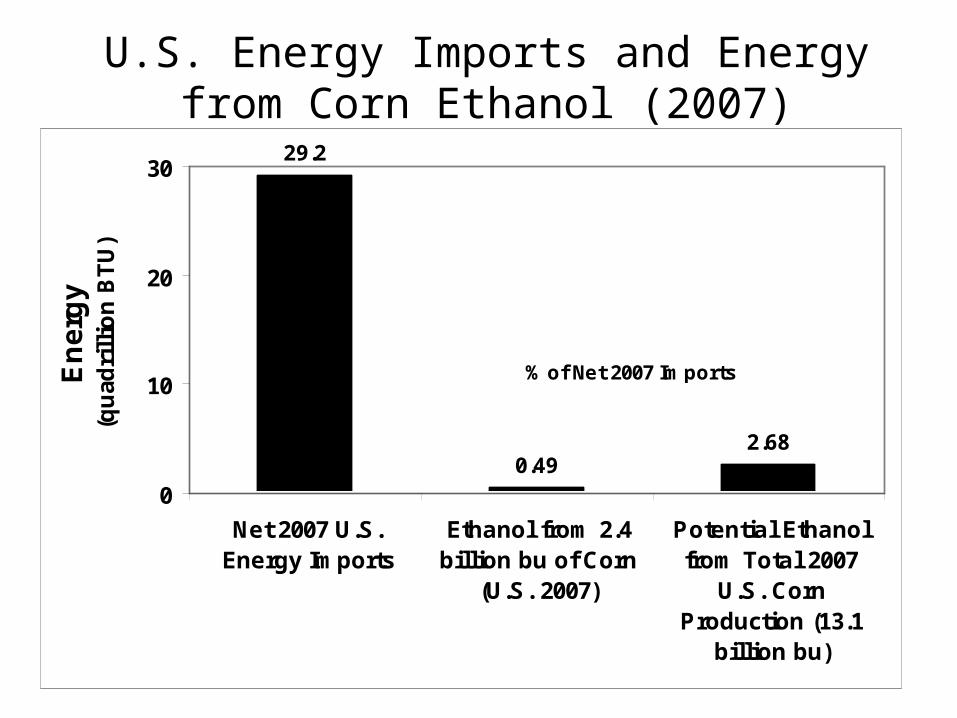
U.S. Energy Imports and Energy from Corn Ethanol (2007)
29.2
0.492.68
0
10
20
30
Net 2007 U.S.Energy Imports
Ethanol from 2.4billion bu of Corn
(U.S. 2007)
Potential Ethanolfrom Total 2007
U.S. CornProduction (13.1
billion bu)
En
erg
y(q
uad
rill
ion
BT
U)
% of Net 2007 Imports
1.7% 9.2%
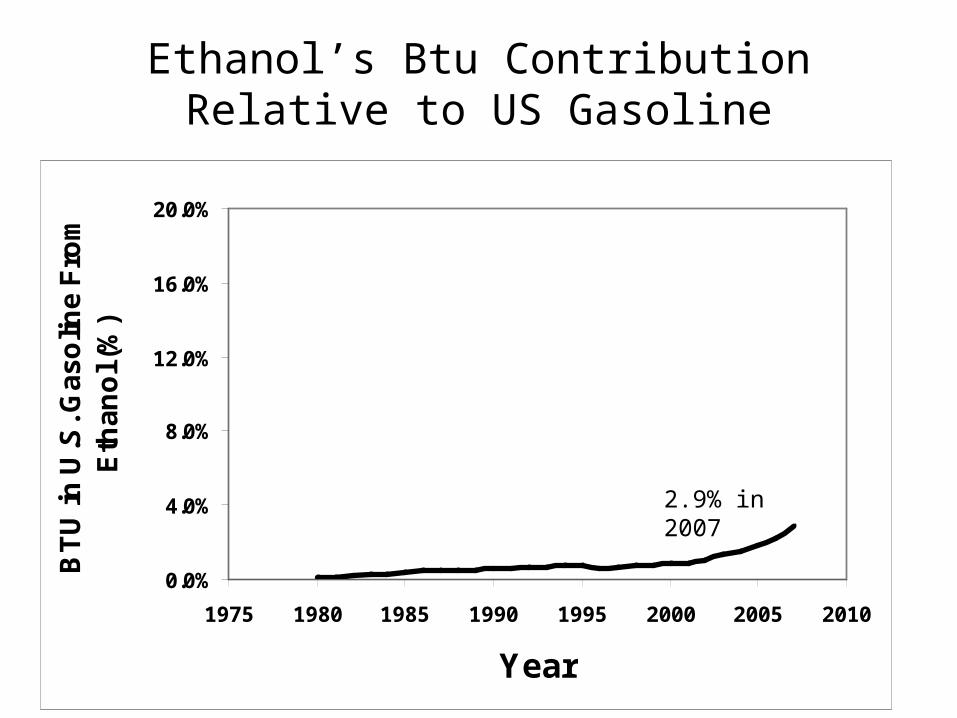
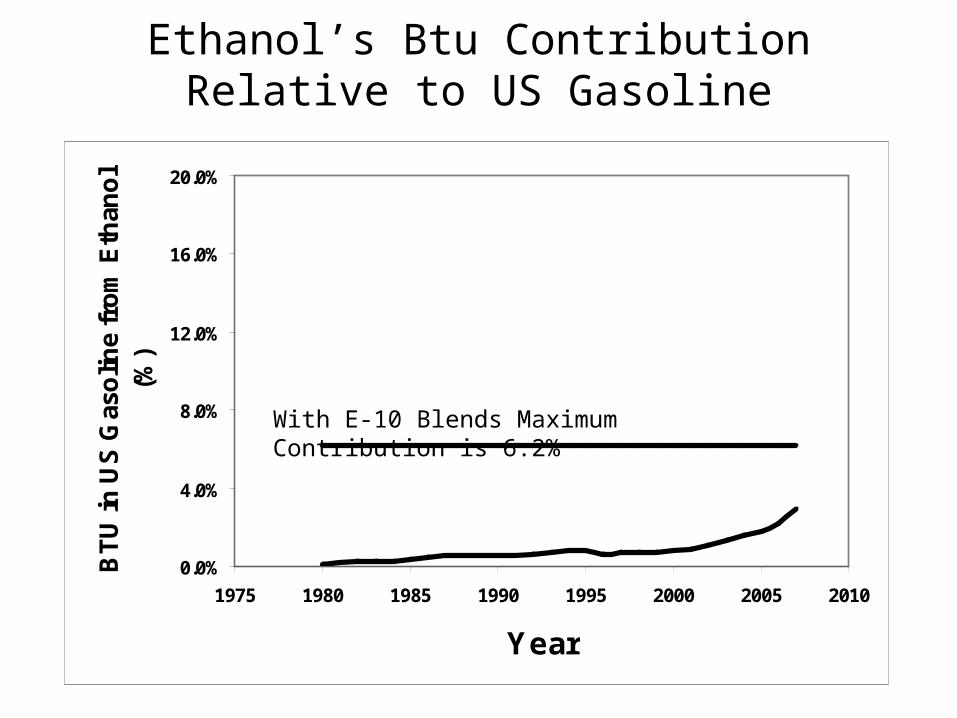
Ethanol’s Btu Contribution Relative to US Gasoline
0.0%
4.0%
8.0%
12.0%
16.0%
20.0%
1975 1980 1985 1990 1995 2000 2005 2010
Year
BT
U in
U.S
. Ga
so
line
Fro
m
Eth
an
ol (
%)
2.9% in 2007
0.0%
4.0%
8.0%
12.0%
16.0%
20.0%
1975 1980 1985 1990 1995 2000 2005 2010
Year
BT
U in
US
Gas
olin
e fr
om
Eth
ano
l (%
)
Ethanol’s Btu Contribution Relative to US Gasoline
With E-10 Blends Maximum Contribution is 6.2%
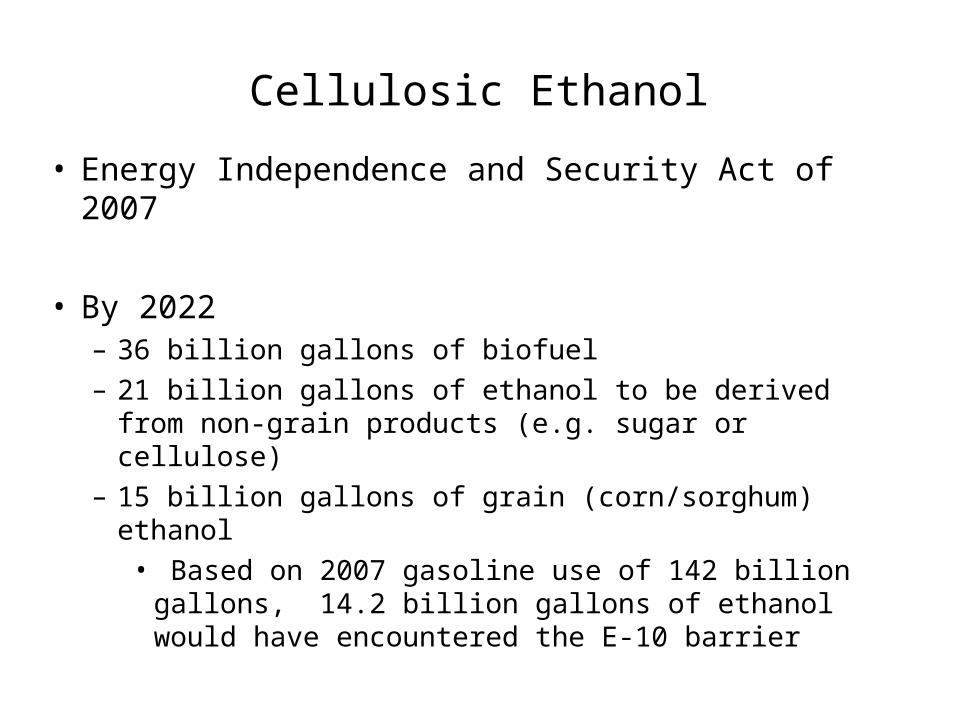
Cellulosic Ethanol
• Energy Independence and Security Act of 2007
• By 2022 – 36 billion gallons of biofuel– 21 billion gallons of ethanol to be derived from non-
grain products (e.g. sugar or cellulose)– 15 billion gallons of grain (corn/sorghum) ethanol
• Based on 2007 gasoline use of 142 billion gallons, 14.2 billion gallons of ethanol would have encountered the E-10 barrier
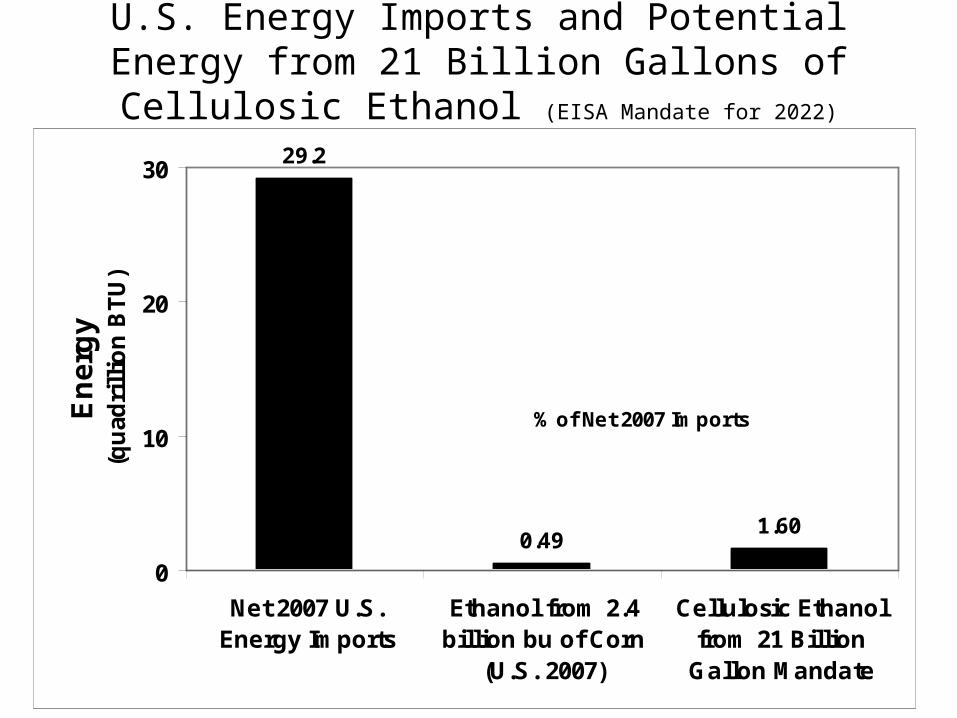
U.S. Energy Imports and Potential Energy from 21 Billion Gallons of Cellulosic Ethanol (EISA Mandate for 2022)
29.2
0.491.60
0
10
20
30
Net 2007 U.S.Energy Imports
Ethanol from 2.4billion bu of Corn
(U.S. 2007)
Cellulosic Ethanolfrom 21 Billion
Gallon Mandate
En
erg
y(q
uad
rill
ion
BT
U)
% of Net 2007 Imports
1.7% 5.5%
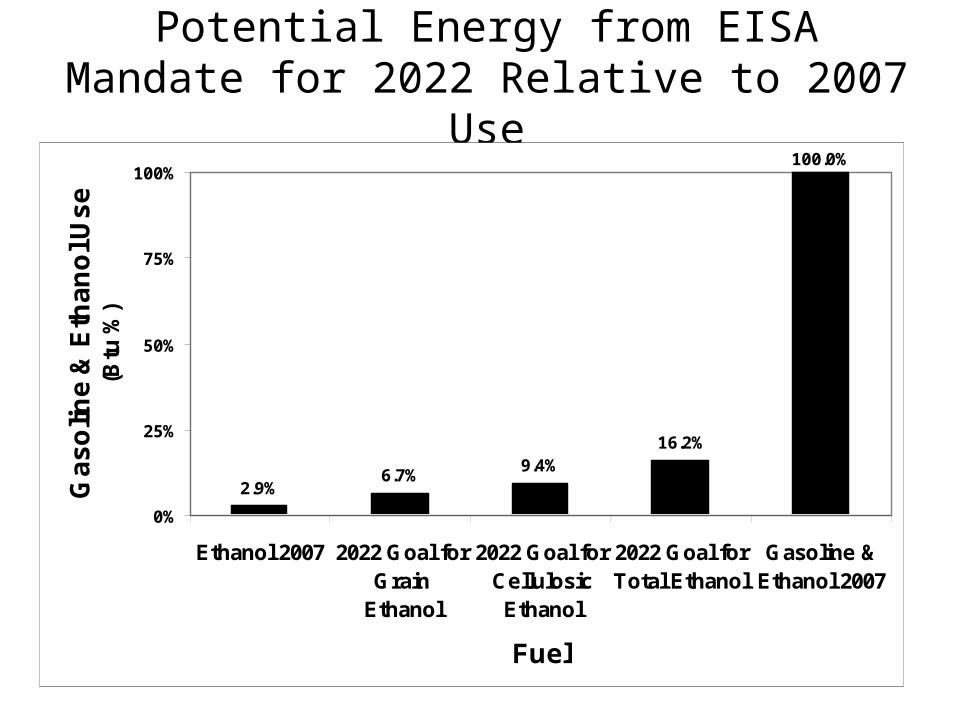
Potential Energy from EISA Mandate for 2022 Relative to 2007 Use
2.9%6.7%
9.4%16.2%
100.0%
0%
25%
50%
75%
100%
Ethanol 2007 2022 Goal forGrain
Ethanol
2022 Goal forCellulosicEthanol
2022 Goal forTotal Ethanol
Gasoline &Ethanol 2007
Fuel
Ga
so
line
& E
tha
no
l Us
e(B
tu %
)
Perspective
• 2022 goal of 36 billion gallons of ethanol would be equivalent to increasing fleet mileage by
– Four miles per gallon (e.g. 25 to 29 miles per gallon)
Challenges to Cellulosic Ethanol
• Economically viable conversion system
• Profitable business model
• Energy is a commodity– The least-cost source will be used first– In the absence of policy incentives (subsidies,
carbon taxes, mandates) extremely difficult to compete with fossil fuels on cost
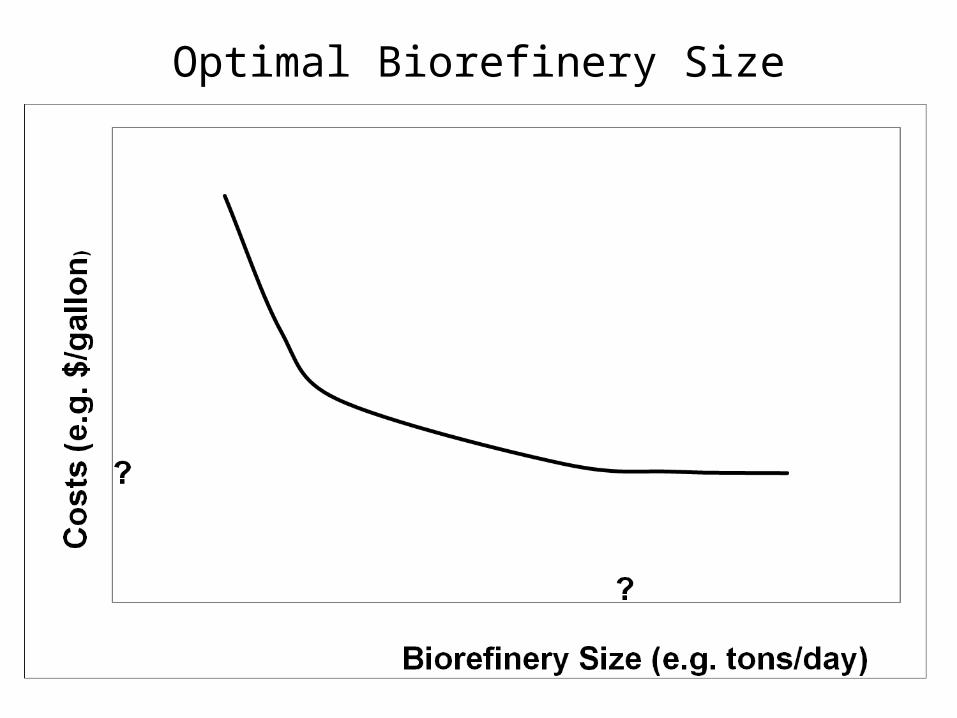
Optimal Biorefinery Size
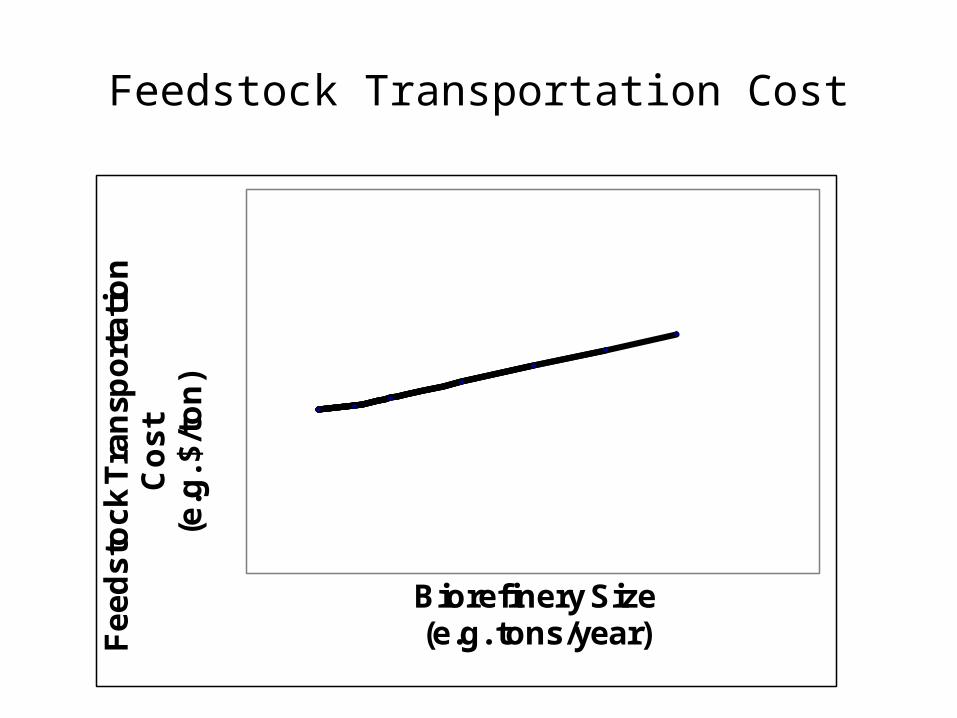
Feedstock Transportation CostF
ee
ds
toc
k T
ran
spo
rta
tio
n
Co
st
(e.g
. $/t
on
)
Biorefinery Size(e.g. tons/year)
Challenges
• Cost efficiency suggests– Year-round operation of the biorefinery– Year-round harvest of feedstock
• Optimal size is unknown but 50+ million gallons per year is common for corn ethanol plants
• Anticipate that a cellulosic biorefinery would require 2,000 dry tons per day
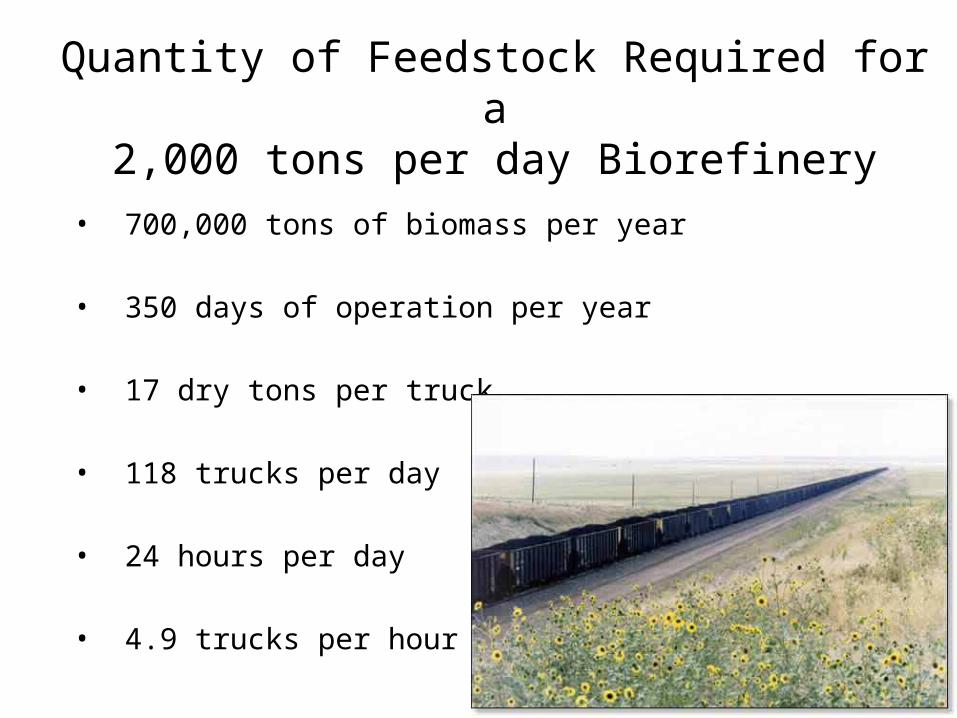
Quantity of Feedstock Required for a2,000 tons per day Biorefinery
• 700,000 tons of biomass per year
• 350 days of operation per year
• 17 dry tons per truck
• 118 trucks per day
• 24 hours per day
• 4.9 trucks per hour
Can Agricultural Resources be Reallocated to Provide Feedstock for Cellulosic Ethanol?
Hypotheses
• Land suitable for economically producing continuous corn and corn-soybeans in rotation is too valuable for producing perennial grass for cellulosic feedstock
• “Corn lobby” will spend a great deal trying to make corn stover work as the base feedstock for cellulosic energy (ethanol business is concentrated in the corn belt)
• Corn stover is not likely to be an economical feedstock (but it won’t be for lack of trying and lack of research funds)
• If the subsidies/incentives are sufficiently great, stover “may work”
Trouble with StubbleFindings of a pilot corn stover collection project conducted near Harlan, Iowa• collection, storage, and transportation of a continuous flow of corn stover is
a “…logistical nightmare…”. • In the U.S. Corn Belt, stover harvest may be complicated by
– Rain– Mud– Snow– Narrow harvest window– Fire– Stalk moisture retention
• Dual collection combines, substantially more expensive, slow harvest, increase the risk of grain loss
Source: Schechinger, Tom. Current Corn Stover Collection Methods and the Future. October 24, 2000. Online. Available at http://www.afdc.doe.gov/pdfs/4922.pdf.
Trouble with Stubble
"Our main concern is $4-per-bushel corn (worth $750 to $800 an acre)," Johnson (a corn producer) said. “$30/acre for biomass is a minor concern for our operation.“
Source: Bill Hord, 27 March 2007, Omaha World-Herald
May require 350,000 acres of corn stover for a single biorefinery
contracts?
spot markets?
Will Perennial Grasses Work ?
Hypotheses• Not on land suitable for economical production
of continuous corn and/or of corn-soybeans rotation
• Perhaps on marginal cropland and cropland pasture (remains to be seen if pasture can be bid from livestock and converted to perennial grasses)
Land ?
“…The rationale for developing lignocellulosic crops for energy is that …poorer quality land can be used for these crops, thereby avoiding competition with food production on better quality land….” (McLaughlin et al. 1999, p. 293).
(Source: McLaughlin, S., J. Bouton, D. Bransby, B. Conger, W. Ocumpaugh, D. Parrish, C. Taliaferro, K. Vogel, and S. Wullschleger. 1999. Developing Switchgrass as a Bioenergy Crop. J. Janick (ed.), Perspectives on new crops and new uses. ASHS Press, Alexandria, VA.)
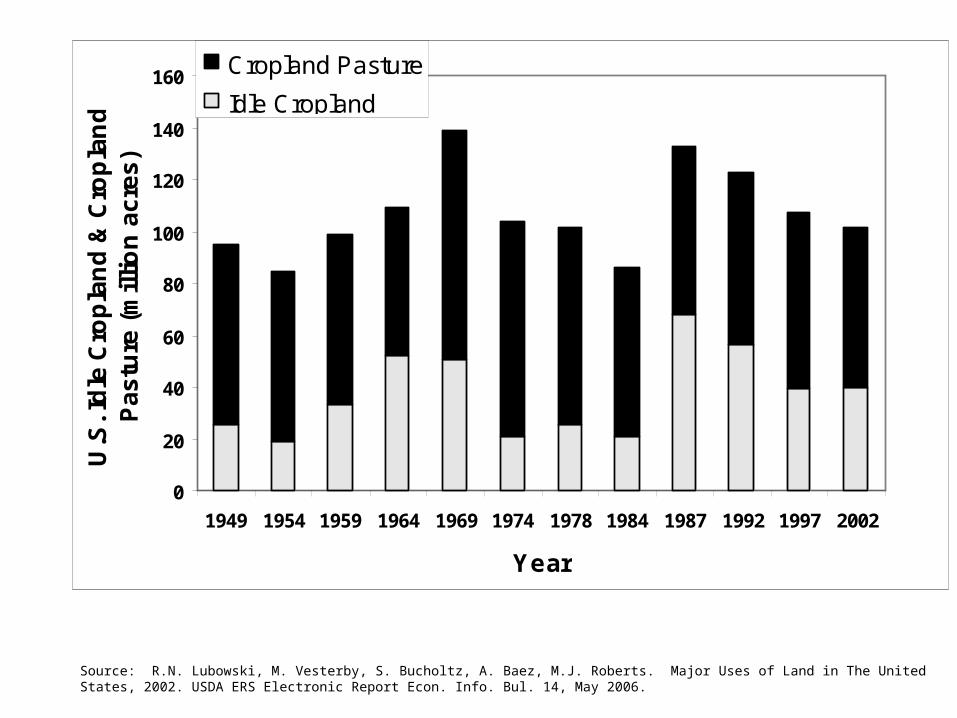
Source: R.N. Lubowski, M. Vesterby, S. Bucholtz, A. Baez, M.J. Roberts. Major Uses of Land in The United States, 2002. USDA ERS Electronic Report Econ. Info. Bul. 14, May 2006.
0
20
40
60
80
100
120
140
160
1949 1954 1959 1964 1969 1974 1978 1984 1987 1992 1997 2002
Year
U.S
. Id
le C
rop
lan
d &
Cro
pla
nd
P
as
ture
(m
illi
on
ac
res
)
Cropland Pasture
Idle Cropland
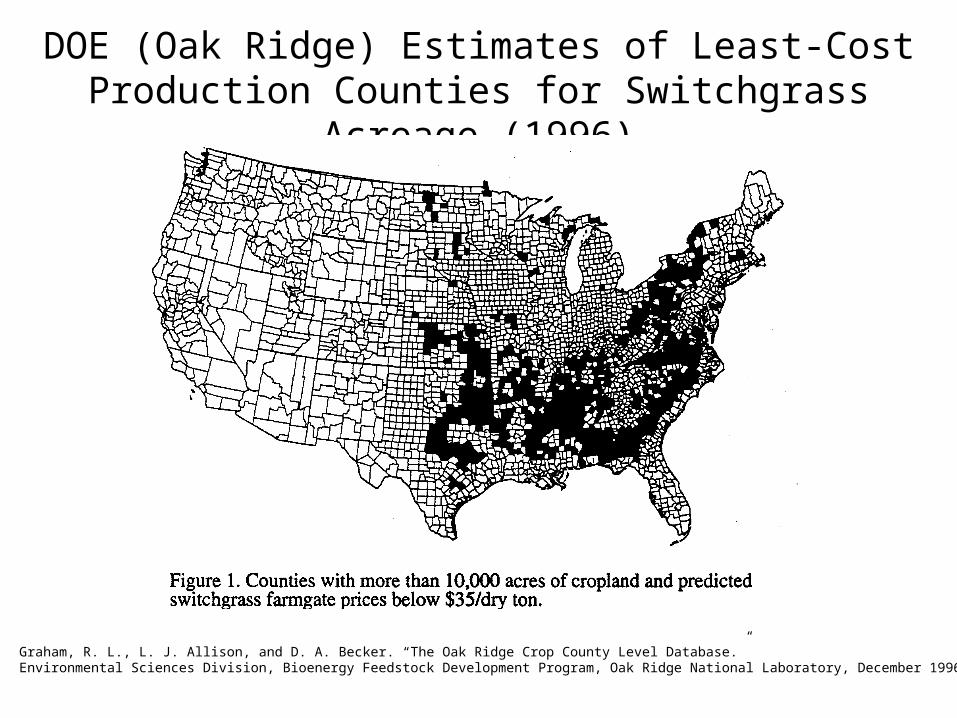
DOE (Oak Ridge) Estimates of Least-Cost Production Counties for Switchgrass Acreage (1996)
Graham, R. L., L. J. Allison, and D. A. Becker. “The Oak Ridge Crop County Level Database.” Environmental Sciences Division, Bioenergy Feedstock Development Program, Oak Ridge National Laboratory, December 1996.
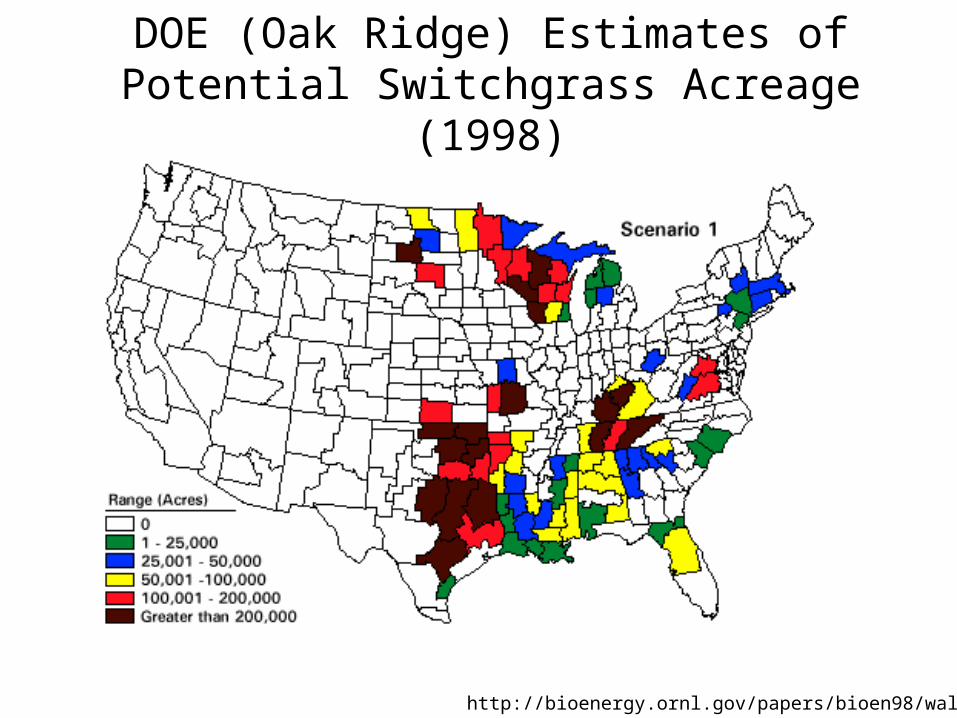
DOE (Oak Ridge) Estimates of Potential Switchgrass Acreage (1998)
•
http://bioenergy.ornl.gov/papers/bioen98/walsh.html
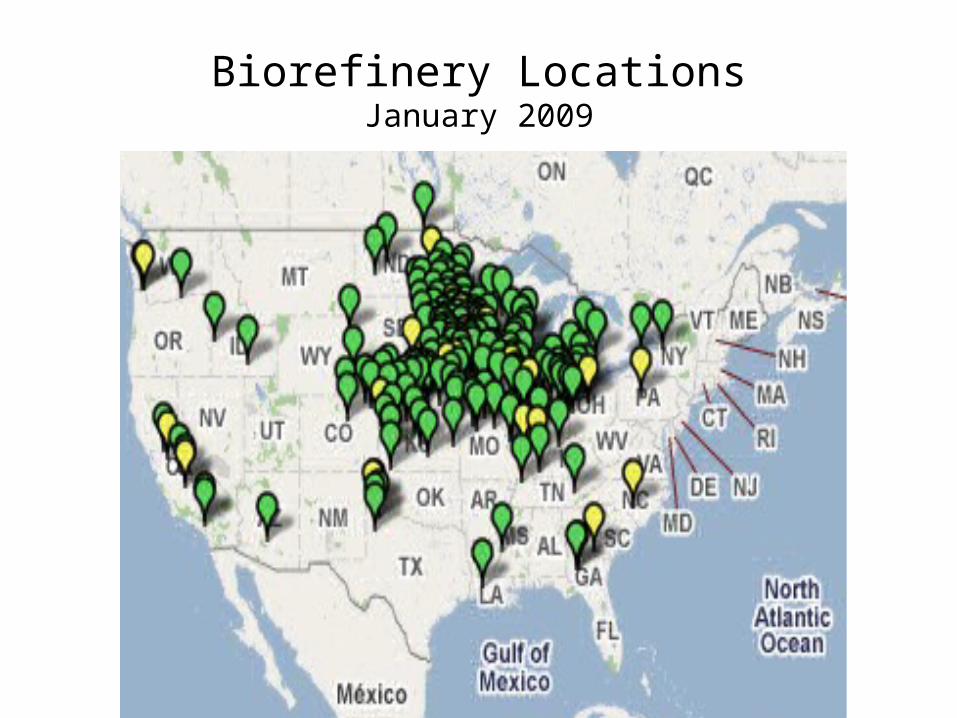
Biorefinery LocationsJanuary 2009
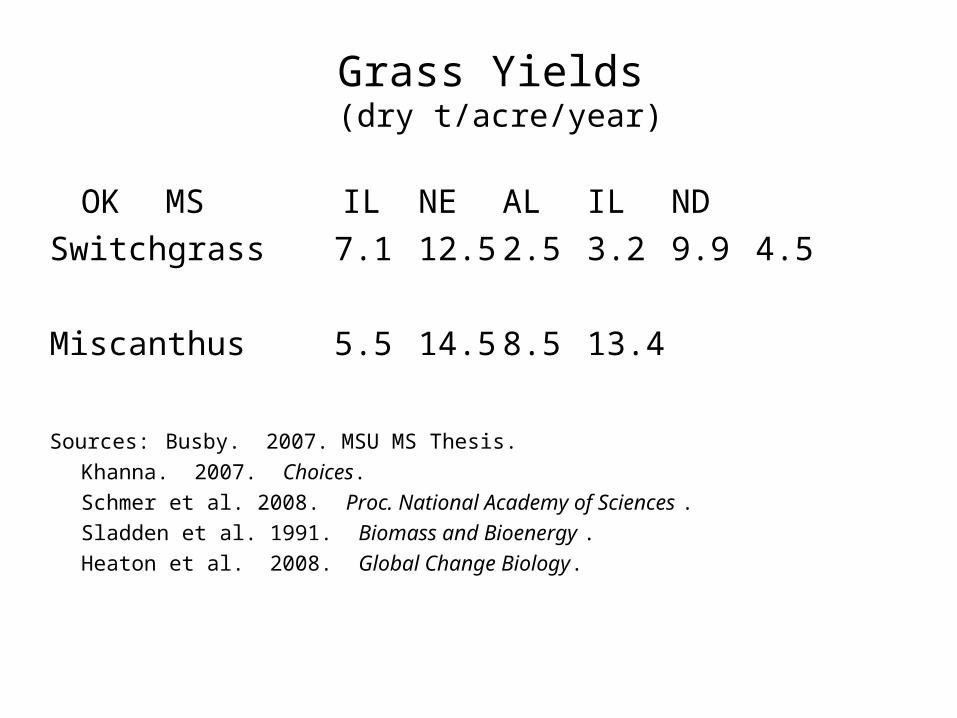
Grass Yields (dry t/acre/year)
OK MS IL NE AL ILND
Switchgrass 7.1 12.5 2.5 3.2 9.9 4.5
Miscanthus 5.5 14.5 8.5 13.4
Sources: Busby. 2007. MSU MS Thesis.Khanna. 2007. Choices. Schmer et al. 2008. Proc. National Academy of Sciences .Sladden et al. 1991. Biomass and Bioenergy . Heaton et al. 2008. Global Change Biology.
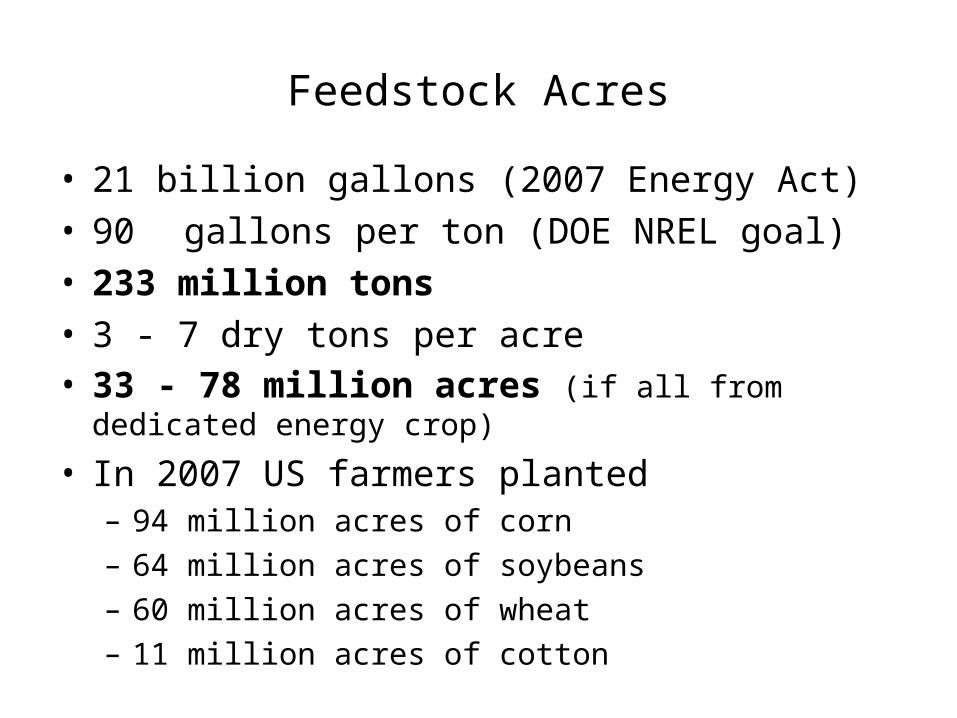
Feedstock Acres
• 21 billion gallons (2007 Energy Act)• 90 gallons per ton (DOE NREL goal)• 233 million tons• 3 - 7 dry tons per acre • 33 - 78 million acres (if all from dedicated energy crop)
• In 2007 US farmers planted – 94 million acres of corn – 64 million acres of soybeans– 60 million acres of wheat– 11 million acres of cotton
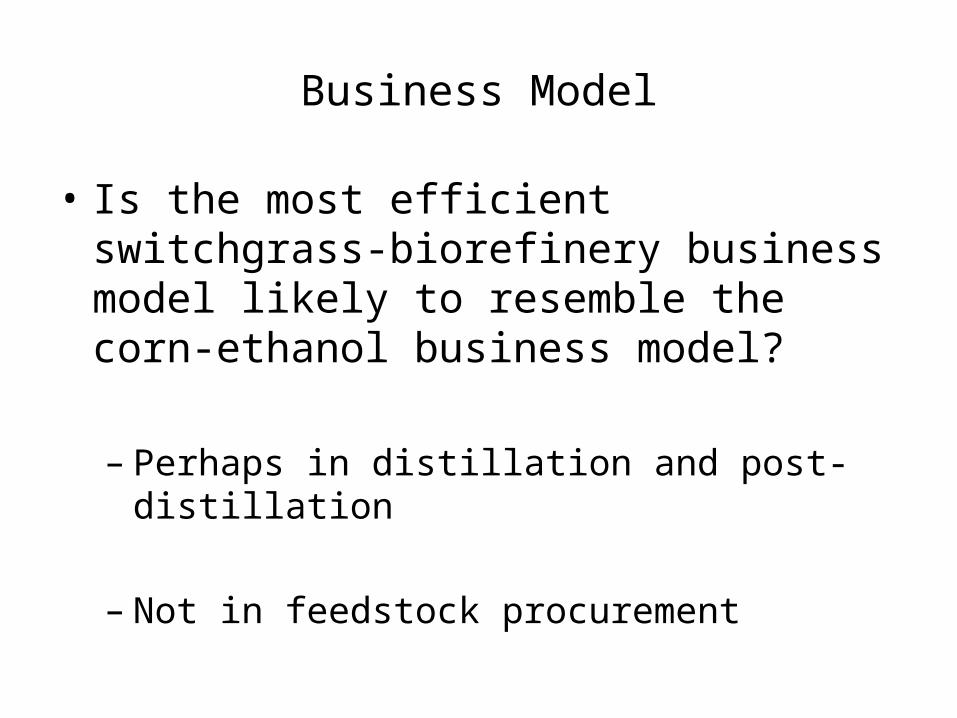
Business Model
• Is the most efficient switchgrass-biorefinery business model likely to resemble the corn-ethanol business model?
– Perhaps in distillation and post-distillation
– Not in feedstock procurement
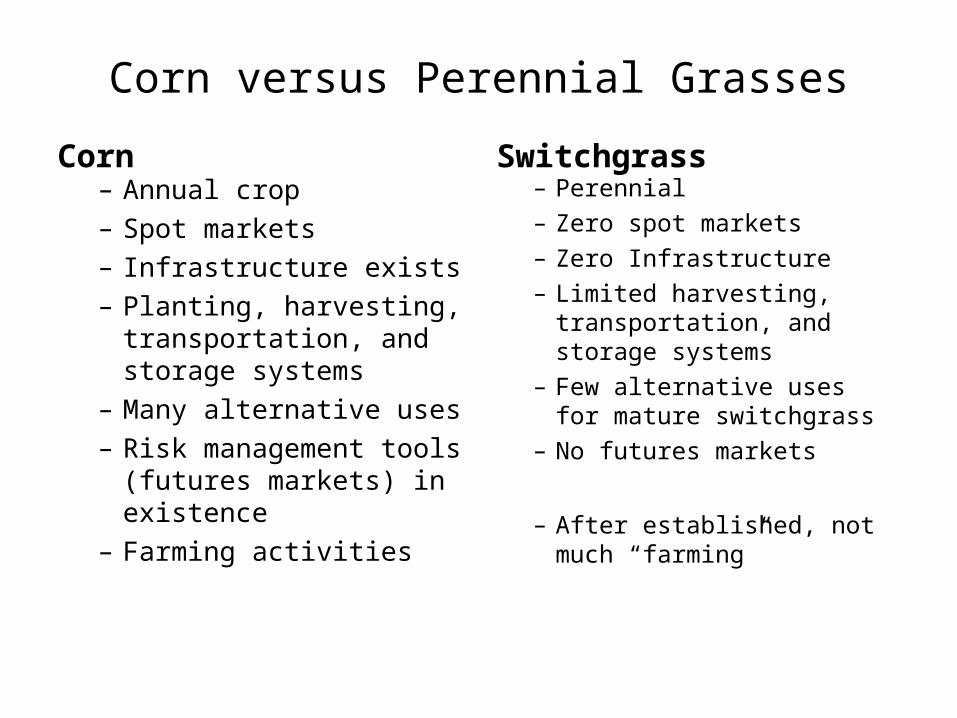
Corn versus Perennial Grasses
Corn– Annual crop– Spot markets– Infrastructure exists– Planting, harvesting,
transportation, and storage systems
– Many alternative uses– Risk management tools
(futures markets) in existence
– Farming activities
Switchgrass– Perennial– Zero spot markets– Zero Infrastructure– Limited harvesting,
transportation, and storage systems
– Few alternative uses for mature switchgrass
– No futures markets
– After established, not much “farming”
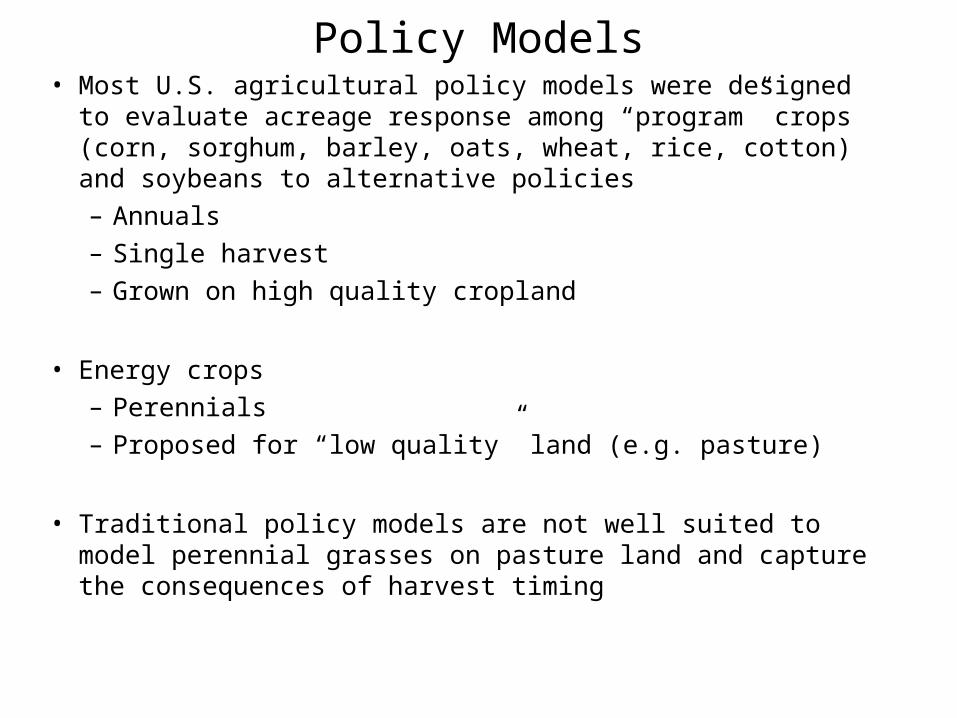
Policy Models• Most U.S. agricultural policy models were designed to evaluate
acreage response among “program” crops (corn, sorghum, barley, oats, wheat, rice, cotton) and soybeans to alternative policies– Annuals– Single harvest– Grown on high quality cropland
• Energy crops– Perennials – Proposed for “low quality” land (e.g. pasture)
• Traditional policy models are not well suited to model perennial grasses on pasture land and capture the consequences of harvest timing
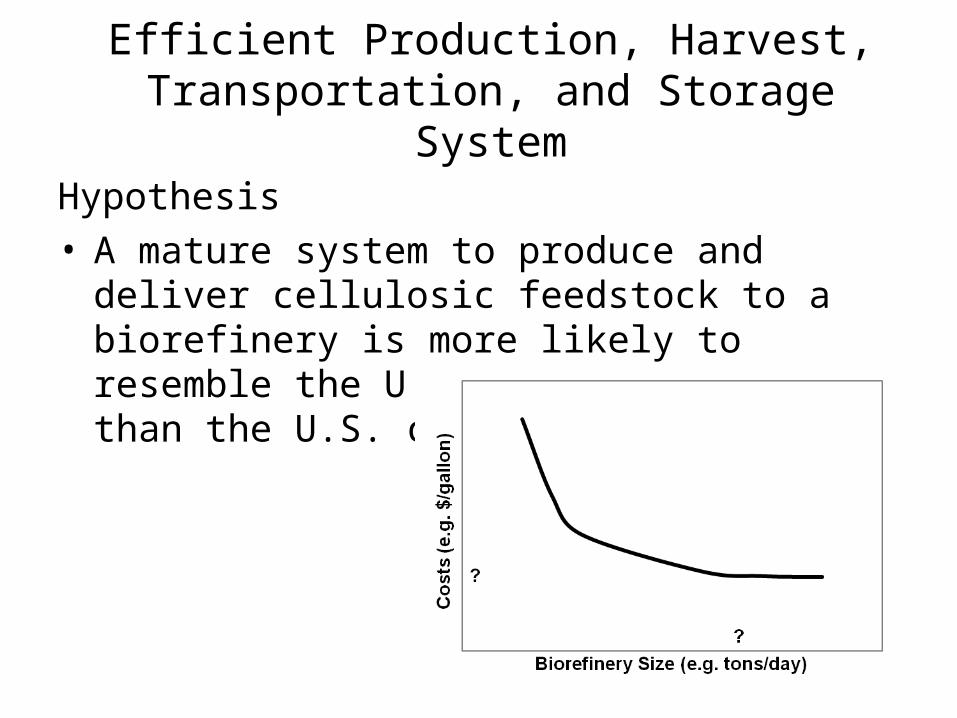
Efficient Production, Harvest, Transportation, and Storage System
Hypothesis• A mature system to produce and deliver
cellulosic feedstock to a biorefinery is more likely to resemble the U.S. timber industry than the U.S. corn industry
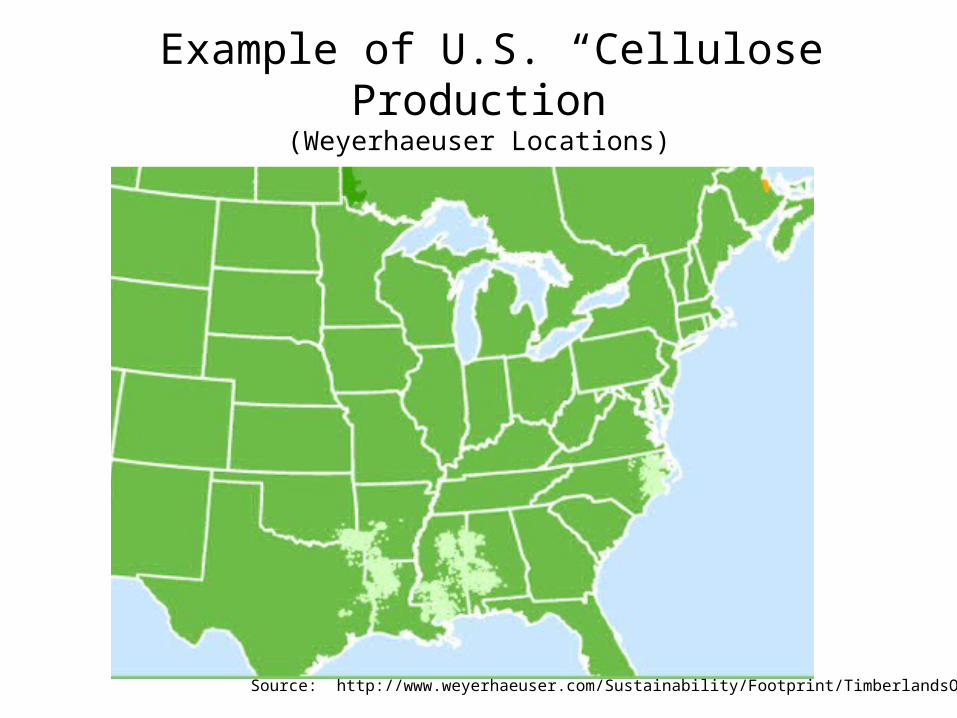
Example of U.S. “Cellulose” Production(Weyerhaeuser Locations)
Source: http://www.weyerhaeuser.com/Sustainability/Footprint/TimberlandsOwnership
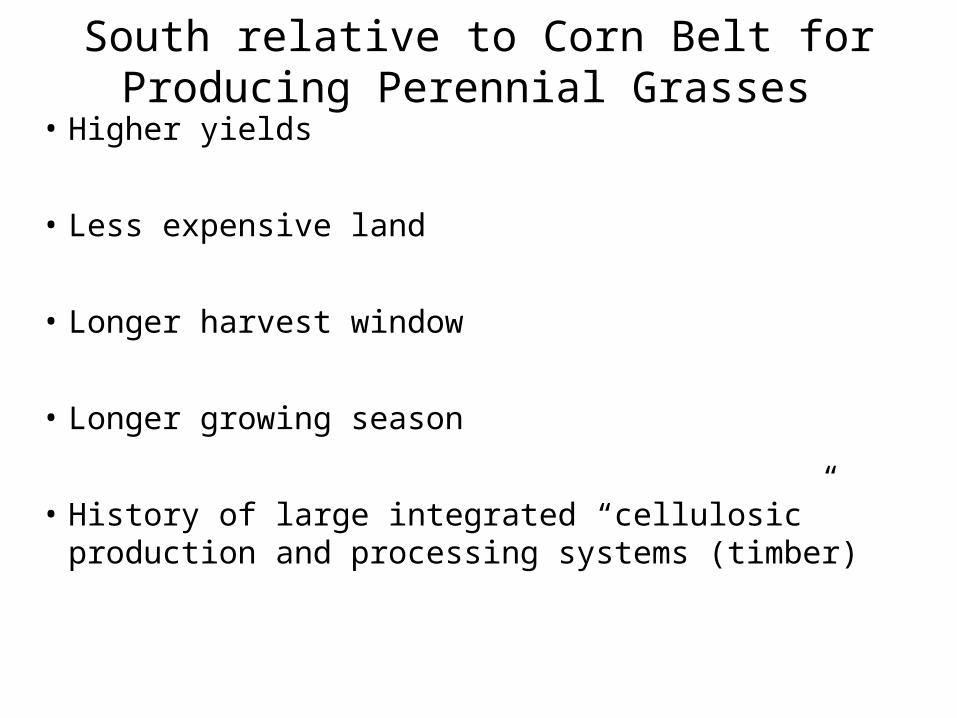
South relative to Corn Belt for Producing Perennial Grasses
• Higher yields
• Less expensive land
• Longer harvest window
• Longer growing season
• History of large integrated “cellulosic” production and processing systems (timber)
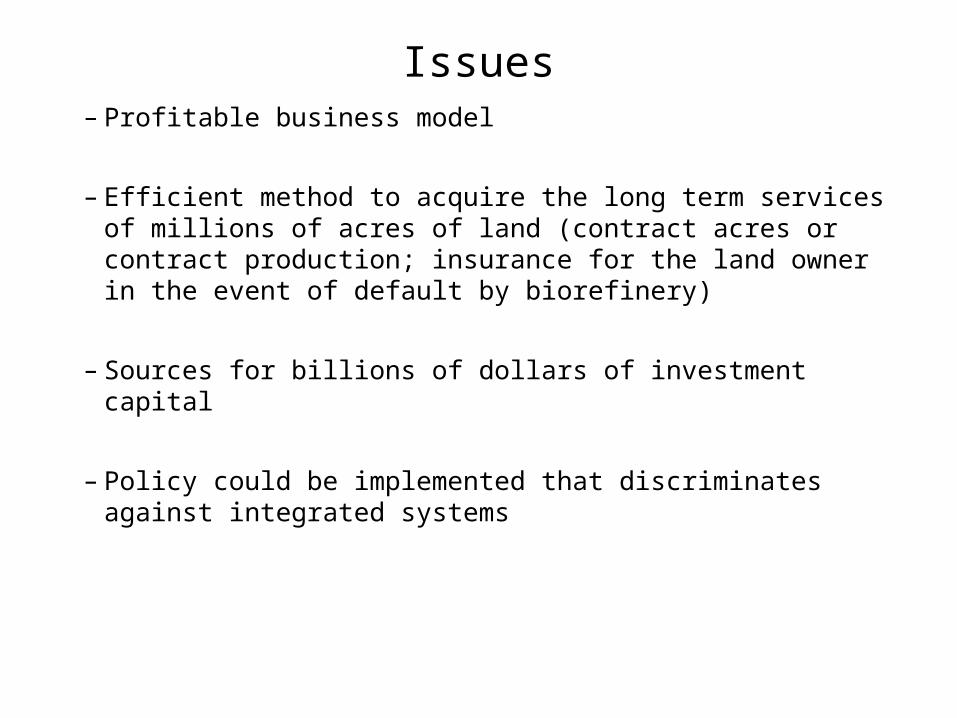
Issues– Profitable business model
– Efficient method to acquire the long term services of millions of acres of land (contract acres or contract production; insurance for the land owner in the event of default by biorefinery)
– Sources for billions of dollars of investment capital
– Policy could be implemented that discriminates against integrated systems
Cellulosic Ethanol
• Potential market is huge
• Many challenges remain
Acknowledgements
• Oklahoma Agricultural Experiment Station• USDA/CSREES• USDA/IFAFS• Oklahoma Bioenergy Center• Sun Grant Initiative• Aventine
• Coskata (licensed technology)