Embed Size (px)
Citation preview
CENTER FOR
RESPONSE TO INTERVENTION IN EARLY CHILDHOOD
Preschool RTI Summit, Measurement Strand
Tamaya Hyatt, September 27, 2011
Alternative Designs for
Evaluating RTI Models
Charles R. Greenwood
Juniper Gardens Children’s Project,
University of Kansas
Guiding Issue for Today’s
Breakout
The success of the RTI approach is predicated on
use of evidence-based practice
Any RTI approach is a package of evidence-
based components
Screening and progress monitoring measures
Practices supporting multiple tiers of support
Fidelity of implementation guiding program
improvement
Others (i.e., coordination strategies, PD)
So, how do we create the supporting evidence?
Guiding Issue for Today’s
Breakout
How do we create the evidence?
For the component practices?
For the entire model?
Hopefully, this discussion will contribute to a
deeper understanding of the issues,
challenges, and study designs best suited for
generating the evidence we need
Briefly, What Exactly is RTI?
RTI is an early intervening approach using evidence-based practices to prevent the need for special education services
Use of an evidence-based Tier 1, core curriculum for all students
Frequent universal screening of all children (students)
Identification of those children not making expected progress
Providing these children more intensive Tiers of support (Tier 2, Tier 3), each with supporting evidence.
Based on short-term progress, decisions to keep or change a child’s level of intervention are made
What are the Implications?
Each RTI component practice needs research evidence
Efficacy of the Tier 1, core curriculum
Efficacy of the Tier 2 and 3 interventions
Validity/utility of the measurement system and its decision making benchmarks
The fully operating RTI model needs research evidence
Efficacy of the full model
Efficacy of the coordination, professional development, and implementation support systems
How do we handle dynamic RTI interventions
where children may change intervention at any
time during a year based on progress?
By definition, RTI services are intentionally
dynamic, school teams or teachers make
intervention change decisions
This may violate the assumptions in some quasi-
experimental designs, for example the
Regression Discontinuity Design)
Presents challenges to attribution of causal
effects that include variable intervention changes
and different exposures (dosage)
How should we handle repeatedly
measured progress monitoring data –
growth trajectories?
Time series, repeatedly measured progress
data are typical in RTI research and present
some challenges to assumptions and
interpretation
Single case designs are highly appropriate when
the unit of study is the individual child’s progress
repeatedly measured (AB being the simplest)
Growth curve analyses are appropriate when the
unit of analysis is multiple children repeatedly
measured
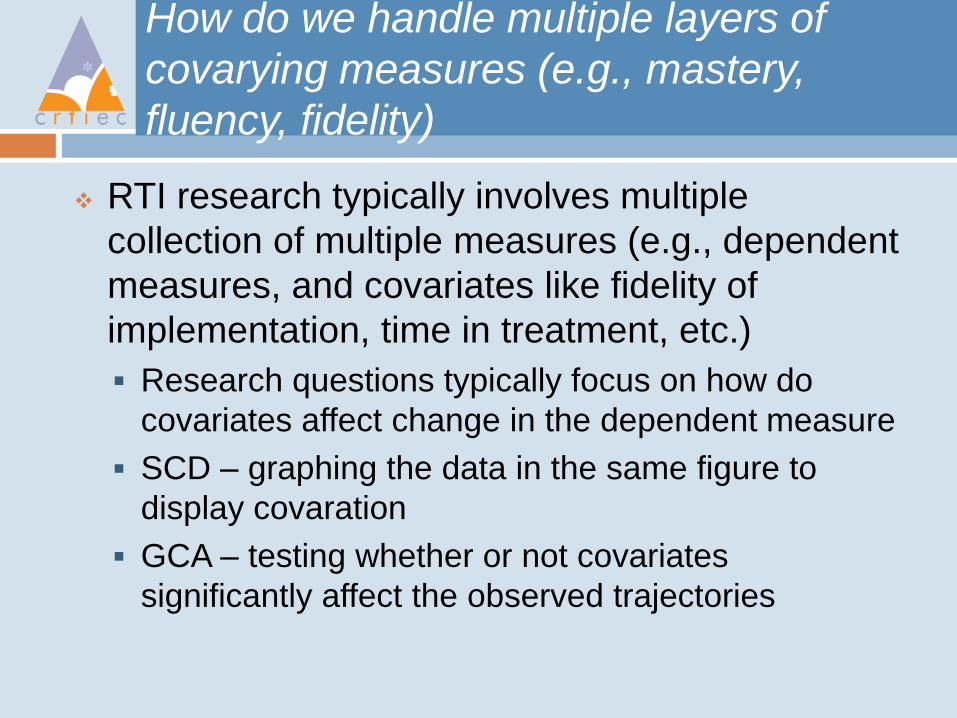
How do we handle multiple layers of
covarying measures (e.g., mastery,
fluency, fidelity)
RTI research typically involves multiple
collection of multiple measures (e.g., dependent
measures, and covariates like fidelity of
implementation, time in treatment, etc.)
Research questions typically focus on how do
covariates affect change in the dependent measure
SCD – graphing the data in the same figure to
display covaration
GCA – testing whether or not covariates
significantly affect the observed trajectories
Some RTI Research and
Development Target Goals
New screening and progress monitoring measurement development, or improving existing
New technique development
Refine and replicate a promising intervention implemented to fidelity
Evaluate the efficacy of a single promising, feasible intervention (e.g., Tier 1, 2, or 3 intervention)
Evaluate the efficacy of a fully operating RTI model
RTI Measurement Development
Design Challenges
Multi-year screening of all children requires measures brief enough that they are feasible to implement by staff Screening measures must have criterion validity, classification
accuracy, and predictive utility
Progress monitoring measures must be 1. Sensitive to individual children’s growth over time
2. Have end-of-year benchmarks
3. Specified rates of progress
4. Local norms
5. Sensitive to intervention effects as evidenced by teacher planning and changes in interventions over time
Mastery monitoring measures require a specified skill sequence be assessed and pass/fail benchmarks at relevant ages or grade levels.
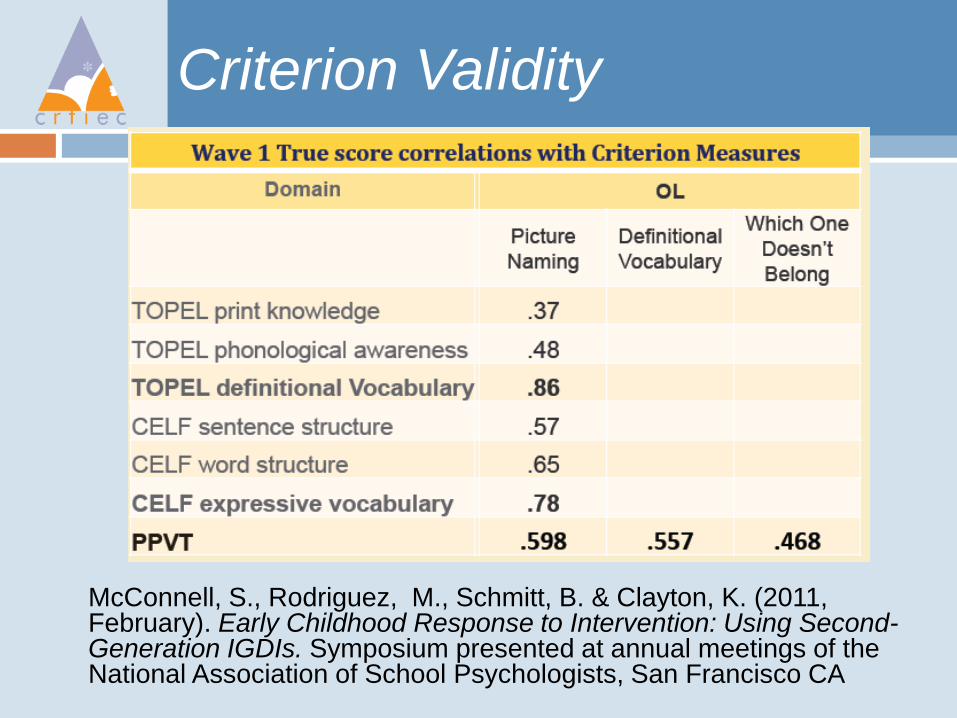
Criterion Validity
McConnell, S., Rodriguez, M., Schmitt, B. & Clayton, K. (2011, February). Early Childhood Response to Intervention: Using Second-Generation IGDIs. Symposium presented at annual meetings of the National Association of School Psychologists, San Francisco CA
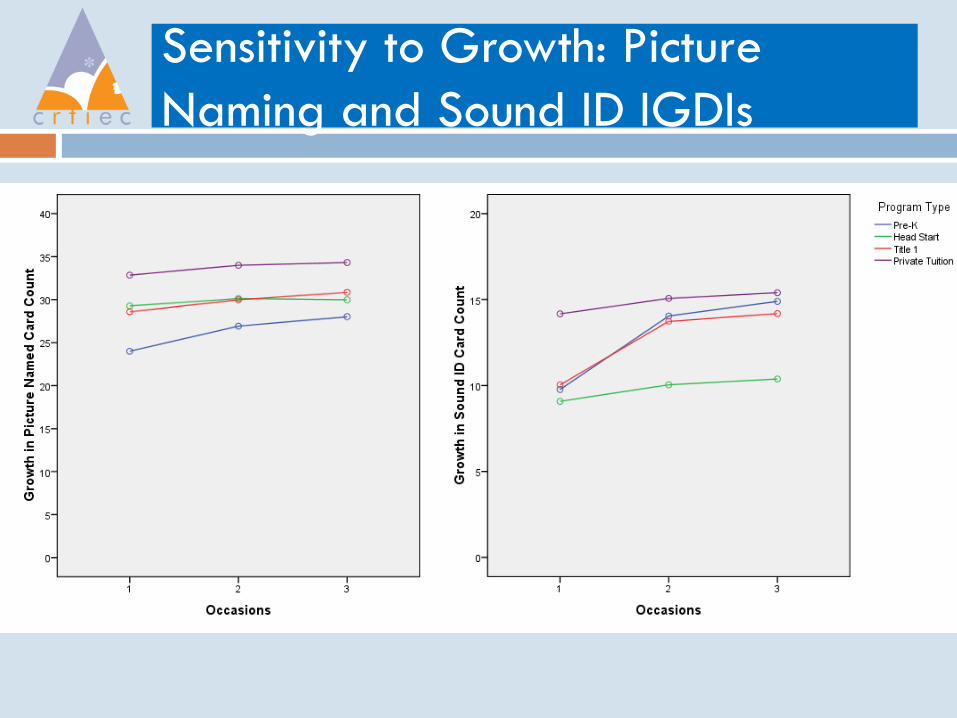
Sensitivity to Growth: Picture
Naming and Sound ID IGDIs
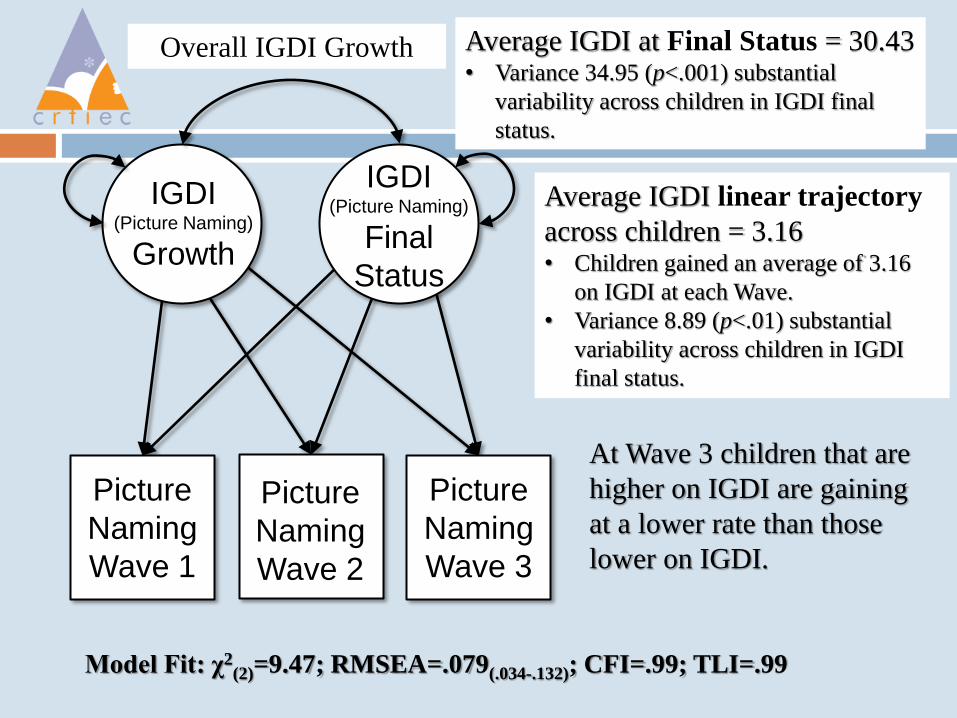
Average IGDI at Final Status = 30.43 • Variance 34.95 (p<.001) substantial
variability across children in IGDI final
status.
Overall IGDI Growth
IGDI (Picture Naming)
Growth
IGDI (Picture Naming)
Final
Status
Picture
Naming
Wave 1
Picture
Naming
Wave 2
Picture
Naming
Wave 3
Model Fit: χ2(2)=9.47; RMSEA=.079(.034-.132); CFI=.99; TLI=.99
Average IGDI linear trajectory
across children = 3.16 • Children gained an average of 3.16
on IGDI at each Wave.
• Variance 8.89 (p<.01) substantial
variability across children in IGDI
final status.
At Wave 3 children that are
higher on IGDI are gaining
at a lower rate than those
lower on IGDI.
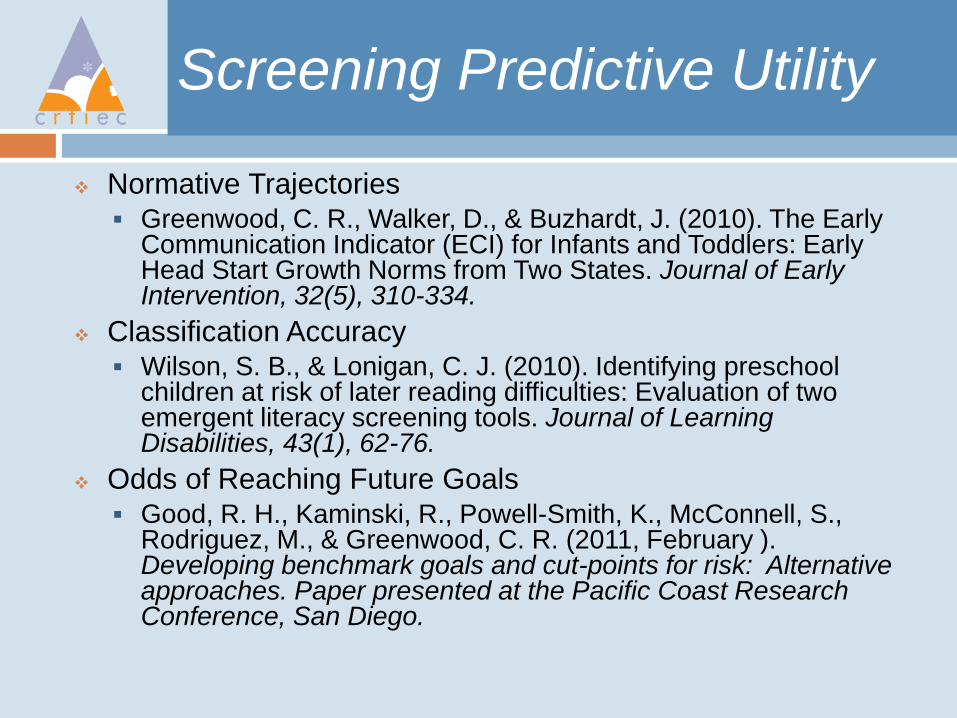
Screening Predictive Utility
Normative Trajectories Greenwood, C. R., Walker, D., & Buzhardt, J. (2010). The Early
Communication Indicator (ECI) for Infants and Toddlers: Early Head Start Growth Norms from Two States. Journal of Early Intervention, 32(5), 310-334.
Classification Accuracy Wilson, S. B., & Lonigan, C. J. (2010). Identifying preschool
children at risk of later reading difficulties: Evaluation of two emergent literacy screening tools. Journal of Learning Disabilities, 43(1), 62-76.
Odds of Reaching Future Goals Good, R. H., Kaminski, R., Powell-Smith, K., McConnell, S.,
Rodriguez, M., & Greenwood, C. R. (2011, February ). Developing benchmark goals and cut-points for risk: Alternative approaches. Paper presented at the Pacific Coast Research Conference, San Diego.
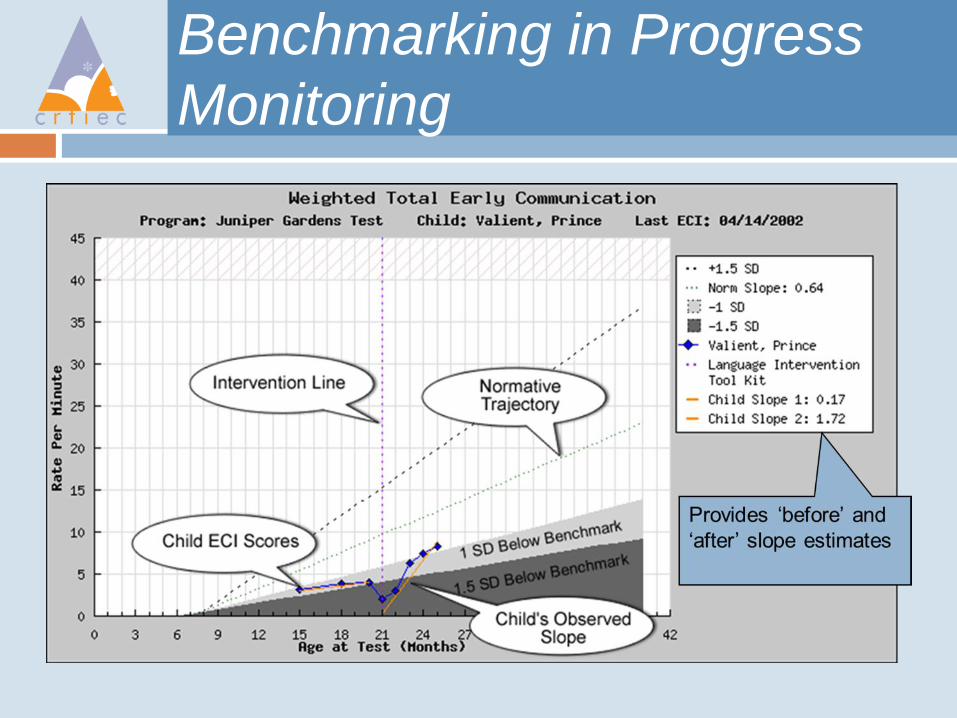
Benchmarking in Progress
Monitoring
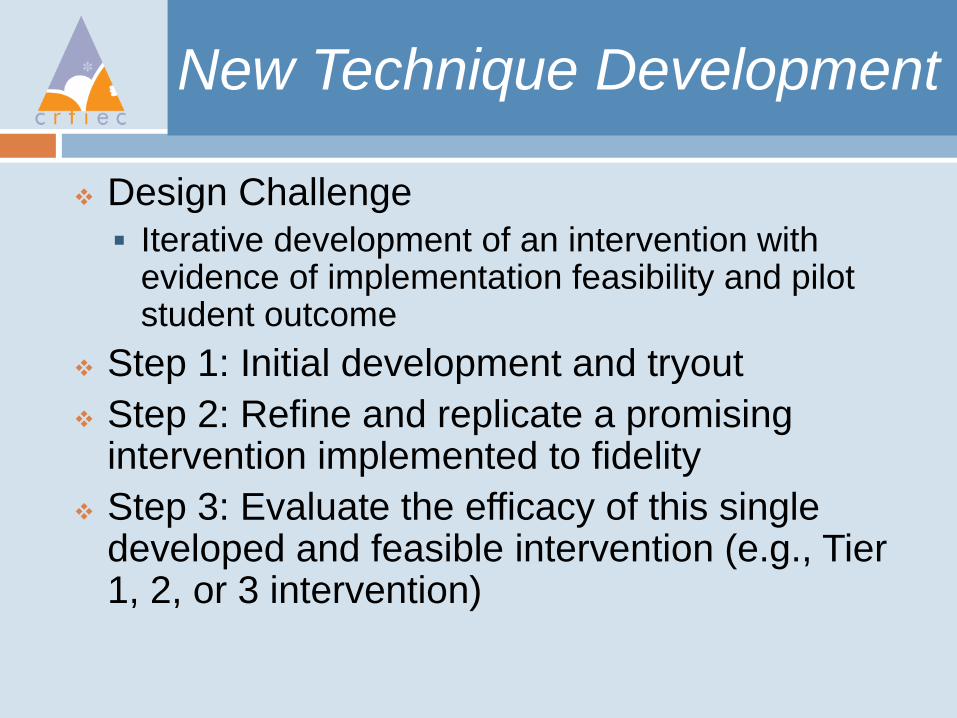
New Technique Development
Design Challenge
Iterative development of an intervention with evidence of implementation feasibility and pilot student outcome
Step 1: Initial development and tryout
Step 2: Refine and replicate a promising intervention implemented to fidelity
Step 3: Evaluate the efficacy of this single developed and feasible intervention (e.g., Tier 1, 2, or 3 intervention)
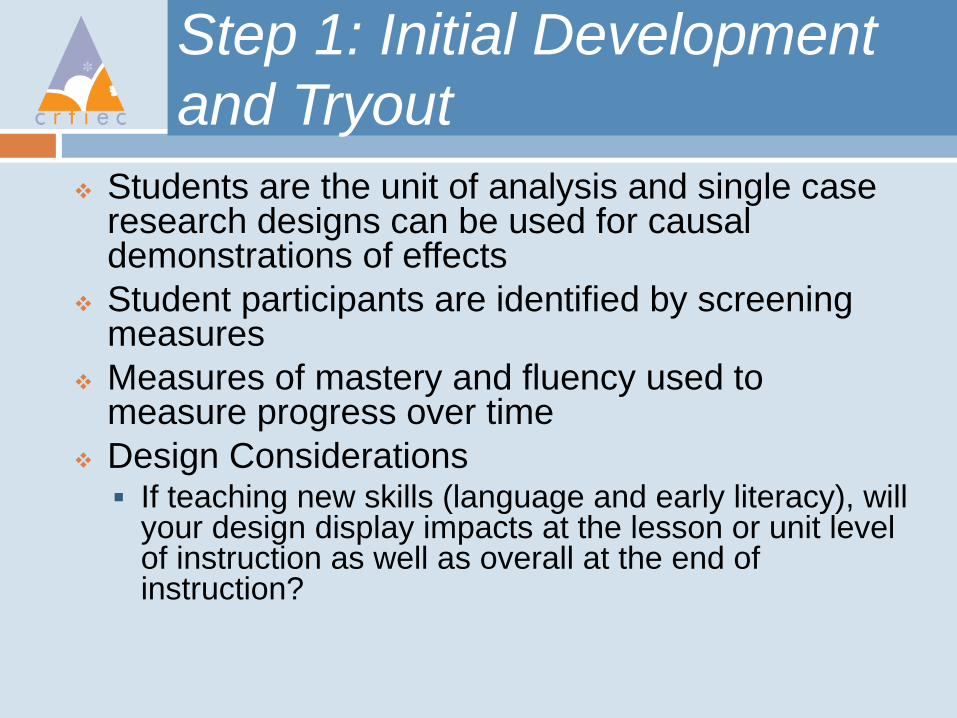
Step 1: Initial Development
and Tryout
Students are the unit of analysis and single case research designs can be used for causal demonstrations of effects
Student participants are identified by screening measures
Measures of mastery and fluency used to measure progress over time
Design Considerations If teaching new skills (language and early literacy), will
your design display impacts at the lesson or unit level of instruction as well as overall at the end of instruction?
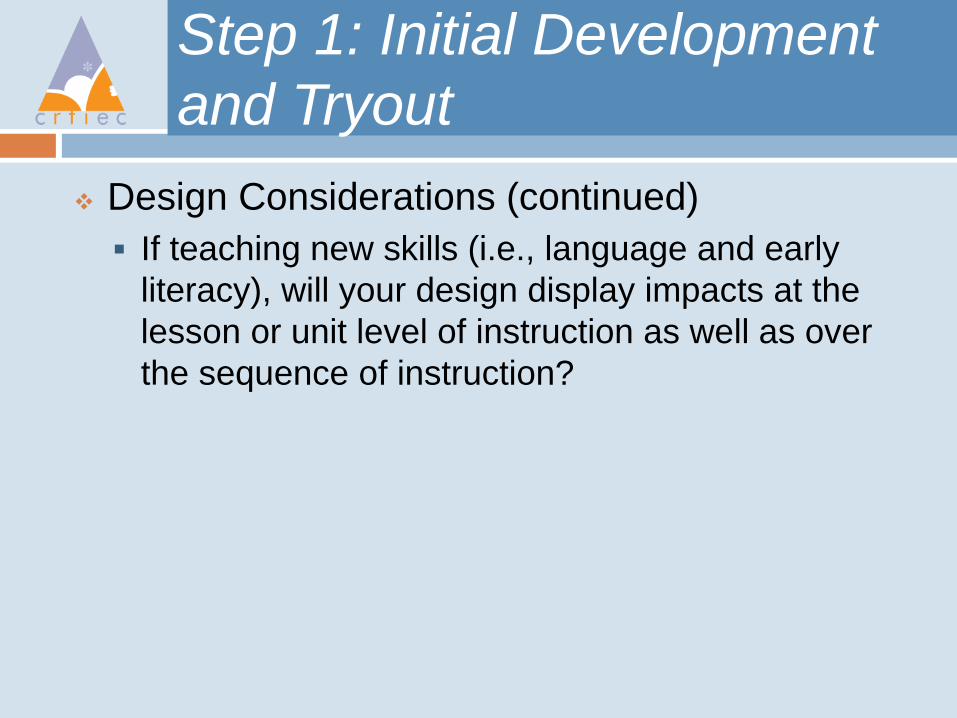
Step 1: Initial Development
and Tryout
Design Considerations (continued)
If teaching new skills (i.e., language and early
literacy), will your design display impacts at the
lesson or unit level of instruction as well as over
the sequence of instruction?
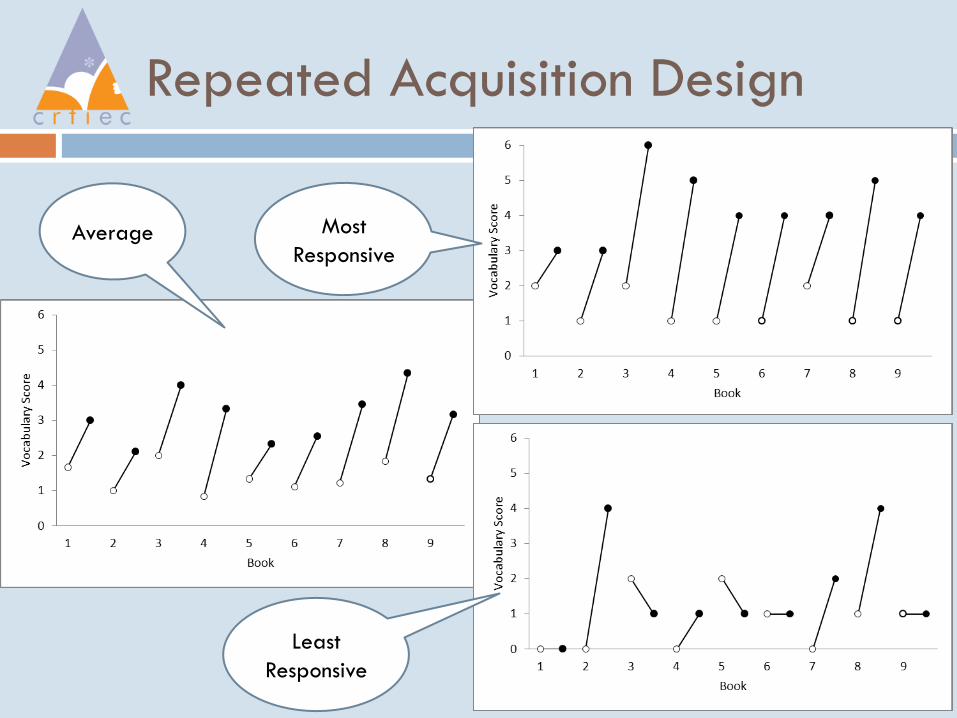
Repeated Acquisition Design
Average
Least
Responsive
Most
Responsive
Step 1: Initial Development
and Tryout
Design Considerations (continued)
Will repeated measurement prove to be reactive?
1. Will children show signs of over-testing?
2. Will children show how growth with repeated testing in
the absence of instructional intervention (baseline)?
Step 1: Initial Development
and Tryout
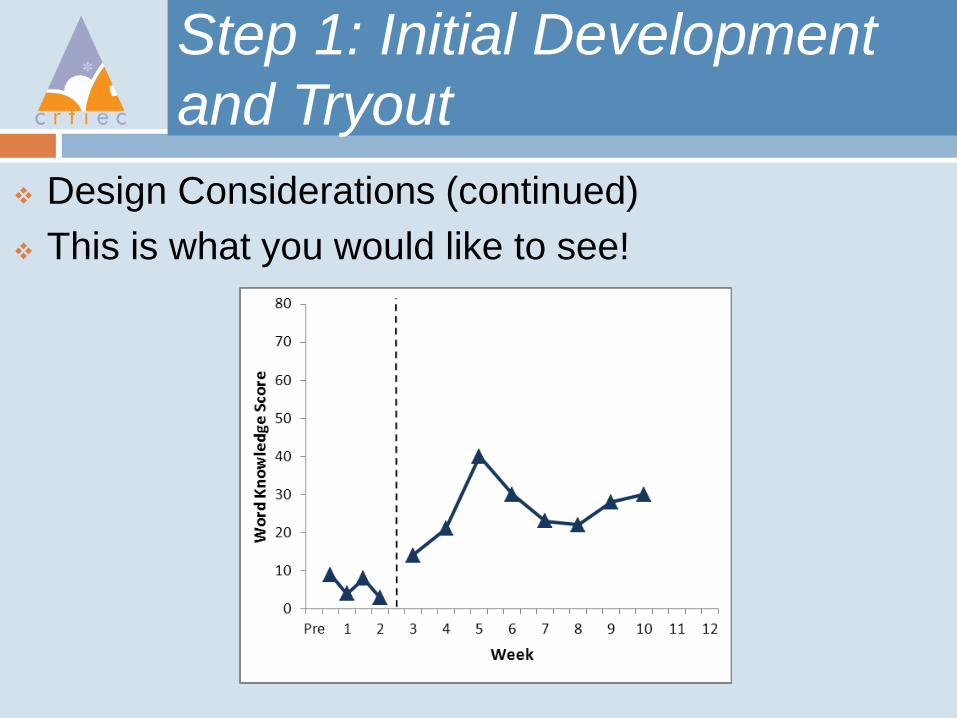
Design Considerations (continued)
This is what you would like to see!
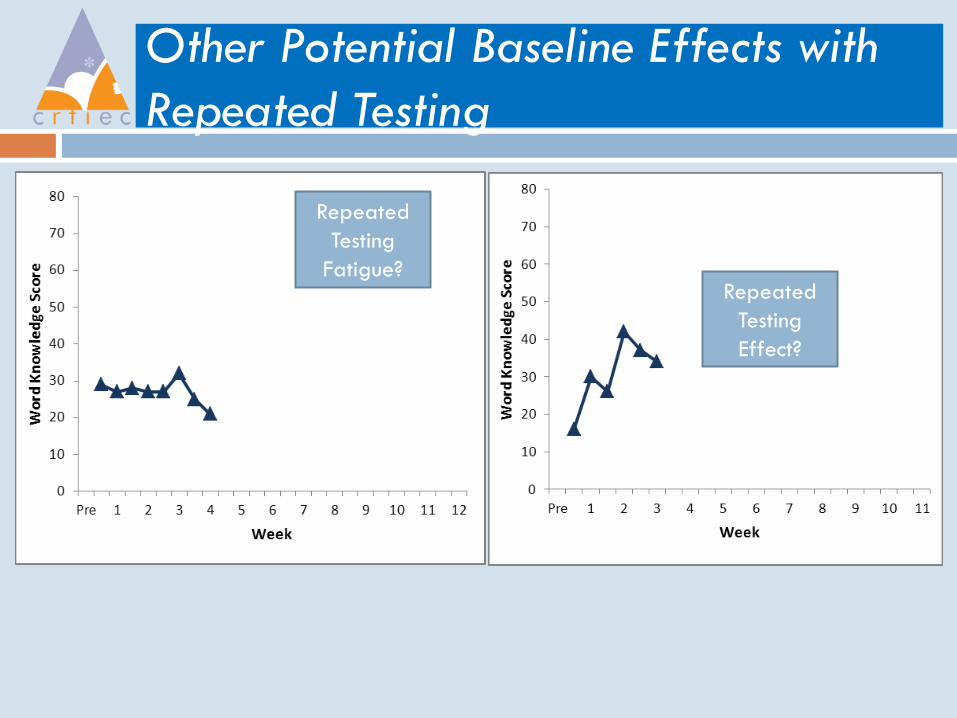
Other Potential Baseline Effects with
Repeated Testing
Repeated
Testing
Effect?
Repeated
Testing
Fatigue?
Step 2: Refine/Replicate When
Implemented to Fidelity
The external validity of promising initial study
findings are extended by replications where
Teachers are implementers and achieving
findings as promising as those achieved with
researcher/developers as implementers
Implementers and student participants are from
other settings and programs, and also achieving
promising results
Student participants represent diverse
subpopulations
Step 2: Refine/Replicate When
Implemented to Fidelity
Vocabulary and Comprehension Tier 2 Listening
Station Intervention
1. Developed in Ohio, Replicated in KS 2010-11
2. Different implementers and different sample and
subpopulations represented
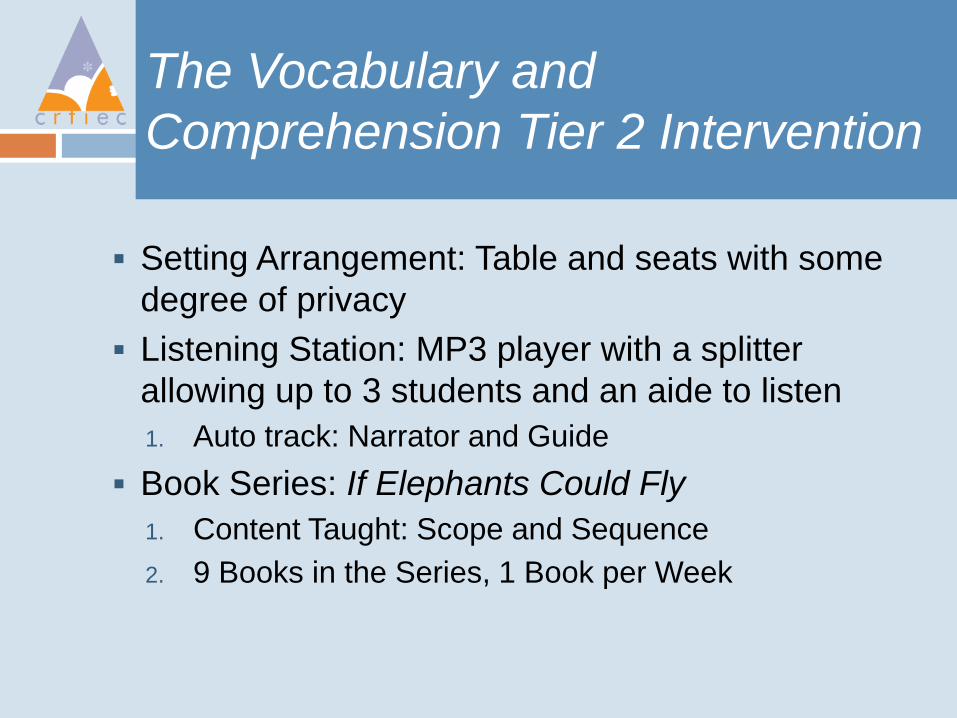
The Vocabulary and
Comprehension Tier 2 Intervention
Setting Arrangement: Table and seats with some
degree of privacy
Listening Station: MP3 player with a splitter
allowing up to 3 students and an aide to listen
1. Auto track: Narrator and Guide
Book Series: If Elephants Could Fly
1. Content Taught: Scope and Sequence
2. 9 Books in the Series, 1 Book per Week
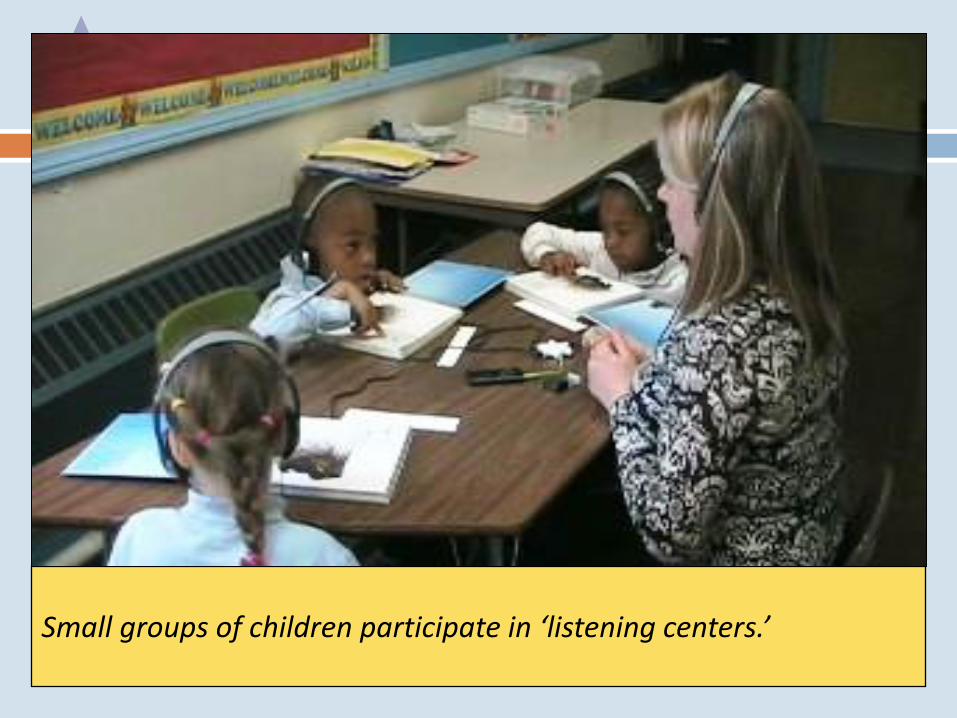
Small groups of children participate in ‘listening centers.’
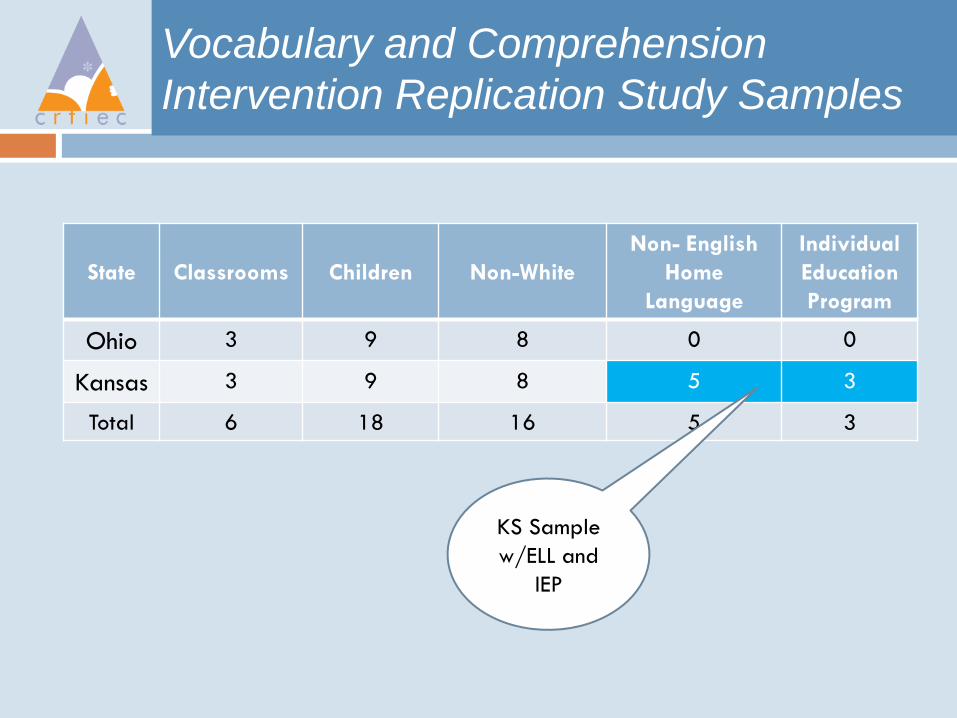
Vocabulary and Comprehension
Intervention Replication Study Samples
State
Classrooms
Children
Non-White
Non- English
Home
Language
Individual
Education
Program
Ohio 3 9 8 0 0
Kansas 3 9 8 5 3
Total 6 18 16 5 3
KS Sample
w/ELL and
IEP
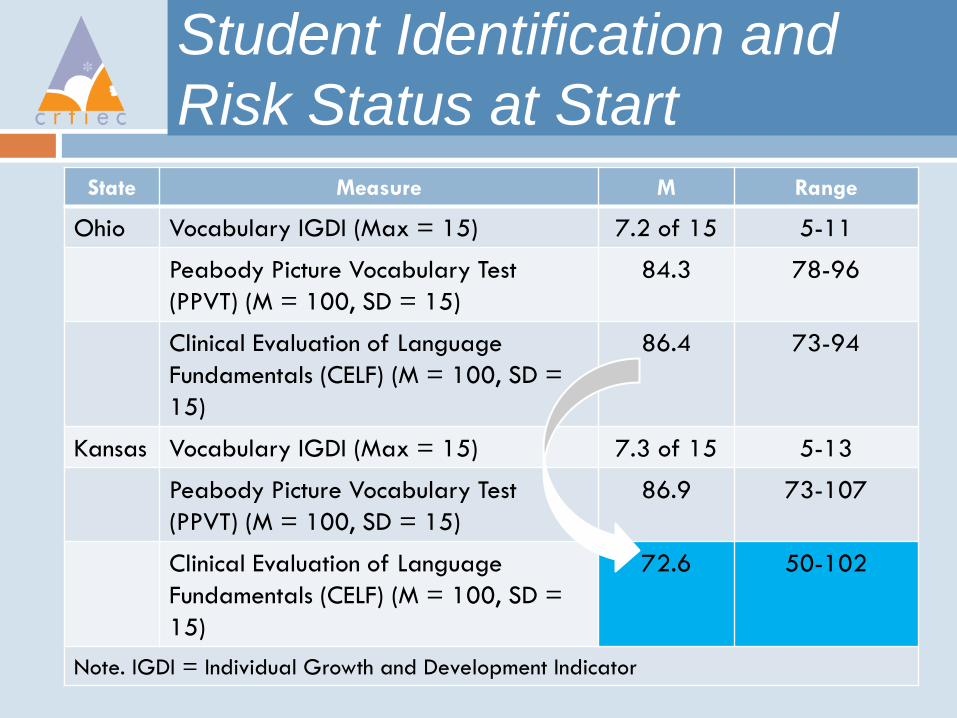
Student Identification and
Risk Status at Start
State Measure M Range
Ohio Vocabulary IGDI (Max = 15) 7.2 of 15 5-11
Peabody Picture Vocabulary Test
(PPVT) (M = 100, SD = 15)
84.3 78-96
Clinical Evaluation of Language
Fundamentals (CELF) (M = 100, SD =
15)
86.4 73-94
Kansas Vocabulary IGDI (Max = 15) 7.3 of 15 5-13
Peabody Picture Vocabulary Test
(PPVT) (M = 100, SD = 15)
86.9 73-107
Clinical Evaluation of Language
Fundamentals (CELF) (M = 100, SD =
15)
72.6 50-102
Note. IGDI = Individual Growth and Development Indicator
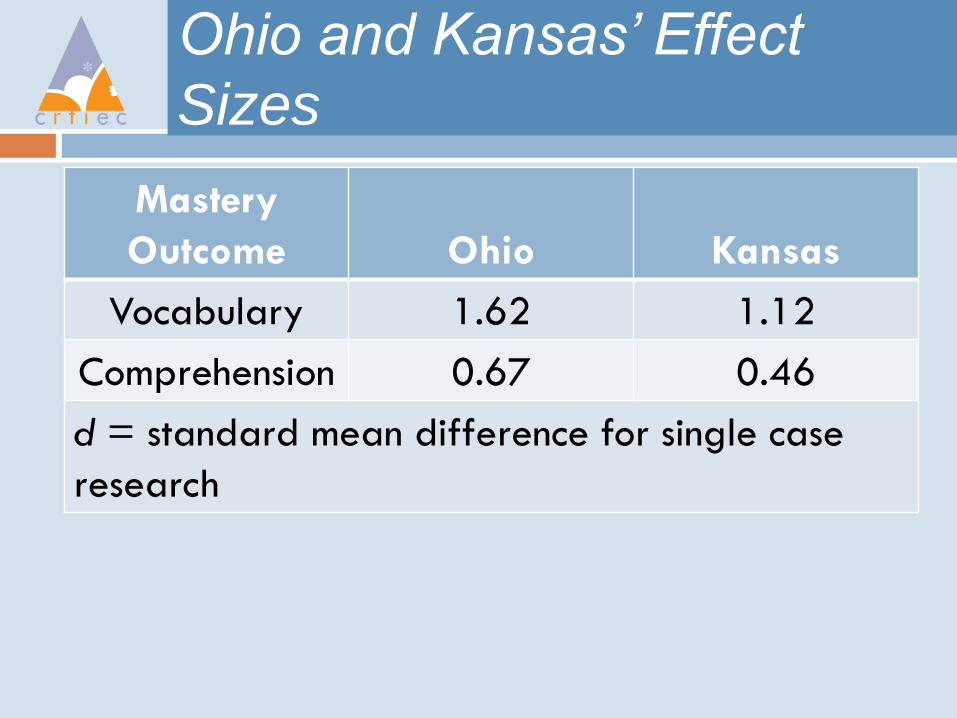
Ohio and Kansas’ Effect
Sizes
Mastery
Outcome
Ohio
Kansas
Vocabulary 1.62 1.12
Comprehension 0.67 0.46
d = standard mean difference for single case
research
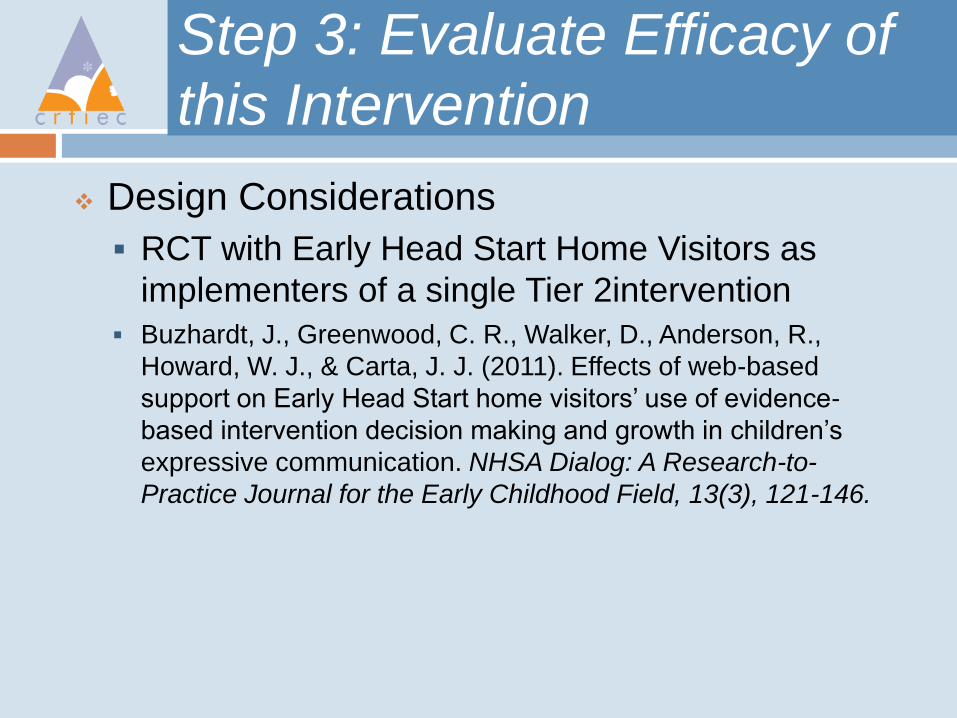
Step 3: Evaluate Efficacy of
this Intervention
Design Considerations
RCT with Early Head Start Home Visitors as
implementers of a single Tier 2intervention
Buzhardt, J., Greenwood, C. R., Walker, D., Anderson, R.,
Howard, W. J., & Carta, J. J. (2011). Effects of web-based
support on Early Head Start home visitors’ use of evidence-
based intervention decision making and growth in children’s
expressive communication. NHSA Dialog: A Research-to-
Practice Journal for the Early Childhood Field, 13(3), 121-146.
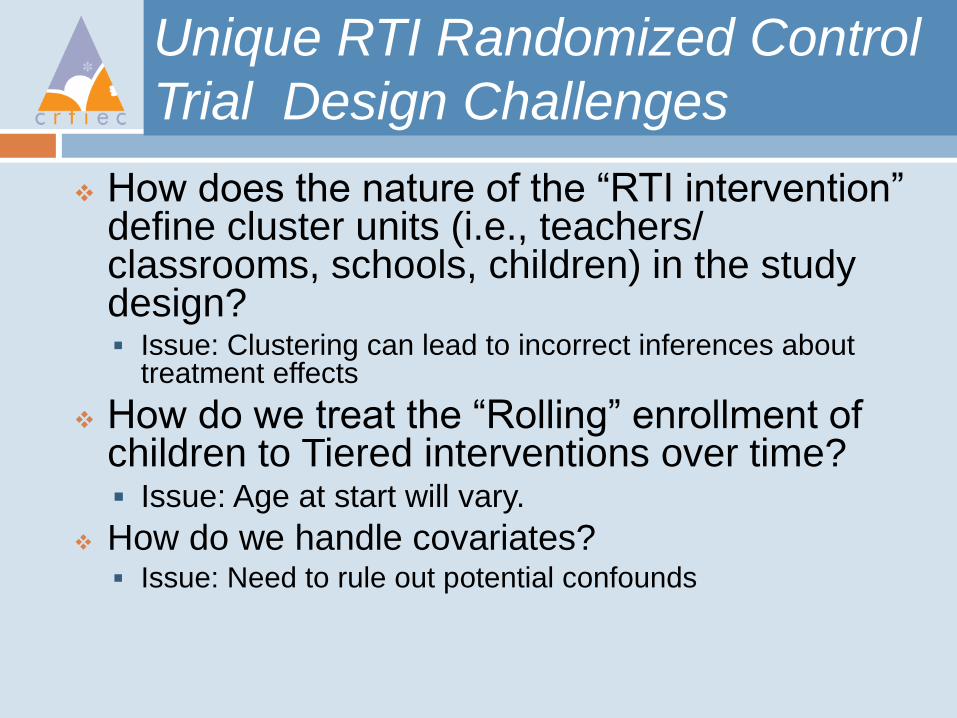
Unique RTI Randomized Control
Trial Design Challenges
How does the nature of the “RTI intervention” define cluster units (i.e., teachers/ classrooms, schools, children) in the study design? Issue: Clustering can lead to incorrect inferences about
treatment effects
How do we treat the “Rolling” enrollment of children to Tiered interventions over time? Issue: Age at start will vary.
How do we handle covariates? Issue: Need to rule out potential confounds
Unique RTI Randomized Control
Trial Design Challenges
How do we handle Tier intervention
assignments that are fluid over time?
Issue: Dosage and time in treatment varies
based on child progress
How should we treat repeatedly measured
progress monitoring data?
Issue: Growth curve analysis
RCT Study Highlights
Purpose – To assess the efficacy of a Tier 2 naturalistic language intervention delivered in the home to parents by home visitors who coach and monitor the parents implementation with their children under two conditions:
A = RTI screening, progress monitoring, decision making, and language promoting strategies implemented in the home by parents
B = A + Making Online Decisions (MOD) Support System
Wait-list RTC
Home visitors randomized within programs
Children nested under home visitors
Participants –
Early Head Start: 5 Programs and 659 children in all
Home Visitors (N = 48, 26 and 22 by group A and B respectively)
Children identified below benchmark (N = 124)
Study Highlights
Unit of Treatment – because treatment was
guided by home visitors, they were
randomized to the two conditions, not children
Measures
Repeatedly measured Early Communication skills
allowing examination of children’s growth over
time
Fidelity of implementation for home visitors and
parents
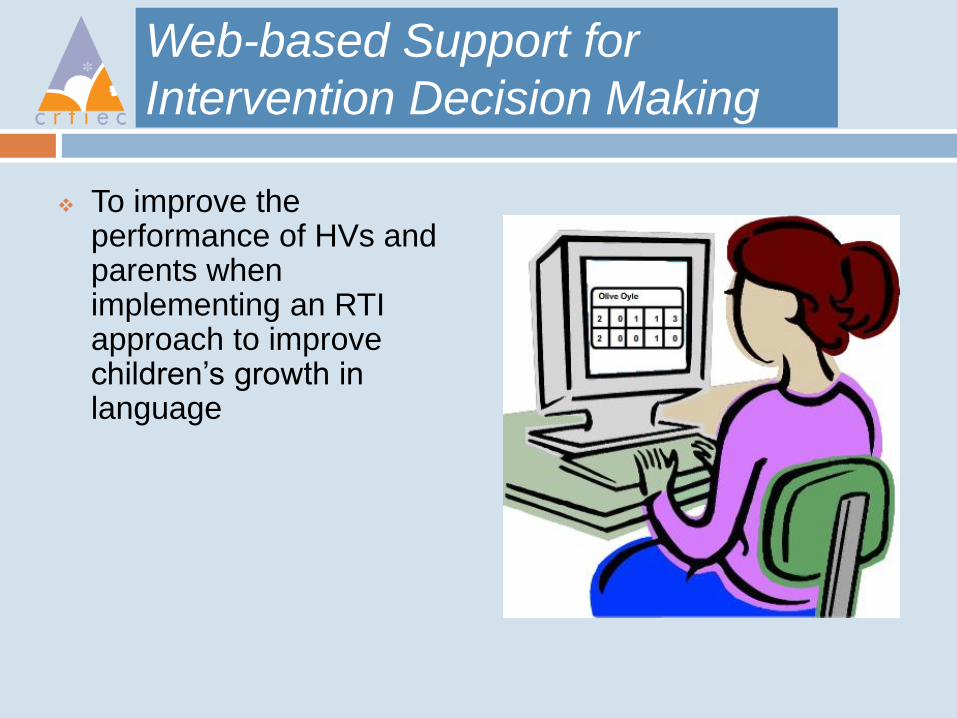
Web-based Support for
Intervention Decision Making
To improve the performance of HVs and parents when implementing an RTI approach to improve children’s growth in language
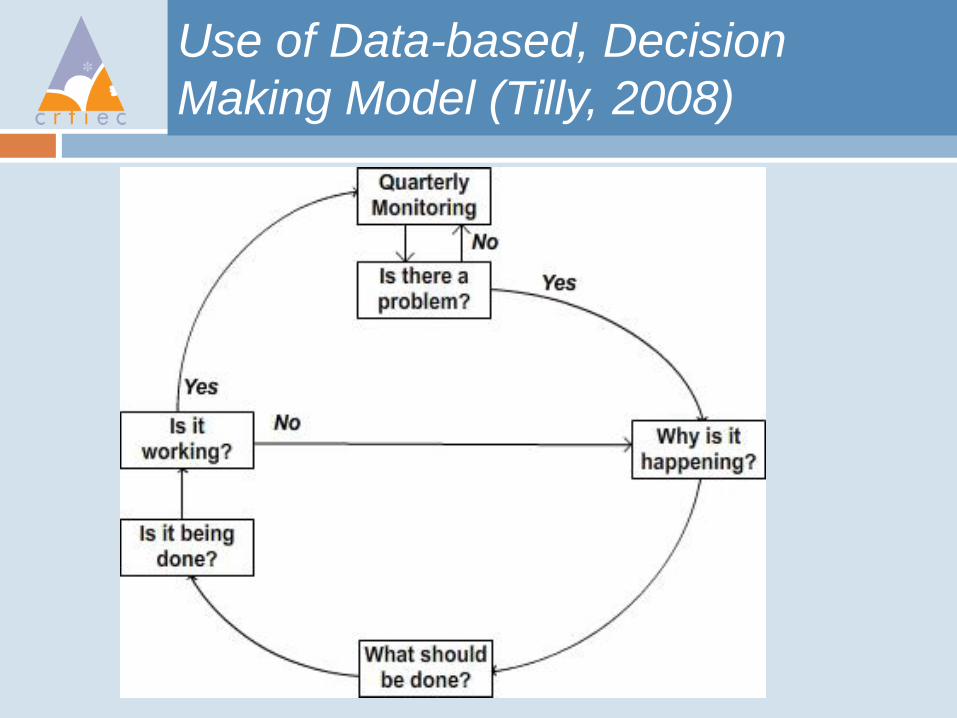
Use of Data-based, Decision
Making Model (Tilly, 2008)
Analytic Strategy
Because this was a randomized design and
the dependent variable was children’s
language growth trajectories we, used
univariate CGA
Individual children’s growth is considered in terms
of slope and intercept
It handles missing data
It supports the use of independent variables and
covariates (IFSP status, Age at Eligibility)
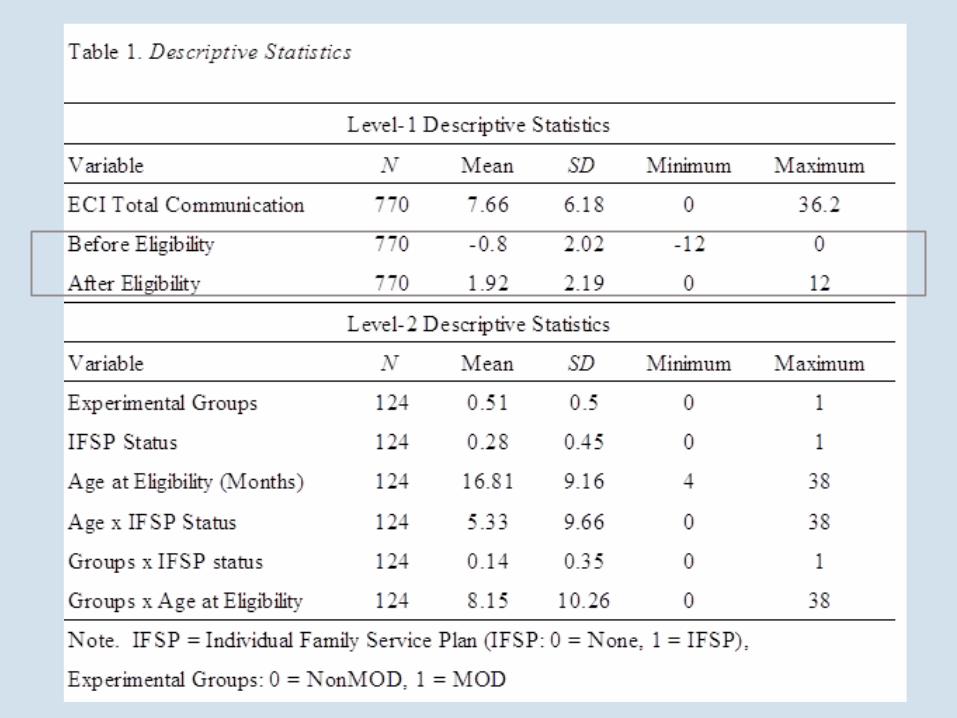
Analytic Strategy
Because children were screened into the study
at different times, each child’s language data
was converted to a time scale in terms of
months before and after onset of the Tier 2
intervention.
This enabled use of a twice-piece CGA with
the intercept centered at the last time point
prior to start of the intervention (time = 0)
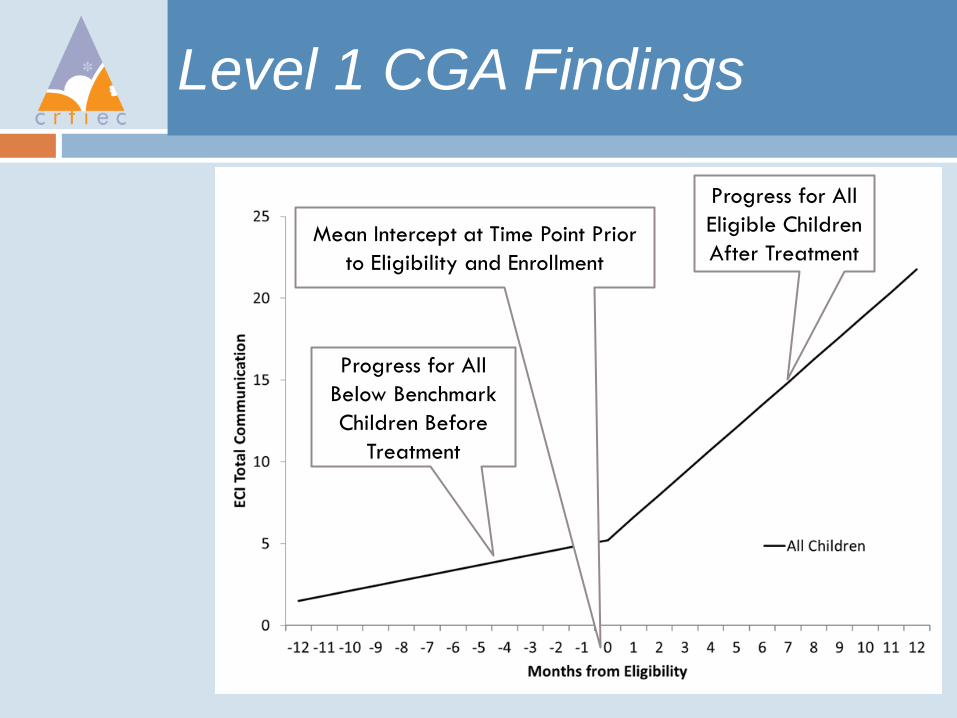
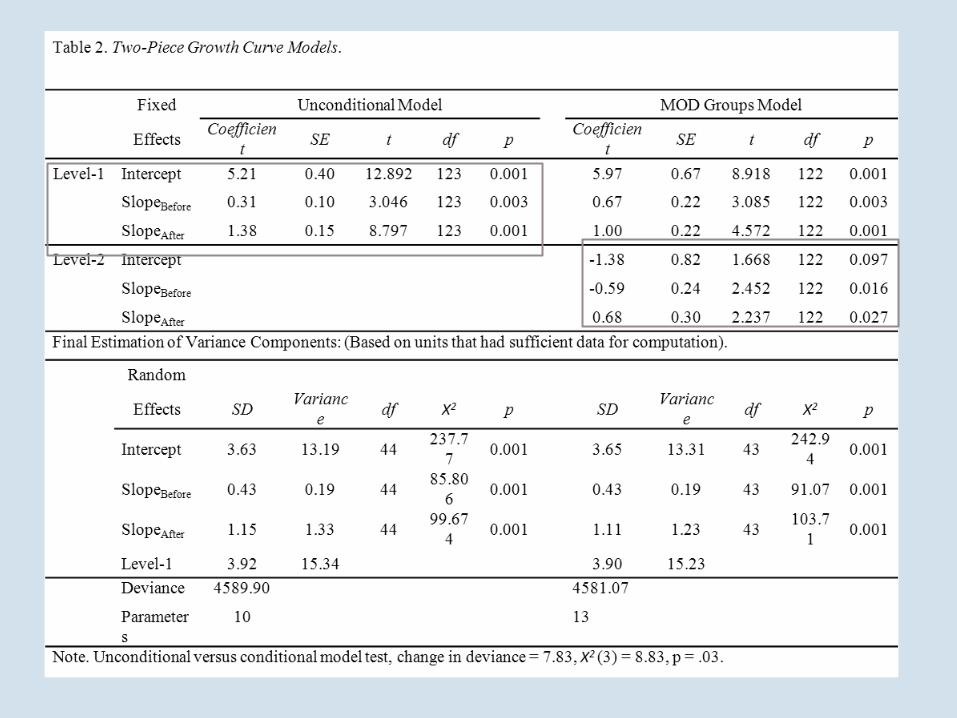
Level 1 CGA Findings
Progress for All
Below Benchmark
Children Before
Treatment
Progress for All
Eligible Children
After Treatment Mean Intercept at Time Point Prior
to Eligibility and Enrollment
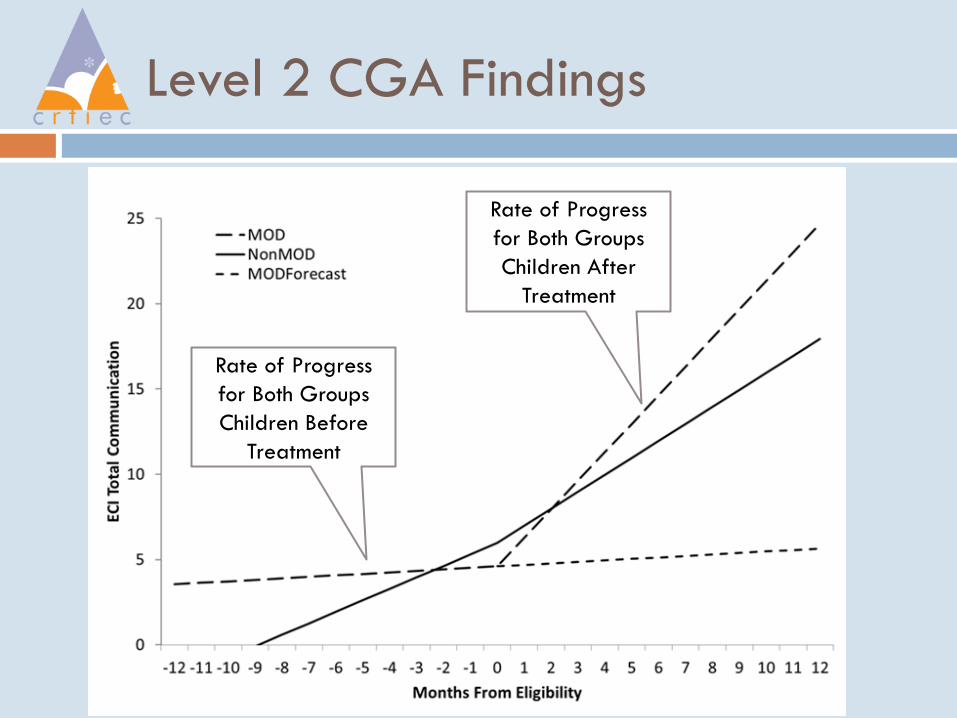
Level 2 CGA Findings
Rate of Progress
for Both Groups
Children Before
Treatment
Rate of Progress
for Both Groups
Children After
Treatment
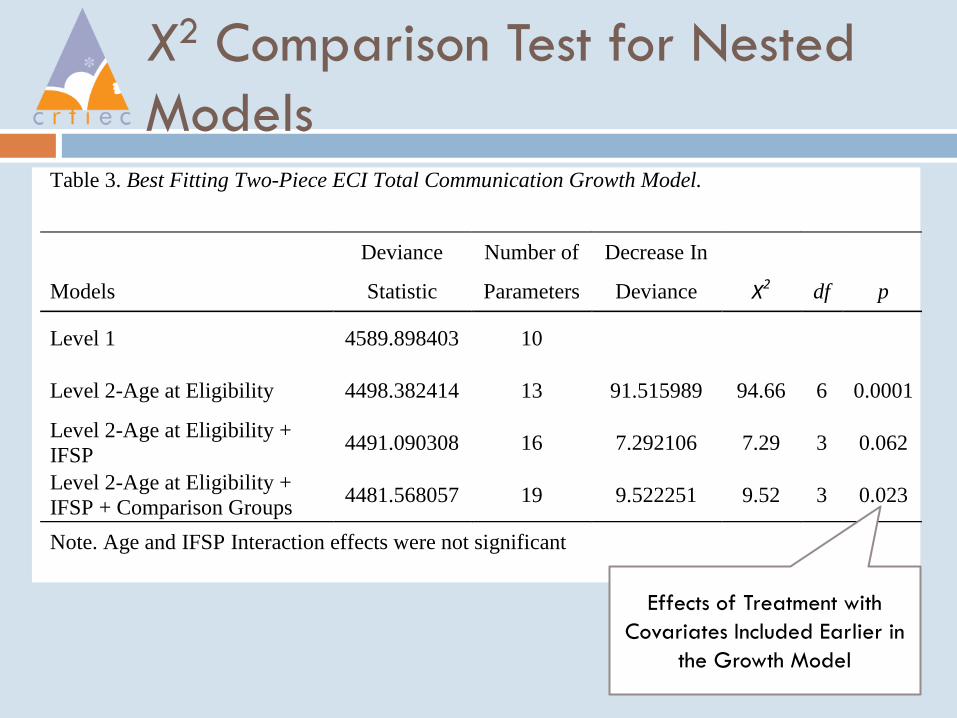
X2 Comparison Test for Nested
Models Table 3. Best Fitting Two-Piece ECI Total Communication Growth Model.
Deviance Number of Decrease In
Models Statistic Parameters Deviance X2 df p
Level 1 4589.898403 10
Level 2-Age at Eligibility 4498.382414 13 91.515989 94.66 6 0.0001
Level 2-Age at Eligibility +
IFSP 4491.090308 16 7.292106 7.29 3 0.062
Level 2-Age at Eligibility +
IFSP + Comparison Groups 4481.568057 19 9.522251 9.52 3 0.023
Note. Age and IFSP Interaction effects were not significant
Effects of Treatment with
Covariates Included Earlier in
the Growth Model
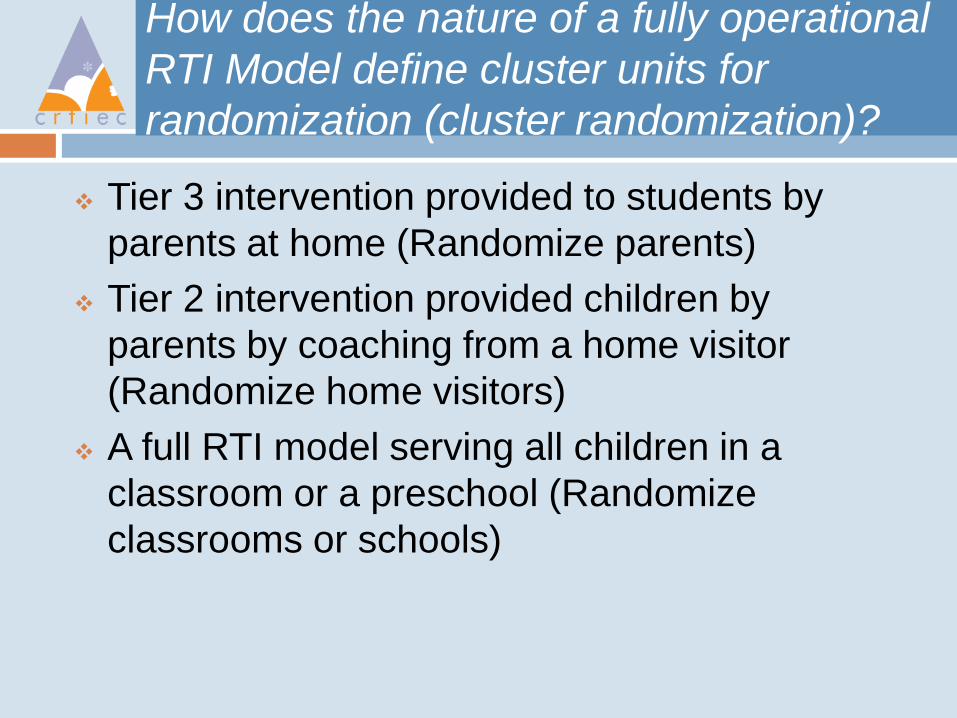
How does the nature of a fully operational
RTI Model define cluster units for
randomization (cluster randomization)?
Tier 3 intervention provided to students by
parents at home (Randomize parents)
Tier 2 intervention provided children by
parents by coaching from a home visitor
(Randomize home visitors)
A full RTI model serving all children in a
classroom or a preschool (Randomize
classrooms or schools)
Multi-Level Growth Models
Represent Clustering
Classroom Level and Child Level Example of
Growth in 1 IGDI
Classroom Level and Child Level Example of
Growth in 2 IGDIs
Program Level and Child Level Example
Preschool Level, Child Level Example
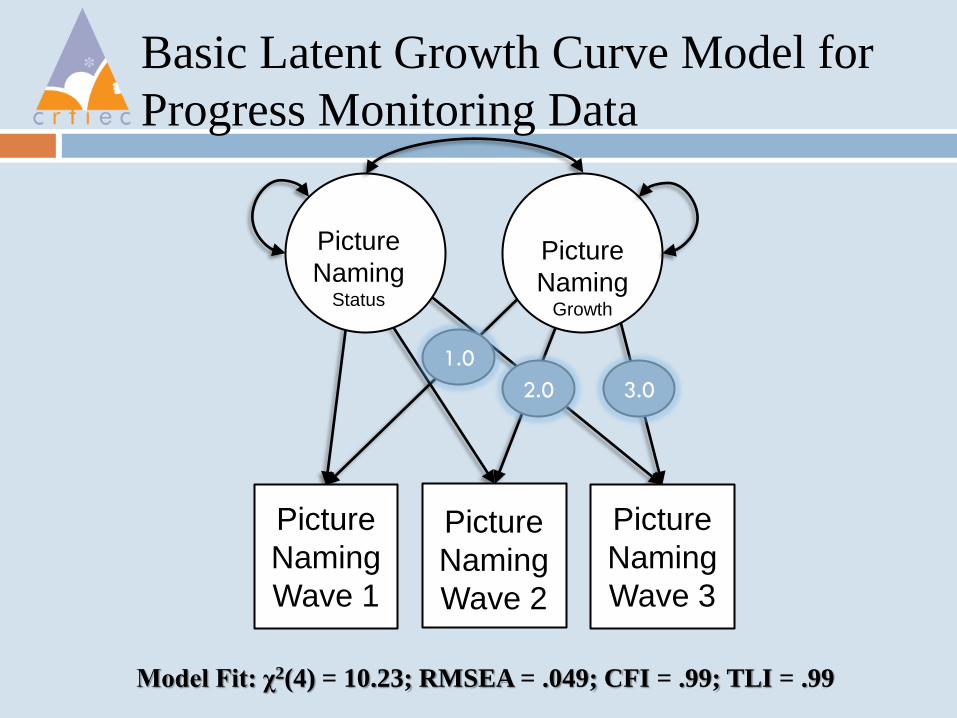
Basic Latent Growth Curve Model for
Progress Monitoring Data
Picture
Naming Status
Picture
Naming
Wave 1
Picture
Naming
Wave 2
Picture
Naming
Wave 3
Model Fit: χ2(4) = 10.23; RMSEA = .049; CFI = .99; TLI = .99
Picture
Naming Growth
1.0
2.0 3.0
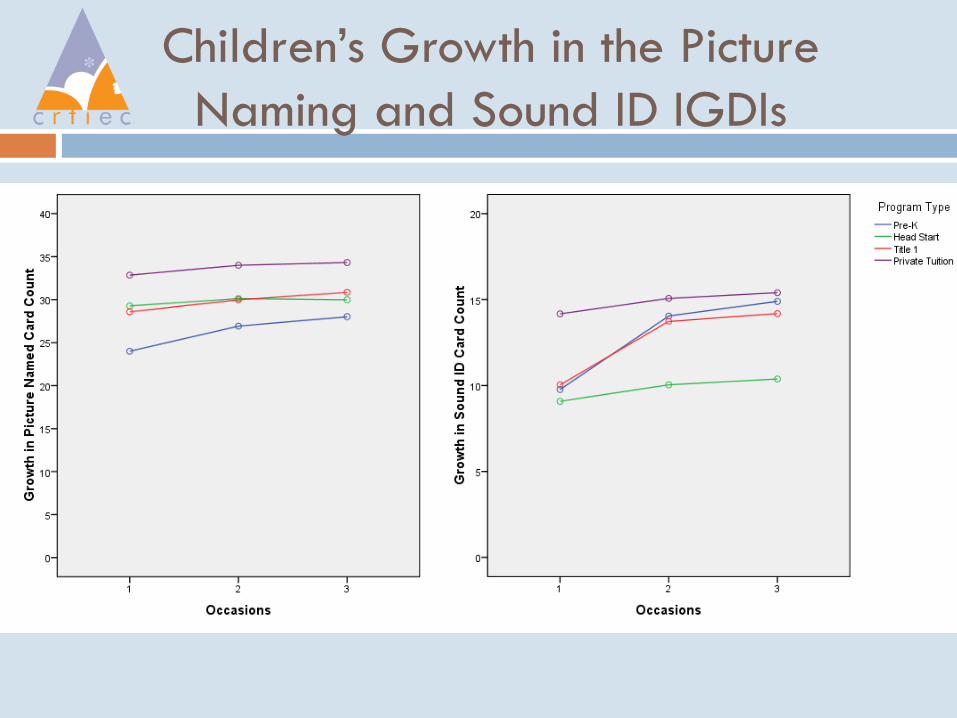
Children’s Growth in the Picture
Naming and Sound ID IGDIs
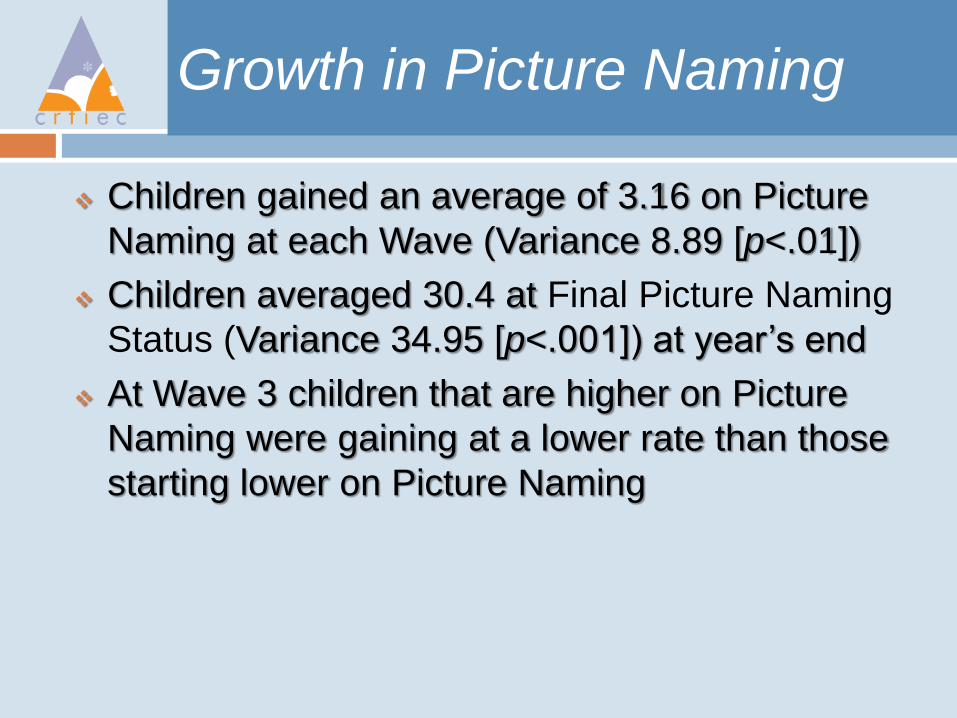
Growth in Picture Naming
Children gained an average of 3.16 on Picture
Naming at each Wave (Variance 8.89 [p<.01])
Children averaged 30.4 at Final Picture Naming
Status (Variance 34.95 [p<.001]) at year’s end
At Wave 3 children that are higher on Picture
Naming were gaining at a lower rate than those
starting lower on Picture Naming
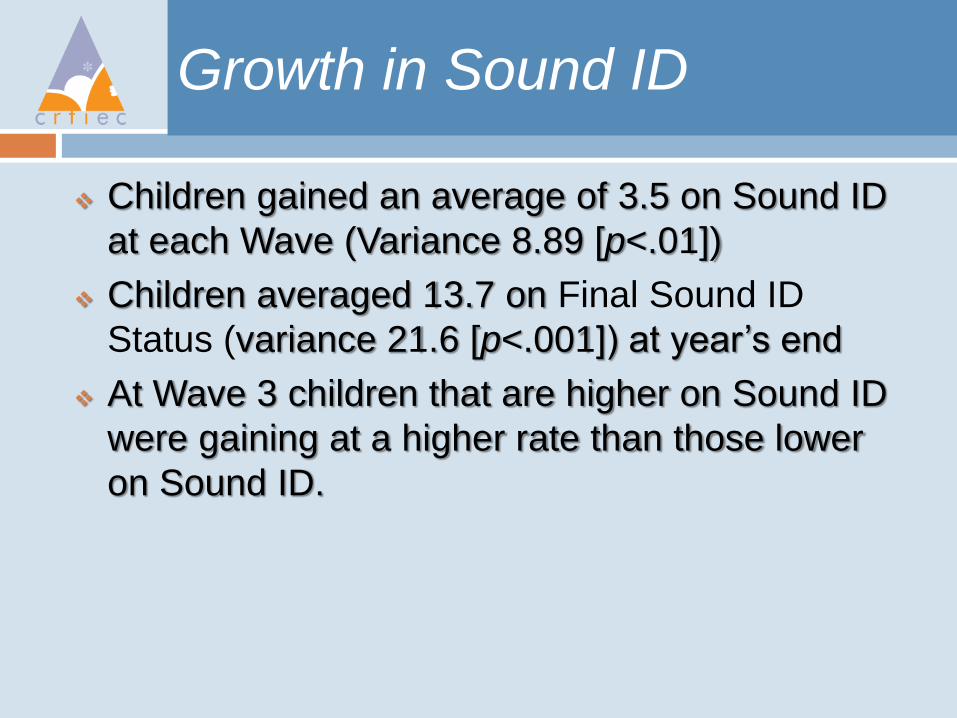
Growth in Sound ID
Children gained an average of 3.5 on Sound ID
at each Wave (Variance 8.89 [p<.01])
Children averaged 13.7 on Final Sound ID
Status (variance 21.6 [p<.001]) at year’s end
At Wave 3 children that are higher on Sound ID
were gaining at a higher rate than those lower
on Sound ID.
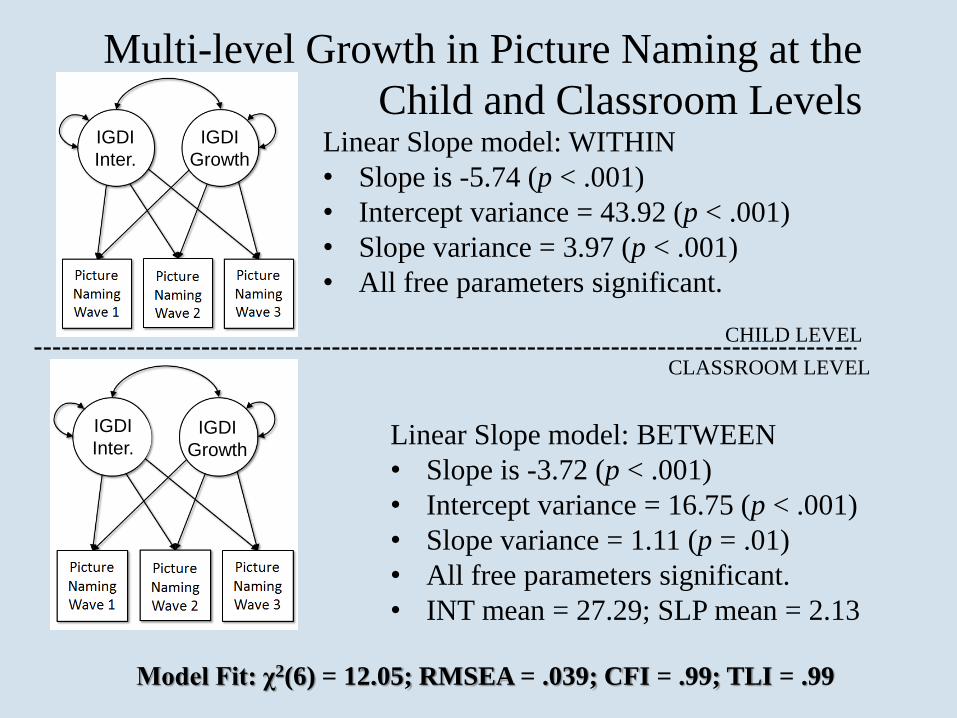
Multi-level Growth in Picture Naming at the
Child and Classroom Levels
CHILD LEVEL
CLASSROOM LEVEL
Linear Slope model: WITHIN
• Slope is -5.74 (p < .001)
• Intercept variance = 43.92 (p < .001)
• Slope variance = 3.97 (p < .001)
• All free parameters significant.
IGDI
Growth
IGDI
Inter.
IGDI
Growth
IGDI
Inter. Linear Slope model: BETWEEN
• Slope is -3.72 (p < .001)
• Intercept variance = 16.75 (p < .001)
• Slope variance = 1.11 (p = .01)
• All free parameters significant.
• INT mean = 27.29; SLP mean = 2.13
Model Fit: χ2(6) = 12.05; RMSEA = .039; CFI = .99; TLI = .99
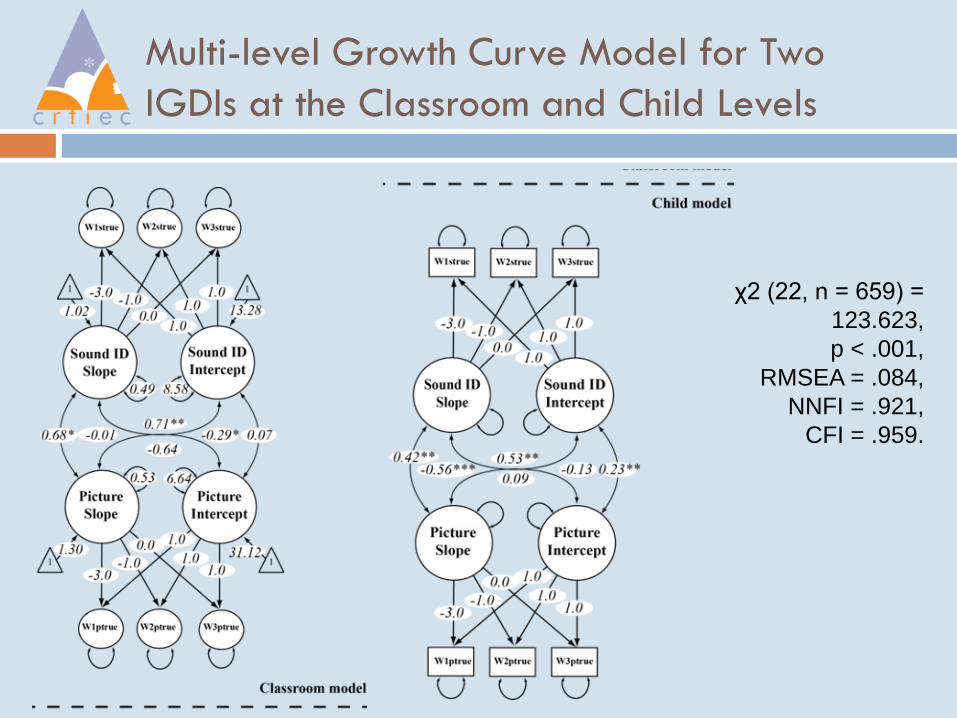
Multi-level Growth Curve Model for Two
IGDIs at the Classroom and Child Levels
χ2 (22, n = 659) =
123.623,
p < .001,
RMSEA = .084,
NNFI = .921,
CFI = .959.
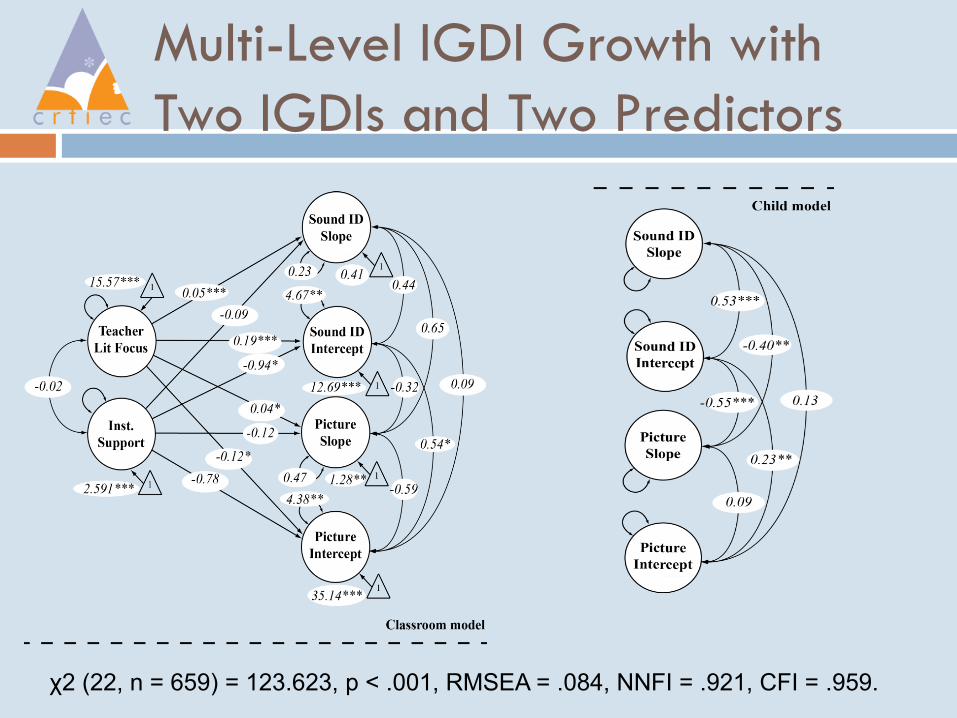
Multi-Level IGDI Growth with
Two IGDIs and Two Predictors
χ2 (22, n = 659) = 123.623, p < .001, RMSEA = .084, NNFI = .921, CFI = .959.
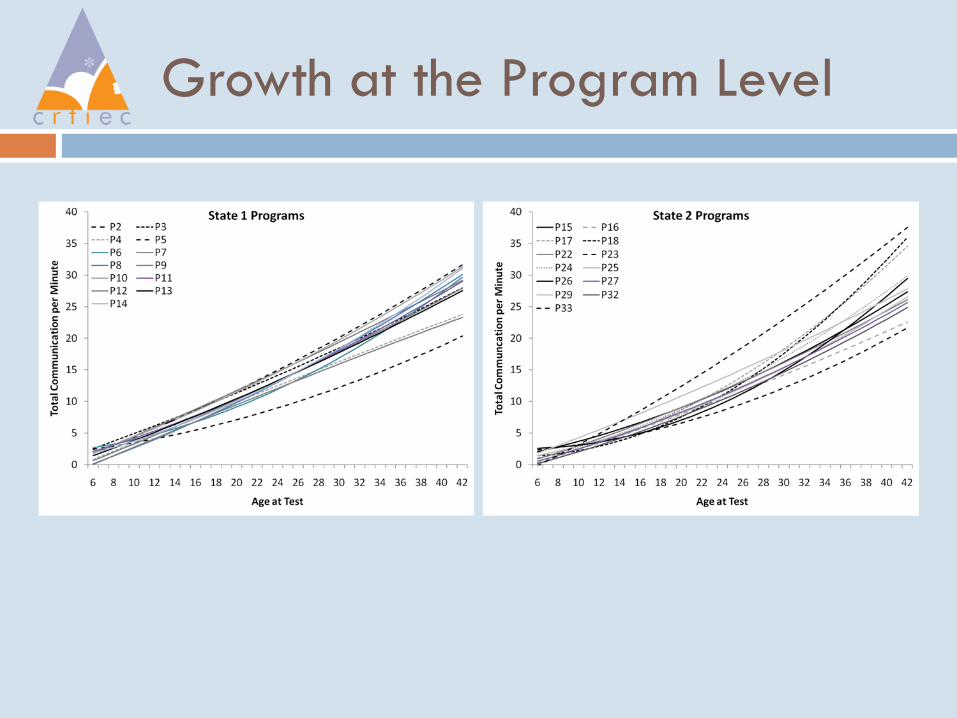
Growth at the Program Level
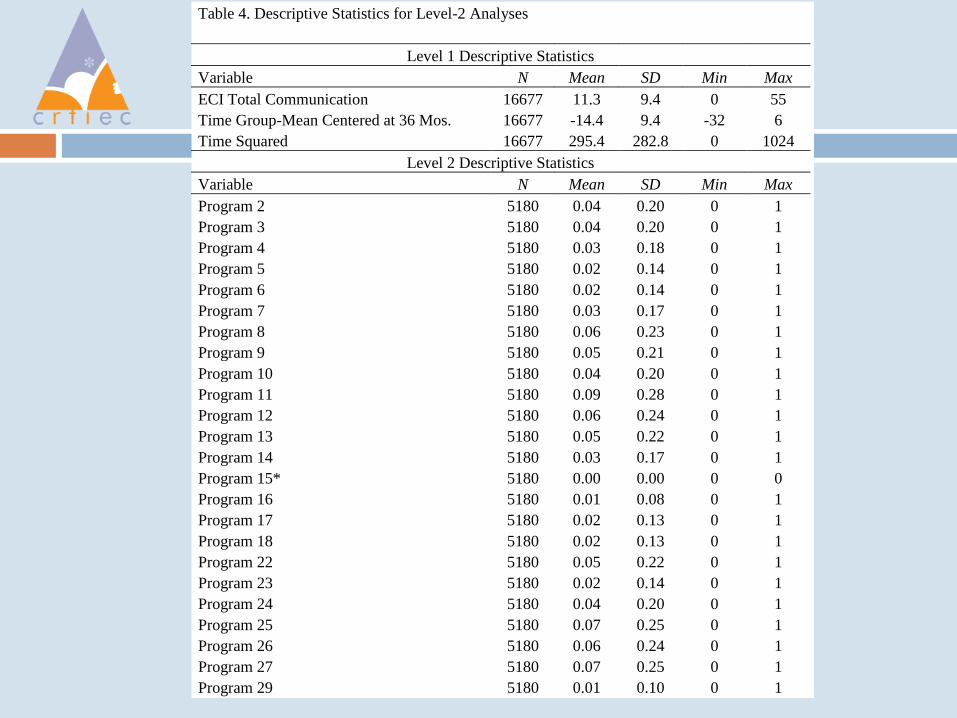
Table 4. Descriptive Statistics for Level-2 Analyses
Level 1 Descriptive Statistics
Variable N Mean SD Min Max
ECI Total Communication 16677 11.3 9.4 0 55
Time Group-Mean Centered at 36 Mos. 16677 -14.4 9.4 -32 6
Time Squared 16677 295.4 282.8 0 1024
Level 2 Descriptive Statistics
Variable N Mean SD Min Max
Program 2 5180 0.04 0.20 0 1
Program 3 5180 0.04 0.20 0 1
Program 4 5180 0.03 0.18 0 1
Program 5 5180 0.02 0.14 0 1
Program 6 5180 0.02 0.14 0 1
Program 7 5180 0.03 0.17 0 1
Program 8 5180 0.06 0.23 0 1
Program 9 5180 0.05 0.21 0 1
Program 10 5180 0.04 0.20 0 1
Program 11 5180 0.09 0.28 0 1
Program 12 5180 0.06 0.24 0 1
Program 13 5180 0.05 0.22 0 1
Program 14 5180 0.03 0.17 0 1
Program 15* 5180 0.00 0.00 0 0
Program 16 5180 0.01 0.08 0 1
Program 17 5180 0.02 0.13 0 1
Program 18 5180 0.02 0.13 0 1
Program 22 5180 0.05 0.22 0 1
Program 23 5180 0.02 0.14 0 1
Program 24 5180 0.04 0.20 0 1
Program 25 5180 0.07 0.25 0 1
Program 26 5180 0.06 0.24 0 1
Program 27 5180 0.07 0.25 0 1
Program 29 5180 0.01 0.10 0 1
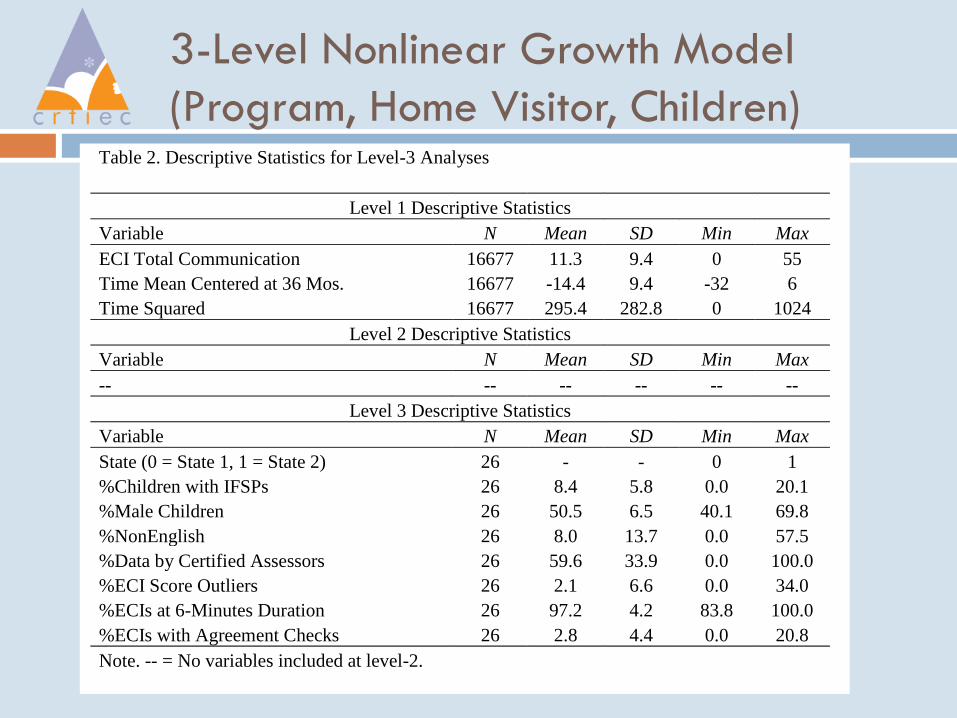
3-Level Nonlinear Growth Model
(Program, Home Visitor, Children) Table 2. Descriptive Statistics for Level-3 Analyses
Level 1 Descriptive Statistics
Variable N Mean SD Min Max
ECI Total Communication 16677 11.3 9.4 0 55
Time Mean Centered at 36 Mos. 16677 -14.4 9.4 -32 6
Time Squared 16677 295.4 282.8 0 1024
Level 2 Descriptive Statistics
Variable N Mean SD Min Max
-- -- -- -- -- --
Level 3 Descriptive Statistics
Variable N Mean SD Min Max
State (0 = State 1, 1 = State 2) 26 - - 0 1
%Children with IFSPs 26 8.4 5.8 0.0 20.1
%Male Children 26 50.5 6.5 40.1 69.8
%NonEnglish 26 8.0 13.7 0.0 57.5
%Data by Certified Assessors 26 59.6 33.9 0.0 100.0
%ECI Score Outliers 26 2.1 6.6 0.0 34.0
%ECIs at 6-Minutes Duration 26 97.2 4.2 83.8 100.0
%ECIs with Agreement Checks 26 2.8 4.4 0.0 20.8
Note. -- = No variables included at level-2.
Summary/Conclusion
Preschool RTI needs a generation of research
seeking to reach a level of effectiveness
greater than business as usual
This work challenges to study designs that are
predicated on the nuances in the RTI
approach and evidence-based practices
Solutions to some of these issues (certainly
not all!) were illustrated