Embed Size (px)
Citation preview

Alternative Cut-off and Surface Finishing
of Investment Castings
A thesis submitted to the University of Birmingham
for the degree of
MSc by Research
by
Miriam Cashman, BEng (Hons)

University of Birmingham Research Archive
e-theses repository This unpublished thesis/dissertation is copyright of the author and/or third parties. The intellectual property rights of the author or third parties in respect of this work are as defined by The Copyright Designs and Patents Act 1988 or as modified by any successor legislation. Any use made of information contained in this thesis/dissertation must be in accordance with that legislation and must be properly acknowledged. Further distribution or reproduction in any format is prohibited without the permission of the copyright holder.

i
Abstract
The research investigates the capability of replacing the cut-off and gate-removal processes at
DePuy Synthes (Ireland) with a single cutting operation. Abrasive WaterJet Cutting (AWJC),
Laser Cutting, Electrical Discharge Machining (EDM) and Plasma Cutting were considered as
alternatives to the current system. Custom investment castings were produced for use in AWJC
experiments to determine the cutting speeds for a range of cut thickness (2 to 30 mm) for the
Cobalt-Chrominum-Molybdenum (CoCrMo) alloy. Femoral and tray castings, each with different
tree designs, were evaluated post knockout (vibratory shell removal). Femoral parts were
undamaged by jet deflection or wear when utilising the correct set up of the AWJC nozzle.
Using a traverse speed of 130 mm/min, the surface finish at the bottom of the 16 mm thick
femoral gate was visually equivalent to the current surface finish obtained after gate removal
(Ra of 9 μm). Thin femoral sections (3.2 mm) cut at 400 mm/min achieved an acceptable Ra of
7 µm with a cycle time of 6 minutes per tree, which was 70% lower than the current processing
time of 23 minutes. Tray castings cut with a traverse speed of 60 mm/min achieved a surface
roughness Ra of 10 µm. However, the process was unsuitable for trays because jet deflection
below the cut caused excessive wear to the machined parts. The use of AWJC for femorals has
the ergonomic benefit of eliminating all manual grinding in the foundry, as well as labour
savings equivalent to a Return-On-Investment (ROI) of two years. Further development of a 3-
dimensional (3-D) vision system however is required to automate the AWJC of femoral castings.

ii
Acknowledgements
I would like to thank my supervisors Prof. Duncan Shepherd and Dr. Sein Leung Soo for their
guidance, and my colleagues at DePuy Synthes for their constant help, particularly Sonia
Ramirez-Garcia, Gavin Dooley, Aziza Mahomed, Brian Conroy and Alan Kavanagh. I would also
like to express my gratitude to Barry Holdsworth and Dr. Amir Rabani (University of
Nottingham) for the use of their facilities and experience, as well as Ben Adams (WARDJet) for
his sharing expert knowledge and advice on waterjet systems. Most of all, I would like to thank
my fiance Garrett Byrne for supporting me in finishing the thesis.
The author would like to acknowledge the EU for the funding support under the Marie Curie
Actions – Industry Academia Partnerships and Pathways, within Framework 7, Grant Agreement
251269, “MEDCAST”, as well as funding support from the FP7 project “ConforM-Jet”.

iii
Table of Contents
Abstract............................................................................................................................................i
Acknowledgements.........................................................................................................................ii
Table of Contents...........................................................................................................................iii
Nomenclature.................................................................................................................................x
1. INTRODUCTION ........................................................................................................... 1
2. BACKGROUND ............................................................................................................. 5
2.1 The Investment Casting Process ...................................................................................... 5
2.1.1 Introduction .............................................................................................................. 5
2.1.2 Wax Injection & Assembly ........................................................................................ 6
2.1.3 Shell Build .................................................................................................................. 7
2.1.4 Casting ....................................................................................................................... 7
2.1.5 Post-Cast Finishing .................................................................................................... 9
2.1.6 Inspection ................................................................................................................ 11
2.1.7 Further Processing .................................................................................................. 11
2.2 Opportunities within Post-Cast Finishing ....................................................................... 12
2.2.1 Introduction ............................................................................................................ 12
2.2.2 Cut-off and Grinding Alternatives for Tibial Castings ............................................. 12
2.2.3 Cut-off and Grinding Alternatives for Femoral Castings ......................................... 13
2.2.4 Alternative Cutting Process & Elimination of Grinding .......................................... 14
2.3 Cutting Operation Requirements ................................................................................... 15
2.4 Alternative Cutting Processes ........................................................................................ 17
2.4.1 Abrasive WaterJet Cutting ...................................................................................... 17

iv
2.4.2 Laser cutting ............................................................................................................ 27
2.4.3 EDM ......................................................................................................................... 33
2.4.4 Plasma Cutting ........................................................................................................ 34
2.4.5 Summary ................................................................................................................. 35
3. MATERIALS AND METHODS ....................................................................................... 37
3.1 Preparation of Investment Castings ............................................................................... 37
3.2 AWJC Equipment & Settings .......................................................................................... 41
3.2.1 AWJC Equipment..................................................................................................... 41
3.2.2 Design of Experiments ............................................................................................ 42
3.2.3 Process Setting for Femoral Castings ...................................................................... 44
3.2.4 Process Settings for Tibial Castings ......................................................................... 44
3.3 Measurement Methods ................................................................................................. 45
4. EXPERIMENTAL RESULTS ........................................................................................... 52
4.1 Cut Surface Characteristics ............................................................................................ 52
4.2 Process Settings .............................................................................................................. 56
4.2.1 Cut Depth ................................................................................................................ 56
4.2.2 Cut Quality .............................................................................................................. 58
4.2.3 Abrasive Mass Flow Rate ........................................................................................ 60
4.2.4 DOE Results ............................................................................................................. 60
4.2.5 Process Variation .................................................................................................... 63
4.3 Ceramic Cutting .............................................................................................................. 64
4.4 Femoral Cutting .............................................................................................................. 65
4.5 Tibial Cutting .................................................................................................................. 68
5. DISCUSSION .............................................................................................................. 74

v
5.1 Choice of Cutting System ............................................................................................... 74
5.2 Femoral AWJC ................................................................................................................ 74
5.2.1 Cutting Speeds ........................................................................................................ 74
5.2.2 Abrasive embedment and surface characteristics ................................................. 75
5.2.3 Automation of Femoral AWJC ................................................................................ 76
5.3 Limitations of AWJC ....................................................................................................... 77
5.3.1 AWJC of Tibials ........................................................................................................ 77
5.3.2 Process Stability ...................................................................................................... 80
5.3.3 Water Filtration & Tank Cleaning ........................................................................... 81
5.4 Running Costs ................................................................................................................. 83
5.5 Health & Safety Considerations ..................................................................................... 85
5.6 Comparison of AWJC with Current Solution .................................................................. 85
5.7 Recommendations for Future Work .............................................................................. 86
6. CONCLUSIONS ........................................................................................................... 88
REFERENCES ........................................................................................................................ 90
List of Tables
Table 2- 1: Mechanical properties of CoCrMo, stainless steel and Ti-6Al-4V ................................ 8
Table 2- 2: Chemical composition of CoCrMo (ASTM F-75) (ASTM, 1998) .................................... 9
Table 2- 3: Total tolerance band after surface finishing ............................................................... 15
Table 2- 4: Composition of garnet abrasive (Pon Selvan et al., 2012) .......................................... 22
Table 2- 5: Comparison of drying systems (AirControlIndustriesLtd, 2013b) .............................. 26
Table 3- 1: Traverse speeds used for experiments ....................................................................... 43
Table 3- 2: AWJC Process settings for femorals ............................................................................ 44
Table 3- 3: AWJC Process settings for tibials ................................................................................ 45
vi
Table 3- 4: Process conditions for samples used in measurement repeatability study ............... 48
Table 3- 5: SEM settings used ....................................................................................................... 51
Table 5- 1: AWJC consumables cost.............................................................................................. 84
Table 5- 2: Comparison of AWJC with the current process .......................................................... 86
List of Figures
Figure 1: Total Knee Replacement (TKR) (Davies, 2013) (a) Pre-operative model of knee (b) Post-
operative model of knee showing the three primary components of TKR .................................... 2
Figure 2- 1: Investment casting process (Non-ferrousFounders'Society, 2014) ............................ 5
Figure 2- 2: Current gate-removal process: (a) Cut-off wheel (b) Robotic grinding ..................... 10
Figure 2- 3: Flat grinding machine (Maegerle, 2014) ................................................................... 12
Figure 2- 4: Alternative post-cast process flow opportunity ........................................................ 15
Figure 2- 5: Femoral surface finish post grinding & blasting: (a) thin sections (b) thick sections 16
Figure 2- 6: Structure of a high-speed waterjet (Momber et al., 2002) ....................................... 17
Figure 2- 7: Surface characteristics following AWJC of metallic workpiece (a) Vt 100 mm/min (b)
Vt 200 mm/min ............................................................................................................................. 19
Figure 2- 8: Cutting speed increases with higher pressure (Flow, 2010) ..................................... 20
Figure 2- 9: Waterjet nozzle configuration (WARDJet, 2013b) .................................................... 21
Figure 2- 10: Typical airknife drying system (AirControlIndustriesLtd, 2013c) ............................ 25
Figure 2- 11: Laser cutting: (a) Laser cutting of sheet metal (LabcoWelding, 2013) (b) Typical
cutting speeds for aluminium, mild steel and stainless steel using a 3 kW laser (Berkmanns and
Faerber, 2008) ............................................................................................................................... 27
Figure 2- 12: Laser cut face of 10 mm thick stainless steel (Wandera et al., 2011): (a) Too slow
(b) Correct speed (c) Too fast ....................................................................................................... 29
Figure 2- 13: SEM image of recast layer and HAZ after laser cutting (Hasçalık and Ay, 2013) .... 30
Figure 2- 14: Angle of incidence during laser cutting for a thin material and thicker material
(Headland Machinery Pty Ltd, 2015) ............................................................................................ 31
Figure 2- 15: Electrical discharge machining (EDM) of CoCrMo ................................................... 34

vii
Figure 2- 16: Plasma Cutting Process (Farmweld, 2014) .............................................................. 35
Figure 3- 1: CoCrMo castings used for preliminary trials: (a) 13 mm thick plates (b) 30 mm
diameter cylinders ........................................................................................................................ 37
Figure 3- 2: Mould preparation: (a) Wax tree (b) Shell coat (c) De-wax ...................................... 38
Figure 3- 3: Failed mould: (a) top remains (b) bottom remains (c) Typical crack ........................ 39
Figure 3- 4: Improved wax tree designs: (a) flat bars 2, 4, 6, 8 and 10 mm thick (b) cylinders 5,
10, 15 and 20 mm diameter ......................................................................................................... 39
Figure 3- 5: De-wax improvements: (a) Wax exited from holes drilled before de-wax (b) Moulds
examined for cracks after burnout (c) Holes plugged with firing clay before the second furnace
cycle .............................................................................................................................................. 40
Figure 3- 6: Post-cast test sample preparation: (a) solidification after pour (b) after knockout (c)
cut-off with AWJC (d) test specimens ready for AWJC experiments ............................................ 41
Figure 3- 7: AWJC Equipment (a) AWJC machine (b) UHP pump ................................................. 42
Figure 3- 8: AWJC tray orientations: (a) Orientation 1 (b) Orientation 2 ..................................... 45
Figure 3- 9: Calibration of abrasive mass flow rate (ma) to the controller setting ....................... 46
Figure 3- 10: Two-dimensional contact probe profilometry ........................................................ 47
Figure 3- 11: Optical profilometry 3D surface images: (a) Wavy surface (b) Rough surface ....... 48
Figure 3- 12: Repeatability study for roughness measurement using contact and optical
profilometry methods ................................................................................................................... 49
Figure 3- 13: Lines drawn to measure striation angle (As) ........................................................... 50
Figure 4- 1: Test pieces after AWJC at 100 mm/min (a) kerf front (b) kerf exit (c) cut face ........ 52
Figure 4- 2: Variation of surface roughness with depth of cut through the cut material (mean
values ± standard deviation) ......................................................................................................... 53
Figure 4- 3: Increasing θ by 12˚ for thick plates: (a) 13 mm thick, θ=90˚ (b) 13 mm thick, θ=102˚
(c) 27 mm thick, θ=90˚ (d) 27 mm thick, θ=12˚ ............................................................................ 54
Figure 4- 4: SEM images of abrasive fragments: (a) IDR & SCR 35x magnification (b) Kerf exit 40x
magnification (c) Kerf exit 1400x magnification ........................................................................... 55
Figure 4- 5: SEM images of IDR showing pit formation and top edge rounding as a result of
abrasive impacts: (a) 250x magnification (b) 400x magnification ................................................ 56

viii
Figure 4- 6: SEM images of cut regions at 500x magnification: (a) Ploughing in the SCR (b) Wear
in the RCR due to abrasive pooling ............................................................................................... 56
Figure 4- 7: Increasing Dc of 30 mm cylinders by reducing Vt: (a) 200 mm/min (b) 140 mm/min
(c) 80 mm/min .............................................................................................................................. 57
Figure 4- 8: Variation of Dc with Vt for 30 mm cylinders .............................................................. 58
Figure 4- 9: Equivalent Dcfor flat and cylindrical castings (Vt=300 mm/min): (a) 13 mm thick flat
casting (b) 30 mm diameter cylinder ............................................................................................ 59
Figure 4- 10: Variation of surface roughness (Ra) with depth of cut for different values of
velocity (Vt) through 13 mm plates (ma=350 g/min) ................................................................... 59
Figure 4- 11: Effect of increasing ma: (a) 150 g/min (b) 350 g/min (c) 350 g/min (d) 480 g/min 60
Figure 4- 12: Ra of all DOE test pieces. The circled results were parts that exhibited deep
grooves with low Ra (due to abrasive pooling) ............................................................................. 61
Figure 4- 13: Variation of surface roughness (Ra) with traverse speed (Vt) for different
thicknesses of flat plates (2, 4, 6, 8 and 10 mm) (ma=350 g/min) ............................................... 62
Figure 4- 14: Variation of traverse speed (Vt) with gate thickness to achieve Ra<10 μm for gates
up to 30 mm thick ......................................................................................................................... 63
Figure 4- 15: Variation of surface roughness (Ra) with traverse speed (Vt) for flat plates 2 mm
thick on different days (ma=350 g/min) ....................................................................................... 64
Figure 4- 16: Effect of ceramic addition on the SCR depth: (a) test piece without ceramic
showing large SCR and small RCR (b) test piece with ceramic showing smaller SCR and large RCR
....................................................................................................................................................... 65
Figure 4- 17: Ceramic cutting: (a) Hollow tube (b) metal cylinder with ceramic insert ............... 65
Figure 4- 18: Computer model of nozzle access to femoral thick sections .................................. 66
Figure 4- 19: Limited nozzle access to femoral parts (a), (b) thin sections (c) thick sections ...... 66
Figure 4- 20: Femoral casting damage from incorrect nozzle setup: (a) thin section (b) area
below thin section (c) thick section .............................................................................................. 67
Figure 4- 21: Cut face of femoral thin sections after AWJC: (a) medial (b) lateral (c) proximal .. 67
Figure 4- 22: Cut face of femoral gates after AWJC at various Vt (mm/min): (a) 100 (b) 110 (c)
120 (d) 130 (e) 140 (f) 150 (g) two passes at 200 mm/min .......................................................... 68
ix
Figure 4- 23: AWJC tray orientation 1 (through thickest gate section): (a) Setup (b) Surface finish
(c) Part damage ............................................................................................................................. 69
Figure 4- 24: AWJC tray orientation 2: (a) Setup (b) Surface finish (c) Part damage ................... 70
Figure 4- 25: AWJC of trunk to prevent tray damage (a) Cut location (b) Cut face after two
passes at 100 mm/min (c) Cut face after one pass at 60 mm/min .............................................. 71
Figure 4- 26: Setup for tibial cutting in orientation 2 after separation from the tree ................. 71
Figure 4- 27: Tray gates after AWJC at Vt 40-80 mm/min ............................................................ 72
Figure 4- 28: Variation of surface roughness of trays with velocity ............................................. 73
Figure 4- 29: Kerf width increase at the start and end of tibial cut .............................................. 73
Figure 5- 1: Effect of increasing standoff distance (WARDJet, 2013a) ......................................... 75
Figure 5- 2: Variation in gate size across range of tray sizes ........................................................ 80

x
Nomenclature
Symbol Meaning Unit As Striation Angle, i.e. the angle between the tangent to the striation curve
and the impinging jet axis ˚
a Angle of incidence during laser cutting ˚ CQ Cut quality coefficient - 𝑑n Nozzle diameter mm Dc Depth of cut mm E Modulus of elasticity in tension MPa Hv Hardness (Vickers) ma Mass flow rate of abrasive particles g/min p Water pressure MPa Ra Surface roughness average µm Rt Surface roughness total µm s Standoff distance mm t Material thickness mm 𝑉𝑡 Traverse speed mm/min θ Nozzle angle ˚
AWJC = Abrasive WaterJet Cutting
BSE = Back-Scattered Electron
CNC = Computer Numeric Controlled
CR = Cruciate-Retaining
CS = Cruciate-Sacrificing
DOE = Design Of Experiment
EDM = Electrical Discharge Machining
FPI = Fluorescent Penetrant Inspection
HAZ = Heat-Affected Zone
IDR = Initial Damage Region
IP = Ingress Protection
PS = Posterior-Stabilizing
SCR = Smooth Cut Region
SEM = Scanning Electron Microscopy
SEI = Secondary Electron Image SSL = Solid State Lasers
RCR = Rough Cut Region
RO = Reverse Osmosis
TC = Through Cut
TKR = Total Knee Replacement

1
1. INTRODUCTION
This project forms part of an initiative funded by the Commission of the European Communities
between DePuy Synthes (Ireland), the University of Birmingham (UK) and the University of
Limerick (Ireland), to advance the state-of-the-art in investment casting processes. The research
aims to create and develop innovative improvement opportunities within post-cast processing,
thereby reducing manufacturing cost per unit. A decrease in manufacturing cost enables
implants to be offered to hospitals at a lower price, thus reducing one of the primary overheads
of surgery and allows greater patient access to orthopaedic operations. Lead time reductions
improve the company’s ability to deliver implants on-time to the customer, thus providing a
more effective service to patients.
The components of Total Knee Replacement surgery are shown in Figure 1. The most commonly
used alloys for orthopaedic implants are Cobalt-Chromium-Molybdenum (CoCrMo), Titanium
(Ti-6Al-4V) and stainless steel. The net shape metal components for total knee replacements
are manufactured either by investment casting or forging. The investment casting foundry at
DePuy Synthes in Cork produces up to 13,000 femoral and tibial CoCrMo castings each week.
Femoral components are designed to be either cruciate ligament retaining or cruciate
sacrificing. Tibial components can have a fixed bearing or rotating platform for the articulating
plastic component. The latter provides increased range of motion in the medial-lateral
direction. In addition, implants can be either cemented or cementless, based on the desired
method of bone fixation. Each product however is typically manufactured in a range of sizes. As
a result of these combinations, there are over 200 different product codes produced in the
DePuy Synthes foundry. The foundry process needs to be sufficiently flexible to accommodate
the mass production of the range of product designs and cast tree variations.

2
Figure 1: Total Knee Replacement (TKR) (Davies, 2013) (a) Pre-operative model of knee (b) Post-operative model of knee showing the three primary components of TKR
The research in this thesis aims to provide a solution to radically change the post-cast
manufacturing process for knee implants. This will be achieved by meeting the following
objectives through a state-of-the-art analysis and by conducting feasibility trials on any
proposed changes:
• Demonstrate a cost-effective alternative post-cast process with health, safety and
environmental benefits over current processes;
• Determine the new processing rate for current CoCrMo cast parts;
• Evaluate the surface finish after processing, with due consideration for downstream
processes;
• The proposed changes target:
o 50% manufacturing cost reduction;
o 50% lead time reduction.
Chapter 2 presents the background to the thesis. The investment casting process is described,
emphasising the effect of upstream and downstream processes on the post-cast requirements.
The current post-cast process and challenges are outlined, while potential improvements to the
present system of cut-off and grinding are discussed, specifically concerning automation
obstacles. A more accurate cutting process is proposed to eliminate subsequent grinding
Tibial Tray
Plastic
spacer
Femoral
(Cruciate
retaining)
(a) (b)

3
operations together with surface finish requirements for the new cutting system. Four
alternative cutting processes are discussed with respect to their potential feasibility for this
application; Abrasive WaterJet Cutting (AWJC), laser cutting, wire-EDM (Electrical Discharge
Machining) and plasma cutting. The AWJC process was chosen for further investigation.
Chapter 3 outlines the materials and methods used in the evaluation of AWJC. As the cutting
speed is dependent on material properties and thickness, investment castings of varying sizes
were required to fully understand the process characteristics. In order to investigate the full
range of material thicknesses for femoral and tibial casting gates, castings were produced in the
University of Birmingham foundry to complement castings sourced from DePuy Synthes. A
number of design changes and process controls were introduced after the original casting
moulds cracked during pour in the University of Birmingham foundry.
Chapter 4 outlines the results of AWJC experiments conducted on CoCrMo castings from 2 to
30 mm thick. The cut surface characteristics are presented, which demonstrate that the
material removal during AWJC occurs via a characteristic wear mechanism. The process
parameters were varied and the resulting cut depth and surface finish were measured. An
empirical formula relating the cut depth to the cutting speed for the thickest casting was used
to estimate the settings for thinner castings. The surface finish was measured using two-
dimensional contact and three-dimensional optical profilometry methods. The lowest
roughness was 2 μm, which was measured at the top of a 13 mm thick cut at a traverse speed
of 35 mm/min. The 2 mm thick castings were cut through at speeds of up to 800 mm/min.
Chapter 5 presents the implementation of AWJC for femoral and tibial castings. The optimum
AWJC orientations were investigated for each product type. Cutting trials were conducted in
the optimum orientations at different cutting speeds in order to observe the different surface
finishes achieved. The results obtained support the recommendation for AWJC to be
implemented on femoral castings with suitable settings proposed. In contrast, the large gate
size of tibial castings precluded the use of AWJC. A number of design modifications however are
proposed to improve the feasibility of AWJC on tibial castings.

4
Chapter 6 discusses the risks and challenges that remain in order to implement AWJC as an
alternative for the current cut-off and grinding system for femoral castings. The running costs
are determined according to the proposed process settings from Chapter 5. The three-
dimensional vision system requirements are also outlined, while the importance of fixture
stability, water quality and regular equipment maintenance are emphasised. Finally, the thesis
concludes with recommendations for future work.

5
2. BACKGROUND
2.1 The Investment Casting Process
2.1.1 Introduction
Figure 2-1 shows the stages of the investment casting process. Multiple wax patterns are
injected and assembled to a runner system to form a tree. A ceramic shell is built up around the
wax tree. The wax is removed to form a hollow ceramic mould. The molten alloy is poured into
the mould to form the cast tree. Post-cast operations include ceramic removal, cut-off, and
finishing. The parts are then inspected for defects and repaired if possible.
Figure 2- 1: Investment casting process (Non-ferrousFounders'Society, 2014)
The focus of this research is post-cast processing. Process changes in wax, shell and casting
configuration can have a significant impact on post-cast finishing requirements. An
understanding of these preceding processes is essential in order to recommend process
improvements that can accommodate future process changes. Similarly, the post-cast process
can have an effect on subsequent machining operations. It is therefore important to
understand the requirements of the existing process in relation to the total process flow.

6
2.1.2 Wax Injection & Assembly
A wax pattern solid model is created with an allowance for wax shrinkage. Gates are additional
sections included on the wax patterns, which allow the parts to be assembled to the wax tree
and are the route through which the metal flows into the shell. The size and shape of the gate
varies according to the product type and size. The gate geometry affects the casting quality and
is determined during introduction of a new mould.
Aluminium wax tooling (mould) is Computer Numeric Controlled (CNC) machined for each new
product based on the wax pattern model. Virgin defect-free wax is melted and continuously
mixed at constant temperature. The wax is injected into the mould to form a pattern. The wax
acceleration, filling pressure, hold pressure and hold time are key factors that control the
mould filling and solidification. Wax shrinkage during solidification and cooling is an important
factor in the final cast dimensions. The most common defects during wax injection are bubbles
and flow lines, which are caused during mould filling. Defects present at the wax pattern stage
carry through to the metal casting. It is more cost-effective to ensure that only defect-free wax
patterns go through the foundry process than to repair flaws in the metal components.
The patterns are visually inspected for defects again at assembly. Defects such as bubbles can
sometimes take up to an hour to rise to the surface of the wax pattern. Multiple parts are
assembled onto a central trunk to form a tree. Heat and wax glue are used to attach the
patterns to the tree, which is a manual process requiring considerable skill and experience. Care
must be taken when assembling the parts to ensure the wax does not drip onto the surface of
any of the patterns. Additional sections are occasionally added to the patterns to improve de-
waxing, promote dimensional stability or dictate the flow of molten metal during filling. Gates,
and any other additions, must be removed in the post-cast processing procedures. In some
instances ceramic cores are used for dimensional capability or to increase production efficiency.
Internal ceramic cores are avoided where possible as they require chemical leaching, a time-
consuming and non-environmentally-friendly process.

7
2.1.3 Shell Build
A ceramic shell is formed around the tree by repeatedly dipping it in slurry and stucco and
allowing it to dry until the desired strength and thickness of shell is achieved. The shell build is
the most time-consuming part of the investment casting process as it takes a few days. The wax
tree design should be stable enough that the parts do not fall off the tree during dipping. This is
a risk if the gates are designed too thin for the size of the part. The initial shell coats have an
influence on the surface finish and the ease of shell removal. The roughness of the wax surface
has to be sufficiently high for the slurry to adhere, while a very fine slurry and stucco will result
in a smoother surface leading to easier shell removal. Thick shells take longer to build and have
a higher consumable cost with greater susceptibility to “necking” (where shell layers meet
across a gap) and are more difficult to remove during knockout. However, thick shells can
reduce the level of scrap defects and promote dimensional stability and are generally used for
tibial trays to provide higher strength around the cone, which may have implications for
alternative post-cast processing options.
2.1.4 Casting
After the shell is formed, the trees are turned upside down for de-waxing, where the wax is
melted in a high pressure and temperature autoclave. The tree design must include paths to
allow for wax to flow by gravity out of the shell. Wax that remains in the shell after de-wax is
burned off during firing. However, occasionally some of the wax is trapped in the mould and
any remaining residue could result in inclusions in the casting. The shell is heated in the furnace
for a couple of hours to sinter the ceramic and prepare it for pouring. The CoCrMo alloy is
melted in an induction furnace. Once the alloy has reached the desired temperature, the fired
shell is removed from the oven and the molten alloy is poured. The pouring rate must be quick
enough to ensure all the parts of the tree is filled before the alloy solidifies but sufficiently slow
to prevent excessive alloy overspill. A partially filled tree is extremely difficult to cut-off as
fixturing is problematic and far less secure, particularly for the abrasive grinding operation.
After pouring the cast tree quickly solidifies and is allowed to cool for a few hours before any
handling to allow the shell to become brittle, which easily falls off the tree when knocked.

8
Material properties affect the mechanism and rate of wear by the abrasive particles during
AWJC, e.g. aluminium can be cut at more than twice the traverse speed of mild steel (Lemma et
al., 2005) with dense materials more difficult to machine (Hlavac et al., 2009). The mechanical
properties of CoCrMo, Ti-6Al-4V and AISI 309 stainless steel are given in Table 2-1. Compared
with stainless steel, CoCrMo is slightly denser, has higher strength and lower ductility.
Therefore it is expected that CoCrMo will have to be machined at lower cutting speeds. The
chemical composition of CoCrMo (ASTM F-75), which is used for the manufacture of most
orthopaedic implants, is given in Table 2-2.
Table 2- 1: Mechanical properties of CoCrMo, stainless steel and Ti-6Al-4V
Mechanical Property CoCrMo (ASTM F-75) (ASTM, 1998)
Stainless Steel (AISI 309) (eFunda, 2014a)
Ti-6Al-4V (eFunda, 2014b)
Young’s modulus (GPa) 220-230 (Pilliar, 2009)
200 113.8
Tensile Strength (MPa) 655 MPa 515 993 Yield strength (MPa) 450 MPa 205 924 Elongation at break (%) >8% (typically 11%
(Cawley et al., 2003)) 40 14
Reduction of area (%) >8% 50 30 Density (x1000 kg/m3) 8.4
(in standard use at DePuy Synthes)
8 4.43

9
Table 2- 2: Chemical composition of CoCrMo (ASTM F-75) (ASTM, 1998)
Element CoCrMo (ASTM F-75)
Cobalt, Co Balance Chromium, Cr 27-30 % Molybdenum, Mo 5-7 % Iron, Fe <0.75 % Nickel, Ni <0.5 % Carbon, C <0.35 % Silicone, Si <1 % Manganese, Mn <1 % Tungsten, W <0.2 % Phosphorus, P <0.02 % Sulphur, S <0.01 % Nitrogen, N <0.25 % Aluminium, Al <0.1 % Titanium, Ti <0.1 % Boron, B <0.01 %
2.1.5 Post-Cast Finishing
The top of the cast tree is clamped in the knockout machine and vibrations, for up to one
minute, remove the majority of the shell. Shell removal is more difficult for products that have
holes or areas with blind access. Similarly, the removal of thicker shells is more difficult because
there is less room for the ceramic to fall out due to geometric constraints in the tree. Knockout
is less effective for the tibial tray tree configuration compared to that of the femorals.
The cast parts are cut off from the tree with an abrasive wheel (Figure 2-2 a). Abrasive cutting is
quick and efficient with a relatively low machine footprint and is suitable for rough cutting of
very thick metals and ceramics. After clamping the tree in place, a laser alignment aid is used to
visually line up the wheel and determine the desired cutting path. Correct alignment of the saw
using the laser guide requires experience. Trays often have a larger quantity of shell remaining
on the tree, making laser alignment more difficult. The wheel is guided to cut the parts from the
tree one row at a time. The skill of the operator in cutting off the parts influences the amount
of material that must be removed post grinding.

10
Following cut-off, the parts are briefly inspected for obvious defects with any scrap parts and
excess tree material disposed for recycling. Any remaining shell material must be removed from
the parts. The batch of parts is placed in the rotating rubber mesh barrel of a machine where
stainless steel shot media bombards the work area by means of an impeller fan whilst the parts
are continuously tumbled. The process is able to remove ceramic from non line of sight areas,
such as femoral augmentation holes and the hole on tibial trays. The round stainless steel
media removes the ceramic and any minor burrs, but does not excessively wear the part (or the
machine components), as would otherwise occur when employing alumina abrasive. The shot
blasting process leaves a shiny surface finish with a surface roughness (Ra) of approximately
2 µm. The machine cycle lasts 18 minutes and up to four batches can be processed at a time.
The batches are subsequently separated by the cast marking / label, which specifies the
product type and code.
Figure 2- 2: Current gate-removal process: (a) Cut-off wheel (b) Robotic grinding
Grinding machines are then used to remove remnants of the gate (Figure 2-2 b). Alumina,
silicon carbide and CBN (Cubic Boron Nitride) are the typical grinding belt abrasives utilised. If
the amount of material to be removed is large, then the grinding robot offset is adjusted. The
program is then re-run on the normal offset. Grinding operations in later processes can remove
up to 3 mm on thick sections of casting gates. Robotic de-gating takes approximately one
minute per casting while femoral parts generally require further manual grinding to remove the
remainder of the thin sections (approximately 30 seconds per casting).
(a) (b)

11
2.1.6 Inspection
The parts are inspected for defects and repaired using small grinding tools if necessary. The
most common defect is ceramic inclusions. Sometimes it is not possible to repair defects and
the part is scrapped. Scrap parts reduce efficiency and cost the business in terms of material
and consumables. Investment casting foundries typically operate at metal scrap rates in the
region of 10-20%. After inspection the parts are tumble-blasted with 60-grit aluminium oxide,
leaving a duller finish. This is the surface finish for the “bonecut” side of the implant, i.e. the
regions of the implant that would be in contact with the bone. A blasted finish is needed for
Fluorescent Penetrant Inspection (FPI), which is an operation performed to check for surface
microcracks. If necessary the parts are repaired and blasted again before another FPI. Each part
is then laser-marked with a unique number prior to X-ray images taken in multiple orientations.
The images are examined for the presence of any sub-surface porosity or shrinkage. Parts that
have porosity or shrinkage are scrapped.
2.1.7 Further Processing
Some castings are sent for Hot Isostatic Pressing (HIP) and homogenisation to improve the
microstructure and mechanical properties. Castings are stored onsite until ready for use on the
manufacturing floor. Finishing operations after the Foundry Value Stream vary for each product
but generally comprise some or all of the following: grinding/milling, blasting, polishing,
inspection, cleaning and packaging. Bonecut surfaces are not machined after the foundry but
instead blasted after machining to ensure surface uniformity. The same blast media is used as
in the foundry. Parts are polished in a number of different ways. Some femorals are individually
polished robotically with polishing wheels while other products are batch-polished in drag-
bowls or flat-surface polished with rotary tables. Parts are visually and dimensionally checked
after each processing step. The products are cleaned and packaged before being sent for
sterilisation.

12
2.2 Opportunities within Post-Cast Finishing
2.2.1 Introduction
There are opportunities for significant lead time and cost reduction within the current post-cast
process. The most lucrative opportunity identified was to eliminate grinding by performing a
more accurate cut-off. As the cast tree configuration and gate geometry are different for
femoral and tibial parts, it is possible that the ideal process may be different for each
component. The advantages and limitations of other options considered for cut-off and
grinding are also discussed in the following sections.
2.2.2 Cut-off and Grinding Alternatives for Tibial Castings
Reduction of machine footprint allows additional machine purchases that increase capacity.
Footprint and cycle time could be reduced by changing the tray robotic grinding system for a
flat surface grinding machine, such as that shown in Figure 2-3. The parts would be loaded into
a fixture mounted on the work table with the grinding wheel moving to machine the parts.
Currently each tray is picked up by the robot and brought to the grinding belt behind the robot.
The use of a CNC grinding machining centre would therefore reduce the movement time.
Decreasing the gate sizes would also reduce the amount of grinding necessary to reach the
required specification, leading to increased grinding belt / wheel life and lower consumables
cost. However, reducing gate size incurs the risk of dimensional changes and casting defects
such as non-fill.
Figure 2- 3: Flat grinding machine (Maegerle, 2014)

13
An automated system for abrasive wheel cut-off and grinding trays can reduce lead time and
direct labour requirements, although numerous challenges exist including shell removal post-
knockout, casting variation, part tolerances, and capital cost. Tibial trays only require cutting in
one plane (2D) and the finish is a flat surface. It is unlikely that abrasive wheel cut-off is capable
of achieving the current post-grinding tolerance. This is primarily because the wheel cuts into
more than one part at a time. Setting up the wheel alignment for one part would damage
adjacent parts during cutting, with any misalignment of the wheel relative to the tree, or tree
instability in the fixture resulting in scrap parts. Each component can be cut individually if the
cutting path was changed or a smaller wheel was used however the alignment of the wheel and
part is likely to remain an issue. In addition, a smaller wheel would have to be replaced more
frequently due to the quicker reduction in diameter.
Parts could be robotically gripped on the opposite face before cutting and transferred to
grinding once cut. Grinding would be extremely dusty and dirty due to the ceramic remains
after knockout. This would likely cause machine maintenance issues. Shell removal by abrasive
bombardment does not remove all of the ceramic from the inner holes of trays. These partially
hidden areas would also be difficult to reach with waterblasting, necessitating a further process
after cut-off such as the existing wheelabrator operation. In this case, a vision-assisted robotic
picking system would be required to hold the parts before grinding. A robot arm capable of
gripping multiple parts allows for the possibility of cutting and grinding multiple parts at a time.
A rotary table grinder may be suitable for this purpose. Cycle time and belt change frequency
could be reduced, thereby increasing capacity. Gripping multiple parts may be beneficial before
cut-off but it would be very difficult, costly and time-consuming to pick multiple parts after cut-
off.
2.2.3 Cut-off and Grinding Alternatives for Femoral Castings
As with tibial castings, an automated system for abrasive wheel cut-off and grinding would
greatly reduce lead time and direct labour requirements, however femorals have additional
thin sections that make the application more complex than trays. Keys challenges include
incorporation of a vision system, part geometry, casting variation, fixturing, ceramic removal

14
post-knockout, tool access to the cutting path, surface quality, machine capacity, footprint and
capital cost. A vision-assisted picking system would be required if femoral parts were cut-off
before the thin sections were removed. Femoral components would require shell removal prior
to cut-off in order to grip the parts in the appropriate location, increasing cost and
development time. A new set of fixtures would also need to be designed. A fully-automated
system has previously been investigated by Depuy comprising waterjet cleaning, cut-off sawing,
vision assisted picking, and two grinding robots. The integration supplier estimated the project
cost at €5.5M. In addition to the high cost, a two robot system had a prohibitively large
footprint. Moreover, based on the quoted grinding capacity, two robots were insufficient for
projected volume increases.
2.2.4 Alternative Cutting Process & Elimination of Grinding
There is an opportunity to eliminate grinding if the parts could be cut-off from the cast tree in
one accurate cutting process as highlighted in the process flow diagram in Figure 2-4. Femoral
products have thin additions as well as the relatively thick primary casting gates, which are
currently removed at the grinding stage. The main benefits of eliminating grinding are lead time
reduction, labour reduction, ergonomic improvement and capacity increase. The gate surfaces
of femorals are finished by manual grinding, which may predispose to the development of
Carpal Tunnel Syndrome (CTS). The onset of CTS has been shown to significantly correlate with
exposure to vibration from handheld tools and to repetitive wrist movements (Wieslander et
al., 1989). Symptoms of CTS include numbness and tingling in the thumbs and fingers. It is
caused by nerve compression in the wrist and treatment requires minor surgery to cut the
transverse carpal ligament. In order to realise the ergonomic benefits of eliminating grinding,
the thin sections need to be removed at the cut-off stage and the process must be automated.

15
Figure 2- 4: Alternative post-cast process flow opportunity
An alternative cutting process was deemed the most appropriate process improvement with
potential options discussed in Section 2.4.
2.3 Cutting Operation Requirements
The alternative process is required to cut CoCrMo of varying geometry and thickness. As runner
system removal occurs before complete refractory removal, a robust cutting process should be
able to cope with some remaining ceramic material. Alternatively a shell removal system could
be integrated with the cutting system.
The thickness to be cut ranges from 2 to 30 mm depending on the product type and size.
Femoral castings have both thin (2-4 mm) and thick (13-17 mm) sections that need to be
removed. Tibial tray sections vary in geometry and are approximately 20 mm thick. The
tolerance bands for the three main types of cuts are given in Table 2-3.
Table 2- 3: Total tolerance band after surface finishing
Product Total tolerance band (mm)
Femoral thick sections 1.25 - 2.7
Tibial trays (thick sections) 1.0
Femoral thin sections 0.8

16
The thin sections can be ground until flush with the part. The height of the thin sections should
be flush or within 0.8 mm from the surface of the part after cutting, which is assessed against a
visual standard only. The current surface finishes of the thin and thick femoral sections are
shown in Figure 2-5. The surface finish after grinding is relatively uniform with a surface
roughness (Ra) of approximately 5 μm. As the parts are subsequently ground on the
manufacturing floor, there is scope to modify the standards if appropriate. Attribute agreement
analysis could be used to evaluate appraisers' agreement of the new standard. The method can
be used when quality requirements are difficult to define and assess. Multiple appraisers are
used, each of which scores the parts. This can be done either on a scale (e.g. 1-10) or parts can
be classified as “good” or “bad”.
Figure 2- 5: Femoral surface finish post grinding & blasting: (a) thin sections (b) thick sections
To minimise fixturing and vision system complexity, the thin sections should be removed from
the parts whilst the tree is fixtured. The parts can then be separated from the tree. However,
removal of the thin sections in this way relies on an accurate machine vision system. If the parts
are removed from the tree before thin section cutting, a shell removal step would be necessary,
as well as an additional robotic vision system to pick up the parts for grinding.
The vision system should be capable of reliable operation in a production environment, with
the machine subject to dust / debris due to the shell remains and therefore should be
appropriately enclosed and suitable extraction systems installed.
Environmental, health and safety factors are of paramount importance. Business requirements
necessitate appropriate running and acquisition costs with total footprint an important
consideration as space is limited within the foundry post-cast area.
(a) (b)

17
2.4 Alternative Cutting Processes
2.4.1 Abrasive WaterJet Cutting
Current Applications
Abrasive WaterJet Cutting (AWJC) can be used to cut virtually any material, with the same
tooling and system, including steel as thick as 200 mm and even materials as hard as
polycrystalline diamond (PCD) (Axinte et al., 2009). Plain waterjets are used for applications
such as cleaning/roughening metals as well as for food cutting applications. The use of AWJC
has recently been investigated as a novel alternative to surgical bone-cutting tools (using
magnesium as the abrasive) (Zaremba et al., 2013). The most common application for AWJC is
in job-shop applications for cutting sheet metals up 10-20 mm thick, with most operations
involving only 2D cutting of flat sheets. However, six-axis AWJC robots are available if higher
application flexibility is required (Flow, 2014).
Process
Water at pressure of up to 620 MPa (90,000 psi) is pumped through a tiny orifice of 0.3 mm to
generate a narrow jet with extremely high velocity of 3500 km per hour (WARDJet, 2014). The
hard abrasive media entrained in the jet stream uses this kinetic energy to perform cutting by
wear. The typical structure of a high pressure waterjet is shown in Figure 2-6. Cutting occurs in
the core zone, where the power of the jet is most concentrated. No tool wear occurs as the
process is non-contact. As the jet still has a degree of power beneath the cutting region,
anything immediately below the cutting region will wear away.
Figure 2- 6: Structure of a high-speed waterjet (Momber et al., 2002)

18
Equipment
A typical AWJC system comprises a pump, high- and low-pressure water delivery lines, cutting
head gantry, cutting head, nozzle system, abrasive hopper and delivery system, water catcher
tank, machine controller, and water filtration unit. Ultra-high pressure water is generated
either using an intensifier pump or a motor-controlled hydraulic pump. Intensifier pumps
account for the vast majority of pumps for abrasive waterjet cutting applications. Intensifier
pumps typically reach much higher pressures but are less efficient than the traditional hydraulic
pump hence the higher pressure required to achieve the same cutting output. The most
important factor for performance of either pump type is the water quality. Manufacturers
recommend certain water treatments based on the incoming water supply. Maintenance of the
pump and high-pressure delivery lines is critical. To ensure optimum performance and prevent
further machine wear, even small leaks should be immediately repaired.
Cut Surface Characteristics
The cut characteristics can be described in terms of cut depth (Dc), surface roughness (Ra), kerf
width (mm) and kerf taper (˚). The kerf is the region where the material has been removed
during cutting. The kerf width and taper can be measured when the cut has not penetrated
through the entire thickness of the workpiece. At high traverse speeds, the bottom of the kerf
is much narrower than the top. Equipment manufacturers offer software to adjust the cutting
program to minimise / eliminate the kerf taper. Material removal in ductile materials such as
metals occurs due to micro-cutting by the abrasive particles at the top of the cut, and ploughing
and rubbing deformation at the bottom of the cut. The mechanism in brittle materials, such as
ceramics, primarily involves fracture. A major advantage is that AWJC is a cold process and thus
prevents the formation of a heat-affected zone (HAZ). For thick metals, AWJC tends to produce
a better quality surface finish compared to laser cutting at the same speed, e.g. 10 mm thick
titanium cut by Zelenak et al. (2012) achieved Ra of 5 μm and 30 μm for AWJC and laser cutting,
respectively. The typical sloped lines (“striations”) of an AWJC surface are shown in Figure 2-7.
When the traverse speed (Vt) is high for the thickness concerned, the jet has less time to
penetrate the material. The result is a lag effect, which is more pronounced towards the cut

19
exit. The jet lag can be quantified by the angle of the striations (As). In general, AWJC results in
three distinct regions along the cut face, the initial damage region (IDR), smooth cutting region
(SCR), and a rough cutting region (RCR) from the jet entry to the exit of the workpiece (Ay et al.,
2010). The depth of the IDR at the top of the cut is a function of the Young’s modulus of the
workpiece material (Hloch and Valicek, 2012), e.g. the IDR of aluminium is deeper than that of
stainless steel. The region between the SCR and RCR is often described as the transition zone.
These regions are normally characterised according to their surface roughness (measured in the
direction of jet traverse), which tends to increase from the top to the bottom of the cut face.
The bottom of the cut face appears wavy and non-uniform when the material thickness is
excessive for the operating conditions used, resulting in locally smooth surfaces with low Ra
values.
Figure 2- 7: Surface characteristics following AWJC of metallic workpiece (a) Vt 100 mm/min (b) Vt 200 mm/min
Process Parameters
Traverse speed and water pressure are the most significant process parameters in AWJC
(Hascalik et al., 2007). Cutting at higher pressure increases cutting speed (see Figure 2-8) and
reduces abrasive consumption. Hoogstrate et al. (2006) found that increasing the water
pressure from 400 MPa to 600 MPa increased the maximum cutting speed of 10 mm thick
(b)
(a)

20
stainless steel by 48%. While abrasives can be recycled when cutting at 60,000 psi (414 MPa),
this is not possible when operating at 90,000 psi (620 MPa) as the abrasive breaks into much
smaller fragments. Increasing pressure also elevates wear of the pump components (Kovacevic,
1991), thereby increasing maintenance frequency and consumables cost.
Figure 2- 8: Cutting speed increases with higher pressure (Flow, 2010)
Reducing traverse speed increases Dc and generally leads to a better surface finish. The
influence of traverse speed on surface roughness is negligible at the top of the cut but becomes
more pronounced with increasing cut depth (Kovacevic, 1991). As the traverse speed increases
the exposure time for the abrasive to strike the target material is reduced, leading to a
narrower kerf.
Orifice & Nozzle Geometry
The orifice and nozzle are critical to forming a coherent waterjet (Figure 2-9). After the orifice,
the high pressure water stream passes through a mixing chamber creating a partial vacuum by
the Venturi effect and the abrasive particles are entrained and accelerated in the high velocity

21
water stream within the nozzle (Nanduri et al., 2002). The nozzle (also called a focusing tube) is
typically made from tungsten carbide, while orifices are either made of ruby, sapphire or
diamond. The edge condition (sharp, rounded or chamfered) and the orifice geometry
(cylindrical, cone-up or cone-down) are key parameters to consider (Hoogstrate et al., 2006).
Conditions enhancing cutting performance, such as increasing abrasive mass flow rate, also
tend to increase nozzle wear. Ruby and sapphire orifices cost approximately $13 and last 40-80
hours of cutting. Diamond orifices cost approximately $500 but last for 500 hours. As such,
diamond orifices are more suitable for high-volume well-established processes where machine
downtime must be kept to a minimum.
Figure 2- 9: Waterjet nozzle configuration (WARDJet, 2013b)
Nozzle wear is higher with shorter nozzle lengths, although this becomes negligible after
approximately 70 mm. The nozzle diameter should be sufficiently large to promote laminar flow
and the length of the tube should be long enough to let the flow be fully developed (Hoogstrate
et al., 2006). Choosing an orifice diameter depends primarily on the cut accuracy required. The
kerf widths are approximately 10% larger than the orifice diameter. Micro abrasive waterjet
machines for machining part features as small as 0.3 mm have recently been developed (Liu,
2014). Larger orifices such as 0.35 mm are used where cutting speed is of paramount
importance. A larger orifice can generally achieve higher material removal rates because it can
accommodate more abrasive. However a large quantity of abrasive remains unused in the
Nozzle cover

22
centre of the jet so it may be economical to recycle the abrasive material. The ratio of nozzle to
orifice diameter is widely recognised as being significant in terms of efficiency and wear. A
nozzle/orifice ratio of between 3 and 4 is desirable. Excessive wear generally occurs at lower
values. For orifice sizes 0.25 mm to 0.4 mm, increasing the nozzle diameter beyond 1.2 mm
reduces the cut depth (Jegaraj and Babu, 2005).
Abrasive
The abrasive parameters that influence cutting include type of abrasive material, particle size,
shape, particle size distribution, abrasive flow rate, recycling capacity and the hardness of
abrasives (Babu and Chetty, 2006). Garnet is used in the vast majority of AWJC applications
(>90%), with its chemical composition detailed in Table 2-4. Most investigations use 80-mesh
garnet grit as the sole or reference abrasive, corresponding to a mesh opening of 177 μm.
Kovacevic (1991) tested mesh sizes 80, 115 and 170 and found that the width of abrasive wear
tracks was in direct correlation with the size of the abrasive particles. Larger abrasive particle
size can be used with larger orifices. However, abrasive prices increase almost exponentially
above 325 μm due to the relative scarcity of coarser material and/or associated
production/marketing costs (Gent et al., 2012).
Table 2- 4: Composition of garnet abrasive (Pon Selvan et al., 2012)
Material Percentage
by mass
FeO 36%
SiO2 33%
Al2O3 20%
MgO 4%
TiO2 3%
CaO 2%
MnO2 2%

23
Hard materials offer more resistance to abrasive wear, which is the material removal
mechanism in AWJC. The Mohs scale is a relative scale used to rank abrasive hardness. A
mineral can only scratch another mineral if the latter has a lower Mohs value, e.g. diamond,
corundum (ruby, sapphire), and talc have Mohs values of 10, 9 and 1, respectively. The abrasive
must be significantly harder than the material to be cut. Garnet abrasive has a hardness of 7.5-8
Mohs (or 1100-1300 Hv), which is significantly greater than CoCrMo (310 Hv). There is a linear
relation between the Hv of an abrasive and the rate of erosion (Gent et al., 2012). Trials
involving the cutting of polycrystalline diamond (PCD) (6000 Hv) with diamond abrasive (10000
Hv) (Axinte et al., 2009) showed that nozzle wear was 52 times greater compared to using
silicon carbide (the next hardest abrasive), but that cutting speed was 200 times faster with the
former. Alumina, the abrasive currently used for surface blasting of castings, has greater cutting
ability than garnet due to its higher hardness of 9 Mohs (2600 Hv) but it is also more expensive.
Orifice and nozzle wear would also be excessive because the abrasive is almost as hard as the
orifice materials ruby/sapphire. Cosansu and Cogun (2012) investigated colemanite as a
cheaper abrasive for AWJC of Ti-6Al-4V and Al-7075. As a result of its lower hardness (4.5
Mohs), 100% more colemanite had to be used to achieve the same surface quality obtained
with garnet.
Recycling of abrasive garnet seems to be the best abrasive cost reduction strategy. For most
applications, garnet abrasive can be recycled up to 4 or 5 times without affecting cut quality.
When cutting at high volumes and with multiple cutting heads, the cost of the recycling
machine can be justified in virgin abrasive savings. Abrasive recycling is not possible when
cutting at extremely high pressures (> 620 MPa) because the abrasive is pulverised in the
mixing chamber and on collision with the substrate. The particles are then too small for
successful recycling. When the abrasive impacts the material, the particles shatter resulting in
sharp edges that perform cutting. Sharper abrasive edges are more effective at material
removal because the particle energy is imparted over a smaller area. A shortcoming however is
that AWJC typically results in embedment of the tiny abrasive fragments on the cut surface.
Boud et al. (2010) found that the original abrasive morphology had no significant impact on grit
embedment because it was dictated by the fractured abrasive geometry.

24
Running Costs
The cost of running a waterjet system is $30-80 per hour (Zlotnicki, 2013). A 100 hp
(horsepower) pump operating at 60,000 psi (413.7 MPa) costs $55 per hour, of which 76% are
due to the costs of abrasive material (Zlotnicki, 2013). In a study by Zheng et al. (1996), the
ratio of total cutting cost per hour between laser and waterjet varied from 0.76 to 0.86. The
laser was less expensive to operate but the initial capital cost was approximately 2.5 times the
cost of the AWJC system. In a more recent study, Perzel (2011) compared the cost of
consumption for laser and abrasive waterjet cutting for carbon steel of 10 mm thickness. The
ratio of total cutting cost per hour between laser and waterjet machining was 1.47. The laser
had much higher costs for depreciation, energy usage and maintenance. Although lasers were
more economical (and faster) at lower thicknesses (<6 mm), at higher thicknesses AWJC was
normally faster and cheaper. Material thickness is therefore a critical parameter to consider
when choosing a new cutting process.
Fixtures
The abrasive waterjet cuts through virtually anything in its path and, therefore, a water catcher
tank (approximately 80 cm deep) is required to absorb the jet energy. AWJC is not suitable for
all part geometries because the jet can damage the region below the cutting zone. Custom
fixtures are not usually required for AWJC because the material removal mechanism through
abrasive wear occurs on a very small area, whereas traditional machining methods such as
grinding induce wear over a much larger area. Flat sheet cutting can be performed without
fixturing the workpiece, instead it is placed on top of grates. Using grates should reduce setup
time and may improve the level of long flat sheets when compared to fixturing to slats. Fixtures
or grates below the cutting region need to be replaced due to wear from the jet, which can lead
to sharp serrated edges on the grates/fixtures, potentially causing a health and safety risk.
Grate replacement is normally 6-12 months, depending on the number of cutting hours and
level of acceptable wear. The cutting zones may be moved around to reduce frequency of grate
replacement.

25
Drying System
As the parts are wet after AWJC, there is a risk of machine damage in subsequent processing,
i.e. stainless steel shot blasting. Water in a compressed-air abrasive blasting system would
quickly cause abrasive blockages, resulting in significant downtime. Therefore, a system to dry
the parts should be incorporated into the backend of the AWJC machine to mitigate this risk. At
the very minimum all parts should be presented drip-dry to the shell-removal process.
Drying can be accomplished using different types of fans or heaters. One potential solution that
has been considered for this work is an Air Knife System. This is a low-pressure, high-volume air
production tool powered by a centrifugal blower unit. This system has been designed
specifically to blow-off all surface liquids and moisture that may be present on a conveyed
product (AirControlIndustriesLtd, 2013a). The castings would drop into an underwater mesh
basket when cut-off. Drying is more effective if the parts can be presented on a conveyor rather
than in a basket so the parts should be transferred to a short overwater conveyor. Alternatively
the batch of parts could be dried in a separate spiral drum after AWJC. However, this would
either require additional direct labour or a machine to load the batches. A basic air knife blower
costs approximately £3,500. For this basic system the airknives and blower would need to be
kept apart from the AWJC system and enclosed to prevent water damage to the blower. The
system should incorporate reciprocating nozzles in order to improve drying, particularly
important for parts with any blind spots. This would cost approximately £10,000 (plus the cost
of a small conveyor). A typical system for bottle drying with airknives is shown in Figure 2-10.
Figure 2- 10: Typical airknife drying system (AirControlIndustriesLtd, 2013c)
Air knives
Motor
Airknife
stand Beverage
conveyor line

26
Although there are two cutting heads, one blower should be sufficient for the system as it could
dry more quickly than the time for two batches to be cut-off. There is a risk that the noise from
the blower may be excessive. DePuy Synthes requires new equipment to operate at <78 dB(A),
whilst blower-driven airknives can operate at up to 85 dB(A) (AirControlIndustriesLtd, 2013b).
Although the capital investment would be higher, the energy used by an airknife would be
lower than that of heaters or other compressed air systems, resulting in much lower running
costs, see Table 2-5 for a comparison between various drying systems.
Table 2- 5: Comparison of drying systems (AirControlIndustriesLtd, 2013b)
Drying system
Pressure
(MPa)
Energy
required
(kW)
Noise
Level
dB(A)
Purchase
Price
(GBP)
Annual
Energy
Cost
(GBP)
Annual
Maintenance
costs
(GBP)
1st
Year
Costs
(GBP)
2nd
Year
Cost
(GBP)
Drilled pipe 0.414 35 91 50 2000 500 2550 2500
Flat Air Nozzle 0.414 51 102 100 3000 1000 4100 4000
Blower-driven Air
Knife
0.021 7.5 85 3000 300 150 3450 450
Conclusion
Abrasive waterjet cutting can machine through inhomogeneous materials such as investment
castings. The material removal rate for AWJC is faster than the current system (cut-off wheel
and grinding) and produces an equivalent surface finish. The feasibility of AWJC however is
primarily influenced by the cut material thickness. If the workpiece is too thick, the use of
abrasive wheel or plasma cutting in combination with grinding would be more economical to
achieve the required surface finish. In general, material thickness in the range of 6-30 mm is
suitable for the application of AWJC and therefore the cast tree configuration should be
evaluated. In addition to nozzle access, the consequences of jet deflection below the cut must
be considered. Although the jet loses power as it cuts through the part, there is generally
sufficient power remaining to damage regions below the cut area. Some of the tree
configurations have parts stacked below one another, which would require shielding or
27
additional cuts should AWJC be utilised. Automation of the AWJC process would eliminate the
manual grinding operation, which improves ergonomics. Multiple cutting heads can be used on
one machine, allowing reduced overall processing time for many applications. Therefore, AWJC
warrants further investigation as a potential alternative to abrasive cut-off and grinding.
2.4.2 Laser cutting
Current Applications
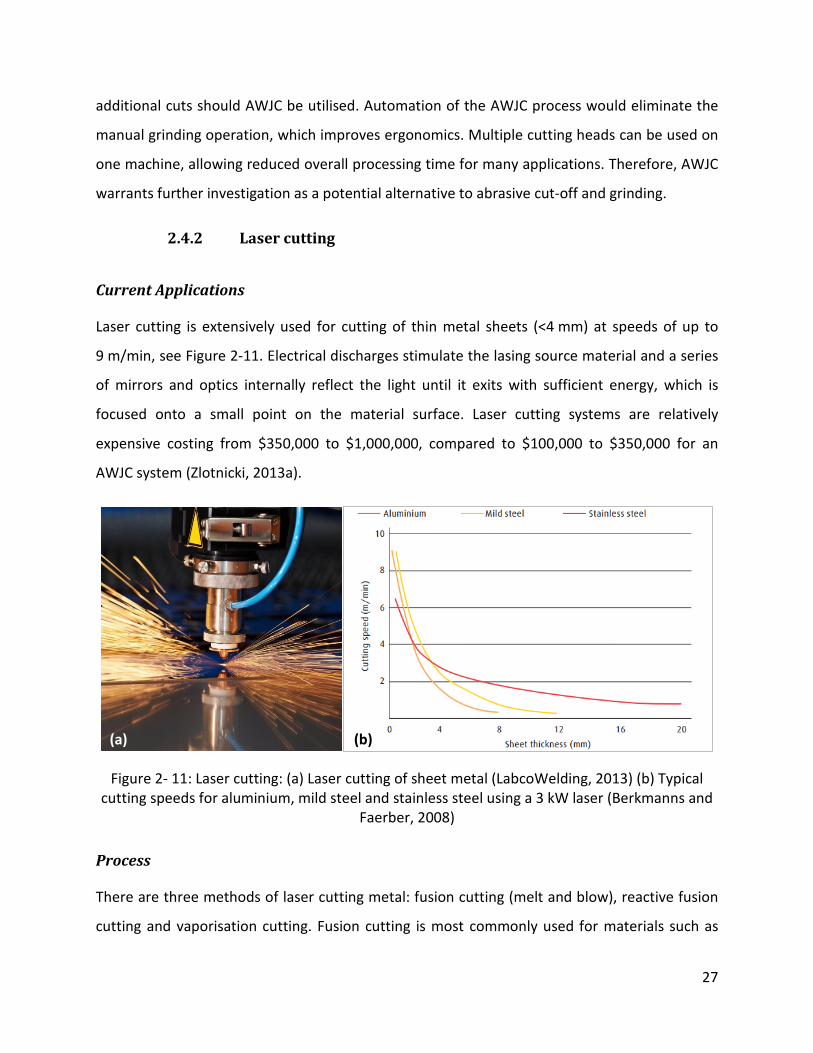
Laser cutting is extensively used for cutting of thin metal sheets (<4 mm) at speeds of up to
9 m/min, see Figure 2-11. Electrical discharges stimulate the lasing source material and a series
of mirrors and optics internally reflect the light until it exits with sufficient energy, which is
focused onto a small point on the material surface. Laser cutting systems are relatively
expensive costing from $350,000 to $1,000,000, compared to $100,000 to $350,000 for an
AWJC system (Zlotnicki, 2013a).
Figure 2- 11: Laser cutting: (a) Laser cutting of sheet metal (LabcoWelding, 2013) (b) Typical cutting speeds for aluminium, mild steel and stainless steel using a 3 kW laser (Berkmanns and
Faerber, 2008)
Process
There are three methods of laser cutting metal: fusion cutting (melt and blow), reactive fusion
cutting and vaporisation cutting. Fusion cutting is most commonly used for materials such as
(a) (b)

28
stainless steel and would be the most suitable method for machining CoCrMo alloy. The metal
is melted by the laser beam and blown out of the kerf by an inert assisting gas (usually
nitrogen), hence the process is also called the melt and blow technique. Reactive fusion cutting
uses oxygen as the assisting gas and can be used for cutting mild steel at faster rates than
would otherwise be achieved with fusion cutting. This generates an exothermic reaction
between the iron and oxygen thus increasing thermal input for melting. Vaporisation cutting
vaporises rather than melts the material, thus requiring relatively high power. It is normally
used for non-melting materials such as wood, carbon or thermoset plastics. Vaporisation is also
required when cutting commences in the middle of a metal sheet rather than from its side
(Wandera, 2010).
Laser sources for fusion cutting of metals are grouped as CO2 or solid-state. Solid-state (fibre)
lasers (SSL) are highly effective at cutting thin materials (<6 mm) while CO₂ lasers tend to be
used for thicker materials. Thick metals (>10 mm) are not normally laser-cut due to the
difficulty in removing molten material from the kerf, although this is improving with new
higher-powered lasers. A recent paper reported that it was possible to cut CrNi stainless steel
of 10 mm thickness at 1000 mm/min with a 4 kW CO₂ laser (Wandera et al., 2011). A CO2 laser
is based on a gas mixture in which light is amplified by carbon dioxide (CO2), helium (H2) and
nitrogen (N2) molecules, with the resulting beams guided by a series of mirrors. Conversely,
typical source materials for SSL include neodymium (Nd) and Neodymium
Yttrium-Aluminium-Garnet (Nd-YAG) with the laser beams generally directed using fibre optics.
Laser cutting requires accurate control of process parameters in order to achieve the desired
surface finish. The laser-material interaction is dependent on a number of factors, including the
laser beam intensity and the absorption rate of the laser energy by the workpiece.
Equipment
Laser cutting machines are available with power levels of up to 10 kW (Trumpf, 2013). At the
higher power spectrum, process speeds rivals that of plasma-cutting even for thick metallic
workpieces, although high power lasers have larger machine footprint and require more energy
to run. A typical laser machine comprises the following components: laser generator, cutting

29
head, gantry, controller and cutting bed.. A high-powered laser cutting system costs in the
region of €400-700k. As laser cutting has primarily been developed for flat sheet applications,
cutting head geometries tend to be large in comparison with AWJC heads, which restrict access
to components cast in tree configurations. Due to the short wavelength (1060 – 1080 nm) of
SSL, strict safety precautions must be taken as the laser beam can pass through the outer eye to
the retina. Similarly, CO2 lasers which operate in the far-infrared spectrum can cause corneal
damage. Protective eyewear, which involves lenses of various densities and colours, are
tailored specifically to the wavelength and power of the laser being used (Greene, 2008).
Cut Surface Characteristics
Laser cut quality typically deteriorates with increasing material thickness. For thick-section laser
cutting, a recast layer is usually formed on the underside of the cut. The cut face of 10 mm
stainless steel performed at different laser traverse rates is shown in Figure 2-12. At the correct
traverse speed, a small amount of recast can be observed at the bottom of the kerf with
striations visible at the top of the cut. Regions of the cut face from top to bottom are
categorised as initial penetration, first reflection and flow, and washout (Steen and Mazumder,
2010). At low speeds, a high level of power is applied to a given workpiece area, which results
in an increase of surface melting as a consequence of excess laser energy being absorbed into
the cut-edge with a smooth surface. Furthermore, kerf width is increased due to greater heat
conduction. In contrast, there is insufficient time for ejection of the melt from the kerf when
operating at high traverse speeds.
Figure 2- 12: Laser cut face of 10 mm thick stainless steel (Wandera et al., 2011): (a) Too slow (b) Correct speed (c) Too fast
(a) (b) (c)

30
A thin heat affected zone (HAZ) is also commonly formed on the cut face following laser
machining, an example of which is shown in Figure 2-13. The surface of the cut material is
heated to its melting point and then rapidly cooled with assisting gas pressure. The sudden
temperature change leads to increased hardness of the recast layer formed on the surface
(Hasçalık and Ay, 2013). The size of the HAZ is determined by various factors such as laser
power, traverse speed as well as gas pressure and is generally more brittle compared to the
bulk material. Mild steel displays a distinct HAZ due to the interaction with the reactive assist
gas (oxygen). The recast layer thickness increases with laser power due to the higher heating
rate but decreases with increasing cutting speed. As feed rate increases, the time for heat
conduction is lowered and hence workpiece thermal damage is reduced (Hasçalık and Ay,
2013).
Figure 2- 13: SEM image of recast layer and HAZ after laser cutting (Hasçalık and Ay, 2013)
Process Parameters
Laser power and traverse speed are parameters that have the most significant effect on the
quality and efficiency of laser cutting. The surface quality deteriorates when the speed is too
high or too low. The speed to achieve optimum surface quality has been shown to be about 20–
33 % lower than the maximum cutting speed for fibre laser cutting of stainless steel (Wandera
et al., 2009). A system’s maximum speed is limited by the laser power intensity and rate of
molten metal removal from the kerf. Increasing laser power allows a faster traverse speed to be
used, improves surface finish and reduces kerf width (Hasçalık and Ay, 2013) (Yilbas, 2004).

31
Other operating parameters for laser cutting include gas type, gas pressure, material density,
flow rate, focal length of the laser beam, focus position and the standoff distance. Significant
first order interactions exist between laser output power and traverse speed, gas pressure and
material thickness (Yilbas, 2004). Higher assisting gas pressure increases the removal rate of
liquid metal from the cutting zone. However, the laser assisting gas may be ineffective over the
rounded surface of the casting gates.
The absorption rate of the metal is dependent on the wavelength of laser radiation, angle of
incidence, material type, as well as the temperature and phase of the metal. In general, CO2
lasers have a much longer wavelength (~10 μm, in the far-infrared spectrum) compared to SSL
(~1 μm). The angle of incidence (a) is the angle between the perpendicular surface of the part
and the point at which the laser beam hits the material. Figure 2-14 shows that the angle of
incidence increases as the material thickness increases.
Figure 2- 14: Angle of incidence during laser cutting for a thin material and thicker material (Headland Machinery Pty Ltd, 2015)

32
Accurate focal point positioning is critical for maximising the power intensity. For cutting thick
solid cylinders, the focus position would require continuous adjustment. The thermal diffusivity
of CoCrMo (3.5x10⁻⁶ m2 s⁄ ) (Miculescu et al., 2008) is similar to that of stainless steel
(4x10⁻⁶ m2 s⁄ ). Mild steel has a thermal diffusivity of 12x10−6 m2 s⁄ and can therefore be cut
at much higher speeds. Reflective metals such as aluminium and copper have lower absorptivity
of laser energy. If the use of the wheelabrator was required before cut-off to remove all of the
non-conducting shell, then the increased reflectivity of the surface may reduce the maximum
cutting speed obtainable. Investment castings have a relatively inhomogeneous microstructure
with the possibility of inherent casting defects present and shrinkage porosity. Cutting through
an inhomogeneous material produces variation in cut quality, such as excessive melting at the
cut face or insufficient melting resulting in failure to cut through the workpiece.
Running Costs
Perzel et al. (2011) compared the total cost of running laser and abrasive waterjet systems for
the cutting of 10 mm thick carbon structural steel. The total cost per hour was €115.40 for laser
cutting and €78.46 for AWJC. The greatest portion of consumable cost is from the assisting gas,
which is usually nitrogen. The benefit of faster cutting from higher-powered lasers generally
outweighs the cost in terms of increased energy consumption, but the initial investment cost
and depreciation are also substantially higher.
Conclusion
For thin materials a higher cutting rate can be achieved with laser cutting. However lasers can
only be used for homogenous, clean materials and requires precise focal point positioning.
Laser cutting is unsuitable for the current application in Depuy as the castings would generally
still contain ceramic residues on their surface, which would interfere with the laser cutting
process.. Laser cutting heads are also currently too large to access the cut regions for the
majority of cast tree configurations under investigation.

33
2.4.3 EDM
Electrical discharge machining (EDM) is a highly accurate process whereby controlled electrical
discharges are employed to erode away a conductive material. A potential difference / voltage
is initially generated between an electrode or thin wire (usually 250-300 thick) and the
conductive workpiece, with the arrangement immersed in an insulating dielectric fluid (usually
deionised water for wire EDM and a hydrocarbon for die sink EDM configurations). As the
electrode and workpiece are brought closer together, the potential difference breaks down the
dielectric resulting in electrical sparks ‘jumping’ across the conductive gap, which causes
localised heating and melts / vaporises microscopic particles of the material.
As EDM is only applicable for conductive materials, the ceramic shell on the cast parts must be
completely removed prior to cutting although recent research has shown that it is possible to
cut non-conductive ceramics (zirconia and alumina) with EDM using a lacquer-based assisting
electrode applied with a doctor knife and screen print techniques to start a sustaining erosion
process (Hösel et al., 2011). Flushing is key part of the EDM process which evacuates molten /
eroded material from the spark gap (distance between the electrode/wire and workpiece
during discharge) to be replaced with fresh dielectric. Flushing also helps to reduce the thermal
effects of EDM on the cut surface / sub-surface. Material aberrations can compromise flushing
particularly in wire-EDM operations leading to a loss in process efficiency, longer machining
times and increased risk of wire breakage, which stops cutting.
Wire-EDM is ideal for the machining of complex profiles requiring an accurate finish, but is
unsuitable for high-volume cutting applications due to the relatively slow material removal
rates. A preliminary trial involving wire-EDM of CoCrMo alloy demonstrated a maximum Vt of
3.5 mm/min for a 13 mm thick CoCrMo plate, see Figure 2-15. This was an order of magnitude
slower than the current process utilised in Depuy. A large number of EDM machines would be
necessary to achieve equivalent cutting volumes in the same time as the current cut-off and
grinding approach. However, the EDM machine footprint is relatively small at approximately
2 x 1.5 m.

34
Figure 2- 15: Electrical discharge machining (EDM) of CoCrMo
2.4.4 Plasma Cutting
Plasma cutting is a thermal based cutting process that melts and blows away the material with
a constricted arc as detailed in the schematic in Figure 2-16. Plasma is a state of matter
generated from partial ionisation (charging) of molecules in gas during heating. A plasma beam
has high temperature and generates a HAZ on the cut material. Electrically conducting metals
are suitable for plasma cutting but non-conducting materials, such as the ceramic shell, can
only be cut with plasma using a non-transferring arc. In this case the material is not placed
within the electrical circuit, contrary to the majority of plasma cutting processes where the
workpiece forms part of the electrical circuit. Plasma cutting is therefore deemed inappropriate
as a replacement for cut-off and grinding operations as the ceramic residue on the cast
components would have to be removed before plasma cutting can be undertaken. The HAZ on
the cut face of the thin sections would be unacceptable as the process tolerances are very tight
in this region. Furthermore, the edge finish is generally inferior to laser or abrasive waterjet
machining, although higher metal cutting rates can be achieved for thicknesses greater than
6 mm. The typical purchase cost for a plasma cutting machine is between $50,000 and
$100,000 (Zlotnicki, 2013a). This is significantly lower than AWJC and laser cutting machines,
which typically cost from $100,000 to $350,000, and from $350,000 to $1,000,000, respectively

35
(Zlotnicki, 2013a). There are significant demands on supplies for plasma cutting, mainly the
industrial gases and metals (Perzel, 2011).
Figure 2- 16: Plasma Cutting Process (Farmweld, 2014)
2.4.5 Summary
Of the cutting processes investigated, AWJC showed the most potential as an alternative for the
cut-off and surface finishing of investment castings at DePuy Synthes. Laser cutting, plasma
cutting and wire-EDM are unsuitable primarily because an additional shell removal process
would be required to completely remove all ceramic residue prior to machining. AWJC, laser
cutting and plasma cutting demonstrate potential for favourable cutting speeds across the
range of thickness for this application. Due to relatively slow cutting rates, multiple EDM
machines would be required to maintain current production volumes. For laser cutting of thick
solid cylinders, the focus position would require continuous adjustment, thus making it
unsuitable for round casting gates. Laser cutting is more expensive for thick metals when
compared with AWJC. Chapter 3 describes the materials and methods used to determine the
AWJC speeds and surface finish achievable for typical DePuy Synthes castings.

36
Table 2-5: Summary of cutting options by key selection criteria
AWJC Laser Cutting EDM Plasma
Cutting
Cutting speed for metals <4 mm thick
Cutting speed for metals >10 mm thick
Cut accuracy for metals >10 mm thick
Ability to cut ceramic & metal together
Ability to cut cylindrical sections
Initial cost of investment
Running cost
Total

37
3. MATERIALS AND METHODS
3.1 Preparation of Investment Castings
In order to represent the full range of gates used on femoral and tibial castings, the cast
workpiece test samples used for AWJC experiments were flat and cylindrical pieces with
thicknesses varying from 2-30 mm. Preliminary investigations employed CoCrMo cast at DePuy
Synthes: 13 mm flat plates and 30 mm diameter cylinders (Figure 3-1). The 13 mm plates were
used to assess the characteristics of the AWJC face while the 30 mm cylinders were utilised to
estimate the maximum cutting depth attainable at various traverse speeds (Vt).
Figure 3- 1: CoCrMo castings used for preliminary trials: (a) 13 mm thick plates (b) 30 mm diameter cylinders
Additional castings were created at the University of Birmingham Foundry to complete the
required thickness range. Two types of wax trees were created at the University of Birmingham:
• Flat bars of 2, 4, 6, 8 and 10 mm thickness;
• Cylinders of 5, 10, 15 and 20 mm diameter.
The wax tool was wiped with a cloth and sprayed with Stoner mould release (Quarryville, PA,
USA). The wax patterns and additional supporting material were injected using an MPI wax
press (Poughkeepsie, NY, USA) and allowed to cool for 30 minutes. The plates were assembled
on top of each other and wax end caps were fixed to each side as shown in Figure 3-2 a. The
wax trees were dipped in Blaysons Trisol 60 pattern wash (Blaysons Casting Systems Ltd,
Cambridge, UK) to remove residual mould release spray and prepare the surface for the
primary shell coating. The trees received five aluminosilicate shell coats and a seal coat (Remet,
Rochester, UK), see Figure 3-2 b. The top of the funnel was cut off using a band saw. The wax
(a) (b) 10 mm

38
was removed from the moulds with an LBBC BoilerclaveTM (LBBC Technologies, Pudsey, UK) at a
maximum pressure of 1 MPa (145 psi) and temperature of 165-170 ˚C (Figure 3-2 c).
Figure 3- 2: Mould preparation: (a) Wax tree (b) Shell coat (c) De-wax
After de-waxing, the moulds were inspected and wrapped in Kaowool refractory blanket (an
alumina-silica fire clay) (Morgan Thermal Ceramics, Berkshire, UK). Kaowool was used to reduce
the cooling rate between firing and pour, and to mitigate the risk of the mould breaking during
handling. The crucibles were coated with a layer of zircon slurry to reduce carbon pickup, which
would have had a deleterious effect on the mechanical properties of the castings. The insulated
moulds were burned out in the furnace at 900˚C for two hours. The CoCrMo alloy was melted in
the crucible by an induction furnace (Inductotherm 175kW VIP PT3, Westampton, NJ, USA). The
mould was removed from the furnace and quickly set up in a ventilated area. Two manual
pours were attempted, however both failed at the bottom of the mould, see Figures 3-3 a, b.
The remaining moulds were removed from the furnace and allowed to cool. Upon inspection,
the moulds had cracked at the bottom during firing as shown in Figure 3-3 c due to rapid wax
expansion.
(b) (a) (c)

39
Figure 3- 3: Failed mould: (a) top remains (b) bottom remains (c) Typical crack
The moulds were redesigned to improve de-waxing. A larger minimum gap of 15 mm was
specified between parts to reduce shell “necking” (joining of the shell from either side). The
cross-bars were eliminated to reduce necking during shell-build, reduce metal turbulence
during filling, and increase the useful length of the test pieces. Fillet radii were added to the
joint edges to improve shell coating consistency, reduce metal turbulence during filling and
reduce the likelihood of non-filling on thin sections. Deeper metal reservoirs were added to the
top and bottom of moulds to reduce the risk of non-filled areas. The pouring cup size was also
scaled down to make the trees lighter during dipping, helping to ensure a more even coating
during manual dipping. Examples of the redesigned wax trees are shown in Figure 3-4.
Figure 3- 4: Improved wax tree designs: (a) flat bars 2, 4, 6, 8 and 10 mm thick (b) cylinders 5, 10, 15 and 20 mm diameter
(a) (b) (c)
(a) (b)

40
Two additional shell coats were applied to increase shell thickness to 10 mm and improve
strength for pour. Before de-waxing, holes were drilled in the top and bottom of the moulds for
additional wax exit routes. Better wax removal was observed with the modified mould design
as the wax exited from the holes, see Figure 3-5 a. The moulds were placed in the furnace for
an hour to burnout any remaining wax. After cooling for 24 hours, no significant cracks were
observed upon inspection of the moulds, see Figure 3-5 b. The holes were then plugged with
firing clay and allowed to dry as shown in Figure 3-5 c.
Figure 3- 5: De-wax improvements: (a) Wax exited from holes drilled before de-wax (b) Moulds examined for cracks after burnout (c) Holes plugged with firing clay before the second furnace
cycle
The moulds were wrapped in Kaowool and put in the furnace for 2-4 hours. A ceramic brick
surround was setup beneath an extraction unit to aid quick placement of the trees in an upright
position after removal from the furnace. Two trees were manually poured for each billet melt.
The alloy was poured into the second mould immediately after the first. The remaining alloy
was poured into an ingot mould as shown in Figure 3-6 a. After cooling for a day, the Kaowool
was removed and the majority of the shell was knocked out manually with a hammer (Figure 3-
6 b). Layers of ceramic which remained following the knock out process were removed by
AWJC. The cast tree was clamped and the parts for the experiments were cut off using AWJC
(Figure 3-6 c), with machine details outlined in Section 3.2.
(a) (b) (c)

41
Figure 3- 6: Post-cast test sample preparation: (a) solidification after pour (b) after knockout (c) cut-off with AWJC (d) test specimens ready for AWJC experiments
For ceramic cutting trials, a 6 mm thick layer of ceramic was fixed to the top surface of a 13 mm
plate with double-sided tape.
3.2 AWJC Equipment & Settings
3.2.1 AWJC Equipment
All of the AWJC experiments were conducted in the Department of Mechanical, Materials and
Manufacturing Engineering at the University of Nottingham on an Ormond, LLC (Auburn, WA,
USA) five-axis machine, see Figure 3-7 a. The 60,000 psi rated pump (Figure 3.7 b) was fixed at
50,000 psi (345 MPa) for all experiments as this was found to provide the best operating
efficiency. A 76 mm nozzle length with a 0.3 mm diameter sapphire orifice was used. The
fixture and nozzle location were manually setup for each cut. The standoff distance (s) was
measured before each trial using a 3 mm gauge plate. This setting was chosen for most
experiments in order to minimise the risk of nozzle crashes.
(b) (a)
(d) (c)
Shell remains
Ceramic brick
surround
Ingot mould
Metal
reservoirs
Wrapped castings
solidifying

42
Figure 3- 7: AWJC Equipment (a) AWJC machine (b) UHP pump
Medium-sized femoral trees cast in the DePuy Synthes foundry were used for AWJC trials at the
University of Nottingham. The trees were mounted in v-blocks with the nozzle manually setup
for each cut of the femoral tree.
3.2.2 Design of Experiments
The traverse speeds used in the experiments are outlined in Table 3-1. In experiment 1, cast
cylinders of 30 mm diameter were cut at constant ma and increasing traverse speeds in order to
determine the effect on cut depths. The traverse speed was increased from 60 mm/min to 300
mm/min in increments of 20 mm/min.
In experiment 2, plates of 13 mm thickness were cut at varying Vt to determine cut
characteristics. Experiment 2 included testing of the effect of adding a 6 mm thick layer of
ceramic to the top of the test piece at Vt of 180, 200 and 220 mm/min. Experiment 3 was a
27 mm thick plate cut at Vt of 80 mm/min in order to determine the change of Ra through a
relatively thick test piece.
Water
catcher tank
Abrasive
controller
Nozzle
UHP
pump
Test piece
(b) (a)

43
Design of Experiments (DOEs) were performed for 2, 4, 6, 8 and 10 mm thick plates and for 5,
10, 15, 20 mm diameter cylinders. Each DOE had two factors, Vt and ma, which were run at two
levels (a full-factorial design). The levels for ma were 350 and 480 g/min. The level settings for
Vt were estimated from the results of experiment 1. In addition, two centre points were used
for Vt, resulting in a total of six runs for each DOE. Experiments 8 to 12 included testing at
additional traverse speeds as the through-cutting speeds for thin flat plates were
underestimated from experiment 1.
Table 3- 1: Traverse speeds used for experiments
Experiment ID Casting shape
Thickness/ Diameter (mm)
Traverse Speeds (mm/min)*
1 Cylinder 30 60, 80, 100, 120, 140, 160, 180, 200, 220, 240, 260, 280, 300
2 Plate 13 35, 100, 140, 160, 180, 200, 220, 240, 300, 400
3 Plate 27 80
4 Cylinder 5 290, 350, 410
5 Cylinder 10 170, 200, 230
6 Cylinder 15 110, 140, 170
7 Cylinder 20 60, 90, 120
8 Plate 2 350, 380, 410, 450, 500, 600, 750, 800
9 Plate 4 290, 320, 350, 370, 390, 410, 430, 450, 470
10 Plate 6 230, 260, 290, 310, 330, 350, 370
11 Plate 8 170, 200, 230, 250, 270, 290, 310
12 Plate 10 110, 140, 170, 190, 210, 230, 250, 270, 290
* Parameters marked in bold were the Vt levels for the DOEs.
Experiments 1 to 12 provided suitable process settings for the subsequent femoral and tibial cutting experiments.

44
3.2.3 Process Setting for Femoral Castings
The femoral castings had five thin sections per part that were 2 to 4 mm thick. The gates were
cylindrical or rectangular with a thickness of 15 ± 2 mm. The process settings used for cutting
the femoral thin sections and gates are given in Table 3-2.
Table 3- 2: AWJC Process settings for femorals
Vt Thin sections: 350-400 mm/min
Gates: 100-150 mm/min
p 345 MPa
ma 350 g/min
Abrasive type 80-mesh GMA garnet
Focusing tube length 76 mm
Orifice 0.3 mm sapphire
s 3 mm
3.2.4 Process Settings for Tibial Castings
The tibial casting chosen for the experimental trials had a gate length of 60 mm and the
maximum width was 22 mm. This is representative of one of the largest tibial tray sizes in
production. The tree was cast in DePuy Synthes with AWJC performed at the University of
Nottingham on the Ormund 5-axis AWJC machine. The cast tree was setup in two different
orientations relative to the cutting head and nozzle. For cutting in orientation 1 the casting was
setup to be cut through the 60 mm thick side and the traverse cutting length was 25 mm. For
cutting in orientation 2 the casting was setup to be cut through the 22 mm thick side and the
traverse cutting length was 60 mm. Testing was conducted over two days, four months apart,
so this may capture some long-term process variation such as nozzle/orifice wear.

45
Figure 3- 8: AWJC tray orientations: (a) Orientation 1 (b) Orientation 2
The process settings used for cutting tibials are detailed in Table 3-3.
Table 3- 3: AWJC Process settings for tibials
Vt Orientation 1: 10 mm/min
Orientation 2: 40, 60, 80 mm/min
p 345 MPa
ma 350 g/min
Abrasive type 80-mesh GMA garnet
Focusing tube length 76 mm
Orifice 0.3 mm sapphire
s 3 mm
3.3 Measurement Methods
3.3.1 Abrasive Mass Flow Rate
The abrasive feed was controlled via a valve metered from 0-10. The valve was calibrated to
determine the abrasive mass flow rate of the chosen abrasive, 80-mesh GMA garnet (GMA
Garnet, Narngulu WA, Australia). This was performed by measuring the mass of the abrasive
allowed to flow freely for one minute into a container. The container was measured and the
electronic scales were set to zero. The abrasive tube was disconnected at the abrasive feed
(a) (b)

46
control. The abrasive was turned on and allowed to flow freely at the selected setting. After a
few seconds a container was placed under the abrasive stream. A stopwatch was started
simultaneously. After 60 seconds the container was removed and then the abrasive was turned
off. The mass of the collected abrasive was measured on the scales. This process was repeated
three times for each number from valve setting 4-7. The abrasive mass flow rate (ma)
calibration showed a linear trendline with respect to the valve control setting, see Figure 3-8.
Although the abrasive varied little when measured over one minute, the tabs are cut in seconds
rather than minutes. Therefore the consistency of abrasive supply is a critical factor affecting
the cut quality. To minimise errors, the pump and abrasives were turned on and allowed to
flow for ~ 3-5 seconds (in order to reach steady state) before the nozzle was moved along the
cut path.
Figure 3- 9: Calibration of abrasive mass flow rate (ma) to the controller setting
y = 108.29x - 290.29 R² = 0.9952
0
100
200
300
400
500
600
3 3.5 4 4.5 5 5.5 6 6.5 7 7.5
ma
(g/m
in)
ma controller setting

47
3.3.2 Cut Depth
The cut depth parameter was used to indicate the height of penetration into the workpiece by
the waterjet at various traverse speeds. Test pieces with incomplete cuts (through thickness
penetration not achieved), were subsequently separated using an Agie Charmilles (Geneva,
Switzerland) FL240 CC wire-EDM machine employing 0.25 mm diameter zinc-coated copper
wire. The cut depth was measured on the cut face from the top of the sample to the minimum
point of cutting (parallel to the nozzle angle) using a vernier calliper.
3.3.3 Surface Roughness
Whilst the machined surface roughness is not a CTQ (Critical-To-Quality) response for the
present application, it nevertheless provides an indication of AWJC process capability and
hence evaluated following each test. The surface roughness of the first test samples was
measured in the direction of jet traverse using two-dimensional (2-D) contact probe
profilometry with a Taylor-Hobson Form Talysurf 120L (Taylor-Hobson Ltd, Leicester, UK), see
Figure 3-10. The mean surface roughness (Ra) was measured according to ISO 4287; over an
evaluation length of 4 mm comprising five sampling (cut-off) lengths of 0.8 mm. The total
height of the roughness profile (Rt) was also recorded. Three locations on the parts were
measured three times, at 1.5 and 7 mm from the top of the cut face, and at 1.5 mm from the
bottom, with the results averaged for each location on the part.
Figure 3- 10: Two-dimensional contact probe profilometry
A limitation of contact profilometry was the difficulty in measuring areas close to the edges of a
sample. Therefore, an optical profilometry method involving an Alicona InfiniteFocus

48
microscope (Alicona UK Ltd, Kent, UK) was also utilised. A representative section of the part
was chosen for examination. A line was drawn at the very bottom of the kerf image to generate
a roughness profile. This was repeated three times for an average reading. Figure 3-11 shows
typical images from the optical system. Wavy surfaces demonstrated low Ra and high Rt
(Figure 3-11 a) whilst rough surfaces had higher Ra and lower Rt (Figure 3-11 b). Rough surfaces
have regular, straight striations and wavy surfaces have irregularly shaped striations at the kerf
exit. Wavy surfaces are indicative of abrasive pooling in this region, which results in deep but
smooth grooves with low surface roughness (Ra), typically less than 12 µm.
Figure 3- 11: Optical profilometry 3D surface images: (a) Wavy surface (b) Rough surface
A measurement repeatability study was conducted for roughness measurements at 1.5 mm
from the kerf exit for both contact and optical methods. The process conditions for the four
samples chosen to represent the range of roughness observed are given in Table 3-4. The
results are detailed in Figure 3-12. Operator was not a factor as there was only one operator.
Table 3- 4: Process conditions for samples used in measurement repeatability study
Sample name A2 A3 B1 B10
Thickness (mm) 13 13 13 13
Vt (mm/min) 100 100 100 230
p (MPa) 345 345 345 345
ma (g/min) 150 300 350 480
θ (˚) 0 0 12 12
(a) (b)
Ra = 11.7 µm
Rt = 147.9 µm
Ra = 13.8 µm
Rt = 105.4 µm

49
Part-to-PartReprodRepeatGage R&R
100
50
0
P erc
ent
% Contribution% Study Var
B10 (w
avy)
B1 (v. s
mooth)
A3 (acce
ptab
le)
A2 (v
. rough
)
B10 (w
avy)
B1 (v
. smoo
th)
A3 (acce
ptab
le)
A2 ( v
. roug
h)
8
4
0
Parts
Sam
ple
Ran
ge
_R=2.936
UCL=7.559
LCL=0
Contact Optical
B10 (w
avy)
B1 (v. s
moot
h)
A3 (accept
able)
A2 (v
. rough)
B10 (w
avy)
B1 (v
. smooth)
A3 (acc
eptable
)
A2 ( v
. rou
gh)
24168
Parts
Sam
ple
Mea
n
__X=10.20UCL=13.21LCL=7.20
Contact Optical
B10 (wavy)B1 (v. smooth)A3 (acceptable)A2 (v. rough)
24
16
8
Parts
OpticalContact
24
16
8
Method
B10 (w
avy)
B1 (v. s
moo
th)
A3 (accep
table
)
A2 (v
. roug
h)
24
168
Parts
Aver
age
ContactOptical
Method
Components of Var iation
R Chart by Method
Xbar Chart by Method
Ra at 1 .5mm from exit by Parts
Ra at 1 .5mm from exit by Method
Parts * Method Interaction
Gage R&R (ANOVA) for Ra at 1.5mm from exit - Comparison of both systems
Figure 3- 12: Repeatability study for roughness measurement using contact and optical profilometry methods
Part-to-part variation accounted for 92% of study variation. The average range between
measurements of the same part was 2.9 µm. The same trend is evident for both methods in the
X-bar chart. The optical method resulted in very slightly higher results but this only accounted
for 1.1% of study variation. These results imply that the two measurement systems are
comparable and both are capable of adequately distinguishing part-to-part variation. As can be
seen in figure 3-12, the very rough part had a higher range between measurements, implying
the measurement uncertainty increases as Ra increases. The average range for the three other
parts is 1.7 µm. This level of measurement uncertainty is sufficient for analysing the results of
the AWJC experiments. The main source of measurement variation for the optical method was
the choice of the representative section assessed. This was limited by the processing time. In
terms of contact profilometry, inconsistencies in alignment of the stylus probe with the surface
positional marks (0.5mm thick) and the edge of the test pieces were the primary causes of
errors / discrepancies in the measurements.

50
3.3.4 Striation Angle
The striation angle (As) was measured using ImageJ software. ImageJ is an open source
software developed at the National Institutes of Health (Bethesda, MA, USA). The image was
rotated and cropped so that the bottom of the kerf was aligned parallel with the image.
Multiple lines were drawn on the image along the striations, to align with the angle of the
striation at the kerf exit, see example in Figure 3-13. This was a useful measure for quantifying
the visual appearance of the cut face, however, it did not account for the depth of the
striations, which made it difficult to position the lines for wavy surfaces. Therefore, roughness
was generally considered more useful but Aswas an appropriate comparator for a limited range
of surface finishes.
Figure 3- 13: Lines drawn to measure striation angle (As)
3.3.5 Scanning Electron Microscopy (SEM)
High resolution SEM images were taken at DePuy Synthes (Cork, Ireland) using a JSM-6610LV
(Jeol USA Inc, MA, USA) and at the University of Birmingham (Birmingham, UK) with a JSM-7000
(Jeol USA Inc, MA, USA). The settings used for the SEM images in Figures 4-4, 4-5 and 4-6 are
given in Table 3-5. Secondary Electron Image (SEI) detection was used for all micrographs
except Figure 4-4 c, where a Back-Scattered Electron (BSE) image was generated. The BSE
setting reduced the reflection from the garnet particle, allowing a clear image to be captured.

51
Table 3- 5: SEM settings used
SEM Settings Figure label
4-4 a 4-4 b 4-4 c 4-5 a 4-5 b 4-6 a 4-6 b Machine JSM-
6610LV
JSM-6610LV
JSM-6610LV
JSM-7000 JSM-6610LV
JSM-7000
JSM-7000
Detection method
SEI SEI BSE SEI SEI SEI SEI
Voltage (kV) 20 20 10 20 20 20 20 Working distance (mm)
11 11 10 10 11 10 10
Magnification 35 40 1400 250 400 500 500 Pressure (Pa) N/A N/A 54 N/A N/A N/A N/A

52
4. EXPERIMENTAL RESULTS
4.1 Cut Surface Characteristics
The kerf was approximately 1 mm wide and narrowed towards the bottom of the cut for 13 mm
thick workpieces cut at 100 mm/min with ma of 300 g/min, see Figure 4-1. The kerf taper angle
was generally observed to increase with higher traverse speed (Vt) or standoff distance (s).
Conversely, the kerf widens towards the bottom edge when approaching maximum Vt, which
was 220 mm/min for 13 mm thick test pieces. Multiple reflections or “abrasive pooling” were
prevalent due to trapped abrasives in the narrow bottom section of the kerf and increased
rubbing in the vicinity. This resulted in the superposition of large wavelength surface variations
in the region, i.e. deep but smooth grooves with low surface roughness (Ra).
Figure 4- 1: Test pieces after AWJC at 100 mm/min (a) kerf front (b) kerf exit (c) cut face
Reducing Vt generally led to lower surface roughnesses, which reached a minimum of
approximately 2 μm (Ra). The surface roughness (Ra) of 27 mm thick CoCrMo specimens was
seen to increase from 2 μm at the top section to 15 μm at the bottom of the cut, see Figure 4-2.
150 g/min
(a) (c) (b)
IDR SCR
RCR
300 g/min
Bottom of kerf
Top of kerf

53
Figure 4- 2: Variation of surface roughness with depth of cut through the cut material (mean values ± standard deviation)
In most applications, AWJC is conducted with the nozzle angle (θ) at 90°(perpendicular to
workpiece surface). Adjusting θ by 12° in the direction of jet traverse reduced the length of the
uncut region at the end of the cut, particularly for thicker workpieces. Changing θ for the
13 mm thick plates had no effect on the striation angle at kerf exit (As), which was 17.6˚ for
both settings. When θ was changed (by 12°) for 27 mm thick plates, As reduced from 22.0˚ ±
1.8 to 13˚ ± 1.7 (Figure 4-3). All of the cylindrical workpieces as well as the 2 and 4 mm thick
plates were cut at θ=90˚, while the nozzle was tilted by 12˚ when machining plates 6 mm or
thicker.
0
20
40
60
80
100
120
140
0
2
4
6
8
10
12
14
16
18
20
0 5 10 15 20 25
R t (μ
m)
R a (μ
m)
Depth (mm)
Avg Ra
Avg Rt
ma = 480 g/min
p = 345 MPa
s = 3 mm
t = 27 mm
Vt = 80 mm/min
θ = 90˚
Top
of c
ut
Bott
om o
f cut

54
Figure 4- 3: Increasing θ by 12˚ for thick plates: (a) 13 mm thick, θ=90˚ (b) 13 mm thick, θ=102˚ (c) 27 mm thick, θ=90˚ (d) 27 mm thick, θ=12˚
Abrasive grit embedment was most evident in the Initial Damage Region (IDR), as can be seen
from the greater quantity of dark flecks at the top section of the cut as shown in Figure 4-4 a.
Some of the fragments were also observed in the Rough Cut Region (RCR), most notably
towards the exit region of the cut (Figures 4-4 b, c).
(a)
(c)
(b)
(d)

55
Figure 4- 4: SEM images of abrasive fragments: (a) IDR & SCR 35x magnification (b) Kerf exit 40x magnification (c) Kerf exit 1400x magnification
Material removal in the IDR, where the angle of abrasive impact was high occurred via
microchip formation and shearing. At low cutting speeds, the IDR was the roughest region but
as cutting speed increased, surface roughness was highest in the RCR . The IDR was seen to
cover the top 0.25-0.5 mm of the cut and was subject to abrasive impacts from the jet
periphery resulting in pit formation and rounding of the top edges, see Figure 4-5.
(a)
(b) (c)
Examples of
embedded grit

56
Figure 4- 5: SEM images of IDR showing pit formation and top edge rounding as a result of abrasive impacts: (a) 250x magnification (b) 400x magnification
Impact angles were approximately 5 to 30˚ lower in the Smooth Cut Region (SCR) and RCR due
to jet lag. Deformation wear by ploughing and abrasive pooling was visible in the SCR and RCR,
respectively see Figure 4-6.
Figure 4- 6: SEM images of cut regions at 500x magnification: (a) Ploughing in the SCR (b) Wear in the RCR due to abrasive pooling
4.2 Process Settings
4.2.1 Cut Depth
Cylinders of 30 mm diameter were used as test pieces (as flat plates of equivalent thickness
were not available) to estimate the cutting depth at different traverse speeds. The maximum
height of the cylinders was representative of the thickest gates in cast trees used in production.
(a) (b)
(a) (b)

57
Each test run was performed once due to material and time constraints. The traverse speed
(Vt ) was varied with all other parameters kept constant. The peak ma of 480 g/min was used.
The nozzle angle (θ) was 90˚ and the standoff distance (s) was 3 mm to the top of the part.
Reducing Vt increased the depth of cut (Dc) and depth of the SCR. The maximum Vt possible
without compromising through-cutting of the cylinder was 80 mm/min. Figure 4-7 shows the
increase in cut depth as Vt was reduced from 200-80 mm/min.
Figure 4- 7: Increasing Dc of 30 mm cylinders by reducing Vt: (a) 200 mm/min (b) 140 mm/min (c) 80 mm/min
The results indicated a logarithmic relationship between Dc and Vt as shown in Figure 4-8. The
empirical formula which relates Dc to Vt over the cutting speed range of 80-300 mm/min is
detailed in Equation 1 with a corresponding coefficient of determination of R2=0.9747 for the
data.
Dc = −14.72 ln(Vt) + 92.798 (1)
(a) (b) (c)

58
Figure 4- 8: Variation of Dc with Vt for 30 mm cylinders
4.2.2 Cut Quality
Equation 1 can be further modified to include a quality coefficient, CQ (Hlavac et al., 2009) and
re-written in terms of Vt as outlined in Equation 2. For a chosen depth (or material thickness),
CQ values <1.0 reduce Vt so that a better surface finish is achieved on the cut face.
Vt = CQ �eDc−92.798−14.72 � (2)
Applying Equation 1 to the 13 ± 1 mm thick samples, the predicted Vt was 226±15 mm/min,
which is equivalent to the actual Vt employed in the experiments to achieve TC; 220 mm/min.
Equivalent cutting depths were obtained with flat and cylindrical sections for the same process
parameters, although the end of the flat sections required finishing with EDM, see Figure 4-9.
The traverse speed should be reduced at the end of flat section cuts to account for lag. Despite
the increase in standoff distance, cylindrical sections can be cut at constant a Vt as the material
is thinner at the start and end of the cut.
0
5
10
15
20
25
30
0 100 200 300 400
D c (m
m)
Vt (mm/min)
ma= 480 g/min
p = 345 MPa
s = 3 mm
t = 30 mm
θ = 90˚

59
Figure 4- 9: Equivalent Dcfor flat and cylindrical castings (Vt=300 mm/min): (a) 13 mm thick flat casting (b) 30 mm diameter cylinder
The surface roughness of the test pieces was used as a measure of cut quality with Ra of
<10 μm corresponding with an acceptable visual finish. Figure 4-10 shows the increasing
roughness from the top to bottom of samples cut at varying traverse speeds. The sample
machined at 180 mm/min demonstrated the highest roughness levels in the middle of the test
piece, which subsequently reduced near the kerf exit due to abrasive pooling causing a wavy
surface.
Figure 4- 10: Variation of surface roughness (Ra) with depth of cut for different values of velocity (Vt) through 13 mm plates (ma=350 g/min)
0
2
4
6
8
10
12
0 2 4 6 8 10 12 14
Ra (µ
m)
Depth of measurement (mm)
35 mm/min
100 mm/min
140 mm/min
160 mm/min
180 mm/min

60
4.2.3 Abrasive Mass Flow Rate
Surface finish quality deteriorates at high cutting speeds. However, cutting speeds can be
increased as more abrasive hits the material, provided the abrasive saturation point has not
been reached. The abrasive saturation point for the 0.3 mm orifice used in the experiments was
480 g/min. For 13 mm thick plates, increasing ma from 150 to 350 g/min increased Vt by 80%
(from 100 to 180 mm/min) while maintaining through cutting conditions, see Figure 4-11 a, b, c.
A further rise in ma from 350 to 480 g/min increased Vt by 22% (from 180 to 220 mm/min), see
Figure 4-11 d.
150 g/min, 100 mm/min
350 g/min, 100 mm/min
350 g/min, 180 mm/min
480 g/min, 220 mm/min Figure 4- 11: Effect of increasing ma: (a) 150 g/min (b) 350 g/min (c) 350 g/min (d) 480 g/min
4.2.4 DOE Results
DOEs were conducted for cylindrical and flat plate test pieces to examine Vt and ma. The Vt
levels were different for each DOE and are given in Table 3-1. The ma levels were kept constant
for all DOEs. Both Vt and ma had a statistically significant effect on Ra and there was no
significant interaction between the two factors. The surface roughness results of DOEs for the
cylinder and flat plate cutting are shown in Figure 4-12. Ra increased with increasing Vt and
reduced with increasing ma, except wherever abrasive pooling resulted in deep grooves with
low Ra values. This was the case for some of the cylindrical test pieces, which are highlighted in
Figure 4-12. The speeds for the cylinder DOEs were very close to maximum through-cut speeds,
(a) (b)
(c) (d)

61
which resulted in abrasive pooling in some of the samples. In contrast, the traverse speeds for
the flat plates were significantly slower than the maximum through-cut speeds. Further
experiments were conducted on the flat plates to determine the maximum through-cut speeds.
15
10
5
10-1
12
10
8
30
20
10
50
30
10
4.5
4.0
3.5
7
6
5
10-1
13.0
10.5
8.0
16
12
8
10-1
12
9
6
Ra for 5mm C y l.
Speed (coded units)
Ra for 10mm C y l. Ra for 15 mm C y l.
Ra for 20mm C y l. Ra for 2mm plates Ra for 4mm plates
Ra for 6 mm plates Ra for 8mm plates Ra for 10mm plates
-11
Ma
Surface roughness (Ra) of DOE test pieces
Figure 4- 12: Ra of all DOE test pieces. The circled results were parts that exhibited deep grooves with low Ra (due to abrasive pooling)
Cast CoCrMo plates 2-10 mm thick were cut at varying Vt with the resulting surface roughness
detailed in Figure 4-13. The 10 mm thick plates were cut through at traverse speeds of up to
290 mm/min. This test piece exhibited a low Ra due to abrasive pooling at the bottom of the cut
resulting in a smooth, wavy surface. The maximum Vt that achieved through cutting for the 8, 6
and 4 mm plates was 310, 370 and 470 mm/min, respectively. The maximum Vt for the 2 mm
plates was 800 mm/min, which was significantly faster than the maximum Vt for a thickness of
4 mm. The surface roughness at kerf exit reduced as the plate thickness reduced. The maximum
Ra on 10 mm plates was 16 μm, whereas this was 14.8, 13.6 and 12 μm on the 8, 6 and 4 mm
plates, respectively. An equivalent surface roughness of approximately 6 μm was achieved for
10, 8, 6, 4 and 2 mm plates cut at Vt of 110, 170, 290, 450 and 750 mm/min, respectively.

62
Figure 4- 13: Variation of surface roughness (Ra) with traverse speed (Vt) for different thicknesses of flat plates (2, 4, 6, 8 and 10 mm) (ma=350 g/min)
Figure 4-14 shows the Vt levels that results in acceptable surface finish (Ra <10 μm) following
AWJC for different cast gate thicknesses up to 30 mm. A slightly higher Vt can be employed for
gates having round cylindrical profiles compared with flat rectangular gates as the bottom of
flat plates are prone to a jet lag effect. For rectangular gates, Vt should be reduced at the end of
the cut to negate the influence of lag. Equation 3 can be used for round gates of circular cross-
section, whilst equation 4 can be used for plates of rectangular cross-section. These equations
incorporate acceptable cut quality.
Vt = 3400.4 (t (mm))−1.176 (3)
Vt = 2186.5 (t (mm))−1.01 (4)
0
2
4
6
8
10
12
14
16
18
0 100 200 300 400 500 600 700 800
R a (μ
m)
Vt (mm/min)
10 mm
8 mm
6 mm
4 mm
2 mm

63
Figure 4- 14: Variation of traverse speed (Vt) with gate thickness to achieve Ra<10 μm for gates up to 30 mm thick
4.2.5 Process Variation
The experimental trials were repeated on the 4 mm plates at the same conditions over two
days. The same traverse speeds produced a visually equivalent surface finish, however the
surface roughness was slightly lower on the second day, see Figure 4-15. This may have been
due to slight differences in setting up the abrasive flow rate or inhomogeneity of the casting
material.
y = 2186.5x-1.01 R² = 0.995
y = 3400.4x-1.176 R² = 0.996
0
100
200
300
400
500
600
700
800
0 2 4 6 8 10 12 14 16 18 20 22 24 26 28 30
V t (m
m/m
in)
Gate Thickness, t (mm)
Flat
Round
Power (Flat)
Power (Round)

64
Figure 4- 15: Variation of surface roughness (Ra) with traverse speed (Vt) for flat plates 2 mm thick on different days (ma=350 g/min)
4.3 Ceramic Cutting
In general, a small amount of alumina-silicate ceramic shell remains after knockout which
increases the risk of nozzle collisions during AWJC. In order to mitigate this risk, an alternative
shell removal process could be used or the standoff distance could be increased. For all flat
specimens free of ceramic residue, through cutting was achieved with Vt=220 mm/min at
ma=480 g/min, albeit with a significant degree of abrasive pooling at the kerf exit, see
Figure 4-16 a. Conversely, traverse speed had to be decreased to 180 mm/min with a nozzle
standoff set at 3 mm (from the top surface) to ensure through cutting for samples with ceramic
coating, which also resulted in a shorter SCR as highlighted in Figure 4-16 b.
y = 2.3774e0.0018x R² = 0.843
y = 1.4239e0.0019x R² = 0.635
0.00
2.00
4.00
6.00
8.00
10.00
12.00
0 200 400 600 800 1000
R a (μ
m)
Vt (mm/min)
Ra Day 1
Ra Day 2
Expon. (Ra Day 1)
Expon. (Ra Day 2)

65
Figure 4- 16: Effect of ceramic addition on the SCR depth: (a) test piece without ceramic showing large SCR and small RCR (b) test piece with ceramic showing smaller SCR and large RCR
Gates employing ceramic cores demonstrated different material removal characteristics as the
ceramic material at the centre was easier to machine compared to a solid metal gate. However
workpieces with a hollow core were less readily cut due to the air gap causing the jet to
diverge. The jet deviation results in the bottom kerf width to be much larger than at the top of
the cut. This was observed following machining of a hollow ceramic tube with AWJC as detailed
in Figure 4-17 a. A similar effect was also evident when cutting a metal piece with a ceramic
insert, such as that shown in Figure 4-17 b.
Figure 4- 17: Ceramic cutting: (a) Hollow tube (b) metal cylinder with ceramic insert
4.4 Femoral Cutting
4.4.1 Nozzle Access and Cutting Orientation
Prior to cutting trials, computer models of the cast tree configurations were created to
investigate potential issues with nozzle access to the cutting areas (Figure 4-18). The
simulations demonstrated that the nozzle cover would collide when machining the largest
femoral sizes. The function of the nozzle cover is to hold the focusing tube in place. A taper can
however be milled off the component to increase access to the cutting zone.
Bottom of
the kerf
Top of
the kerf
(a) (b)
(a) (b)
Ceramic
insert
Metal
cylinder
SCR
RCR

66
Figure 4- 18: Computer model of nozzle access to femoral thick sections
The nozzle is required to operate in close proximity to the part being cut to optimise
performance. It was generally more difficult to access the cut area on parts with the thinnest
sections as shown in Figure 4-19 a. In order to avoid collisions with the component, the standoff
distance (s) was increased by 1-2 mm where necessary.
Figure 4- 19: Limited nozzle access to femoral parts (a), (b) thin sections (c) thick sections
When the nozzle was aligned 1 mm to the side of the part, the side of the part was damaged
rather than cutting through the thin section, see Figure 4-20 a. The cut surface was visibly rough
as the material was too thick in this region for the traverse speed employed. When the nozzle
angle was set to 5˚ towards the part, damage occurred beneath the cut on the opposite side of
the casting, see (Figure 4-20 b), which does not occur with the appropriate nozzle angle. During
(b) (a) (c)
Nozzle
Thin sections before cutting
Thick section before cutting
Femoral Part

67
thick section cutting, part damage occurred when the nozzle angle was not perpendicular with
the cut face (Figure 4-20 c). The jet cut into the part leaving a very rough finish which is
unacceptable for production.
Figure 4- 20: Femoral casting damage from incorrect nozzle setup: (a) thin section (b) area below thin section (c) thick section
4.4.2 Cutting Speed and Surface Finish
The nozzle was setup to start approximately 1 mm before and after the sections. The time to
cut each thin section 9 mm long was less than 1.5 seconds. Manual grinding of these areas
takes 2-3 seconds. The cut finish obtained at Vt of 400 mm/min is shown in Figure 4-21.
Figure 4- 21: Cut face of femoral thin sections after AWJC: (a) medial (b) lateral (c) proximal
The majority of the thick femoral sections are cylindrical with a diameter of 14-16 mm. These
were cut at varying speeds as shown in Figure 4-22. Reducing Vt increased the cut depth and
improved cut surface quality. Two passes were required when attempting cut-off at Vt
200 mm/min while a single pass operation was possible at 150 mm/min. At a traverse speed of
(b) (a) (c)
(a) (b) (c)

68
130 mm/min, the surface finish at the bottom of the cut (Ra of 9 μm) was visually equivalent to
the current finish after gate removal. Using a lower Vt of 120 mm/min would therefore improve
process capability. A 16 mm diameter gate takes 7.5 seconds to cut with Vt of 120 mm/min.
Figure 4- 22: Cut face of femoral gates after AWJC at various Vt (mm/min): (a) 100 (b) 110 (c)
120 (d) 130 (e) 140 (f) 150 (g) two passes at 200 mm/min
4.5 Tibial Cutting
4.5.1 Nozzle Access and Cutting Orientation
Alternative cutting orientations were investigated to determine the possibility of producing an
accurate finish from top to bottom without causing damage to other parts on the cast tree. The
cutting orientation that enabled access to all parts required cutting through the thickest
(60 mm) gate cross section as detailed in Figure 4-23 a. A slow traverse speed of 10 mm/min
was used to cut through the section. Despite the low cutting rate, the cut length (25 mm) was
shorter compared to other arrangements. The gate height was 1.6 mm at the top of the cut and
3.6 mm at the bottom, see Figure 4-23 b. While no damage was apparent on the cut part
beneath the gate, the jet caused major damage to a component below the cut zone, see
Figure 4-23 c.
(a) (b) (c) (d)
(e) (f) (g)

69
Figure 4- 23: AWJC tray orientation 1 (through thickest gate section): (a) Setup (b) Surface finish (c) Part damage
To cut through gates at the highest possible Vt, it was necessary to orientate the nozzle so that
it penetrated the thinner side of the gate. Cutting along the thinnest section was only
achievable when machining was initiated at the top of the tree as the nozzle could not be
positioned close enough to the cut region when approaching from the opposite side. While
gates on the top row of parts were easily reached, those below were not accessible when using
the same AWJC nozzle angle. Even after removal of the top row, nozzle access was still
restricted because of the remaining gates. One of the parts in the top row was cut in
orientation 2 at Vt of 80 mm/min and θ of 12˚, see Figure 4-24 a. Although complete through-
cut was not achieved (Figure 4-24 b), the part was easily removed with a lever. Significant
damage however was inflicted on the part in the row below the cut as shown in Figure 4-24 c.
Other part
damaged below
cut zone
(a) (b) (c)
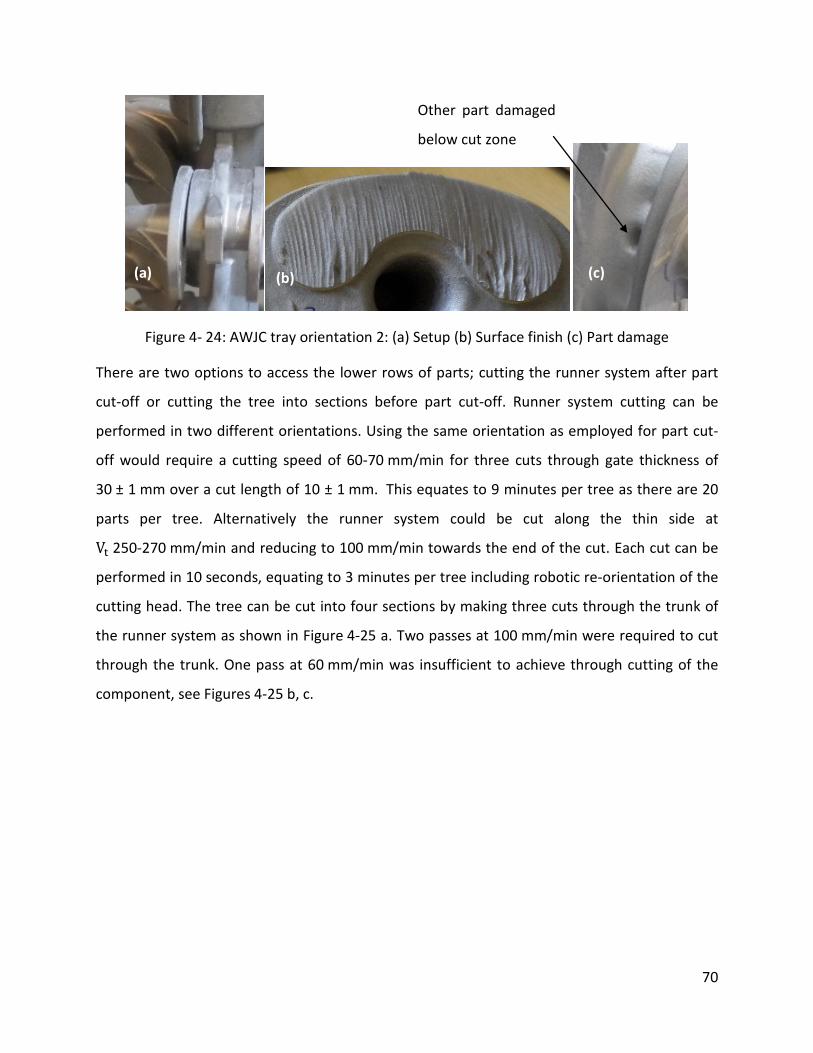
70
Figure 4- 24: AWJC tray orientation 2: (a) Setup (b) Surface finish (c) Part damage
There are two options to access the lower rows of parts; cutting the runner system after part
cut-off or cutting the tree into sections before part cut-off. Runner system cutting can be
performed in two different orientations. Using the same orientation as employed for part cut-
off would require a cutting speed of 60-70 mm/min for three cuts through gate thickness of
30 ± 1 mm over a cut length of 10 ± 1 mm. This equates to 9 minutes per tree as there are 20
parts per tree. Alternatively the runner system could be cut along the thin side at
Vt 250-270 mm/min and reducing to 100 mm/min towards the end of the cut. Each cut can be
performed in 10 seconds, equating to 3 minutes per tree including robotic re-orientation of the
cutting head. The tree can be cut into four sections by making three cuts through the trunk of
the runner system as shown in Figure 4-25 a. Two passes at 100 mm/min were required to cut
through the trunk. One pass at 60 mm/min was insufficient to achieve through cutting of the
component, see Figures 4-25 b, c.
Other part damaged
below cut zone
(a) (b) (c)

71
Figure 4- 25: AWJC of trunk to prevent tray damage (a) Cut location (b) Cut face after two passes at 100 mm/min (c) Cut face after one pass at 60 mm/min
4.5.2 Cutting Speed and Surface Finish
Following AWJC of the trunk, the remaining sections were individually setup to perform part
cut-off in orientation 2 at Vt of 40, 60 and 80 mm/min. For the cutting trials in orientation 2, the
parts were fixed in place over a sacrificial plate and the nozzle was set to 90˚ (Figure 4-26).
Figure 4- 26: Setup for tibial cutting in orientation 2 after separation from the tree
Areas under the gate suffered wear damage due to jet divergence. Particularly noticeable were
areas on the left of the part before the gate (the nozzle passed from left to right), the region
underneath the hole and the cast lettering, see Figure 4-27 b. Subsequent parts were cut-off at
a reduced off-set from the component and at higher traverse speeds of 60 and 80 mm/min, see
Figure 4-27 c and g. Due to kerf tapering, the gate height was flush at the top and sloped by
(a) (b) (c)

72
1 mm at the bottom of the gate. The part cut-off time was approximately one minute for Vt of
60 mm/min. Figure 4-27 d shows the wear effect of cutting too close to the part.
Figure 4- 27: Tray gates after AWJC at Vt 40-80 mm/min
The roughness of the machined surfaces shown in Figure 4-27 (excluding d) are plotted in
Figure 4-28. At Vt of 40 mm/min the gate surface finish was comparatively smooth (Ra < 6 µm).
The roughness (Ra) rose to approximately 10 µm when Vt was increased to 60 mm/min and
80 mm/min.
(a) (b)
(c) (d) (e)
(f) (g)

73
Figure 4- 28: Variation of surface roughness of trays with velocity
The kerf was wider at the start and end of the cut compared to the middle because the standoff
distance was not adjusted for the rounded part geometry, see Figure 4-29. The standoff
distance was approximately 1 mm in the middle of the cut and 7 mm at the start and end of
the cut.
Figure 4- 29: Kerf width increase at the start and end of tibial cut
0.0
20.0
40.0
60.0
80.0
100.0
120.0
140.0
0.00
2.00
4.00
6.00
8.00
10.00
12.00
20 40 60 80 100
Rt (μ
m)
Ra (μ
m)
Vt (mm/min)
Day 1 Ra Day 2 Ra Day 1 Rt Day 2 Rt
Start of cut End of cut

74
5. DISCUSSION
5.1 Choice of Cutting System
Following an extensive literature review of various alternative cut-off operations for cast
biomedical components, AWJC was chosen for experimental evaluation due to its ability for
machining a wide range of materials at relatively high removal rates, e.g. 10 mm thick titanium
cut at 550 mm/min (Zelenak et al., 2012), with virtually no workpiece heat-affected zone. The
process is capable of cutting through both metals and ceramics. In contrast, the performance of
laser cutting is highly dependent on laser-material interactions (Wandera et al., 2011), and is
generally unsuitable for ceramic materials. Therefore, any ceramic coatings left over after
knockout would have to be removed prior to laser cutting. Other technical challenges with laser
cutting included limited access to the cutting area due to relatively large cutting heads. In
addition, the round thick gates would cause high variability of melt blowout and make accurate
focal-point positioning difficult. Melt blowout can be controlled more easily for laser cutting of
flat sheet metal as the cross-sectional area is constant.
5.2 Femoral AWJC
5.2.1 Cutting Speeds
The AWJC traverse speed (Vt) for a typical thick femoral gate was 120 mm/min. The highest
traverse rate for through cutting of 16 mm thick CoCrMo femoral gates was 140 mm/min.
Conversely, the 4 mm plates were cut through at up to 470 mm/min while the 2 mm flat
workpieces were machined through at 800 mm/min. The thin sections of femoral castings are
typically 2-3.2 mm thick, depending on the product type. Access to the thin sections however is
limited by part geometry. Although increasing the standoff distance (s) reduced cutting
efficiency (Figure 5-1), the additional 1-2 mm was occasionally necessary to avoid nozzle
collision with the part. Although the thinnest sections can be as little as 2 mm thick, higher
traverse speeds were not used because of the increased nozzle standoff. A nozzle angle of 5-10˚
ensured that the surface finish was approximately flush with the part, despite the arrangement

75
increasing the effective cut thickness by 1-2 mm. The thickest thin sections (3.2 mm) can be cut
at 400 mm/min with an acceptable surface finish (Ra <7 µm). This however was marginally
lower than the 450 mm/min achieved by Hlavac et al. (2009) for 4 mm thick NH1 steel. This was
attributed to the higher pressure of 450 MPa utilised by Hlavac et al. (2009) compared with the
350 MPa used for this research. The cutting speeds obtained for 4 mm thick CoCrMo represent
a cycle time reduction of 70% as opposed to the current cut-off and grinding system, which
takes 23 minutes to achieve the equivalent surface finish.
Figure 5- 1: Effect of increasing standoff distance (WARDJet, 2013a)
5.2.2 Abrasive embedment and surface characteristics
Abrasive grit embedment was insignificant for AWJC of femorals as a sufficiently large cast layer
is removed during subsequent processing. Top edge rounding was particularly evident when
cutting 2 mm thin plates at high traverse speeds of up to 800 mm/min. In order to achieve
process tolerances for thin sections, the machine programs have to incorporate variable impact
angles or reducing traverse speeds. Paul et al. (1998) demonstrated that the maximum erosion
rate was achieved with an impact angle of 10-20˚. Conversely, rounding of the top edges after
cutting the thick femoral gates is beneficial to the subsequent grinding operation as a rounded
edge incurs lower wheel wear than a stepped profile. Increasing standoff increases top edge
rounding because the jet loses coherency as it moves through open air, thus reducing cutting
efficiency, as highlighted in Figure 5-1. If standoff is increased to 7-8 mm, cutting speeds must
be reduced by approximately 20% to achieve similar results with respect to tolerance and edge
quality (WARDJet, 2013a).

76
5.2.3 Automation of Femoral AWJC
Most AWJC machines do not employ material handling automation, such as shuttles, as the
operation does not comprise a large proportion of the running cost. Most job-shop applications
require patterns to be cut from a large sheet of metal. Ninety percent of all AWJC machines are
loaded and unloaded either by hand or with the aid of simple cranes (Flow, 2013). However,
automation is essential for femoral AWJC due to the long setup time that would otherwise be
required for such complex geometry. An AWJC head could be fitted to a robotic system, which
would be highly repeatable but less accurate than conventional AWJC machines. A robotic
system may also provide increased flexibility but at the expense of higher equipment costs. For
this application, a vision system used in conjunction with a 5-axis AWJC machine was deemed
most suitable because the flexibility provided by a robotic solution is not required. In order to
automate the cutting system it is necessary to first locate the individual part positions on the
tree. The part patterns are repeatable but the part position on the tree is subject to variation
due to manual wax tree assembly. A three-dimensional (3-D) vision system would have to be
incorporated into the AWJC system to accurately locate the individual parts on the tree before
cutting. There is a risk of an abrasive blockage or nozzle damage (and resulting downtime) if the
nozzle is incorrectly positioned and hits the part or the ceramic during machining. The vision
system will therefore be required to differentiate between the parts and the ceramic layer and
communicate the respective positions to the AWJC controller prior to cutting.
Machine vision systems comprise five components: lighting, lens, sensor, image processing and
input/output hardware. The vision system would operate outside of the water. The system
however must be capable of operating in a wet environment with abrasives present and
therefore should be rated to the highest level of Ingress Protection (IP), IP67, which is
waterproof to a depth of 1 metre. The parts would be submerged for cutting to minimise
operating noise. The sinking of the fixture has to be closely controlled to maintain a high degree
of part accuracy during cutting. Stereovision systems use multiple cameras positioned in
different places allowing calculation of the depth of a real object. Lighting is important because
it illuminates the features of the part so that they can be clearly detected by the camera. The
lighting selected depends on the surface luminosity, which varies from the cast metal to the

77
ceramic as well as across the cast surface and any wet areas. The position of the lighting also
affects the contrast between different part features. The lens captures the images and sends
them to the sensor in the form of digital images. Calibration is required to align pixel
information from multiple cameras at different angles. This involves using a calibration grid,
acquired at different angles to calculate image distortion as well as the exact spatial
relationship between the cameras (NI, 2013).
Point-clouds generated during image capture are used for the second stage in position finding,
which is pattern matching. Pattern matching is a general purpose tool to find arbitrary shapes
in an image and measure their position with high accuracy (MatrixVision, 2013). The point
clouds captured on the tree before cutting can be compared to a computer model. The AWJC
software then adjusts the standard cutting program to account for the position of each part on
the tree and avoid ceramic areas.
5.3 Limitations of AWJC
A major limitation of AWJC is that it does not suit all cast tree configurations. The jet damages
regions below the cutting zone and the cutting speeds achievable for thick sections are slower
than can be achieved with the use of abrasive wheel grinding or plasma cutting. The process
tolerances achievable with sections thicker than 25 mm (Ra of 15 µm at bottom of cut) are
inferior to abrasive wheel cutting, which has a much faster cutting rate of approximately
450 mm/min for the same thickness. In addition to the AWJC machine, the system requires a
UHP pump, a waste removal system and a water filtration unit. Each of these components
requires adequate access for maintenance and results in a large footprint of approximately 9 m2
for a complete AWJC system.
5.3.1 AWJC of Tibials
Tibial trays are not suitable for AWJC with their current cast tree configuration and gate size.
Tray trees have large quantities of shell remaining after knockout compared to femorals. As a

78
result, a vision system may struggle to accurately locate part positions of this product type. If
the pattern cannot be identified then the cutting program will not run.
Nozzle access is limited for the tibial tree configuration. Cutting in orientation 1 (through the
thickest gate section) damaged the parts below the cut (as shown previously in Figure 4-23).
Sacrificial plates up to 20 mm thick can be placed under the parts being cut-off to prevent this
damage, however this involves an additional consumable item and would constitute a
significant portion of the production cost. Cutting in orientation 2 allowed the parts to be cut-
off more quickly and avoids damaging parts below the cut region as highlighted in Figure 4-26.
In order to access parts to cut in this orientation and prevent damage to parts lower down the
tree, additional cuts through the trunk of the tree were made to separate the rows. These
additional cuts added 3 minutes to the total cutting time for the tree.
When cutting through the tree, the ceramic region in the middle (see Figure 4-25) causes the
jet to lose kinetic energy resulting in a maximum Vt that is lower than that achievable with a
solid metal cylinder. The jet diverges into the surrounding layer of softer ceramic before cutting
through the hard CoCrMo alloy and, therefore, loses cutting potential. Two passes at
100 mm/min will cut through more consistently than one pass at 50 mm/min because of the
ceramic region. On the second pass there is no ceramic in the way of the bottom region of the
alloy. However, the standoff distance is also greatly increased, which limits the transverse
speed below that is normally possible
The time for machining a tibial tree with AWJC is approximately 28 minutes, comprising
24 minutes for the parts, 3 minutes for the additional tree cuts and a 1 minute allowance for
robotic movement to position the nozzle. This cycle time is slower than the current system
comprising 3 minutes for cut-off and 18 minutes for gate removal. To equal the current
processing rate for wheel cut-off and grinding, the traverse cutting speed in the optimum
orientation must be approximately 80 mm/min for a gate length of 60 mm (including an
allowance of 3 minutes for additional tree cuts to gain access to parts). The surface finish
obtained from the first cut at 80 mm/min had deep wavy contours resulting in Ra of 8.8 µm and
a corresponding high Rt of 121.0 µm. Towards the end of the cut, the surface quality

79
deteriorated further as a result of increasing standoff distance. It was difficult with AWJC to
achieve a flat surface having the required component process tolerance of 0-1.016 mm gate
height across 20 mm thick gates. The surface finish from the cut (shown in Figure 4-24 b) had a
higher roughness (Ra = 12.8 µm) compared to the current grinding finish (Ra = 3 µm). Three
conditions led to one side of the gate cutting through and the other failing to achieve
separation. The standoff distance increased towards the end of the cut due to the shape of the
gate. The part was held at a slight slope due to warping of the base plate (further increasing the
standoff distance) and the nozzle was set to cut at an angle of 12˚ with the intent of accounting
for lag. Altering the nozzle angle was not necessary as the end of the gate was round. The same
cut at 80 mm/min (in orientation 2) was repeated on the second day with a constant standoff
distance and the nozzle at 90˚. For the second cut at 80 mm/min, the surface finish obtained
was of much higher quality. Here, the Ra was slightly higher at 9.6 µm but Rt was significantly
lower at 55.2 µm (Figure 4-28), compared to Ra of 8.8 µm and Rt of 121.0 µm for the initial cuts.
The surface finish was improved by reducing the traverse rate but this also increased wear
below the cut. Jet divergence beneath the gate caused excessive wear, particularly of the cast
lettering. Removal of the cast lettering is a problem because it is used to differentiate between
product sizes in subsequent foundry processing. Reducing gate size allows for higher cutting
speeds and lowers cycle times. Figure 5-2 shows the variation in gate thickness of tibial
castings. The average gate thickness is 22 mm over a range of different shapes. Decreasing the
gate size may adversely affect the casting dimensions as this would reduce metal shrinkage
near the gates and poses the risk of casting defects such as cold-shut or non-fill. Cold-shut
occurs when two advancing metal fronts solidify before or at the intersection, resulting in a jig-
saw shaped defect. Non-fill relates to incomplete filling of moulds during pour. Changing the
gate dimensions requires a re-validation of the casting dimensions to demonstrate that the
foundry process produces cast parts within specification. A metallurgical evaluation would also
be performed to demonstrate equivalency of the metal grain structure in the casting for a new
gate design.

80
Figure 5- 2: Variation in gate size across range of tray sizes
Jet divergence below the cut would remain a problem if the gate size were reduced. While it
may be possible to improve performance using submerged cutting and sacrificial plates, is it still
insufficient to avoid damage to areas immediately below the bottom of the gate. Thinner gates
would also have sections of the platform above the hole that can be damaged. The jet diverged
horizontally (kerf width increased) at the start and end of tibial cuts and during AWJC of the
30 mm cylinders. The standoff distance was fixed from the top of the workpiece. As the jet
traverses, the standoff distance (s), is at a minimum in the middle but higher at the start and
end of the cut. It may be possible to counteract this effect by moving the nozzle closer to the
part for the middle of the cut length. However, this may increase damage under the hole, an
area that already exhibits detrimental wear.
5.3.2 Process Stability
Variation in surface roughness was observed from day-to-day for the same process settings
(Figure 4-15). Possible reasons for these differences include the level of orifice wear, setting of
the abrasive flow rate, variation in water pressure (Kovacevic, 1991), standoff distance, nozzle
angle and measurement errors. In order to minimise process variation and enable the use of
AWJC in a mass-production environment, a strategy for implementing process monitoring
Gate
size
(mm
)

81
strategies is important. Axinte and Kong (2009) used acoustic emission sensors to supervise
AWJ machining. The sensors were employed to detect anomalous events at both the nozzle and
workpiece. Malfunctions such as nozzle blockages were detected, including partial blockages
and it was also possible to distinguish the differences between full Through-Cut (TC), partial TC
and non-TC conditions.
Clogging of the abrasive supply can cause problems with machine reliability. Clogs can occur
due to excessive volumes of abrasives or when using grits that is too large for a particular
orifice diameter, the presence of large contaminants in the abrasive, or the nozzle tip
contacting the workpiece during piercing or cutting (Day, 2014). It is important that the
abrasive hopper is leak-proof to prevent any water entering should splashback occur during
cutting. Any water that enters the abrasive hopper or feeding system causes the abrasive to
become wet and clump, which results in blockage of the abrasive feed system. Moisture in the
abrasive feed system has to be completely dried before the system will run again. The blockage
has to be cleared from the line and abrasive feed controller using compressed air and possibly
also heated blowers. This can be a time-consuming fix, normally 30-60 minutes. Therefore
precautions should be taken to ensure the abrasive feed system remains dry with measures
including inspection of the abrasive container for cracks, areas of wear or gaps at the joints.
5.3.3 Water Filtration & Tank Cleaning
Water quality is important for the pump and water delivery system. Pump, valve and orifice
damage will occur if even the smallest amount of dirt or contaminant enters the system. It is
essential for incoming water to be filtered to prolong pump life. A large volume of water flows
through the AWJC system. The flow rate increases with increasing pressure. For a pressure of
345 MPa, the water flow rate through a 0.35 mm orifice is 3.46 litres per minute of cutting.
A 0.25 mm orifice uses 1.77 litres per minute. Two cutting heads running 0.25 mm diameter
orifices use the same quantity of water as a single 0.35 mm configuration (WARDJet, 2013b).
Manufacturers typically provide specification for incoming water, which includes a pH range
and limitations regarding dissolved solids for certain ions. Water with Total Dissolved Solids

82
(TDS) less than 100 parts per million normally requires no softening treatment. These dissolved
inorganic solids include calcium, magnesium, iron, manganese, chloride, sulphates and silica.
Incoming hard water requires softening. A very small portion of applications require additional
treatment such as Reverse Osmosis (RO) and de-ionisers. A RO system costs
approximately €20,000, which are recommended where the TDS is greater than 200 ppm.
However, if used unnecessarily, such processes tend to make the water too pure for AWJC and
it can become “ion starved”. In this state, the water absorbs ions from surrounding materials,
such as the metals in the pump and high-pressure plumbing lines. Whilst using RO and de-
ionisers can greatly extend orifice life, it can simultaneously cause very expensive damage to
the intensifier and plumbing. Replacing the orifices is less expensive than replacing the
damaged pump components, i.e. the high-pressure cylinders, check valves, and end caps.
A number of machine tool manufacturers have developed proprietary water filtration systems
(JetEdge 2014; WARDJet 2014b). With a closed-loop filtration system, up to 95% of the
incoming water supply can be reused. Water recycling costs about $2 to $4 per hour to run,
which covers filters and electricity (Day, 2008), which is quite insignificant in comparison with
other AWJC running costs (see Sections 2.4.1 and 5.4). The 5% water that is lost is due to
evaporation and no water goes to drain. The first stage of water recycling is settling of solids.
The waste sludge is comprised of abrasives and metal particles from cutting, as well as any
objects that may have fallen into the water catcher tank. There needs to be sufficient time for
settling of suspended solids, which requires very large settling tanks. Barrier filtration is
accomplished in stages where the particle size is sequentially reduced. Decreasing filter sizes
enables more frequent changing of large filters and less frequent replacement of the more
expensive fine filters. In hot climates/environments a chiller unit may also be required to
ensure delivery of cool water to the pump and cutting system. Sometimes the pump cooling
system operates on a separate circuit and has glycol added to improve efficiency. A chiller unit
would not be necessary in the current post-cast environment. However, a chiller may be
necessary if the AWJC machine were to be located near to the furnace.
83
5.4 Running Costs
As discussed in Section 2.4.1, abrasives comprises 60-80% of the cost of running an AWJC
operation. Other consumables for this process include nozzles, orifices, high-pressure pump
components, low-pressure components and water filters. The consumable cost per hour is
given in Table 5-1, which was provided by WARDJet Inc (OH, USA). Each orifice-nozzle has an
abrasive saturation point, the peak ma. After this point the water flow is insufficient for the
quantity of abrasive particles colliding within the nozzle. This leads to build up of abrasive in the
delivery tube. Large orifices have a higher peak ma, allowing quicker cutting but at the cost of
lower accuracy and higher abrasive cost per hour. Cutting time is increased at low ma. The cost
per unit is higher at low ma because it takes longer to consume labour and overheads. The
optimum ma is the point after which the higher abrasive costs offset the benefits of faster
cutting.

84
Table 5- 1: AWJC consumables cost
Item description Average Life
(Hrs)
List Price
(USD)
Cost per hour
(USD/Hr)
Nozzle 50 $ 85.00 $ 1.70
Diamond Orifice (0.010) 1000 $ 425.00 $ 0.43
Abrasive Cutting Head 2000 $ 340.00 $ 0.17
Mixing Chamber 1000 $ 155.00 $ 0.16
HP Seal Kit 650 $ 95.00 $ 0.15
Check Valve Body 3000 $ 425.00 $ 0.14
On/Off Valve Repair Kit 500 $ 57.00 $ 0.11
Air Actuator 5000 $ 495.00 $ 0.10
HP Cylinder 6000 $ 580.00 $ 0.10
Plunger 11000 $ 1,050.00 $ 0.10
On/Off Valve Body 4000 $ 275.00 $ 0.07
Bleed Down Valve Repair Kit 1575 $ 80.00 $ 0.05
Check Valve Repair Kit 1500 $ 75.00 $ 0.05
Adapter 4000 $ 185.00 $ 0.05
Bleed Down Valve Body 6000 $ 225.00 $ 0.04
Dynamic Seal Backup 1300 $ 40.00 $ 0.03
Seal Housing 6000 $ 165.00 $ 0.03
Spacer Tube 6000 $ 145.00 $ 0.02
Output Adapter 6000 $ 130.00 $ 0.02
AS Plunger Bearing 6000 $ 98.00 $ 0.02
Rod Seal 2000 $ 6.00 $ 0.01

85
5.5 Health & Safety Considerations
The introduction of AWJC for femorals presents an ergonomic benefit as manual grinding would
be removed. The repetitive high-force action of manual grinding operations poses the risk of
carpal tunnel syndrome. Therefore removing this operation is highly beneficial for the
operators wellbeing.
When cutting above water level, significant noise is generated during AWJC. Submerged AWJC
greatly reduces the noise, most of which comes from the jet hitting the water catcher tank. The
noise increases the further away the nozzle is from the water surface. The main drawback of
submerged AWJC is that the view of the operator during cutting is obstructed. Process
monitoring is especially important to ensure that the machine stops automatically should any
faults develop.
Chemicals may need to be added to the tank to prevent bacterial growth. The Omax filtration
system uses an ozone generator to reduce bacteria growth. The sludge produced following
machining has to be periodically removed from the tank. Most manufacturers offer a non-
standard system for automatic sludge removal or tank cleaning. Without a tank cleaning
system, the water must be emptied from the catcher tank and the sludge shovelled out, clearly
a messy and labour intensive process.
5.6 Comparison of AWJC with Current Solution
The current process is described in section 2.1.5. It involves manual abrasive wheel cut-off,
followed by ceramic removal by blasting with stainless steel shot and afterwards the remaining
gate sections are removed by robotic grinding and manual grinding to finish. The proposed
technology is compared with the current solution in Table 5-2. Note that ceramic removal with
AWJC would be performed after cutting. The main benefits of AWJC over the current system
are direct labour savings, removal of manual operations, and reduction of consumables cost
and cycle time. The main disadvantage of AWJC is that it is not suitable for use on tibial castings
due to the current gate size and configuration.

86
Table 5- 2: Comparison of AWJC with the current process
AWJC Current Process (Cut-off and grinding)
Suitability for femoral
castings
Yes Yes
Suitability for tibial
castings
Unsuitable due to current
gate size and configuration
Yes
Number of operations to
remove gates (each
requiring one operator)
One Two
Cycle time 30 seconds per casting 90 seconds per casting
Consumables cost €0.15 per casting €0.20 per casting
Manual operations Not required Manual cut-off (errors lead to scrap) and
manual grinding (ergonomics concern)
5.7 Recommendations for Future Work
Further development of a vision system is required for AWJC to be used for cutting femorals.
This work includes the transformation of the point-clouds captured by the stereovision cameras
to the CAD (Computer Aided Design) models. The optimum number of cameras should be
determined. The transformation algorithms from the vision processing software to the AWJC
controller should be validated by cutting multiple femoral trees of different sizes and varying
amounts of ceramic residue. Testing of the fixture that drops the femoral tree into the water
for submerged cutting should be performed to verify any movement from nominal is minimal
and does not impact cut accuracy.
Tibial gate size reductions and changing gate configuration should be investigated. This could
enable AWJC of tibial castings, as well as resulting in metal savings. Likewise, reduction of
femoral gates sizes would allow faster cutting speeds to be used. Reduction of the thin sections
has a particularly strong benefit. The maximum Vt to obtain a through-cut for the 2 mm plates
was 800 mm/min, which was significantly faster than the maximum Vt for a thickness of 4 mm,

87
which was 470 mm/min. Therefore, reduction of the thickness of the thin femoral sections by
1.2 mm could enable up to 70% faster AWJC speeds.
Further work is required to quantify the degradation of the orifice/nozzle over time.
Process control improvements should be investigated. Acoustic emission could be used for
quality control and optimisation of maintenance schedules.
Cutting at higher pressures has not been performed as part of this work with commercial AWJC
machines available at 90,000 psi. There is an opportunity for a cost-improvement project to
recycle used abrasive. However, abrasive recycling is not possible when cutting at 90,000 psi. As
abrasive recycling is possible at 60,000 psi, it is recommended that further tests be conducted
at 60,000 psi to determine whether higher traverse speeds can be achieved. Further work
would determine whether the cutting volume is sufficient to justify the cost of implementing an
abrasive recycling unit. Alternative abrasives and abrasive suppliers should also be investigated.

88
6. CONCLUSIONS
The research undertaken aimed to determine the feasibility of AWJC as a solution in the
manufacturing of CoCrMo investment castings at DePuy Synthes. The following conclusions
were derived from the results presented in Chapter 4:
• AWJC is a potentially viable alternative to the cut-off and grinding of femoral castings.
The process is capable of cutting through ceramic remains on top of the casting and still
cutting the metal at a reasonable speed.
• AWJC is currently unsuitable for tibial tray castings because the jet wears away the
castings below the cutting region. Further research is recommended to investigate gate
size reduction and re-configuration to enable AWJC of tibials and save metal.
• The traverse speed (Vt) for AWJC CoCrMo castings of circular cross-section to achieve Ra
of <10 µm can be estimated by the equation Vt = 3400.4 (t (mm))−1.176, where t is
material thickness. For rectangular cross-sections, the equation is
Vt = 2186.5 (t (mm))−1.01. For rectangular gates, Vt should be reduced at the end of
the cut to negate the influence of the jet lagging effect.
• Using a traverse speed of 130 mm/min, the surface finish at the bottom of the 16 mm
thick femoral gate was visually equivalent to the current finish after gate removal (Ra of
9 μm).
• The thickest thin femoral sections (3.2 mm) can be cut at 400 mm/min and achieve an
acceptable Ra of 7 µm. This is significant as manual grinding is currently required to
achieve an equivalent finish. The use of AWJC can eliminate this finishing operation,
thereby removing an ergonomic concern.
• The total cycle time per femoral tree was 6 minutes, which equates to a 67% cycle time
reduction compared to the current production process.
• The maximum Vt to obtain a through-cut for the 2 mm plates was 800 mm/min, which
was significantly faster than the maximum Vt for a thickness of 4 mm, which was
470 mm/min. Therefore, reduction of the thickness of the thin femoral sections by just
1.2 mm could potentially enable up to 70% faster AWJC speeds.

89
• Further research is required to develop a vision system to interface with the AWJC
system. The vision system is required to identify the location of individual parts on the
cast tree. It needs to be capable of differentiating the ceramic remains from the cast
components.
90
REFERENCES
AIRCONTROLINDUSTRIESLTD. 2013a. Air Knife Systems [Online]. Available: http://www.aircontrolindustries.com/uk/products/20/air-knife-systems [Accessed 23/Oct/13.
AIRCONTROLINDUSTRIESLTD 2013b. Comparison to compressed air. AIRCONTROLINDUSTRIESLTD 2013c. DRI-Line Series. ASTM 1998. ASTM F75, Standard Specification for Cobalt-28 Chromium-6 Molybdenum Casting
Alloy and Cast Products for Surgical Implants (UNS R30075). AXINTE, D. A. & KONG, M. C. 2009. An integrated monitoring method to supervise waterjet
machining. CIRP Annals - Manufacturing Technology, 58, 303-306. AXINTE, D. A., SRINIVASU, D. S., KONG, M. C. & BUTLER-SMITH, P. W. 2009. Abrasive waterjet
cutting of polycrystalline diamond: A preliminary investigation. International Journal of Machine Tools and Manufacture, 49, 797-803.
AY, M., CAYDAS, U. & HASCALIK, A. 2010. Effect of Traverse Speed on Abrasive Waterjet Machining of Age Hardened Inconel 718 Nickel-Based Superalloy. Materials and Manufacturing Processes, 25, 1160-1165.
BABU, M. & CHETTY, O. 2006. A study on the use of single mesh size abrasives in abrasive waterjet machining. International Journal of Advanced Manufacturing Technology, 29, 532-540.
BOUD, F., CARPENTER, C., FOLKES, J. & SHIPWAY, P. H. 2010. Abrasive waterjet cutting of a titanium alloy: The influence of abrasive morphology and mechanical properties on workpiece grit embedment and cut quality. Journal of Materials Processing Technology, 210, 2197-2205.
CAWLEY, J., METCALF, J. E. P., JONES, A. H., BAND, T. J. & SKUPIEN, D. S. 2003. A tribological study of cobalt chromium molybdenum alloys used in metal-on-metal resurfacing hip arthroplasty. Wear, 255, 999-1006.
COSANSU, G. & COGUN, C. 2012. An investigation on use of colemanite powder as abrasive in abrasive waterjet cutting (AWJC). Journal of Mechanical Science and Technology, 26, 2371-2380.
DAVIES, R. 2013. Knee Replacement [Online]. Available: http://physioworks.com.au/injuries-conditions-1/knee-replacement-knee-arthroplasty [Accessed 15/Jan/14.
EFUNDA. 2014a. Stainless Steel AISI Type 309 [Online]. Available: http://www.efunda.com/materials/alloys/stainless_steels/show_stainless.cfm?ID=AISI_Type_309&prop=all&Page_Title=AISI%20Type%20309 [Accessed 24/Aug/14.
EFUNDA. 2014b. Ti Alloy Ti-6Al-4V [Online]. Available: http://www.efunda.com/materials/alloys/titanium/show_titanium.cfm?ID=T18_AB&prop=all&Page_Title=Ti-6Al-4V [Accessed 24/Aug/14.
FLOW. 2010. 94,000 psi HyperPressure Technology [Online]. Available: http://www.flowwaterjet.com/~/media/pdfs/Brochure/Cutting/94k_HyperPressure_productsheet.ashx [Accessed 26/Nov/13.

91
FLOW. 2013. Waterjet Tips [Online]. Flow International Corporation. Available: http://www.flowwaterjet.com/en/waterjet-technology/waterjet-cutting-tips.aspx [Accessed 11/Mar/13].
GENT, M., MENÉNDEZ, M., TORNO, S., TORAÑO, J. & SCHENK, A. 2012. Experimental evaluation of the physical properties required of abrasives for optimizing waterjet cutting of ductile materials. Wear, 284–285, 43-51.
HASÇALıK, A. & AY, M. 2013. CO2 laser cut quality of Inconel 718 nickel – based superalloy. Optics & Laser Technology, 48, 554-564.
HASCALIK, A., CAYDAS, U. & GURUN, H. 2007. Effect of traverse speed on abrasive waterjet machining of Ti-6Al-4V alloy. Materials & Design, 28, 1953-1957.
HEADLAND MACHINERY PTY LTD. 2015. Myth Buster: Fibre Vs CO2 Lasers [Online]. Headland Machinery Pty Ltd. Available: http://www.headland.com.au/sheet-metal-news/myth-buster-fibre-vs-co2-lasers/ [Accessed 11/Mar/15].
HLAVAC, L. M., HLAVACOVA, I. M., GEMBALOVA, L., KALICINSKY, J., FABIAN, S., MEST'ANEK, J., KMEC, J. & MADR, V. 2009. Experimental method for the investigation of the abrasive water jet cutting quality. Journal of Materials Processing Technology, 209, 6190-6195.
HLOCH, S. & VALICEK, J. 2012. Topographical anomaly on surfaces created by abrasive waterjet. International Journal of Advanced Manufacturing Technology, 59, 593-604.
HOOGSTRATE, A. M., SUSUZLU, T. & KARPUSCHEWSKI, B. 2006. High Performance Cutting with Abrasive Waterjets beyond 400 MPa. CIRP Annals - Manufacturing Technology, 55, 339-342.
HÖSEL, T., MÜLLER, C. & REINECKE, H. 2011. Spark erosive structuring of electrically nonconductive zirconia with an assisting electrode. CIRP Journal of Manufacturing Science and Technology, 4, 357-361.
JEGARAJ, J. J. R. & BABU, N. R. 2005. A strategy for efficient and quality cutting of materials with abrasive waterjets considering the variation in orifice and focusing nozzle diameter. International Journal of Machine Tools and Manufacture, 45, 1443-1450.
KOVACEVIC, R. 1991. Surface texture in abrasive waterjet cutting. Journal of Manufacturing Systems, 10, 32-40.
LABCOWELDING. 2013. Laser Cutting in CT [Online]. Available: http://labcowelding.com/services/laser-cutting-in-ct [Accessed 11/Nov/13.
LEMMA, E., DEAM, R. & CHEN, L. 2005. Maximum depth of cut and mechanics of erosion in AWJ oscillation cutting of ductile materials. Journal of Materials Processing Technology, 160, 188-197.
MAEGERLE. 2014. Flat and Profile Grinding Machines [Online]. Available: http://www.maegerle.com/en/products/mfp-flatandprofilegrinding.html.
MATRIXVISION. 2013. mvIMPACT Match - Pattern matching [Online]. Available: http://www.matrix-vision.com/image-processing-software-mvIMPACT-match.html [Accessed 10/Oct/13.
MICULESCU, M., COSMELEATA, G., BRANZEI, M. & MICULESCU, F. 2008. Thermal diffusivity of materials using flash method applied on CoCr alloys. UPB Scientific Bulletin, 70, 71-81.
MOMBER, A. W., WONG, Y. C., IJ, R. & BUDIDHARMA, E. 2002. Hydrodynamic profiling and grit blasting of low-carbon steel surfaces. Tribology International, 35, 271-281.

92
NANDURI, M., TAGGART, D. G. & KIM, T. J. 2002. The effects of system and geometric parameters on abrasive water jet nozzle wear. International Journal of Machine Tools and Manufacture, 42, 615-623.
NI. 2013. 3D Imaging with NI LabVIEW [Online]. Available: http://www.ni.com/white-paper/14103/en/ [Accessed 02/Dec/13.
NON-FERROUSFOUNDERS'SOCIETY. 2014. Casting Processes and Tooling [Online]. Available: http://www.defensecastingsuppliers.com/defense-contractors-toolkit-home/casting-processes-tooling.aspx [Accessed 15/Jan/14.
PAUL, S., HOOGSTRATE, A. M., VAN LUTTERVELT, C. A. & KALS, H. J. J. 1998. Analytical and experimental modelling of the abrasive water jet cutting of ductile materials. Journal of Materials Processing Technology, 73, 189-199.
PERZEL, V., HLOCH, S., TOZAN, H., YAGIMLI, M. AND HREHA, P. 2011. Comparative analysis of abrasive waterjet (AWJ) technology with selected unconventional manufacturing processes. International Journal of the Physical Sciences, 6, 5587-5593.
PON SELVAN, M. C., RAJU, N. M. & SACHIDANANDA, H. K. 2012. Effects of process parameters on surface roughness in abrasive waterjet cutting of aluminium. Frontiers of Mechanical Engineering.
STEEN, W. & MAZUMDER, J. 2010. Laser Material Processing, Springer. TRUMPF. 2013. TruFlow lasers with up to 10000 Watts [Online]. Available: http://www.trumpf-
laser.com/en/products/co2-lasers/axial-flow-lasers/truflow-10000-w.html [Accessed 11/Nov/13.
WANDERA, C. 2010. PERFORMANCE OF HIGH POWER FIBRE LASER CUTTING OF THICK-SECTION STEEL AND MEDIUM-SECTION ALUMINIUM. Doctor of Science (Technology), Lappeenranta University of Technology.
WANDERA, C., KUJANPAA, V. & SALMINEN, A. 2011. Laser power requirement for cutting thick-section steel and effects of processing parameters on mild steel cut quality. Proceedings of the Institution of Mechanical Engineers Part B-Journal of Engineering Manufacture, 225, 651-661.
WANDERA, C., SALMINEN, A. & KUJANPAA, V. 2009. Inert gas cutting of thick-section stainless steel and medium-section aluminium using a high power fiber laser. Journal of Laser Applications, 21, 154-161.
WARDJET. 2013a. Cutting Characteristics [Online]. Available: http://www.wardjet.com/01-waterjet-cutting-characteristics.html [Accessed 02/Sep/13.
WARDJET. 2013b. Waterjet Relationship Parameters [Online]. Available: http://www.wardjet.com/02-waterjet-relationship-parameters.html [Accessed 22/Oct/13.
YILBAS, B. S. 2004. Laser cutting quality assessment and thermal efficiency analysis. Journal of Materials Processing Technology, 155–156, 2106-2115.
ZELENAK, M., VALICEK, J., KLICH, J. & ZIDKOVA, P. 2012. COMPARISON OF SURFACE ROUGHNESS QUALITY CREATED BY ABRASIVE WATER JET AND CO2 LASER BEAM CUTTING. Tehnicki Vjesnik-Technical Gazette, 19, 481-485.
ZHENG, H. Y., HAN, Z. Z., CHEN, Z. D., CHEN, W. L. & YEO, S. 1996. Quality and cost comparisons between laser and waterjet cutting. Journal of Materials Processing Technology, 62, 294-298.

93
ZLOTNICKI, S. 2013. How much does waterjet cutting cost? [Online]. Available: http://www.esab-cutting.com/the-cnc-cutting-blog/waterjet-cutting/how-much-does-waterjet-cutting-cost.html [Accessed 31/Mar/14 2014].
![map 1[1] VIEW 39 km 44 km 74 km CUT-OFF POINTS BAY CUT-OFF 12h15 Scarborough CUT-OFF 141-100 ATLANTIC OCEAN MISTY CLIFFS 49 km Miller's Point SMITSWINKEL FALSE CUT-OFF POINTS AND TIME](https://img.pdfslide.us/doc/110x75/5ad6a3967f8b9a6b668bf5ed/map-11-view-39-km-44-km-74-km-cut-off-points-bay-cut-off-12h15-scarborough-cut-off.jpg)