Embed Size (px)
Citation preview
Page | i
Alternative Calibration Process for Optical Smoke Detectors
A Major Qualifying Project
submitted to the faculty of
Worcester Polytechnic Institute
In partial fulfillment of the requirements for the
Degree of Bachelor of Science
By:
Maura Killeen and Lauren Giacobbe
In Partnership with:
Jikang (Tony) Cui and Chengliang (Carl) Ye
of Shanghai Jiao Tong University
Date:
August 23, 2012
Advised by:
Professor Yiming (Kevin) Rong

Page | ii
Abstract
Optical smoke detectors must be calibrated in order to accurately determine
obscurity levels. Engineers from Tyco International identified several disadvantages
with previously utilized methods of calibration. This project investigated several
potential improvements to the existing techniques, and developed alternative
methods of calibrating optical smoke detectors. After conducting extensive research
and systematically comparing multiple processes, the method of inserting a reflective
surface with a variable angle of refraction was identified as the most appropriate.
This paper provides justification for that selection.

Page | iii
Acknowledgements
Numerous people provided abundant support and assistance over the course of
this project. In addition to employees of Tyco in Westminster, Massachusetts;
Wizmart in Ningbo, China; and Flextronics in Suzhou, China; the team would like to
thank:
Yiming (Kevin) Rong, Professor of Mechanical Engineering at Worcester
Polytechnic Institute
Lei Zhang, Professor of Mechanical Engineering at Shanghai Jiao Tong University
A.J. Capowski, Chief Engineer, Tyco Fire Protection Products
Bob Lin, Engineering Manager, Tyco International
Justin Tu, Mechanical Engineer, Tyco Fire Protection Products

Page | iv
Authorship
Maura Killeen and Lauren Giacobbe contributed equally to this project.
Page | v
Table of Contents
Abstract .......................................................................................... ii
Acknowledgements ............................................................................. iii
Authorship Page ................................................................................ iv
Table of Contents ............................................................................... v
List of Figures .................................................................................. vii
List of Tables .................................................................................. viii
1.0: Introduction ................................................................................ 1
2.0: Background & Literature Review ........................................................ 3
2.1: Optical Smoke Detectors ................................................................. 3
2.2: Importance of Calibration ................................................................ 5
2.3: Existing Calibration Methods ............................................................. 7
2.4: Calibration Methods for Photoelectric Smoke Sensors Utilized by the Company . 8
2.4.1: Calibration by Means of a Smoke Box Apparatus ................................. 9
2.4.2: The Electronic Calibration Process ............................................... 11
2.5: Specifications for New Calibration Method .......................................... 12
3.0: Methodology .............................................................................. 14
3.1: Exploration of Previously Utilized Calibration Techniques ........................ 14
3.2: Brainstorming of Alternative Calibration Methods .................................. 15
3.3: Selection of the Most Appropriate Calibration Technique ......................... 15
3.4: Development of the Selected Calibration Method .................................. 16
3.4.1: Utilizing CAD Models to Aid in Design Selection ................................ 16
3.4.2: Employing Simulation Software for Angle Selection ........................... 16
3.5: Generation of a Succinct Summary and Recommendations ....................... 17
4.0: Results ..................................................................................... 18
4.1: Brainstorming Process ................................................................... 18
4.1.1: Problem Definition .................................................................. 18
4.1.2: Methods of Redirecting and Reducing Infrared Light .......................... 19
Page | vi
4.2: Brainstormed Methods of Simulating Obscuration .................................. 22
4.2.1: Insertion of a Semi-Opaque Material ............................................. 22
4.2.2: Adjustable Mirror Apparatus ...................................................... 24
4.2.3: Insertion of Polarized Lenses ...................................................... 25
4.3: Selection of Most Appropriate Method ............................................... 27
4.3.1: Assumptions for All Proposed Techniques ....................................... 28
4.3.2: Comparison of Proposed Techniques with Previously Utilized Techniques . 28
4.4: Final Design for Calibration Apparatus ............................................... 30
4.4.1: Housing ............................................................................... 30
4.4.2: Servomechanism .................................................................... 30
4.4.3: Four-bar Linkage .................................................................... 31
4.4.4: Shaft Component ................................................................... 32
4.5: Selection of Mirror Positioning for Simulating Obscuration ........................ 33
4.5.1: Simulation at the Clean Air Value ................................................ 33
4.5.2: Simulation at the Smoke Value ................................................... 35
5.0: Conclusions & Recommendations ...................................................... 37
5.1: Areas of Improvement for Previously Utilized Calibration Techniques .......... 37
5.2: Alternative Calibration Method for Reducing Company Expenditures ........... 38
5.3: Importance of Documentation for Calibration Methods ............................ 38
5.4: Identification of Areas for Future Investigation ..................................... 39
Works Cited .................................................................................... 40
Appendix A: Project Description ............................................................ 42
Appendix B: Basic Specifications for the Given Smoke Detector Model ............... 45
Appendix C: Visio Calibration Flowchart ................................................... 49
Page | vii
List of Figures
Figure 1. Exposed chamber of an optical smoke detector. .................................. 4
Figure 2. Layout of a traditional smoke box. ................................................ 10
Figure 3. Insertion of a semi-opaque material for simulation obscuration. ............. 23
Figure 4. Variable angle mirror apparatus. .................................................. 25
Figure 5. Positioning of polarized lenses. .................................................... 26
Figure 6. Superstructure of the calibration device. ........................................ 30
Figure 7. Servomechanism component of the apparatus. ................................. 31
Figure 8. Aerial view of the four-bar linkage. ............................................... 32
Figure 9. Shaft component of the variable angle mirror apparatus. ..................... 33
Figure 10. Optical simulation for the detector. ............................................. 34
Figure 11. Setup used in the optical simulation. ............................................ 35
Figure 12. Results of the simulation. ......................................................... 36

Page | viii
List of Tables
Table 1. Distribution of tasks and progress concerning documentation. ................ 17
Table 2. Weighed factors utilized to select calibration method. ......................... 29
Page | 1
1.0: Introduction
The functionality of optical smoke detectors is vital for public safety (Baker &
Adams, 1993). Normally, these devices utilize photodiodes housed in dark chambers.
Ventilation through the casing allows the surrounding air to enter. An infrared light-
emitting diode (IRLED) projects a beam parallel to the photodiode. Under clean air
conditions, the refraction from the IRLED onto the photodiode is minimized. However,
an increase in refracted light will raise the output from the photodiode, which can
indicate the presence of obscuring particles. Therefore, an alarm is generated if there
is a prolonged increase in photodiode output (Wizmart engineers, personal
communication, 25 June 2012). Determining the value at which an alarm should be
generated is crucial. False alarms resulting from overly sensitive devices can result in
decreased significance and inconvenience; delayed alarms in actual emergencies can
prevent responsive action and result in property damage, injuries, and death
(Dubivsky & Bukowski, 1989).
In order to ensure that the alarm is initiated at an appropriate level of
obscuration, optical smoke detectors must be calibrated (United Nations Industrial
Development Organization, 2006). The most common method of accomplishing this is
to determine what value the assembled smoke detector will output at a specific
obscurity. This value can be identified by placing the device in a chamber with a
simulated obscurity; the output can then be recorded (A.J. Capowski, personal
communication, February 9, 2012). This value can then be compared to the output in
clean air, and the resulting offset can be used to adjust the sensor (Mi & Rattman,
2009).
Page | 2
Tyco Fire and Security, a major producer of smoke detection instruments, has
requested an improved calibration method. Details can be seen in Appendix A. While
their “smoke boxes” accurately simulate obscurity, this process requires extensive
control systems including ventilation. The company has developed electronic
calibration stations, which temporarily replace the external cover of an assembled
sensor and simulate refraction using additional IRLEDs. These devices have worked
well, but are aging and will soon have to be replaced. Tyco International would like to
use this opportunity to explore areas for improvement in the calibration process,
including lowering expenses, increasing accuracy, reducing number of control
systems, decreasing completion time, and increasing throughput during
manufacturing, as noted in the project description in Appendix A.
The overarching goal of this product is to aid Tyco International in the
development of a calibration process that addresses these requests. We hope to
accomplish this by researching and investigating currently utilized calibration
techniques, analyzing these processes, comparing these to any potentially feasible
new methods, and selecting one or more processes for further development. After
defining the most appropriate calibration technique(s), we will present our findings
and recommendations to Tyco to facilitate their design processes.
Page | 3
2.0: Background & Literature Review
In this chapter, relevant information concerning optical smoke detectors and
their calibration is discussed. The first section details optical smoke detectors and
their functionality. In section two, the importance of ensuring accurate calibration of
optical smoke detectors is addressed. Section three summarizes calibration
techniques that are currently utilized in industry. In section four, the methods
utilized by the company are identified. Finally, section five discusses the Tyco
International specifications for an improved calibration method.
2.1: Optical Smoke Detectors
For this project, the focus will be on photoelectric light scattering smoke
detectors, which utilize a light source in order to detect obscuration (System Sensor,
n.d.). In Appendix B it is stated that photoelectric smoke detectors, also known as
optical smoke detectors, primarily detect slow-burning fires such as overheating
cables; ion chambers are more appropriate for rapidly spreading fires (“Smoke Alarm
Roundup”, 2008).
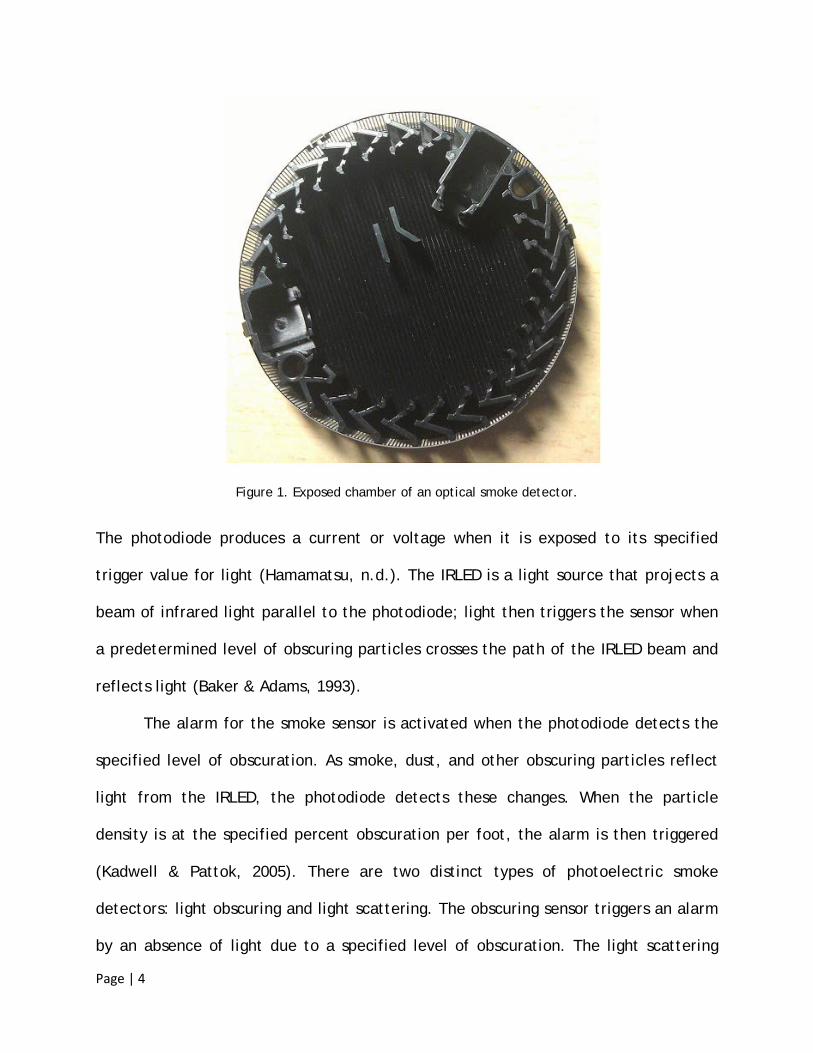
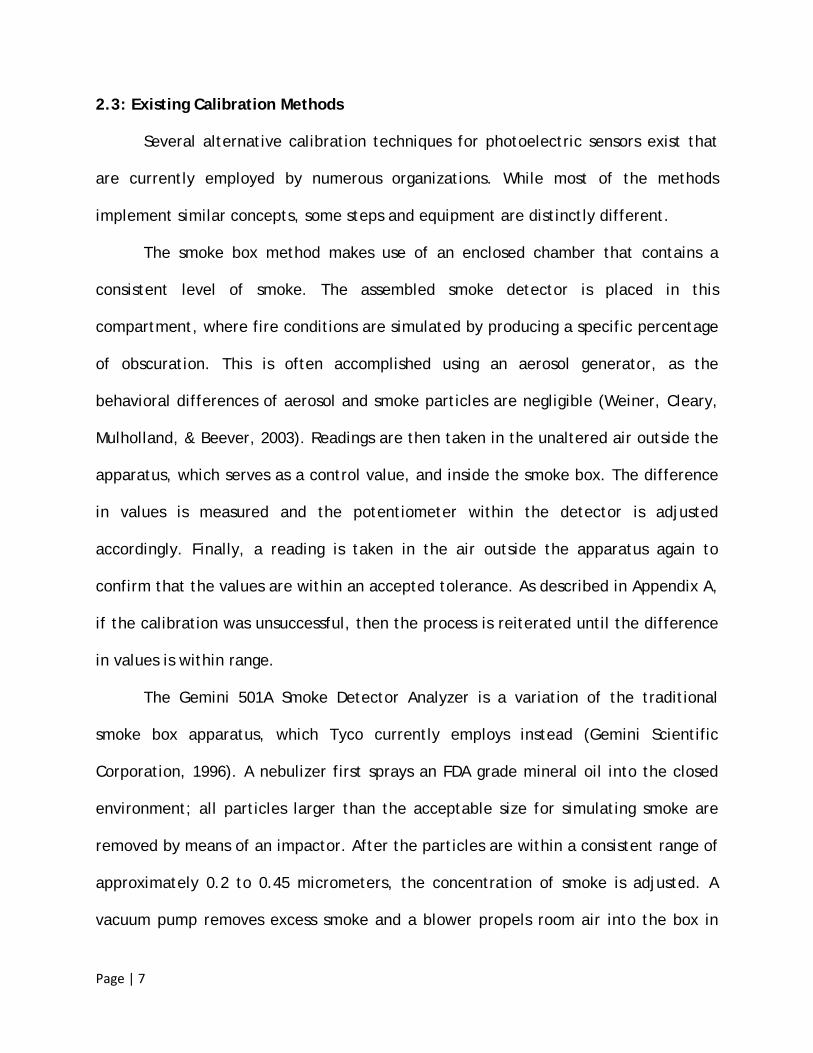
All photoelectric smoke sensors require a chamber, a photodiode, and an IRLED
(infrared light-emitting diode). The chamber is the space inside the smoke detector
that is not exposed to any light, but ventilation allows obscuring particles from the air
to enter, as seen in Figure 1 (Wizmart engineers, personal communication, 25 June
2012).
Page | 4
Figure 1. Exposed chamber of an optical smoke detector.
The photodiode produces a current or voltage when it is exposed to its specified
trigger value for light (Hamamatsu, n.d.). The IRLED is a light source that projects a
beam of infrared light parallel to the photodiode; light then triggers the sensor when
a predetermined level of obscuring particles crosses the path of the IRLED beam and
reflects light (Baker & Adams, 1993).
The alarm for the smoke sensor is activated when the photodiode detects the
specified level of obscuration. As smoke, dust, and other obscuring particles reflect
light from the IRLED, the photodiode detects these changes. When the particle
density is at the specified percent obscuration per foot, the alarm is then triggered
(Kadwell & Pattok, 2005). There are two distinct types of photoelectric smoke
detectors: light obscuring and light scattering. The obscuring sensor triggers an alarm
by an absence of light due to a specified level of obscuration. The light scattering
Page | 5
photoelectric smoke detector triggers an alarm when smoke particles reflect light
from the IRLED onto the photodiode; this is the model for which Tyco has requested a
new calibration method.
A large range of percent obscuration per foot values are used for optical smoke
sensors. As the National Institute of Standards and Technology (NIST) notes,
manufacturers often design smoke sensors to detect as wide a range as possible in
order to facilitate calibration (Dubivsky & Bukowski, 1989). However, the devices are
most frequently set to values ranging from 1 to 3% obscuration per foot. Additionally,
most public and private organizations do not set sensitivity any lower than 0.6%
obscuration per foot, so as to avoid excessive false alarms (Duke University, 2006).
The National Institute of Standards and Technology lists approximately 1.01%
obscuration per foot, 2.01% obscuration per foot, and 2.99% obscuration per foot as
the high, middle, and low sensitivity settings, respectively (Cleary, 2009). For this
project, Tyco has suggested 3% obscuration per foot as the target number (see
Appendix A). A random sampling of smoke detectors yields a dominant result of
approximately 2.6-3.6% obscuration per foot, which confirms the company standard as
a relatively common choice (Shapiro, 1994).
2.2: Importance of Calibration
A proper calibration method is vital to ensure that each smoke detector is
accurate and reliable (United Nations Industrial Development Organization, 2006).
Additionally, initial calibration in the factory is required by the UL 268 regulation, a
publication by the nonprofit safety organization UL (Gentex, 1998; UL LCC, n.d.). This
Page | 6
rule is enforced by UL representatives testing random samples from the company on
an annual basis (Dungan, 2007). According to the United Nations Industrial
Development Organization, calibration is defined as a set of operations that establish
the relationship between values indicated by the instrument, a separate measuring
system, and the corresponding known values. This process is necessary in order to
guarantee traceability, or that all smoke detectors will output consistently
corresponding values which meet reference standards.
The National Fire Protection Association, a nonprofit organization dedicated to
outlining safe practices for fire safety, outlines the importance of smoke sensor
calibration in their NFPA 72 publication. Manufacturing differences and other
variables such as dust or dirt can alter the sensitivity of the sensor (System Sensor,
2010). Common manufacturing variations include photodiode sensitivity, IRLED
strength, and imperfections in the sensor chamber (Wizmart engineers, personal
communication, 25 June 2012). Failing to properly calibrate the sensor can result in
either lack of functionality (less sensitivity) or excessive false alarms (more
sensitivity). Therefore, it is imperative that each smoke detector is calibrated
according to each respective manufacturer.
It is also important to use a viable calibration technique. For example, canned
smoke or an aerosol chemical spray may be arbitrarily sprayed to test the
functionality of the smoke detector. However, utilizing an unmeasured concentration
can produce random or inconsistent results, as the NFPA notes (National Fire
Protection Association, 2010).
Page | 7
2.3: Existing Calibration Methods
Several alternative calibration techniques for photoelectric sensors exist that
are currently employed by numerous organizations. While most of the methods
implement similar concepts, some steps and equipment are distinctly different.
The smoke box method makes use of an enclosed chamber that contains a
consistent level of smoke. The assembled smoke detector is placed in this
compartment, where fire conditions are simulated by producing a specific percentage
of obscuration. This is often accomplished using an aerosol generator, as the
behavioral differences of aerosol and smoke particles are negligible (Weiner, Cleary,
Mulholland, & Beever, 2003). Readings are then taken in the unaltered air outside the
apparatus, which serves as a control value, and inside the smoke box. The difference
in values is measured and the potentiometer within the detector is adjusted
accordingly. Finally, a reading is taken in the air outside the apparatus again to
confirm that the values are within an accepted tolerance. As described in Appendix A,
if the calibration was unsuccessful, then the process is reiterated until the difference
in values is within range.
The Gemini 501A Smoke Detector Analyzer is a variation of the traditional
smoke box apparatus, which Tyco currently employs instead (Gemini Scientific
Corporation, 1996). A nebulizer first sprays an FDA grade mineral oil into the closed
environment; all particles larger than the acceptable size for simulating smoke are
removed by means of an impactor. After the particles are within a consistent range of
approximately 0.2 to 0.45 micrometers, the concentration of smoke is adjusted. A
vacuum pump removes excess smoke and a blower propels room air into the box in
Page | 8
order to reduce the level of obscuration. This design is preferential due to the
harmless nature of the particulates; a common concern with smoke box calibration is
the hazard of exposing the surrounding environment to smoke. Many smaller
organizations and laboratories choose this product for individual calibration needs
(Brown & Vickers, 1995). For example, Meridian photoelectric smoke detectors are
calibration with the Gemini 501A in order to ensure accuracy and prove safety before
distributing their products to the public (Digital Security Controls, 1996).
Another similar product is the AW Technology 1900 optical detector calibration
tunnel (AW Technology, 2010). This calibration instrument utilizes aerosol in a
contained environment that is easily controlled by means of a computer. After the
tunnel stabilizes at the desired percent obscuration, the calibration may be
completed for each batch of smoke detectors in approximately three minutes with an
optical scatter smoke sensor. As a result, this adaption of the smoke box apparatus
facilitates calibration and improves efficiency.
2.4: Calibration Methods for Photoelectric Smoke Sensors Utilized by the Company
Due to manufactured differences, a calibration process is necessary for each
photoelectric smoke sensor in order to ensure that obscuration levels are consistently
detected and that industry standards are met (United Nations Industrial Development
Organization, 2006; Dungan, 2007). Tyco currently utilizes two techniques for
calibrating sensors: the smoke box method and the electronic calibration method
(A.J. Capowski, personal communication, February 9, 2012).
Page | 9
2.4.1: Calibration by Means of a Smoke Box Apparatus
Multiple smoke box calibration stations are currently utilized at Wizmart, an
important manufacturer for Tyco located in Ningbo, China. Initially, one basic station
is utilized for calibration of every manufactured product that passes through the
factory. Afterward, two more accurate testing stations, the UL Smoke Testing Box ESD
C01 and the Lorenz Test-tunnel EN54-5/7, verify if random samples pass American and
European standards, respectively. The UL Smoke Testing Box is more accurate than
the generic smoke box, but can take up to three hours to complete one test. The
Lorenz Test-tunnel is the most accurate apparatus in the factory, but it is a
multimillion-dollar machine that is costly to maintain and replace. Therefore, only
the less accurate smoke box is employed on a regular basis in order to control cost
and time consumption (Wizmart engineers, personal communication, 25 June 2012).
For accurate and consistent calibration of smoke detectors, the environment
inside the box must be maintained at a known obscuration. Six different materials are
consecutively burned inside the box to simulate 3 percent obscuration per foot.
During these six trials, the software pauses until there is an appropriate amount of
smoke and clean air is introduced if the obscuration becomes too elevated. After a
stable environment is produced, a densitometer, or a calibrated smoke detector, is
inserted into the smoke box in order to determine the obscuration and whether a
calibration is appropriate at that level (Wizmart engineers, personal communication,
25 June 2012).
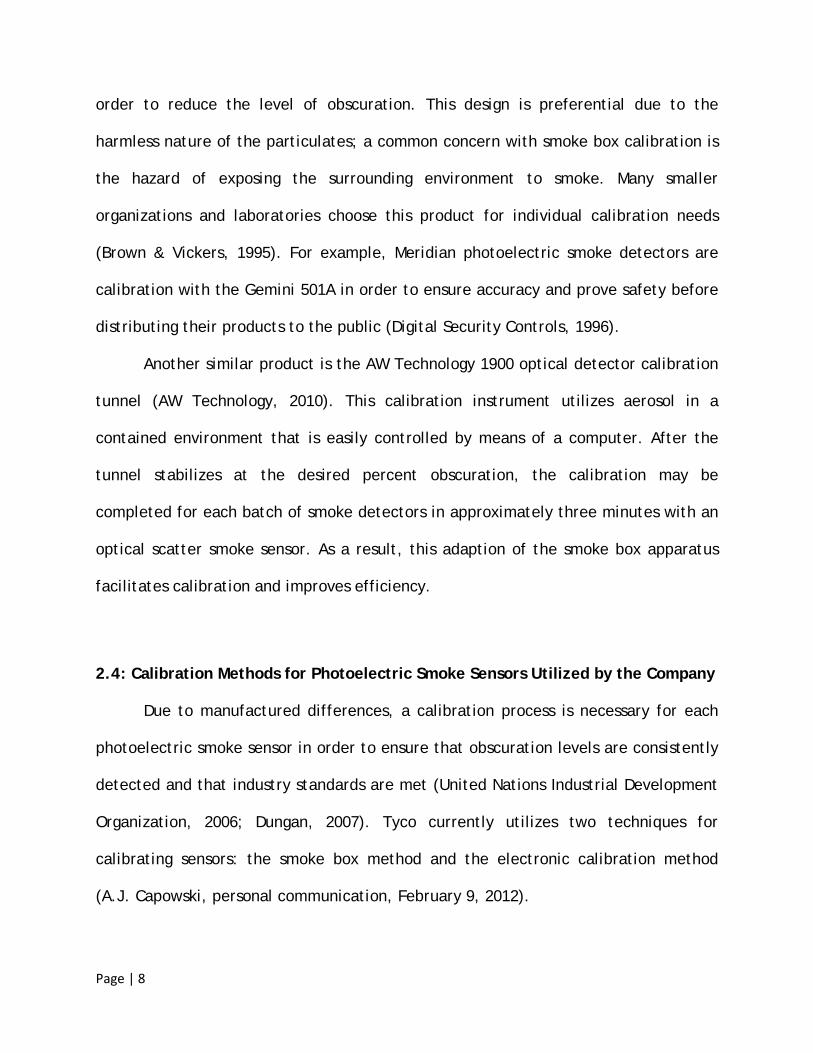
WizMart engineers follow a systematic method for the smoke box calibration
station. First, a clean air value (CAV) is defined as the photodiode output for the

Page | 10
uncalibrated product before it enters the controlled environment. After the
environment inside the box has been adjusted to represent 3% obscuration per foot,
the output value of the photodiode inside of the box is recorded (3SV). A delta value
(DV), or the difference between the CAV and the 3SV, is then calculated. If the values
are not in range, a potentiometer is adjusted in order to alter the outputs (Wizmart
engineers, personal communication, 25 June 2012). The basic layout of a smoke box
may be seen in Figure 2.
Figure 2. Layout of a traditional smoke box.
While the smoke box method of calibration is an accurate standby for most fire
protection companies such as Tyco, there are several drawbacks. The process of
physically simulating an accurate level of obscuration and completing the calibration
requires a much longer period of time than electronic calibration. Additionally, the
obscuring agent inside the apparatus must be consistently maintained at 3%
Page | 11
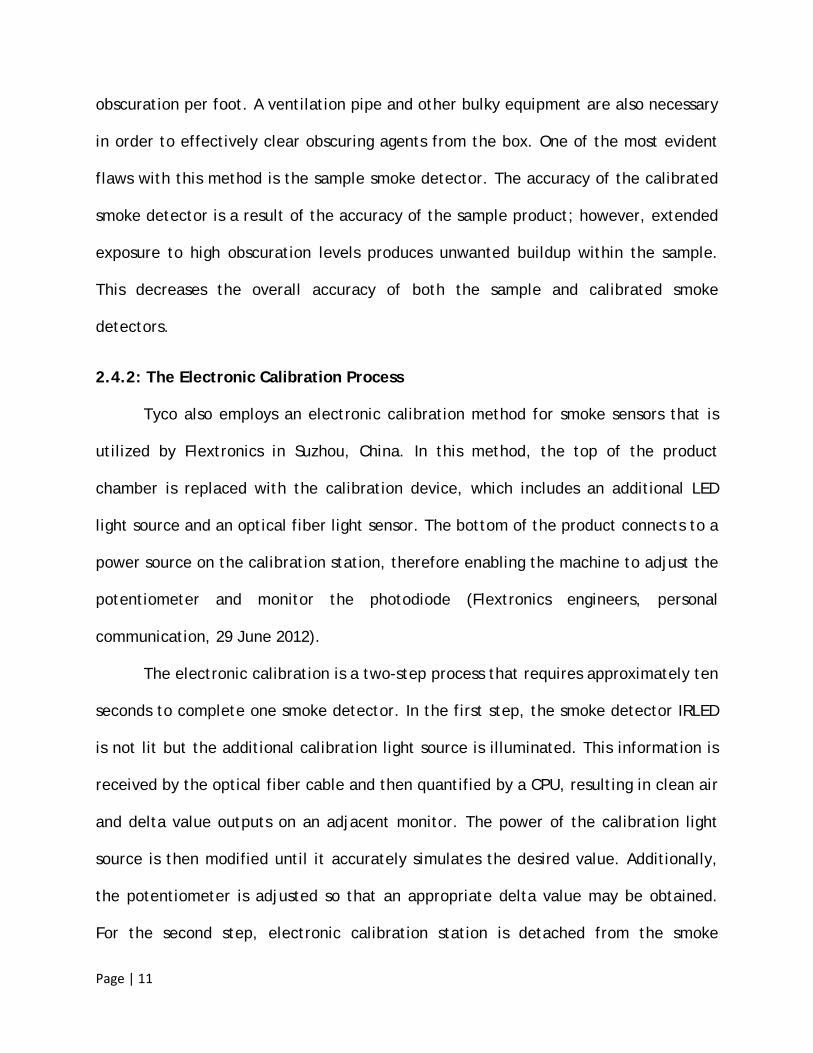
obscuration per foot. A ventilation pipe and other bulky equipment are also necessary
in order to effectively clear obscuring agents from the box. One of the most evident
flaws with this method is the sample smoke detector. The accuracy of the calibrated
smoke detector is a result of the accuracy of the sample product; however, extended
exposure to high obscuration levels produces unwanted buildup within the sample.
This decreases the overall accuracy of both the sample and calibrated smoke
detectors.
2.4.2: The Electronic Calibration Process
Tyco also employs an electronic calibration method for smoke sensors that is
utilized by Flextronics in Suzhou, China. In this method, the top of the product
chamber is replaced with the calibration device, which includes an additional LED
light source and an optical fiber light sensor. The bottom of the product connects to a
power source on the calibration station, therefore enabling the machine to adjust the
potentiometer and monitor the photodiode (Flextronics engineers, personal
communication, 29 June 2012).
The electronic calibration is a two-step process that requires approximately ten
seconds to complete one smoke detector. In the first step, the smoke detector IRLED
is not lit but the additional calibration light source is illuminated. This information is
received by the optical fiber cable and then quantified by a CPU, resulting in clean air
and delta value outputs on an adjacent monitor. The power of the calibration light
source is then modified until it accurately simulates the desired value. Additionally,
the potentiometer is adjusted so that an appropriate delta value may be obtained.
For the second step, electronic calibration station is detached from the smoke
Page | 12
detector, and the product is reassembled. After this process is complete, a clean air
value is measured and the operator may determine whether or not the smoke
detector is acceptably calibrated (Flextronics engineers, personal communication, 29
June 2012).
Conversely, the electronic process is less accurate than the smoke box method.
Of the electronically calibrated products that are randomly tested in a UL certified
smoke box, approximately 1% fail to function correctly. This error is commonly
attributed to faulty photodiodes in the products (Flextronics engineers, personal
communication, 29 June 2012). As a result, some organizations do not recommend
electronic calibration as a sufficient calibration method (Washington State Patrol Fire
Protection Bureau Inspection Station, n.d.). While the electronic calibration
technique is faster, the project description conveys that it is also significantly more
expensive and replacing or updating the aging equipment is costly.
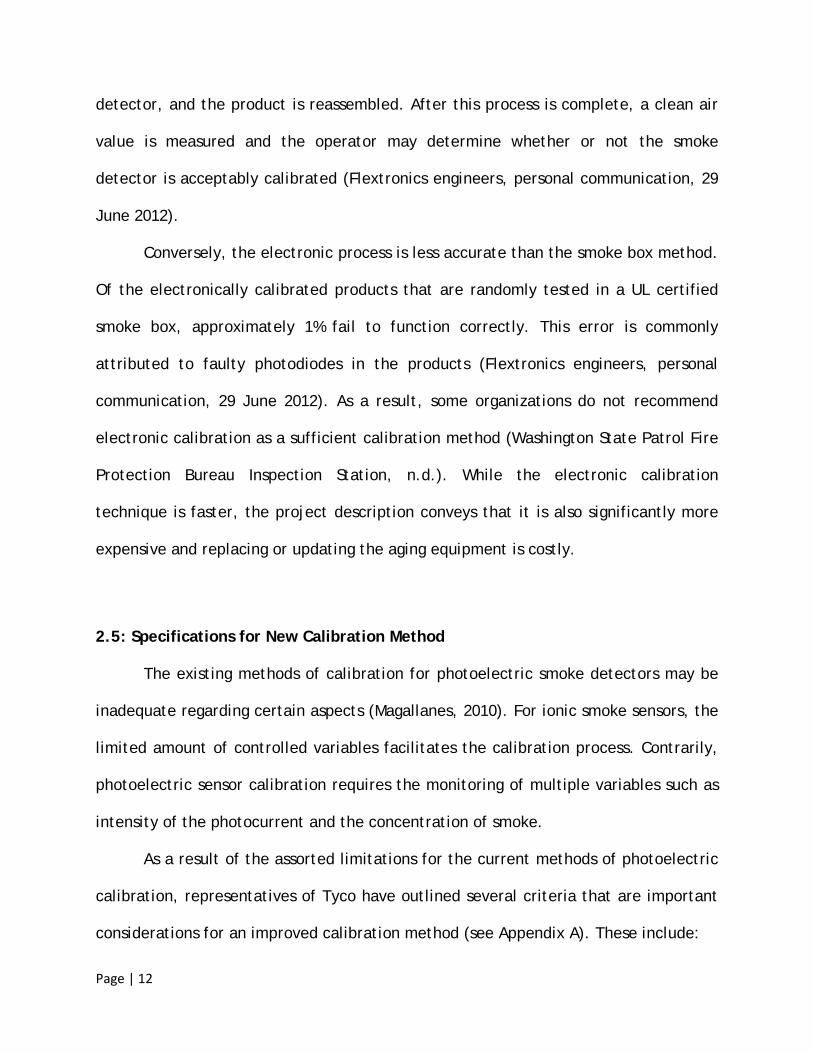
2.5: Specifications for New Calibration Method
The existing methods of calibration for photoelectric smoke detectors may be
inadequate regarding certain aspects (Magallanes, 2010). For ionic smoke sensors, the
limited amount of controlled variables facilitates the calibration process. Contrarily,
photoelectric sensor calibration requires the monitoring of multiple variables such as
intensity of the photocurrent and the concentration of smoke.
As a result of the assorted limitations for the current methods of photoelectric
calibration, representatives of Tyco have outlined several criteria that are important
considerations for an improved calibration method (see Appendix A). These include:

Page | 13
• Affordable cost
• Accuracy
• Fewer control systems
• Shorter timeframe
• Higher throughput during manufacturing
This new technique will combine the strongest aspects of the various existing
calibration methods. For example, smoke box calibration is accurate but slower than
other methods; similarly, electronic calibration requires fewer control systems but is
more expensive. There is a need for a calibration technique that will integrate all of
the positive aspects and minimize the current limitations.
Page | 14
3.0: Methodology
In this chapter, a discussion of the methods utilized to achieve the stated
project objectives is presented. In section one, the tasks that the team completed to
sufficiently investigate existing calibration techniques are discussed. The process for
brainstorming alternative calibration methods is then detailed in the second section.
In the third section, a discussion of the methods used to brainstorm alternative
techniques is presented. Actions completed to develop the selected method are also
reviewed in section four. In the fifth section, the process utilized to present these
results and recommendations to Tyco International is discussed.
3.1: Exploration of Previously Utilized Calibration Techniques
Before the team considered alternative techniques for the company, it was
necessary to gain a thorough understanding of the existing calibration methods. The
team completed extensive preliminary research concerning the basic functionality of
optical smoke detectors and common methods of calibration. The team also reviewed
several calibration patents regarding optical smoke detectors from both Tyco
International and similar organizations. The Tyco subsidiary SimplexGrinnell, located
in Westminster, Massachusetts, was visited and engineers were interviewed in order
to better understand the equipment and processes employed in the smoke box
calibration technique. The companies Wizmart Technology Inc. in Ningbo, PRC and
Flextronics International Ltd. in Suzhou, PRC were also visited and interviewed were

Page | 15
conducted in order to gather information about the smoke box and electronic
calibration methods, respectively.
3.2: Brainstorming of Alternative Calibration Methods
The team implemented a systematic approach for devising potential calibration
methods. As a group, the team collectively brainstormed several options for
addressing current disadvantages and improving detector calibration. The scope of
the alternative techniques was then narrowed down to account for idea feasibility,
project timeframe, and available resources. Each team member then individually
formulated a solution that incorporated one or more of the elements discussed in the
group brainstorming process, and the team examined these new methods.
3.3: Selection of the Most Appropriate Calibration Technique
After the team obtained a thorough understanding of all existing calibration
techniques and possible alternatives, the evaluation process was initiated. A side-by-
side comparison of benefits and disadvantages of existing and alternative calibration
methods was generated. The criteria provided by the company and additional factors
generated by the group were also documented and compared. Each criterion was
assigned a weighted factor in order of company priorities, and each technique was
quantified in a design matrix. The calibration method with the highest value was then
selected as the most appropriate option to fulfill the criteria specified by Tyco
International.
Page | 16
3.4: Development of the Selected Calibration Method
Multiple processes were utilized in the development process of the chosen
calibration technique. These fundamental procedures included the employment of
CAD models and simulation software in order to refine and improve the design.
3.4.1: Utilizing CAD Models to Aid in Design Selection
Initially, the team produced preliminary sketches after discussion of the
rudimentary apparatus. These designs were then detailed in CAD models and modified
as the team identified flaws or areas for improvement. Among other considerations,
stability and minimalism were notable aspects when the most appropriate design for
the calibration device was being selected. After multiple iterations and several
modifications, a final design was unanimously chosen.
3.4.2: Employing Simulation Software for Angle Selection
For the selected variable angle mirror method, optical simulation software was
utilized to determine the mirror positioning that most accurately simulated 3 percent
per foot obscuration. Assuming that the light received by the photodiode was
proportional to the voltage output, an LED was inserted into the simulated chamber
and optical parameters were set. The resulting number was used as the zero value.
For simulating the 3 percent per foot obscuration, the team inserted one fixed and
one variable angle mirror into the chamber. When the mirrors were parallel, the
angle was adjusted to zero. When the mirror rotated clockwise, the angles were
determined to be negative. Correspondingly, angles were determined to be positive
when the mirror rotated counterclockwise. The simulation was then completed with

Page | 17
the given parameters and the angles best replicating the specified obscuration were
identified.
3.5: Generation of a Succinct Summary and Recommendations
Throughout the course of the project, the team concurrently documented all
pertinent progress, as seen in Table 1. A final report including a detailed summary of
all research, results, conclusions, and recommendations was generated and provided
to Tyco International. This material was then succinctly summarized in a Powerpoint
presentation that was delivered to the Tyco CEO Mr. George Oliver and other
concerned parties. The team also conducted a presentation, consisting of an overview
of this content, to an audience containing engineers and Tyco representatives.
Table 1. Distribution of tasks and progress concerning documentation.

Page | 18
4.0: Results
In this chapter, a detailed summary of the development of an alternative
calibration process for optical smoke detectors is presented. Justification for
decisions made during the brainstorming process will be provided in section one.
Section two contains brief descriptions of several proposed calibration methods. The
third section outlines the comparison process used to select the most appropriate
technique. In section four, the final design for the chosen calibration technique is
detailed. Section five reviews the outcomes of the simulations utilized in order to
select optimal mirror positioning.
4.1: Brainstorming Process
4.1.1: Problem Definition
The first efforts from the project team’s brainstorming process were devoted
to narrowing the focus of the stated problem. While the request for an alternative
method of calibration is extremely broad, the team hoped to collaborate on the
improvement of a specific section of the existing process.
Limiting factors such as project resources and timeframe, as well as abilities of
project team members, were considered. During brainstorming, there was a lack of
detailed information on certain portions of the calibration processes, such as the
functionality of the electronic calibration stations, or voltage outputs from the
photodiode at various stages of calibration. Because of the limited timeframe during
Page | 19
which the project was completed, team members agreed to proceed as if this
information was not available. The project team comprised mechanical engineering
students, so potential improvements focusing on electronic or software components
were disregarded.
The project team concluded that the alternative calibration technique should
redirect a reduced portion of the output from the IRLED into the photodiode in order
to simulate the desired level of obscuration. By simulating a known obscurity without
the use of ventilation, a new calibration technique could achieve many of the
advantages of the electronic calibration process. The alternative method could
potentially utilize many of the components from the existing process, such as the
software for photodiode measurement and the potentiometer adjustment system.
However, the project team could reduce the cost and number of control systems by
calibrating with light from each detector’s installed IRLED, instead of inserting a new
light source. This approach also enables the new calibration process to account for
minor differences between various detectors’ IRLEDs, which only the smoke box
method currently does.
4.1.2: Methods of Redirecting and Reducing Infrared Light
The team brainstormed several potential methods of redirecting and/or
reducing the light from the IRLED. Prior to organizing these approaches into formal
calibration techniques, research was conducted on each topic in order to explore
potential applications.
• Semi-Opaque Materials
Page | 20
• Polarizers
• Apertures
• Mirrors
• Lenses
• Fiber Optical Cables
Each of these potential methods of light reduction and redirection were considered
and discussed. Team members then spent a brief period of time working
independently to develop separate, complete methods of reducing IRLED output by a
desired amount, and then directing that reduced light into the photodiode.
4.1.2.1: Semi-Opaque Materials
One explored technique of simulating obscuration was the insertion of a semi-
opaque material. The material would be attached to a calibration cover, which would
have the piece positioned such that the IRLED would be obscured by a specific
opacity. For this method, the team investigated numerous materials in search of an
affordable material that could be manufactured at various opacities. Polycarbonate
was identified as an inexpensive, durable semi-opaque material for insertion into the
chamber.
4.1.2.2: Polarizers
The team also researched the use of polarizers for obscuration purposes.
Specifically, a set of two linear polarizers could be adjusted to simulate different
levels of obscuration. If one polarizer remained in a static position while another was
rotated, the amount of light being transmitted would be altered. The level of
Page | 21
obstructed light could be adjusted to represent 3% obscuration per foot; unlike the
constant obscuration of a semi-opaque material, multiple trials of different opacities
would not be required.
4.1.2.3: Apertures
The team investigated the use of apertures as an alternate method of
controlling the amount of transmitted light. The aperture could be easily widened or
narrowed to expose the photodiode to either an increased or decreased amount of
IRLED light, respectively. A disadvantage of this option included acquisition of an
appropriate device for insertion into the chamber; with limited time and resources,
this obscuration method was not the most feasible option.
4.1.2.4: Mirrors
A system of mirrors was explored as an alternative to the currently utilized
methods of redirecting and reducing light from the IRLED. Similar to the insertion of
polarizers, one mirror would remain motionless while the other mirror was adjusted in
increments. As the mechanical system altered the angle of the adjustable mirror, the
amount of light being redirected to the photodiode could be controlled to simulate
the desired 3% obscuration per foot.
4.1.2.5: Lenses
When exploring numerous options for adjusting the amount of light being
received by the photodiode, the team considered the implementation of lenses. By
utilizing the level of curvature for the manufactured lens, a specific amount of light
from the smoke detector IRLED could be redirected. However, the team observed that
Page | 22
a potential disadvantage was the necessity to manufacture several lenses in order to
select a curvature that accurately simulated light redirection at 3% obscuration per
foot.
4.1.2.6: Fiber Optical Cables
Fiber optical cables were also investigated as a method of controlling the
amount of light being transmitted to the photodiode. These cables were employed in
the previously utilized electronic calibration technique in order to detect the amount
of light that was transmitted from the calibration station light source. An improved
method would incorporate fiber optic cables to facilitate the sustainment of known
obscurity; using the cables, the amount of light being redirected in the chamber could
be maintained at a level simulating 3% obscuration per foot.
4.2: Brainstormed Methods of Simulating Obscuration
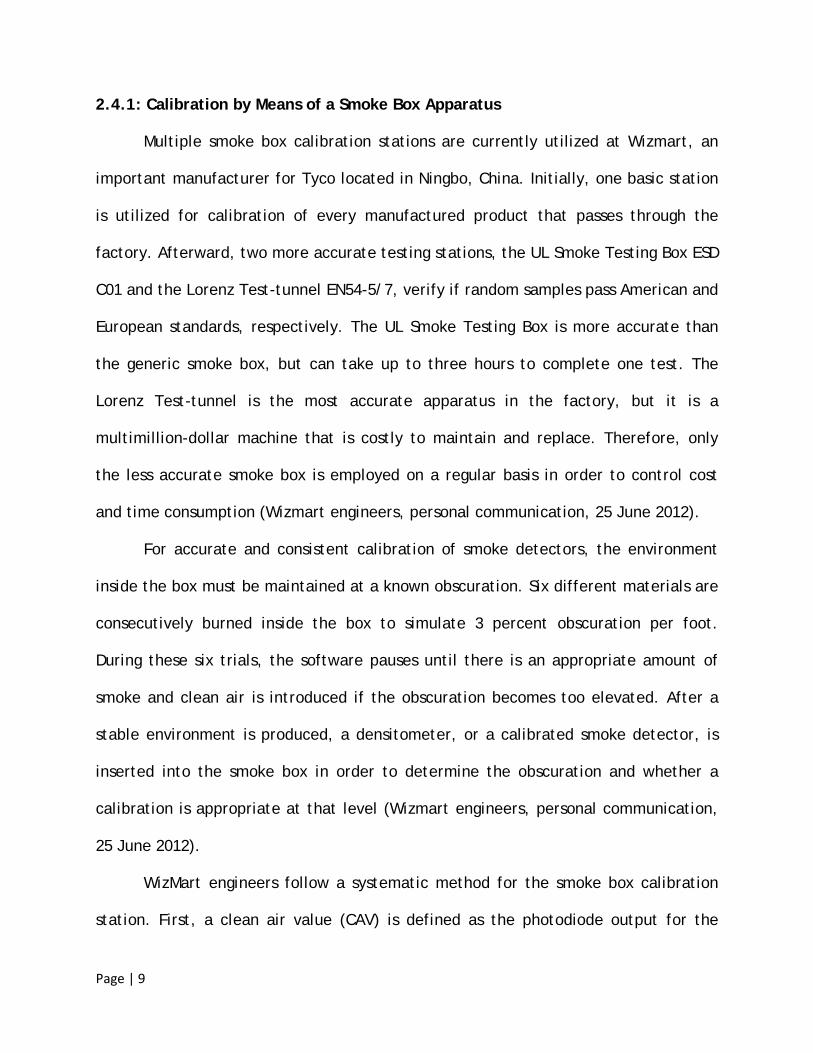
4.2.1: Insertion of a Semi-Opaque Material
One possibility that the project team discussed was the design of a calibration
system that utilized a semi-opaque material to simulate a known obscurity. As
suggested in one of the Tyco project descriptions (see Appendix A), a sample of
material that refracted light in a manner similar to smoke could be inserted into the
sensor chamber during calibration.
Before the calibration cover is attached to the smoke detector, the untested
product would be attached to the electronic base identical to the one used in the

Page | 23
current electronic calibration method. Voltage outputs from the photodiode would
then be converted to quantitative values representing the amount of obscuration in
clean air; this clean air value would then be recorded. Next, the cover of the smoke
detector would be replaced with a calibration cover. The calibration apparatus would
resemble a normal cover, with the exception being a polycarbonate lens would be
strategically attached to partially obscure the light traveling from the IRLED to the
photodiode. This arrangement can be seen in Figure 3.
Figure 3. Insertion of a semi-opaque material for simulation obscuration.
Another voltage reading is recorded and converted to a quantitative output that
represents the amount of light received from the photodiode at 3% obscuration per
foot. The difference between the 3% and clean air values, also known as the delta
value, could then be observed. The potentiometer would be automatically adjusted
depending on where the delta value is in relation to the acceptable range.
Afterward, the smoke detector would be tested once more in order to confirm that
Page | 24
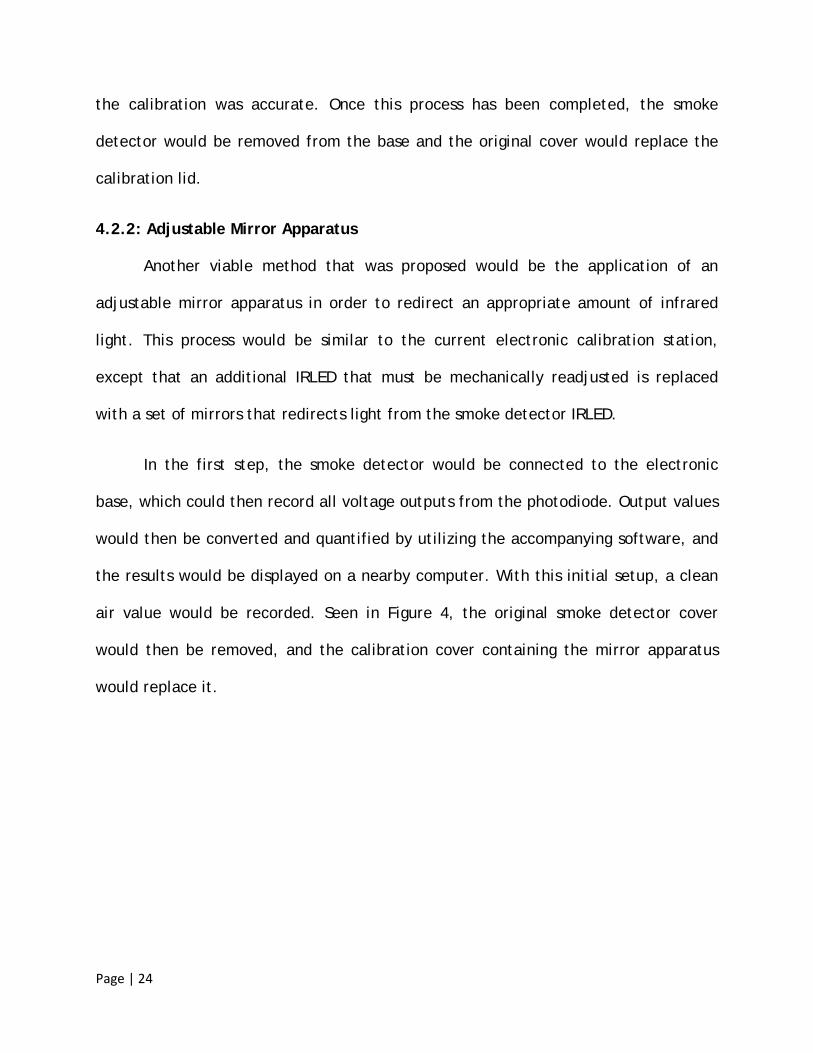
the calibration was accurate. Once this process has been completed, the smoke
detector would be removed from the base and the original cover would replace the
calibration lid.
4.2.2: Adjustable Mirror Apparatus
Another viable method that was proposed would be the application of an
adjustable mirror apparatus in order to redirect an appropriate amount of infrared
light. This process would be similar to the current electronic calibration station,
except that an additional IRLED that must be mechanically readjusted is replaced
with a set of mirrors that redirects light from the smoke detector IRLED.
In the first step, the smoke detector would be connected to the electronic
base, which could then record all voltage outputs from the photodiode. Output values
would then be converted and quantified by utilizing the accompanying software, and
the results would be displayed on a nearby computer. With this initial setup, a clean
air value would be recorded. Seen in Figure 4, the original smoke detector cover
would then be removed, and the calibration cover containing the mirror apparatus
would replace it.
Page | 25
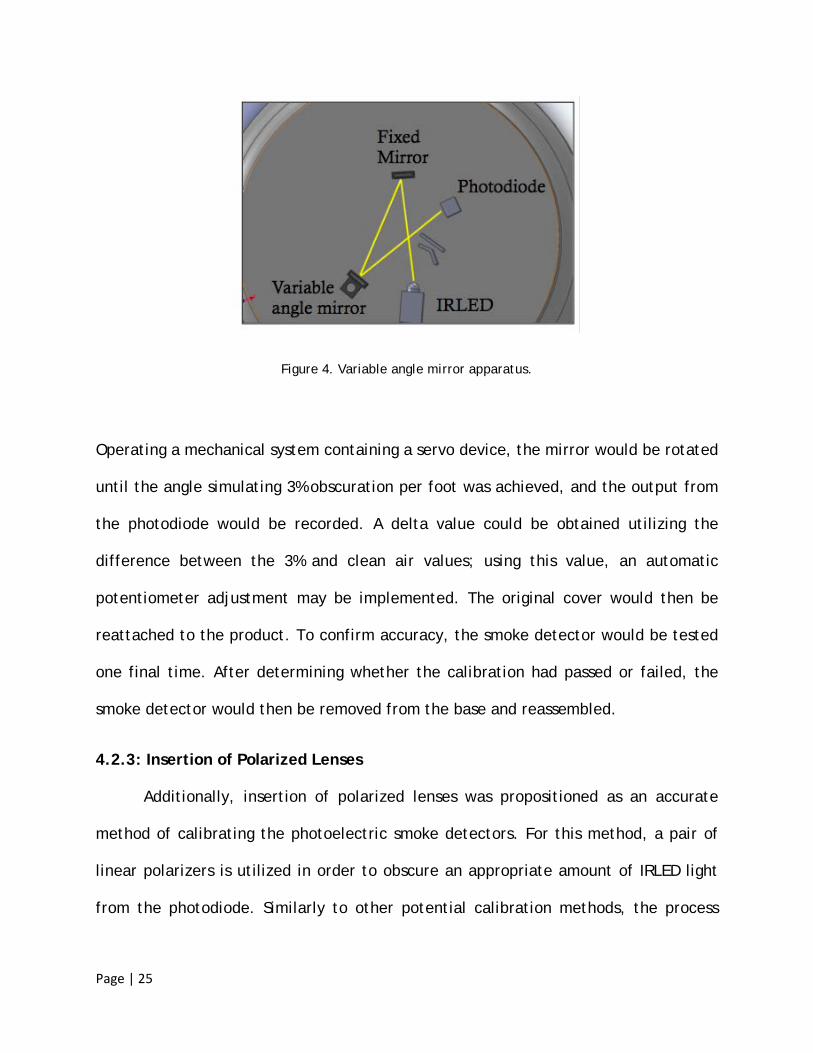
Figure 4. Variable angle mirror apparatus.
Operating a mechanical system containing a servo device, the mirror would be rotated
until the angle simulating 3% obscuration per foot was achieved, and the output from
the photodiode would be recorded. A delta value could be obtained utilizing the
difference between the 3% and clean air values; using this value, an automatic
potentiometer adjustment may be implemented. The original cover would then be
reattached to the product. To confirm accuracy, the smoke detector would be tested
one final time. After determining whether the calibration had passed or failed, the
smoke detector would then be removed from the base and reassembled.
4.2.3: Insertion of Polarized Lenses
Additionally, insertion of polarized lenses was propositioned as an accurate
method of calibrating the photoelectric smoke detectors. For this method, a pair of
linear polarizers is utilized in order to obscure an appropriate amount of IRLED light
from the photodiode. Similarly to other potential calibration methods, the process
Page | 26
would require an electronic base that could read the voltage output from the
photodiode and deliver this information to the appropriate software.
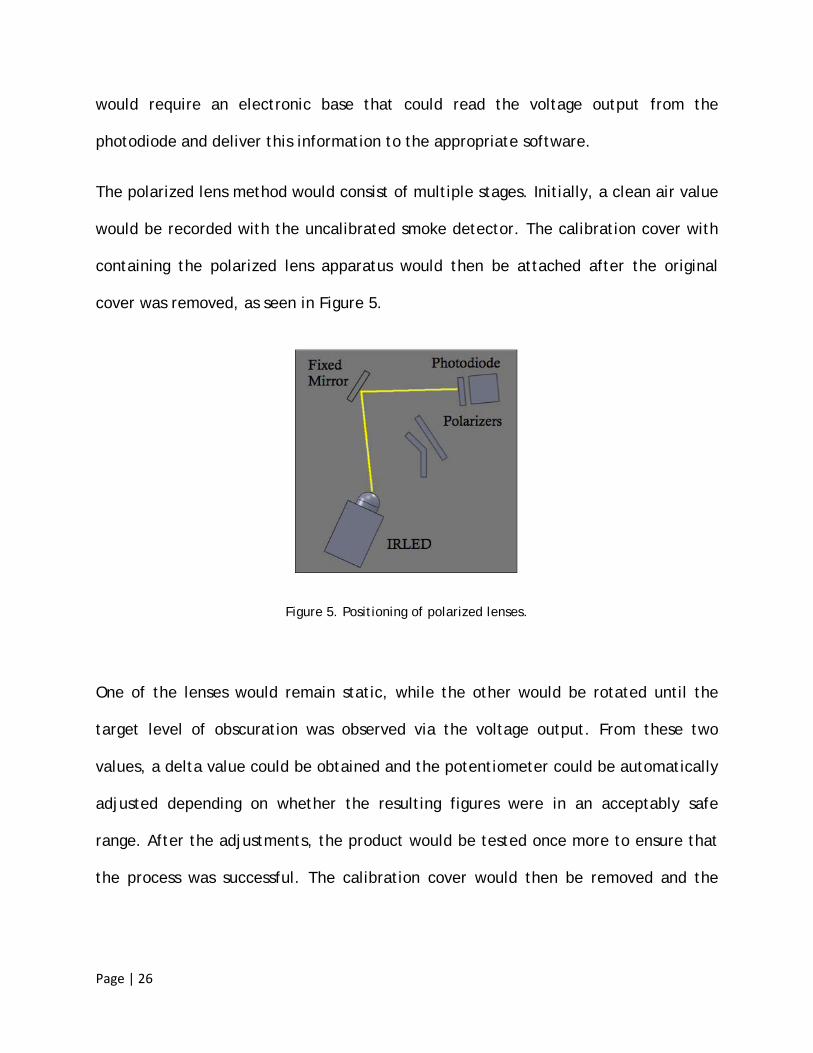
The polarized lens method would consist of multiple stages. Initially, a clean air value
would be recorded with the uncalibrated smoke detector. The calibration cover with
containing the polarized lens apparatus would then be attached after the original
cover was removed, as seen in Figure 5.
Figure 5. Positioning of polarized lenses.
One of the lenses would remain static, while the other would be rotated until the
target level of obscuration was observed via the voltage output. From these two
values, a delta value could be obtained and the potentiometer could be automatically
adjusted depending on whether the resulting figures were in an acceptably safe
range. After the adjustments, the product would be tested once more to ensure that
the process was successful. The calibration cover would then be removed and the

Page | 27
smoke detector would be detached from the base. The original product cover would
then be replaced.
4.3: Selection of Most Appropriate Method
Multiple approaches were included in the decision-making process for the most
suitable calibration technique. First, the team narrowed the scope of the project; a
group discussion yielded the conclusion that options involving extensive programming
would not be feasible given the limited timeframe. Additionally, the team established
that each brainstormed method should involve a mechanical system.
In the next phase, the team discussed all potential methods and produced a list
of unexplored options. With these proposals and the established conditions in mind,
each team member brainstormed a unique calibration technique and presented their
results to the collective. A consensus on the most appropriate method for Tyco
International was then reached after quantifying and comparing several factors for
each technique. These categories, outlined by the company in their original project
description, include: cost to build a station, time for one calibration, level of
accuracy, number of control systems, and throughput during manufacturing.
Additional factors that the team included were feasibility of the method and
incorporation of the current calibration stations. The brainstormed technique that
fulfilled these categories most fully was then universally selected as the method to
develop further.
Page | 28
4.3.1: Assumptions for All Proposed Techniques
Every technique selected for consideration included several common
assumptions. One of these expectations was the incorporation of components from
the current electronic calibration station. All proposed methods required the
currently used electronic base. This component served as a power source to the
smoke detector and as a connection to the computer setup that displayed the
obscuration level; both of these functions were necessary for each new method of
calibration. Another shared assumption was the necessity of the software utilized in
Tyco’s existing calibration methods. After the voltage values from the photodiode
were received by the system, the software was critical for converting these outputs to
quantified obscuration levels.
Logistical assumptions were also established before executing the project. The
team brainstormed these methods under the impression that detailed information
concerning the relationship between the LED and photodiode output would be
provided by the company. An additional supposition was that all the necessary
materials that were ordered would be delivered in under a week. Following this
assumption for each proposed technique, a universal schedule was generated to
reflect this allotted period of time for shipping.
4.3.2: Comparison of Proposed Techniques with Previously Utilized Techniques
Another step in the selection procedure was the comparison of techniques
implemented by Tyco International and the proposed alternatives. Similar to the
assessment of brainstormed techniques, the several criteria specified by the company
were compared for each method, as seen in Table 2.
Page | 29
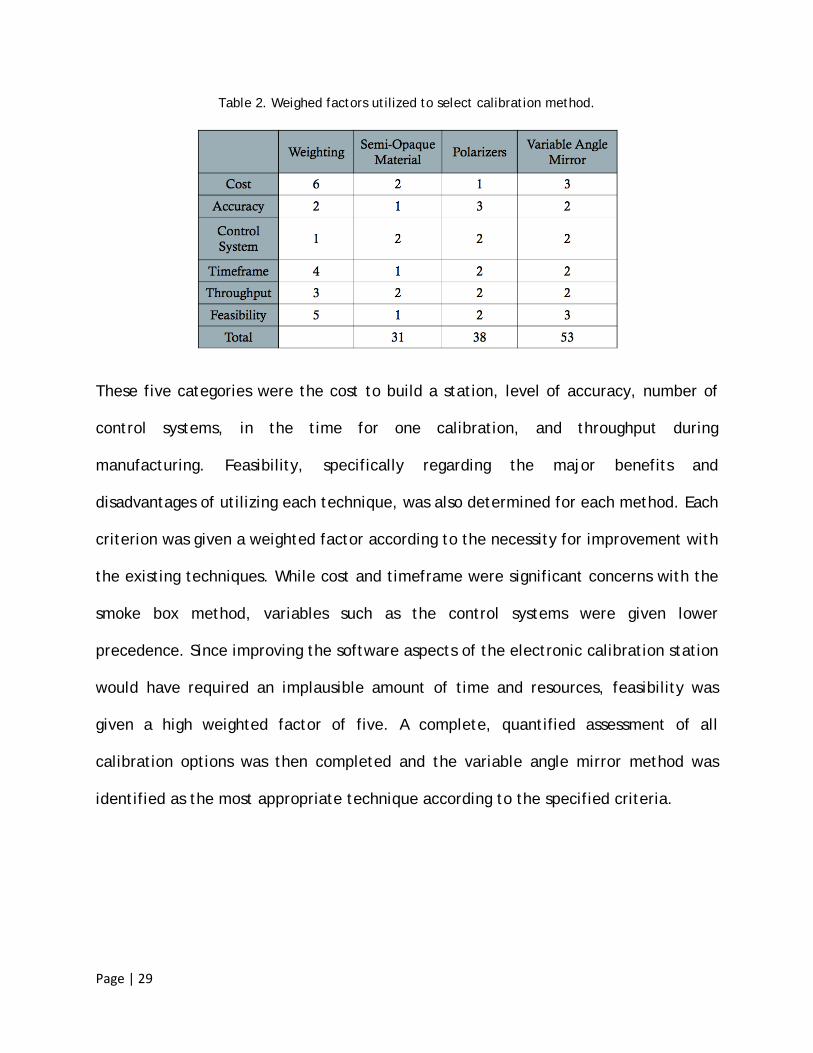
Table 2. Weighed factors utilized to select calibration method.
These five categories were the cost to build a station, level of accuracy, number of
control systems, in the time for one calibration, and throughput during
manufacturing. Feasibility, specifically regarding the major benefits and
disadvantages of utilizing each technique, was also determined for each method. Each
criterion was given a weighted factor according to the necessity for improvement with
the existing techniques. While cost and timeframe were significant concerns with the
smoke box method, variables such as the control systems were given lower
precedence. Since improving the software aspects of the electronic calibration station
would have required an implausible amount of time and resources, feasibility was
given a high weighted factor of five. A complete, quantified assessment of all
calibration options was then completed and the variable angle mirror method was
identified as the most appropriate technique according to the specified criteria.
Page | 30
4.4: Final Design for Calibration Apparatus
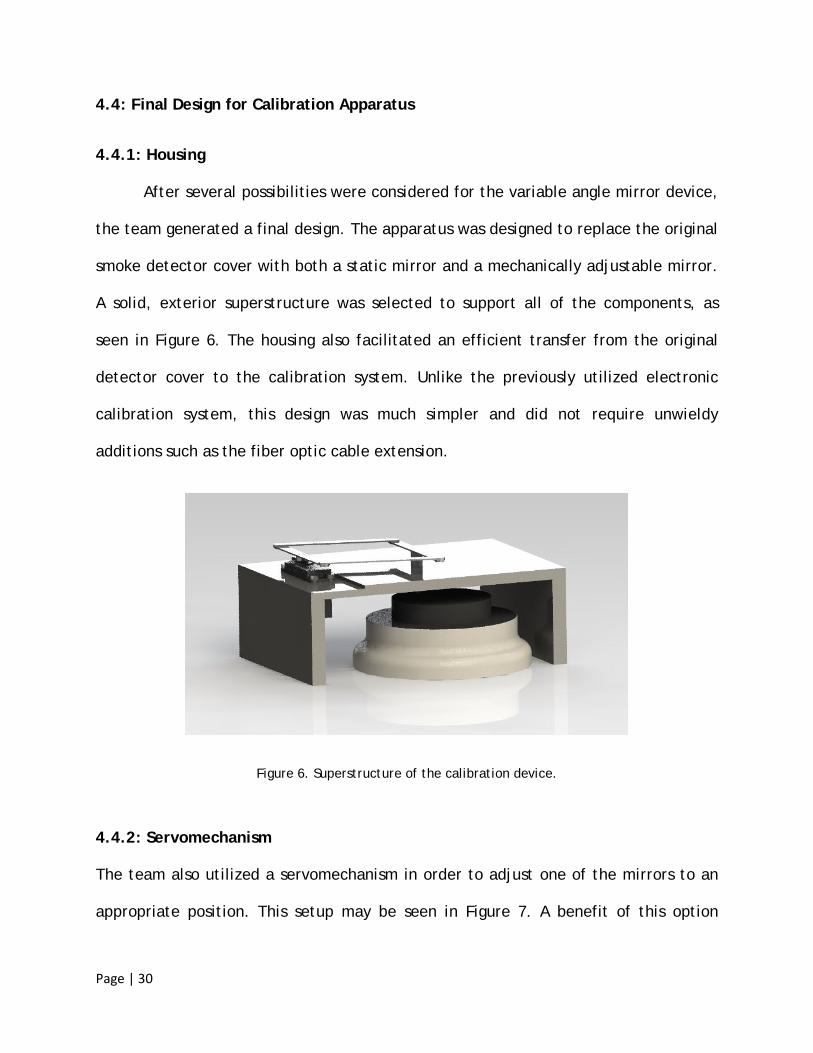
4.4.1: Housing
After several possibilities were considered for the variable angle mirror device,
the team generated a final design. The apparatus was designed to replace the original
smoke detector cover with both a static mirror and a mechanically adjustable mirror.
A solid, exterior superstructure was selected to support all of the components, as
seen in Figure 6. The housing also facilitated an efficient transfer from the original
detector cover to the calibration system. Unlike the previously utilized electronic
calibration system, this design was much simpler and did not require unwieldy
additions such as the fiber optic cable extension.
Figure 6. Superstructure of the calibration device.
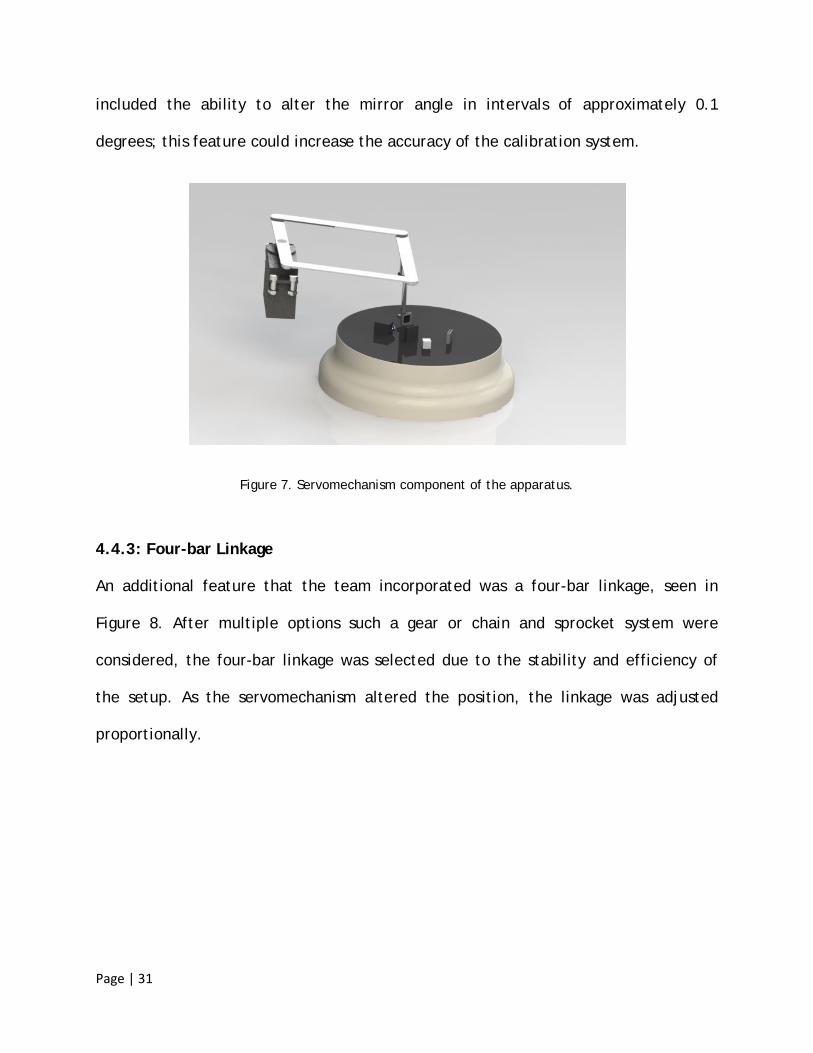
4.4.2: Servomechanism
The team also utilized a servomechanism in order to adjust one of the mirrors to an
appropriate position. This setup may be seen in Figure 7. A benefit of this option
Page | 31
included the ability to alter the mirror angle in intervals of approximately 0.1
degrees; this feature could increase the accuracy of the calibration system.
Figure 7. Servomechanism component of the apparatus.
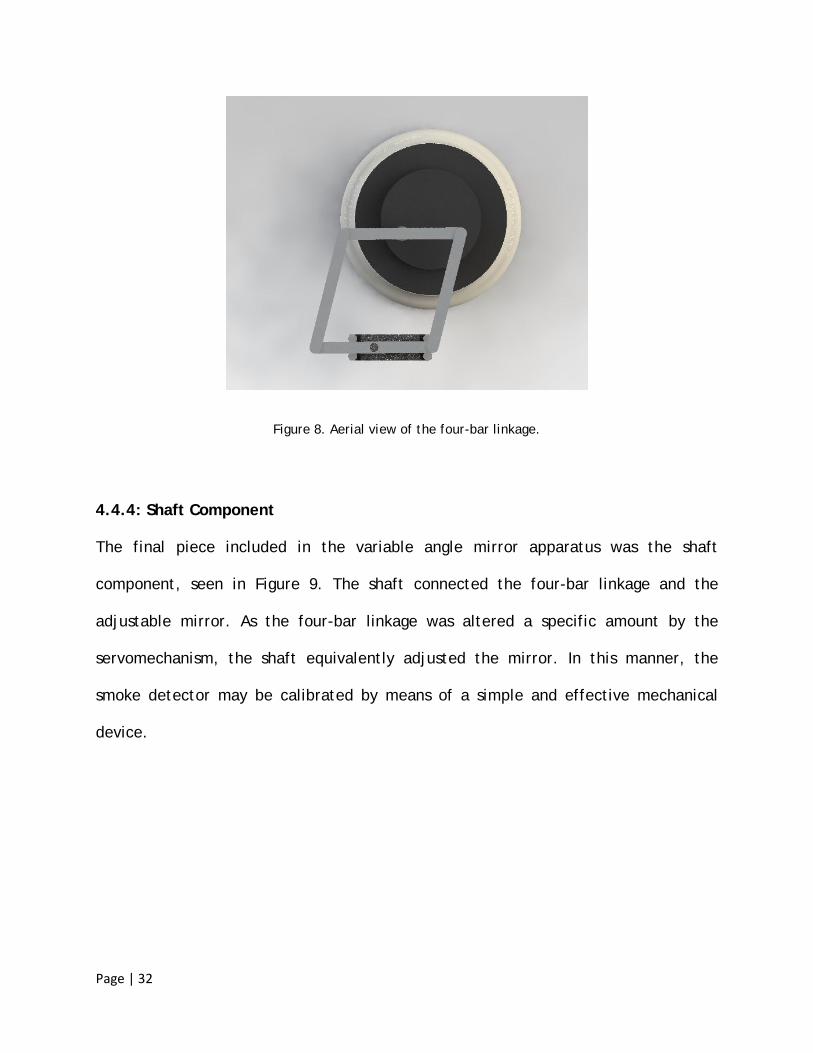
4.4.3: Four-bar Linkage
An additional feature that the team incorporated was a four-bar linkage, seen in
Figure 8. After multiple options such a gear or chain and sprocket system were
considered, the four-bar linkage was selected due to the stability and efficiency of
the setup. As the servomechanism altered the position, the linkage was adjusted
proportionally.
Page | 32
Figure 8. Aerial view of the four-bar linkage.
4.4.4: Shaft Component
The final piece included in the variable angle mirror apparatus was the shaft
component, seen in Figure 9. The shaft connected the four-bar linkage and the
adjustable mirror. As the four-bar linkage was altered a specific amount by the
servomechanism, the shaft equivalently adjusted the mirror. In this manner, the
smoke detector may be calibrated by means of a simple and effective mechanical
device.

Page | 33
Figure 9. Shaft component of the variable angle mirror apparatus.
4.5: Selection of Mirror Positioning for Simulating Obscuration
After the variable angle mirror method was selected as the most appropriate
calibration technique, it was necessary to determine the mirror angles that emulated
3% obscuration per foot. These positions were necessary for simulating obscuration as
accurately as possible; therefore, the team utilized optical simulation software in
order to determine which values should be employed during calibration. This process
required simulation at the clean air value and at the smoke value, 3% obscuration per
foot.
4.5.1: Simulation at the Clean Air Value
Before measurements were recorded at a specific level of obscuration, a clean
air value was required. Seen in Figure 10, an IRLED was inserted into the detector
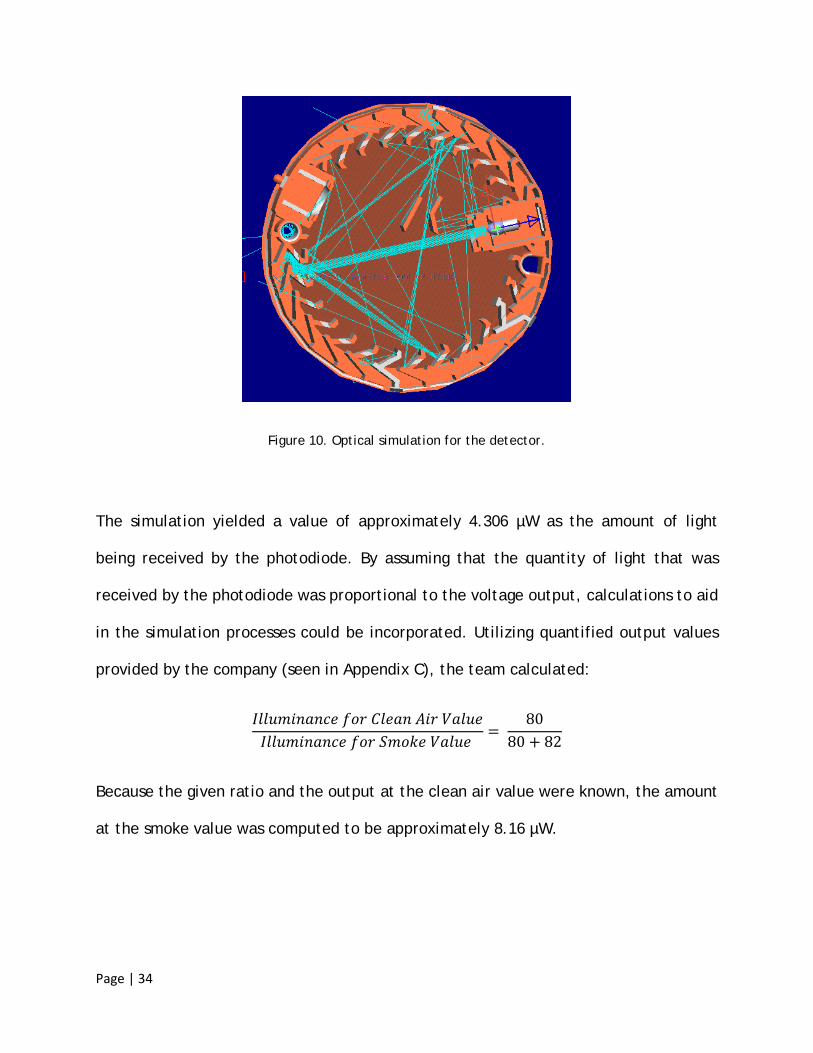
chamber. Optical parameters were then established and the simulation was initiated.
Page | 34
Figure 10. Optical simulation for the detector.
The simulation yielded a value of approximately 4.306 µW as the amount of light
being received by the photodiode. By assuming that the quantity of light that was
received by the photodiode was proportional to the voltage output, calculations to aid
in the simulation processes could be incorporated. Utilizing quantified output values
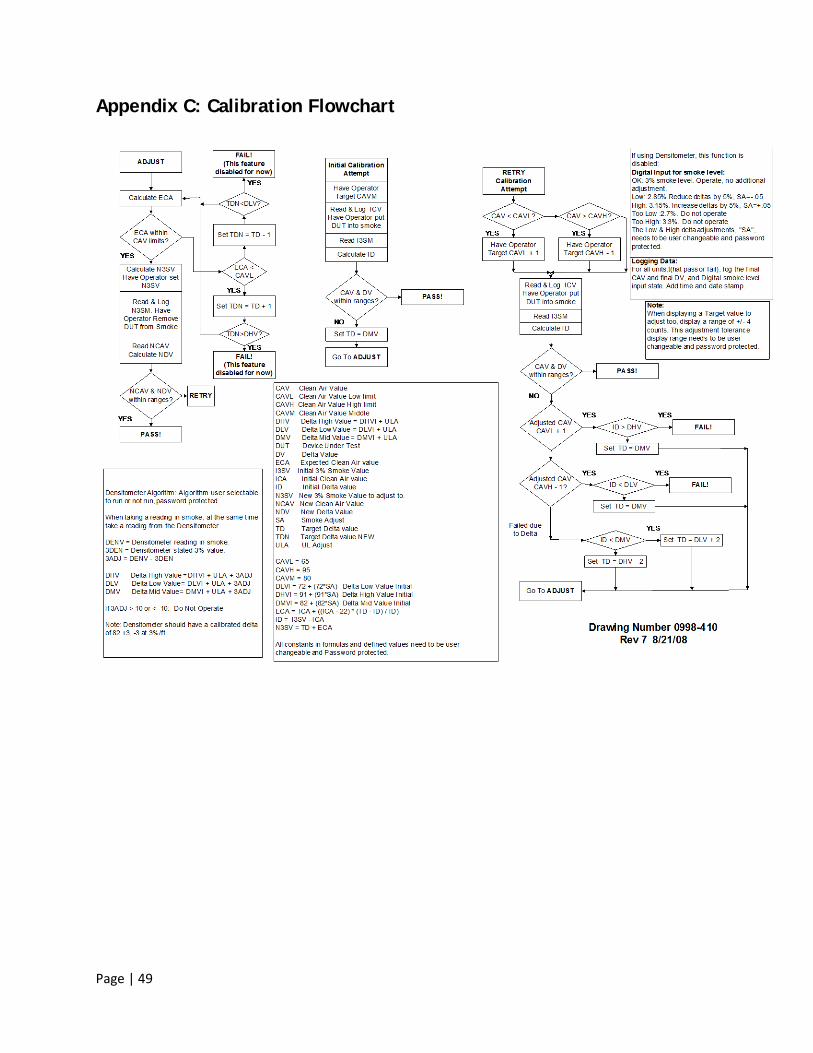
provided by the company (seen in Appendix C), the team calculated:
𝐼𝑙𝑙𝑢𝑚𝑖𝑛𝑎𝑛𝑐𝑒 𝑓𝑜𝑟 𝐶𝑙𝑒𝑎𝑛 𝐴𝑖𝑟 𝑉𝑎𝑙𝑢𝑒𝐼𝑙𝑙𝑢𝑚𝑖𝑛𝑎𝑛𝑐𝑒 𝑓𝑜𝑟 𝑆𝑚𝑜𝑘𝑒 𝑉𝑎𝑙𝑢𝑒
= 80
80 + 82
Because the given ratio and the output at the clean air value were known, the amount
at the smoke value was computed to be approximately 8.16 µW.

Page | 35
4.5.2: Simulation at the Smoke Value
After the output value was obtained, parameters were inserted for the
simulation at 3% obscuration per foot. In addition to the basic chamber, a fixed mirror
and an adjustable mirror were included in the chamber, as seen in Figure 11.
Figure 11. Setup used in the optical simulation.
Specifications were also established for each mirror position. Parallel positioning for
the mirrors resulted in an angle of zero. The angle was a negative value when the
mirror was rotated counterclockwise. Likewise, the angle was positive if the mirror
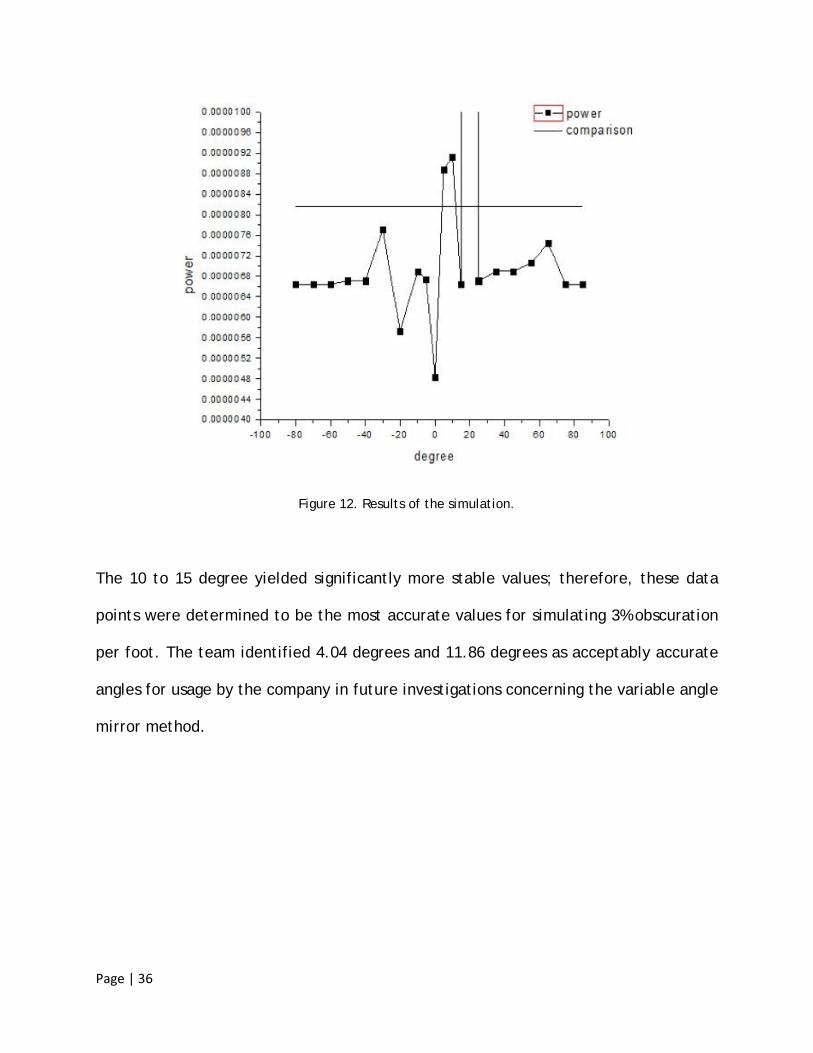
was adjusted in a counterclockwise direction. Power outputs, measured in Watts,
rapidly increased from approximately 0 to 10 degrees. These results can be seen in
Figure 12.
Page | 36
Figure 12. Results of the simulation.
The 10 to 15 degree yielded significantly more stable values; therefore, these data
points were determined to be the most accurate values for simulating 3% obscuration
per foot. The team identified 4.04 degrees and 11.86 degrees as acceptably accurate
angles for usage by the company in future investigations concerning the variable angle
mirror method.
Page | 37
5.0: Conclusions & Recommendations
In this chapter, closing statements concerning the outcomes of the project are
discussed. The weaknesses and areas for improvement of the previously utilized
calibration methods are detailed. As an alternative, a less expensive method that is
still accurate and rapid is recommended. Additionally, maintaining thorough records
of each calibration technique is advocated. The possibilities of improving electrical or
software components of the calibration process are also considered.
5.1: Areas of Improvement for Previously Utilized Calibration Techniques
Currently employed calibration methods, while fully functional, have several
disadvantages. For example, the smoke box technique requires excessive control
systems due to bulky ventilation systems and the necessity to maintain a constant
obscuration in the chamber. Additionally, as the day progresses and variables change
with each trial, accuracy may be decreased depending on the condition of the sample
smoke detector. Physically simulating a fire with various smoke and aerosol
substances also requires a significantly higher amount of time to complete than the
electronic calibration process. Another time concern is the CAV; if the product does
not have a value within range, the process must be repeated. The electronic
calibration technique also has multiple areas for improvement. When the station
equipment becomes outdated or in need of repair, an expensive setup is required due
to the necessary charging base and software components. Additionally, control

Page | 38
systems including the additional light source and fiber optic cable attachments are
another limiting factor for electronic calibration.
5.2: Alternative Calibration Method for Reducing Company Expenditures
Implementing a new method could reduce cost without compromising accuracy,
timeframe, or throughput. The variable angle mirror apparatus would cost less than
1000 RMB, or less than $150 USD, to build. In addition, the time to calibration one
device would be approximately ten to fifteen seconds, similar to the currently
implemented electronic calibration method. The accuracy and throughput would also
be comparable to previously utilized techniques. A further benefit of the variable
anger mirror method includes the capability of integration into the existing software
and electronic components, which would save the company time and money if the
new technique were selected.
5.3: Importance of Documentation for Calibration Methods
Detailed documentation of calibration techniques is crucial for future
development. While researching previously utilized calibration techniques, the team
was unable to obtain any information regarding the electronic calibration method.
Thorough descriptions of each calibration technique could facilitate improvements
and updates to the systems. Therefore, the team recommends that the company
record and maintain documentation detailing each process, and provide this to future
brainstorming teams.

Page | 39
5.4: Identification of Areas for Future Investigation
Due to a limited timeframe and resources, the team was unable to investigate
several options for development. One possibility would be improving the variable
angle mirror apparatus. Basic simulations generated estimates for ideal mirror
positions, but future investigations regarding the most effective positioning could
increase the accuracy of the system. Future exploration for the company could
include improvement of the electronic and software aspects of calibration. Altering
facets such as the current program used to analyze the data or the electronic base
setup could potentially improve the overall time or accuracy of the calibration
system.
Page | 40
Works Cited
AW Technology (2010). 1900 calibration tunnel. Retrieved from http://www.awtechnology.com/Products/1900Tunnel.htm
Baker, D. & Adams, P. (1993). Residential fire detection. Retrieved from
http://extension.missouri.edu/p/G1907 Brown, R.H. & Vickers, R.N. (1995). Smoke detector operability and reliability in
military family housing. Retrieved from http://handle.dtic.mil/100.2/ADA307087
Cable Organizer Learning Center (2008). Smoke alarm roundup: The difference
between ionization and photoelectric smoke detectors. Retrieved from http://cableorganizer.com/articles/smoke-alarm-roundup.html
Cleary, T. (2009). Proceedings from the SUPDET 2009: Fire Protection Research
Foundation’s 13th Annual Suppression and Detection Research & Applications Symposium. Orlando, FL: Cleary.
Digital Security Controls (1996). Meridian photoelectric smoke detectors & alarms.
Retrieved from http://www.hsasecurity.com/meridian.pdf Dubivsky, P.M. & Bukowski, R.W. (1989). False alarm study of smoke detectors in
Department of Veterans Affairs Medical Centers (VAMCS). Retrieved from http://fire.nist.gov/bfrlpubs/fire89/PDF/f89012.pdf
Duke University (2006). Smoke detector standards. Durham, N.C.: Facilities
Management Department. Dungan, K.W. (2007). Reliability of fire alarm systems. Fire Protection Engineering,
Winter 2007 (33). Gentex (1994). Gentex technical bulletin number 003. Retrieved from
http://www.gentex.com/sites/default/files/fire_docs/TB003.pdf Gemini Scientific Corporation (1996). The Gemini 501A smoke detector analyzer
technical data. Retrieved from http://firesafetytech.com/images/pdf/Gem%20501A-Bat%20brochure.pdf?PHPSESSID=9e0cdcc8c28f81b97d7828a58f446bb9
Hamamatsu (n.d.). Photodiode technical information. Retrieved from
http://sales.hamamatsu.com/assets/applications/SSD/photodiode_technical_information.pdf

Page | 41
Kadwell, B.J. & Pattok, G.R., Gentex Corporation (2005) Compact particle sensor, U.S. Pat. 6,876,305 B2.
Magallanes, S.S. (2010). On the calibration of photoelectric smoke detector
technology. Retrieved from http://calibration.ezinemark.com/on-the-calibration-of-photoelectric-smoke-detector-technology-168f00cdc69.html
Mi, Z. & Rattman, W.S., Tyco Safety Products (2009) Smoke detector calibration, U.S. Pat. 7,474,226 B2.
National Fire Protection Association (2010). NFPA 72: National fire alarm and signaling
code. Retrieved from http://www.nfpa.org/ Shapiro, J. (1994). Smoke detector operability survey: Engineering laboratory
analysis. Retrieved from http://www.cpsc.gov/library/foia/foia01/os/operable.pt2.pdf
System Sensor (2010). Applications guide: system smoke detectors. Retrieved from
http://www.systemsensor.com/pdf/A05-1003.pdf System Sensor (n.d.). Guide for the proper use of intrinsically safe fire protection
devices. Retrieved from http://www.systemsensor.ca/guides/I56-1257.pdf United Nations Industrial Development Organization (2006). Role of measurement and
calibration in the manufacture of products for the global market. Retrieved from http://www.unido.org/fileadmin/media/documents/pdf/tcb_role_measurement_calibaration.pdf
UL LCC (n.d.). Smoke detectors for fire alarm systems: UL 268. Retrieved from
http://ulstandardsinfonet.ul.com/scopes/scopes.asp?fn=0268.html Washington State Patrol Fire Protection Bureau Inspection Station (n.d.). Smoke
detector sensitivity testing and smoke entry/alarm respond testing. Retrieved from http://www.wsp.wa.gov/fire/docs/inspections/smoke_det_sensitivity_testing.pdf
Weiner, D.W., Cleary, T.G., Mulholland, G.W., & Beever, P.F. (2003). Light scattering
characteristics and size distribution of smoke and nuisance aerosols. Retrieved from http://fire.nist.gov/bfrlpubs/fire03/PDF/f03058.pdf
Page | 42
Appendix A: Project Descriptions
Sensor Calibration Project
Background: A photo sensor consists of a chamber, which keeps out light, but allows smoke particles to enter. The chamber consists of a bottom, in which the electronics are mounted, and the top, which provides a cover and creates the smoke chamber. Within the chamber there is an Infrared LED that is pulsed on every few seconds. Located off at an angle away from the IRLED is a prism which will direct light down to a photo diode that is connected to a photo amplifier circuit. Because the LED is shooting light at an angle, the light from the LED does not normally hit the prism. When smoke enters the chamber the light is reflected off the smoke particles and some of the reflected light hits the prism and illuminates the photo diode, creating a signal. The level of this signal is dependent on the characteristics of the smoke particles entering the chamber, for example, particle size, color, and density.
One of the problems with designing photo sensors was monitoring the LED to make sure it was functional. This problem was solved by allowing for a little reflection in the chamber to hit the photo diode, so there is a small background signal present when the LED flashes and there is no smoke. The amount of signal depends on the characteristics of the IR LED and the background scatter of light within the chamber area. This background signal is called the “zero value” or the long term average value. Alarms are then generated when the signal rises to a certain level above the background signal.
When manufacturing a smoke sensor, one major issue is the need to calibrate the sensor. Calibration insures that the sensor puts out a signal that is properly correlated to the smoke level. Variation in the IR LED, photo diode, and electronics mean that there are a broad range of values that can come out of different detectors for the same amount of smoke. These variations need to be calibrated out.
Page | 43
Calibration methods:
Two methods of calibrating Tyco smoke sensors have been developed and used over the years. Each is described below:
One approach utilizes an electronic calibration station. In this approach, the Sensor is loaded onto the station with the sensor chamber top removed. A special calibration head is lowered onto the sensor housing; this simulates the chamber cover, and has electronics to measure the IR LED’s spectral emissions, dispersion, and intensity characteristics; as well as a source (smoke LED) that is directed at the prism, which is used to provide the simulated smoke obscuration signal.
Based on the IRLED’s characteristics, the smoke LED signal strength is determined to represent the calibration signal which represents 3%/ft obscuration. There are two calibration parameters to validate: a proper zero value, and a proper delta value (additional signal) at 3% obscuration. A potentiometer is provided on the Photo Sensor PCA that is used to adjust the signal gain of the photo amplifier circuit. Based on the zero value, and the delta value read once the smoke LED is activated, the potentiometer is adjusted to get a valid delta value while the smoke LED is active; the zero value is then again measured; if it is within range, calibration is complete; if not, then the procedure is repeated. Note, adjusting the potentiometer varies both the zero value and delta value. Once calibration is complete, the Photo sensor is removed from the fixture, a chamber top is snapped on, and the zero value is validated.
Another approach is to us a “smoke box” to generate the 3%/ft obscuration. With this approach, wick can be used to provide the smoke obscuration, or an aerosol generator using mineral oil can be used to provide the 3%/ft obscuration. The Sensor is mounted to a door of the smoke box; a zero value is read; then the sensor is put into the smoke box with 3% obscuration. The new signal is read from the sensor; the delta is calculated, and then based on the zero value, and the new value at 3% obscuration, the potentiometer is adjusted to give the new calculated 3% value. The sensor is removed from the 3% obscuration; then the zero value is read; if the zero value and delta value are in range, the calibration is complete; otherwise the procedure is repeated.
Page | 44
The Project:
The above approaches have their own limitations. The electronic calibration stations are costly; they are getting old and difficult to maintain; and are not as accurate at setting the proper delta values as is possible with the smoke box process. The smoke box process requires an exhaust vent to the outside air to remove the smoke or aerosol from the box; requires a control system for maintaining the 3% obscuration; particle size of the smoke/aerosol is a factor can vary throughout the day; the speed of calibration is slower than the electronic calibration stations. Thus, it is desirable to develop an alternate calibration procedure.
This alternate calibration method would have to be less costly than the electronic calibration stations, provide more accurate calibration, require less control systems than the smoke box procedure, and calibrate the sensors in a short timeframe, have a higher throughput.
One method that has been discussed is to insert some physical element accurately into the path of the IRLED, which would then reflect a consistent amount of the IRLED light into the prism that would represent a known %/ft obscuration. This method would have to be validated. One issue to control would be whether, with the variations of the IRLED, and the mechanics involved, the tester could produce an accurate and repeatable process. The method would also have to provide a means to quickly go between reading the zero value and the obscuration value, so that the calibration process could be stepped through several times in a row quickly.
Project Statement: Develop an approach for calibrating smoke sensors that does not involve smoke, and can be implemented at reasonably low cost with high throughput on a manufacturing line.
Page | 45
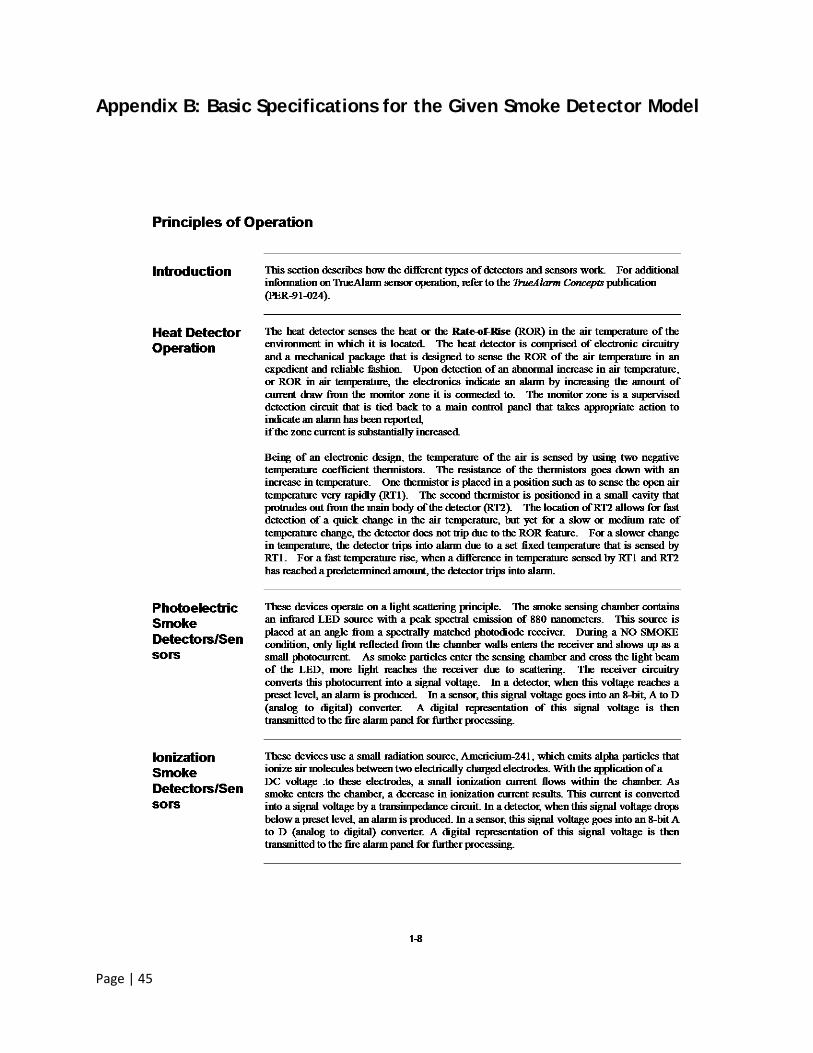
Appendix B: Basic Specifications for the Given Smoke Detector Model
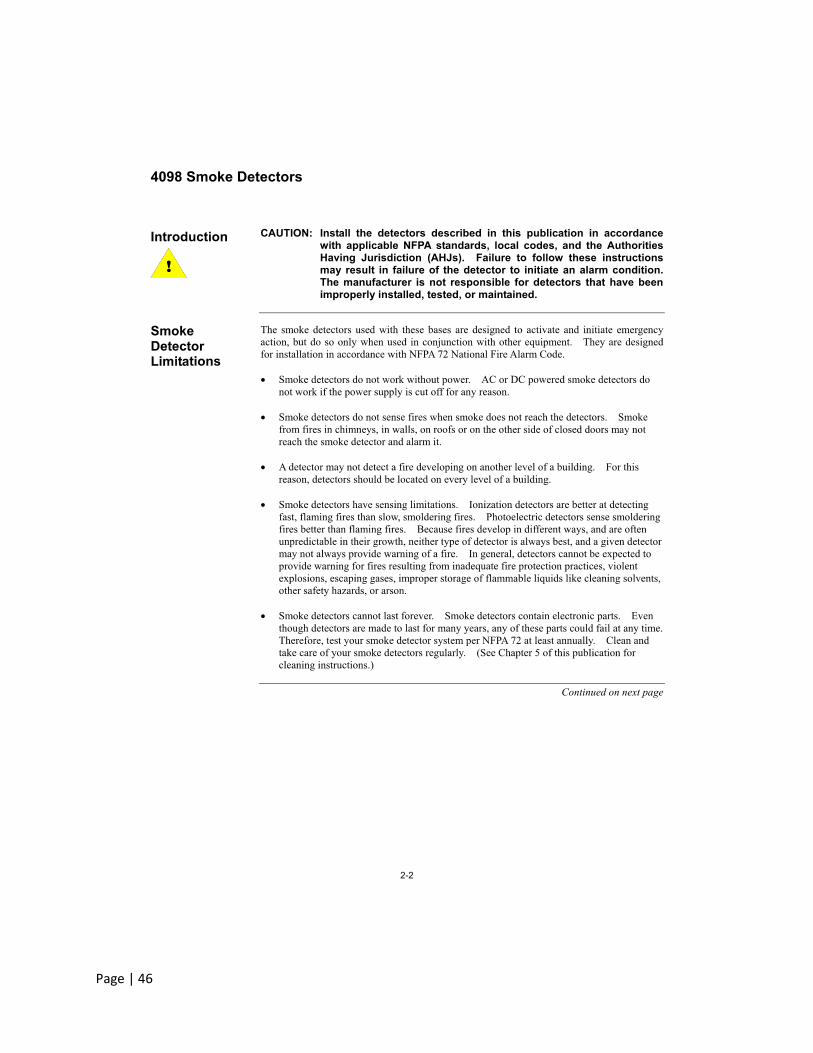
Page | 46

Page | 47
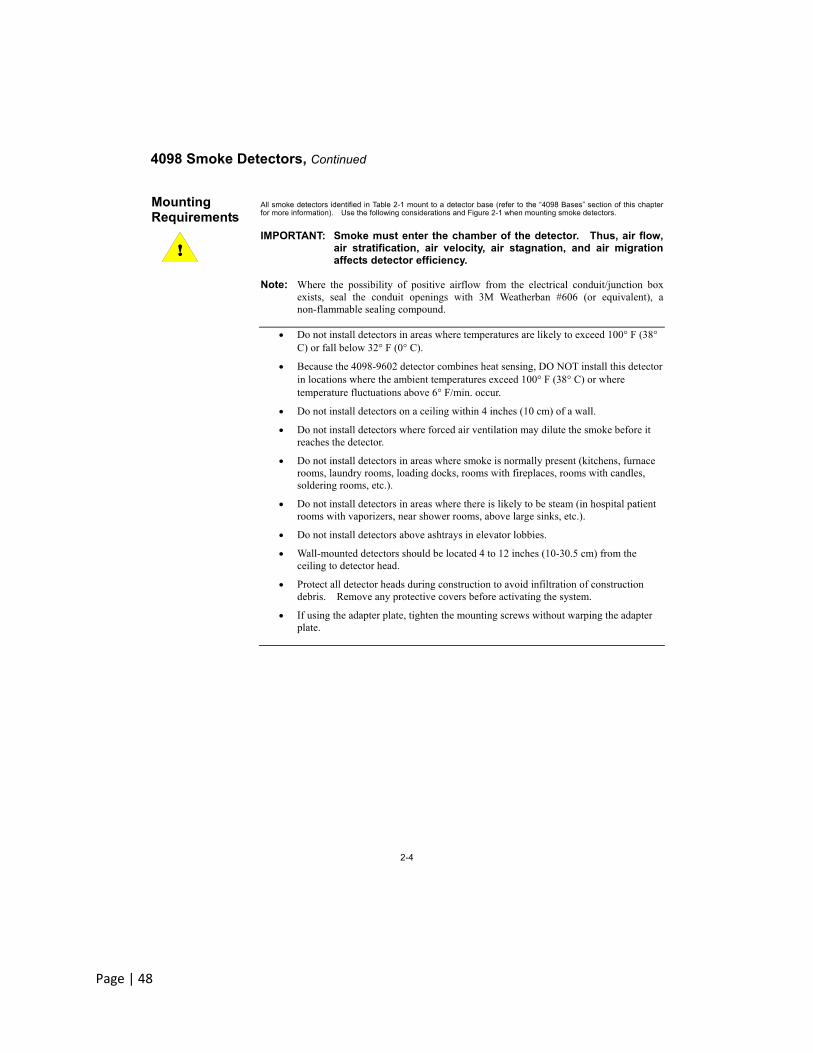
Page | 48
Page | 49
Appendix C: Calibration Flowchart