Embed Size (px)
Citation preview

December 8, 2015 20:18 806 UHTE_A_1098245
Heat Transfer Engineering, 00(00):1–16, 2015Copyright C©© Taylor and Francis Group, LLCISSN: 0145-7632 print / 1521-0537 onlineDOI: 10.1080/01457632.2015.1098245
Altering Bubble Dynamics via In SituVapor Extraction
RANDALL G. FOX, COREY D. JUAREZ, DEBORAH V. PENCE,and JAMES A. LIBURDYSchool of Mechanical, Industrial, and Manufacturing Engineering, Oregon State University, Corvallis, Oregon, USA5
Spatiotemporal cooling of electronics using latent energy might be achieved by closely spaced, rapid departure of smallbubbles. One means to achieve small diameters during boiling is to provide an additional upward force during bubbleformation, such as that from vapor extraction. Experiments were conducted of bubble extraction using constant flow ratesof both air and vapor that ranged from 30 to 90 mm3/s. Extraction was achieved with a hydrophobic porous membranesealed to a tube in which a vacuum was drawn. The gap between the extraction and supply surface was varied from 0.5 to3.25 mm. Only individual bubbles that ruptured at the top surface while still attached to the supply surface were considered.Bubble departure diameters are approximately 80% of the gap height. As with unconfined bubbles in pool boiling, thebubble frequency varies inversely with departure diameter. Correlations for bubble rupture, bubble departure, and bubblefrequency are presented as a function of gap height. Using the three distinct regimes identified in the experimental study,namely, growth only, growth with extraction, and extraction only, an effective bubble diameter model and an appropriatestatic force balance were developed. These were used to predict bubble departure frequencies and diameters, respectively,under confined extraction conditions.
10
15
INTRODUCTION AND BACKGROUND
As noted by Hamann et al. [1], new demands are being placed20on high-heat-flux cooling systems that are based on spatiotem-poral cooling capabilities, particularly at very small scales. Con-sequently, the ability to provide localized cooling on demand isan area of increasing interest. Boiling heat transfer is one meansof achieving high flux cooling, and by introducing artificial nu-25cleation sites, bubble formation can be localized. If the bubblesize can also be controlled, the spacing of artificial sites can bedesigned to avoid bubble interactions (Judd [2]). One means ofcontrolling bubble size is to add an additional upward force thatcauses the bubble to depart at a smaller diameter. To create such30a force, it is proposed to locate a hydrophobic, porous extrac-tion surface opposite and parallel to the surface where vapor isbeing generated. The extraction surface is located such that itconfines the bubble during formation, providing the additionalforce necessary to create smaller bubbles.35
Address correspondence to Professor Deborah Pence, School of Mechanical,Industrial and Manufacturing Engineering, Oregon State University, Corvallis,OR 97331-6001, USA. E-mail: [email protected]
Color versions of one or more of the figures in the article can be found onlineat www.tandfonline.com/uhte.
The application of vapor extraction to heat sinks was firstintroduced by Apreotesi et al. [3] using a fractal-like branchingmicrochannel flow network and by David et al. [4] for severalmicroscale configurations. The latter group extended these stud-ies by employing a computational fluid dynamic analysis (Fang, 40et al. [5]). All results show that vapor extraction results in loweroperating temperatures with corresponding lower channel pres-sure drops. As an added benefit to the potential of regulatingheat transfer, extraction has the potential to reduce or alleviateflow instabilities in convective boiling heat sinks, as noted by 45Qu and Mudawar [6].
In designing microchannel heat sinks with extraction, it isnecessary to understand the design constraints, which include,among other things, the advection to extraction rate ratios.Many of these constraints were identified, and recommenda- 50tions made, by David et al. [7] for adiabatic and diabatic mi-crochannels with advective flow. Xu et al. [8] identified designconstraints for adiabatic microchannel flows.
In a model developed to assess pressure drop through fractal-like branching channels experiencing in situ vapor extraction, 55Salakij et al. [9] recognized the drawback of using the entiremembrane area for predicting the amount of vapor being ex-tracted. In the model, Darcy’s Law was used to predict extrac-tion rates. Based on this need, Cappello et al. [10] studied the
1

December 8, 2015 20:18 806 UHTE_A_1098245
2 R. G. FOX ET AL.
extraction potential through a hydrophobic porous membrane60using both water vapor/liquid and air/water mixtures with noadvection, and determined that the area of the bubble in con-tact with the extraction surface is the crucial area to employfor proper application of Darcy’s Law. Fazeli et al. [11] studiedtwo-phase gas and vapor extraction from a 1-mm gap with no65advective flow. By increasing the pressure inside the gap, in-jected gas bubbles were observed to decrease in size and, in thecase of vapor generation, the critical heat flux was delayed.
Prediction of the bubble diameters during simultaneousgrowth and extraction is necessary to design an effective spa-70tiotemporal cooling system driven by extraction. For the caseof unconfined boiling, bubble departure diameters and bubbledeparture frequencies were investigated and semiempiricallymodeled in the early work by Ivey [12]. Numerous studiesfollowed resulting in several correlations, but that of Koca-75mustafaogullari [13] is cited quite extensively, particularly incommercially available computational codes.
Static force balances are generally preferred as a means ofpredicting departure diameters; however, it is important that theforces relevant to the situation are included. Thorncroft et al. [14]80provide a thorough assessment of forces acting on unconfinedbubbles and detachment models for a variety of static and cross-flow scenarios.
The first goal of the present study is to experimentally ex-amine the effects of bubble extraction on bubble dynamics by85characterizing departure diameters and departure frequenciesunder confined extraction. Three regimes are identified in theprocess: (I) growth only, (II) growth with extraction, and (III)extraction only. These are shown in Figure 1. The second goalis to develop a theoretical model for predicting the bubble diam-90eter as a function of time and confinement height, recognizingthat it may need to be made semiempirical at this initial stage ofdevelopment. Finally, given that forces contributing to bubbledeparture during confined extraction have not yet been studied,the third goal is to assess the relevant forces acting on a bubble95over the course of its lifetime. Included in this assessment isthe contribution of the exit momentum, which, unlike the inletmomentum, does not go to zero at bubble departure. Once deter-mined, the relevant forces can be used in a static force balance todetermine bubble departure diameter. This information is then100used with the bubble diameter model to determine the bubbledeparture frequency. To improve the general applicability ofthe model, both adiabatic and diabatic cases are studied, usingair/water mixtures for the former and heated bubble generationat an artificial nucleation site for the latter.105
EXPERIMENTAL FACILITIES
The experimental test facilities for the diabatic study and theadiabatic study are shown in Figures 2a and 2b, respectively.Consistent between the the two facilities are the test chamber,110the extraction chamber, and the lighting configuration. The sur-
Figure 1 Three regimes of in situ vapor extraction: (a) growth only, (b) growthwith extraction, and (c) extraction only.
faces at which the bubbles were generated differ, but are gener-ically called the supply surface. The test chamber, 64 × 54 ×50 mm (deep), consists of walls made of glass for viewing thebubble and an aluminum base in which the silicon surface for 115
heat transfer engineering vol. 00 no. 00 2015

December 8, 2015 20:18 806 UHTE_A_1098245
R. G. FOX ET AL. 3
Figure 2 Test facilities for (a) diabatic study and (b) adiabatic study.
diabatic studies and the aluminum orifice plate for the adiabaticstudy are mounted. The chamber is filled with approximately150 ml distilled water. For the diabatic case the water is degassedby vigorously boiling it for 30 min in the test chamber usingtwo submerged cartridge heaters. The heaters are also used to120maintain the pool temperature between 99.0 and 99.2◦C duringtesting, as measured with a K-type unsheathed thermocouple.The adiabatic study is conducted at room temperature.
The extraction surface, which confines the bubble, wasformed from a hydrophobic PTFE membrane from Sterlitech125with a specified pore diameter of 0.45 μm, porosity of 55%,and thickness of 15.6 μm. The membrane also has a laminatedsupport layer. The membrane was secured at the bottom of aglass tube (4.2 mm OD, 2.1 mm ID), which was connected bytubing to a vacuum source to create a 35-kPa pressure differ-130
ential across the membrane for the diabatic case and 14.5 kPafor the adiabatic case. The vacuum was created by suspend-ing a free weight from two 10-ml syringes connected to theglass tube. The pressure inside the glass tube was recorded at1000 Hz during testing using a differential pressure transducer 135(OMEGADYNE PX 409-015DWUV). The membrane surfacediameter was larger than the bubble diameters being generatedfor all cases studied. The extraction surface can be positioned tocreate gap heights, H, ranging from 0.52 to 4.0 mm, although inthis study the maximum H value used is 1.9 mm for the diabatic 140case and a range of 1.2 to 3.25 mm for the adiabatic case. Inaddition, the confinement surface was removed for studying theunconfined bubble departure diameter and frequency.
For the diabatic case, an artificial nucleation site was ma-chined in a 675-μm-thick <100> silicon substrate using an 145ultraviolet (UV) laser (ESI 5330 UV Laser Microvia Drill) tobe 30 μm in diameter and 100 μm deep. The nucleation sitewas heated to 81.4 W/cm2 using a high-repetition-rate pulsedNd:YLF laser (New Wave Research, Pegasus PIV, dual diodeNd:YLF 527 nm). The pulse rate and energy levels were con- 150trolled up to 10,000 pps per laser diode with a nominal pulseduration of 100 ns. The beam characteristics were evaluated atthe bottom of the silicon surface by imaging the intensity profileusing a CCD chip. Based on the paper by Aspnes and Studna[15], the laser beam at the silicon test surface had a theoretical 15537.6% reflectance with 99% of the entering light absorbed inthe first 17 μm. The reflectance corrected laser power was de-termined by mapping the intensity distribution. The equivalentlaser beam diameter was defined based on the decay of intensityto 10% of the peak intensity. The laser spot size used for this 160study was 1.21 mm diameter, with 0.93 W delivered to the bot-tom of the silicon surface using a 3500-Hz laser pulse frequency.It was shown by Fox et al. [16] that these conditions resulted ina steady temperature at the top of the silicon surface to within0.01% of the surface excess temperature during boiling. 165
For the adiabatic case, a 1-mm-thick aluminum plate witha 0.5-mm-diameter hole formed an orifice through which airwas injected at a controlled rate using a programmable syringepump (Cole Parmer). As designed based on the paper by Teraskaand Tsuge [17], a constant volumetric flow rate was achieved 170by using a hydrophobic porous plug to produce the requiredpressure drop across the orifice. The three-phase contact lineremains pinned at the orifice, as predicted by Dyson [18]. Designdetails are provided in Juarez [19]. A fixed nominal injectionrate of air of 90 mm3/s was used for the adiabatic case. 175
Imaging of the bubbles was obtained using a high-speed,high-resolution (HSHR) camera (Phantom v5.0 with a Mitu-toyo M Plan APO ×10 lens) for the diabatic case (resolutionof 9.2 μm/pixel) and a Nikon J4 camera with a Nikon AFMicro Nikkor 60-mm lens for the adiabatic case (resolution 180of 36.9 μm/pixel). Images were acquired between 1,000 and12,500 fps depending upon the conditions, and for gap heightsbetween 0.52 and 3.25 mm. The chamber was backlit with ahalogen light directed through a fiber-optic cable to a defusingsheet. 185
heat transfer engineering vol. 00 no. 00 2015
December 8, 2015 20:18 806 UHTE_A_1098245
4 R. G. FOX ET AL.
Data Reduction and Uncertainty Analysis
The images for each frame were processed to determine bub-ble size as a function of time from inception to full extraction. ACanny edge detection method was used to determine the extentof the bubble. Since only two-dimensional images were avail-190able, the bubble volume was found by taking one-pixel-high,horizontal slices through the bubble and assuming each slice tobe axisymmetric to calculate the associated volume. All sliceswere then summed to get the total volume of each bubble foreach frame. This volume was then converted to an equivalent195diameter by assuming the total volume to be that of a sphere.To test the accuracy of the algorithm, a ball bearing of 7.15 mmdiameter was imaged and the volume calculated was found tobe within 0.5% and 1.7% of the actual value for the diabatic andadiabatic cases, respectively.200
Uncertainty values for statistically averaged data, includingbubble diameters, times, and frequencies, are reported in the re-sults. However, manufacturer-reported, calibrated, and assumeduncertainties for use in propagation uncertainty analyses arereported here. The uncertainty in gap height is ±0.02 mm,205whereas the uncertainty in a single measured bubble diame-ter is ±0.01 mm and ±0.02 mm for the diabatic and adiabaticcases, respectively. The uncertainty in time measurements is±0.1 ms and ±0.42 ms for the diabatic and adiabatic cases, re-spectively. The calibrated uncertainty in pressure transducer is210±0.2 kPa, and the reported uncertainties for the thermocoupleand syringe pump are ±1.1◦C and ±2.3 mm3/s, respectively.The uncertainty in heat flux was determined to be ±1.7 W/cm2.Assumed uncertainties used in propagation analyses include thatof the membrane permeability, which is ±0.5 × 10⁻¹⁵ m2 and215±1 × 10-15 m2 for the diabatic and adiabatic cases, respectively,±2.5 μm for the membrane thickness, and a ±3% uncertaintyin the maximum area over which extraction is modeled.
Experimental Results
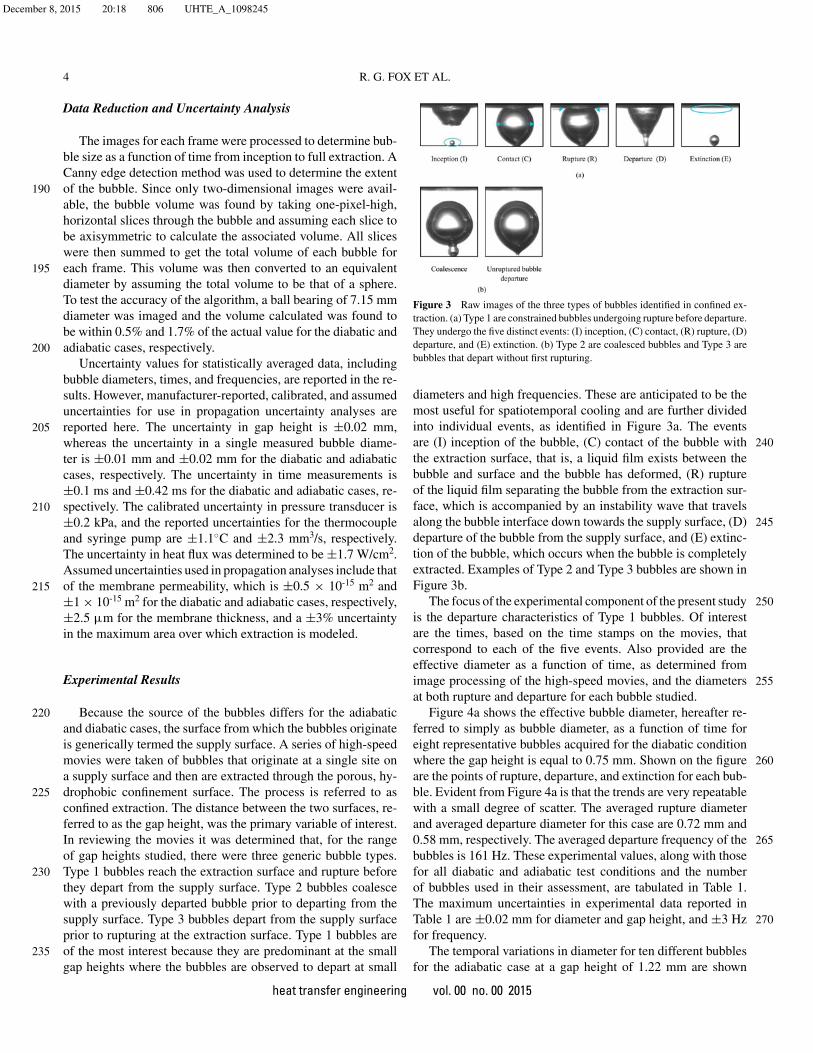
Because the source of the bubbles differs for the adiabatic220and diabatic cases, the surface from which the bubbles originateis generically termed the supply surface. A series of high-speedmovies were taken of bubbles that originate at a single site ona supply surface and then are extracted through the porous, hy-drophobic confinement surface. The process is referred to as225confined extraction. The distance between the two surfaces, re-ferred to as the gap height, was the primary variable of interest.In reviewing the movies it was determined that, for the rangeof gap heights studied, there were three generic bubble types.Type 1 bubbles reach the extraction surface and rupture before230they depart from the supply surface. Type 2 bubbles coalescewith a previously departed bubble prior to departing from thesupply surface. Type 3 bubbles depart from the supply surfaceprior to rupturing at the extraction surface. Type 1 bubbles areof the most interest because they are predominant at the small235gap heights where the bubbles are observed to depart at small
Figure 3 Raw images of the three types of bubbles identified in confined ex-traction. (a) Type 1 are constrained bubbles undergoing rupture before departure.They undergo the five distinct events: (I) inception, (C) contact, (R) rupture, (D)departure, and (E) extinction. (b) Type 2 are coalesced bubbles and Type 3 arebubbles that depart without first rupturing.
diameters and high frequencies. These are anticipated to be themost useful for spatiotemporal cooling and are further dividedinto individual events, as identified in Figure 3a. The eventsare (I) inception of the bubble, (C) contact of the bubble with 240the extraction surface, that is, a liquid film exists between thebubble and surface and the bubble has deformed, (R) ruptureof the liquid film separating the bubble from the extraction sur-face, which is accompanied by an instability wave that travelsalong the bubble interface down towards the supply surface, (D) 245departure of the bubble from the supply surface, and (E) extinc-tion of the bubble, which occurs when the bubble is completelyextracted. Examples of Type 2 and Type 3 bubbles are shown inFigure 3b.
The focus of the experimental component of the present study 250is the departure characteristics of Type 1 bubbles. Of interestare the times, based on the time stamps on the movies, thatcorrespond to each of the five events. Also provided are theeffective diameter as a function of time, as determined fromimage processing of the high-speed movies, and the diameters 255at both rupture and departure for each bubble studied.
Figure 4a shows the effective bubble diameter, hereafter re-ferred to simply as bubble diameter, as a function of time foreight representative bubbles acquired for the diabatic conditionwhere the gap height is equal to 0.75 mm. Shown on the figure 260are the points of rupture, departure, and extinction for each bub-ble. Evident from Figure 4a is that the trends are very repeatablewith a small degree of scatter. The averaged rupture diameterand averaged departure diameter for this case are 0.72 mm and0.58 mm, respectively. The averaged departure frequency of the 265bubbles is 161 Hz. These experimental values, along with thosefor all diabatic and adiabatic test conditions and the numberof bubbles used in their assessment, are tabulated in Table 1.The maximum uncertainties in experimental data reported inTable 1 are ±0.02 mm for diameter and gap height, and ±3 Hz 270for frequency.
The temporal variations in diameter for ten different bubblesfor the adiabatic case at a gap height of 1.22 mm are shown
heat transfer engineering vol. 00 no. 00 2015

December 8, 2015 20:18 806 UHTE_A_1098245
R. G. FOX ET AL. 5
Figure 4 Experimental effective bubble diameter versus time with inception(I), rupture (R), departure (D), and extinction (E) points identified for eachbubble for (a) diabatic case for H = 0.75 mm and 8 bubbles, and (b) adiabaticcase for H = 1.22 mm and 10 bubbles.
Figure 4b. Again, the trends are very consistent with a smalldegree of scatter. However, there appears to be more of an275oscillation in the diameter between the rupture and departureevents than in the diabatic case. Although the cause for thisoscillation is unknown, it may be due to a time varying extractiondiameter. Unfortunately, measuring a diameter at an interfacefrom the images is difficult, as noted by Cooper et al. [20].280
Figure 5 Averaged experimental rupture diameter, DR, and departure diameter,DD, and averaged bubble departure frequency, fD, as a function of gap heightfor diabatic and adiabatic cases.
The averaged experimental diameter data in Table 1 are plot-ted in Figure 5 as a function of gap height. There is a decreasein both the rupture and departure diameters as the gap height isdecreased. Linear regressions were performed on the diabaticand adiabatic rupture diameters and departure diameters as a 285function of gap height, with both in units of millimeters. Thestandard error of each fit is provided in parentheses following theequation. For the diabatic bubble rupture diameter, the equationis
DR = 0.83H + 0.16 (±0.08 mm) (1)
For the adiabatic case, the equation is 290
DR = 0.62H + 0.84 (±0.15 mm) (2)
For the diabatic bubble departure diameter, the equation is
DD = 0.81H (±0.03 mm) (3)
For the adiabatic bubble departure diameter, the equation is
DD = 0.84H (±0.14 mm) (4)
Recall that these correlations are only valid for the range ofH used in the fit; therefore, they are not expected to predict 295unconfined cases for departure or situations in which the gapheight approaches zero. Diameter results estimated from theseequations are provided in Table 1, and denoted as correlationvalues.
Experimental bubble departure frequency for both diabatic 300and adiabatic cases are also provided in Figure 5. There is anobserved increase in departure frequency with decreases in gapheight. The dimensionless frequency, reported in the form of the
heat transfer engineering vol. 00 no. 00 2015

December 8, 2015 20:18 806 UHTE_A_1098245
6 R. G. FOX ET AL.
Table 1 Averaged bubble rupture diameters, departure diameters and departure frequencies from experiments, correlations, bubble model and/or static forcebalance.
Diabatic: H, mm
0.52 0.75 1.07 1.40 1.60 1.67 1.90 ∞
Number of bubbles 109 142 79 93 50 41 9 37DR (mm) Experiments 0.56 0.72 1.09 1.32 1.52 1.53 1.71 N/A
Rupture correlation: Eq. (1) 0.59 0.78 1.05 1.32 1.49 1.54 1.74 N/ADD (mm) Experiments 0.42 0.58 0.93 1.13 1.30 1.35 1.53 1.53
Departure correlation: Eq. (3) 0.42 0.61 0.87 1.13 1.30 1.35 1.54 N/AForce balance 0.44 0.64 0.93 1.22 1.41 1.47 1.69 1.54
fD (Hz) Experiments 260 161 93 56 32 26 20 22Strouhal correlation: Eq. (7) 263 155 85 50 35 32 21 N/ADiameter model 190 162 102 57 37 32 17 22
Adiabatic: H, mm
1.22 2.14 3.25 ∞
Number of bubbles 10 10 10 10DR (mm) Experiments 1.53 2.29 2.80 N/A
Rupture correlation: Eq. (2) 1.60 2.17 2.85 N/ADD (mm) Experiments 0.97 1.91 2.68 2.88
Departure correlation: Eq. (4) 1.02 1.80 2.73 N/AfD (Hz) Experiments 33 13 7 7
Strouhal correlation: Eq. (8) 32 14 6 N/ADiameter model 30 16 9 7
Note. Correlations include those for the bubble departure diameter and frequency. Included is the number of bubbles used in computing the averages.
Strouhal number,
St = fD
√H/
g (5)
is presented as a function of dimensionless gap height in Fig-305ure 6. A characteristic velocity similar to that proposed in Haber-man and Morton [21],
u ∝√
gDD ≈√
gH (6)
is used in defining the Strouhal number. According to Eqs. (3)and (4), H is linearly proportional to DD; therefore, H is used asthe characteristic dimension in the velocity term. The gap height310in Figure 6 is normalized by the unconfined bubble departurediameter, DUD. To be of practical utility, DUD is computed us-ing the correlation given by Kocamustafaogullari [13] for thediabatic cases. For the adiabatic case, DUD is determined usinga static force balance from Thorncroft et al. [14] that includes315growth, buoyancy and surface tension forces and assumes a90-degree contact angle.
The lines in Figure 6 represent linear regressions of the data.For the diabatic case, with the standard error of the fit providedin parentheses, the regression equation is320
St = 2.0(
H/DU D
)−1/2 − 1.5 (±0.07) (7)
and the equation is
St = 0.41(
H/DU D
)−1/2 − 0.27 (±0.03) (8)
for the adiabatic case. Evident from these relations and the
definition of St from Eq. (5) is that the gap height and bub-ble departure diameters are proportionally related. Recall thataccording to Eqs. (3) and (4) the departure diameter is propor- 325tional to the gap height; therefore, the departure frequency isinversely related to the departure diameter. This trend is con-sistent with that for unconfined bubbles, as is reported in Carey[22]. Again, frequency values using these equations are pro-
Figure 6 Strouhal number as a function of dimensionless gap height for di-abatic and adiabatic cases. Linear regressions are also provided: Eq. (7) fordiabatic case and Eq. (8) for adiabatic case.
heat transfer engineering vol. 00 no. 00 2015

December 8, 2015 20:18 806 UHTE_A_1098245
R. G. FOX ET AL. 7
Figure 7 Averaged experimental times between events for all gap heights fordiabatic and adiabatic cases.
vided in Table 1 for comparison and are denoted as correlation330values.
The data were also used to determine the time intervals be-tween events, which are shown in Figure 7. For both the diabaticand adiabatic cases, the times from inception to contact andfrom inception to departure decrease dramatically as the gap335height is reduced. However, there is no discernable trend withgap height in the time between contact and rupture. The time ittakes from departure to extinction also decreases with decreasesin gap height. This decrease may be related to the smaller vol-umes that need to be extracted for smaller bubbles. However,340the predictability of this time would also depend upon the rateof extraction, which depends upon the extraction area, whichmay also vary with gap height. The time between rupture anddeparture for the diabatic cases decreases with gap height from3 to 0.8 ms, which from Figure 7 appears small when compared345to the decrease in the total duration of the bubble. There is nodiscernable trend in this time interval for the adiabatic case. Asexpected for a constant volumetric injection rate, as is the casefor the adiabatic case, the wait time is insignificant. The waittime is also negligible for the diabatic case, which suggests that350the volumetric growth rate of the bubble is also constant fordiabatic conditions.
The bubble volume variation with time for a single bubbleis shown in Figure 8a for the diabatic case for each of thegap heights of 0.52, 0.75 and 1.07 mm and in Figure 8b for355the adiabatic case for a 2.14 mm gap height. The points ofdeparture (D), rupture (R), and extinction (E) are specific to theseparticular bubbles and are presented because they represent theboundaries defining the various regimes. Starting with the regionbetween departure and extinction, the slopes are fairly linear up360until very close to extinction. Cappello et al. [10] found Darcy’s
Figure 8 Experimental bubble volume versus time for (a) diabatic case withgap heights of 0.52, 0.75, and 1.07 mm, and (b) adiabatic case with a gap heightof 2.14 mm.
Law, as reported from DeWeist [23],
Vext = K�P Aext
μgδ(9)
to predict well the extraction process when the area of the bubblein contact with the extraction surface is used. Because the slopesof the extraction only regime vary between the three diabatic 365cases presented, whereas the membrane characteristics, driving
heat transfer engineering vol. 00 no. 00 2015

December 8, 2015 20:18 806 UHTE_A_1098245
8 R. G. FOX ET AL.
pressure difference, and thermophysical properties do not, thissuggests that the extraction area likely depends upon gap height.It appears the extraction areas decrease with gap height, whichis consistent with the smaller bubble size at smaller H.370
In Figure 8a, between the point of rupture and point of de-parture for the gap heights of 0.75 and 1.07 mm, the slope alsoappears to be fairly linear. This suggests that the extraction andgrowth rates are likely both constant throughout. It could alsobe that the growth rate decreases as the extraction rate increases,375although what would be contributing to a decrease in growth isunclear. For the smallest gap height of 0.52 mm for the diabaticcase in Figure 8a and for the 2.14 mm adiabatic case in Figure8b, however, there is clearly a change in slope from near rup-ture to near departure. For the adiabatic case with a constant380growth rate, this change indicates that the rate of extractionchanges between these two points. This is also assumed for thediabatic case. The only variable that could be responsible forthe change in extraction rate, according to Darcy’s Law, is theextraction area. Unfortunately, it is difficult to tell what is hap-385pening without a study of the three-phase contact-line dynamicsat the extraction surface.
The injection rate is well approximated by the slope of thecurve between inception (I) and rupture (R) in Figure 8b. FromFigure 8a it is evident that the volumetric growth rate from390inception to near rupture can also be fairly well approximatedas constant. However, the fact that the slopes decrease withdecreasing H for these three diabatic test cases although theheat supplied is constant is noteworthy. For a fixed heat inputto a bubble, in which C′ is some fraction of heat, q, supplied to395the surface that enters the bubble, a constant volumetric growthrate can be predicted from
VG = C ′qρghlv
(10)
For an unconfined bubble C′ was empirically determined tobe 0.06 for the measured volumetric growth rate of 41.7 mm3/s.The observed differences in volumetric growth rate during the400growth-only regime suggest that the heat input to the bubble,that is, the coefficient C′, is likely influenced by the presenceand height of the gap.
To help explain what may contribute to this change in vol-umetric flow rate, a plot of experimental volumetric flow rate405versus gap height for the diabatic cases is provided in Figure 9.A quadratic regression analysis, in which H is in millimeters,yields
VG = −70H 2 + 184H − 49.7 (±8.8 mm3/s) (11)
The experimental volumetric flow rate values are also tabu-410lated in Table 2 along with the total number of bubbles recorded,the number of bubbles experiencing rupture prior to departure(Type 1), the number of bubbles that coalesce while still at-tached to the supply surface (Type 2), and the number of singlebubbles that depart prior to rupture (Type 3). See Figure 3b for415examples of these types of bubbles. Also note that the number of
Figure 9 Experimentally determined inlet volumetric growth rates as a func-tion of gap height for the diabatic case and quadratic fit provided in Eq. (11).
bubbles may differ from those in Table 1, which has the numberof bubbles included in assessing the averages reported. Not allbubbles were deemed adequate for diameter and/or frequencyassessments. 420
Apparent from Figure 9 is that for a gap height of 0.75 mm theexperimental volumetric flow rate of 41.7 mm3/s for unconfinedbubbles is a good approximation. Note that this gap height isapproximately half of the unconfined bubble departure diameter,DUD. For the lowest gap height of 0.52 mm, the heat input to 425the bubble appears to be suppressed as indicated by a lowervolumetric growth rate. Although a decrease in heat input isundesirable, the added benefit of being able to more closelyspace nucleation sites may counteract this drawback. For gapheights greater than 1 mm, the heat input to the bubble appears 430to be improved over that of the unconfined case. Although thereason for this is not clear, evident from Table 2 is that theoccurrence of coalesced bubbles and bubbles that depart priorto rupture increases significantly, from essentially zero to over50%. It is believed that the hydrodynamics may be altering the 435amount of supplied heat that gets into a Type 1 bubble followingone of the other types of bubbles.
Bubble Diameter Model and Force Balance
Because the correlations developed in the previous sectionare limited in applicability to conditions in which the data were 440acquired, a theoretical model to predict the diameter and fre-quency at which bubbles depart is preferred. To determine thedeparture criterion for unconfined bubble departure, Thorncroftet al. [14] started with the transient momentum equation validfor bubble formation in a pool, the equation of which is provided 445
heat transfer engineering vol. 00 no. 00 2015

December 8, 2015 20:18 806 UHTE_A_1098245
R. G. FOX ET AL. 9
Table 2 Experimental volumetric growth rate for Type 1 bubbles, the number of bubbles for each bubble type, and the number of bubbles observed for each gapheight for the diabatic case.
Number of bubbles
H (mm) All bubbles Type 1 Type 2 Type 3 VG(mm3/s)
0.52 112 112 0 0 310.75 156 153 3 0 401.07 177 79 85 13 771.40 247 85 141 21 781.60 220 47 148 25 651.67 224 40 160 24 521.90 277 9 225 43 55
Note. Types of bubble are identified in Figure 3.
here,
d (mu)
dt= FB + FG + Fσ,sup + Ry,sup + (mu)i (12)
with the inlet momentum included and FB representing the netbuoyant force. The momentum balance reduces to a static forcebalance at departure because the transient term is assumed neg-ligible due to the small bubble mass and the inlet momentum450also goes to zero as the bubble is pinched off. Also, the reactionforce, Ry,sup, that results from van der Waal forces acting throughthe meniscus at the supply surface goes to zero at departure [14].The momentum balance in Eq. (12) modified for the conditionswith confined extraction is455
d (mu)
dt= FB + FG + Fσ,sup + Ry,sup + Ry,ext
+ (mu)i − (mu)e (13)
For confined extraction the reaction force at the extractionsurface, Ry,ext, is also likely to be negligible, not because oflift-off, which does not occur at this surface at departure, butbecause of the porous hydrophobic nature at that surface. Unlikethe inlet momentum, however, the exit momentum does not ap-460proach zero at bubble departure. The magnitudes of the terms inEq. (13), except for the reaction forces and transient momentumterm, are computed over the course of the bubble lifetime in or-der to elucidate relevant physics and determine the applicabilityof applying a static force balance to predict departure diameter,465that is, the practicality of neglecting the exit momentum.
If the diameter of the bubble is known as a function of time,as is represented schematically in Figure 10a, the predicted de-parture diameter can be used in conjunction with the diameterversus time relation to determine the time it takes between in-470ception and departure. Given that the wait time is negligible, asnoted from Figure 7, the inverse of this time would provide aprediction of the bubble departure frequency.
Because the volumetric flow rate during the growth onlyregime can be approximated as constant, as shown schematically475in Figure 10b as a linear line on a bubble volume verse time plot,and because extraction can be modeled through Darcy’s Law,there exists the potential to develop a theoretical model thatpredicts bubble diameter as a function of time. The theoretical
bubble diameter model is based on conservation of mass for the 480three different regimes shown in Figure 11. Also shown in Fig-ure 11 are the force terms and momentum terms to be assessedduring the lifetime of the bubble. Regime I, shown in Figure11a, only has mass entering and is known as the growth onlyregime, starting at inception and ending at the point the bub- 485ble ruptures at the extraction surface. To be considered in theforce/momentum analysis are the inlet momentum, net buoyantforce, surface tension force at the supply surface, and the growthforce. Regime II experiences both growth and extraction, start-ing at the point of rupture and ending at the point at which the 490bubble departs from the supply surface. Figure 11b shows theforce and momentum terms to be considered in Regime II, which
Figure 10 Schematic representations of (a) bubble diameter versus time and(b) bubble volume versus time. At the moment a bubble departs (D) a newbubble forms (I).
heat transfer engineering vol. 00 no. 00 2015

December 8, 2015 20:18 806 UHTE_A_1098245
10 R. G. FOX ET AL.
includes the net buoyancy force, the surface tension force at thesupply surface, and the inlet momentum from Regime I, plusthe exit momentum and surface tension at the extraction surface.495The vertical growth rate upon rupture is negligible; hence, thegrowth force in this regime is considered negligible. Regime III,initiated at departure and ending at extinction, is shown in Figure11c. Although not important to model in terms of finding the de-parture diameter and departure frequency, including Regime III500can aid in the understanding of the physics. In Regime III, onlyexit momentum and the surface tension force at the extractionsurface are considered.
Bubble Diameter Model
The control volume used in the development of the bubble505diameter model is shown in Figure 1. In all cases the density ofthe bubble is assumed constant.
Regime I. A transient mass balance in which mass enters thesystem at a fixed rate equal to VG yields
DI (t) = 3
√6VG t
π(14)
where time, t, is set to zero at bubble inception. This equation510is valid for all of Regime I, from inception (I) to rupture (R),where tR is determined by dividing the volume at rupture bythe growth rate, VG . The volume at rupture is determined usingrupture diameters predicted from Eqs. (1) and (2) for diabaticand adiabatic cases, respectively.515
Regime II. After the bubble ruptures, growth is accompa-nied by extraction. For the present study, it is assumed that theextraction process does not influence the rate of growth andthat the rate at which mass leaves by extraction is consistentwith Darcy’s Law, provided in Eq. (9). A transient mass balance520considering mass entering and leaving the system yields
DI I (t) = 3
√6
π
[VR + VG (t − tR) − K�PAext,I I
μgδ(t − tR)
](15)
This equation is only valid from rupture (R) to departure (D),that is, tR < t ≤ tD. This equation is also only valid for a constantextraction area, when in reality the extraction area is expectedto increase from a value of zero at rupture. A modified form of525this equation is presented after a variation in extraction area isassumed, at which point the prediction of tD is also addressed.
Regime III. Following bubble departure, the rate of growthgoes to zero and the mass inside the bubble is balanced bythe rate of mass removed. Again, using Darcy’s Law to model530extraction yields
DI I I (t) = 3
√6
π
[VD − K�PAext,I I I
μgδ(t − tD)
](16)
which is applicable from departure (D) to extinction (E). The ex-traction area, Aext,III, is assumed constant because of the constantextraction rates observed during Regime III.
Figure 11 Force and momentum terms considered on a bubble during theregimes: (a) Regime I: growth only, (b) Regime II: growth with extraction, and(c) Regime III: extraction only.
heat transfer engineering vol. 00 no. 00 2015
December 8, 2015 20:18 806 UHTE_A_1098245
R. G. FOX ET AL. 11
Relevant information needed for Eqs. (14) through (16) are535the following: (i) growth rate, (ii) diameter (volume) of thebubble at rupture, which is used to indicate the onset of RegimeII, (iii) the diameter of the extraction area during Regime II,which is expected to vary over time and start at a value ofzero at the point of rupture, (iv) the bubble departure diameter540(volume), used to indicate when to turn off growth at the onsetof Regime III, and (v) the diameter of the extraction area duringRegime III.
The growth rate for the diabatic case is simply the volu-metric injection rate of the air, the averaged value of which is54588.1 mm3/s. For these initial stages of model development, thecorrelation provided by Eq. (11) is used for the diabatic case.Ideally, a theoretical model to predict the heat input to the bubblewould be available for use.
The diameter of the bubble at which rupture occurs, DR, may550eventually also be theoretically predicted, perhaps using surfaceenergy. However, at these initial stages of model development,the empirical values predicted from Eq. (1) for the diabatic caseand Eq. (2) for the adiabatic case are used to assess the rupturevolume.555
The departure diameter is generally predicted as the bubblediameter that balances the static forces immediately prior todeparture. The forces to employ in a static force balance forconfined extraction are assessed in the next section.
The diameter of the bubble in contact with the extraction560surface is needed to compute the extraction area in Darcy’s Lawand the surface tension at the extraction surface. For the presentpurposes the extraction rates in Regime III are fairly constantso the extraction diameters are also expected to be constant.For Regime III, an extraction diameter equal to the departure565diameter well predicts the observed extraction rates; therefore,it is assumed that
dext,I I I = DD (17)
where DD is computed from Eq. (3) for the diabatic case andEq. (4) for the adiabatic case. Based on images taken from thehigh-speed camera, these values are consistent.570
In Eq. (15) the extraction rate during Regime II is assumedconstant. However, as noted previously, in all likelihood the ex-traction area will be close to zero at rupture and then increasein size. Ideally the velocity of the contact line at the extractionsurface would be determined from a theoretical model employ-575ing surface energy phenomena. For the present study, a linearvariation of the extraction area from zero to Aext,III is assumedbetween the time of rupture and time of departure, yielding theextraction area relation
Aext,I I = Aext,I I It − tR
tD − tR(18)
from which dext,II can be determined. Note that the departure580time, tD, is not known a priori. Therefore, for the present studythe departure time is estimated from the Strouhal relations inEqns. (7) and (8) for the diabatic and the adiabatic cases, re-spectively.
Incorporating the variable extraction area from Eq. (18) into 585the Regime II mass balance and integrating yields
DI I (t) = 3
√6
π
[VR + VG (t − tR) − K�PAext,I I I
2μgδ (tD − tR)(t − tR)2
](19)
In summary, Eqs. (14), (16), (17), and (19) are used to assessbubble diameter versus time.
Force/Momentum Assessment
In Regimes I and II, inlet momentum and net buoyancy force 590are computed using volumetric growth rates and bubble diame-ters predicted from the bubble diameter model. Both act upward.The inlet momentum is computed from
(mu)i = 4ρg V 2G
πd2sup
(20)
and the net buoyancy is found using
FB = π
6
(ρl − ρg
)gD3 (21)
The surface tension force at the supply surface and the growth 595force from [14], both of which act downward, are
Fσ,sup = −dsupσπsinθsup (22)
and
FG = −π
4ρl D2
(1.64r2
)(23)
respectively, where r is determined from
r = kntn−1 (24)
For both adiabatic and diabatic cases, n = 1/3. For the adia-batic case, k in Eq. (24) is 0.00277 m/s1/3 and dsup is simply the 600orifice diameter. For the diabatic case, k is 0.00215 m/s1/3 and
dsup = Dsinθsup (25)
In Regimes II and III, the exit momentum is
(mu)e = ρg Aext
(K�P
μgδ
)2
(26)
which acts upward, as does the surface tension force at theextraction surface,
Fσ,ext = dextσπsinθext (27)
The extraction area and extraction diameter for the appropri- 605ate regime, that is, II or III, should be employed. Each force andmomentum term is computed for each point in time using thebubble diameter determined from the bubble diameter model.
Equation (24) was derived for a spherical bubble growingnormal to the supply surface; therefore, it should become zero 610when the bubble first makes contact with the extraction surface.However, bubble growth may not be spherical and a bubble may
heat transfer engineering vol. 00 no. 00 2015

December 8, 2015 20:18 806 UHTE_A_1098245
12 R. G. FOX ET AL.
make contact at a diameter smaller than the gap height. This isevident from Figure 5, which shows that the rupture diametercan be less than the gap height. Therefore, the growth force in615the current model is terminated at rupture.
Bubble Model Validation and Preliminary Model Results
To validate the bubble diameter model, departure diametersand departure frequencies for both diabatically and adiaticallygenerated bubbles under unconfined conditions were predicted.620A static force balance including growth and net buoyant and sur-face tension forces was employed to assess departure diameters.Based on this departure diameter, the bubble diameter modelwas used to predict diameter versus time during the growthphase until the departure diameter condition is reached. This625resulted in a prediction of the time from inception to departure.By taking the inverse of this time, the departure frequency wasdetermined. Thermophysical properties for the diabatic studywere determined for saturated conditions at 1 atm, and at 20◦Cand 1 atm for the adiabatic study.630
Once the static force balance and bubble diameter model arevalidated, bubble diameters, forces, and momentum terms canbe predicted for each point in time under confined extractionconditions. Ideally, various combinations of θext and θsup can beassessed to find the single combination yielding the best predic-635tion of the experimental departure diameters and frequencies,as well as the trends in the three regimes. Experimentally char-acterized values of permeability, K, are 6.2 × 10⁻¹⁵ m2 and7.5 × 10-15 m2, respectively, for vapor and dry air and are usedin the current model (Cappello et al. [10]).640
Model Validation
For the diabatic case, the unconfined departure diameter anddeparture frequency were predicted using the unconfined bubblegrowth rate of 41.7 mm3/s and a supply surface contact angle of14.5 degrees. The predicted values are 1.54 mm and 21.8 Hz,645compared with experimental values of 1.53 mm and 22.4 Hz,respectively, which is used as validation of the model. Note thatthe contact angle, although on the low end, is within the rangereported for static contact angles on a silicon surface accordingto Williams and Goodman [24].650
For the adiabatic case, the unconfined departure diameterand departure frequency were predicted using a bubble growthrate of 88.1 mm3/s and a 90-degree contact angle at the supplysurface. Predicted values are 2.85 mm and 7.24 Hz, comparedwith 2.88 mm and 7.2 Hz determined experimentally.655
Bubble Departure Diameters from Static Force Balance
Plotted in Figure 12 are the time-varying forces and the inletand exit momentums shown in Figure 11, as well as the sumof only the forces, �, for the diabatic case with a gap height of0.75 mm. In this particular case, and all others under the current660
Figure 12 Forces and momentums from Figure 11 along with sum of forcespresented versus time for diabatic case with H = 0.75 mm. Note that momen-tum terms are two orders of magnitude smaller than forces, hence not clearlydistinguishable.
test conditions, both inlet and exit momentum terms are negli-gible (two orders of magnitude smaller than the surface tensionforces) in comparison to the other contributions throughout thebubble’s existence. Therefore, a static force balance must alsobe valid for predicting bubble departure diameters for confined 665extraction.
In terms of the physics, it is evident from Figure 12 thatthe surface tension at the extraction surface, the magnitude ofwhich is affected by the diameter and contact angle at the three-phase contact line, is the dominant mechanism for Type 1 bubble 670departure. This finding suggests that the proposed configurationwith small gap heights can be used in a variety of orientationsand in low gravity environments.
Also evident from Figure 12 is that the growth force is signif-icant only immediately following inception. However, because 675the vertical increase in growth, r , is restricted by the extractionsurface, the growth force is only important up until the bubblereaches the contact surface. Because the exact time at whichcontact occurs is difficult to determine, and therefore the diame-ter at this time, for consistency the growth force is set to zero at 680the point of rupture. Therefore, for Type 1 bubbles undergoingconfined extraction, the departure diameter is predicted from astatic force balance in which the buoyant force and the surfacetension forces at the supply surface and the extraction surfaceare included. 685
Bubble Departure Frequencies from Bubble Model
Diabatic volumetric growth rates from Eq. (11) were usedin the bubble diameter model with confined extraction. Initially
heat transfer engineering vol. 00 no. 00 2015

December 8, 2015 20:18 806 UHTE_A_1098245
R. G. FOX ET AL. 13
the 14.5-degree contact angle used in validating the model wasemployed with a 125-degree static contact angle measured at690the hydrophobic surface using a sessile drop. However, the re-sults did not compare well with experimental data. Therefore,the values of θext and θsup that best fit the trends over the range oftest conditions were 165 degrees and 30 degrees, respectively.Although the value used at the supply surface is greater than that695found for matching the data for unconfined bubble departure,it is still in the range of values reported for static contact an-gles on a silicon surface [24]. Furthermore, given the additionalupward force acting on the bubble after rupture, the supply sur-face contact angle might be expected to be greater than for the700unconfined case.
Likewise, although the static contact angle of a sessile waterdroplet on the hydrophobic extraction surface in the presenceof air was found to be 125 degrees, the existence of downwardgravitational forces, the fact that it is a vapor/liquid interface as705opposed to a gas/liquid interface in contact with the hydropho-bic membrane, and the fact that vapor is being removed couldall contribute to a higher contact angle at the extraction sur-face. In any event, the results are highly sensitive to the contactangles at both surfaces. Ideally, a theoretical model for pre-710dicting dynamic contact angles at both surfaces would be quitebeneficial.
For the diabatic case with a gap height of 0.75 mm, a depar-ture diameter of 0.64 mm was predicted using the static forcebalance, which is within 10% of the averaged experimental715value. The diameter of the bubble as a function of time was pre-dicted using the bubble diameter model, the results of which areprovided in Figure 13a, with data from Figure 4a superimposed.The point of rupture, R, is predicted from Eq. (1). The point ofdeparture, D, is predicted using departure diameter determined720from a static force balance. The inverse of the time from incep-tion to when the departure diameter is reached is used to assessthe departure frequency. It was predicted to be 162 Hz, whichis within 1% of the experimental value of 161 Hz. The bubblediameters predicted clearly represent the experimental trends725and departure conditions fairly well for this case. The depar-ture diameter and frequency predictions for all diabatic casesare tabulated in Table 1. Departure diameters predicted from astatic force balance are within 10% of experimental values anddeparture frequencies predicted from the bubble diameter model730are within 30% of experimental values.
The agreement in trends is not quite as good for the diabaticcase with a gap height of 0.52 mm as it was for the 0.75-mmcase, as is evident from Figure 13b. However, because of the useof empirical estimates for the volumetric growth rate and for the735rupture diameter, the assumptions regarding unknown trends indext,II and dext,III, and finally the sensitivity to contact angles, thepredictive nature of the bubble diameter model coupled with thestatic force balance is considered to be very good and with greatpotential once the empiricism is minimized or removed.740
For the diabatic case, the value of θsup can be assumed to beessentially constant [14], whereas dsup varies with bubble diam-eter, as noted from Eq. (25). Recall also that Eq. (3) suggests
Figure 13 Predicted bubble diameter versus time for diabatic case overlaidexperimental data for (a) H = 0.75 mm and (b) H = 0.52 mm. Points R and Drepresent DR from Eq. (1) and DD from a static force balance.
a decrease in bubble diameter with a decrease in gap height.Therefore, for the diabatic cases, in accordance with Eq. (22) 745for a fixed θsup, a decrease in gap height yields a decrease in theonly downward acting force, that is, the surface tension force atthe supply surface. This decrease in the only downward actingforce is consistent with a prediction of smaller departure diam-eters from a static force balance, as expected for smaller gap 750heights.
heat transfer engineering vol. 00 no. 00 2015

December 8, 2015 20:18 806 UHTE_A_1098245
14 R. G. FOX ET AL.
Figure 14 Predicted bubble diameter versus time for adiabatic case overlaidexperimental data for H = 1.22 mm. Points R and D represent DR from Eq. (2)and DD from Eq. (4).
For the adiabatic case, however, dsup is constant and equal tothe supply orifice diameter. Therefore, to force a single combi-nation of θsup and θext for all three adiabatic cases would result ina single value for the downward force that is independent of gap755height. The consequence of this is that the static force balanceyields a constant bubble departure diameter, independent of thegap height. Because this is not the case from observations, a re-lation for the dependence of θsup on bubble diameter is needed.Therefore, the value of DD for the adiabatic cases is determined760using Eq. (4), the empirical result of departure diameter ver-sus gap height, rather than from a static force balance. Thisvalue of DD is then used with the bubble diameter model to pre-dict the bubble departure frequency. In Figure 14, the adiabaticdata from Figure 4b are again plotted with the bubble diame-765ter predictions, with rupture diameter and departure diameterpredictions overlaid. The trend in diameter is well predicted,although the departure diameter is somewhat higher, as notedfrom Table 1, than the experimental value. It is expected that byincluding a larger data set the experimental averages will result770in a better predictive correlations for both rupture and departurediameters. The departure frequencies predicted using the bubbledeparture model reported in Table 1 are within 10% to 30% ofthe experiment values.
In summary, a static force balance that includes the buoy-775ancy force, and the surface tension forces at both the supplyand extraction surface, predicts fairly well diabatic bubble de-parture diameters. The semiempirical bubble diameter modelyields fairly decent values of bubble departure frequency forboth diabatic and adiabatic cases. However, both the bubble di-780ameter model and the static force balance would benefit fromhaving more theoretically based predictions of the three-phasecontact line dynamics at the extraction surface and conditions
for bubble rupture. The force balance could be greatly improvedwith a better understanding of, and a better ability to predict, 785the dynamic contact angles at the hydrophobic porous surfacewhile undergoing extraction and at the supply surface for theadiabatic case.
Finally, there is obviously a practical limitation to this tech-nique. If the extraction rate is less than the rate at which vapor 790is generated for cooling applications, there will be a vapor layerthat could easily lead to dryout. For a given volumetric growthrate, which is related to the heat input by Eq. (10), the followingcan be used to assess the minimum acceptable gap height, H:
H ≥√
4VGμgδ
πB2 K�P(28)
In this equation B is the slope of the departure diameter 795correlation in Eq. (3), and δ, K, μg, and �P are characteristicsof the extraction conditions determined by the application.
CONCLUSIONS AND RECOMMENDATIONS
High-speed movies of confined extraction of individual va-por and gas bubbles supplied at a constant volumetric flow rate 800were studied for a range of confinement, or gap, heights. Ofthe types of bubbles identified, the ones studied are those thatruptured prior to departing from the surface from which theywere supplied. These are most relevant to addressing spatiotem-poral cooling needs. The bubble dynamics are categorized into 805three regimes: Regime I: bubble growth only, Regime II: simul-taneous growth with extraction, which follows rupture of thebubble at the extraction surface; and Regime III: bubble extrac-tion only, which occurs after the bubble departures from thesupply surface. 810
Correlations for predicting the diameter at which the bubblesrupture and at which they depart and for predicting the departurefrequency were generated for both the diabatic and adiabaticcases. The bubbles depart at a fixed fraction of the gap heightwhereas the departure frequency is inversely related to the gap 815height. This inverse relation between diameter and frequency istypical of bubble departure under unconfined conditions. Boththe diabatic and adiabatic cases experienced no wait times.
At these initial stages of model development, empirical cor-relations were used in a static force balance to determine bubble 820departure diameter for a given condition, which was subse-quently used in a theoretically based dynamic bubble diametermodel for predicting bubble departure frequencies. A study ofthe forces acting on the bubble as a function of time shows thatthe surface tension force at the extraction surface is the driving 825factor for inducing small bubble departure diameters. Other im-portant forces to include are the surface tension at the supplysurface and net buoyancy. The exit momentum and inlet mo-mentum are negligible. Also, the presence of the confinementsurface suppresses the growth force after the bubble makes con- 830tact with this surface. Because the time of contact is hard to
heat transfer engineering vol. 00 no. 00 2015

December 8, 2015 20:18 806 UHTE_A_1098245
R. G. FOX ET AL. 15
predict, the growth force is turned off after rupture and, unlikein the static force balance for an unconfined situation, is notincluded in a static force balance for confined extraction. Theforce balance is highly sensitive to the contact angle at both835the extraction surface and the supply surface. A practical limi-tation on the minimum gap height for a given bubble injectionrate is provided, where the injection rate can theoretically bedetermined from the heat input.
To improve the bubble diameter model, an experimental rela-840tion as a minimum, or preferably a theoretically based relation,is needed for the time varying extraction area following rupture.A study of the mechanism(s) responsible for bubble rupture anda study of the dynamic contact angle at a hydrophobic poroussurface during the extraction process are also of interest. In845addition, a study as to what influence the gap height plays onthe fraction of supplied heat that enters the bubble would bebeneficial.
NOMENCLATURE
A area m2850B Constant in Eq. (28)—C′ fraction of heat entering bubble in Eq. (10)—D diameter of three-dimensional objects: bubbles md diameter of two-dimensional objects: contact areas mf frequency Hz855F force Ng gravitational acceleration kg-m/s2
hlv enthalpy of phase change J/kgH extraction surface gap height mk growth rate constant in Eq. (24) m/s1/3860m mass flow rate kg/s�P power input N/m2
q time and space averaged heat flux Wr radial growth rate m/sRy reaction force normal to supply/extraction surfaces N865t time sSt Strouhal number —u velocity m/sV volume m3
V volumetric flow rate m3/s870
Greek Symbols
θ contact angle degreesδ membrane thickness mσ surface tension N/mρ density kg/m3875K membrane permeability m2
μ dynamic viscosity N-s/m2
� summation of forces N
Subscripts
B net buoyant880
D departuree exitext extractiong gas for adiabatic and vapor for diabatic studiesG growth 885i inletl liquid phaseR rupturesup supplyUD unconfined departure 890σ surface tensionI Regime III Regime IIIII Regime III
Bubble Events 895
C contactD departureE extinctionI inceptionR rupture 900
REFERENCES
[1] Hamann, H. F., Lacey, J., Weger, A., and Wakil, J.,Spatially-Resolved Imaging of Microprocessor Power(SIMP): Hotspots in Microprocessors, Tenth IntersocietyConference on Thermal and Thermomechanical Phenom- 905ena in Electronics Systems, ITHERM ’06, San Diego, CA,pp. 121–125, 2006.
[2] Judd, R. L., On Nucleation Site Interaction, Journal ofHeat Transfer, vol. 110, pp. 475–478, May 1988.
[3] Apreotesi, M., Pence, D. V., and Liburdy, J. A., Vapor 910Extraction From Flow Boiling in a Fractal-Like Branch-ing Heat Sink, IPACK 2007-33423, Proc. of IPACK2007,ASME InterPACK’07, Vancouver, BC, Canada, pp.321–328, 2007.
[4] David, M. P., Khurana, T., Hidrovo, C., Pruitt, B. L., and 915Goodson, K. E., Vapor-Venting, Micromachined Heat Ex-changer for Electronics Cooling, ASME 2007 InternationalMechanical Engineering Congress and Exposition, SeattleWA, pp. 951–960, 2007.
[5] Fang, C., David, M., Rogacs, A., and Goodson, K. 2010, 920Volume of Fluid Simulation of Boiling Two-Phase Flowin a Vapor-Venting Microchannel, Frontiers in Heat andMass Transfer, vol. 1, no. 1, 2010.
[6] Qu, W., and Mudawar, I., Measurement and Prediction ofPressure Drop in Two-Phase Micro-Channel Heat Sinks, 925International Journal of Heat and Mass Transfer, vol. 46,no. 15, pp. 2737–2753, 2003.
[7] David, M. P., Steinbrenner, J. E., Miler, J., and Goodson,K. E., Adiabatic and Diabatic Two-Phase Venting Flow in a
heat transfer engineering vol. 00 no. 00 2015

December 8, 2015 20:18 806 UHTE_A_1098245
16 R. G. FOX ET AL.
Microchannel, International Journal of Multiphase Flow,930vol. 37, no. 9, pp. 1135–1146, 2011.
[8] Xu, J., Vaillant, R., and Attinger, D., Use of a PorousMembrane for Gas Bubble Removal in Microfluidic Chan-nels: Physical Mechanisms and Design Criteria, Microflu-idics and Nanofluidics, vol. 9, no. 4–5, pp. 765–772,9352010.
[9] Salakij, S., Liburdy, J. A., Pence, D. V., and Apreotesi,M., Modeling In-Situ Vapor Extraction During Convec-tive Boiling in Fractal-Like Branching Microchannel Net-works, International Journal of Heat and Mass Transfer,940vol. 60, pp. 700–712, 2013.
[10] Cappello, N., Pence, D. V., and Liburdy, J. A., MassTransport Limitations Through Porous HydrophobicMembranes, ASME 2013 Fluids Engineering DivisionSummer Meeting, Lake Tahoe, CA, 2013.945
[11] Fazeli, A., Mortazavi, M., and Moghaddam, S., Hierarchi-cal Biphilic Micro/Nanostructures for a New GenerationPhase-Change Heat Sink, Applied Thermal Engineering(2015), vol. 78, pp. 380–386, 2015.
[12] Ivey, J. J., Relationships Between Bubble Frequency, De-950parture Diameter and Rise Velocity in Nucleate boiling,International Journal of Heat and Mass Transfer, vol. 10,no. 8, pp. 1023–1040, 1967.
[13] Kocamustafaogullari, G., Pressure Dependence of BubbleDeparture Diameter for Water, International Communi-955cations in Heat and Mass Transfer, vol. 10, no. 6, pp.501–509, 1983.
[14] Thorncroft, G. E., Klausner, J. F., and Mie, R., Bub-ble Forces and Detachment Models, Multiphase Sci-ence and Technology, vol. 13, no. 3&4, pp. 35–76,9602001.
[15] Aspens, D. E., and Studna, A. A., Dielectric Functions andOptical Parameters of Si, Ge, GaP, GaAs, GaSb, InP, InAs,and InSb from 1.5 to 6.0 eV, Physical Review B, vol. 27,no. 2, pp. 985–1009, 1983.965
[16] Fox, R. G., Juarez, C. D., Pence, D. V., and Liburdy,J. A., Altering Bubble Dynamics via Vapor Extraction,ASME 12th International Conference on Nanochannels,Microchannels, and Minichannels, ICNMM2014-22258,Chicago, IL, 2014.970
[17] Terasaka, K., and Tsuge, H., Bubble Formation UnderConstant-Flow Conditions, Chemical Engineering Sci-ence, vol. 48, no. 19, pp. 3417–3422, 1993.
[18] Dyson, D. C., Contact Line Stability at Edges: Commentson Gibb’s Inequalities, Physics of Fluids, vol. 31, no. 2,975pp. 229–232, 1988.
[19] Juarez, C. D., The Influence of Gas Extraction on Bub-ble Dynamics, University Honors College Thesis, OregonState University, Corvallis, OR, 2015.
[20] Cooper, M. G., Mori, K., and Stone, C. R., Behaviour of980Vapour Bubbles Growing at a Wall With Forced Flow.International Journal of Heat and Mass Transfer, vol. 26,no. 10, pp. 1489–1507, 1983.
[21] Haberman, W. L., and Morton, R. K., An ExperimentalInvestigation of the Drag and Shape of Air Bubbles Rising 985in Various Liquids, Navy Department Report, September1953.
[22] Carey, V. P., Liquid–Vapor Phase-Change Phenomena,Hemisphere Publishing Corporation, New York, NY,February 1992. 990
[23] De Weist, R. J. M., Flow Through Porous Media, AcademicPress, New York, NY, 1967.
[24] Williams, R., and Goodman, A. M., Wetting of Thin Layersof SiO2 by Water, Applied Physics Letters, vol. 25, no. 10,pp. 531–532, 1974. 995
Randall G. Fox is a Ph.D. student in mechanicalengineering at Oregon State University. His doctoralwork is on boiling dynamics in the presence of aconfining porous hydrophobic surface with vapor ex-traction. He graduated with bachelor’s degrees in me- 1000chanical engineering and applied mathematics fromOregon Institute of Technology in 2008.
Corey D. Juarez was an undergraduate student inOregon State University’s Honors College, and theSchool of Mechanical, Industrial, and Manufactur- 1005ing Engineering. He obtained his honors bachelor’sof science in mechanical engineering in March 2015.His undergraduate research was focused on isolat-ing the hydrodynamics present during nucleate poolboiling, and modeling bubble departure while being 1010extracted through a confining hydrophobic poroussurface.
Deborah V. Pence is a professor of mechanical engi-neering at Oregon State University. She received herPh.D. from Clemson University is 1995. Her research 1015interests are focused on thermal management witha focus at the microscale. She has co-authored 71peer-reviewed journal and conference publications.She served as editor for, and currently serves on theeditorial board of, Experimental Thermal and Fluid 1020Science.
James A. Liburdy is the J. R. Welty Professor ofMechanical Engineering at Oregon State University.He received graduate degrees from Stanford and PennState and his undergraduate degree from Cornell Uni- 1025versity, where he specialized in turbulent heat transferand fluid dynamics. He is a fellow of the AmericanSociety of Mechanical Engineers, has served as chairof the ASME Fluid Engineering Division, and hasheld chair positions of several technical committees 1030in both the ASME Heat Transfer and Fluid Engineer-
ing divisions. He has also served as associated editor of the Journal of HeatTransfer and Journal of Fluids Engineering. He has been the principal inves-tigator on a number of projects funded by NASA, the Department of Energy(DoE), Air Force Office of Scientific Research (AFOSR), and Office of Naval 1035Reseach (ONR), as well as industry members such as General Electric, Xerox,Westinghouse, AT&T, and others. He currently has more than 200 peer-reviewedpublications and has served as a consultant to NASA, ONR, Lawrence Liver-more Laboratory, and others.
heat transfer engineering vol. 00 no. 00 2015