Embed Size (px)
Citation preview

Simon AzoulayChairman and Chief Executive Officer
Bruno BenolielDeputy Chief Executive Officer
Paris, September 23rd 2020
ALTEN2020 First Half Results

September 23rd 2020 l ALTEN - 2020 First Half Results
DISCLAIMER
“This presentation may contain information that may be considered forward‐looking. Thisinformation constitutes trends or targets and should not be considered to be a forecast of theCompany’s results or any other performance indicator.
By its nature, this information is subject to risk and uncertainty, which may be outside theCompany’s control in certain cases. A more detailed description of these risks and uncertaintiesappears in the Company’s Universal Registration Document, available on its website(www.alten.com).”

September 23rd 2020 l ALTEN - 2020 First Half Results
ACTIVITY IN FIRST HALF 2020

September 23rd 2020 l ALTEN - 2020 First Half Results
ALTEN, LEADER IN ENGINEERING AND TECHNOLOGY CONSULTING (ETC)
Revenue:
€1,240.4 M36,100 employeesOper. Profit on Activity:
€75.2 M
INTERNATIONAL:
60.4% of revenue€749.3 M: +3.9% including ‐2.2% organic
+0.3% forex
FRANCE:
39.6% of revenue
€491.1 M: ‐14%Including ‐13.7% organic
GEARING: ‐19.2 %87% OF TOTAL HEADCOUNT
FOOTPRINT INOVER 25 COUNTRIES
6.1% of revenue
31,440 engineers
‐4.0%Including ‐7.3% organic
RESULTS ARE STRONGLY IMPACTED BY THE HEALTH CRISIS4
DECEMBER 2019: 32,550 (‐1 110)
JUNE 2019: 31,200 (+240)

J u n e 2 0 2 0 : 3 1 , 4 4 0
D e c em b e r 2 0 1 9 : 3 2 , 5 5 0 ( ‐ 1 , 1 1 0 )
J u n e 2 0 1 9 : 3 1 , 2 0 0 ( ‐ 2 4 0 )
GEOGRAPHIC FOOTPRINT PER CONTINENT (NUMBER OF ENGINEERS)
AMERICA ASIA I PACIFIC
ENGINEERS
1,740
EUROPE (EXCL. FRANCE)
5,050
MIDDLE‐EAST I AFRICA860
12,840
1 , 6 4 0
7 7 0
1 3 , 1 5 0
FRANCE 10,9501 1 , 5 1 0
4 , 1 3 0
5
+ 1 0 0
‐ 5 6 0
‐ 3 1 0
+ 9 0
+ 9 2 0
ENGINEER HEADCOUNT IS ALMOST STABLE BETWEEN JUNE 2019 AND JUNE 2020 .PART IAL UNEMPLOYMENT FOR NEARLY 2 ,000 ENGINEERS ( FRANCE & GERMANY) +2% ADDIT IONAL BENCH

September 23rd 2020 l ALTEN - 2020 First Half Results
ALTEN’S POSITIONING
Risk level Position Estimated gross margin % Group’s activity
4 CAPEX investments: internal R&D, IP, Risksharing, Edition, Prototyping, pre‐production Random & long term 0%
3 Work PackagesWith Technical Direction & Methods 28% ‐ 35%
60%Including 1/3
on ALTEN’s sites
2Consulting / Technical Assistance
With added value: HR management and bench risks
22% ‐ 35% 38%
1 Staffing, Freelance, 5 ‐ 18% 2%
NB: ‐ Level 5 = manufacturer (Tier‐1 plant & production)‐ Level 6 = industry (OEM – complete integrator)
6

Internal IS
Internalnetwork
IS & Internal networks(Enterprise Services for IT/IS Department)
=30%
Engineering(Products & Services Delivered)
=70%
ConsultingPMOOrganisation
Expertise & Training
Customer Support
Operations
EngineeringOutsourced R&D
Conception & Design
EngineeringIndustrial process &
Manufacturing engineering
ALTEN’sCore business
IS softwares & applications
NetworkInfra, Cloud,Security
BPOSoftware package
BPOinfrastructures
Support 1 & 2
Support 1 & 2
ALTEN’S POSITIONING
7
17.6%
4.4%
12.0%
8.2%5.5%8.2%
11.6%
6.7%
6.8%
4.7%
14.3%
€1,240.4 M
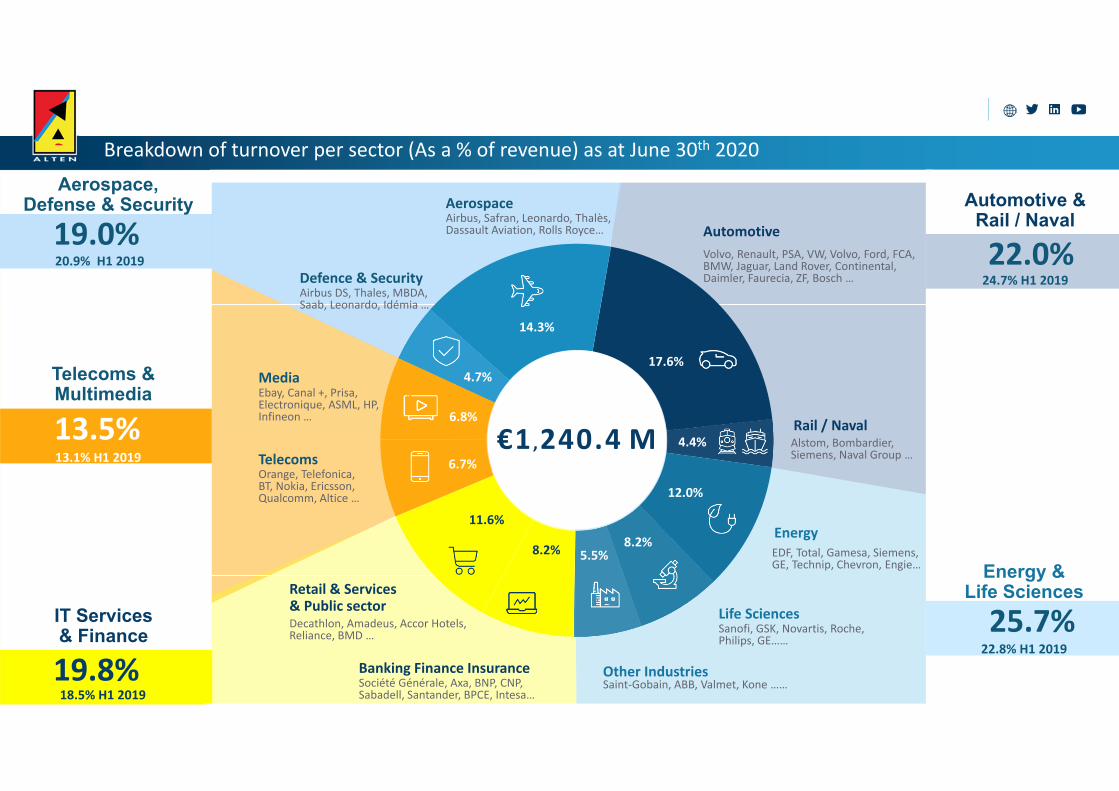
Breakdown of turnover per sector (As a % of revenue) as at June 30th 2020
AerospaceAirbus, Safran, Leonardo, Thalès, Dassault Aviation, Rolls Royce…
Defence & SecurityAirbus DS, Thales, MBDA,Saab, Leonardo, Idémia …
MediaEbay, Canal +, Prisa, Electronique, ASML, HP,Infineon …
Banking Finance InsuranceSociété Générale, Axa, BNP, CNP, Sabadell, Santander, BPCE, Intesa…
Retail & Services & Public sectorDecathlon, Amadeus, Accor Hotels, Reliance, BMD …
TelecomsOrange, Telefonica, BT, Nokia, Ericsson, Qualcomm, Altice …
AutomotiveVolvo, Renault, PSA, VW, Volvo, Ford, FCA,BMW, Jaguar, Land Rover, Continental, Daimler, Faurecia, ZF, Bosch …
Rail / NavalAlstom, Bombardier,Siemens, Naval Group …
EnergyEDF, Total, Gamesa, Siemens, GE, Technip, Chevron, Engie…
Other IndustriesSaint‐Gobain, ABB, Valmet, Kone ……
Life SciencesSanofi, GSK, Novartis, Roche, Philips, GE……
19.0%
13.5%
19.8%
Telecoms & Multimedia
IT Services & Finance
20.9% H1 2019
13.1% H1 2019
18.5% H1 2019
22.0%
25.7%
Energy & Life Sciences
22.8% H1 2019
24.7% H1 2019
Automotive & Rail / Naval
Aerospace, Defense & Security

RAIL :• Investment programmes are continued as equipment in infrastructures and supplies.•Development of export markets.•Opportunities in the Bombardier/Alstom merge.
NAVAL :•Development of submarine markets – exportation & French Navy.•Growth and modernisation of ship fleets should not as for now be impacted by the decreased activityof cruise companies and maritime transport.
OUR MARKETS
17.6%
4.4%
RAIL/NAVAL
Already in a difficult situation in 2019, the automotive sector has been heavily impacted by the healthcrisis.
Volumes similar to those of 2019 will not be reached end 2021/early 2022 but many technologicalprogrammes must be completed such as: electrification, autonomous vehicle, embedded software and connected services.
Activity should resume in 2021.
AUTOMOTIVE
9

OUR MARKETS
14.3%
4.7%
DEFENCE & SECURITY
Civil areonautics are impacted by a decrease in air traffic which should resume very slowly. Therefore, panel consolidation at automakers as well as engine and equipment manufacturers is an opportunity to acquire marketshares. Securing competences is essential to resume their activity.In addition to projects associated with Data, Digital and PLM to improve productivity, we may also foresee someprojects of the future: autonomous aircraft, connected aircraft, carbon‐free aircraft, etc., which will boost activitiesstarting from 2022/2023.
Space should resume growth as soon as 2021, after a year of financial scarcity due to changes in production and launching calendars. ALTEN’s positioning on engineering fields such as systems, mechanics, electronics and software development is promising whilst launchers are undergoing change.
Defence & Security were less impacted even though the activity slowed down during the health crisis. Export markets
are developing; European programmes are being pursued (tank and fighter aircraft).
ALTEN is also well positioned on a strong growth in IoT, Big Data, AI and Cyber security, hence enabling a positive
outlook.
AERONAUTICS/SPACE
10

OUR MARKETS
8.2%
12.0%
Because of the health crisis, public administrations and pharmaceutical laboratories will change theirstrategies for relocation and more investment in clinical research. Projects associated with regulatory changes are being pursued.
Investment in connected medical equipment (ehealth, IoT, embedded softwares) will accumulate.
Compliance of quality systems with ISO 13485 standards is driving projects.
Even if it activity was resuming in 2018/2019, the sector of Oil & Gas is again impacted by declining oilprices. Several projects were postponed (excluding LNG projects).
Nuclear is however not impacted by the crisis as several important programmes were launched (new EPR; refurbishment, security and dismantling of plants).
Investments in carbon‐free energy are growing.
ENERGY
LIFE SCIENCES
11

OUR MARKETS
6.7%
19.8% Investments in Banks/Insurance are temporarily slowed down, however the outlook is favourablethanks to the development of digital (apps, website, infrastructure, cloud and security). Sharp decrease in Retail in Q2 and punctuel drop in investments. Need to accelerate the digitaltransformation of distribution channels (logistics and sales) and big data/analytics to supportbusiness by mid‐2021.
The health crisis had little impact on telecoms due to the invoicing methods of providers and a reinforced criticality of networks during the crisis.
5G & FTTH projects are postponed to 2021. Developing investments in equipment and network infrastructures is necessary.
BFI/SERVICES/PUBLIC SECTOR
TELECOMS
12

September 23rd 2020 l ALTEN - 2020 First Half Results
CONTINUED GROWTH STRATEGY THROUGH ACQUISITIONS
ALTEN HAS COMPLETED 3 ACQUISITIONS OVERSEAS:One Chinese/Japanese company specialised in IT(annual revenue: €18 M, 400 consultants)
One company in South Korea specialised in software development and PLM (annual revenue: €21 M, 300 consultants)
One company in US/Ukraine in IT and software development(annual revenue: €7.5 M, 100 consultants)
THANKS TO A TARGETED PLAN FOR EXTERNAL GROWTH,ALTEN PURSUES ITS INTERNATIONAL DEVELOPMENT, MORE SPECIFICALLY IN ASIA.
13

September 23rd 2020 l ALTEN - 2020 First Half Results
FCPE Alten1.08%
SHAREHOLDER BASE AS AT SEPTEMBER 17TH 2020
% in shares
Founder14.91%
Treasury stock1.36%
Publ ic82.65%
14
Euronext ParisSegment A
FR 0000071946(SRD)
% of voting rights
Founder 26.21%
FC Alten 0.95%
Public 72.84%
• CAPITALISATION (AS AT 17/09/20):
€2,631 M• NUMBER OF SHARES (AS AT 17/09/20):
34 200 567

September 23rd 2020 l ALTEN - 2020 First Half Results
2020 FIRST HALF RESULTS

September 23rd 2020 l ALTEN - 2020 First Half Results
ONGOING INTERNATIONAL GROWTH
INT
FR
51 .8%48 .6%
48 .2%
39 .6%
60 .4%
55 .8%
51 .4%
46 .7%
53 .3%
44 .2%
54 .2%
45 .8%
H1 2015 H1 2016 H1 2017 H1 2020H1 2018 H1 2019
764.2870.5
1,240.41,292.3
1,099.9983.7
Revenue in €M
16

September 23rd 2020 l ALTEN - 2020 First Half Results
HEADCOUNT PROGRESSION
INT
FR
2015 2016 2017 2018 2019 S1 2020
18,000 engineers
50 . 4%
49 . 6%
28,000
21,400 engineers
54 . 8%
45 . 2% 41 . 8% 38 . 0% 36 . 4% 35 . 4%
62 . 0%
58 . 2%
64 . 6%63 . 7%
24,100
20,433
24,700 engineers
37,200
29,600 engineers33,700 32,550 engineers
36,10031,440 engineers
17

September 23rd 2020 l ALTEN - 2020 First Half Results
GROWTH IN BUSINESS ‐ GROUP
‐4.0%
‐7.3%
+0.2%
€M H1 2019 Revenue H1 2020 RevenueChange/l-f-l
H1 2019 Revenue
1,289.7
2.5
1,196.2
41.7
2.5
1,292.3 1,240.4
Revenue on a l-f-l basis
Change in scope
FX impact
Consolidated revenue
+3.1%
The sustained organic growth that started many years agowas stopped by the health crisis in Q2 2020.
18

September 23rd 2020 l ALTEN - 2020 First Half Results
GROWTH IN BUSINESS ‐ FRANCE
‐14.0 %
‐13.7 %
€M H1 2019 Revenue H1 2020 Revenue
568.7
2.5
491.1
571.2 491.1
Revenue on a l-f-l basis
Change in scope
FX impact
Consolidated revenue
In Q2, the impacts of the health crisis in France werestronger than in other countries.
Change/l-f-lH1 2019 Revenue
19

September 23rd 2020 l ALTEN - 2020 First Half Results
GROWTH IN BUSINESS ‐ INTERNATIONAL
+3.9%
‐2.2%
+0.3%
€M H1 2019 Revenue H1 2020 Revenue
721.1 705.1
41.7
2.5
721.1 749.3
Revenue on a l-f-l basis
Change in scope
FX impact
International - TOTAL
+5.8%
Although growth was stopped by the health crisis, its impacts are fewer thanin France and more heterogeneous depending on the geographical areas.
Change/l-f-lH1 2019 Revenue
20

September 23rd 2020 l ALTEN - 2020 First Half Results
PROGRESSION OF ORGANIC GROWTH IN 2020
% Q1 Q2 H1
France 0.4% ‐27.9% ‐13.7%
International 6.8% ‐11.0% ‐2.2%
GROUP 3.9% ‐18.4% ‐7.3%
Growth on constant business days 3.0% ‐18.5% ‐7.8%
Very strong impact of the health crisis in Q2 2020
21

September 23rd 2020 l ALTEN - 2020 First Half Results
YTD Change
COUNTRY 2019 % 2020 % Published Change in scope
Forex Organic, excl. Forex effect
FRANCE 571.2 44.2% 491.1 39.6% ‐ 14.0% ‐ 0.4% 0.0% ‐ 13.7%
INTERNATIONAL 721.1 55.8% 749.3 60.4% 3.9% 5.8% 0.3% ‐ 2.2%
NORTH AMERICA 151.3 11.7% 162.9 13.1% 7.6% 4.7% 2.2% 0.7%
GERMANY 121.6 9.4% 106.5 8.6% ‐ 12.4% 3.6% 0.0% ‐ 16.0%
SCANDINAVIA 102.8 8.0% 90.3 7.3% ‐ 12.1% 3.4% ‐ 0.9% ‐ 14.6%
SPAIN 78.1 6.0% 79.4 6.4% 1.7% 4.8% 0.0% ‐ 3.1%
BENELUX 77.7 6.0% 78.4 6.3% 0.8% 2.5% 0.0% ‐ 1.6%
ASIA PACIFIC 43.5 3.4% 58.0 4.7% 33.4% 27.9% ‐ 1.5% 7.0%
ITALY 51.4 4.0% 57.3 4.6% 11.3% 0.0% 0.0% 11.3%
UK 39.4 3.0% 54.4 4.4% 38.1% 22.9% 0.0% 15.2%
SWITZERLAND 25.1 1.9% 29.3 2.4% 17.0% 0.0% 6.8% 10.3%
OTHERS 30.2 2.3% 32.9 2.7% 8.8% 0.0% ‐ 3.1% 11.9%
TOTAL 1 292.3 100.0% 1 240.4 100.0% ‐ 4.0% 3.0% 0.2% ‐ 7.3%
BREAKDOWN OF TURNOVER PER GEOGRAPHICAL AREA AS AT JUNE 30TH 2020
22

September 23rd 2020 l ALTEN - 2020 First Half Results23
Q1 2020 Q2 2020 H1 2020
COUNTRY Published Organic, excl. Forex effect Published Organic, excl.
Forex effect Published Organic, excl. Forex effect
FRANCE ‐ 0.1% 0.4% ‐ 28.2% ‐ 27.9% ‐ 14.0% ‐ 13.7%
INTERNATIONAL 13.2% 6.8% ‐ 5.2% ‐ 11.0% 3.9% ‐ 2.2%
NORTH AMERICA 24.7% 16.3% ‐ 7.9% ‐ 13.3% 7.6% 0.7%
GERMANY ‐ 2.3% ‐ 6.3% ‐ 22.9% ‐ 26.0% ‐ 12.4% ‐ 16.0%
SCANDINAVIA ‐ 2.3% ‐ 3.8% ‐ 22.3% ‐ 25.8% ‐ 12.1% ‐ 14.6%
SPAIN 6.8% 1.4% ‐ 3.3% ‐ 7.6% 1.7% ‐ 3.1%
BENELUX 7.0% 2.0% ‐ 5.1% ‐ 5.1% 0.8% ‐ 1.6%
ASIA PACIFIC 32.4% 12.7% 34.3% 1.9% 33.4% 7.0%
ITALY 14.9% 14.9% 7.9% 7.9% 11.3% 11.3%
UK 57.7% 34.0% 18.3% ‐ 3.6% 38.1% 15.2%
SWITZERLAND 19.6% 12.7% 14.4% 7.8% 17.0% 10.3%
OTHERS 15.7% 17.0% 2.0% 6.9% 8.8% 11.9%
TOTAL 7.3% 4.0% ‐ 15.2% ‐ 18.4% ‐ 4.0% ‐ 7.3%
BREAKDOWN OF TURNOVER PER GEOGRAPHICAL AREA AS AT JUNE 30TH 2020

September 23rd 2020 l ALTEN - 2020 First Half Results
CONDENSED INCOME STATEMENT
The operating margin on activity is highly impacted by the health crisis.
€M H1 2019 H1 2020 Change %
Revenue 1,292.3 1,240.4 ‐4.0 %
Operating Profit on ActivityAs % of Revenue
116.69.0%
75.26.1%
‐35.6 %
Share‐based payments ‐3.2 ‐2.5
Non‐recurring profit ‐4.5 ‐4.0
Operating profitAs % of revenue
108.98.4%
68.75.5%
‐37.0 %
Financial Income 0.1 11.5
Income tax expenseEMCs and minority interests
‐34.92.3
‐21.01.5
Net income, Group ShareAs % of revenue
76.45.9%
60.64.9%
‐20.6 %
24

September 23rd 2020 l ALTEN - 2020 First Half Results
FINANCIAL INCOME ANALYSIS
H1 2019 H1 2020Cost of net financial debt ‐0.4 ‐0.3
Interests on leasing contracts (IFRS16) ‐0.8 ‐0.9
Cost of financial debt and lease ‐1.2 ‐1.2
Forex result 1.0 ‐0.2
Other net financial income 0.3 12.9
FINANCIAL INCOME 0.1 11.5
25

September 23rd 2020 l ALTEN - 2020 First Half Results
CONDENSED INCOME STATEMENT BY REGION
€M H1 2019France
H1 2019Intl.
H1 2019Group
H1 2020France
H1 2020Intl.
H1 2020Group
Revenue 571.2 721.1 1,292.3 491.1 749.3 1,240.4
Operating Profit on ActivityAs % of revenue
56.39.9%
60.38.4%
116.69.0%
21.14.3%
54.07.2%
75.26.1%
Share-based payments -2.9 -0.3 -3.2 -1.3 -1.2 -2.5
Non-recurring profit & impairment -1.4 -3.1 -4.5 -1.6 -2.4 -4.0
Operating ProfitAs % of revenue
52.09.1%
56.97.9%
108.98.4%
18.23.7%
50.56.7%
68.75.5%
Financial income 0.3 -0.2 0.1 10.5 1.0 11.5
Income tax expenseEMCs and minority interests
-19.52,8
-15.4-0,6
-34.92,3
-8.21,5
-12.80,0
-21.01,5
Net income, Group shareAs % of revenue
35.66.2%
40.85.7%
76.45.9%
22.04.5%
38.65.1%
60.64.9%
26

September 23rd 2020 l ALTEN - 2020 First Half ResultsGear ing is – 19.2%
A VERY HEALTHY BALANCE SHEET
CURRENT ASSETS:
1,003.8
o/w customer receivables: 860.6
NON‐CURRENT ASSETS:
843.9
o/w goodwill: 535.6Incl. right of use: 174.0
Cash & cash equivalents: 202.6Cash & cash equivalents : 258.3
CURRENT ASSETS:
916.2
o/w customer receivables: 745.0
NON‐CURRENT ASSETS:
820.4
o/w goodwill: 551.3Incl. right of use: 161.3
ASSETS EQUITY & LIABILITIES
2 , 0 50 . 1 1 , 9 9 4 . 9 2 , 0 5 0 . 1 1 , 9 9 4 . 9
N‐C LIABILITIES: 176.0Incl. lease debts: 125.0
CURRENT LIABILITIES:
619.5Incl. lease debts: 41.5
o/w customer‐driven liabilities: 94.5
SHAREHOLDER’S EQUITY:
1,168.0
o/w Group Share: 1,168.6
CURRENT LIABILITIES:
630.5Incl. lease debts: 42.8
o/w customer‐driven liabilities:107.6
N‐C LIABILITIES: 181.4Incl. lease debts: 134.1
SHAREHOLDER’S EQUITY:
1,113.3
o/w Group share: 1,113.8
Current financial liabilities: 124.9
De c embe r 2 019 De c embe r 2 019J une 2020 J une 2020
27
Current financial liabilities: 31.4

CHANGE IN NET CASH POSITION (€M)
Free cash flow: +134.9
‐3.4
Net cash31/12/2019
Net cash30/06/2020
Other financingflows
Self‐financingcapacity
Tax paid Change in WCR Financial investments
DividendsCapex Flows fromlease debtsIFRS16
17.9‐25.195.1
‐26.2
74.9
98.5
12,5
Incl. 27.1IFRS16
Incl. ‐1.9 IFRS16
224.3
0
‐7.4
28

September 23rd 2020 l ALTEN - 2020 First Half Results
FREE CASH FLOW ANALYSIS
H1 2019 H1 2020 H1 202012 months
201912 months
6 months 12 months
OPERATIONAL CASH FLOW (MBA) AS % OF REVENUE
123.19.5%
71.45.8%
272.010.4%
220.48.4%
DEPRECIATION OF RIGHTS OF USE ANDFINANCIAL COSTS
22.8 27.1 48.3 52.6
CASH FLOW (MBA) IFRS16 145.9 98.5 320.3 273.0
TAX PAID (29.0) (26.2) (77.1) (74.3)
CHANGE IN WCR (27.9) 95.1 (18.8) 102.6
FLOWS FROM LEASE DEBT (22.1) (25.2) (46.3) (47.8)
CASH FROM OPERATIONSAS % OF REVENUE
66.95.2%
142.311.3%
178.16.8%
253.59.7%
CAPEX (8.0) (7.4) (17.9) (17.2)
FREE CASH FLOWAS % OF REVENUE
58.94.6%
134.910.9%
160.36.1%
236.39.0%
29
September 23rd 2020 l ALTEN - 2020 First Half Results
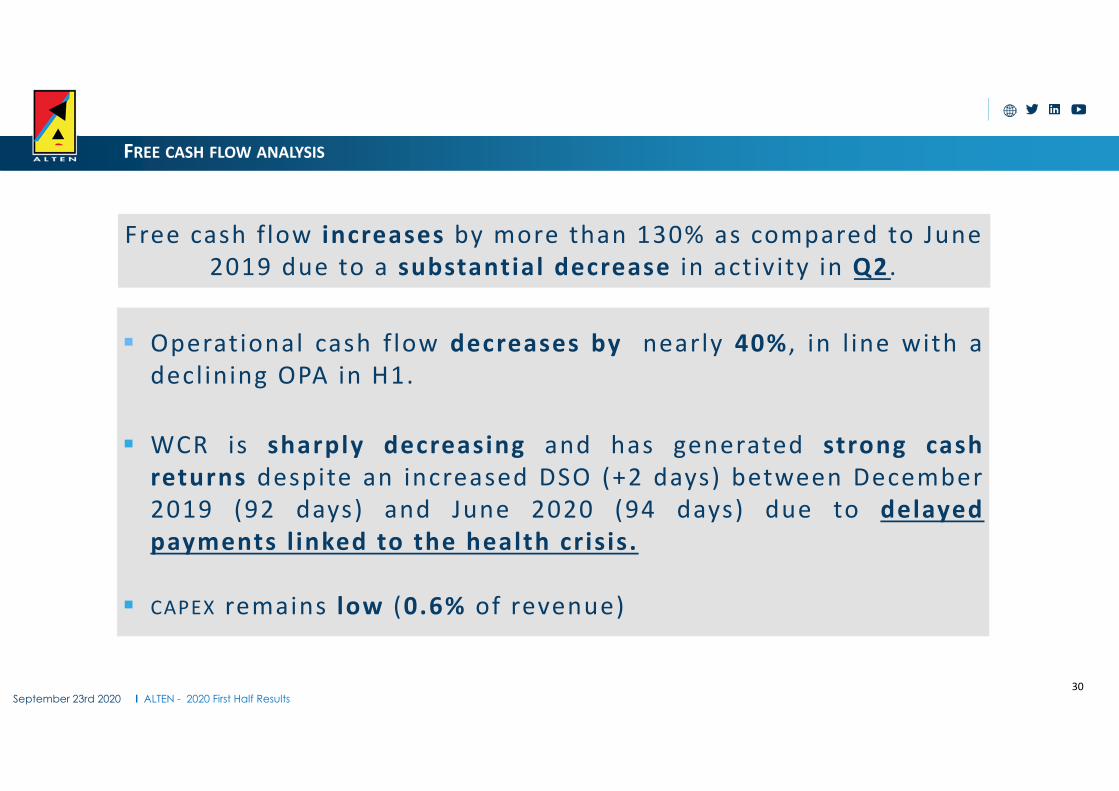
Free cash f low increases by more than 130% as compared to June2019 due to a substantial decrease in activity in Q2 .
FREE CASH FLOW ANALYSIS
Operational cash flow decreases by nearly 40% , in l ine with adecl ining OPA in H1.
WCR is sharply decreasing and has generated strong cashreturns despite an increased DSO (+2 days) between December2019 (92 days) and June 2020 (94 days) due to delayedpayments linked to the health crisis.
CAPEX remains low (0.6% of revenue)
30

September 23rd 2020 l ALTEN - 2020 First Half Results
IFRS16 FINANCIAL IMPACTS
31
A S S E T S
L I A B I L I T I E S
BALANCE SHEET ( € M )
INCOMESTATEMENT
( € M )
F INANCINGSTATEMENT
( € M )
Rights of use 161.3
Deffered tax ‐0.1
161.2
Consolidated reserves 0.2
Net income ‐0.2
Lease debt 166.5
Rent free ‐5.3
161.2
OPA 0.6
Financial income ‐0.9
Tax 0.1
Net income ‐0.2
V e r y l o w i m p a c t o n P & L N o i m p a c t o n T F T & G r o u p c a s h f l o w
Cash flowDepreciation of rights of use & financial costs
27.1
WCR ‐1.9
Suppression of flows from lease debts
‐25.2
Free cash flow 0
IFRS16 lease debts are not included in the net cash flows of ALTEN Group. They account for €166.5 M at end of June 2020 (o/w 88% estate, 10% vehicles, 2% other).
SYNTHÈSE
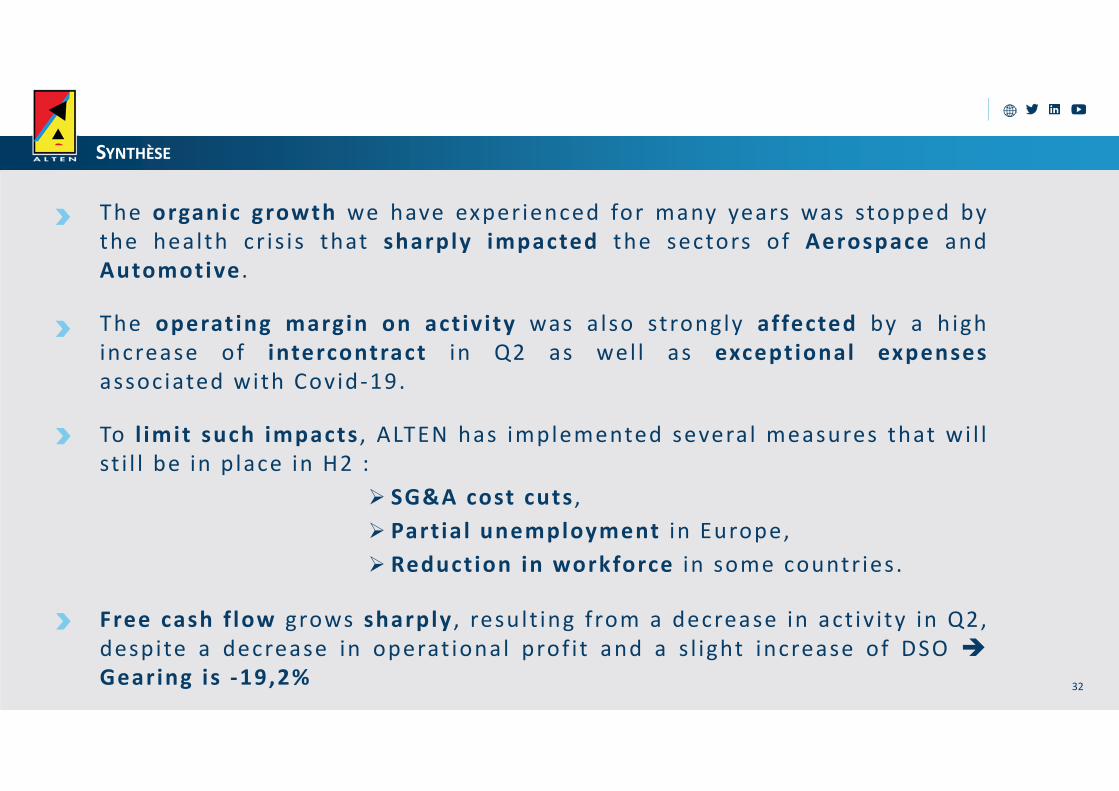
The organic growth we have experienced for many years was stopped bythe health cr is is that sharply impacted the sectors of Aerospace andAutomotive .
The operat ing margin on act iv ity was also strongly affected by a highincrease of intercontract in Q2 as wel l as exceptional expensesassociated with Covid ‐19.
To l imit such impacts , ALTEN has implemented several measures that wi l lst i l l be in place in H2 :
SG&A cost cuts , Part ial unemployment in Europe, Reduction in workforce in some countr ies.
Free cash flow grows sharply , result ing from a decrease in act iv i ty in Q2,despite a decrease in operat ional prof i t and a sl ight increase of DSO Gearing is ‐19,2% 32

September 23rd 2020 l ALTEN - 2020 First Half Results
GROWTH STRATEGY

STRATÉGIE ET DÉVELOPPEMENT
34
The health cr is i s has mainly impacted the fo l lowing sectors : Aeronaut ics (France and Germany) Automot ive ( s ince H2 2019 in Europe and in the US) .Both sectors should however exper ience s ign i f i cant technolog ica lt ransformat ions in the next few years with subsequent h igh investments in R&D.
ALTEN i s current ly implement ing an act ion plan for the next three yearsa iming to boost internat iona l development and divers i ty in bus iness sectors , more spec i f i ca l ly Energy, L i fe Sc iences , IT serv ices , etc .
Regarding externa l growth, ALTEN act ive ly p lans to complete acquis i t ions of a l a rger s i ze ‐ on an internat iona l leve l and in France, in order to acce lerate i tsdeve lopment .

CONCLUSION
35
Thanks to our cul ture based on a r igorous management and a very
healthy balance sheet structure, we were able to face the Covid ‐19
cr is i s and are now given the resources to boost catch ‐up.
ALTEN therefore conf i rms more than ever i ts strategy ‐ centered on the
Engineer, with a plan to divers i fy i ts bus iness sectors pos i t ionning and
geographica l footpr int .
ALTEN i s conf ident with the goal to reach its ear ly 2019 business
posi t ion again at the end of 2021, as wel l as resume sharp growth with
an OPA next to 10% and an internat ional act iv i ty above 65%.

September 23rd 2020 l ALTEN - 2020 First Half Results
APPENDICES
September 23rd 2020 l ALTEN - 2020 First Half Results
BALANCE SHEET – ASSETS (IN THOUSANDS OF EUROS)
37
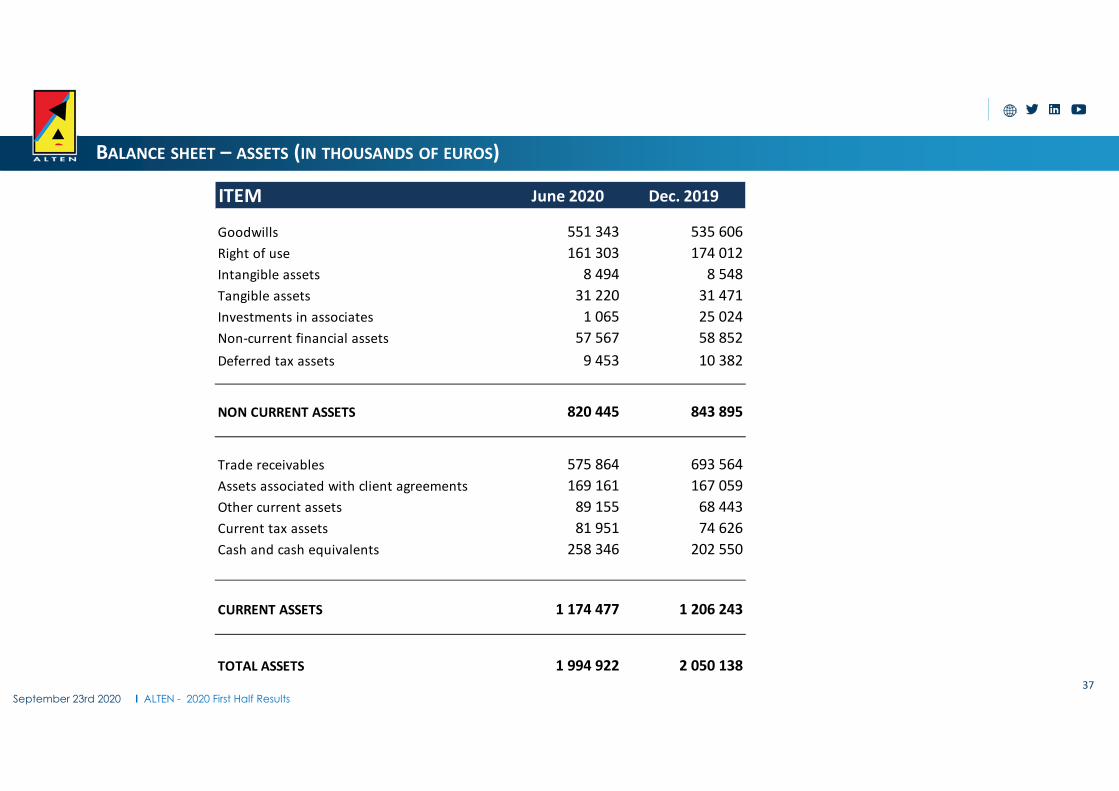
ITEM June 2020 Dec. 2019
Goodwills 551 343 535 606Right of use 161 303 174 012Intangible assets 8 494 8 548Tangible assets 31 220 31 471Investments in associates 1 065 25 024Non‐current financial assets 57 567 58 852Deferred tax assets 9 453 10 382
NON CURRENT ASSETS 820 445 843 895
Trade receivables 575 864 693 564Assets associated with client agreements 169 161 167 059Other current assets 89 155 68 443Current tax assets 81 951 74 626Cash and cash equivalents 258 346 202 550
CURRENT ASSETS 1 174 477 1 206 243
TOTAL ASSETS 1 994 922 2 050 138

September 23rd 2020 l ALTEN - 2020 First Half Results
BALANCE SHEET – LIABILITIES (IN THOUSANDS OF EUROS)
38
ITEM June 2020 Dec.2019
Capital 35 888 35 864Premiums 60 250 60 250Consolidated reserves 1 011 813 853 413Consolidated earnings 60 646 164 225
SHAREHOLDERS' EQUITY 1 168 597 1 113 752
MINORITY INTERESTS ‐571 ‐425
Employee benefits 14 538 13 743Provisions 7 771 11 745Non-current financial liability 3 108 3 111Non-current Lease debt 125 015 134 128Other non-current liabilities 24 909 18 171Deferred tax liabilities 623 476
NON CURRENT LIABILITIES 175 963 181 374
Provisions 7 238 8 807Current financial liabilities 31 382 124 864Current lease debt 41 471 42 806Trade payables 97 633 90 119Other current liabilities 362 793 367 293Assets associated with client agreements 94 524 107 561Current tax liabilities 15 893 13 987
CURRENT LIABILITIES 650 933 755 437
TOTAL LIABILITIES 1 994 922 2 050 138

September 23rd 2020 l ALTEN - 2020 First Half Results
INCOME STATEMENT (IN THOUSANDS OF EUROS)
39
ITEM H1 2020 H1 2019NET REVENUE 1 240 380 1 292 252
Purchase consumed ‐121 136 ‐109 557Payroll expenses ‐920 932 ‐934 428External charges ‐82 384 ‐98 406Taxes other than on income ‐6 663 ‐6 538Depreciation and amortization ‐33 055 ‐29 382Other operating income and expenses ‐1 047 2 708
OPERATING PROFIT ON ACTIVITY 75 162 116 648
Share based payments ‐2 518 ‐3 198
OPERATING PROFIT ON ACTIVITY BEFORE EXCEPTIONALS 72 644 113 451
Non recurrent profit ‐3 977 ‐4 513
OPERATING PROFIT 68 667 108 938
Net borrowing costs ‐1 198 ‐1 238Other financial income and expenses 12 669 1 328
FINANCIAL INCOME 11 471 90
Share of earning of equity affiliates 1 366 2 778Income tax expense ‐20 961 ‐34 880
NET OVERALL EARNINGS 60 543 76 925
PROFIT ATTRIBUTABLE TO MINORITY INTERESTS 103 ‐517
PROFIT ATTRIBUTABLE TO THE GROUP 60 646 76 409

September 23rd 2020 l ALTEN - 2020 First Half Results
CASH FLOW STATEMENT (IN THOUSANDS OF EUROS)
40
ITEM H1 2020 H1 2019CASH FLOW 98 509 145 868
Consolidated net earnings 60 543 76 925Earnings from associates ‐1 366 ‐2 778Depreciation, provisions and other calculated expenses 27 862 31 908Share-based payments 2 518 3 198Income tax expense 20 961 34 880Capital gains or losses from disposal ‐14 164 166Net borrowings costs 1 198 1 238Financial cost on update and provisions 957 331
Tax paid ‐26 178 ‐28 982Change in working capital requirements 95 108 ‐27 903
NET CASH FLOW GENERATED BY ACTIVITY 167 438 88 982
Acquisition / Disposal on fixed assets ‐7 270 ‐12 532Impact of change in scope of consolidation and earn-outs paid 18 028 ‐51 442
NET CASH FLOW ON INVESTMENTS 10 758 ‐63 974Net financial interest paid ‐1 393 ‐1 413Dividends paid to shareholders 0 ‐33 444Capital increase 0 0Buy back of shares ‐778 1 044Repayment of long-term financial debt ‐472 ‐5 150Change in current financial liabilities ‐92 943 33 904Change in lease debts ‐24 234 ‐21 280
NET CASH FLOW FROM FINANCING OPERATIONS ‐119 821 ‐26 340
CHANGE IN CASH RELATED TO FOREIGN EXHANGE POSITION ‐2 580 257
CHANGE IN CASH POSITION 55 795 ‐1 074
Cash on hand 258 346 119 297Bank loans ‐8 555 ‐26 578Overdrafts ‐25 492 ‐110 383
NET CASH POSITION 224 298 ‐17 664

2020 First Half Results
Contact
[email protected]://www.alten.com/fr/investisseurs/
T : +33 (0)1.46.08.71.79
40 av. André Morizet92513 Boulogne‐Billancourt Cedex
ALTEN