Embed Size (px)
Citation preview
Alstom Renewable PowerAnalyst Day
Nantes28th February 2013
Jérôme Pécresse
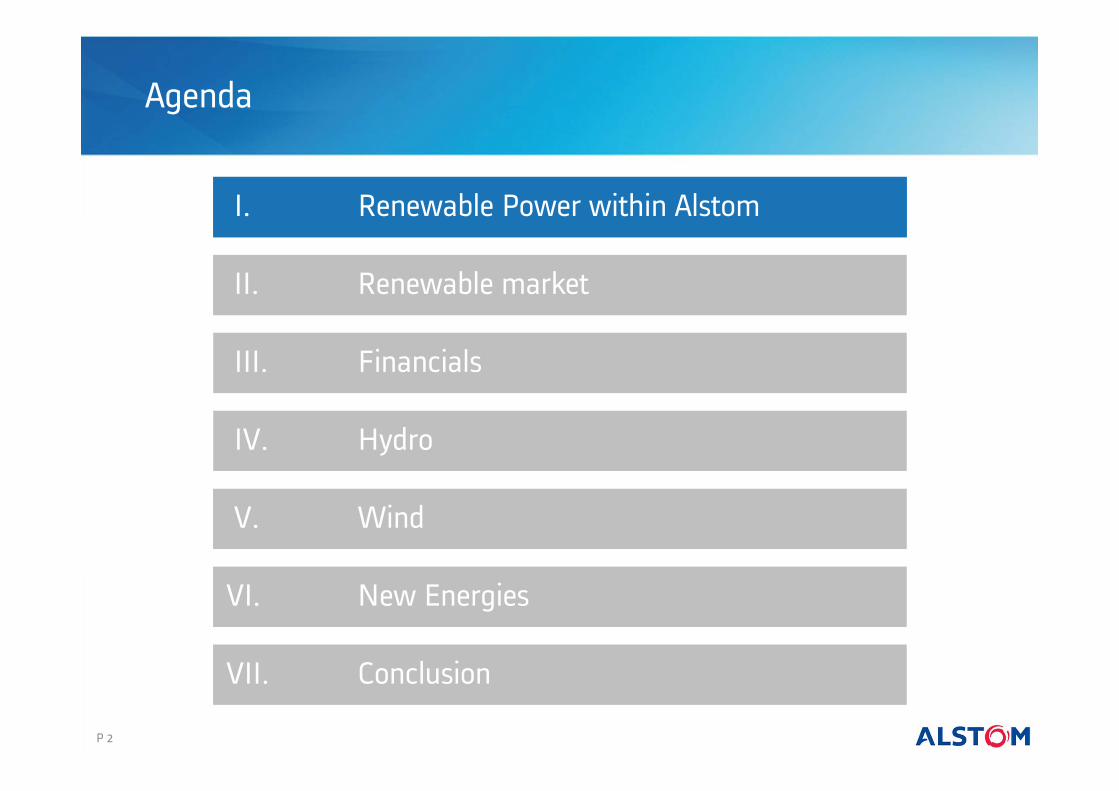
Agenda
I. Renewable Power within Alstom
IV. Hydro
V. Wind
II. Renewable market
P 2
VI. New Energies
VII. Conclusion
III. Financials
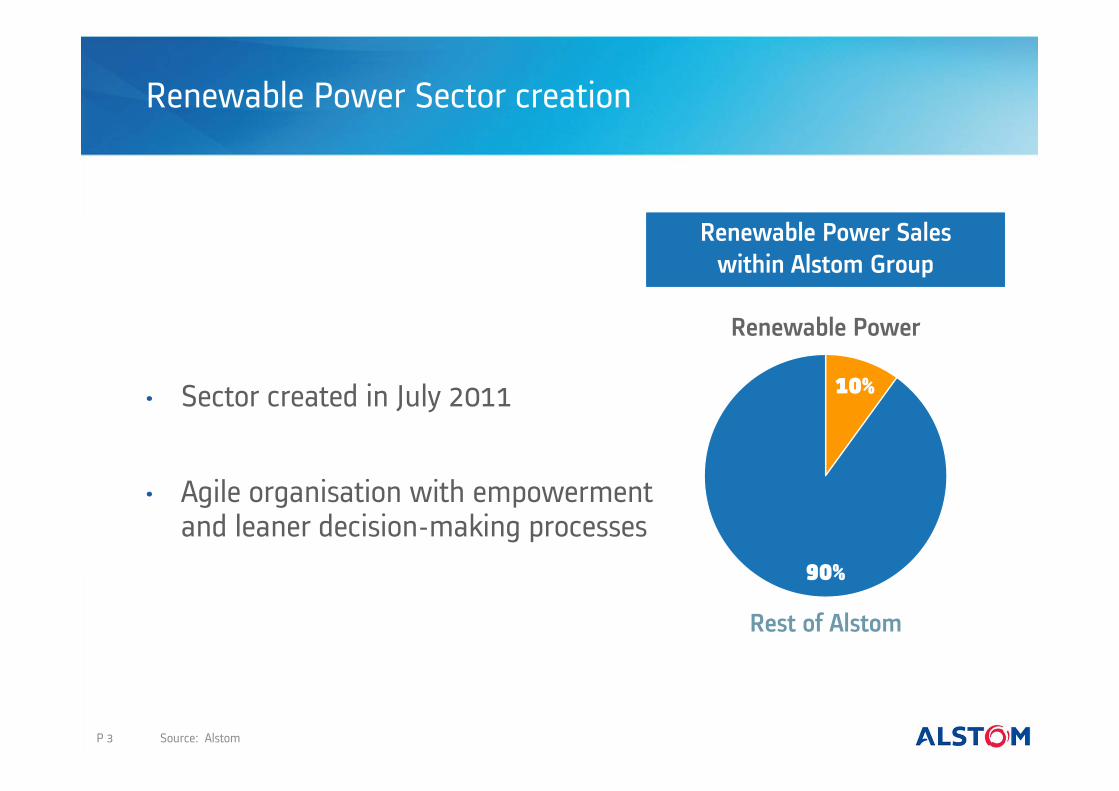
Renewable Power Sector creation
• Sector created in July 2011
• Agile organisation with empowermentand leaner decision-making processes
Renewable Power Saleswithin Alstom Group
10%
Rest of Alstom
90%
Renewable Power
P 3 Source: Alstom
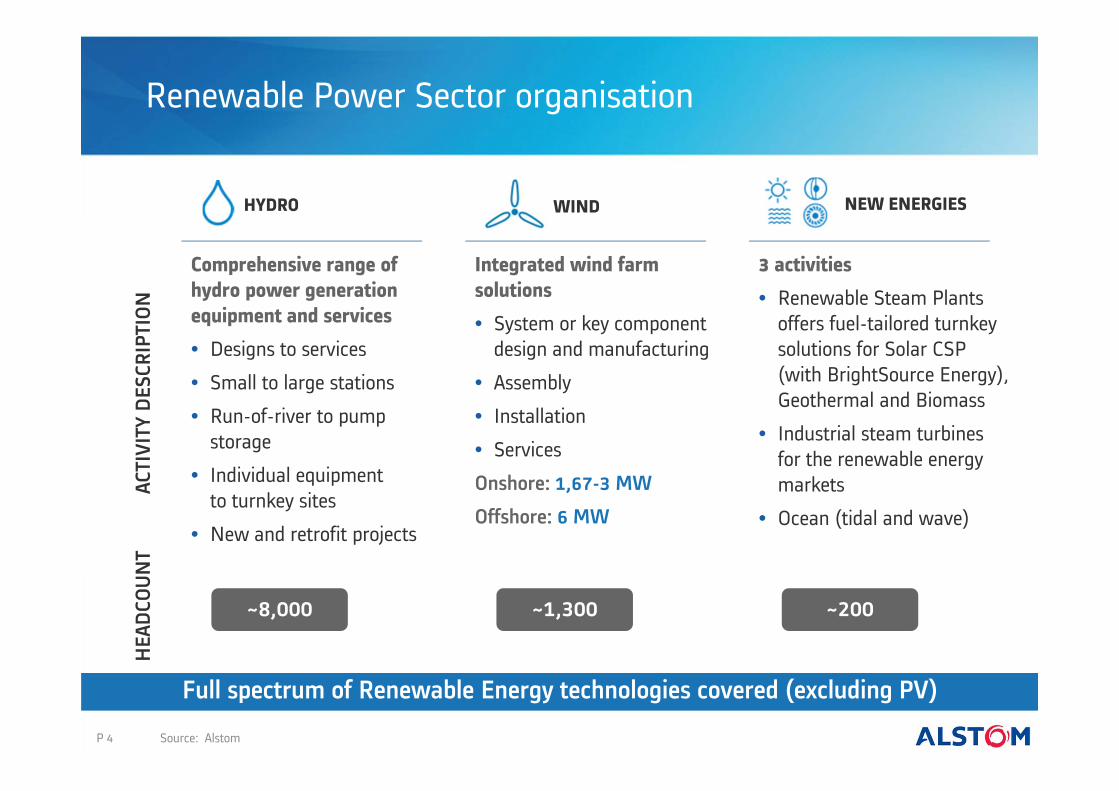
Renewable Power Sector organisation
HYDRO WIND NEW ENERGIES
Comprehensive range of hydro power generation equipment and services
• Designs to services
• Small to large stations
• Run-of-river to pump storage
• Individual equipmentto turnkey sites
• New and retrofit projects
3 activities
• Renewable Steam Plants offers fuel-tailored turnkey solutions for Solar CSP (with BrightSource Energy), Geothermal and Biomass
• Industrial steam turbinesfor the renewable energy markets
• Ocean (tidal and wave)
Integrated wind farm solutions
• System or key component design and manufacturing
• Assembly
• Installation
• Services
Onshore: 1,67-3 MW
Offshore: 6 MW
ACTI
VITY
DES
CRIP
TION
HEA
DCO
UNT
P 4
~8,000 ~1,300 ~200
Source: Alstom
Full spectrum of Renewable Energy technologies covered (excluding PV)
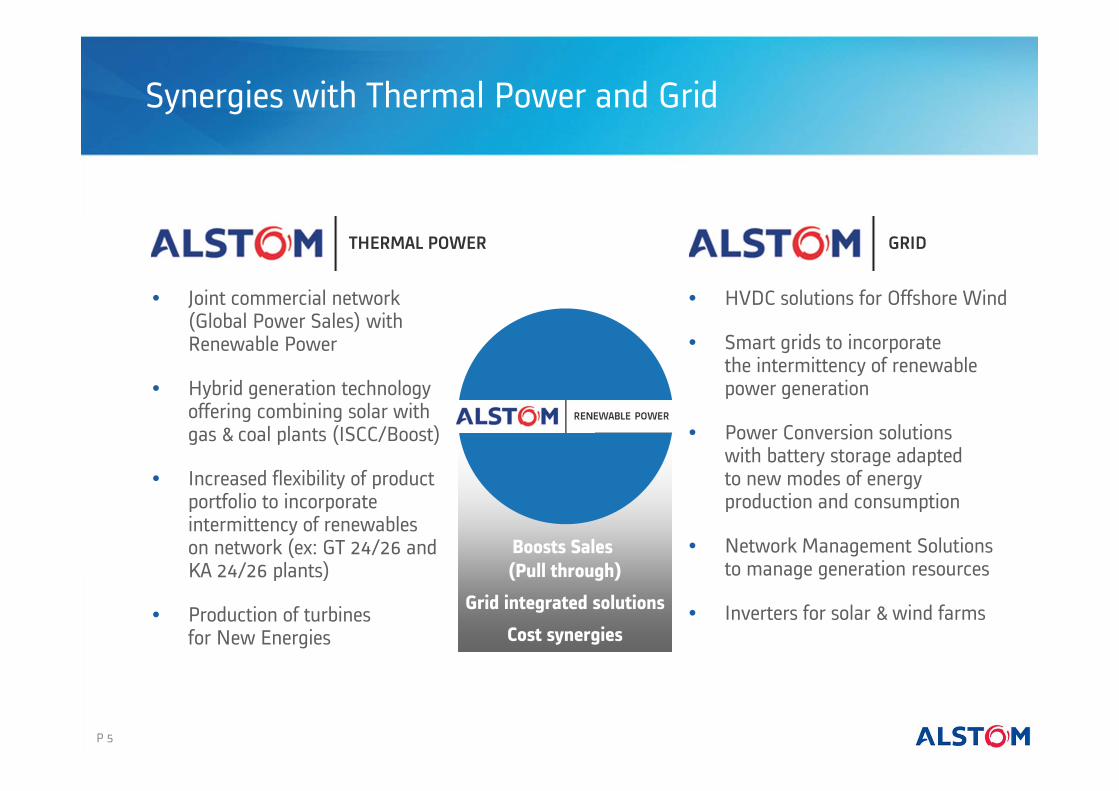
Synergies with Thermal Power and Grid
THERMAL POWER
• Joint commercial network (Global Power Sales) with Renewable Power
• Hybrid generation technology offering combining solar with gas & coal plants (ISCC/Boost)
• Increased flexibility of product portfolio to incorporate intermittency of renewableson network (ex: GT 24/26 and KA 24/26 plants)
• Production of turbinesfor New Energies
• HVDC solutions for Offshore Wind
• Smart grids to incorporatethe intermittency of renewable power generation
• Power Conversion solutionswith battery storage adaptedto new modes of energyproduction and consumption
• Network Management Solutionsto manage generation resources
• Inverters for solar & wind farms
P 5
GRID
Boosts Sales (Pull through)
Grid integrated solutions
Cost synergies
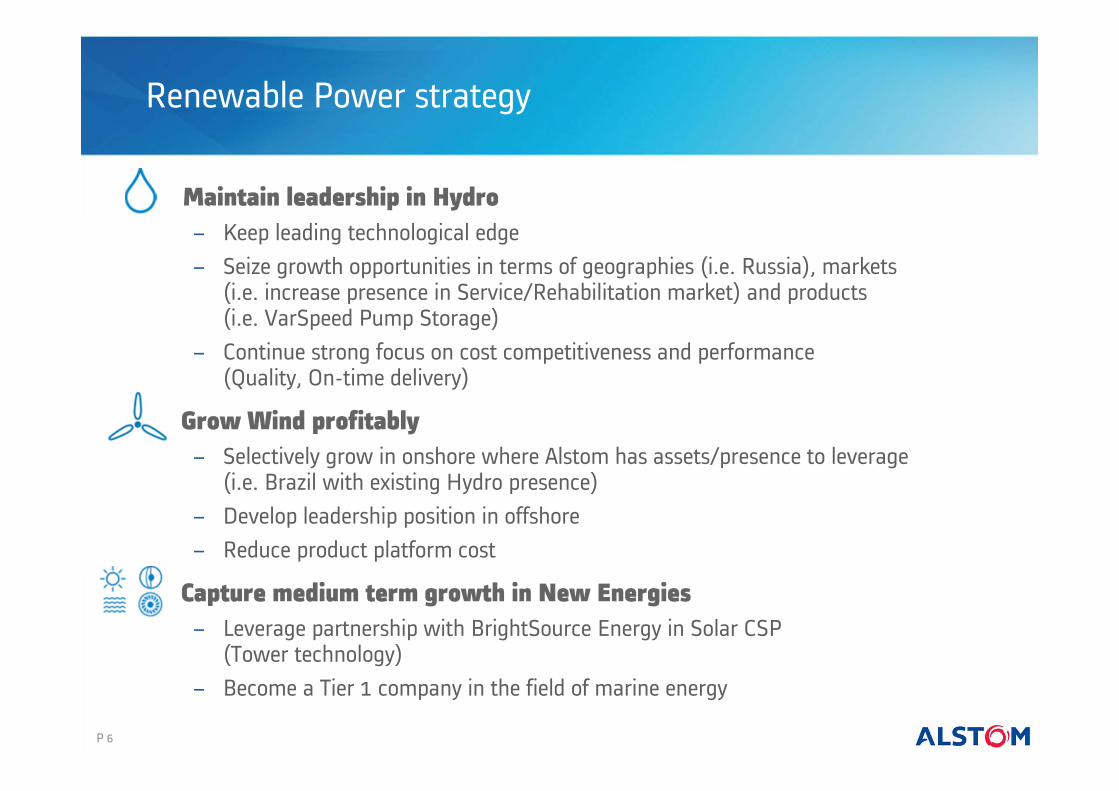
Renewable Power strategy
Maintain leadership in Hydro − Keep leading technological edge− Seize growth opportunities in terms of geographies (i.e. Russia), markets
(i.e. increase presence in Service/Rehabilitation market) and products(i.e. VarSpeed Pump Storage)
− Continue strong focus on cost competitiveness and performance(Quality, On-time delivery)
Grow Wind profitably− Selectively grow in onshore where Alstom has assets/presence to leverage
(i.e. Brazil with existing Hydro presence)− Develop leadership position in offshore − Reduce product platform cost
Capture medium term growth in New Energies − Leverage partnership with BrightSource Energy in Solar CSP
(Tower technology) − Become a Tier 1 company in the field of marine energy
P 6
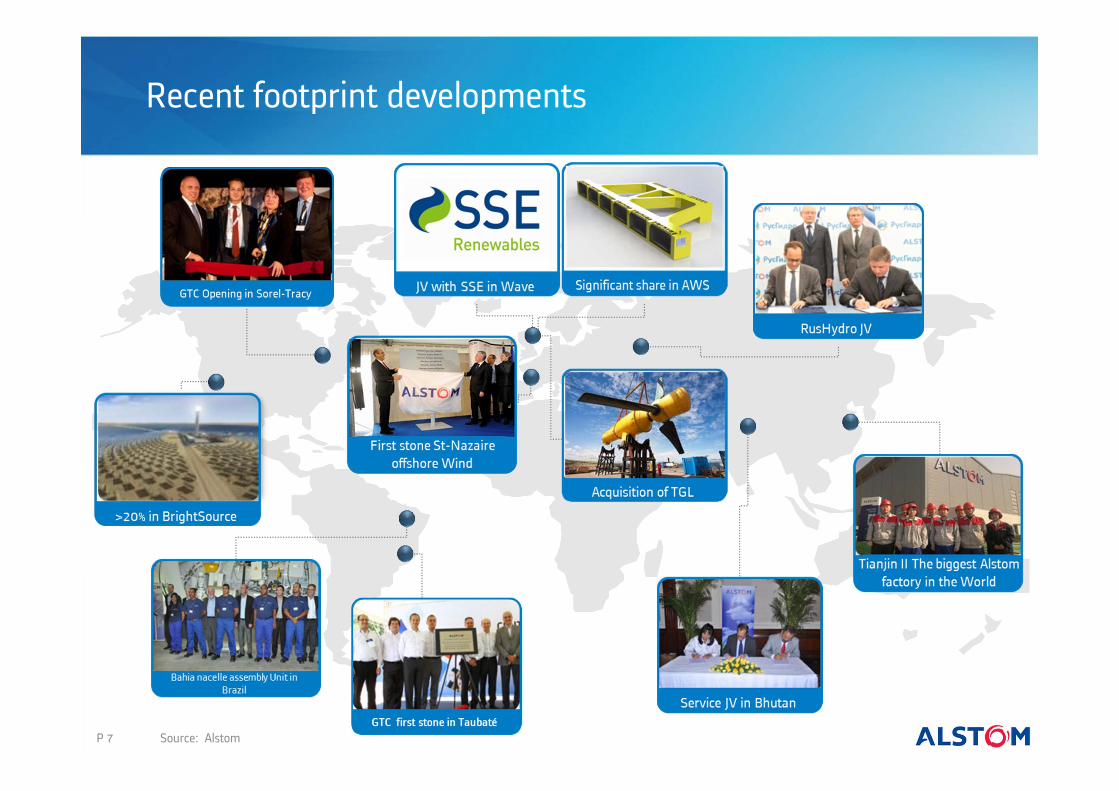
Recent footprint developments
P 7 Source: Alstom
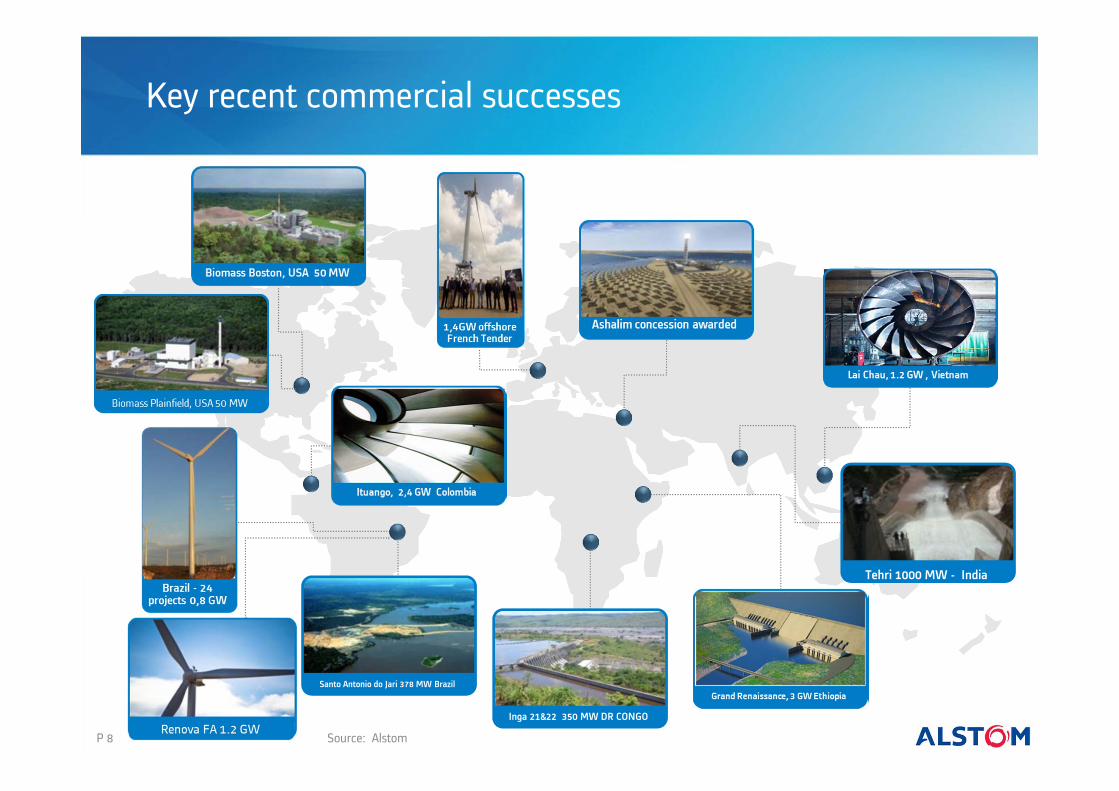
Key recent commercial successes
P 8
Santo Antonio do Jari 378 MW Brazil
Tehri 1000 MW - India
Source: Alstom
Inga 21&22 350 MW DR CONGO
Agenda
P 9
I. Renewable Power within Alstom
IV. Hydro
V. Wind
II. Renewable market
VI. New Energies
VII. Conclusion
III. Financials
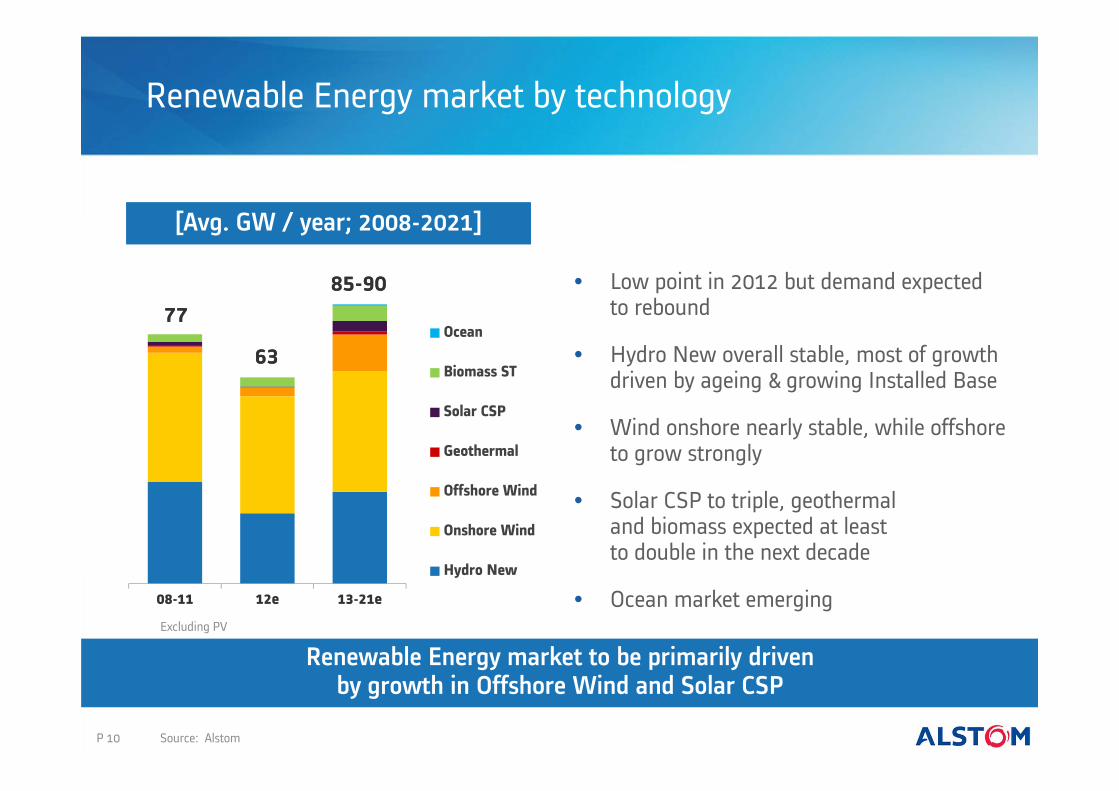
Renewable Energy market by technology
P 10
[Avg. GW / year; 2008-2021]
Renewable Energy market to be primarily drivenby growth in Offshore Wind and Solar CSP
0
100
08-11 12e 13-21e
Ocean
Biomass ST
Solar CSP
Geothermal
Offshore Wind
Onshore Wind
Hydro New
777785-9085-90
Excluding PV
6363
• Low point in 2012 but demand expectedto rebound
• Hydro New overall stable, most of growth driven by ageing & growing Installed Base
• Wind onshore nearly stable, while offshore to grow strongly
• Solar CSP to triple, geothermaland biomass expected at leastto double in the next decade
• Ocean market emerging
Source: Alstom
08-11 12e 13-21e
China
Oceania
India
Asia
LAM
NAM
MEA
Russia & CIS
Europe
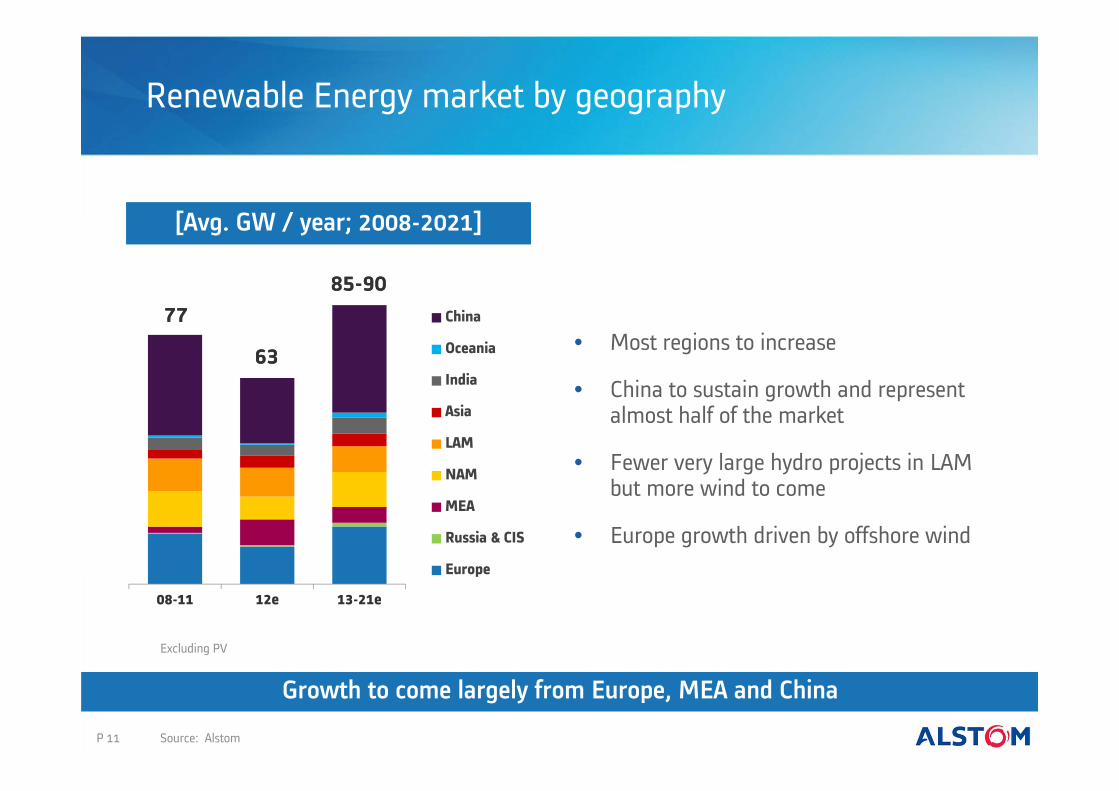
Renewable Energy market by geography
P 11
[Avg. GW / year; 2008-2021]
• Most regions to increase
• China to sustain growth and represent almost half of the market
• Fewer very large hydro projects in LAMbut more wind to come
• Europe growth driven by offshore wind
Growth to come largely from Europe, MEA and China
Excluding PV
777785-9085-90
6363
Source: Alstom
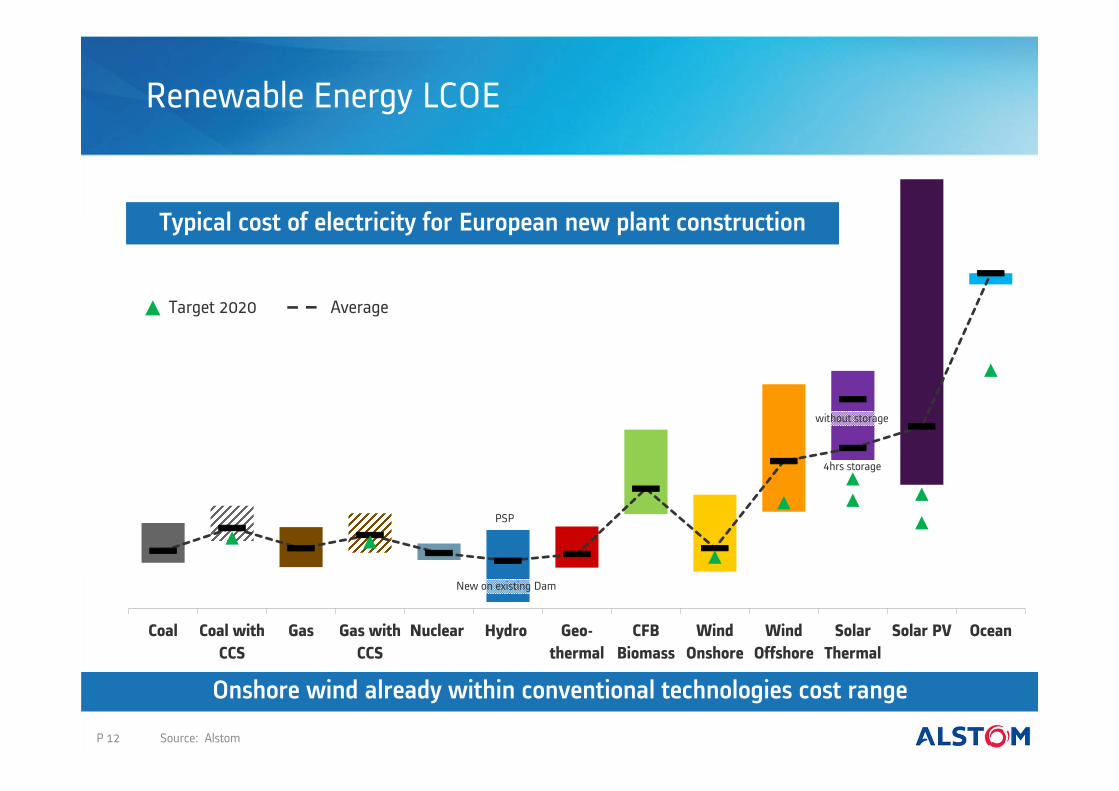
Renewable Energy LCOE
Onshore wind already within conventional technologies cost range
Coal Coal withCCS
Gas Gas withCCS
Nuclear Hydro Geo-thermal
CFBBiomass
WindOnshore
WindOffshore
SolarThermal
Solar PV Ocean
without storage
PSP
Target 2020
4hrs storage
New on existing Dam
Average
P 12
Typical cost of electricity for European new plant construction
Source: Alstom
Agenda
P 13
I. Renewable Power within Alstom
IV. Hydro
V. Wind
II. Renewable market
VI. New Energies
VII. Conclusion
III. Financials
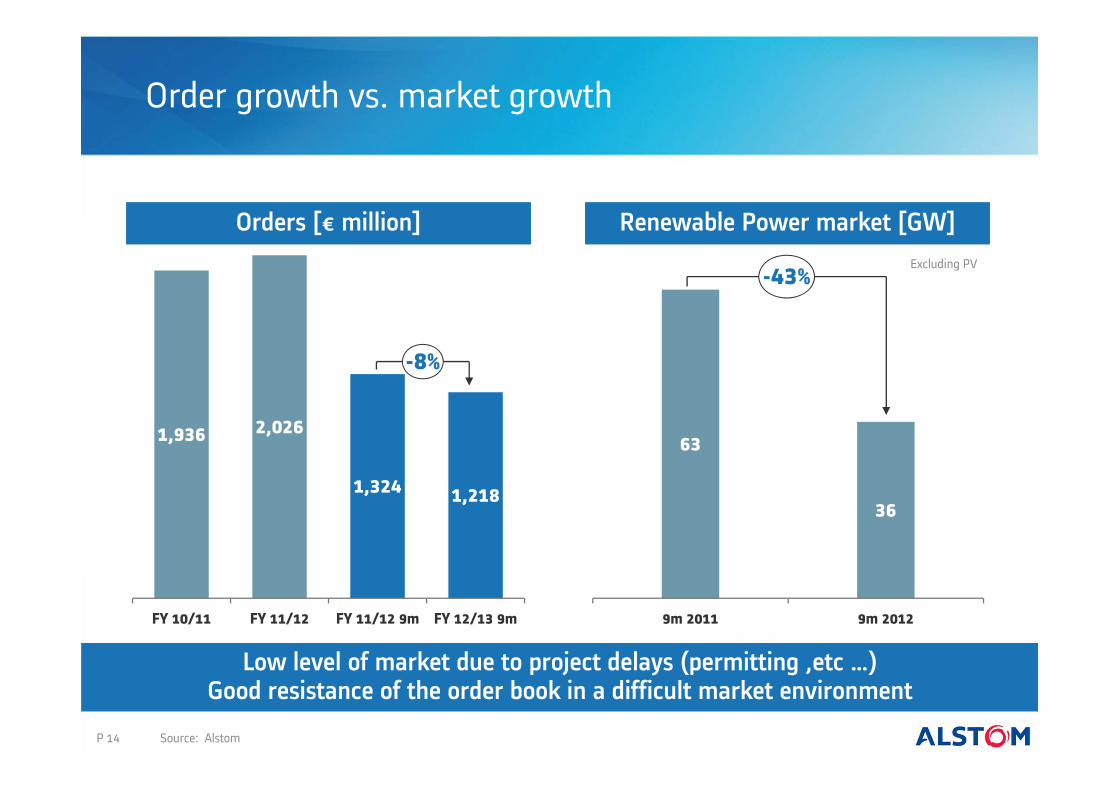
Order growth vs. market growth
1,936 2,026
1,324 1,218
FY 10/11 FY 11/12 FY 11/12 9m FY 12/13 9m
-8%
P 14
Excluding PV
Low level of market due to project delays (permitting ,etc …)Good resistance of the order book in a difficult market environment
Orders [€ million] Renewable Power market [GW]
63
36
9m 2011 9m 2012
-43%
Source: Alstom
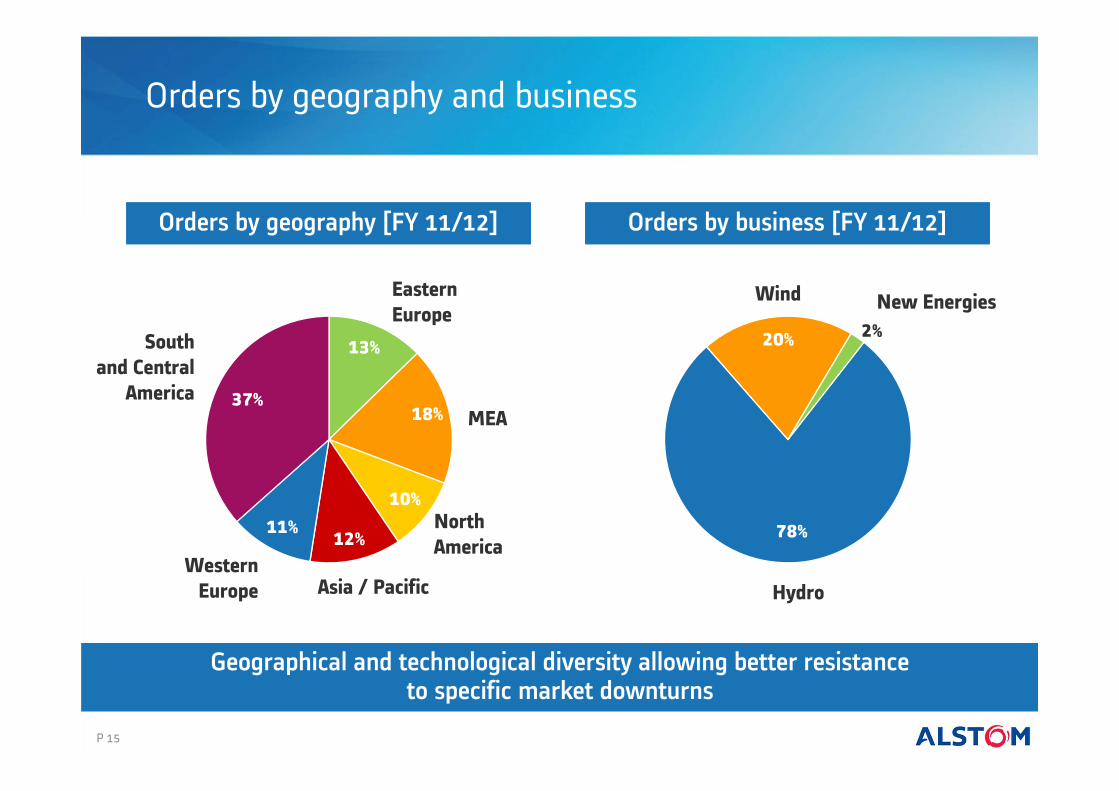
Orders by geography and business
78%
20% 2%New EnergiesWind
Hydro
13%
18%
10%
12%11%
37%MEA
NorthAmerica
EasternEurope
Asia / PacificWestern
Europe
Southand Central
America
P 15
Orders by business [FY 11/12]Orders by geography [FY 11/12]
Geographical and technological diversity allowing better resistanceto specific market downturns
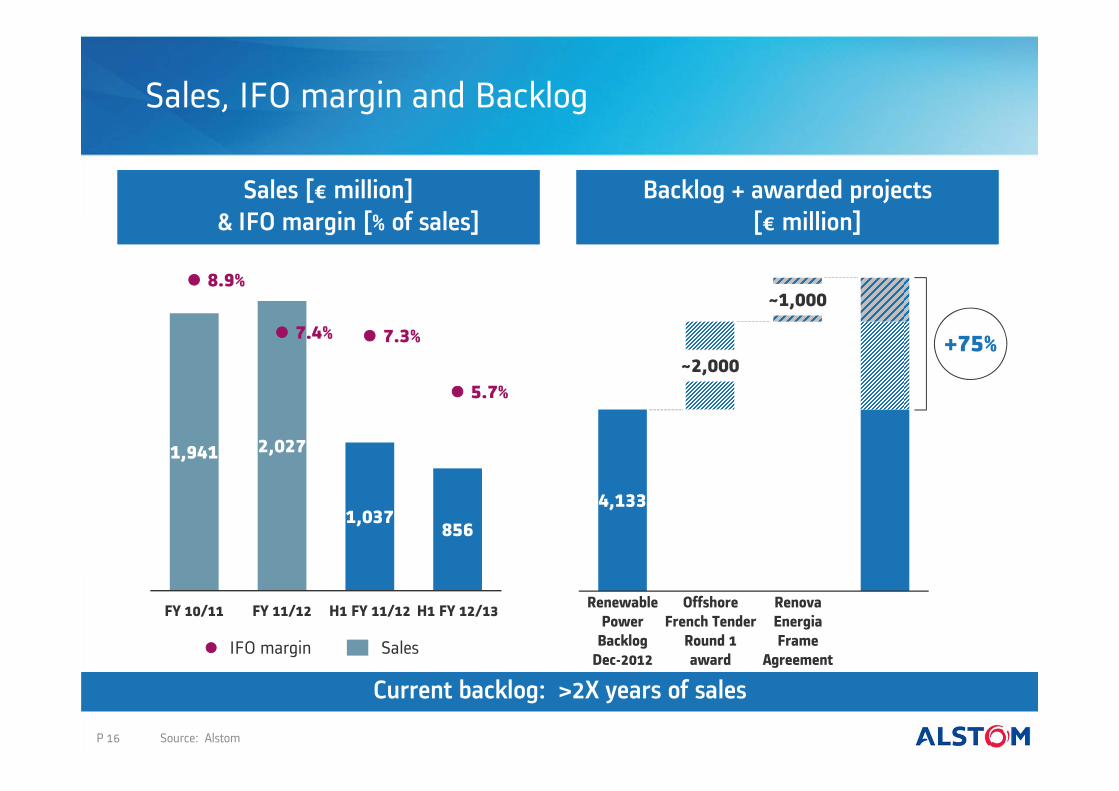
4,133
~2,000
~1,000
Sales, IFO margin and Backlog
RenovaEnergiaFrame
Agreement
OffshoreFrench Tender
Round 1award
RenewablePower
BacklogDec-2012
1,941 2,027
1,037 856
8.9%
7.4% 7.3%
5.7%
0
1
2
3
4
5
6
7
8
9
FY 10/11 FY 11/12 H1 FY 11/12 H1 FY 12/13
SalesIFO margin
P 16
Backlog + awarded projects[€ million]
Sales [€ million]& IFO margin [% of sales]
Current backlog: >2X years of sales
Source: Alstom
+75%
Agenda
P 17P 17
I. Renewable Power within Alstom
IV. Hydro
V. Wind
II. Renewable market
VI. New Energies
VII. Conclusion
III. Financials
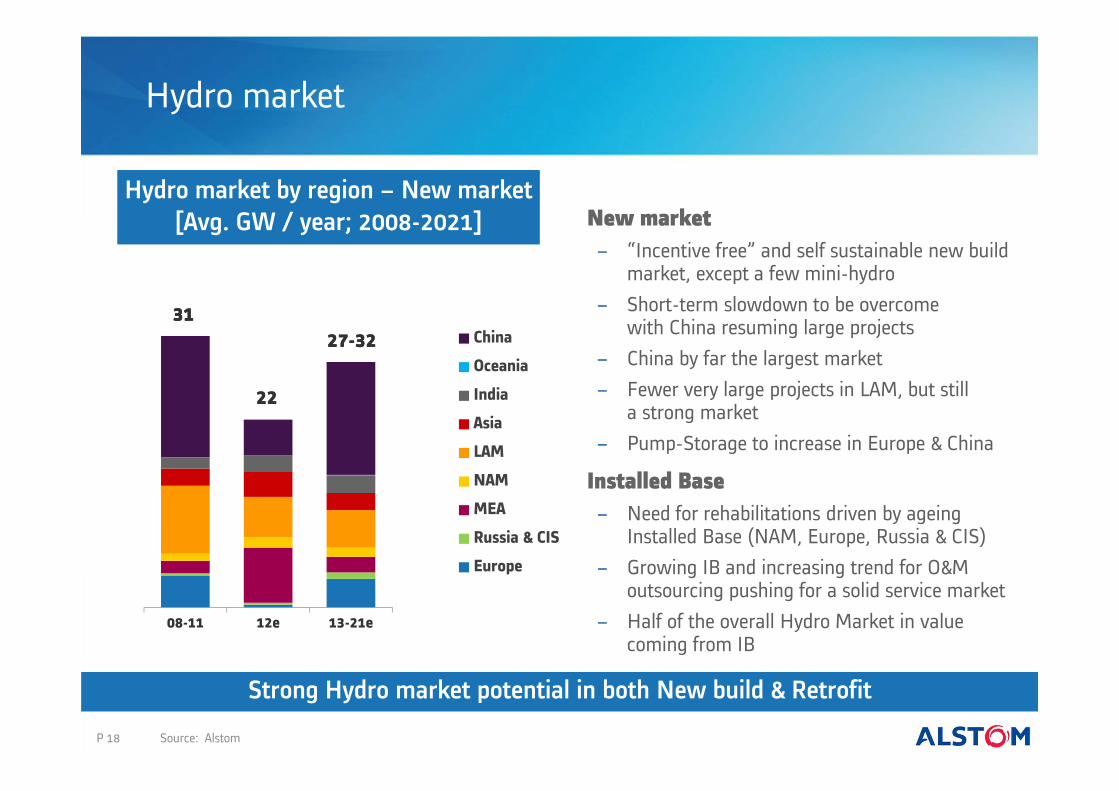
Hydro market
P 18
08-11 12e 13-21e
China
Oceania
India
Asia
LAM
NAM
MEA
Russia & CIS
Europe
313127-3227-32
2222
Hydro market by region – New market[Avg. GW / year; 2008-2021] New market
− “Incentive free” and self sustainable new build market, except a few mini-hydro
− Short-term slowdown to be overcomewith China resuming large projects
− China by far the largest market− Fewer very large projects in LAM, but still
a strong market− Pump-Storage to increase in Europe & China
Installed Base− Need for rehabilitations driven by ageing
Installed Base (NAM, Europe, Russia & CIS)− Growing IB and increasing trend for O&M
outsourcing pushing for a solid service market− Half of the overall Hydro Market in value
coming from IB
Strong Hydro market potential in both New build & Retrofit
Source: Alstom
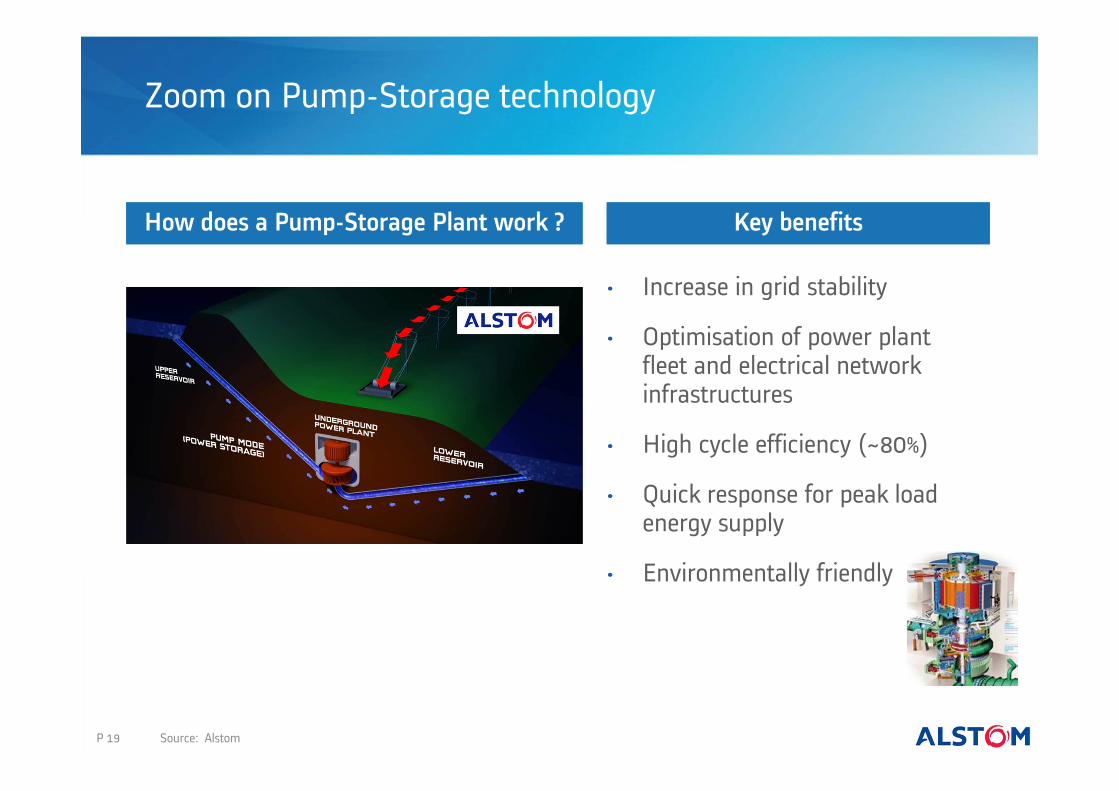
Zoom on Pump-Storage technology
• Increase in grid stability
• Optimisation of power plant fleet and electrical network infrastructures
• High cycle efficiency (~80%)
• Quick response for peak load energy supply
• Environmentally friendly
P 19
Key benefitsHow does a Pump-Storage Plant work ?
Source: Alstom
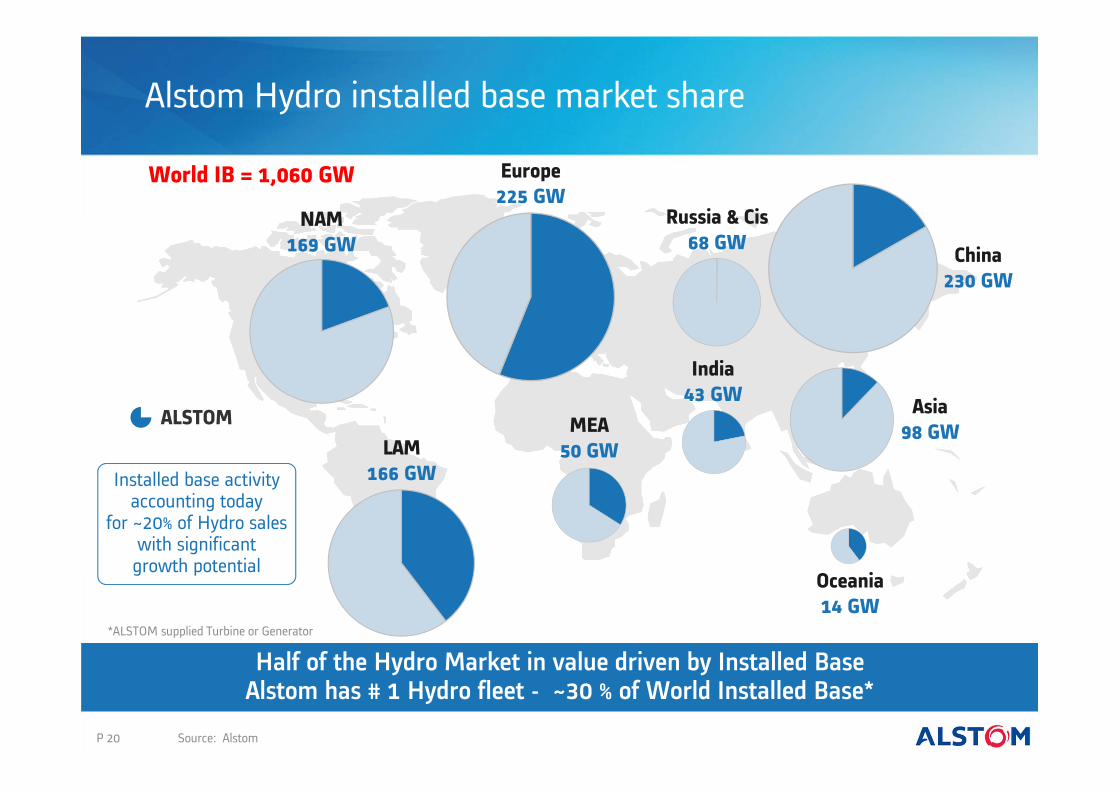
Alstom Hydro installed base market share
P 20 Source: Alstom
World IB = 1,060 GW
Half of the Hydro Market in value driven by Installed BaseAlstom has # 1 Hydro fleet - ~30 % of World Installed Base*
*ALSTOM supplied Turbine or Generator
ALSTOM
Installed base activityaccounting today
for ~20% of Hydro saleswith significantgrowth potential
Asia98 GW
China230 GW
India43 GW
Russia & Cis68 GW
Europe225 GW
MEA50 GW
NAM169 GW
LAM166 GW
Oceania14 GW
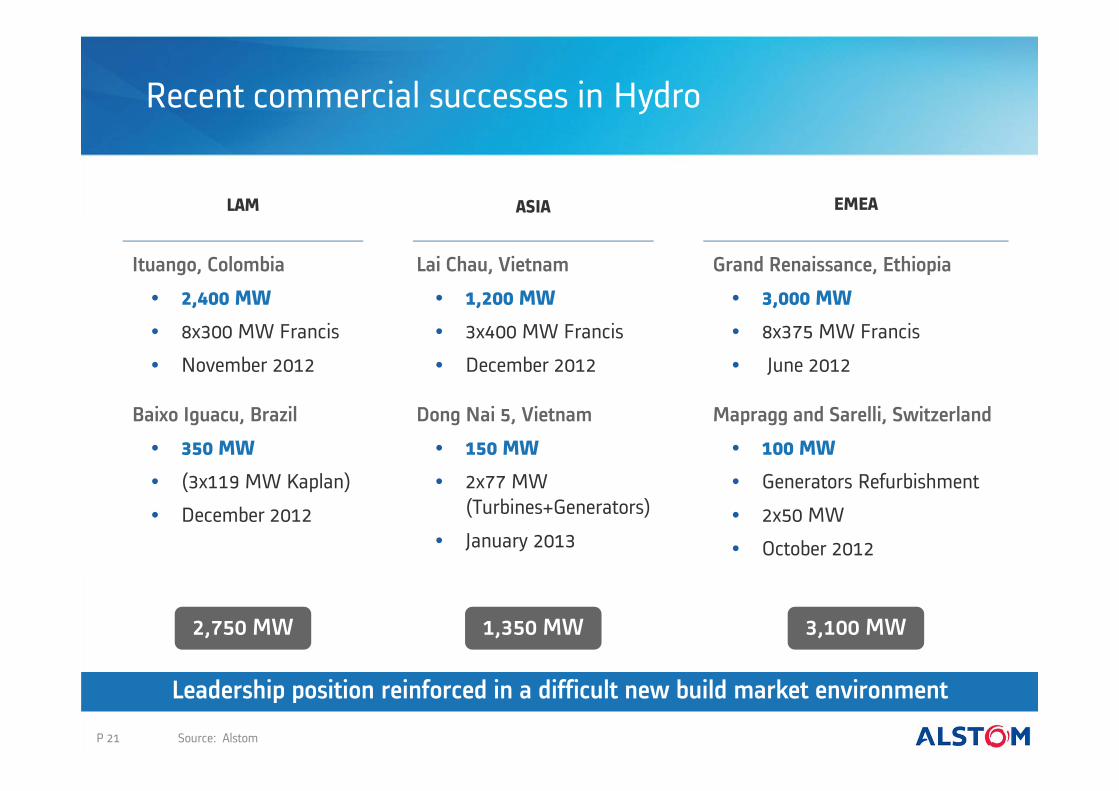
Recent commercial successes in Hydro
P 21
LAM
Ituango, Colombia
• 2,400 MW
• 8x300 MW Francis
• November 2012
Baixo Iguacu, Brazil
• 350 MW
• (3x119 MW Kaplan)
• December 2012
2,750 MW
ASIA
Lai Chau, Vietnam
• 1,200 MW
• 3x400 MW Francis
• December 2012
Dong Nai 5, Vietnam
• 150 MW
• 2x77 MW (Turbines+Generators)
• January 2013
1,350 MW
EMEA
Grand Renaissance, Ethiopia
• 3,000 MW
• 8x375 MW Francis
• June 2012
Mapragg and Sarelli, Switzerland
• 100 MW
• Generators Refurbishment
• 2x50 MW
• October 2012
3,100 MW
Leadership position reinforced in a difficult new build market environment
Source: Alstom
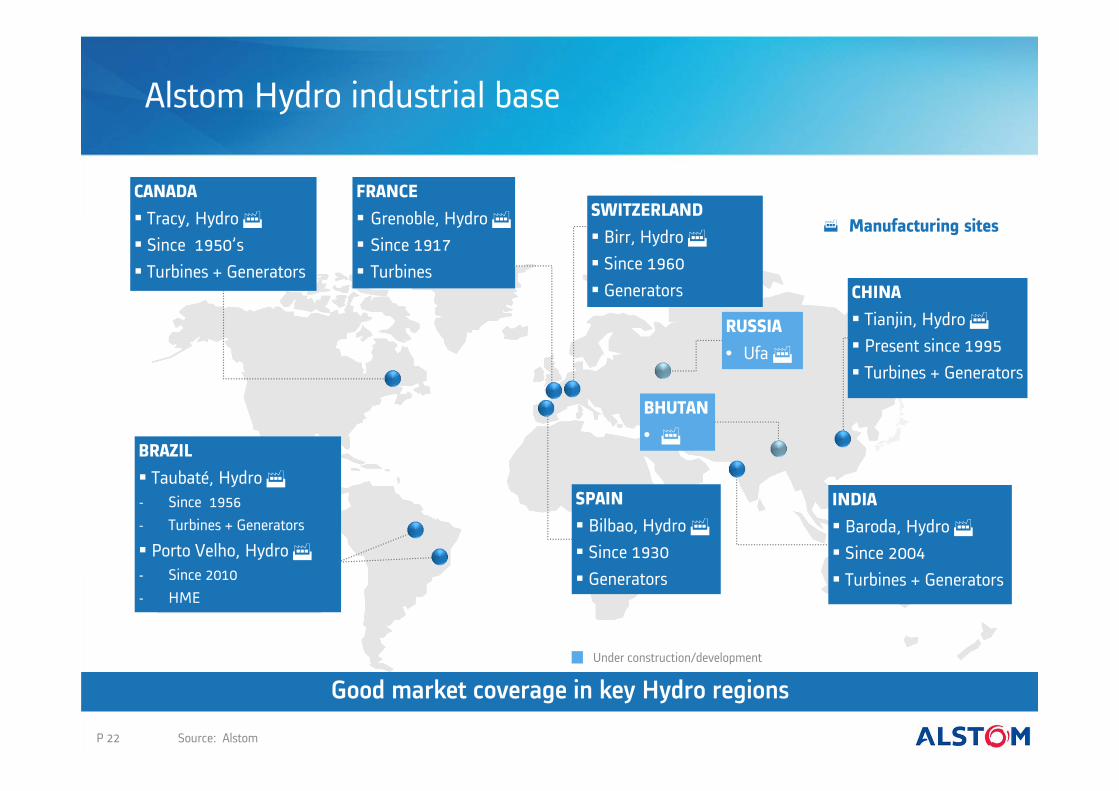
Alstom Hydro industrial base
BRAZIL Taubaté, Hydro - Since 1956- Turbines + Generators
Porto Velho, Hydro - Since 2010- HME
CHINA Tianjin, Hydro Present since 1995 Turbines + Generators
INDIA Baroda, Hydro Since 2004 Turbines + Generators
FRANCE Grenoble, Hydro Since 1917 Turbines
SPAIN Bilbao, Hydro Since 1930 Generators
SWITZERLAND Birr, Hydro Since 1960 Generators
CANADA Tracy, Hydro Since 1950’s Turbines + Generators
Manufacturing sites
RUSSIA• Ufa
P 22
BHUTAN•
Source: Alstom
Good market coverage in key Hydro regionsUnder construction/development
Partnership with RusHydro
AlstomRusHydroEnergy (JV)
• JV announced in a strategic cooperation agreementin December 2010 with a mission to producehydropower and auxiliary equipment in Russia
• Shareholders Agreement signed in June 2011to establish the JV (50% -1 share for Alstom)
• Ufa factory: part of AlstomRusHydroEnergy JV,to be managed by Alstom
• JV to employ over 500 people by 2015
• Strong potential, notably for large refurbishment works
P 23
Unique opportunity to expand in Russian and CIS markets
Source: Alstom
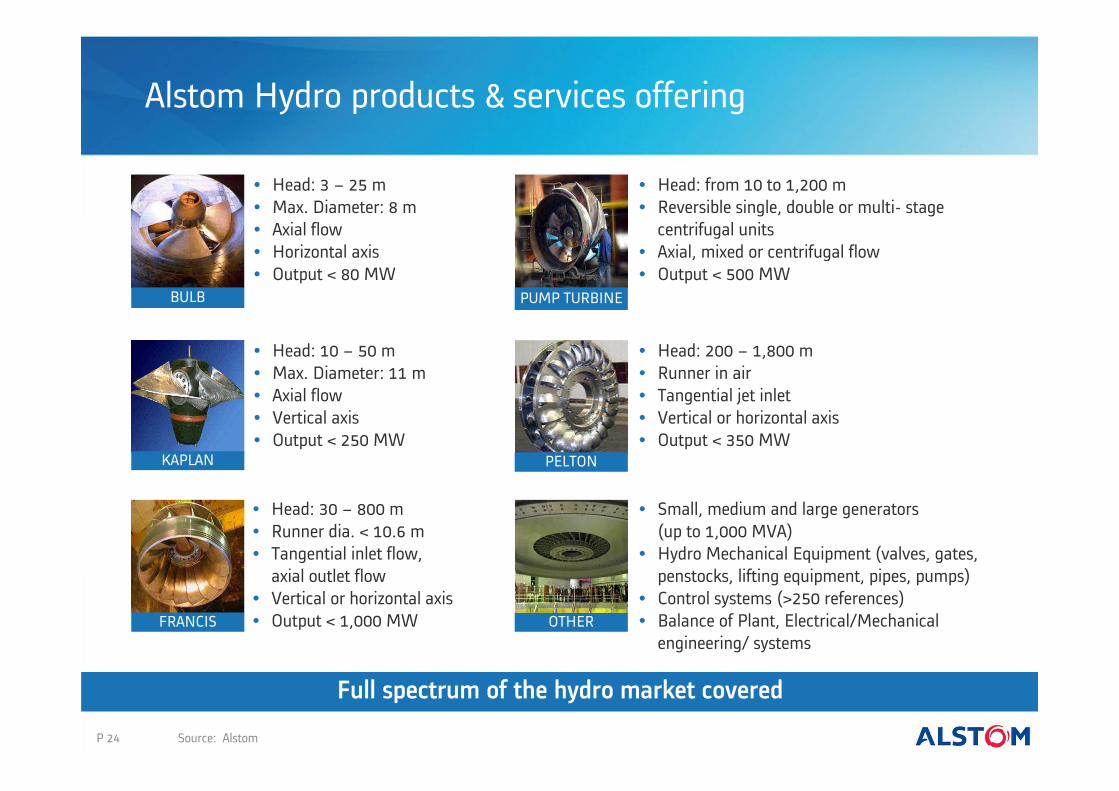
Alstom Hydro products & services offering
• Head: 3 – 25 m• Max. Diameter: 8 m• Axial flow• Horizontal axis• Output < 80 MW
• Head: 10 – 50 m• Max. Diameter: 11 m• Axial flow• Vertical axis• Output < 250 MW
• Head: 30 – 800 m• Runner dia. < 10.6 m• Tangential inlet flow,
axial outlet flow• Vertical or horizontal axis• Output < 1,000 MW
• Head: 200 – 1,800 m• Runner in air• Tangential jet inlet• Vertical or horizontal axis• Output < 350 MW
• Head: from 10 to 1,200 m• Reversible single, double or multi- stage
centrifugal units• Axial, mixed or centrifugal flow• Output < 500 MW
BULB
KAPLAN
FRANCIS
PELTON
PUMP TURBINE
• Small, medium and large generators(up to 1,000 MVA)
• Hydro Mechanical Equipment (valves, gates, penstocks, lifting equipment, pipes, pumps)
• Control systems (>250 references)• Balance of Plant, Electrical/Mechanical
engineering/ systemsOTHER
P 24
Full spectrum of the hydro market covered
Source: Alstom
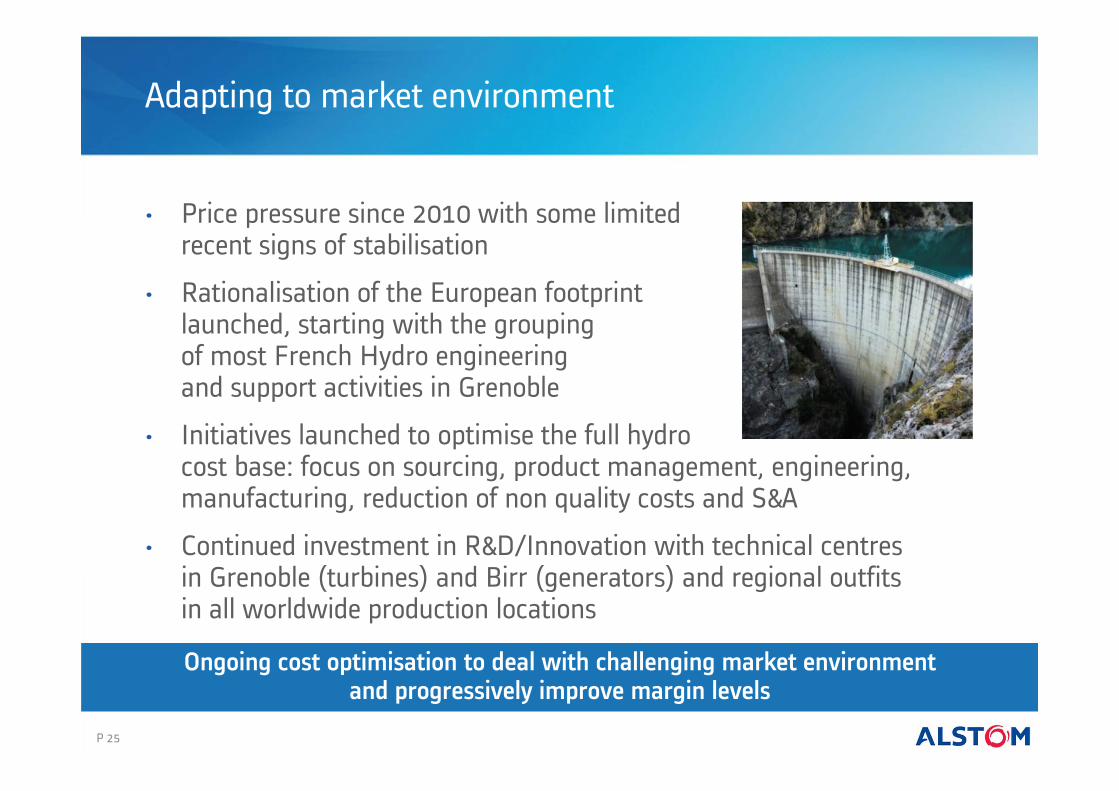
Adapting to market environment
• Price pressure since 2010 with some limitedrecent signs of stabilisation
• Rationalisation of the European footprintlaunched, starting with the groupingof most French Hydro engineeringand support activities in Grenoble
• Initiatives launched to optimise the full hydrocost base: focus on sourcing, product management, engineering, manufacturing, reduction of non quality costs and S&A
• Continued investment in R&D/Innovation with technical centresin Grenoble (turbines) and Birr (generators) and regional outfitsin all worldwide production locations
P 25
Ongoing cost optimisation to deal with challenging market environment and progressively improve margin levels
Agenda
P 26
I. Renewable Power within Alstom
IV. Hydro
V. Wind
II. Renewable market
VI. New Energies
VII. Conclusion
III. Financials
Wind market
P 27
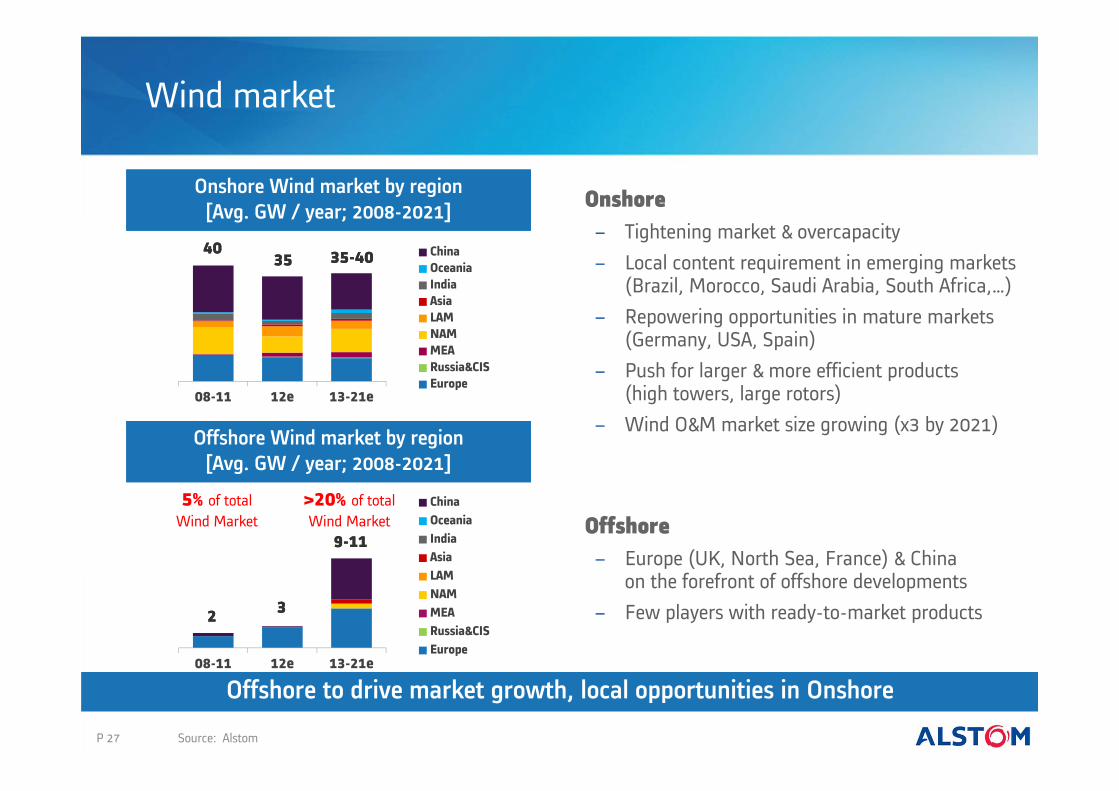
Onshore− Tightening market & overcapacity − Local content requirement in emerging markets
(Brazil, Morocco, Saudi Arabia, South Africa,…)− Repowering opportunities in mature markets
(Germany, USA, Spain)− Push for larger & more efficient products
(high towers, large rotors)− Wind O&M market size growing (x3 by 2021)
08-11 12e 13-21e
ChinaOceaniaIndiaAsiaLAMNAMMEARussia&CISEurope
08-11 12e 13-21e
ChinaOceaniaIndiaAsiaLAMNAMMEARussia&CISEurope
5% of total Wind Market
>20% of total Wind Market
4040
22
35-4035-40
9-119-11
3535
33
Onshore Wind market by region[Avg. GW / year; 2008-2021]
Source: Alstom
Offshore to drive market growth, local opportunities in Onshore
Offshore− Europe (UK, North Sea, France) & China
on the forefront of offshore developments− Few players with ready-to-market products
Offshore Wind market by region[Avg. GW / year; 2008-2021]
050
100150200
2004 2006 2008 2010 2012
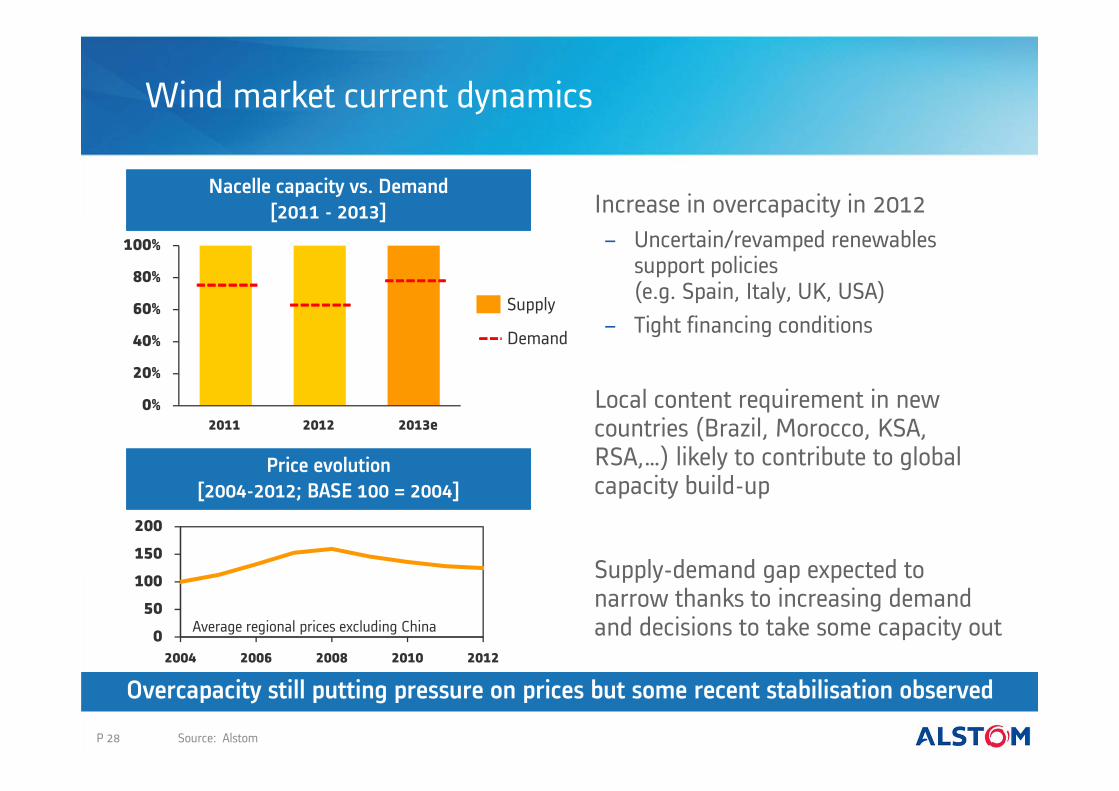
Increase in overcapacity in 2012− Uncertain/revamped renewables
support policies(e.g. Spain, Italy, UK, USA)
− Tight financing conditions
Local content requirement in new countries (Brazil, Morocco, KSA, RSA,…) likely to contribute to global capacity build-up
Supply-demand gap expected to narrow thanks to increasing demand and decisions to take some capacity out
Wind market current dynamics
0%
20%
40%
60%
80%
100%
2013e20122011
Demand
Supply
Average regional prices excluding China
P 28
Nacelle capacity vs. Demand[2011 - 2013]
Price evolution[2004-2012; BASE 100 = 2004]
Source: Alstom
Overcapacity still putting pressure on prices but some recent stabilisation observed
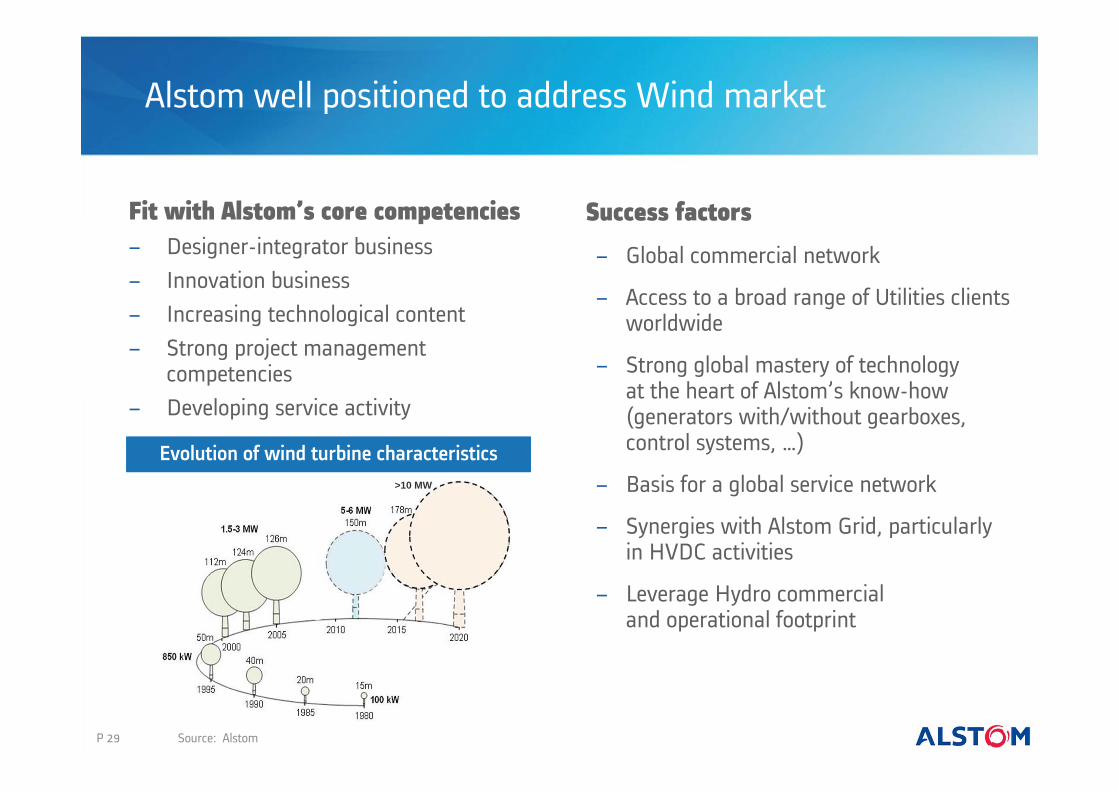
>10 MW
Alstom well positioned to address Wind market
Fit with Alstom’s core competencies− Designer-integrator business− Innovation business− Increasing technological content− Strong project management
competencies− Developing service activity
Success factors
− Global commercial network
− Access to a broad range of Utilities clients worldwide
− Strong global mastery of technologyat the heart of Alstom’s know-how (generators with/without gearboxes, control systems, …)
− Basis for a global service network
− Synergies with Alstom Grid, particularlyin HVDC activities
− Leverage Hydro commercialand operational footprint
P 29 Source: Alstom
Evolution of wind turbine characteristics
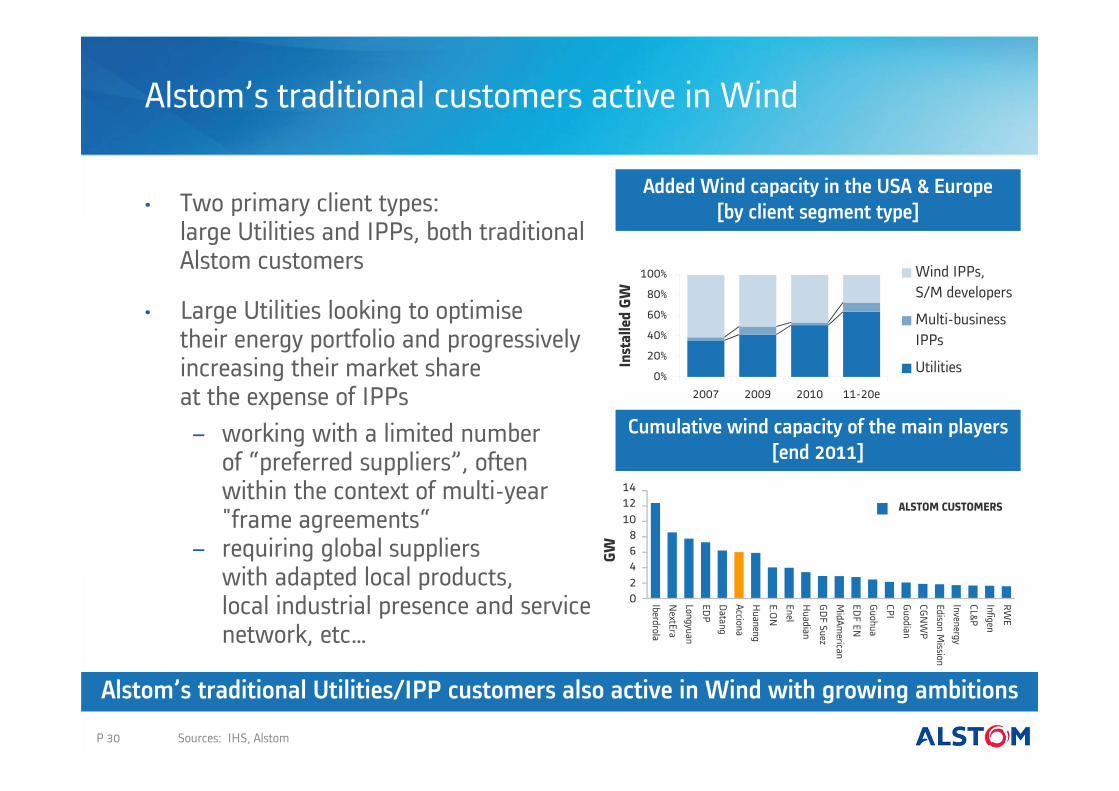
Alstom’s traditional customers active in Wind
• Two primary client types:large Utilities and IPPs, both traditional Alstom customers
• Large Utilities looking to optimisetheir energy portfolio and progressively increasing their market shareat the expense of IPPs− working with a limited number
of “preferred suppliers”, oftenwithin the context of multi-year "frame agreements“
− requiring global supplierswith adapted local products,local industrial presence and service network, etc…GW
Iberdrola
NextEra
Longyuan
0
10864
14
2
12
EDP
Datang
Acciona
Huaneng
E.ON
Enel
Huadian
GDF Suez
MidAm
erican
EDF EN
Guohua
CPI
Guodian
CGNW
P
Edison Mission
Invenergy
CL&P
Infigen
RWE
P 30
0%
20%
40%
60%
80%
100%
2007 2009 2010 11-20e
Inst
alle
d GW
Wind IPPs,S/M developers
Multi-businessIPPs
Utilities
Alstom’s traditional Utilities/IPP customers also active in Wind with growing ambitions
Added Wind capacity in the USA & Europe [by client segment type]
Cumulative wind capacity of the main players [end 2011]
ALSTOM CUSTOMERS
Sources: IHS, Alstom
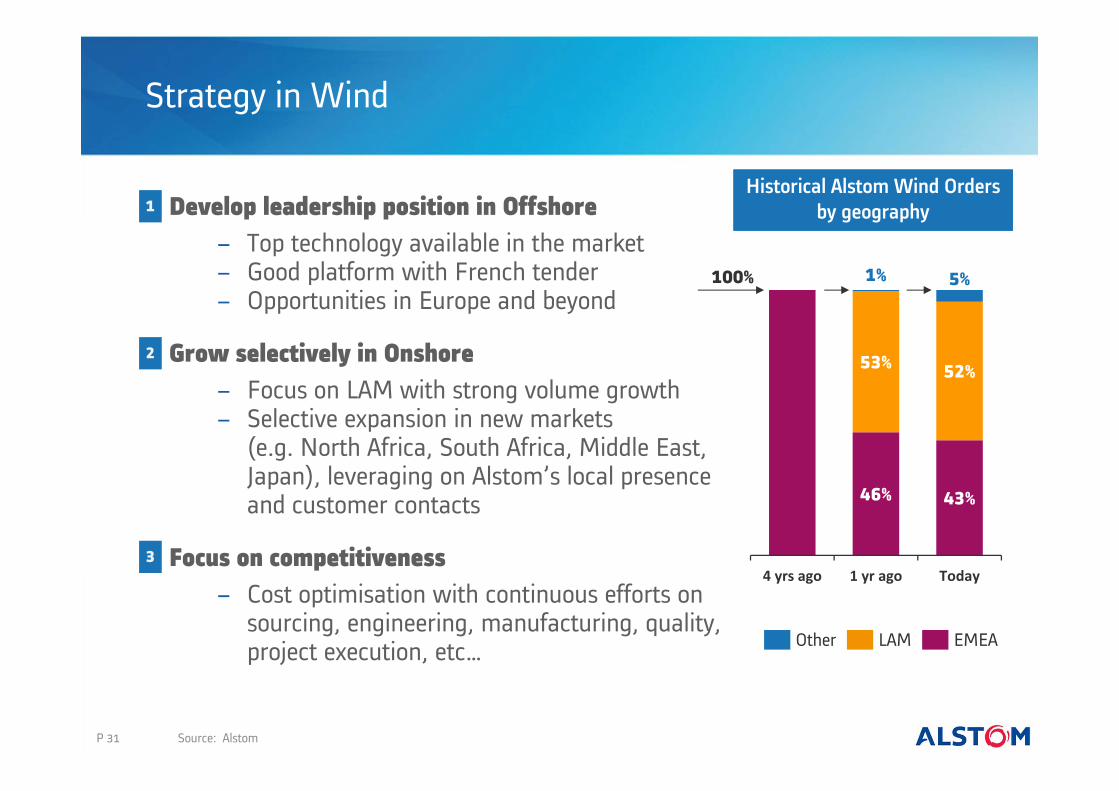
Develop leadership position in Offshore− Top technology available in the market− Good platform with French tender− Opportunities in Europe and beyond
Grow selectively in Onshore− Focus on LAM with strong volume growth− Selective expansion in new markets
(e.g. North Africa, South Africa, Middle East,Japan), leveraging on Alstom’s local presenceand customer contacts
Focus on competitiveness− Cost optimisation with continuous efforts on
sourcing, engineering, manufacturing, quality,project execution, etc…
Strategy in Wind
46% 43%
53% 52%
1% 5%
4 yrs ago 1 yr ago Today
100%
EMEALAMOther
P 31 Source: Alstom
1
2
3
Historical Alstom Wind Orders by geography
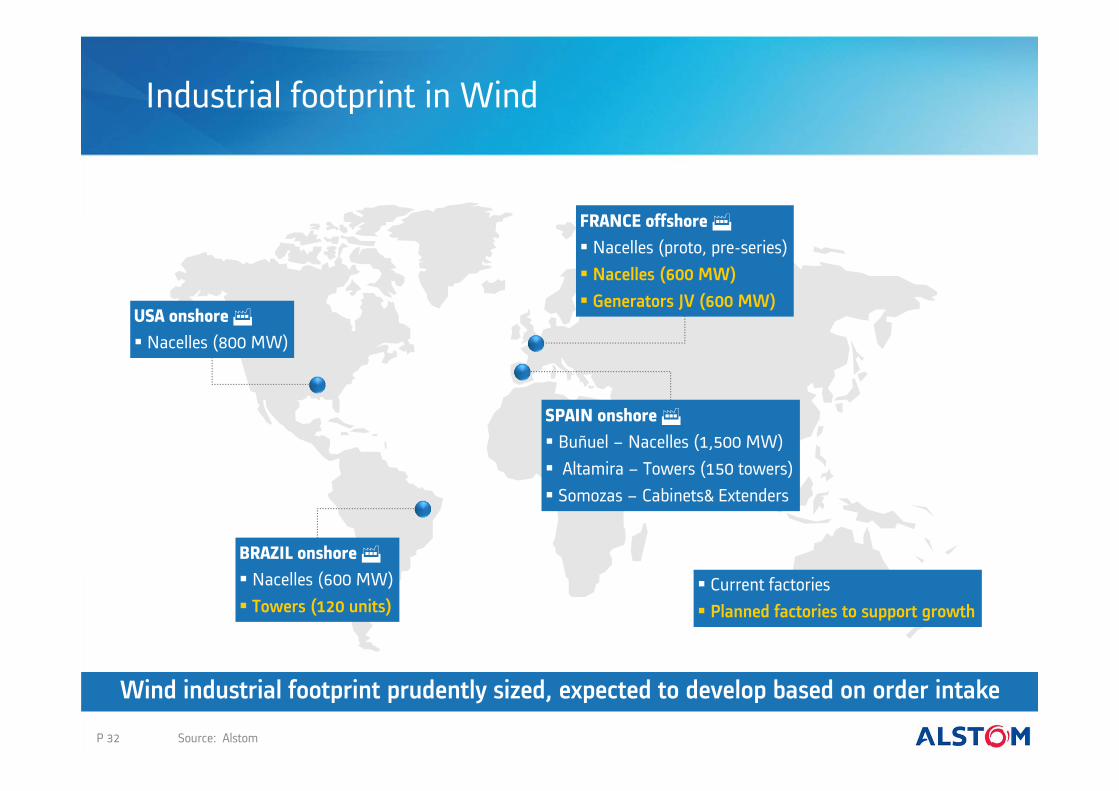
Industrial footprint in Wind
P 32
USA onshore Nacelles (800 MW)
Wind industrial footprint prudently sized, expected to develop based on order intake
BRAZIL onshore Nacelles (600 MW) Towers (120 units)
FRANCE offshore Nacelles (proto, pre-series) Nacelles (600 MW) Generators JV (600 MW)
SPAIN onshore Buñuel – Nacelles (1,500 MW) Altamira – Towers (150 towers) Somozas – Cabinets& Extenders
Current factories Planned factories to support growth
Source: Alstom
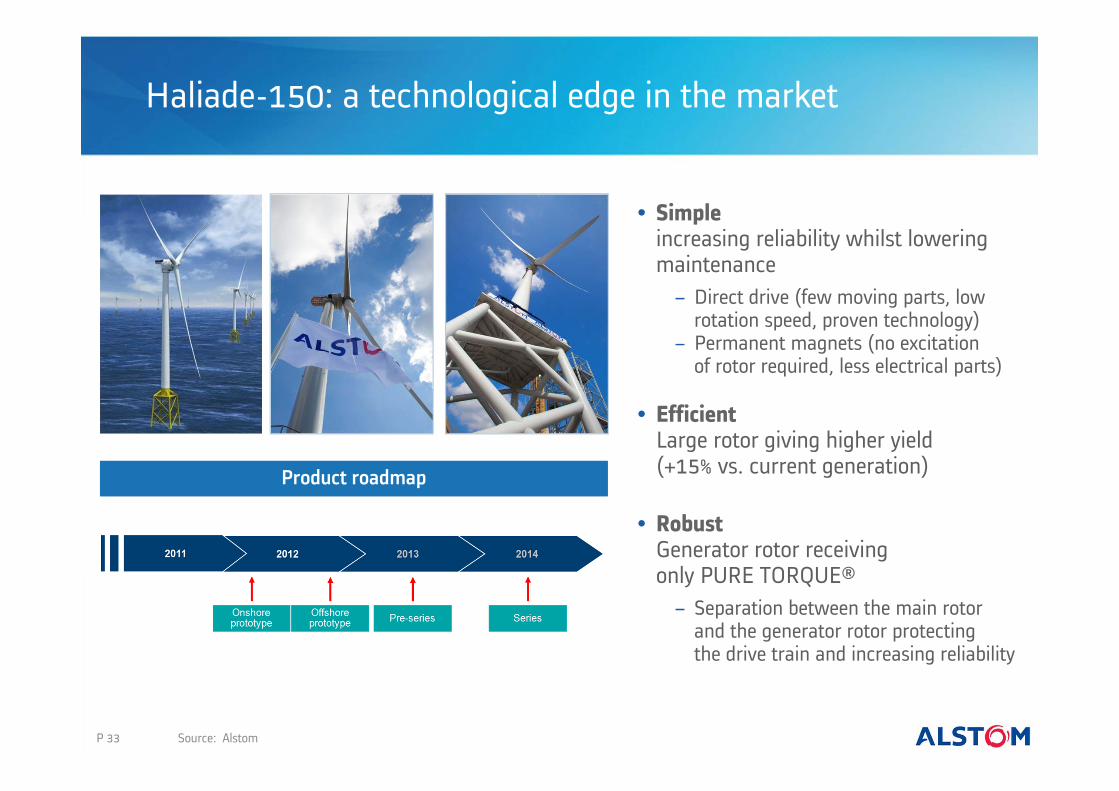
Haliade-150: a technological edge in the market
P 33
• Simpleincreasing reliability whilst lowering maintenance− Direct drive (few moving parts, low
rotation speed, proven technology)− Permanent magnets (no excitation
of rotor required, less electrical parts)
• EfficientLarge rotor giving higher yield(+15% vs. current generation)
• RobustGenerator rotor receivingonly PURE TORQUE®− Separation between the main rotor
and the generator rotor protectingthe drive train and increasing reliability
Product roadmap
Source: Alstom
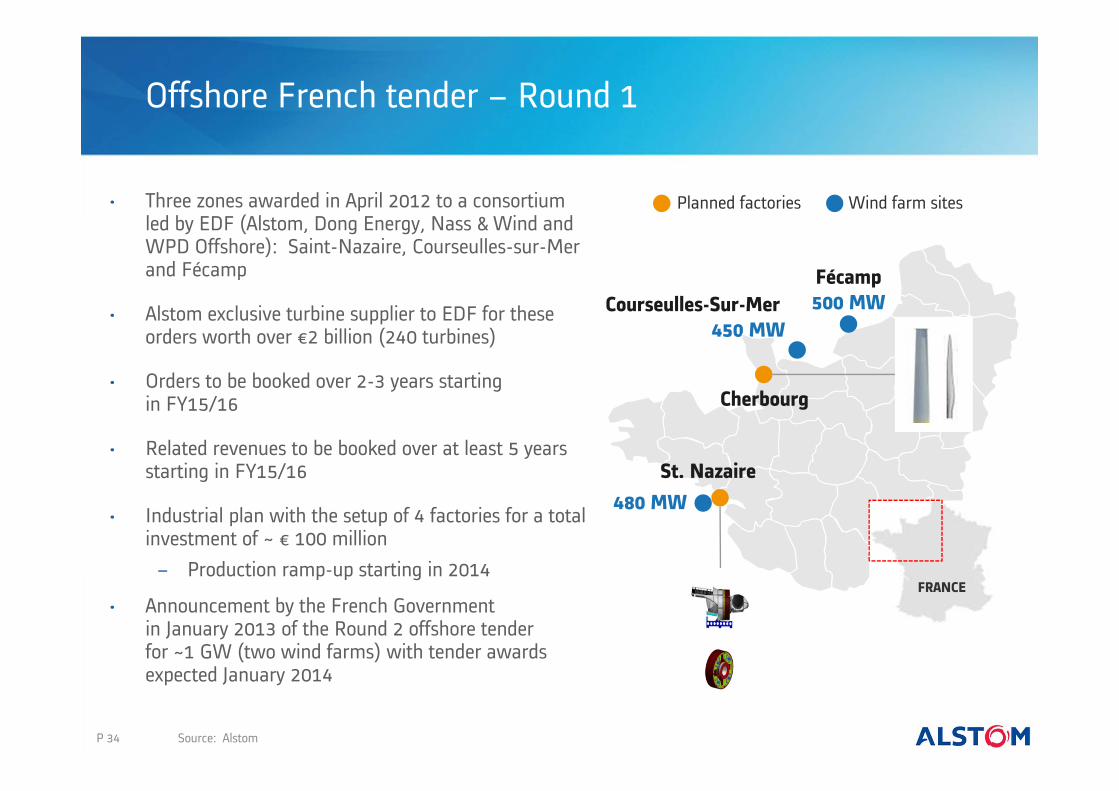
Offshore French tender – Round 1
• Three zones awarded in April 2012 to a consortium led by EDF (Alstom, Dong Energy, Nass & Wind and WPD Offshore): Saint-Nazaire, Courseulles-sur-Merand Fécamp
• Alstom exclusive turbine supplier to EDF for these orders worth over €2 billion (240 turbines)
• Orders to be booked over 2-3 years startingin FY15/16
• Related revenues to be booked over at least 5 years starting in FY15/16
• Industrial plan with the setup of 4 factories for a total investment of ~ € 100 million− Production ramp-up starting in 2014
• Announcement by the French Governmentin January 2013 of the Round 2 offshore tenderfor ~1 GW (two wind farms) with tender awards expected January 2014
Fécamp500 MWCourseulles-Sur-Mer
450 MW
FRANCE
P 34
St. Nazaire
Cherbourg
Planned factories Wind farm sites
Source: Alstom
480 MW
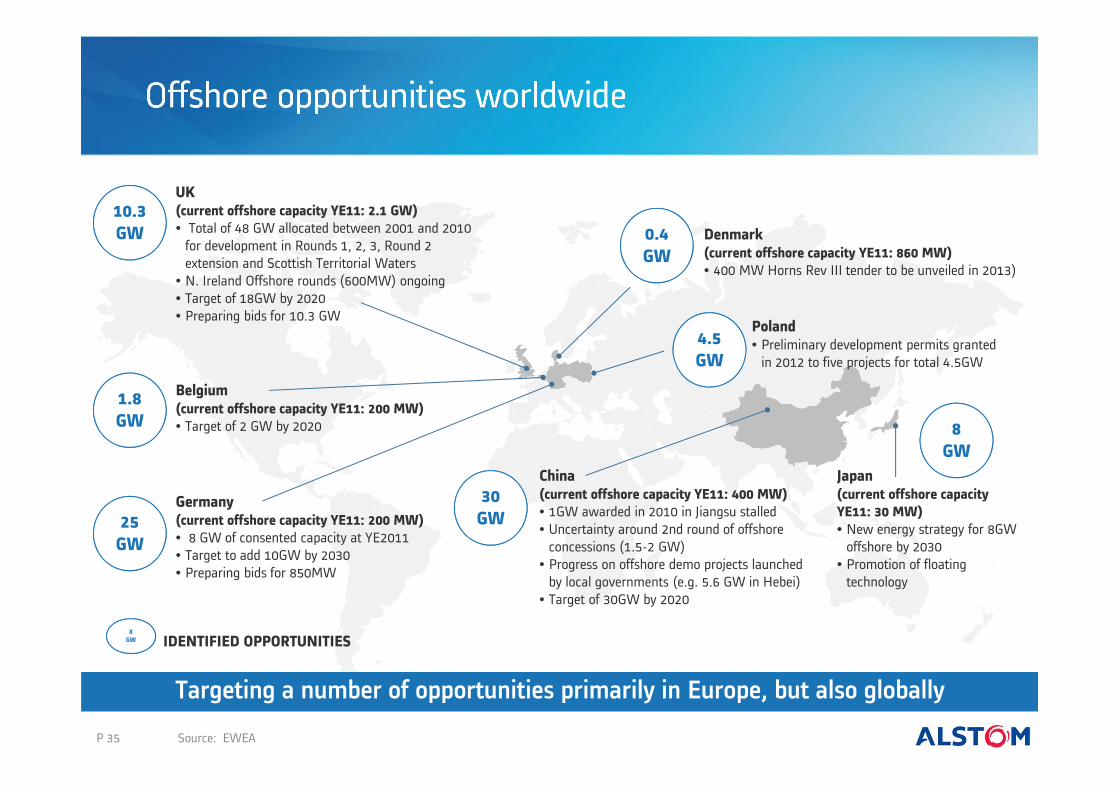
Offshore opportunities worldwide
UK(current offshore capacity YE11: 2.1 GW) • Total of 48 GW allocated between 2001 and 2010
for development in Rounds 1, 2, 3, Round 2 extension and Scottish Territorial Waters
• N. Ireland Offshore rounds (600MW) ongoing• Target of 18GW by 2020• Preparing bids for 10.3 GW
Germany(current offshore capacity YE11: 200 MW) • 8 GW of consented capacity at YE2011• Target to add 10GW by 2030• Preparing bids for 850MW
China(current offshore capacity YE11: 400 MW) • 1GW awarded in 2010 in Jiangsu stalled• Uncertainty around 2nd round of offshore
concessions (1.5-2 GW)• Progress on offshore demo projects launched
by local governments (e.g. 5.6 GW in Hebei)• Target of 30GW by 2020
Japan(current offshore capacity YE11: 30 MW) • New energy strategy for 8GW
offshore by 2030• Promotion of floating
technology
Poland• Preliminary development permits granted
in 2012 to five projects for total 4.5GW
Denmark(current offshore capacity YE11: 860 MW) • 400 MW Horns Rev III tender to be unveiled in 2013)
Belgium(current offshore capacity YE11: 200 MW) • Target of 2 GW by 2020
10.3 GW
1.8 GW
30GW25
GW
8GW
0.4 GW
4.5 GW
XGW IDENTIFIED OPPORTUNITIES
P 35
Targeting a number of opportunities primarily in Europe, but also globally
Source: EWEA
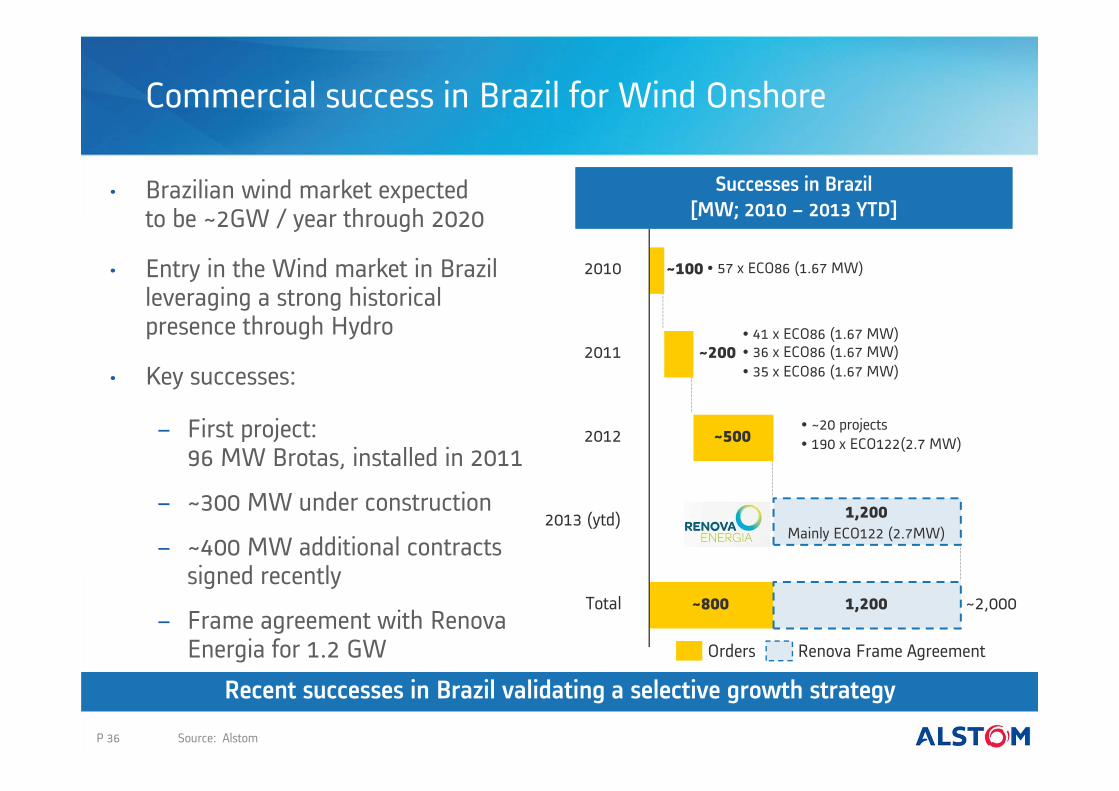
Commercial success in Brazil for Wind Onshore
• Brazilian wind market expectedto be ~2GW / year through 2020
• Entry in the Wind market in Brazil leveraging a strong historical presence through Hydro
• Key successes:
− First project:96 MW Brotas, installed in 2011
− ~300 MW under construction
− ~400 MW additional contracts signed recently
− Frame agreement with RenovaEnergia for 1.2 GW
Total ~2,000~800 1,200
2013 (ytd) 1,200
2012 ~500
2011 ~200
2010 ~100
Successes in Brazil[MW; 2010 – 2013 YTD]
Orders Renova Frame Agreement
• 57 x ECO86 (1.67 MW)
• 41 x ECO86 (1.67 MW)• 36 x ECO86 (1.67 MW)• 35 x ECO86 (1.67 MW)
• ~20 projects• 190 x ECO122(2.7 MW)
Mainly ECO122 (2.7MW)
P 36 Source: Alstom
Recent successes in Brazil validating a selective growth strategy
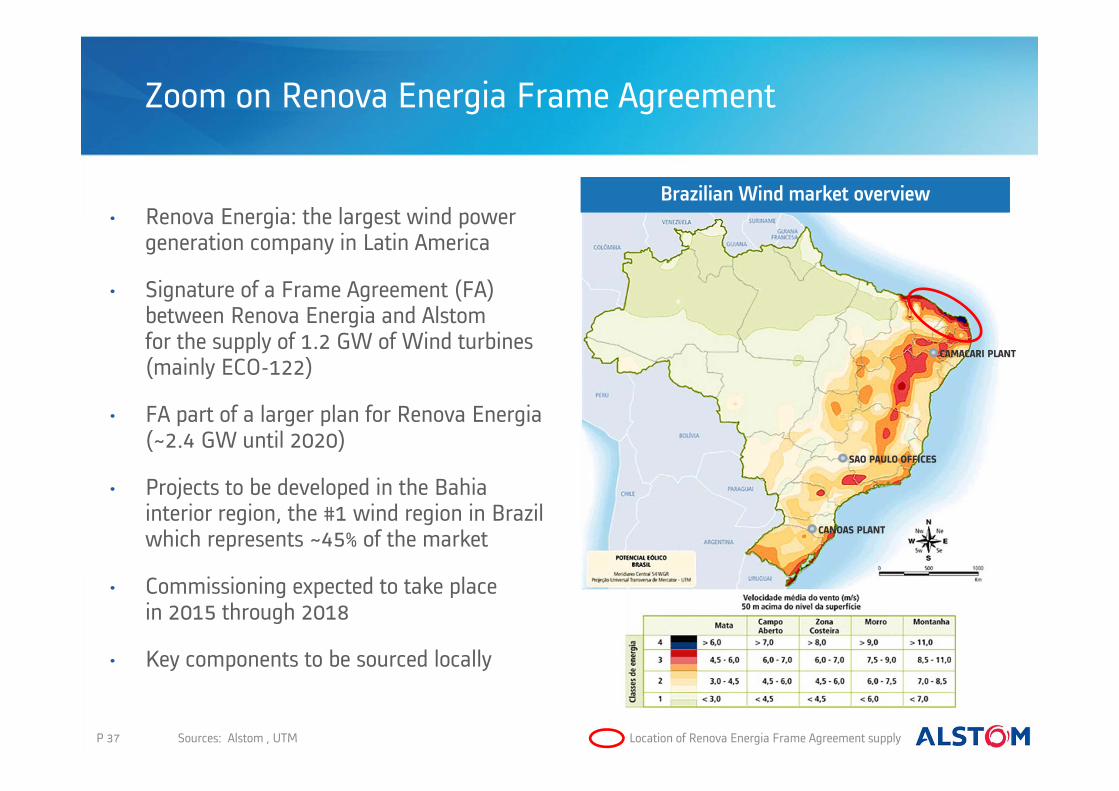
Zoom on Renova Energia Frame Agreement
P 37
• Renova Energia: the largest wind power generation company in Latin America
• Signature of a Frame Agreement (FA) between Renova Energia and Alstomfor the supply of 1.2 GW of Wind turbines (mainly ECO-122)
• FA part of a larger plan for Renova Energia(~2.4 GW until 2020)
• Projects to be developed in the Bahia interior region, the #1 wind region in Brazil which represents ~45% of the market
• Commissioning expected to take placein 2015 through 2018
• Key components to be sourced locally
CAMACARI PLANT
CANOAS PLANT
SAO PAULO OFFICES
Location of Renova Energia Frame Agreement supply
Brazilian Wind market overview
Sources: Alstom , UTM
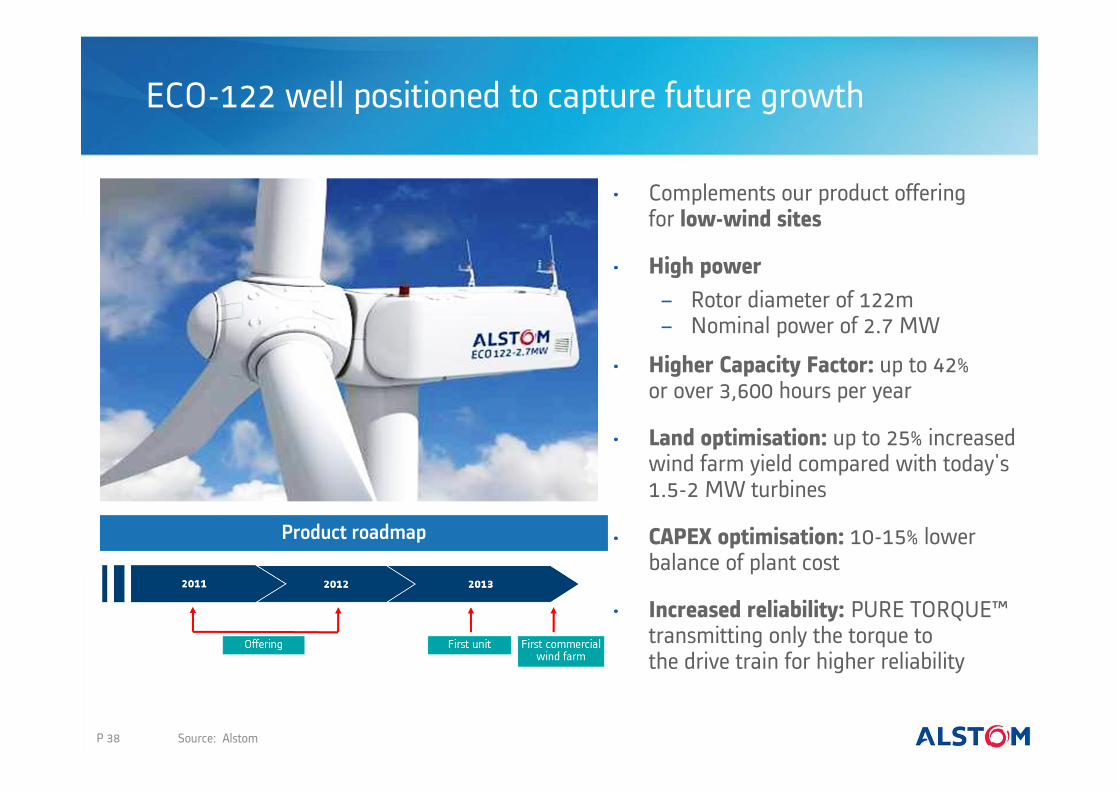
ECO-122 well positioned to capture future growth
P 38
• Complements our product offeringfor low-wind sites
• High power− Rotor diameter of 122m− Nominal power of 2.7 MW
• Higher Capacity Factor: up to 42%or over 3,600 hours per year
• Land optimisation: up to 25% increased wind farm yield compared with today's 1.5-2 MW turbines
• CAPEX optimisation: 10-15% lower balance of plant cost
• Increased reliability: PURE TORQUE™ transmitting only the torque tothe drive train for higher reliability
Source: Alstom
Product roadmap
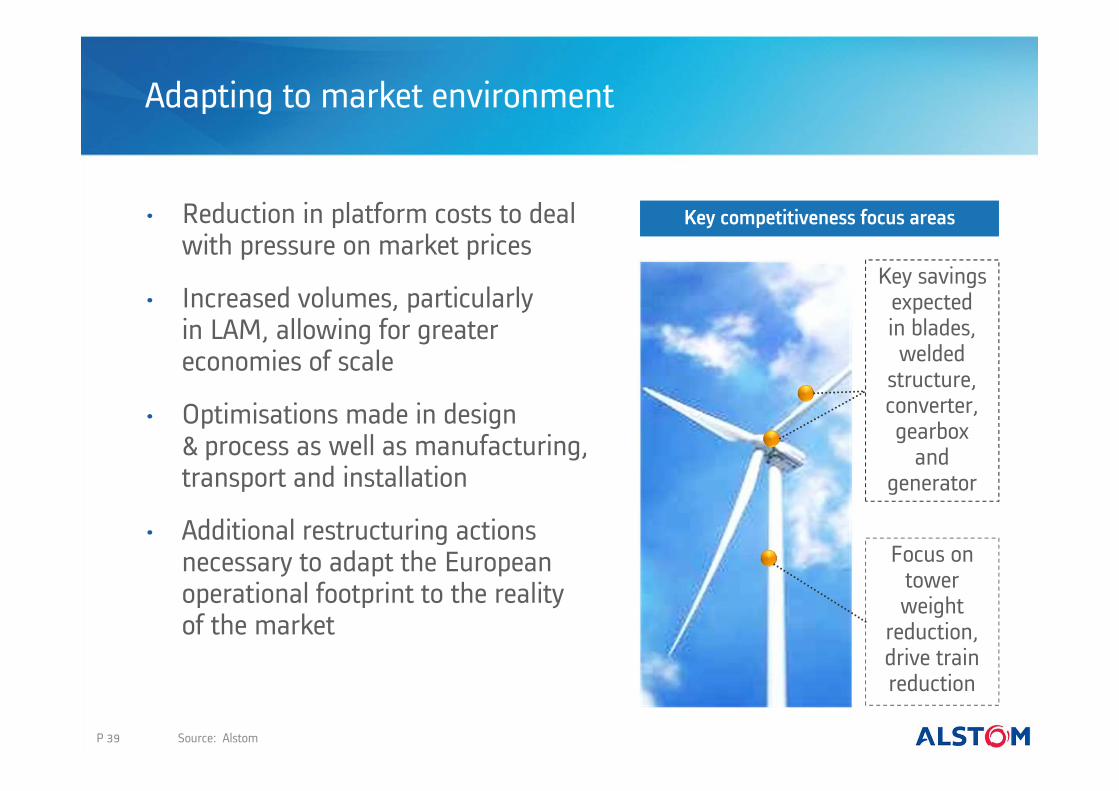
Adapting to market environment
Key savings expectedin blades, welded
structure, converter, gearbox
and generator
P 39 Source: Alstom
Focus on tower weight
reduction, drive train reduction
Key competitiveness focus areas• Reduction in platform costs to dealwith pressure on market prices
• Increased volumes, particularlyin LAM, allowing for greater economies of scale
• Optimisations made in design& process as well as manufacturing, transport and installation
• Additional restructuring actions necessary to adapt the European operational footprint to the realityof the market
Agenda
P 40
I. Renewable Power within Alstom
IV. Hydro
V. Wind
II. Renewable market
VI. New Energies
VII. Conclusion
III. Financials
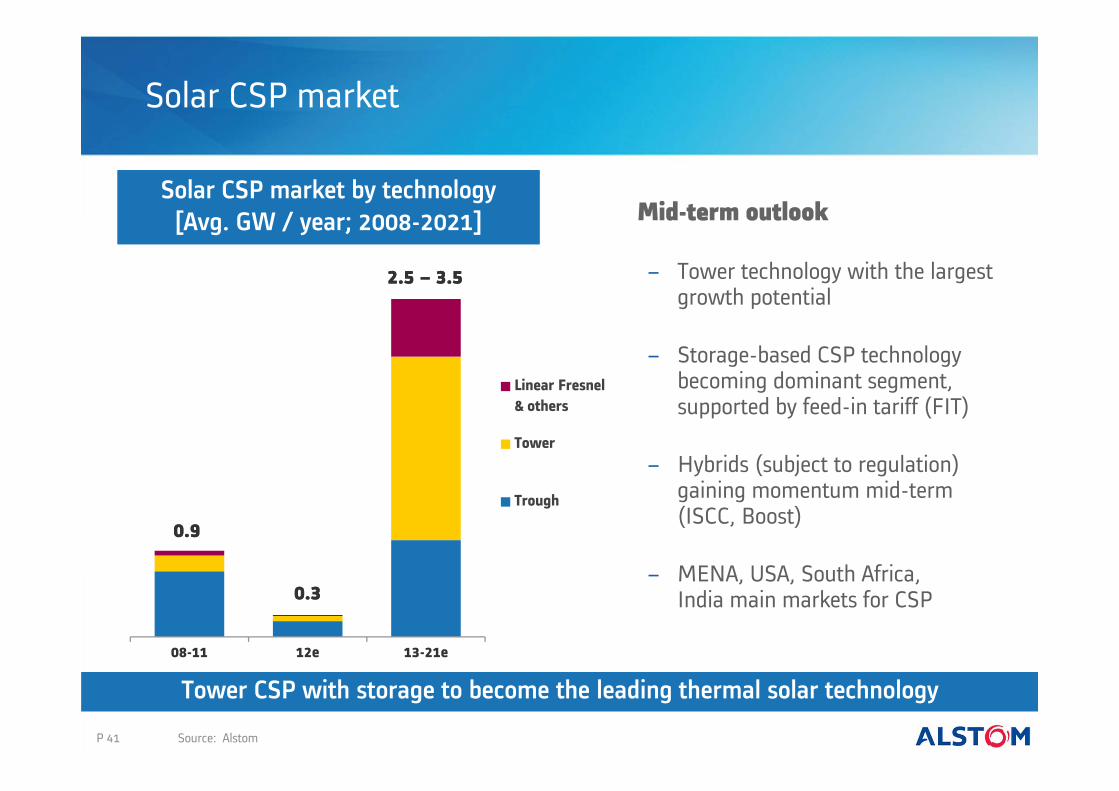
Solar CSP market
P 41
Mid-term outlook
− Tower technology with the largest growth potential
− Storage-based CSP technology becoming dominant segment, supported by feed-in tariff (FIT)
− Hybrids (subject to regulation) gaining momentum mid-term(ISCC, Boost)
− MENA, USA, South Africa,India main markets for CSP
08-11 12e 13-21e
Linear Fresnel& others
Tower
Trough
0.90.9
2.5 – 3.52.5 – 3.5
0.30.3
Solar CSP market by technology[Avg. GW / year; 2008-2021]
Source: Alstom
Tower CSP with storage to become the leading thermal solar technology
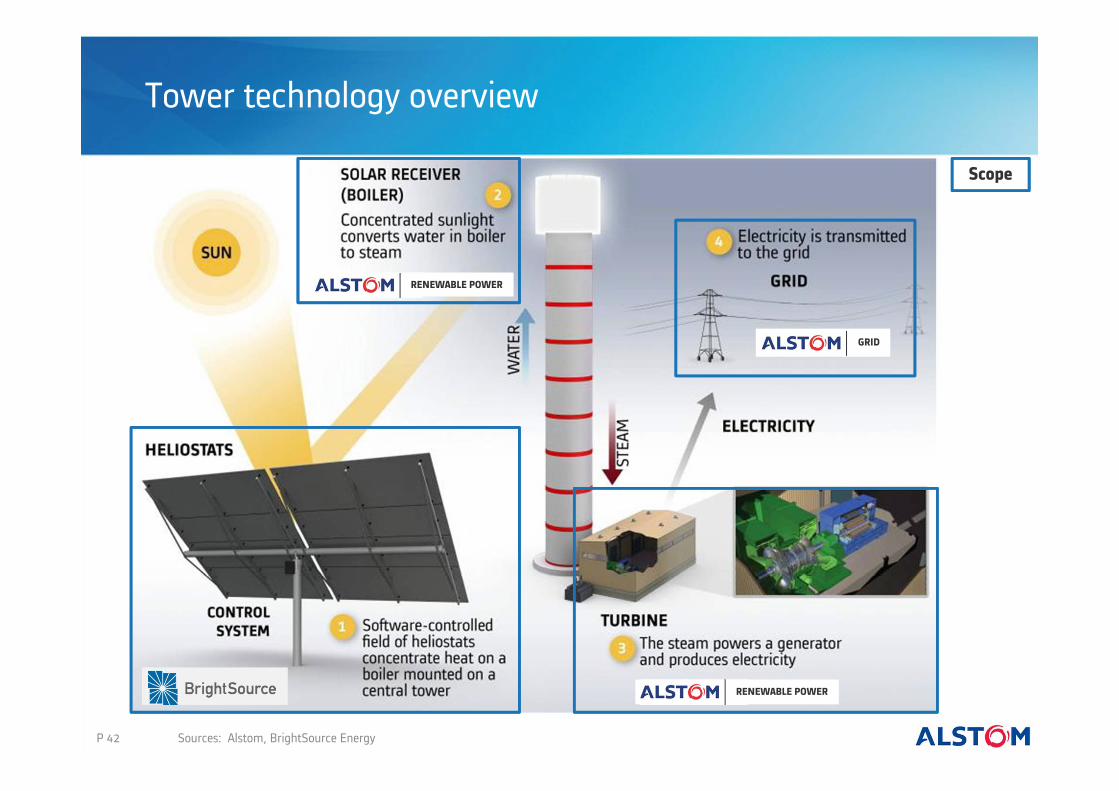
Tower technology overview
P 42 Sources: Alstom, BrightSource Energy
GRID
RENEWABLE POWER
RENEWABLE POWER
Scope
LCOE
To be proven
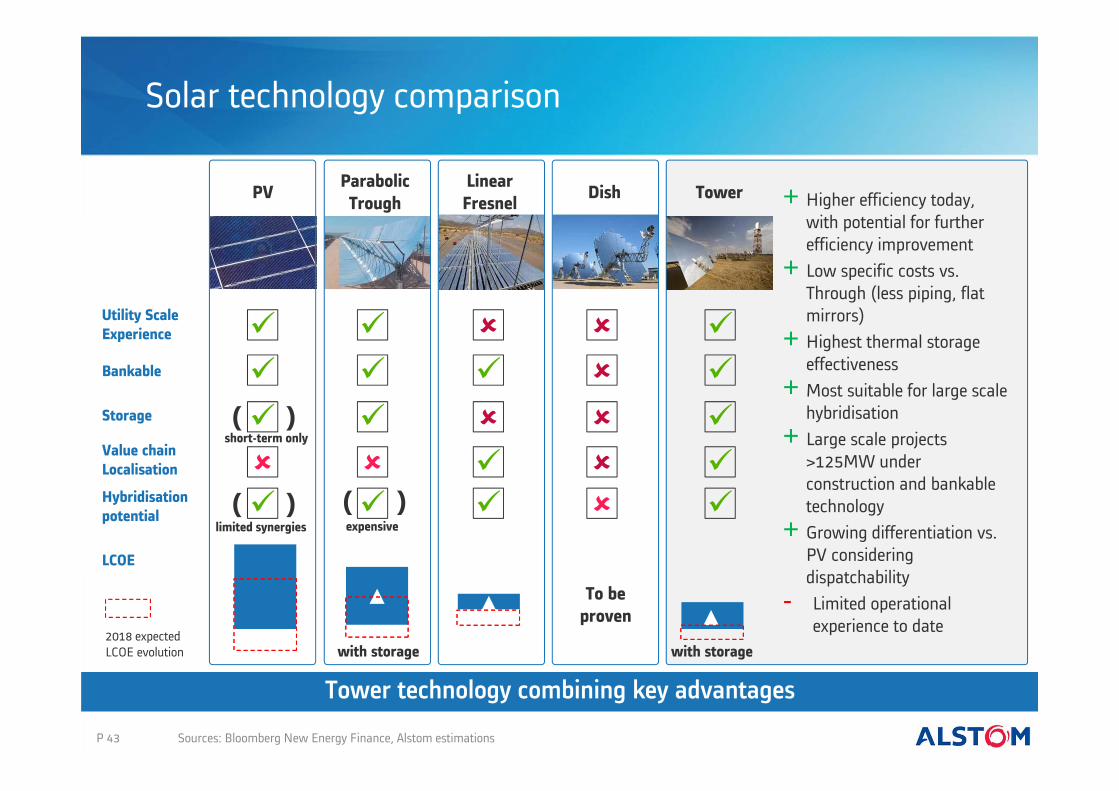
Solar technology comparison
P 43 Sources: Bloomberg New Energy Finance, Alstom estimations
ParabolicTrough
LinearFresnel Dish TowerPV
( )
( )
Utility ScaleExperience
Bankable
Storage
Value chainLocalisation
Hybridisationpotential
( )
expensive
short-term only
limited synergies
+ Higher efficiency today, with potential for further efficiency improvement
+ Low specific costs vs. Through (less piping, flat mirrors)
+ Highest thermal storage effectiveness
+ Most suitable for large scale hybridisation
+ Large scale projects >125MW under construction and bankable technology
+ Growing differentiation vs. PV considering dispatchability
- Limited operationalexperience to date
Tower technology combining key advantages
with storage2018 expectedLCOE evolution with storage
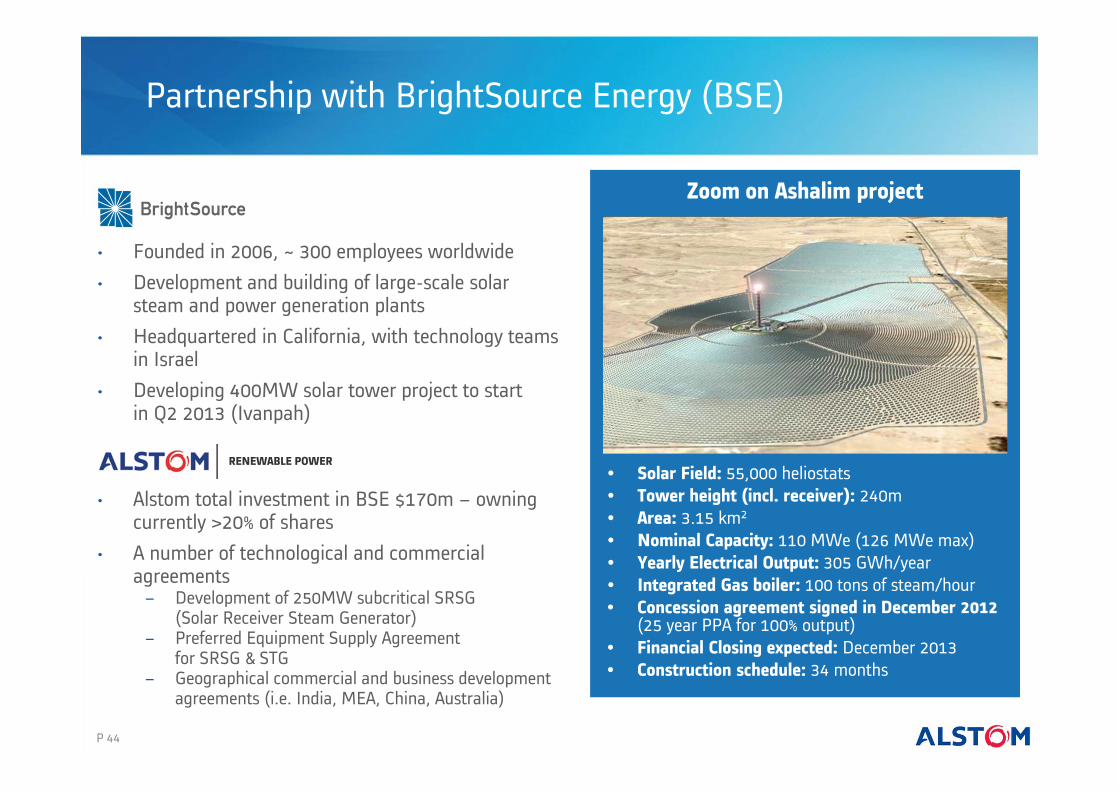
Partnership with BrightSource Energy (BSE)
• Founded in 2006, ~ 300 employees worldwide• Development and building of large-scale solar
steam and power generation plants • Headquartered in California, with technology teams
in Israel• Developing 400MW solar tower project to start
in Q2 2013 (Ivanpah)
• Alstom total investment in BSE $170m – owning currently >20% of shares
• A number of technological and commercial agreements− Development of 250MW subcritical SRSG
(Solar Receiver Steam Generator)− Preferred Equipment Supply Agreement
for SRSG & STG− Geographical commercial and business development
agreements (i.e. India, MEA, China, Australia)
• Solar Field: 55,000 heliostats • Tower height (incl. receiver): 240m• Area: 3.15 km2
• Nominal Capacity: 110 MWe (126 MWe max)• Yearly Electrical Output: 305 GWh/year• Integrated Gas boiler: 100 tons of steam/hour• Concession agreement signed in December 2012
(25 year PPA for 100% output)• Financial Closing expected: December 2013• Construction schedule: 34 months
P 44
Zoom on Ashalim project
RENEWABLE POWER
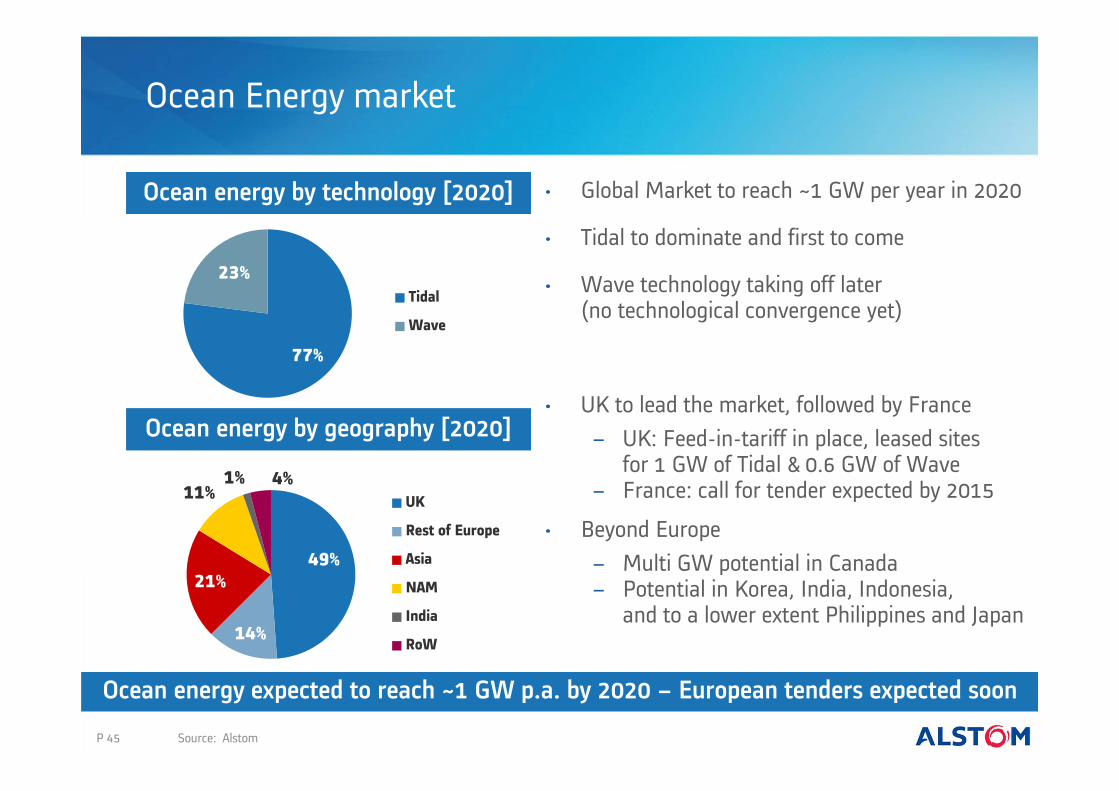
77%
23%Tidal
Wave
Ocean Energy market
P 45
49%
14%
21%
11%1% 4%
UK
Rest of Europe
Asia
NAM
India
RoW
• Global Market to reach ~1 GW per year in 2020
• Tidal to dominate and first to come
• Wave technology taking off later(no technological convergence yet)
• UK to lead the market, followed by France− UK: Feed-in-tariff in place, leased sites
for 1 GW of Tidal & 0.6 GW of Wave − France: call for tender expected by 2015
• Beyond Europe− Multi GW potential in Canada − Potential in Korea, India, Indonesia,
and to a lower extent Philippines and Japan
Source: Alstom
Ocean energy expected to reach ~1 GW p.a. by 2020 – European tenders expected soon
Ocean energy by technology [2020]
Ocean energy by geography [2020]
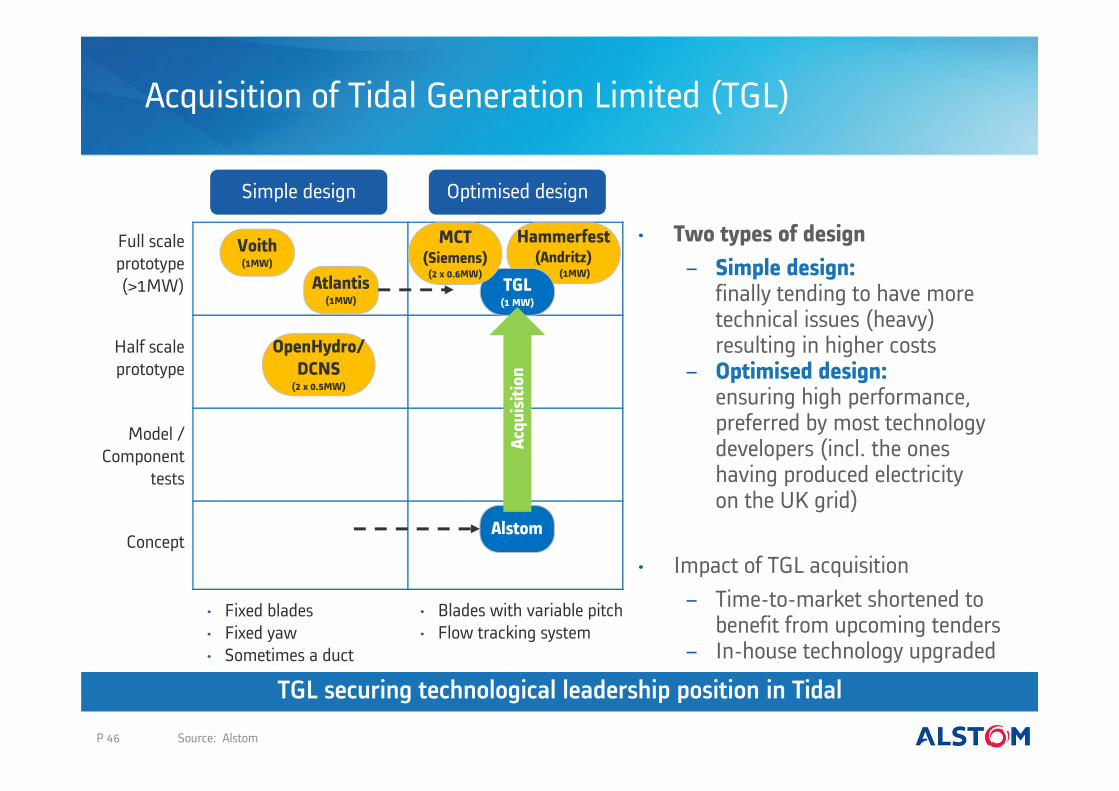
Acquisition of Tidal Generation Limited (TGL)
Model / Component
tests
Optimised design
Full scale prototype (>1MW)
Concept
Half scale prototype
Simple design
• Blades with variable pitch• Flow tracking system
• Fixed blades• Fixed yaw• Sometimes a duct
• Two types of design− Simple design:
finally tending to have more technical issues (heavy) resulting in higher costs
− Optimised design:ensuring high performance, preferred by most technology developers (incl. the oneshaving produced electricityon the UK grid)
• Impact of TGL acquisition− Time-to-market shortened to
benefit from upcoming tenders − In-house technology upgraded
Atlantis(1MW)
Hammerfest (Andritz)
(1MW)
OpenHydro/DCNS
(2 x 0.5MW)
Voith(1MW)
TGL(1 MW)
MCT (Siemens)
(2 x 0.6MW)
Alstom
P 46 Source: Alstom
TGL securing technological leadership position in Tidal
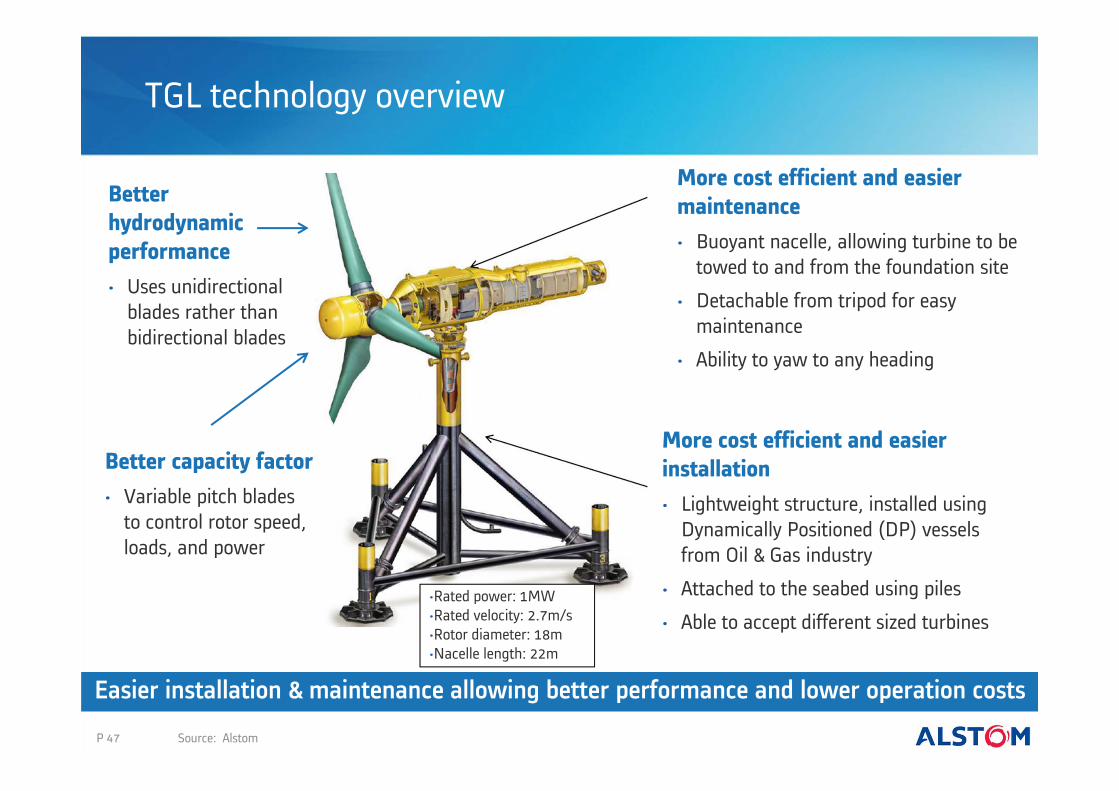
TGL technology overview
More cost efficient and easier installation• Lightweight structure, installed using
Dynamically Positioned (DP) vesselsfrom Oil & Gas industry
• Attached to the seabed using piles
• Able to accept different sized turbines
More cost efficient and easier maintenance• Buoyant nacelle, allowing turbine to be
towed to and from the foundation site
• Detachable from tripod for easy maintenance
• Ability to yaw to any heading
Better capacity factor• Variable pitch blades
to control rotor speed, loads, and power
•Rated power: 1MW•Rated velocity: 2.7m/s•Rotor diameter: 18m•Nacelle length: 22m
Better hydrodynamic performance• Uses unidirectional
blades rather than bidirectional blades
P 47 Source: Alstom
Easier installation & maintenance allowing better performance and lower operation costs
Agenda
P 48
I. Renewable Power within Alstom
IV. Hydro
V. Wind
II. Renewable market
VI. New Energies
VII. Conclusion
III. Financials
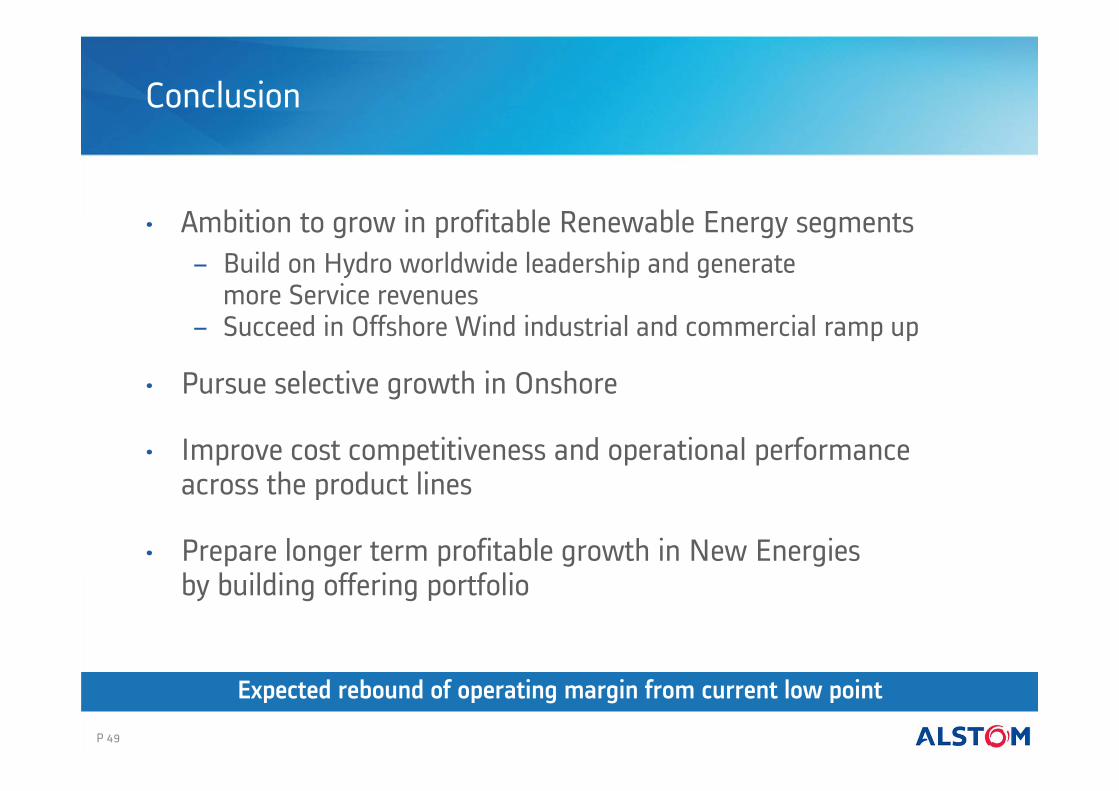
Conclusion
• Ambition to grow in profitable Renewable Energy segments− Build on Hydro worldwide leadership and generate
more Service revenues− Succeed in Offshore Wind industrial and commercial ramp up
• Pursue selective growth in Onshore
• Improve cost competitiveness and operational performance across the product lines
• Prepare longer term profitable growth in New Energiesby building offering portfolio
P 49
Expected rebound of operating margin from current low point