Embed Size (px)
Citation preview

AMRL-TR-69-30 .
PATHWAYS OF GLUCOSE CATABOLISM INMAMMALS
1. RATE OF CATABOLIC PATHWAYS IN RATS
C. H. WANG
I. R. PRINCE
F. N. DOST
D. JOHNSON
Science Research InstituteOregon State University
AUGUST 1969
a"LOPIo1061 STIN2:o copy
This document has been approved for publicrelease and sale; its distribution is unlimited.
AEROSPACE MEDICAL RESEARCH LABORATORYAEROSPACE MEDICAL DIVISIONAIR FORCE SYSTEMS COMMAND
WRIGHT-PATTERSON AIR FORCE BASE, OHIO

NOTICES
When US Government drawings, specifications, ot other data are used for any purpose other thana definitely related Government procurement operation, the Government thereby incurs no respon-sibility nor any obligation whatsoever, and the fact that the Government may have formulated, fur-nished, or in any way supplied the said drawings, specifications, or other data, is not to be regardedby implication or otherwise, as in any manner licensing the holder or any other person or corpora-tion, or conveying any rights or permission to manufacture, use, or sell any patented inventionthat may in any way be related thereto.
Federal Government agencies and their contractors registered with Defense Documentation Center(DDC) should direct requests for copies of this report to:
DDCCameron StationAlexandria, Virginia 22314
Non-DDC users may purchase copies of this report from:
Chivf, Storage and Dissemination SectionClearinghouse for Federal Scientific & Technical Information (CFSTI)Sills Building5285 Port Royal RoadSpringfield, Virginia 22151
Organizations and individuals receiving reports via the Aerospace Medical Research Laboratories'automatic mailing lists should submit the addressograph plate stamp on the report envelope or referto the code number when corresponding about change of address or cancellation.
Do not return this copy. Retain or destroy.
The experiments reported herein were conducted according to the "Guide for Laboratory AnimalFacilities and Care," 1965 prepared by the Committee on the Guide for Laboratory Animal Re-sources, National Academy of Sciences-National Research Council; the regulations and standardsprepared by the Department of Agriculture; and Public Law 89-544, "Laboratory AnimalWelfare Act," August 24, 1967.
100 - October 1969 - C0455 - 95-2097

FOREWORD
This study was initiated and co-sponsored by the AerospaceMedical Research Laboratory, Aerospace Medical Division, Wright-Patterson AFB, Ohio 45433, and the Life Sciences Division of theOffice of Aerospace Research, Arlington, Virginia 22209. Theresearch was performed in accordance with the Contract No. AF33615-67-C-1787 in support of Project 7163, "Research on Biomechanismsand Metabolism." Drs. C.H. Wang and F.N. Dost were principalinvestigators for the Science Research Institute, Oregon StateUniversity, Corvallis, Oregon 97331. Dr. Kenneth C. Back, Chief,Toxicology Branch, Toxic Hazards Division was the contract monitorfor the Aerospace Medical Research Laboratory. Research for thisfirst technical report under the contract was initiated 1 July 1967and completed I December 1968.
C. H. KRATOCHVIL, Colonel, USAF, MC
Commander
Aerospace Medical Research Laboratory
iii
TABLE OF CONTENTS
Section Page
Introduction ........... ................... 1
II Materials ..................... 16
III Methods . . . o .. ..... . .. *. . . . . . 18
IV Results and Discussion ......................... 22
References .............................. 51
iv

RATE OF CATABOLIC PATHWAYS IN RATS
SECTION I
INTRODUCTION
Within the past 30 years much progress has been made in under-
standing the metabolism of glucose in various biological systems. Of
particular interest is the recognition of several major pathways of glucose
catabolism, each involving the sequential operation of a number of re-
actions leading from glucose to various intermediates and eventually
to respiratory CO2 . These pathways are the mechanisms in producing
energy by means of biochemical oxidation and in providing intermediates
for biosynthesis.
The recognition of the Embden-Meyerhof-Parnas (EMP) pathway
represents a major breakthrough in modern biochemistry through the
efforts of such eminent scientists as Blichner, Harden, Young, Robison,
Meyerhof, Neuberg, Embden, Parnas, Needham, the Coris and Warburg
(ref. 1). The EMP pathway is, in essence, a symmetrical glycolytic
mechanism giving ris~e to the formation of two moles of pyruvic acid
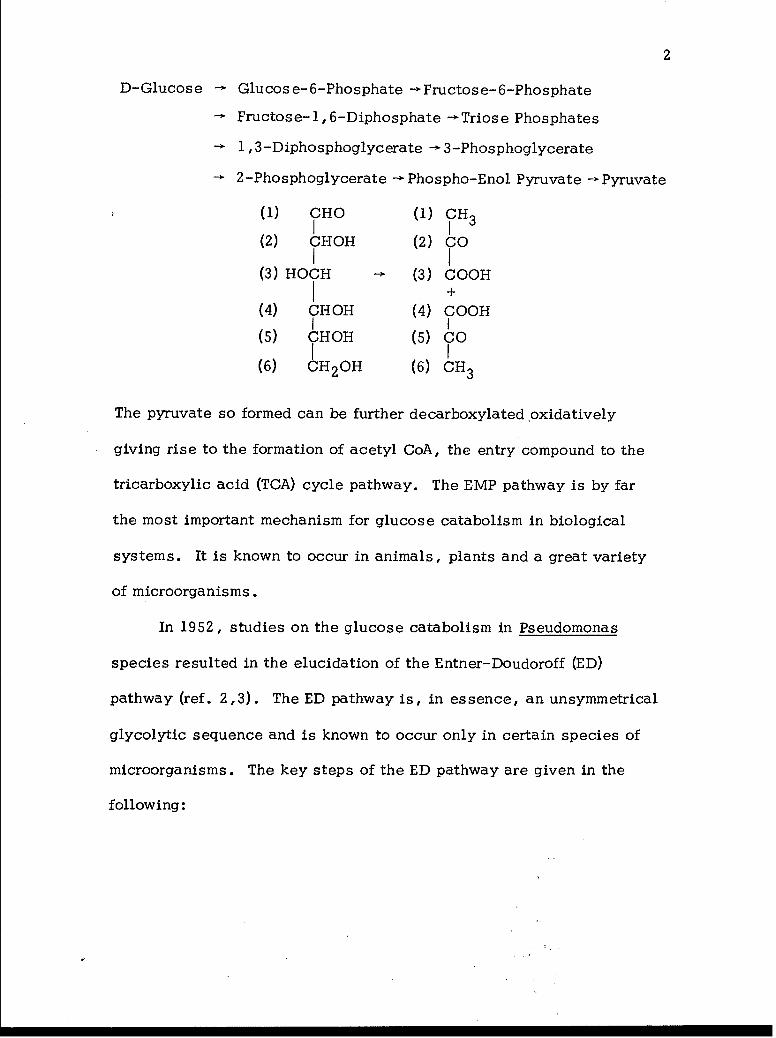
from one mole of glucose. Key steps involved under this pathway are
given in the following:
2
D-Glucose -• Glucose-6-Phosphate - Fructose- 6-Phosphate
- Fructose-1, 6-Diphosphate - Triose Phosphates
1,3-Diphosphoglycerate -• 3-Phosphoglycerate
2-Phosphoglycerate -• Phospho-Enol Pyruvate -• Pyruvate
(1) CHO (1) CH 31 1(2) CHOH (2) COI I(3) HOCH -(3) COOH
I +(4) CHOH (4) COOH
(5) CHOH (5) CO1 1(6) CH 2 OH (6) CH 3
The pyruvate so formed can be further decarboxylated oxidatively
giving rise to the formation of acetyl CoA, the entry compound to the
tricarboxylic acid (TCA) cycle pathway. The EMP pathway is by far
the most important mechanism for glucose catabolism in biological
systems. It is known to occur in animals, plants and a great variety
of microorganisms.
In 1952, studies on the glucose catabolism in Pseudomonas
species resulted in the elucidation of the Entner-Doudoroff (ED)
pathway (ref. 2,3). The ED pathway is, in essence, an unsymmetrical
glycolytic sequence and is known to occur only in certain species of
microorganisms. The key steps of the ED pathway are given in the
following:

3
D-Glucose - Glucose-6-P -•Gluconolactone-6-P
6-Phosphogluconate -• 2-Keto-3-Deoxyphosphogluconate
- pyruvate[Lglyceraldehyde-3-P -• pyruvate(1) CHO (1) COOH
1 1(2) HCOH (2) CO1 1(3) HOCH (3) CH 3I -*+
(4) H1C0OH (4) CHO (4) COOHI 1 1(s) HCOO (k) CO -- (5) 0O
(6) 01120H (6) CH 2 -O-P (6) 013
Thus, one mole of glucose is degraded .via the ED pathway giving rise
to two moles of pyruvate which can be in turn decarboxylated giving rise
to acetyl CoA.
The discovery of glucose-6-phosphate dehydrogenase and 6-
phosphogluconate dehydrogenase (ref. 4,5,6) in the middle 1930' s
paved the ground for the recognition of the pentose phosphate (PP)
pathway and the pentose cycle (PC) pathway in 1953 through the efforts
of Horecker, Racker and their associates (Ref. 7,8). Via the PP pathway,
glucose is converted to C02 and pentose phosphate. The latter is in
turn converted by way of a number of intermediates to fructose-6-P.
Fructose-6-P so formed can be catabolized via the EMP pathway through
the intermediary formation of fructose-i, 6-diP, giving rise to the for-
mation of pyruvate. Such a sequence can therefore be visualized as
the PP-EMP pathway and the essential steps are summarized in the
following:

4
D-Glucose -• Glucose-6-P -• Gluconolactone-6-P
-• 6-PhosphogluconateS edoheptulose- 7-P
- Pentose- 5-P--Tetrose-4-P
Fructose-6-P EMPFructose 1,6-diP -• Pyruvate
Glyceraldehyde-3-P - Pyruvate
(1) •HO (2) (2) CHH2 OH (2) (2) ?H3(2) H OH (3) (3) CO (3) (3) CO
3 3 H (3) (2) HOQ ->(3) (2) COOH
(4) H OH (4) (4) H OH (4) (4) COOH(5) H( OH 3(1)CO2 (5) (5) H TOH (5) k6) ýO
(6) CH2 OH (6) (6) CH 2 -O-P (6) (6) CH 3+
(4) CHO (4) COOH
(5) HYOH - (5) 0
(6) CH2 0-P (6) CH 3
Alternately, fructose-6-P, derived from glucose via the PP
pathway, can be converted to glucose-6-P via the action of D-glucose-
6-phosphate ketoisomerase -. The extent of conversion is naturally
dependent on reaction equilibria among various competing mechanisms.
The glucose-6-phosphate so formed can be in turn routed once again
into the PP pathway; such a sequence of reactions is recognized as
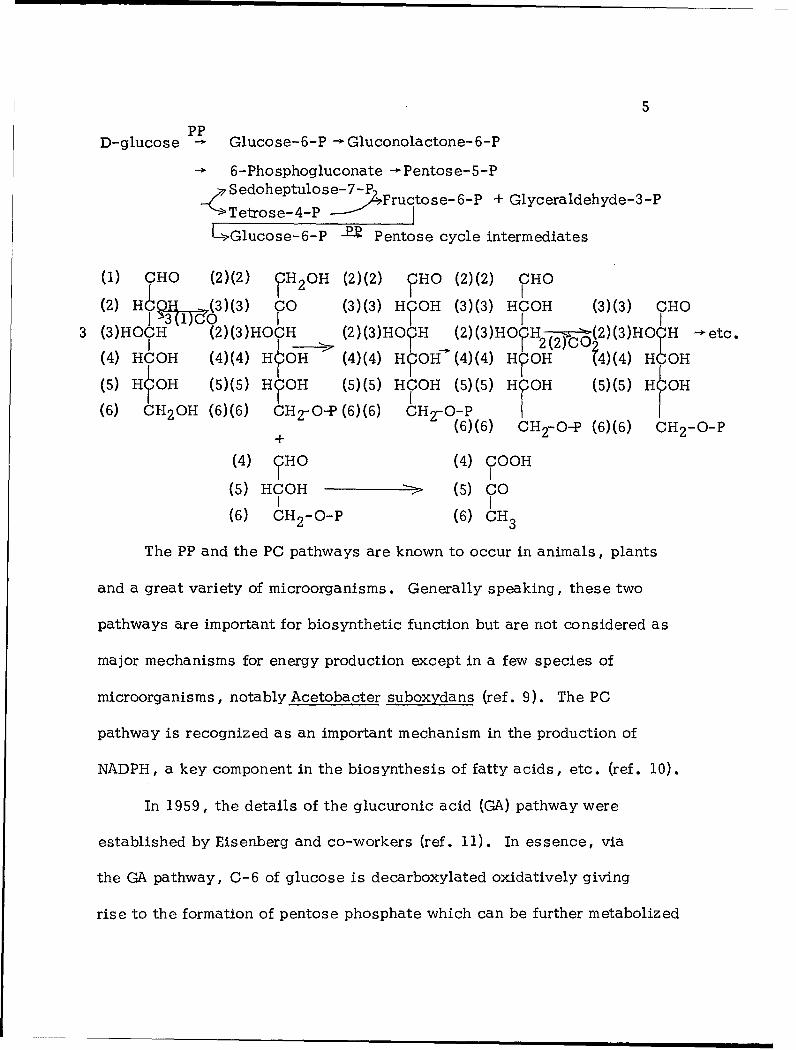
the pentose cycle pathway. The key steps involved in the PC pathway
and the rearrangement of the carbon skeleton of glucose via this pathway
are summarized in the following:
5PP
D-glucose Glucose-6-P -•Gluconolactone-6-P
6-Phosphogluconate -*Pentose-5-P_'Sedoheptulose-7-P Fructose- 6-P + Glyceraldehyde-3-P
-(ýTetrose-4-P Fr I
'->Glucose-6-P -P] Pentose cycle intermediates
(1) CHO (2)(2) 4H 2 OH (2)(2) GHO (2)(2) CHO
(2) HQL (3)(3) • (3)(3) H•OH (3)(3) 1COH (3)(3) CHO
3 (3)HOCH (2)(3)HOCH (2)(3)HORH (2)(3)H10ýH1 (2)(3)HH 0etc.
(4) HCOH (4)(4) H OE-i (4)(4) HROl (4)(4) HOH f4)(4) HOH
(5) H OH (5)(5) HROH (5)(5) HCOH (5)(5) HEOH (5)(5) H OH
(6) CH 2 OH (6)(6) CH2-O-P (6)(6) CH2-O-P
+ (6)(6) CH2-O-P (6)(6) CH 2 -O-P
(4) CHO (4) COOHT 1(5) HCOH " (5) CO1 1(6) CE2 -O-P (6) CH 3
The PP and the PC pathways are known to occur in animals, plants
and a great variety of microorganisms. Generally speaking, these two
pathways are important for biosynthetic function but are not considered as
major mechanisms for energy production except in a few species of
microorganisms, notably Acetobacter suboxydans (ref. 9). The PC
pathway is recognized as an important mechanism in the production of
NADPH, a key component in the biosynthesis of fatty acids, etc. (ref. 10).
In 1959, the details of the glucuronic acid (GA) pathway were
established by Eisenberg and co-workers (ref. 11). In essence, via
the GA pathway, C-6 of glucose is decarboxylated oxidatively giving
rise to the formation of pentose phosphate which can be further metabolized
6
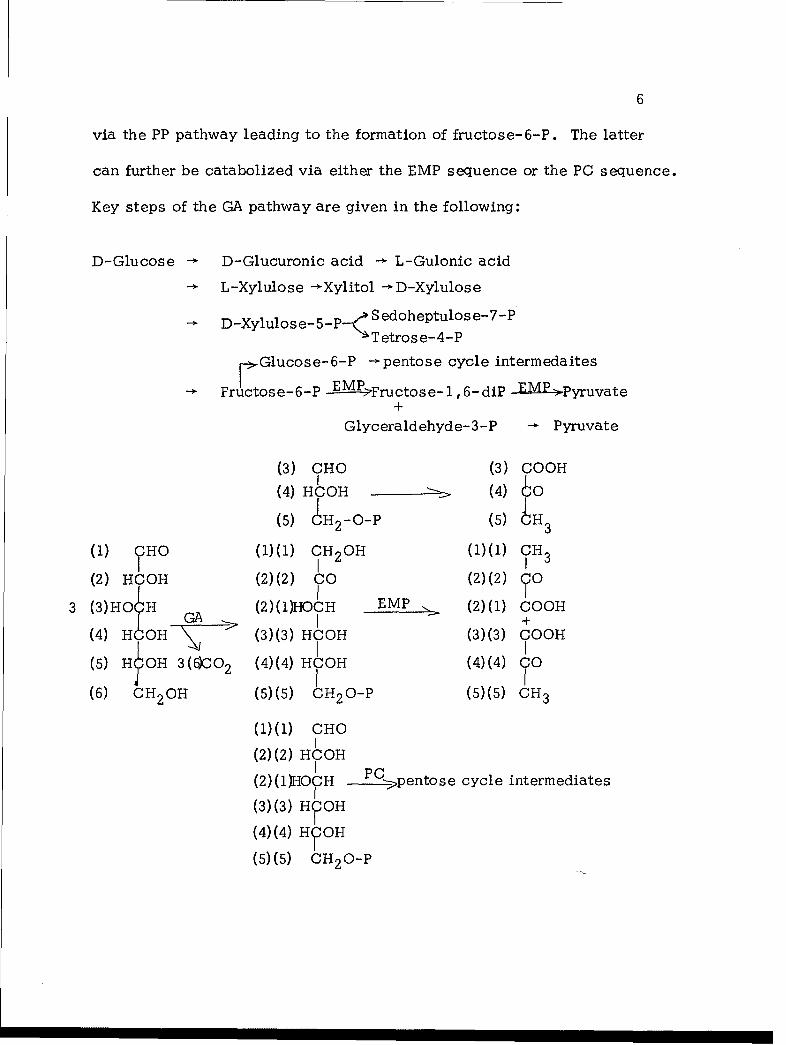
via the PP pathway leading to the formation of fructose-6-P. The latter
can further be catabolized via either the EMP sequence or the PC sequence.
Key steps of the GA pathway are given in the following:
D-Glucose -• D-Glucuronic acid -• L-Gulonic acid
L-Xylulose -*Xylitol -•D-Xylulose
_•DXylulos e_ 5_p S edoheptulose-7-PTetrose-4-P
Glucose-6-P -*pentose cycle intermedaites
-* Fructose-6-P EMP,-Fructose- 1,6- diP -EaMP--,Pyruvate+
Glyceraldehyde-3-P -• Pyruvate
(3) CHO (3) COOH
(4) KCOH t (4) 8O
(5) & 2-o-P (5) 1C 3
(1) ?HO (1)(1) CH 2 OH (I)(i) CH 3
(2) HOOH (2)(2) 0 (2)(2) YO
3 (3)HOýH (2)(1)HOCH EMP (2)(1) COOHGI +
(4) HOOH (3)(3) HCOH (3)(3) COOK
(5) H OH 3(E)C02 (4)(4) HCOK (4)(4) CO1 1(6) CH 2 OH (5)(5) CH20-P (5)(5) CH 3
(1)(1) CHO
(2) (2) HCOHI PC(2)(IlIO•H -,pentose cycle intermediates
(3) (3) HOH
(4)(4) HKOH
(5)(5) CH 2 0-P
7
The GA pathway is reported to be operative in higher animals (ref. 12,
13,14) and in other biological systems. It is recognized that the GA
pathway is of importance for synthesis of L-ascorbic acid in animals
other than primates and the guinea pig but is not a major mechanism for
energy production.
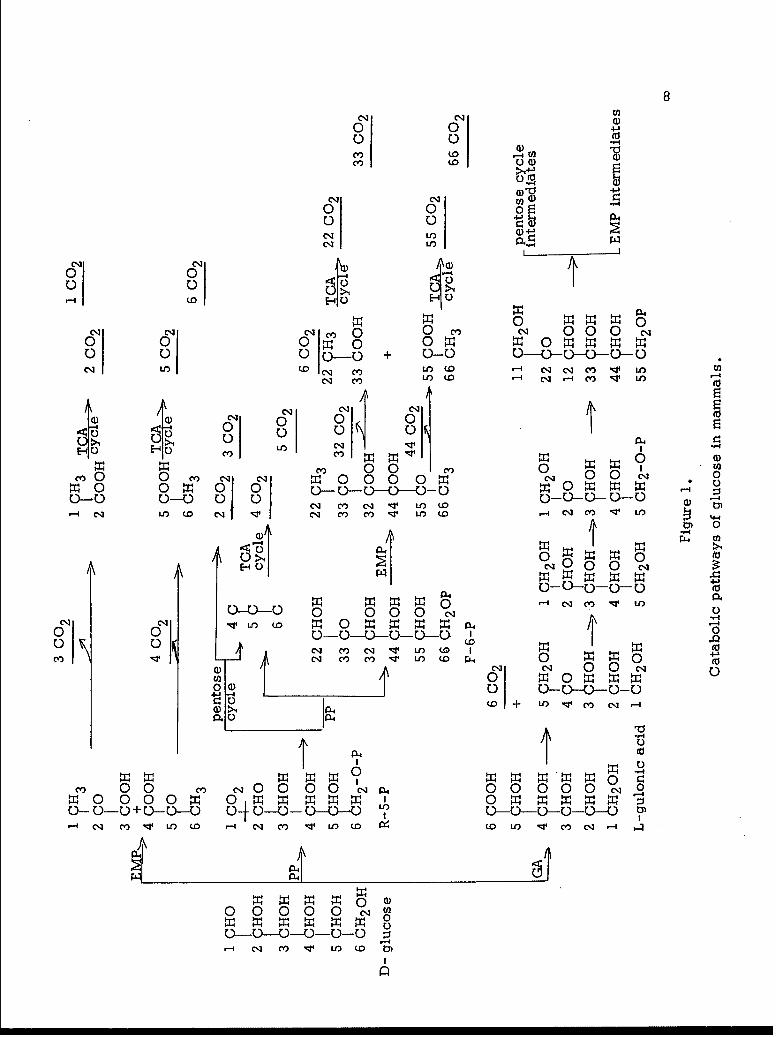
In mammals, information in the literature (ref. 12,14,16,17)
indicates that glucose is catabolized via the concurrent operation of
three primary pathways, namely: the EMP pathway, the PP pathway
(with fructose-6-phosphate formed therefrom routed into the EMP and
the PC pathways) and the GA pathway, with the latter two presumably
playing minor roles insofar as energy production is concerned. Pyruvic
acid is the key intermediate derived from glucose via each of these
pathways. Oxidative decarboxylation of pyruvate leads to the formation
of acetyl CoA which can be readily catabolized via the TCA cycle
pathway giving rise to carbon skeletons of various lengths for bio-
synthetic functions and to respiratory CO2 and water for energy production.
The composite mechanism for glucose catabolism in higher animals is
depicted in Figure 1.
Recognition of the nature of catabolic pathways of glucose in
biological systems prompted many workers to estimate relative roles
played by the individual catabolic sequences in over-all catabolism.
Such information is of great importance in understanding the functions
00 0)-
0 V C. - Uto 1 0 w
a0)o
0 0 o I -
(0~~0 Hk E4
cCJ4v, 0110 0 x 0 0 m 000 W.m
0 0 0o m - 0 C
0 0 0 U-0~ + U0- 0-0-0-O-0-0-0C4LO) LO( 3 CV0O ( -4 cq " m W
0 C',
00 00IY ~ co)~1~L(
0-U~~~ 0-00-0-m 0 0 ~ z 0L -U- - -o(0II WM' 1
0-0 00-0-0-0()m--- 0I LO(00
0 0 0r4-
(v)C~ ~) Y) U) (0 -~0 M 01
E-4 0l 0 1
000 0 0-0-0-0-
00 +0I .J
0000 C13 00 0 0
0 a)
00
m ) w -I c oa 14W V ) (0 LO m v m - 1
9
of each of the glucose pathways. Numerous methods have been devised
to estimate the participation of glucose pathways making use of radio-
tracer methods involving 14C and 3H-specifically labeled glucose as
substrates. Unfortunately, some early works in this regard did not
provide precise information since one of the key assumptions underlying
the early methods stated that the pentose phosphate derived from glucose
via the PP pathway does not participate further in catabolic functions.
Such an assumption was soon proven incorrect upon unveiling of the
details of the PC pathway by Horecker (ref. 7) and Racker (ref. 8).
The catabolic fate of pentose phosphate derived from glucose has been
taken into consideration by various investigators since 1956 (ref. 17,
18,19,20,21) in devising methods for meaningful estimation of glucose
pathways.
Existing methods for pathway estimation can be classified into
different categories on the basis of either experimental approaches or
objectives. Insofar as experimental approaches are concerned, in
most of the reported experiments labeled substrates were generally
introduced into tissue preparations or intact biological systems in
single doses. Information on glucose pathways was obtained by
examining one or more of the following manifestations:
(a) relative specific activities of glucose derivatives such
as. glycogen, glycerol, lactate, 002, etc. derived from
10
1 4 C-specifically labeled glucose substrates (ref. 17,20),
(b) yields of 1 4 C in fatty acids, lactate, etc. derived from
14C-specifically labeled glucose substrates (ref. 20), and
(c) yields of 14 C in respiratory CO 2 derived from 1 4 C-specifically
labeled glucose substrates (ref. 21,22).
Practically all the reported works on glucose pathways are con-
cerned with the relative participation of the EMP pathway and the PP
(or PC) pathway in biological systems. This is understandable since
these two pathways are by far the most common mechanisms in animals,
plants and a majority of the microorganisms. The participation of other
pathways such as the GA pathway in animals and plants has been in-
vestigated by some workers. However, up to the present time, there
exists no useful method for the estimation of three concurrent glucose
pathways in any biological system.
The objectives of the existing methods for the estimation of two
concurrent pathways have been focused on a direct assessment on the
contribution of the PP (or the PC) pathway. The contribution of the
EMP pathway is deduced from the difference between total amount of
glucose metabolized and the fraction of glucose engaged in PP (or PC)
pathway. This approach is naturally under the assumption that
substrate glucose does not participate in either anabolic pathways
or other catabolic pathways. Wang and his co-workers (ref. 21,23)
11
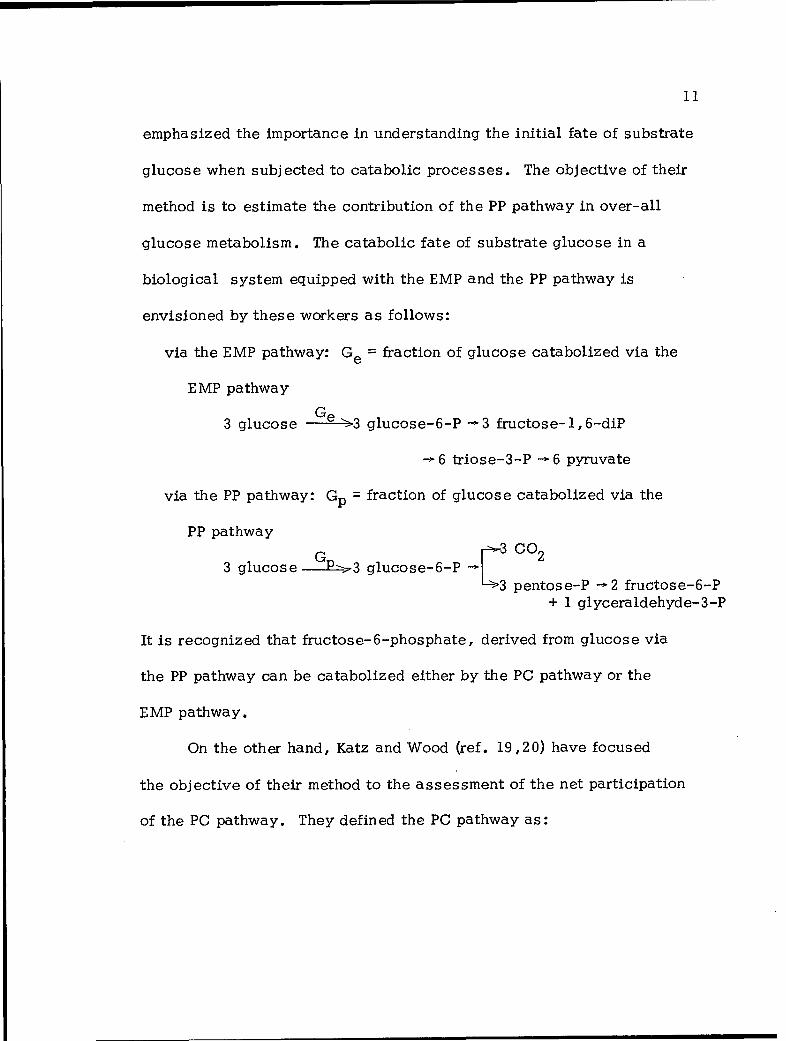
emphasized the importance in understanding the initial fate of substrate
glucose when subjected to catabolic processes. The objective of their
method is to estimate the contribution of the PP pathway in over-all
glucose metabolism. The catabolic fate of substrate glucose in a
biological system equipped with the EMP and the PP pathway is
envisioned by these workers as follows:
via the EMP pathway: Ge = fraction of glucose catabolized via the
EMP pathway
3 glucose - ý3 glucose-6-P -. 3 fructose-1,6-diP
-. 6 triose-3-P -. 6 pyruvate
via the PP pathway: Gp = fraction of glucose catabolized via the
PP pathway
3 glucose G---O3 glucose-6-P2>3 pentose-P -. 2 fructose-6-P
+ 1 glyceraldehyde-3-P
It is recognized that fructose-6 -phosphate, derived from glucose via
the PP pathway can be catabolized either by the PC pathway or the
EMP pathway.
On the other hand, Katz and Wood (ref. 19,20) have focused
the objective of their method to the assessment of the net participation
of the PC pathway. They defined the PC pathway as:

12
via the PC pathway: PC = fraction of glucose catabolized via the
PC pathway
3 glucose-6-P--3 CO 2 + 1 glyceraldehyde-3-P + 2 fructose-6-P
2 fructose-6-P -•2 glucose-6-Pnet reaction
glucose 'C-'>I glucose-6-P -•3 CO2 + 1 glyceraldehyde-3-P
More recently, Landau, Katz and Bartsch have examined in more detail
the validity of their method in applying to studies with adipose tissue,
taking into consideration the equilibria of several key steps in glucose
catabolism such as triose phosphate isomerization (ref. 10) and the
transaldolase reaction (ref. 24). It should be noted that the contribution
of the pentose cycle pathway designated as PC and the term Gp, defined
by Wang and his co-workers as the participation of the PP pathway in
over-all glucose catabolism, can be readily related to each other
(ref. 21,22) and represented by the expression: Gp = 3 PCI+2 PC
Whereas the existing methods for pathway estimation do provide
one with useful information on the relative roles of two major pathways
operating concurrently in biological systems, these methods are never-
theless suffering from several drawbacks. Thus, in order to assess
the role played by the PC pathway, Katz and his co-workers assumed
that glucose is not engaged to any great extent in non-triose phosphate
pathways and that the pentose phosphate, derived from the glucose
13
via the PP pathway, is not engaged in any biosynthetic processes
(ref. 19). The validity of these assumptions cannot be readily verified.
Of more importance is the fact that the existing methods do not provide
one with a direct assessment on the participation of the EMP pathway.
Only by assuming that glucose is not engaged in any anabolic processes
and that the EMP and the PP pathways are the only catabolic routes can
one estimate the contribution of the EMP pathway by difference. The
validity of these assumptions may be questioned since it is known
that glucose can be incorporated into glycogen, etc. and that the
glucuronic acid pathway is operative in several biological systems
including higher animals. It is for this reason that in reality there
exists, at the present time, no defined information on the relative
participation of glucose pathways in mammals.
The experimental approaches underlying various existing methods
for pathway studies with mammals are also matters of concern. First,
reported works on glucose pathways in mammals using radiotracer
methods are those involving the use of either tissue preparation or
intact animals. Findings with a preparation of a given tissue do not
reflect the catabolic behavior of intact animals. Second., means
for substrate administration in reported experiments with intact animals
can be classified into two basic types on the basis of the routes used
for substrate* administration. A number of workers prefer to administer

14
labeled glucose by means of single-dose intravenous injection of a
trace amount of labeled glucose. Findings in this type of experiment
reflect at best only the catabolic behavior of endogenous glucose. It
is likely that a trace amount of labeled glucose, once injected into
the circulatory system, is trapped by various endogenous pools such
as glycogen, etc. and thereby creating a distorted catabolic picture.
Wang and co-workers (ref. 12) administered 1.5 gm of 1 4 C-labeled
glucose, in solution form, to fasted rats by means of stomach tube.
Although they have obtained some useful radiorespirometric data,
their findings do not permit them to assess quantitatively the relative
participation of catabolic pathways. In fact, single-dose substrate
administration, regardless of the routes, constitute a transient
increase of glucose in the animal body. Findings obtained in this
type of experiment would not provide one with meaningful kinetic
information leading to a correct understanding of the catabolic fate
of glucose.
In the present work, glucose catabolism in intact rats is studied
by means of the radiorespirometric method. Carbon-14 specifically
labeled glucose at an optimal level, as determined in a series of
preliminary experiments, is administered to rats continuously by way
of intravenous infusion. Data obtained on the rate of 14CO 2 production
from rats utilizing labeled glucose under steady state conditions are

15
used to calculate the catabolic rates of three concurrent pathways; i.e.,
the EMP pathway, the PP pathway and the GA pathway.

16
SECTION II
MATERIALS
Experimental Animals
Male Sprague Dawley rats obtained from the Berkeley Pacific
Laboratories, Berkeley, California were used in all phases of this work.
The animals were obtained at an average weight of 220 gin, and were
maintained on Purina Laboratory Chow and water, ad libitum.
Radiochemicals
The radiochemicals used in the present work were obtained from
the New England Nuclear Corporation, Boston, Mass. Identity and
purity of each of the radiochemicals was established by paper chromon-
tography and autoradiography. Labeling positions for each of the radio-
chemicals were established by means of microbial degradation of the
respective compounds.
Other Chemicals
Reagent grade chemicals were used in all operations. Materials for
liquid scintillation counting were obtained from the Packard Instrument
Company, Downer's Grove, Illinois. Glucostat reagent for the deter-
mination of blood glucose was obtained from the Worthington Biochemical
Company, Freehold, New Jersey
Instrumentation and Other Equipment
Polyethylene- silicone rubber cannulas were prepared for these

17
studies by Mr. J. J. Krake of the Upjohn Research Laboratory, Kalamazoo,
Michigan, according to the methods described by Heatley and Weeks
(ref. 25).
The infusion system consists of a Harvard Model 600-2-200 syringe
pump with variable control (Harvard Apparatus Co., Dover, Massachusetts)
modified to drive four 10 ml plastic disposable syringes (Plasti-pak,
Becton Dickinson Co., E. Rutherford, New Jersey). A 30-inch length
of PE 100 tubing (Clay-Adams, Inc., New York) is attached to each
syringe for connection with the indwelling cannula of the rat.
Respiratory 14CO2 was measured continuously by means of a radio-
respirometric system described in detail by Wang (ref. 27). The 1.6-
liter animal chamber is swept with air at a rate of 500 ml per minute,
carrying respiratory 14CO 2 through a drying column and then a one
liter flow-ion chamber. The ion current generated by beta particles
arising from the disintegration of 1 4 C in the ion chamber is measured by
a vibrating reed electrometer (Cary Model 31, Applied Physics Co.).
The analog signal from the electrometer is converted to digital form by
a voltage-to-frequency converter (Dymec 2010, Hewlett-Packard Co.).
The digital pulses are accumulated on a six decade RIDL Model 49-43
scaler, and printed out at pre-set time intervals upon receipt of command
from a programmer (RIDL 52-44) and timer (RIDL 54-8), which also control
simultaneously the operation of three other identical systems. The
calibration of 14C-measurement in the ion chamber has been described
previously (ref. 28).
18
SECTION III
METHODS
Implantation of Cannulae
The indwelling cannula was placed in the anterior vena cava,
usually through the right jugular vein, according to the technique of
Weeks and Davis (ref. 26). The animals were allowed to recover at least
five days after surgery, or until the presurgical weight of 250 to 280 gm
was regained. When used experimentally, the animals usually weighed
280 to 320 gm.
Substrate Administration
Rats were prepared for continuous infusion in the following steps:
Food was removed 2 to 3 hours after the beginning of the daily 12-hour
dark period and 12 hours later the animal was given 1,500 mg glucose
in 3 ml water by stomach tubing. Six hours after this feeding, the rat
was considered to be in a post-absorptive state (ref. 12) with maximal
liver glycogen storage. At this time the animal was placed in a restrainer
cage (Aerospace Industries, Model 1R350, Garnerville, New York) and
connected to the substrate syringe which had been filled with the substrate
solution and pumped sufficiently to fill the connecting line and purge all
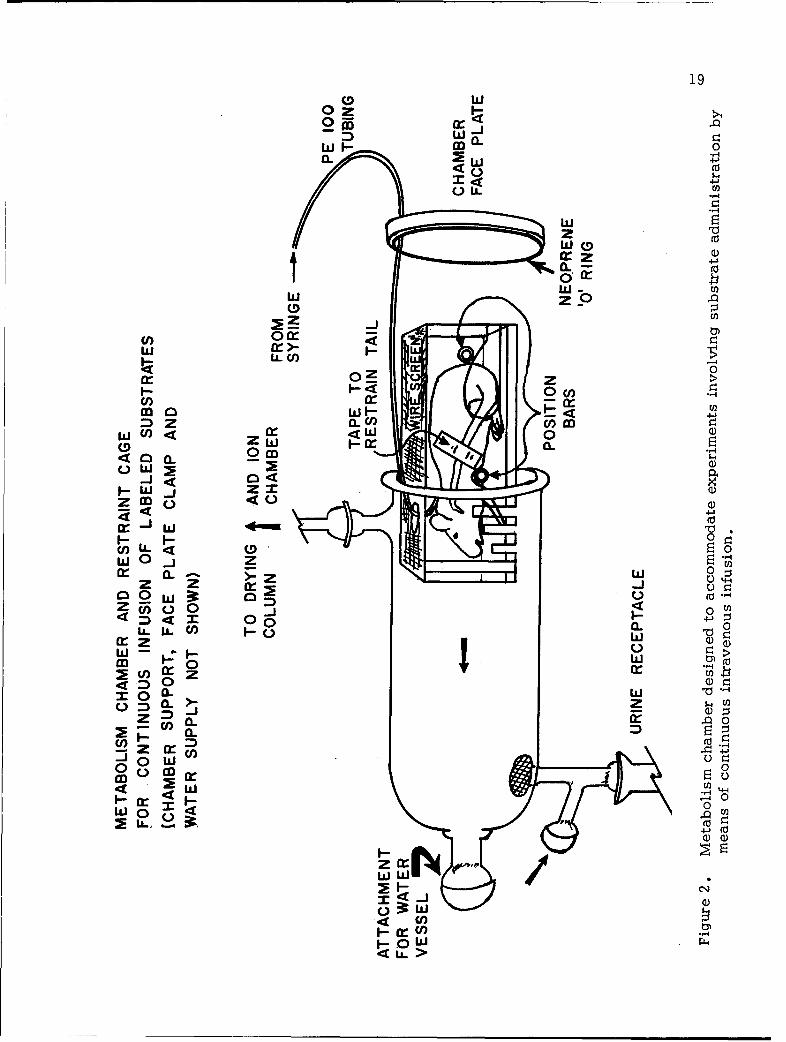
bubbles. The animal, in its restraining device, was then inserted into
a 4" x 9" radiorespirometer chamber (Figure 2).
In all but exploratory experiments, the infusion was begun and
19
z >4
w 0-4
a. w 4-J
w rz
w ~zb
U))
CA 0
w Ir -4
004l
a) aw-
C.) wI-
W0 ._j z x
c1 - -- w
z z cZ2w 0 0 En-
0 00 a. 0c1
a. oC) t3 z
+r W rru40 ()r
x o CLw,-
4U)
4LiL
20
maintained at a rate of 0. 84 ml per hour with glucose concentration ad-
justed to the appropriate level so that 150 mg glucose, containing 0.01
to 0.02 pLc 14 C, was administered to the rat per hour. Measurement of
respiratory 14CO 2 was continued through at least 5 hours after the
termination of infusion, at which time the radioactivity in respiratory
CO 2 had subsided to a negligible level.
Determination of Specific Activity of Blood Glucose
In several experiments it was desirable to know the specific
activity of blood glucose while the rat was metabolizing infused glucose
at the metabolic steady state. The substrate infusion was stopped at
the end of six hours and blood was collected by heart puncture 30 to
45 seconds after the implanted cannula was disconnected. A 0.2 ml
aliquot of the blood sample was analyzed for glucose using the glucostat
method.
To determine the radioactivity of the blood sample, one ml blood
was deproteinated with 2 ml of trichloracetic acid and the mixture cen-
trifuged for several minutes. One ml of the supernatant was placed in a
20 ml liquid scintillation counting vial and agitated with a stream of
nitrogen gas to remove any residual 1 4 CO2 . Ten ml of Bray's solution
(ref. 29) was added to the counting vial and the contents were thoroughly
mixed by shaking. The sample was then counted in a liquid scintillation
counter (Packard Instrument Company, Model 314EX2). A solution con-
taining known amounts of glucose-U- 1 4 C was used as an internal
21
standard to determine the counting efficiency for the described mixture.
All counting was carried out over a sufficient duration so that the relative
standard deviations of the counting data were less than 1%.
Specific activity of glucose was calculated on the basis of net14CO2 radioactivity in dpm per mg of glucose. Experimental evidence
indicates that radioactivity of blood components other than glucose is
negligible.
Determination of Radioactivity in Lipid Fractions
It was desirable to learn the extent of incorporation of 14C from
the labeled glucose into lipid fractions of various tissue under the con-
ditions of these radiorespirometric experiments. For this purpose, rats
were sacrificed at the end of 6 hours of a typical radiorespirometric
experiment. Various tissues were isolated and individually homogenized.
The lipid fraction was extracted according to the method of Katz, Landau
and Bartsch (ref. 10). The individual extracts were evaporated in vacuo
and processed for counting in the liquid scintillation counter in the
conventional manner.

22
SECTION IV
RESULTS AND DISCUSSION
The objective of the present work is to ascertain the catabolic
fate of administered glucose in rat. To this end, radiorespirometric
experiments were designed to collect information that can be used to
calculate the catabolic rate of individual glucose pathways. Comparative
analysis of the rate data so obtained should provide one with a good
understanding on the relative contribution of each of the major glucose
pathways.
In the present work, emphasis is focused on the initial fate of
exogenous glucose engaged in catabolic processes. It is noted that
in glucose catabolism, via any one of the three recognized major
catabolic routes (Figure 1), certain carbon atoms are converted promptly
to respiratory CO 2 . It follows that if one can collect meaningful data
on the rate of CO 2 formation from the respective carbon atoms, one
should be able to utilize such data to calculate approximate rates of
respective catabolic pathways.
Intravenous infusion was chosen as the route for substrate admin-
istration in radiorespirometric experiments since by continuous infusion
of a solution of labeled glucose at optimal concentration, a metabolic
steady state can be readily reached in rat with respect to the turnover
of the exogenous glucose (ref. 20). Experimentally, the realization of

23
a metabolic steady state can be verified by determining the rate of
respiratory 14002 formation from labeled glucose. Thus, if glucose-3-
14C is used as the substrate, one should expect that the rate of con-
version of C-3 of glucose to C02 will follow a constant rate soon after
the beginning of substrate infusion, reflecting the catabolic steady
state. This is true since it is known that the EMP-pyruvate decarboxylation
pathway is a major catabolic route in rats and via this route, the conversion
of C-3 or C-4 of glucose to C02 is a prompt process. Data on rates of 002
production obtained with rats metabolizing glucose under steady state
conditions are the only ones that can be interpreted and analyzed to
gain kinetic information of catabolic pathways.
Optimal Substrate Level
There are several important criteria that should be taken into
consideration in designing radiorespirometric experiments involving
continuous glucose infusion, particularly with respect to the rate of
infusion in terms of amount of glucose administered per unit time.
First of all, since one is interested in the catabolic fate of glucose, it
will be desirable to ensure that the bulk of the administered glucose,
as soon as it enters the circulatory system, is rapidly oxidized to CO2.
For this reason, the rats used in the experiments were those maintained
at a post-absorptive state. Under these conditions, limited amount of
substrate glucose is expected to be incorporated into liver glycogen.
If the glucose is administered to the rat at a rate significantly higher

24
than that of the metabolic capability of the rat, undesirable physiological
manifestations may result. Notable ones are the secretion of an excessive
amount of insulin and loss of labeled glucose through renal excretion.
On the other hand, if the rate of glucose infusion is too low, a distorted
catabolic picture, with respect to the exogenous glucose, may result
from the interference of endogenous glucose. It is known that with
radiotracer experiments, the extent and rate of conversion of labeled
carbon atoms of substrate to C02 is dependent on the size of the
endogenous pool (ref. 31).
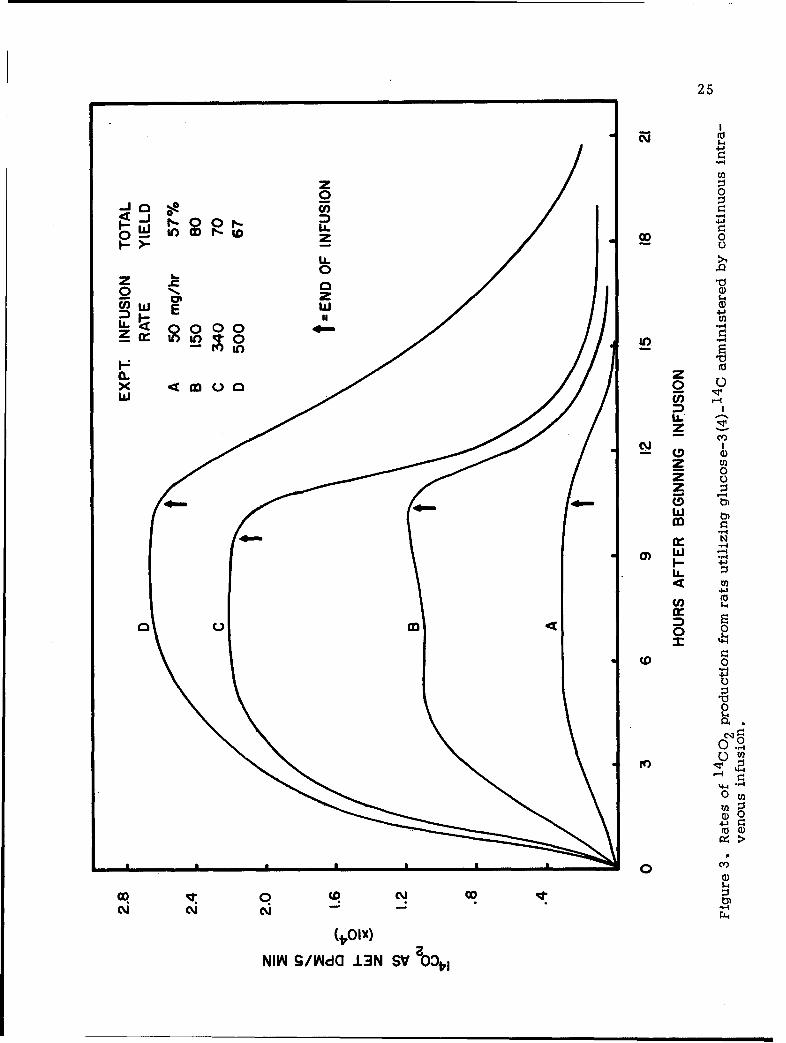
In order to determine the optimal substrate level, a series of
radiorespirometric experiments were carried out using glucose-3(4)- 1 4 C
as the test substrate. Solution of the labeled glucose was infused into
the rat at a rate of 0. 84 ml/hr. The specific rate of infusion with
respect to volume of solution is determined on the basis of physiological
and mechanical considerations. The concentrations of substrate solution
ranged from 6% to 60% w/V. Hence, the rate of infusion with respect
to the amount of glucose administered ranged from 50 mg to 500 mg/hr.
The findings in this series of experiments are given in Figure 3
in which the radioactivities of 14C02 in dpm collected during 5-minute
intervals are plotted against time. In these experiments, glucose
infusion was allowed to continue for a period of 10 hours after which
time measurement of respiratory 140O2 was continued for 5 hours, until
25
z0
ILLU0
00
o. 00
_ z
Cf)
CD a
o..z Md
-4
w Ul4ii
CYCd1..
irom 0
0
C.)
4-40
4J4~
fu
0 cd0
4a)
4,01x)
MI GId 13 -V - -- 4

26
the production of respiratory 1 4 CO2 subsided to an insignificant level.
Data given represents the average value of at least four replica experiments
and deviation among comparable results is found to be no greater than 4%.
The data given in Figure 3 provide one with two types of information:
namely, rate of 14CO2 production expressed as dpm per unit time inter-
val and integrated yields of 14C02 at the end of experiment (5 hours after
the termination of infusion) expressed as percent of radioactivity in the
administered glucose.
It is noted that when the rate of glucose infusion is as low as
50 mg/hr., only 57% of the radioactivity of the glucose is converted to
respiratory C02. Evidently, the relatively small amount of exogenous
labeled glucose infused into the rat is not able to reduce significantly
the supply of endogenous glucose, lipids and other compounds into
the circulatory system. Consequently, a sizable portion of the labeled
glucose was trapped in various endogenous pools by way of exchange
reactions associated with anabolic processes, resulting in a limited
conversion of C-3 and C-4 of glucose to respiratory C02.
On the other hand, when the rate of infusion is 500 mg/hr., one
finds that the rate of 14CO2 production reached a constant level only
in the last two hours of the infusion period. Moreover, even after
termination of glucose infusion at 10 hours, respiratory 14002 was
produced at a significant rate over a period of the next 5 hours. The
cumulative yield of 14C02 at the end of the experiment is found to be

27
67%, only slightly higher than that observed in experiments with infusion
rate of 50 mg/hr. Evidently, with such high rate of substrate adminis-
tration, the rat is not capable of metabolizing promptly the infused glucose
resulting in the channeling of a significant portion of the administered
glucose into depletable anabolic reserves.
Comparison of findings in these experiments lead one to believe
that the optimal substrate level is that while the infusion rate, with
respect to amount of glucose, is kept in the neighborhood of 150 mg/hr.
Thus, one finds that the cumulative yield of 14C02 is highest at this
substrate level, a fact implying that at this substrate level, the ad-
ministered glucose can be promptly routed into catabolic processes
without too much interaction with the endogenous reserve. This
contention is verified by the findings of a series of experiments, using
glucose-3- 1 4 C and glucose-3(4)- 1 4C as substrates, which are designed
to determine the specific activity of blood glucose and extent of in-
corporation of labeled glucose into liver glycogen and lipid fraction.
These data were obtained with samples taken from the rat 6 hours
after the beginning of glucose infusion at which time a metabolic
steady state has been definitely reached in the rat with respect to the
infused glucose (Figure 3).
As shown in Table I, the specific activity of blood glucose is
essentially the same as that of the infused glucose. This fact indicates
that at an infusion rate of 150 mg/hr., and under metabolic steady
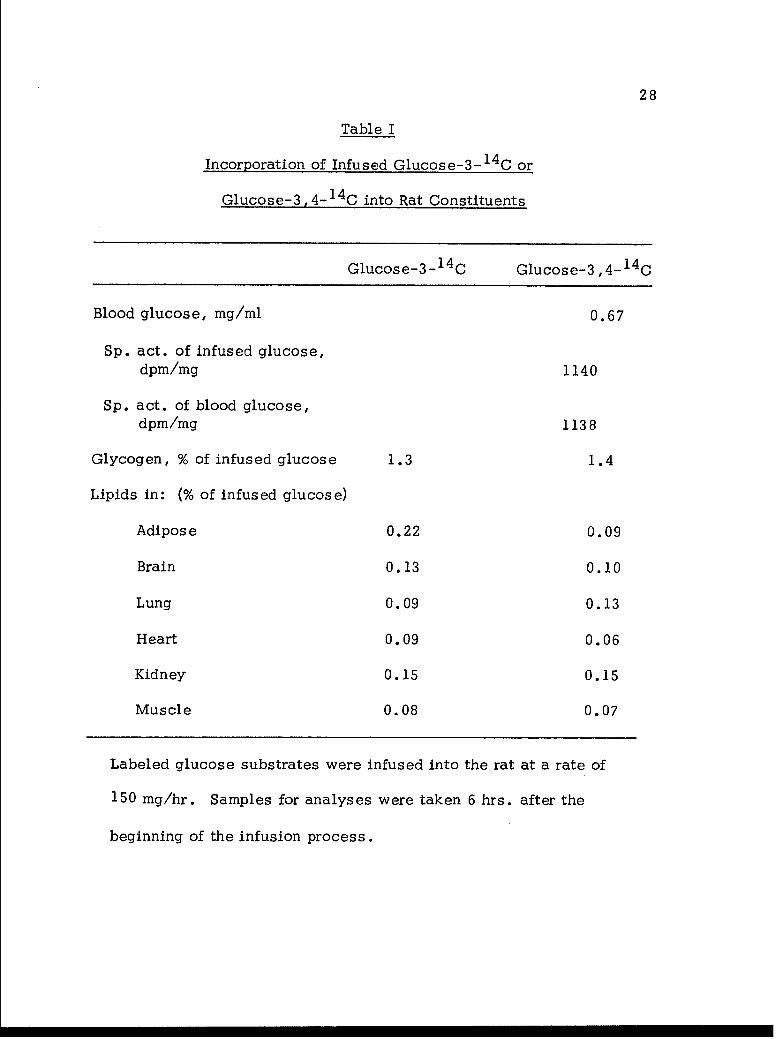
28
Table I
Incorporation of Infused Glucose-3-1 4 C or
Glucose-3,4- 1 4 C into Rat Constituents
Glucose-3- 1 4 C Glucose-3,4- 1 4 C
Blood glucose, mg/ml 0.67
Sp. act. of infused glucose,dpm/mg 1140
Sp. act. of blood glucose,dpm/mg 1138
Glycogen, % of infused glucose 1.3 1.4
Lipids in: (% of infused glucose)
Adipose 0.22 0.09
Brain 0.13 0.10
Lung 0.09 0.13
Heart 0.09 0.06
Kidney 0.15 0.15
Muscle 0.08 0.07
Labeled glucose substrates were infused into the rat at a rate of
150 mg/hr. Samples for analyses were taken 6 hrs. after the
beginning of the infusion process.

29
state conditions, the supply of endogenous glucose into the circulatory
system has been practically shut off. In other words, glucose metabolism
in the rat, under these conditions, involves almost exclusively the
exogenous glucose. Of equal interest is the finding that the amount
of labeled glucose incorporated into liver glycogen is very limited in
extent. This fact reveals that with the rat at post-absorptive state,
little infused glucose is incorporated into anabolic reserves. Similarly,
the incorporation of the labeled carbon atoms and hence the trioses,
derived from infused glucose, into lipid fraction is also found to be
very limited in magnitude. It is of interest to note that the extents of
incorporation of infused glucose to lipid fraction are found to be approxi-
mately the same in either the glucose-3- 14 C or the glucose-3(4)- 1 4 C
experiments. It therefore appears that there exists a rapid equilibration
between glyceraldehyde-3-P and dihydroxyacetone phosphate, derived
from substrate glucose, by the action of triose isomerase.
It should be noted further that when the infusion rate is 150 mg/hr.,
the total administered dose of glucose over a period of 12 hrs. is 1,800
mg, an amount of the same magnitude as the daily food intake of the rat.
At this infusion rate, and assuming that the infused glucose is promptly
metabolized by the rat, the utilization rate of glucose in rats of the
weight range used in the present studies is only slightly less than
that reported by Baker, et al. (ref. 32).

30
A series of radiorespirometric experiments using various specifi-
cally labeled glucose infused into post-absorptive rat at the optimal
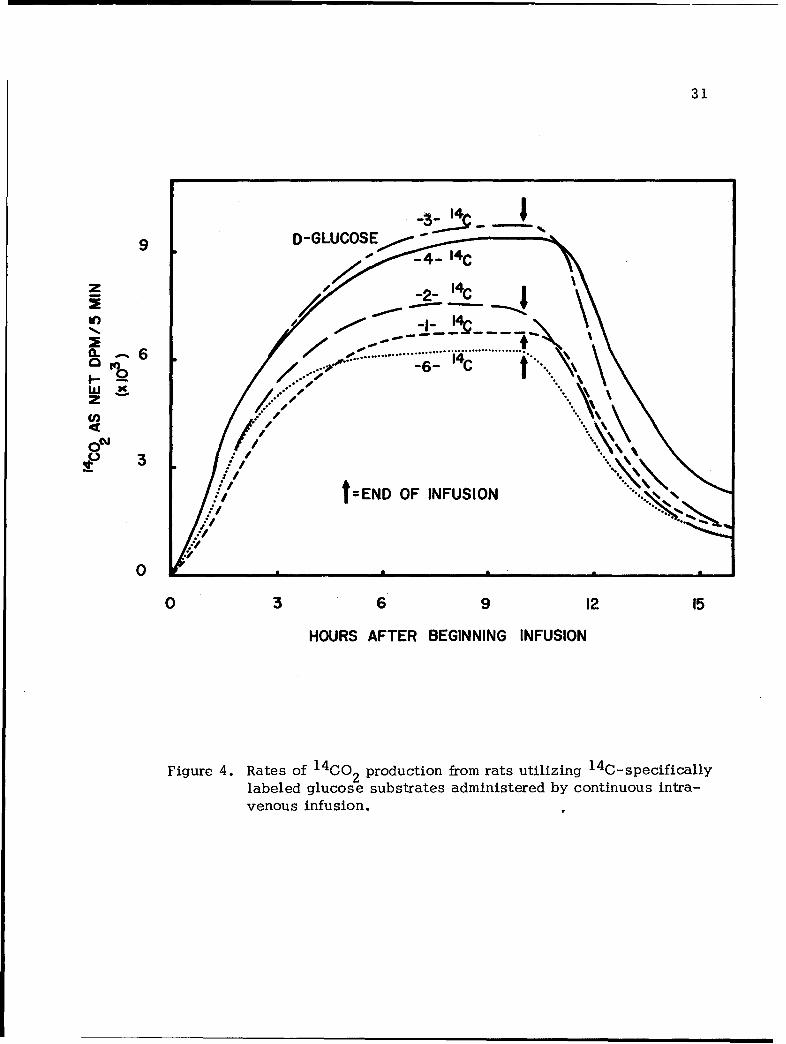
infusion rate were then carried out. The findings are given in Figure 4
in which the rates for the production of respiratory 14C02, expressed in
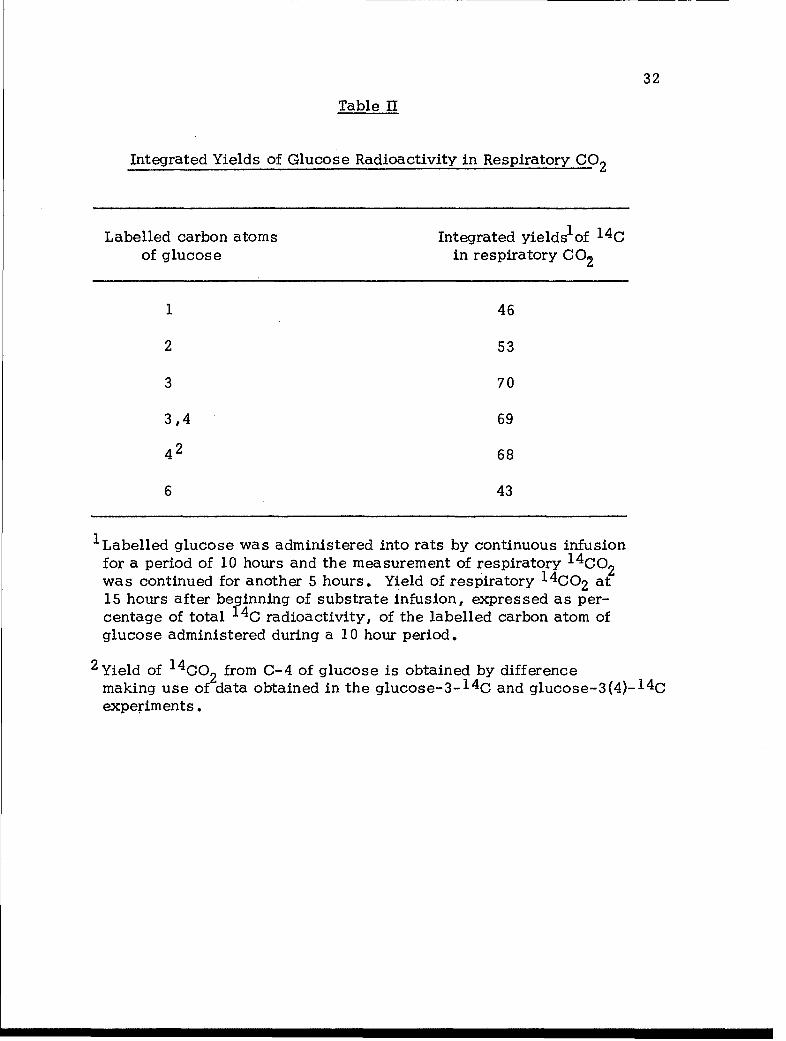
dpm per 5-min. intervals, were plotted against time. Given in Table II
are integrated yields of CO2 from the labeled carbon atoms at the end
of experiments; i.e., 15 hours after the beginning of infusion and 5
hours after the termination of infusion. Data shown represent the
average of at least four replica experiments with deviations in results
among replica experiments being less than 4%.
The radiorespirometric data given in Table II and Figure 3 provide
one with much information on the fate of carbon atoms of glucose in
rat catabolism. As shown in Figure 4, the rates for the conversion
for most of the carbon atoms of glucose to respiratory CO2 followed
an ascending slope during the first few hours of glucose infusion and
reached constant levels until the substrate infusion was terminated,
except in the case of C-4 of glucose, a mild ascending slope was
observed throughout the first 10 hours. It is difficult to attach any
significance to the latter observation, particularly in view of the fact
that data for C-4 of glucose was obtained by difference making use
of data obtained in glucose-3(4)- 1 4 C and glucose-3- 14 C experiments.
It is noted that upon termination of substrate infusion, rates for the
conversion of carbon atoms to respiratory C02 declined sharply and
31
9 D-GLUCOSE ~--4- 14C
Z14
V .,
0 -. 6 e ......................a -6-
(0
6N3
=:END OF INFUSIONZ
0
0 3 6 9 12 15
HOURS AFTER BEGINNING INFUSION
Figure 4. Rates of 1 4 CO 2 production from rats utilizing 1 4 C-specificallylabeled glucose substrates administered by continuous intra-venous infusion.
32
Table II
Integrated Yields of Glucose Radioactivity in Respiratory C02
Labelled carbon atoms Integrated yieldslof 14C
of glucose in respiratory CO.
1 46
2 53
3 70
3,4 69
42 68
6 43
iLabelled glucose was administered into rats by continuous infusionfor a period of 10 hours and the measurement of respiratory 14CO 2was continued for another 5 hours. Yield of respiratory 14C 02 at15 hours after beginning of substrate infusion, expressed as per-centage of total 14C radioactivity, of the labelled carbon atom ofglucose administered during a 10 hour period.
2 Yield of 14CO 2 from C-4 of glucose is obtained by differencemaking use of data obtained in the glucose-3-14C and glucose- 3 (4)- 14C
experiments.
33
reached insignificant levels 5 hours after substrate infusion. This fact
implied that a fraction of infused glucose may have been incorporated
into endogenous reserve and hence was not catabolized immediately.
Several conclusions, qualitative in nature, with regard to glucose
pathways in rats can be drawn from an analysis of the data given in
Figure 4 and Table II. The fact that 0-3 or C-4 of glucose was con-
verted to respiratory C02 at a higher rate and to a larger extent than
any other carbon atoms of glucose points to the predominant role played
by the EMP-pyruvate decarboxylation pathway in rats (ref. 12)(Figure 1).
The fact that rates of C02 production are approximately the same with
these two carbon atoms indicates that: (1) two trioses derived from
glucose via the EMP pathway are in rapid equilibrium with each other
and hence they display practically identical catabolic behaviors, and
(2) C-3 and 0-4 of glucose were converted to respiratory CO 2 primarily
via the EMP-pyruvate decarboxylation pathway since the fates of these
two carbon atoms via other pathways such as the PP pathway and the
GA pathway are quite different from each other and would show up as
significant differences in rates and extent of conversion to respiratory
CO2'
The rate for the conversion of C-2 of glucose to C02 is found
to be only slightly greater than that of either C-1 or C-6. If glucose
is catabolized exclusively via the EMP-TCA pathway (Figure 1), acetyl
CoA derived from glucose is likely to interact with endogenous compounds
34
such as fatty acids, amino acids, etc. prior to its oxidation to C02 .
Such a situation will result in a preferential conversion of the carboxyl
carbon atoms (equivalent to C-I and C-6 of glucose) to respiratory CO2,
by a substantial factor, over that of the methyl carbon atoms (equivalent
to C-2 and C-5 of glucose)(ref. 31). Consequently, the findings that
the rates for C-I and C-6 of glucose to CO2 are only slightly lower
than that of C-2 in magnitudes provide one with indications that path-
ways other than the EMP routes occur in rats. Previously, it has been
reported by many workers (ref. 10, 1I, 12,13,14,15) that the PP pathway
and the GA pathway are operative in rats.
Use can also be made of the data on rates of 14C02 production
given in Figure 2 to devise a method for pathway estimation on the
basis of catabolic rates of individual pathways. Such a method can be
developed since the observed rates of 14CO2 production from certain
carbon atoms of glucose are closely related to the rates of individual
glucose pathways. In devising a method to estimate the rate of
individual catabolic pathways of glucose, several basic assumptions
are required. These assumptions are:
(1) There are three concurrent pathways for glucose catabolism
in intact rats. These pathways are the EMP-TCA pathway,
the PP pathway and the GA pathway (Figure 1).
(2) There is no significant drainage of intermediates associated
with the GA pathway, particularly the glucuronides, ascorbic
35
acid, and other intact 6-carbon intermediates.
(3) The trioses derived from glucose via the EMP pathway are
in rapid equilibrium with each other and hence they have
identical catabolic behaviors.
(4) There is no significant drainage of pyruvate, derived from
glucose, in the biosynthetic pathways. In other words
pyruvate, once formed, is promptly decarboxylated oxi-
datively to yield CO 2 and acetyl CoA.
(5) C02 fixation of the C3 + C1 type is not an important process
in the over-all rat metabolism.
Verification of each of the foregoing given assumptions has been
provided either in the present work or from findings in other laboratories.
Let,
Gcat = rate of glucose catabolism.
R3 (or R4 ) = rate of 14CO2 production in dpm/min. with
rats utilizing infused glucose-3- 1 4 C (or
glucose-4- 1 4C) at the metabolic steady state.
It is recognized that R3 (or R4 ) is made up of
three components; namely, R3e (or R4e) =
rate of 14CO2 production from infused glucose-
3-140 (or glucose-4- 1 40) at the metabolic
steady state via the EMP-TCA pathway

36
(equivalent to the EMP-pyruvate decarboxylation
pathway); R3p (or R4 p) = rate of 14CO2 production
from infused glucose-3- 1 4 C (or glucose-4- 1 4 C) at
the metabolic steady state via the PP pathway; and
R3 n (or R4n) = rate of 14C02 production ,from in-
fused glucose-3-1 4 C (or glucose-4- 1 4 C) at the
metabolic steady state via the GA pathway. Hence,
R3 = R3e + R3p + R3n and R4 = R4e + R4p + R4n.
R1 rate of 14CO2 production in dpm/min. with rats
utilizing infused glucose-l- 14C at the metabolic
steady state. It is recognized that R1 is made
up of three components; namely, Rle = rate of
1402 production from infused glucose-1- 1 4 C
at the metabolic steady state via the EMP-TCA
pathway; Rlp = rate of 14CO2 production from
infused glucose-1- 1 4 C at the metabolic steady
state via the PP pathway; and Rln = rate of 140O2
production from infused glucose-1- 1 4 C at the
metabolic steady state via the GA pathway.
Hence, R1 = Rie + Rlp + Rln.
R2 rate of 14CO2 production in dpm/min. with rats
utilizing infused glucose-2- 14 C at the metabolic
steady state. It is recognized that R2 is made
37
up of three components; namely, R2e = rate of
14CO2 production from infused glucose-2- 1 4 C
at the metabolic steady state via the EMP-TCA
pathway; R2p = rate of 14CO2 production from
infused glucose-2- 14 C at the metabolic steady
state via the PP pathway; and R2n = rate of
14002 production from infused glucose-2-1 4 C
at the metabolic steady state via the GA pathway.
Hence, R2 = R2e + R2p + R2n.
R6 rate of 14CO 2 production in dpm/min. with rats
utilizing infused glucose-6i 140 at the metabolic
steady state. It is recognized that R6 is made
up of three components; namely, R6 e = rate of
14CO2 production from infused glucose-6- 1 4C
at the metabolic steady state via the EMP-TCA
pathway; R6p = rate of 140o2 production from
infused glucose-6-14C at the metabolic steady
state via the PP pathway; and R6n = rate of
14C 02 production from infused glucose-6- 1 4 C
at the metabolic steady state via the GA pathway.
Hence, R6 = R6e + R6p + R6n.
S specific activity of the infused glucose specifically
labeled at a given carbon atom at the metabolic

38
steady state, expressed in dpm/mg.
Ger = catabolic rate of the infused glucose via the
EMP-TCA pathway at the metabolic steady
state, expressed in mg/min.
Gpr = catabolic rate of the infused glucose via the
PP pathway at the metabolic steady state,
expressed in mg/min.
Gnr = catabolic rate of the infused glucose via the
GA pathway at the metabolic steady state,
expressed in mg/min.
Ge = fraction of the catabolized glucose, at the
metabolic steady state, via the EMP-TCA path-
way, expressed as percentage of catabolized
glucose.
Gp = fraction of the catabolized glucose, at the
metabolic steady state, via the PP pathway,
expressed as percentage of catabolized glucose.
Gn = fraction of the catabolized glucose, at the
metabolic steady state, via the GA pathway,
expressed as percentage of catabolized glucose.
On the basis of the understanding that for each mole of glucose
catabolized via the EMP-TCA pathway, the PP pathway or the GA pathway,
one mole of C02 will be produced from C-3 (or C-4), 0-I and 0-6 of
39
glucose, respectively. The catabolic rate of the individual glucose
pathways can be calculated making use of the specific activity of the
infused glucose expressed as dpm/mg as shown in Table I. It is under-
stood that the specific activity of blood glucose at the metabolic steady
state is found to be the same as that of the infused glucose.
Thus, the catabolic rate of the EMP-TCA pathway can be expressed
as:
Ger - R3e - R4e (1)S S
The catabolic rate of the PP pathway can be expressed as:
GprRlp (2)
S
The catabolic rate of the GA pathway can be expressed as:
G R6n (3)Gnr = S
and the over-all rate of glucose catabolism is,
Gcat = Ger + Gpr + Gnr (4)
Since it has been assumed that there are only three concurrent
catabolic pathways operating in rats, it follows that relative participation
or contribution of individual catabolism pathways in over-all glucose
catabolism can be expressed as:
Ger x 100Ge = G(5)

40
Gpr X )00Gcat
G Gnr x 100Gcat
The exact values for the terms R3e, Rlp and R6 n needed for
accurate pathway estimation cannot be readily ascertained from the
observed data on R3 , R1 and R6 since the latter terms are each made up
of three components and some of the components cannot be directly
measured. However, the magnitudes of the terms R3e, Rlp and R6n
can be crudely estimated thereby making it possible to make a crude
estimation of pathway participations. Thus, the conversion of C-3
of glucose to respiratory CO2 via either the PC pathway or the GA
pathway involved various steps and intermediates via long catabolic
sequences (Figure 1). Participation of these intermediates in biosyn-
thetic and exchange reactions will reduce much the opportunity for C-3
of glucose to be converted to respiratory C02 . Consequently, unless
there are other evidences indicating that the PC and the GA are pre-
dominant pathways in glucose catabolism, one can consider as a close
approximation that R3 = R3e.
In order to estimate the approximate values of Rlp and R6n, one
needs to first examine the makeup of the terms R1 and R6 . In the case
of RI, of the three component terms; viz. Rle, Rlp and Rln, Rln is
, , , , ' i i i i

41
likely to be relatively small in magnitude since the conversion of C-1
of glucose via the GA pathway also involves a long catabolic sequence
subject to dilution of various endogenous intermediates. In contrast,
conversion of C-1 of glucose via the PP pathway is direct and hence
Rlp is a major component of R1 even when the participation of the PP
pathway is limited in extent. As an approximation one can therefore
consider that R1 = Rle + Rlp. Similarly, in the case of R6 , of the three
component terms; viz. R6e, R6 p and R6n, R6p is likely to be relatively
small in magnitude since the conversion of 0-6 of glucose via the PP
pathway involves a long catabolic sequence subject to dilution of various
endogenous intermediates, while conversion of C-6 to C02 via the GA
pathway is a more direct process. It follows that as an approximation
R6 = R6e + R6 n* With the foregoing considerations in mind, if one can
devise a means to estimate the values of Rle and R6e, one should be
able to have a crude estimation of the values of Rlp and R6n, needed
in calculating the rates of the PP and the GA pathways.
Information on the net rate for the conversion of either C-1 (Rle)
or C-6 (R6e) of glucose to C02 via exclusively the EMP-TCA pathway,
cannot be directly obtained from the radiorespirometric data collected
in the glucose experiments. However, such information can be acquired
in experiments using reference compounds simulating a key catabolic
intermediate of glucose in the EMP pathway (ref. 33,34). Examination of
possible compounds that can be used as a reference compound revealed

42
that glutamic acid is the best choice.
The use of glutamate as a reference compound is derived from the
considerations that glutamate is known to be present in small amounts
in the circulatory system of rats and the chemical nature of glutamate
is such that continuous infusion of a trace amount into the circulatory
system would not incur any detrimental effect. The biogenic relationship
between the carbon skeleton of glutamate and glucose is well established
as illustrated in the following:
1 C 2,5 COOH 2,5 COOH 2,5 C0 2
2C 2,5 CHNH 2 2,5 C0 2,5 C02SI , TCA
4 1,6 CH2 1,6 GH2 1,6 CO2
I2 25U 2,5 COOH 2,5 dOOH 2,5 C02
6C3
D-glucose L-glutamate
Numerals designate positions of carbon atoms in glucose.
It is visualized that the conversion of C-2 of glucose to respiratory
C02 is primarily by way of the EMP-TCA sequence. Hence one can con-
sider that R2 = R2eand use can be made of the observed values of R2 as a
reference value to calculate the values of Rle and R6e*
In order to obtain information on the relative rates for the conversion
of various carbon atoms of glutamic acid, a series of radiorespirometric
experiments were carried out using DL-glutamic acid-i ,-2, and -3(4)-14C
43
as individual substrates. The conditions used for the glutamate experi-
ments are the same as that for the glucose experiments. Unlabeled
glucose was infused into the rat at a rate of 150 mg/hr., along with trace
amount of 14C-specifically labeled glutamate. DL-glutamic acid was
used instead of L-glutamic acid, since all the 1 4 C-labeled glutamic acids
were synthesized chemically and hence they are racemic mixtures. The
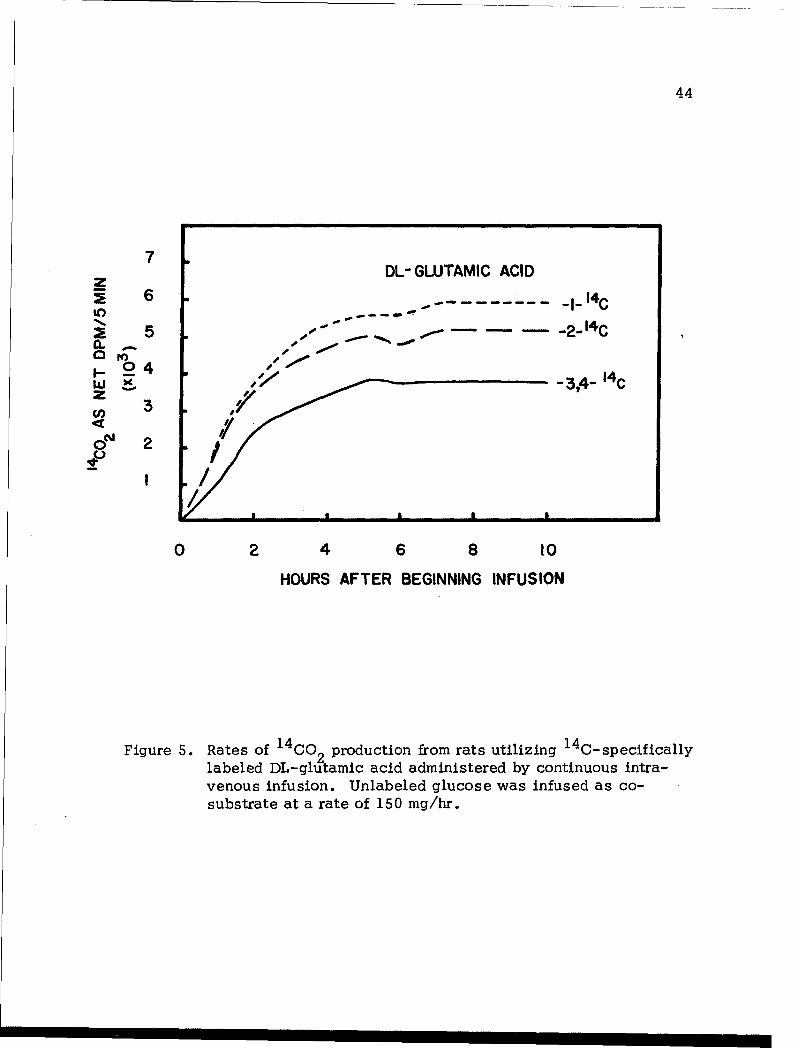
findings in this series of experiments are given in Figure 5.
It is noted that the rate for the conversion of labeled carbon atoms
of DL-glutamate to respiratory CO 2 reached a constant level a few hours
after the beginning of the substrate infusion. It is therefore reasonable
to believe that a metabolic steady state in rats can be realized with
respect to the infused glutamate. It is further noted that C-2 of glutamate
was converted to respiratory CO2 at a rate considerably greater than that
of C-3 (4). Using the rate data collected at 8 hours after the beginning
of infusion, the ratio:
rate of CO 2 from C-2 of glutamate s5.5 x 103 dpm/5 min.
rate of CO 2 from C-3(4) of glutamate 3.8 x 10 dpm/5 min. 1.37
Taken into consideration the biogenic relationships between glutamate and
glucose; i.e., rate of CO2 from C-2 of glutamaterate of CO2 from C-3(4) of glutamate
rate of CO 2 from C-2 of glucose via EMP-TCA cycle pathway
rate of G2 from C-i or C-6 of glucose via EMP-TCA cycle pathway
if the infused glucose were catabolized exclusively via the EMP-TCA
44
7Z 7DL-GLUTAMIC ACID--E 6" -1"4C
w I-
0 2Co
0 2 4 6 8 I0
HOURS AFTER BEGINNING INFUSION
Figure 5. Rates of 14O prdcinfo asuiiig 1 4 C-specifically
labeled DL-glutamic acid administered by continuous intra-venous infusion. Unlabeled glucose was infused as co-substrate at a rate of 150 mg/hr.
0 4 i j j j j j j
45
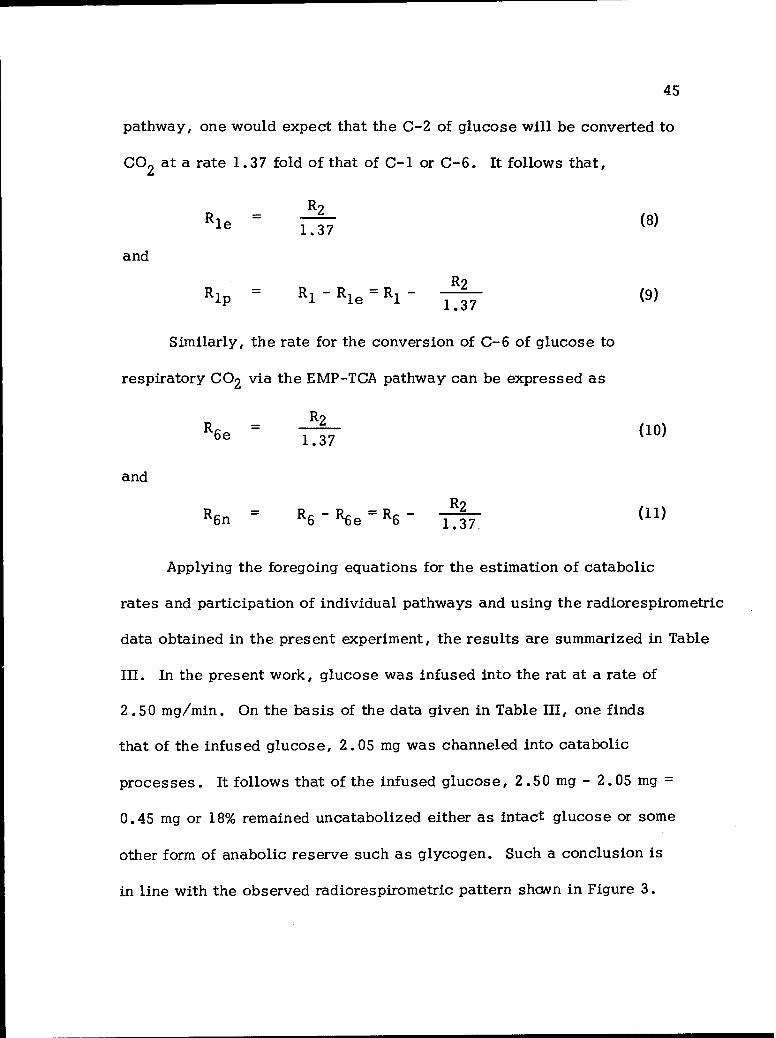
pathway, one would expect that the C-2 of glucose will be converted to
CO 2 at a rate 1.37 fold of that of C-1 or C-6. It follows that,
Rle = R2 (8)1.37
and=R2 9
Rlp = R1 - Rle = R1 R2 1.37
Rl~Ri=Ri~ 1.37
Similarly, the rate for the conversion of C-6 of glucose to
respiratory CO2 via the EMP-TCA pathway can be expressed as
R6e R2 (10)
1.37
and
R6n R6 - R6 e=R 1.37 (11)
Applying the foregoing equations for the estimation of catabolic
rates and participation of individual pathways and using the radiorespirometric
data obtained in the present experiment, the results are summarized in Table
III. In the present work, glucose was infused into the rat at a rate of
2.50 mg/min. On the basis of the data given in Table III, one finds
that of the infused glucose, 2.05 mg was channeled into catabolic
processes. It follows that of the infused glucose, 2.50 mg - 2.05 mg =
0.45 mg or 18% remained uncatabolized either as intact glucose or some
other form of anabolic reserve such as glycogen. Such a conclusion is
in line with the observed radiorespirometric pattern shcwn in Figure 3.
46
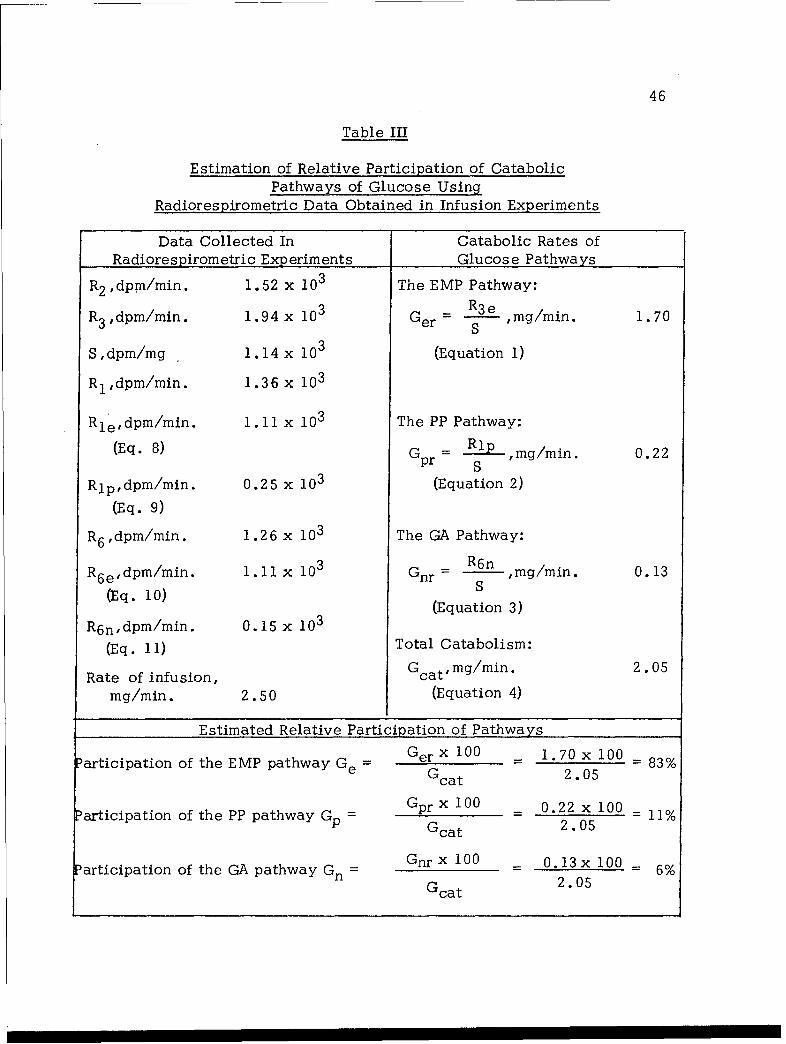
Table III
Estimation of Relative Participation of CatabolicPathways of Glucose Using
Radiorespirometric Data Obtained in Infusion Experiments
Data Collected In Catabolic Rates of
Radiorespirometric Experiments Glucose Pathways
R2 ,dpm/min. 1.52 x 10³ The EMP Pathway:
R3 ,dpm/min. 1.94 x 10 Ger SR3e , mg/min. 1.70
S,dpm/mg 1.14 x 10³ (Equation 1)R1,dpm/min. 1.36 x 10³
Rledpm/min. 1.11 x 10³ The PP Pathway:
(Eq. 8) Gpr S Rp, ,mg/min. 0.22
Rlp,dpm/min. 0.25 x 10 3 (Equation 2)
(Eq. 9)
R6 ,dpm/min. 1.26 x l03 The GA Pathway:
R6 edpm/min. 1.11 x 10 Gnr- R6n ,rmg/min. 0.13
(Eq. 10) (Equation 3)
R6 n,dpm/min. 0.15 x 10³
(Eq. 11) Total Catabolism:
Rate of infusion, Gcat' mg/min. 2.05
mg/min. 2.50 (Equation 4)
Estimated Relative Participation of Pathways
Participation of the EMP pathway G= Ger x 100 = 1.70 x 100 - 83%e Gcat 2 .05
articipation of the PP pathway Gp = 0.22x100 - 11%Gcat 2.05
Participation of the GA pathway Gn = Gnrx 100 0.13x 100 - 6%Gcat 2.05

47
Thus, upon termination of substrate administration at 10 hours after the
beginning of infusion, a considerable amount of substrate radioactivity
appeared in the respiratory C02 at declining rate for a period of 5 hours.
The integrated yields of respiratory 14CO2 from labeled glucose during
the depletion phase (from termination of infusion to the end of the
experiment) can be crudely estimat ed by a visual inspection of the
rate data given in Figure 3. Thus, the area under the rate curve ob-
tained in the glucose-3-14C experiment during the period from 10
hours to 15 hours is approximately one-fifth (or 20%) of the area under
the entire curve which is of the same magnitude as the calculated value;
i.e., 18% for anabolized glucose. This fact renders support to the
validity of several assumptions made in the analysis of the present
radiorespirometric data.
As indicated by the results given in Table III, the EMP pathway
is by far the predominant route for glucose catabolism in intact rats.
The estimated contribution of the PP pathway amounting to 11% of
catabolized glucose is equivalent to 4% expressed in terms of contribution
of the pentose cycle pathway (ref. 21,22). Previously, Landau and Katz
(ref. 10) in studies with adipose tissue, have reported that the contri-
bution of the pentose cycle pathway to glucose catabolism is 10 to 15%.
It is possible that the pentose cycle is playing a more important role
in adipose tissue inasmuch as the major byproduct of the pentose cycle
pathway; i.e., NADPH, is needed for the synthesis of fatty acids,

48
a major function of the adipose tissue. The GA pathway is estimated to
play a very minor role (approximately 6%) in glucose catabolism. Earlier,
Landau et al. (ref. 14) reported that with rat epididymal tissue, the GA
pathway contributes at most 10% in over-all glucose catabolism.
It is also of interest to analyze the information on relative
participation of various glucose pathways taking into consideration
both the catabolic and anabolic routes. When the pathway data are
expressed on the basis of total administered glucose and considering
that the portion of glucose which was not engaged immediately in
catabolic processes, was engaged in anabolic functions, one can
express the pathway information obtained in the present work as follows:
Total amount of glucose administered to the rat per minute
= 2.50 mg or 100%
Amount of glucose engaged in anabolic processes per minute
= 0.45 mg or 18%
Amount of glucose engaged in catabolic processes per minute
= 2.05 mg or 82%
Amount of glucose routed into the EMP pathway per minute
= 1.70mg or 68%
Amount of glucose routed into the PP pathway per minute
= .22 mg or 9%
Amount of glucose routed into the GA pathway per minute
= .13 mg or 5%

49
Estimated relative participation of individual catabolic pathways
in over-all glucose catabolism (Table III) represents upper limits of
contribution of each catabolic route. This is true since in calculating
the values of R3e, Rlp and R6 n, the contributions of indirect routes for
the conversion of some glucose carbon atoms to respiratory CO 2 were
ignored. However, it is noted that the estimated total amount of
glucose engaged in prompt catabolism is 18% of the infused glucose,
a value of the same magnitudes as that concluded from the observed
radiorespirometric pattern (Figures 2 and 3). In the latter regard,
approximately 20% of the infused glucose was found to be converted
to respiratory CO 2 during the depletion phase. One is therefore inclined
to believe that the pathway information obtained in the present work is
not too far from the true catabolic behavior of the rat.
It can therefore be concluded that when glucose is infused into
rats at post-absorptive state, a major fraction is routed into catabolic
functions with the EMP-TCA being the most important catabolic pathway.
The PP pathway and the GA pathway occur in intact rats but are not
important catabolic mechanisms. It should be noted that in the present
work, the contribution of the EMP pathway in glucose catabolism is
estimated by direct means. This is in contrast to previously reported
methods in which only the contribution of the PP pathway is measured
directly and the EMP pathway is estimated as the difference between
total glucose utilized and the fraction of glucose routed into the PP

50
pathway. These earlier approaches assumed that the administered
glucose is engaged completely in catabolic functions.
The present work provides one with information on the rate of
catabolism via a given pathway at metabolic steady state. In fact,
the use of infusion techniques and associated methodology described
herein demonstrated that rate of a catabolic event in mammals can
be directly measured. The availability of rate information is believed
of great importance in studying the effect of internal or external factors
upon carbohydrate metabolism in mammals.
51
REFERENCES
1. Axelrod, B., "Glycolysis," a chapter in "Metabolic Pathways,"3rd Edition, edited by David Greenberg, Academic Press, New York,112-140, 1967.
2. Entner, N. and M. Douordoff, "Glucose and Gluconic Acid Oxidationof Pseudomonas saccharophila," I. Biol. Chem. 196, 853-862, 1952.
3. MacGee, J. and M. Douordoff, "A New Phosphorylated Intermediatein Glucose Oxidation," I. Biol. Chem. 210, 617-626, 1954.
4. Warburg, 0. and W. Christian, "Aktivierung von Kohlehydrat inRotenBlutzellen," Biochem. Z. 238, 131-134, 1931.
5. Warburg, 0., W. Christian and A. Griese, "Wasserstofftbortragendes Co-Ferment, -seine Zusammensetzung und Wirkungsweise,"Biochem. Z. 282, 157-205, 1935.
6. Lipmann, F., "Fermentation of Phosphogluconic Acid," Nature 138,588-589, 1936.
7. Horecker, B. L., "A New Pathway for the Oxidation of Carbohydrate,"Brewer's Digest 28, 214-219, 1953.
8. Racker, E., "Alternate Pathways of Glucose and Fructose Metabolism,"Advances inEnzymolo' 15, 141-182, 1954.
9. Kitos, P. A., C. H. Wang, B. A. Mohler, T. E. King and V. H.Cheldelin, "Glucose and Gluconate Dissimilation in Acetobactersuboxydans," J. Biol. Chem. 233, 1295-1298, 1958.
10. Katz, J., B. R. Landau and G. E. Bartsch, "The Pentose Cycle,Triose Phosphate Isomerization and Lipogenesis in Rat AdiposeTissue," J. Biol. Chem. 241, 727-740, 1966.
11. Eisenberg, F., Jr., P. G. Dayton and I. J. Burns, "Studies on theGlucuronic Acid Pathway of Glucose Metabolism," J. Biol. Chem.234, 250-253, 1959.
12. Wang, C. H., L. P. Snipper, 0. Bilen and B. Hawthorne, "Catabolismof Glucose and Gluconate in Intact Rats," Proc. Soc. Exptl. Biol. andMed.411, 93-97, 1962.

52
13. Winegrad, A. I., W. N. Shaw, F. D. W. Lukens, W. C. Stadie andA. E. Renold, "Effects of Growth Hormone in Vitro on the Metabolismof Glucose in Rat Adipose Tissue," J. Biol. Chem. 234, 1922-1928,1959.
14. Landau, P. R., G. E. Bartsch and H. R. Williams, "Estimation ofGlucuronic Acid Pathway Contribution to Glucose Metabolism inAdipose Tissue and the Effect of Growth Hormone," J. Biol. Chem.241, 750-760, 1966.
15. Landau, B. R. and J. Katz, "Pathways of Glucose Metabolism," achapter in "Handbook of Physiology - Adipose Tissue," Section V,American Physiological oc., Washington, D. C., edited by Landau,Katz, Reynold and Cahill, 235, 1965.
16. Katz, J., "The Use of Glucose- 1 4 C inthe Study of the Pathways ofGlucose Metabolism in Mammalian Tissues," in "Radioactive Isotopesin Physiology, Diagnostics and Therapy," Vol. 1, Springer-Verlag,Berlin-Heidelberg, 707-751, 1961.
17. Segal, S., M. Berman and A. Blair, "The Metabolism of Various C 1 4 -Labeled Glucose in Man and An Estimation of the Extent of GlucoseMetabolism by the Hexose Monophosphate Pathway," J. ClinicalInvestigation 40, 1263, 1961.
18. Wenner, C. E. and S. Weinhouse, "Metabolism of Neoplastic TissueIX, An Isotope Tracer Study of Glucose Catabolism Pathways in Normaland Neoplastic Tissues," J. Biol. Chem. 222, 399-414, 1956.
19. Wood, H. G., and J. Katz, "The Distribution of C14 in the HexosePhosphates and the Effect of Recycling in the Pentose Cycle," J.Biol. Chem. 233, 1279-1283, 1958.
20. Katz, J. and H. G. Wood, "The Use of Glucose C14 for the Evaluationof the Pathways of Glucose Metabolism," J. Biol. Chem. 235, 2165-2177, 1960.
21. Wang, C. H. and J. Krackov, "The Catabolic Fate of Glucose inBacillus subtilis," J. Biol. Chem. 237, 3614-3622, 1962.
22. Katz, J. and H. Wood, "The Use of C 14 0 2 Yields from Glucose-l-and -6-C 1 4 for the Evaluation of the Pathways of Glucose Metabolism,"J. Biol. Chem. 238, 517-523, 1963.
53
23. Wang, C. H., "Metabolism Studies by Radiorespirometry," In"Advances in Tracer Methodology," Vol. I. (Seymour Rothchild,Ed.), Plenum Press, New York, 1962.
24. Landau, B. R. and G. E. Bartsch, "Estimations of Pathway Contri-butions to Glucose Metabolism and the Transaldolase Reactions,"J. Biol. Chem. 241, 741-749, 1966.
25. Heatley, N. G. and J. R. Weeks, "Fashioning Polyethylene Tubingfor Use in Physiological Experiments," J. Appl. Physiol. 19, 542-545, 1964.
26. Weeks, J. R. and J. D. Davis, "Chronic Intravenous Cannulas forRats," J. Appl. Physiol. 19, 540, 1964.
27. Wang, C. H., "Radiorespirometry," In "Methods of BiochemicalAnalysis," Vol. XV (David Glick, ed.), John Wiley & Sons, NewYork, 1967.
28. Dost, F. N., D. J. Reed and C. H. Wang, "Fate of UDMH andMMH in Rats, AMRL-TR-64-111 (AD 610 569), Aerospace MedicalResearch Laboratory, Wright-Patterson Air Force Base, Ohio.
29. Bray, G. A., "A Simple Efficient Liquid Scintillator for CountingAqueous Solutions in a Liquid Scintillation Counter," Anal. Biochem.1, 279, 1960.
30. Morris, B. and M. W. Simpson-Morgan, "Effects of Glucose on theMetabolism of Infused Chylomicron Fatty Acis in UnanaesthetizedRats," J. Physiol. 177, 74, 1965.
31. Strisower, E. H., G. D. Kohler and I. L. Chaikoff, "Incorporation ofAcetate Carbon into Glucose by Liver Slices from Normal and Alloxan-diabetic Rats," J. Biol. Chem. 198, 115, 1952.
32. Baker, N., R. A. Shipley, R. E. Clark and G. E. Incefy, "C 1 4 Studiesin Carbohydrate Metabolism: Glucose Pool Size and Rate of Turnoverin the Normal Rat," Am. J. Physiol. 196, 245, 1959.
33. Bloom, B. and D. Stetten, Jr., "The Fraction of Glucose Catabolizedvia the Glycolytic Pathway," J. Biol. Chem. 212, 555, 1955.
34. Katz, J., S. Abraham, R. Hill and I. L. Chaikoff, "Importance ofGlycolytic and Oxidative Pathways in Glucose Utilization by Liver,"J. Am. Chem. Soc. 76, 2277, 1954.