Embed Size (px)
Citation preview
ORIGINAL RESEARCHpublished: 20 April 2018
doi: 10.3389/fmars.2018.00130
Frontiers in Marine Science | www.frontiersin.org 1 April 2018 | Volume 5 | Article 130
Edited by:
Alison Buchan,
University of Tennessee, Knoxville,
United States
Reviewed by:
Jeffrey Polovina,
National Oceanic and Atmospheric
Administration (NOAA), United States
Andrew Irwin,
Mount Allison University, Canada
*Correspondence:
Maria T. Kavanaugh
Specialty section:
This article was submitted to
Aquatic Microbiology,
a section of the journal
Frontiers in Marine Science
Received: 06 December 2017
Accepted: 28 March 2018
Published: 20 April 2018
Citation:
Kavanaugh MT, Church MJ,
Davis CO, Karl DM, Letelier RM and
Doney SC (2018) ALOHA From the
Edge: Reconciling Three Decades of
in Situ Eulerian Observations and
Geographic Variability in the North
Pacific Subtropical Gyre.
Front. Mar. Sci. 5:130.
doi: 10.3389/fmars.2018.00130
ALOHA From the Edge: ReconcilingThree Decades of in Situ EulerianObservations and GeographicVariability in the North PacificSubtropical GyreMaria T. Kavanaugh 1*, Matthew J. Church 2, Curtiss O. Davis 1, David M. Karl 3,
Ricardo M. Letelier 1 and Scott C. Doney 4
1College of Earth, Ocean and Atmospheric Sciences, Oregon State University, Corvallis, OR, United States, 2 Flathead Lake
Biological Station, University of Montana, Polson, MT, United States, 3Daniel K. Inouye Center for Microbial Oceanography:
Research and Education (C-MORE), University of Hawaii at Manoa, Honolulu, HI, United States, 4Department of
Environmental Sciences, University of Virginia, Charlottesville, VA, United States
Global analyses of satellite and modeled data suggest decreased phytoplankton
abundance and primary productivity in oligotrophic gyres as they expand in response
to increased surface temperatures, shoaling of surface mixed layers, and decreased
supply of subsurface macronutrients. However, analogous changes in the phytoplankton
have not been evident in situ at Hawaii Ocean Time-series (HOT) Station ALOHA
(22◦45′N, 158◦00′W), suggesting that physiological or structural reorganization not
observed from space, uncorrected sensor drift, or uncharacterized geographic variability
may be responsible for the apparent discrepancy. To address the latter, we compared
interannual patterns of in situ phytoplankton dynamics and mixed layer properties to
gyre extent and boundary location based on multiple definitions including dynamic
topography, a threshold of satellite surface chlorophyll (chl a) ≤0.07mg m−3, and
multivariate biophysical seascapes using modeled or satellite data. Secular increases
in gyre extent were apparent, although the rate of expansion was much slower than
previously reported, whereas strong interannual oscillations were evident for all definitions
of the gyre. Modeled and satellite-based multivariate seascapes agreed well in terms
of expansion (surface area of seascapes) and isolation of Station ALOHA (distance
to seascape boundary) resulting in a combined data record of nearly three decades.
Isolation was associated positively with the North Pacific Gyre Oscillation (NPGO), and
negatively with Multivariate ENSO Index (MEI), and Pacific Decadal Oscillation (PDO). The
converse was true for the gyre’s expansion. Expansion followed a shoaling and freshening
of the surface mixed layer and declines of in situ net primary production (PP) suggesting
that Station ALOHA may serve as an early indicator of gyre biogeographic patterns.
Lags between geographic indicators and in situ conditions appear to partially explain
past observed discrepancies between patterns from satellite remote sensing and those
from in situ conditions at Station ALOHA.
Keywords: climate oscillations, North Pacific Subtropical Gyre, dynamic geography, seascape ecology, Station
ALOHA
Kavanaugh et al. Aloha From the Edge
INTRODUCTION
Covering over 20 million square kilometers, the North PacificSubtropical Gyre (NPSG) is the largest ecosystem on the planetsurface (Sverdrup et al., 1942; Karl, 2010). The permanentlystratified surface layer in this system restricts the vertical fluxesof inorganic nutrients into the well-lit surface region, resultingin low primary production (PP) and export of carbon to the deepocean. However, because of their size, open ocean regions like theNPSG are responsible for substantial oceanic primary and exportproduction (Martin et al., 1987; Emerson et al., 1997). The debateis ongoing, however, as to how these processes are changing inresponse to longer term shifts in environmental forcing such aschanges in ocean chemistry (Dore et al., 2009) and temperature(Karl et al., 2001; Corno et al., 2007; Saba et al., 2010). Accurateestimation of global ocean production and export, therefore,will require not only reliable estimation of NPSG ecosystemprocesses (Karl, 2010) but also a detailed understanding of theoceanographic context in which these processes are occurring,including an accurate characterization of gyre geography and thedynamics of gyre areal extent and boundary location.
Because of their immense size and age, oligotrophic gyreshave been considered historically to support pelagic ecosystemsin a climax state relatively resulting from stable environmentalforcing in space and time; however, they are now recognized todisplay substantial spatial, seasonal, and interannual variability(Venrick, 1995; Karl, 2010; Karl and Church, 2017). Whiledominated by small phytoplankton and regenerated productivity(Letelier et al., 1996; Li et al., 2011), relatively short-livedperturbations in the NPSG contribute not only to momentaryincreases in net primary productivity (NPP) but also to thedecoupling of autotrophic and heterotrophic processes andsubsequent export of particulate carbon. These include deepvertical mixing events followed by water column restratification(DiTullio and Laws, 1991) associated with the passage of cycloniceddies (Letelier et al., 2000; Wilson and Adamec, 2001), Rossbywaves (Sakamoto et al., 2004), and the breaking of internal waves.On longer time scales, in situ PP and phytoplankton biomass(as determined by chlorophyll chl a) in the NPSG, measuredduring various programs such as CLIMAX and the Hawaii OceanTime-series (HOT) have increased over the past four decades(Venrick et al., 1987; Karl et al., 2001; Corno et al., 2007). Theseincreases have been linked to a shift in the phase of the PacificDecadal Oscillation (PDO, Karl et al., 2001) or El Niño SouthernOscillation (ENSO)/PDO interactions (Corno et al., 2007) andresulting changes in stratification.
Station ALOHA (22.75◦N, 158◦W: A Long-term OligotrophicHabitat Assessment) is a benchmarkmonitoring site in the NPSGwhere in situ sampling of ocean physical, biological, and chemicalparameters has occurred since 1988 (Karl, 2010). However, thepatterns of increased biomass and primary productivity foundin situ are contrary to synoptic patterns observed throughanalyses of derived satellite products. Behrenfeld et al. (2006)observed that global ocean net PP and phytoplankton biomass(as defined by chl a) decreased from 1999 to 2006 in responseto increased water column stratification. Hypothesized as anecological response to an increase in the multivariate ENSO
index, the chl a trend was largely driven by changes in thesubtropical gyres. Both Polovina et al. (2008) and Irwin andOliver (2009) noted ENSO or PDO-associated increases in theareal extent of the most oligotrophic water in subtropical gyres.Finally, recent analyses of ocean color data from 1997 to 2010 and1997 to 2013 suggest gradual, yet significant, decreases in surfacechl a in subjectively defined polygons that encompassed theoligotrophic regions of the North Pacific as well as other basins(Signorini and McClain, 2012; Signorini et al., 2015). Conversely,Siegel et al. (2013) argue that the tropical/sub-tropical negativecorrelation between satellite chl a and sea surface temperature(SST) is primarily a physiological signal of variable chl a tocarbon (C) ratio rather than a phytoplankton biomass signal,likely associated with photoacclimation (Letelier et al., 1993,2017;Winn et al., 1993). While some analyses of long-term in situdata support the trend toward oligotrophy found in early large-scale studies (Boyce et al., 2010, 2011, 2014), the majority of insitu time series do not (Chavez et al., 2011; McQuatters-Gollopet al., 2011).
Contrary findings between gyre-scale and in situ analyses,attribution of change to differing climate modes, and thevariations in the shape and extent of the gyre suggest that regionaloceanographic context needs to be considered when examiningthe role of interannual variability and secular trends on largescale shifts in the subtropical gyres (e.g., Hammond et al., 2017).One such regional approach considers the temporal patterns offeatures as a composite of biophysical interactions (Oliver andIrwin, 2008; Kavanaugh et al., 2014b, 2016). Seasonally evolvingsatellite-derived seascapes describe regional variability in theNorth Pacific with differences in biogeochemical interactions(Kavanaugh et al., 2014b), and community structure (Kavanaughet al., 2014a). Here, we use interannual varying seascapes tofurther our understanding of subtropical gyre dynamics andcompare seascape variability relative to circulation-based or low-level chl a-based definitions of the gyre. We hypothesized thatyear-to-year variability in the size of the subtropical gyre andlocation of the gyre boundary is reflected in the patterns ofphytoplankton abundance and productivity at Station ALOHA.The location of Station ALOHA is highlighted, with trendsand oscillations of seascape area and isolation compared acrossdefinitions and analyzed in concert with in situ patterns.Specifically, we address the following questions:
1. What are the interannual trends across different metrics ofgyre expansion?
2. To what degree are variations in subtropical seascapegeography related to interannual to decadal climate modes?
3. Finally, how do variations in seascape geography relate tothe interannual patterns of phytoplankton abundance andprimary productivity observed at Station ALOHA?
METHODS
Oligotrophic Chl a Gyre ExtentArea of the extent of highly oligotrophic gyre (a thresholddefined as chl a ≤ 0.07mg m−3; Polovina et al., 2008, hereafteroligotrophic threshold chl a) was calculated from monthly
Frontiers in Marine Science | www.frontiersin.org 2 April 2018 | Volume 5 | Article 130
Kavanaugh et al. Aloha From the Edge
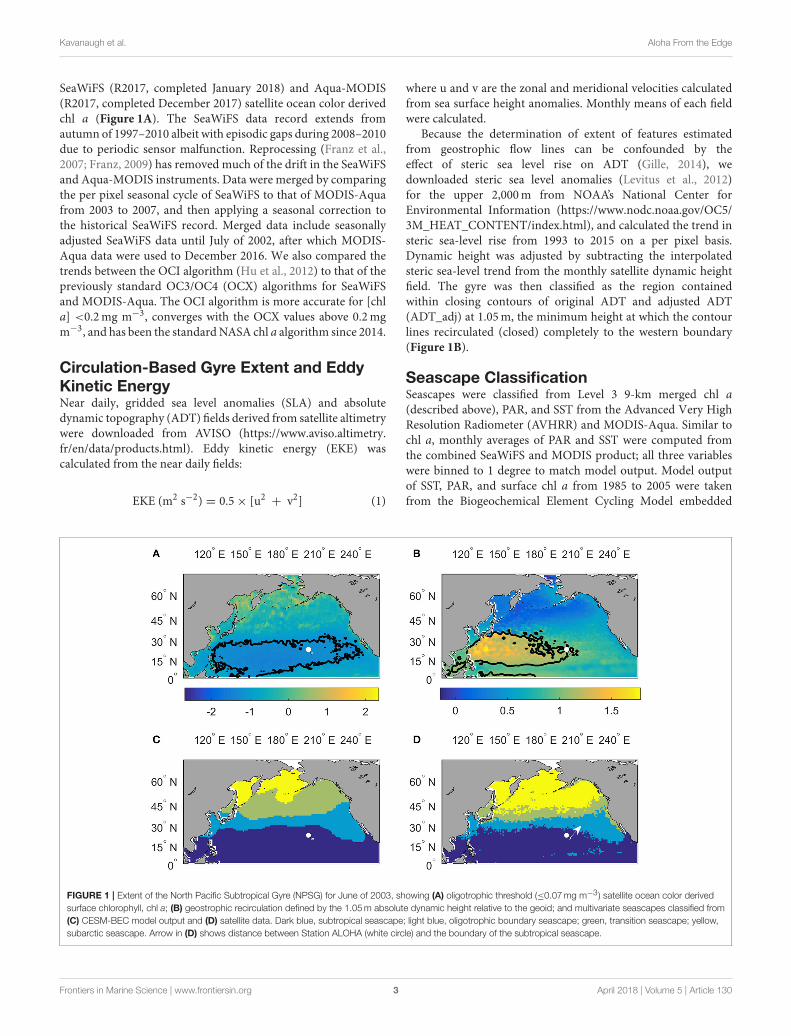
SeaWiFS (R2017, completed January 2018) and Aqua-MODIS(R2017, completed December 2017) satellite ocean color derivedchl a (Figure 1A). The SeaWiFS data record extends fromautumn of 1997–2010 albeit with episodic gaps during 2008–2010due to periodic sensor malfunction. Reprocessing (Franz et al.,2007; Franz, 2009) has removed much of the drift in the SeaWiFSand Aqua-MODIS instruments. Data were merged by comparingthe per pixel seasonal cycle of SeaWiFS to that of MODIS-Aquafrom 2003 to 2007, and then applying a seasonal correction tothe historical SeaWiFS record. Merged data include seasonallyadjusted SeaWiFS data until July of 2002, after which MODIS-Aqua data were used to December 2016. We also compared thetrends between the OCI algorithm (Hu et al., 2012) to that of thepreviously standard OC3/OC4 (OCX) algorithms for SeaWiFSand MODIS-Aqua. The OCI algorithm is more accurate for [chla] <0.2mg m−3, converges with the OCX values above 0.2mgm−3, and has been the standardNASA chl a algorithm since 2014.
Circulation-Based Gyre Extent and EddyKinetic EnergyNear daily, gridded sea level anomalies (SLA) and absolutedynamic topography (ADT) fields derived from satellite altimetrywere downloaded from AVISO (https://www.aviso.altimetry.fr/en/data/products.html). Eddy kinetic energy (EKE) wascalculated from the near daily fields:
EKE (m2 s−2) = 0.5× [u2 + v2] (1)
where u and v are the zonal and meridional velocities calculatedfrom sea surface height anomalies. Monthly means of each fieldwere calculated.
Because the determination of extent of features estimatedfrom geostrophic flow lines can be confounded by theeffect of steric sea level rise on ADT (Gille, 2014), wedownloaded steric sea level anomalies (Levitus et al., 2012)for the upper 2,000m from NOAA’s National Center forEnvironmental Information (https://www.nodc.noaa.gov/OC5/3M_HEAT_CONTENT/index.html), and calculated the trend insteric sea-level rise from 1993 to 2015 on a per pixel basis.Dynamic height was adjusted by subtracting the interpolatedsteric sea-level trend from the monthly satellite dynamic heightfield. The gyre was then classified as the region containedwithin closing contours of original ADT and adjusted ADT(ADT_adj) at 1.05m, the minimum height at which the contourlines recirculated (closed) completely to the western boundary(Figure 1B).
Seascape ClassificationSeascapes were classified from Level 3 9-km merged chl a(described above), PAR, and SST from the Advanced Very HighResolution Radiometer (AVHRR) and MODIS-Aqua. Similar tochl a, monthly averages of PAR and SST were computed fromthe combined SeaWiFS and MODIS product; all three variableswere binned to 1 degree to match model output. Model outputof SST, PAR, and surface chl a from 1985 to 2005 were takenfrom the Biogeochemical Element Cycling Model embedded
FIGURE 1 | Extent of the North Pacific Subtropical Gyre (NPSG) for June of 2003, showing (A) oligotrophic threshold (≤0.07mg m−3) satellite ocean color derived
surface chlorophyll, chl a; (B) geostrophic recirculation defined by the 1.05m absolute dynamic height relative to the geoid; and multivariate seascapes classified from
(C) CESM-BEC model output and (D) satellite data. Dark blue, subtropical seascape; light blue, oligotrophic boundary seascape; green, transition seascape; yellow,
subarctic seascape. Arrow in (D) shows distance between Station ALOHA (white circle) and the boundary of the subtropical seascape.
Frontiers in Marine Science | www.frontiersin.org 3 April 2018 | Volume 5 | Article 130

Kavanaugh et al. Aloha From the Edge
in the Community Earth System Model (CESM-BEC, Doneyet al., 2009; Moore et al., 2013). Surface chl a concentration issensitive to mixed layer depth in the subtropics (e.g., Letelieret al., 1996; Siegel et al., 2013); thus we chose the CESM-BECbecause of its inclusion of photoacclimation. While this does notisolate the effect of photoacclimation, it assures that modeledchl a and satellite chl a are responding similarly to physicalforcing, reflecting the phytoplankton physiological responsesobserved at StationALOHA.All data sets were standardized priorto classification. Satellite and model seascapes were classifiedseparately (Figures 1C,D).
Climatological seasonal means of PAR, SST, and chl awere defined for both data sets from 2003 to 2007. Weused a probabilistic self-organizing mapping algorithm (PrSOM,Anouar et al., 1998) to reduce the 3-variable (SSTx,y,m, PARx,y,chl a x,y,m) spatiotemporal data set onto a 15× 15 neuronal mapresulting in 225 classes, each with its own 3-Dweight based on themaximum likelihood estimation (3-DMLEs). The neural net size(15× 15 nodes) was chosen to maximize sensitivity to mesoscaleprocesses while preventing underpopulated nodes (defined as<500 pixels). The 3-D MLEs were then further reduced using ahierarchical agglomerative clustering (HAC) with Ward linkages(Ward, 1963). This linkage method uses combinatorial, Euclidiandistances that conserve the original data space with sequentiallinkages (McCune et al., 2002). Euclidian distances here areequivalent to within-group and total sum of squares.
Previously, we found that eight seascapes classified fromseasonal climatologies of satellite-derived SST, chl a, and PARrepresented seasonal shifts in biogeochemical patterns andplanktonic assemblages (Kavanaugh et al., 2014a,b). Here, wefollowed themethodology of Kavanaugh et al. (2014b), with threeexceptions. First, the seasonal variability of PAR was removedon a per-pixel basis to minimize discontinuities associated withthe spring and fall transitions, with interannual and spatialvariability remaining. Second, stepwise agglomerations wereconducted using the Ward method until four seascapes for eachof the model and satellite data sets were defined: a subtropicalseascape, oligotrophic transition, a mesotrophic transition, and asubarctic seascape. These four regions bear the spatial signatureof analogous seasonally evolving regions classified previously(Kavanaugh et al., 2014b) and represent a trade-off betweenvariance explained in both the satellite and model records,and spatial match-up between satellite and modeled seascapes(Figure S1). Finally, once the seasonal and spatial vectors wereclassified, the means, variances and covariances within seascapesinformed a multivariate Gaussian mixture model (GMM). Classassignments of individual months were then determined bytheir maximum posterior probabilities. New classes were thenpredicted from the CESM and satellite GMMs using the monthlymeans of chl a, SST, and PAR of the respective model and satellitetime series.
Geographic MetricsWe focus on the dynamics of the subtropical seascapeand the boundary between the subtropical and oligotrophictransition seascape. Total area of oligotrophy, recirculation, andmultivariate subtropical seascape was assigned based on the
sum of the area of all pixels within the appropriate contouror identified seascape in the North Pacific. Surface area ofeach pixel was calculated by correcting for the spheroid-effecton distance between lines of longitude. For each time step,the distance from Station ALOHA to the subtropical seascapeboundary was also calculated using the mean of the 5th quantileof all boundary distances in a quadrant 45◦ on either side ofdue NE from Station ALOHA Figure 1D); encroachment of lessoligotrophic waters from the NE was most common. When theoligotrophic boundary encroached beyond (south and or east of)Station ALOHA, the distance values were negative. All area-basedanalyses were truncated at 10◦N to minimize the effect of theequatorial upwelling region.
To understand the role of mesoscale variability on basin-scale geography, we examined the relationship between meanEKE and the difference in extent between the gyre defined bycirculation and that defined by oligotrophy (see above). Pixelswere categorized as belonging in (1) both the oligotrophic andphysical gyres, (2) only in the physical gyre, or (3) only in theoligotrophic gyre. The mean EKE was calculated over the pixelsfor each of the three aforementioned groups.
Climatic IndicesTo infer the effect of climatic forcing on the interannualdynamics of gyre geography, three different indices were used.The multivariate El Niño Southern Oscillation Index (MEI) iscomputed from a principal component analysis (PCA) of sixvariables including sea level pressure, zonal and meridional windcomponents, cloudiness, and sea surface and air temperatures(Wolter and Timlin, 1993). These data are available fromNOAA (http://www.esrl.noaa.gov/psd/enso/mei/). The NorthPacific Gyre Oscillation (NPGO, Di Lorenzo et al., 2008; http://www.o3d.org/npgo/) is the second dominant mode calculatedfrom North Pacific sea surface height anomalies and is associatedwith accelerated North Pacific, Alaska, and California Currents(Chavez et al., 2011). The Pacific Decadal Oscillation (PDO,Mantua et al., 1997; Zhang et al., 1997) is associated with thedominant mode of North Pacific SST anomalies and the dataare available from the University of Washington (http://jisao.washington.edu/pdo/).
Station ALOHA DataIn situ NPP, Total chl a (Tchl a, the sum of divinyl andmonovinyl chl a), and in situ physical patterns in the subtropicalNorth Pacific were assessed using archived data from StationALOHA (http://hahana.soest.hawaii.edu/hot/hot-dogs/interface.html). Net PP was determined by daytime incubation in bottlesspiked with 14C bicarbonate incubated in situ to maintainnatural light and temperature (Letelier et al., 1996). Chl aand photosynthetic accessory pigments were measured byhigh performance liquid chromatography (HPLC) according toWright et al. (1991). Mean pigment concentrations and NPPpatterns were quantified separately for the light-saturated surface(0–45m) and light-limited region of the euphotic zone thatcontained the deep chlorophyll maximum (DCM, 75–150m).Potential temperature and bottle salinity were also recordedfor the upper 45m. Mixed layer depth was calculated using
Frontiers in Marine Science | www.frontiersin.org 4 April 2018 | Volume 5 | Article 130

Kavanaugh et al. Aloha From the Edge
a potential density gradient threshold of 0.005 kg m−4 and apotential density offset of 0.125 kg m−3 from the surface (Karland Lukas, 1996).
Statistical AnalysisCross correlation analyses were conducted to determine thecorrelations between climate and geographic metrics, therelationship between seascape dynamics and in situ conditionsat Station ALOHA, and the time scales or lags at whichthe correlation was strongest. Cross correlation analysis wasalso conducted to determine the effect of EKE on spatialmismatch between geographic metrics. Prior to analysis, monthlyclimatological means were calculated by removing outliers(exceeding ± 3 standard deviations), then missing in situdata were interpolated using a 3-month LOESS filter tominimize the effect of within-year data density on interannualtrends. Then, anomalies for each time series were calculatedby subtracting the monthly climatological mean, calculatedfrom the smoothed data, and then smoothing with a 12-month LOESS filter prior to correlation analysis. Statisticalsignificance of correlation coefficients were determined using acritical value which adjusted degrees of freedom to account forautocorrelation in covariance (Glover et al., 2011). Correlationsthat exceeded this value are considered significant (p <
0.05).Trends over time were adjusted to account for the effect of
climate oscillations. We conducted a PCA across the NPGO,PDO, and MEI indices; multiple linear regression was conductedusing the PCA scores as predictors and individual seasonally-detrended anomalies as responses. Trends were then a result of asimple linear fit to the residuals of the multiple linear regressionmodel.
RESULTS
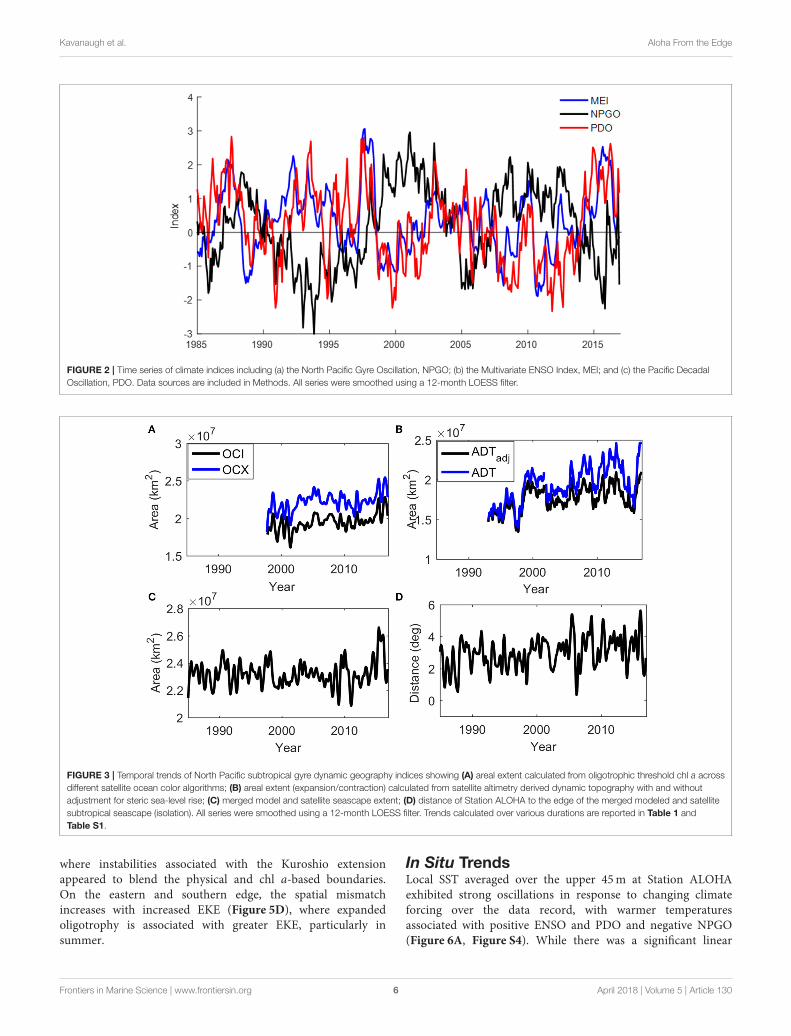
Climate VariabilityFrom 1985 to 2016, three to four cycles of the NPGO, MEI, andPDO were evident (Figure 2). In the early part of the record(1985–1998), the PDO and MEI were out of phase but movedinto phase following the 1997–1998 El Niño and subsequentLa Niña, remaining in phase for the rest of the data record(r = 0.6, p < 0.001). Throughout our study period, the NPGOwas anticorrelated (r = −0.5, p < 0.001) with the other twoindices, but also led the PDO and MEI by 5 and 8 months,respectively (Figure S2). Thus, any secular trend reported is thatwhich remains after accounting for the effect of oscillations in thesign and magnitude of the climate indicators.
Expansion and Isolation Trends and DriversPatterns and trends among the different gyre geographic metricsvaried and were associated with different climate forcing. Thearea of low-level chl a was dependent on algorithm, with thelower sensitivity of the OCX resulting in a larger expanse ofoligotrophy (Figure 3A, Table 1). Large interannual oscillationswere evident, with any linear trend being highly dependenton record length (Table S1). From 1998 to 2016, expansion ofthe area of low-level chl a occurred at a rate of 0.36% year−1
(Table 1). Seasonal and interannual oscillations as well as weakincreases (0.5% per year) in the physical extent of the gyrewere evident from the altimetry-based time series (Figure 3B,Table 1). Trends were weaker in data adjusted for steric sea-level changes than those unadjusted for absolute dynamic height(ADT_adj and ADT, respectively, Table S1). As with the extentof oligotrophy, presence or magnitude of a trend depended onthe length of the time series, with no trend evident from 1998to 2006 (Figure 3B, Table S1), despite the strong ENSO signalduring that span. Because modeled and satellite seascapes werehighly correlated and in phase for both indices (Figures S1B,C;expansion: r = 0.64, p < 0.05; isolation r = 0.76, p < 0.05),the data records were combined and a single index of expansionor isolation was used that spanned the entire data record(1985–2016). There was evidence of slight expansion of thesubtropical seascape from 1985 to 2016 (Table 1). Isolationdistance also varied from year to year, although aseasonal,within-year variability was higher relative to the other metrics(Figure 3D). A linear trend was evident from 1985 to 2016 (butnot over a shorter duration), with isolation distance increasing by0.9% per year (Table 1).
Gyre extent, defined by oligotrophic threshold chl a, waspositively correlated to the MEI, with positive MEI precedingexpansion of low-level chl a area by 6–12 months (Figure 4A).The areal extent of recirculation was positively correlated withthe NPGO and strongly negatively correlated with the PDOand MEI (Figure 4B). Similar to the area of low-level chl a,the subtropical seascape was strongly correlated to the MEI andwas also related to the PDO (Figure 4C), whereas the isolationof Station ALOHA within the subtropical gyre was positivelycorrelated with the NPGO and negatively correlated with theMEI and PDO (Figure 4D). While covering a much larger area,areal extent of multivariate seascapes was weakly correlated tothat of threshold chl a patterns, (Figure S3A: r = 0.24, p < 0.05);however, patterns preceded the chl-only index by approximately7 months. Multivariate seascape expansion was anti-correlated toboth the dynamic topography extent described above (r=−0.48,p < 0.05), and the distance of Station ALOHA to the edge of thesubtropical seascape (Figure S3B: r =−0.36, p < 0.05). Isolationdistance was positively correlated to gyre extent as measured bygeostrophy (r = 0.33, p < 0.05), with isolation shifts precedingthat of gyre extent also by 7 months. Isolation was not correlatedto the low-level chl ametric.
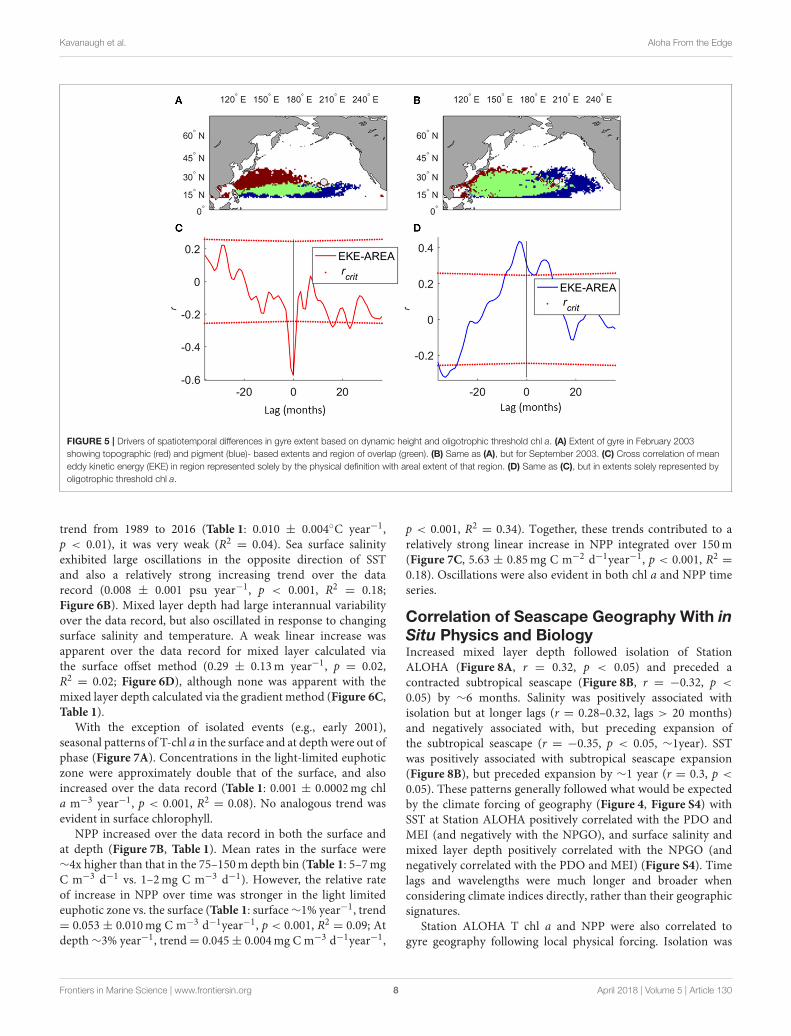
The NPSG is most contracted in winter and at itsgreatest extent in September for both definitions of the gyre(Figures 5A,B). The northern winter boundary of the physicalgyre exceeds that of low-level chl a, and the summer easternboundary extends less than the low-level chl-a. However,on interannual scales, the physical extent and low-level chla-based extent were anti-correlated, due to different climateforcing. The physical extent is strongly positively correlatedwith the NPGO, whereas the extent of low-level chl a ispositively correlated with the PDO and MEI. Increased EKEresulted in expansion of the areal extent of oligotrophic-threshold chl a. The result is that off of the Kuroshio, thespatial mismatch between the two definitions is minimizedwith increased EKE between their boundaries (Figure 5C),
Frontiers in Marine Science | www.frontiersin.org 5 April 2018 | Volume 5 | Article 130
Kavanaugh et al. Aloha From the Edge
FIGURE 2 | Time series of climate indices including (a) the North Pacific Gyre Oscillation, NPGO; (b) the Multivariate ENSO Index, MEI; and (c) the Pacific Decadal
Oscillation, PDO. Data sources are included in Methods. All series were smoothed using a 12-month LOESS filter.
FIGURE 3 | Temporal trends of North Pacific subtropical gyre dynamic geography indices showing (A) areal extent calculated from oligotrophic threshold chl a across
different satellite ocean color algorithms; (B) areal extent (expansion/contraction) calculated from satellite altimetry derived dynamic topography with and without
adjustment for steric sea-level rise; (C) merged model and satellite seascape extent; (D) distance of Station ALOHA to the edge of the merged modeled and satellite
subtropical seascape (isolation). All series were smoothed using a 12-month LOESS filter. Trends calculated over various durations are reported in Table 1 and
Table S1.
where instabilities associated with the Kuroshio extensionappeared to blend the physical and chl a-based boundaries.On the eastern and southern edge, the spatial mismatchincreases with increased EKE (Figure 5D), where expandedoligotrophy is associated with greater EKE, particularly insummer.
In Situ TrendsLocal SST averaged over the upper 45m at Station ALOHAexhibited strong oscillations in response to changing climateforcing over the data record, with warmer temperaturesassociated with positive ENSO and PDO and negative NPGO(Figure 6A, Figure S4). While there was a significant linear
Frontiers in Marine Science | www.frontiersin.org 6 April 2018 | Volume 5 | Article 130

Kavanaugh et al. Aloha From the Edge
TABLE 1 | Secular trends across geographic metrics, chl a algorithms, and in situ characteristics at Station ALOHA.
Algorithm Span Span mean Trend (year−1) Trend (SE) % change year−1 R2 p-Value
AREA METRICS (km2)
ocx: chl a ≤0.07mg m−3 1998–2016 2.23E+007 4.87E+04 1.39E+04 0.220 0.05 <0.001
oci: chl a ≤ 0.07mg m−3 1998–2016 1.95E+007 7.00E+04 1.36E+04 0.360 0.11 <0.001
ADT_adj 1993–2016 1.76E+007 8.66E+04 1.11E+04 0.491 0.42 <0.001
ADT_adj 1998–2016 1.76E+007 8.48E+04 1.08E+04 0.481 0.27 <0.001
Subtropical Seascape 1985–2016 2.32E+007 1.64+04 6.03E+03 0.071 0.02 <0.01
DISTANCE METRICS (km)
Station ALOHA to SS edge 1985–2016 3.28E+02 3.20E+00 8.90E-01 0.970 0.04 <0.001
STATION ALOHA
SST (◦C) 1989–2016 24.8 0.013 0.004 0.052 0.04 <0.01
SSS (psu) 1989–2016 35.1 0.008 0.001 0.023 0.14 <0.001
MLD (surface offset, m) 1989–2016 58.7 0.29 0.13 0.494 0.02 0.02
MLD (gradient threshold, m) 1989–2016 32.5 0.14 0.11 0.431 0 0.2
[chl a]: 0–45m (mg chl a m−3) 1989–2016 0.09 0 0 0.000 0 0.72
[chl a]: 75–150m (mg chl a m −3) 1989–2016 0.17 0.001 0.0002 0.588 0.06 <0.001
NPP: 0–45m (mg C m−3 d−1) 1989–2016 6.07 0.053 0.01 0.873 0.08 <0.001
NPP: 75–150m (mg C m−3 d−1) 1989–2016 1.13 0.045 0.004 3.982 0.34 <0.001
NPP: Int to150m (mg C m−2 d−1) 1989–2016 513 5.63 0.85 1.097 0.18 <0.001
Italicized values denote no significant trend over the duration measured. Signatures of the NPGO, PDO, and MEI have been removed from each time series prior to analysis (see section
Methods).
FIGURE 4 | Lagged correlations between climate indices and dynamic geography indices of the North Pacific Subtropical Gyre. Where lag is negative, climate index
leads geographic metric; the converse is true for positive lags. Correlations are significant when they exceed the critical value (dotted red lines). (A) Gyre area defined
by chl a ≤ 0.07mg m−3. (B) Gyre area defined by closing contour of dynamic height (1.05m). (C) Gyre area defined by the extent of the multivariate subtropical
seascape. (D) Distance from Station ALOHA to the edge of the subtropical seascape.
Frontiers in Marine Science | www.frontiersin.org 7 April 2018 | Volume 5 | Article 130
Kavanaugh et al. Aloha From the Edge
FIGURE 5 | Drivers of spatiotemporal differences in gyre extent based on dynamic height and oligotrophic threshold chl a. (A) Extent of gyre in February 2003
showing topographic (red) and pigment (blue)- based extents and region of overlap (green). (B) Same as (A), but for September 2003. (C) Cross correlation of mean
eddy kinetic energy (EKE) in region represented solely by the physical definition with areal extent of that region. (D) Same as (C), but in extents solely represented by
oligotrophic threshold chl a.
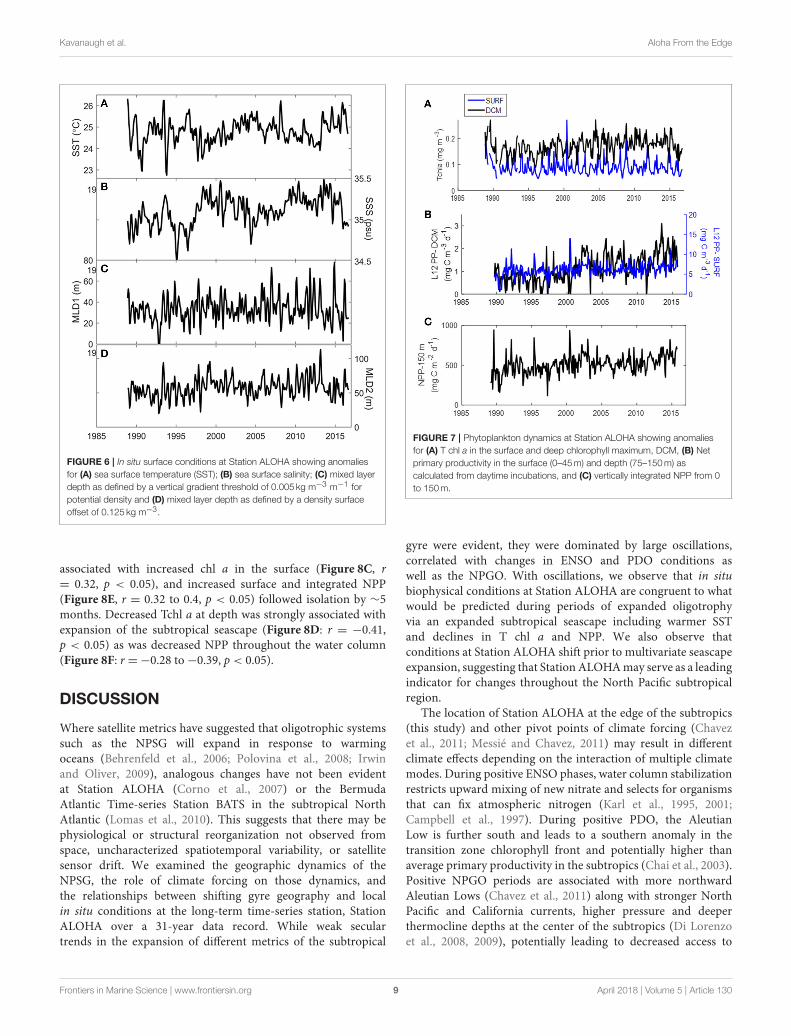
trend from 1989 to 2016 (Table 1: 0.010 ± 0.004◦C year−1,p < 0.01), it was very weak (R2 = 0.04). Sea surface salinityexhibited large oscillations in the opposite direction of SSTand also a relatively strong increasing trend over the datarecord (0.008 ± 0.001 psu year−1, p < 0.001, R2 = 0.18;Figure 6B). Mixed layer depth had large interannual variabilityover the data record, but also oscillated in response to changingsurface salinity and temperature. A weak linear increase wasapparent over the data record for mixed layer calculated viathe surface offset method (0.29 ± 0.13m year−1, p = 0.02,R2 = 0.02; Figure 6D), although none was apparent with themixed layer depth calculated via the gradient method (Figure 6C,Table 1).
With the exception of isolated events (e.g., early 2001),seasonal patterns of T-chl a in the surface and at depth were out ofphase (Figure 7A). Concentrations in the light-limited euphoticzone were approximately double that of the surface, and alsoincreased over the data record (Table 1: 0.001 ± 0.0002mg chla m−3 year−1, p < 0.001, R2 = 0.08). No analogous trend wasevident in surface chlorophyll.
NPP increased over the data record in both the surface andat depth (Figure 7B, Table 1). Mean rates in the surface were∼4x higher than that in the 75–150m depth bin (Table 1: 5–7mgC m−3 d−1 vs. 1–2mg C m−3 d−1). However, the relative rateof increase in NPP over time was stronger in the light limitedeuphotic zone vs. the surface (Table 1: surface∼1% year−1, trend= 0.053 ± 0.010mg C m−3 d−1year−1, p < 0.001, R2 = 0.09; Atdepth∼3% year−1, trend= 0.045± 0.004mg C m−3 d−1year−1,
p < 0.001, R2 = 0.34). Together, these trends contributed to arelatively strong linear increase in NPP integrated over 150m(Figure 7C, 5.63 ± 0.85mg C m−2 d−1year−1, p < 0.001, R2 =0.18). Oscillations were also evident in both chl a and NPP timeseries.
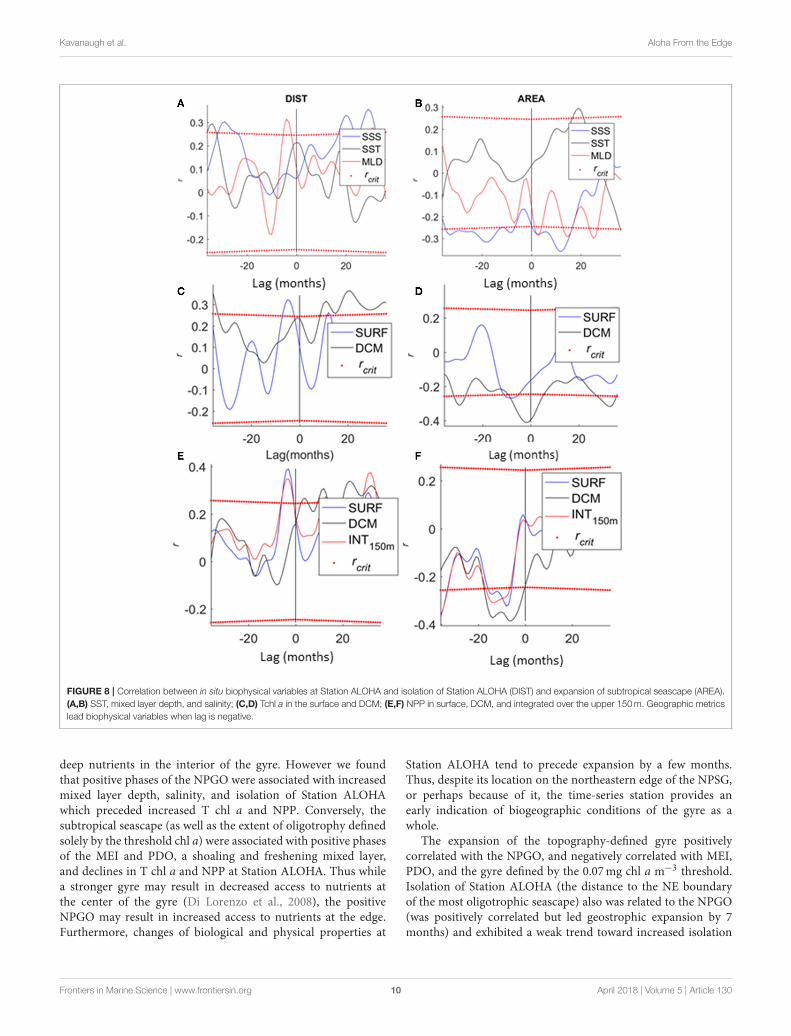
Correlation of Seascape Geography With in
Situ Physics and BiologyIncreased mixed layer depth followed isolation of StationALOHA (Figure 8A, r = 0.32, p < 0.05) and preceded acontracted subtropical seascape (Figure 8B, r = −0.32, p <
0.05) by ∼6 months. Salinity was positively associated withisolation but at longer lags (r = 0.28–0.32, lags > 20 months)and negatively associated with, but preceding expansion ofthe subtropical seascape (r = −0.35, p < 0.05, ∼1year). SSTwas positively associated with subtropical seascape expansion(Figure 8B), but preceded expansion by ∼1 year (r = 0.3, p <
0.05). These patterns generally followed what would be expectedby the climate forcing of geography (Figure 4, Figure S4) withSST at Station ALOHA positively correlated with the PDO andMEI (and negatively with the NPGO), and surface salinity andmixed layer depth positively correlated with the NPGO (andnegatively correlated with the PDO and MEI) (Figure S4). Timelags and wavelengths were much longer and broader whenconsidering climate indices directly, rather than their geographicsignatures.
Station ALOHA T chl a and NPP were also correlated togyre geography following local physical forcing. Isolation was
Frontiers in Marine Science | www.frontiersin.org 8 April 2018 | Volume 5 | Article 130
Kavanaugh et al. Aloha From the Edge
FIGURE 6 | In situ surface conditions at Station ALOHA showing anomalies
for (A) sea surface temperature (SST); (B) sea surface salinity; (C) mixed layer
depth as defined by a vertical gradient threshold of 0.005 kg m−3 m−1 for
potential density and (D) mixed layer depth as defined by a density surface
offset of 0.125 kg m−3.
associated with increased chl a in the surface (Figure 8C, r= 0.32, p < 0.05), and increased surface and integrated NPP(Figure 8E, r = 0.32 to 0.4, p < 0.05) followed isolation by ∼5months. Decreased Tchl a at depth was strongly associated withexpansion of the subtropical seascape (Figure 8D: r = −0.41,p < 0.05) as was decreased NPP throughout the water column(Figure 8F: r =−0.28 to−0.39, p < 0.05).
DISCUSSION
Where satellite metrics have suggested that oligotrophic systemssuch as the NPSG will expand in response to warmingoceans (Behrenfeld et al., 2006; Polovina et al., 2008; Irwinand Oliver, 2009), analogous changes have not been evidentat Station ALOHA (Corno et al., 2007) or the BermudaAtlantic Time-series Station BATS in the subtropical NorthAtlantic (Lomas et al., 2010). This suggests that there may bephysiological or structural reorganization not observed fromspace, uncharacterized spatiotemporal variability, or satellitesensor drift. We examined the geographic dynamics of theNPSG, the role of climate forcing on those dynamics, andthe relationships between shifting gyre geography and localin situ conditions at the long-term time-series station, StationALOHA over a 31-year data record. While weak seculartrends in the expansion of different metrics of the subtropical
FIGURE 7 | Phytoplankton dynamics at Station ALOHA showing anomalies
for (A) T chl a in the surface and deep chlorophyll maximum, DCM, (B) Net
primary productivity in the surface (0–45m) and depth (75–150m) as
calculated from daytime incubations, and (C) vertically integrated NPP from 0
to 150m.
gyre were evident, they were dominated by large oscillations,correlated with changes in ENSO and PDO conditions aswell as the NPGO. With oscillations, we observe that in situbiophysical conditions at Station ALOHA are congruent to whatwould be predicted during periods of expanded oligotrophyvia an expanded subtropical seascape including warmer SSTand declines in T chl a and NPP. We also observe thatconditions at Station ALOHA shift prior to multivariate seascapeexpansion, suggesting that StationALOHAmay serve as a leadingindicator for changes throughout the North Pacific subtropicalregion.
The location of Station ALOHA at the edge of the subtropics(this study) and other pivot points of climate forcing (Chavezet al., 2011; Messié and Chavez, 2011) may result in differentclimate effects depending on the interaction of multiple climatemodes. During positive ENSO phases, water column stabilizationrestricts upward mixing of new nitrate and selects for organismsthat can fix atmospheric nitrogen (Karl et al., 1995, 2001;Campbell et al., 1997). During positive PDO, the AleutianLow is further south and leads to a southern anomaly in thetransition zone chlorophyll front and potentially higher thanaverage primary productivity in the subtropics (Chai et al., 2003).Positive NPGO periods are associated with more northwardAleutian Lows (Chavez et al., 2011) along with stronger NorthPacific and California currents, higher pressure and deeperthermocline depths at the center of the subtropics (Di Lorenzoet al., 2008, 2009), potentially leading to decreased access to
Frontiers in Marine Science | www.frontiersin.org 9 April 2018 | Volume 5 | Article 130
Kavanaugh et al. Aloha From the Edge
FIGURE 8 | Correlation between in situ biophysical variables at Station ALOHA and isolation of Station ALOHA (DIST) and expansion of subtropical seascape (AREA).
(A,B) SST, mixed layer depth, and salinity; (C,D) Tchl a in the surface and DCM; (E,F) NPP in surface, DCM, and integrated over the upper 150m. Geographic metrics
lead biophysical variables when lag is negative.
deep nutrients in the interior of the gyre. However we foundthat positive phases of the NPGO were associated with increasedmixed layer depth, salinity, and isolation of Station ALOHAwhich preceded increased T chl a and NPP. Conversely, thesubtropical seascape (as well as the extent of oligotrophy definedsolely by the threshold chl a) were associated with positive phasesof the MEI and PDO, a shoaling and freshening mixed layer,and declines in T chl a and NPP at Station ALOHA. Thus whilea stronger gyre may result in decreased access to nutrients atthe center of the gyre (Di Lorenzo et al., 2008), the positiveNPGO may result in increased access to nutrients at the edge.Furthermore, changes of biological and physical properties at
Station ALOHA tend to precede expansion by a few months.Thus, despite its location on the northeastern edge of the NPSG,or perhaps because of it, the time-series station provides anearly indication of biogeographic conditions of the gyre as awhole.
The expansion of the topography-defined gyre positivelycorrelated with the NPGO, and negatively correlated with MEI,PDO, and the gyre defined by the 0.07mg chl a m−3 threshold.Isolation of Station ALOHA (the distance to the NE boundaryof the most oligotrophic seascape) also was related to the NPGO(was positively correlated but led geostrophic expansion by 7months) and exhibited a weak trend toward increased isolation
Frontiers in Marine Science | www.frontiersin.org 10 April 2018 | Volume 5 | Article 130
Kavanaugh et al. Aloha From the Edge
over the duration of the study. During positive NPGO conditions,transport through the North Pacific and California currents isstronger (Di Lorenzo et al., 2008), and meanders of the southernedge of the North Pacific Current-California current bifurcationmay be reduced leading to the associated increase in isolation ofStation ALOHA within the northeast corner of the subtropicalseascape.
Eddy kinetic energy appears to expand the geographicsignature of oligotrophy, resulting in a temporal mismatchbetween the gyre defined by low-level chl a and dynamictopography. While this suggests that the net effect of mesoscaleprocesses on chl a (extent of oligotrophy) is negative (expansive),the observed effect of eddies on phytoplankton biomassand NPP near Station ALOHA are mixed. Upwelling withincyclonic eddies have also been purported to change communitystructure (Bidigare et al., 2003), primary and new production(Vaillancourt et al., 2003). Anticyclonic eddies can result inincreased nitrogen fixation (Fong et al., 2008; Church et al.,2009) which is responsible for over 40% of the new/exportproduction at HOT. Finally, regions between anticyclonicand cyclonic eddies have also been shown to have increasedPP and particulate organic carbon flux (Guidi et al., 2012).Sea surface height variation in general, has been found toaffect the location and species composition in the DCM,with a shallower DCM with higher abundance of largereukaryotic phytoplankton occurring with lower SSH (Baroneet al., in review). Future studies could use existing databasesto investigate the relative frequency of eddies (e.g., Cheltonet al., 2011) in the NPSG during different climate modes,and determine whether changes in frequency are accompaniedby changes in nitrogen fixation, NPP, and export at StationALOHA.
Secular increases in the gyre geographical extent are weak,but evident within all four geographic indices. Limited bythe satellite record at the time of publication, Polovina et al.(2008) reported increases in the areal extent of oligotrophicthreshold chl a in the North Pacific at a rate of 2.2% per yearfrom 1998 to 2007. Irwin and Oliver (2009) reported generalincreases through time in the most oligotrophic provincesin their classification, with oscillatory behavior found acrossall oligotrophic provinces. Using a longer record and linearregression analyses, Signorini et al. (2015) found mostly seculardeclines in surface chl a over large, subjectively chosenregions, but also discussed the influence of mixed layer depthchanges and subsequent photoacclimation on chl a in thesubtropics. In our re-analysis of geographic trends in theNorth Pacific using the latest processing of MODIS andSeaWiFS, we observe ENSO- and PDO-influenced oscillationsof areal extent of regions with chl a <0.07mg m−3 over aweak secular trend (Figure 3A, Table 1); however, we derivemuch slower rates of expansion than previously reported.Reprocessing and subsequent lowering of blue water chl aconcentrations in the early SeaWiFS record (https://oceancolor.gsfc.nasa.gov/reprocessing/r2014/seawifs/) may be one reasonfor this discrepancy in expansion rate (2–1.1%). However, the chla algorithm used (a decline of 1.1–0.7% year−1) and a data recordlength that could account for climate oscillations (a decline
from 0.7 to 0.4% year−1) may contribute to a greater extent.Nevertheless, the gyre as defined by dynamic topography alsoappears to be expanding, and relatedly, increasing the isolationof Station ALOHA. Physical gyre expansion was fastest prior to1998, but appeared to increase throughout the altimetry recordeven with adjustments made for steric sea level rise (e.g., Gille,2014). Note that surface topography in our analysis has not beencorrected for interannual variability in atmospheric pressure;for this reason our reported trends based on SSH must beviewed as preliminary. Finally, we see no secular trend, butstrong oscillations and correlation with both ENSO and PDOwere apparent with the extent of the multivariate subtropicalseascape (Figures 3C, 4C), where chl a dynamics may havebeen balanced in the classification by SST and spatial lightvariability. The latter result is in agreement with Behrenfeldet al. (2016), who found large oscillations in surface chl aconcentrations in the subtropical gyres after accounting for theeffect of photoacclimation.
After accounting for climate oscillations in the in situ datarecord at Station ALOHA, we observed that SST, salinity, andmixed layer depth (but only as defined by the surface offsetmethod) were weakly increasing over 1989–2016. Concomitantto geographic and physical trends, we also confirm the increaseof primary production, as well as phytoplankton standing stockderived from chl a in the euphotic zone, throughout the datarecord at Station ALOHA, as previously reported by Cornoet al. (2007) and Karl and Church (2017). It is unclear whetherlong-term trends in T chl a and NPP are associated withchanges in nutrient inputs (Luo et al., 2012; Letelier et al.,in preparation), community structure, and or increased efficiencyof photosynthesis, particularly in the DCM (Letelier et al.,2017).
While lags in how climate oscillations affect in situ conditionsat Station ALOHA relative to the rest of the gyre maysuggest better agreement with respect to expanding oligotrophy,the divergence of secular trends measured by satellite-basedgeography and in situ conditions at Station ALOHA point towardan alternative hypothesis. In situ PP in the surface appears tobe balanced by loss on diurnal time scales (White et al., 2017),allowing no accumulation of biomass through time. In ourstudy, we found that secular trends of phytoplankton appear tobe stronger in the deeper light-limited region of the euphoticzone, below the optical depth that satellites can see. IncreasedNPP in the DCM is correlated with greater abundances ofnanophytoplankton (White et al., 2015), which represent over40% of the particulate carbon (Barone et al., 2015). However, thedebate about what exactly 14 C incubations measure (NPP, grossPP or something in between, e.g., Marra, 2009) is exacerbatedwhen considering shifts in community structure, particularlytoward increased dominance by nano- and picophytoplankton.Species with relatively high ratios of respiration to photosynthesismay tend to substantially overestimate net primary production,perhaps because a substantial percentage of the carbon respiredby such species is old carbon (Pei and Laws, 2013). 14C alsooverestimates NPP at low growth rates, although the discrepancyis less in 12-h than in 24-h incubations (Pei and Laws, 2014).Certainly, careful intercomparison of incubation and bottle-free
Frontiers in Marine Science | www.frontiersin.org 11 April 2018 | Volume 5 | Article 130
Kavanaugh et al. Aloha From the Edge
methods (e.g., Quay et al., 2010; Juranek and Quay, 2013),optical assessments of size structure (White et al., 2015) andgross carbon accumulation (White et al., 2017) along with 1-Dmodeling (e.g., Luo et al., 2012) will be helpful to determinehow long-term changes in physical and chemical parametersare affecting the ecosystem structure and function at StationALOHA.
Our results also suggest that long-term satellite and 3-Dmodeling studies, particularly those that parameterize multiplespecies and currencies of production (e.g., Luo et al., 2012;Nicholson et al., 2014) are necessary to understand thespatial and temporal scales of physical forcing and ecologicalresponses in the NPSG. We note that, although the 30+year record may be sufficient to examine many oscillations, amodeling study determined that ∼40 years was necessary todetect secular trends in the subtropics (Henson et al., 2010).However, the relationships between the geographic indicatorsand conditions at Station ALOHA revealed in this studymay allow for future hypotheses to be tested, particularlythose that relate to the role of mesoscale variability inmodulating seasonal to interannual change and the role of StationALOHA as an early indicator of gyre responses to climateoscillations.
CONCLUSION
Through the lens of pelagic seascape ecology, we have quantifieddifferent geographic systems in the North Pacific that expandand contract on seasonal and interannual scales and haveembedded long-term Eulerian in situ observations from StationALOHA in a dynamic mosaic of the NPSG. Over a three-decade time-series, we were able to quantify subtle seculartrends and strong oscillations in gyre-scale geographic patternsand in situ conditions at Station ALOHA. Due to a longerdata record and improved sensitivity of satellite algorithmsto low-level chl a, we observe secular trends that are weakerthan previously reported, but evident in both physical andbiological definitions of the gyre, physical changes at StationALOHA, and changes in phytoplankton standing stock andNPP, primarily in the deeper euphotic zone. Finally, we observethat conditions at Station ALOHA shift analogously to stronginterannual oscillations in gyre-scale oligotrophy as defined bymultivariate seascapes, with shoaled mixed layer and declinesin phytoplankton biomass and production occurring with anexpanded subtropical seascape.
AUTHOR CONTRIBUTIONS
MK: Devised the original question with input from CD and RL,created the study design, and analyzed the data with input fromSD; MC and DK: Contributed data and historical context to themanuscript. All authors contributed to the writing and editing ofthe manuscript.
ACKNOWLEDGMENTS
We acknowledge support from the National Science Foundationthrough the Center for Microbial Oceanography: Researchand Education (C-MORE), an NSF Science and TechnologyCenter (EF-0424599), and the Hawaii Ocean Time-series (OCE-1260164; MC and DK), and the National Aeronautics andSpace Administration Ocean Biology and BiogeochemistryProgram (NASA NNX14AM36G, SD and MK) and theBiodiversity and Ecological Forecasting Program (NNX14AP62Aand 80NSSC18K0412, MK). Additional support was provided bythe Gordon and Betty Moore Foundation (#3794; DK) and theSimons Foundation’s SCOPE project (#329104 ; DK).
SUPPLEMENTARY MATERIAL
The Supplementary Material for this article can be foundonline at: https://www.frontiersin.org/articles/10.3389/fmars.2018.00130/full#supplementary-material
Figure S1 | Seascape determination of dynamic gyre geography. (A) Variance
explained by satellite and model seascapes and the percent of pixels that have the
same classification in space and time between satellite and modeled seascapes.
(B) Cross-correlation of model and satellite time series of subtropical seascape
expansion. (C) Cross-correlation of model and satellite time series of isolation of
Station ALOHA.
Figure S2 | Cross-correlation of MEI and PDO with NPGO.
Figure S3 | Cross-correlation of geographic indicators. (A) Areal extent of low
level chl a, extent defined by geostrophy, and isolation distance of Station ALOHA
in relation to variations in subtropical seascape extent. (B) Areal extent of low level
chl a, extent defined by geostrophy, and subtropical seascape extent in relation to
variations in the isolation distance of Station ALOHA within the subtropical
seascape.
Figure S4 | Cross correlation analysis of climate indices and in situ surface
properties at station ALOHA.
Table S1 | Trends of subtropical expansion across geographic metrics, chl a
algorithms, and time-series duration. Italicized values denote no significant trend
over the duration measured. The effect of climate oscillations has not been
removed.
REFERENCES
Anouar, F., Badran, F., and Thiria, S. (1998). Probabilistic self-organizing
map and radial basis function networks. Neurocomputing 20, 83–96.
doi: 10.1016/S0925-2312(98)00026-5
Barone, B., Bidigare, R. R., Church, M.J., Karl, D.M., Letelier, R.M., and White,
A.E. (2015). Particle distributions and dynamics in the euphotic zone of
the North Pacific Subtropical Gyre. J. Geophys. Res. Oceans 120, 3229–3247.
doi: 10.1002/2015JC010774
Behrenfeld, M. J., O’Malley, R. T., Boss, E. S., Westberry, T. K., Graff, J. R.,
Halsey, K. H., et al. (2016). Revaluating ocean warming impacts on global
phytoplankton. Nat. Clim. Chang. 6, 323–330. doi: 10.1038/nclimate2838
Behrenfeld, M. J., O’Malley, R., T., Siegel, D. A., McClain, C. R., Sarmiento, J. L.,
Feldman, G. C., et al. (2006). Climate-driven trends in contemporary ocean
productivity. Nature 444, 752–755. doi: 10.1038/nature05317
Bidigare, R. R., Benitez-Nelson, C., Leonard, C. L., Quay, P. D., Parsons, M. L.,
Foley, D. G., et al. (2003). Influence of a cyclonic eddy on microheterotroph
biomass and carbon export in the lee of Hawaii. Geophys. Res. Lett. 30:1318.
doi: 10.1029/2002GL01639
Boyce, D. G., Dowd, M., Lewis, M. R., and Worm, B. (2014). Estimating global
chlorophyll changes over the past century. Prog. Oceanogr. 122, 163–173.
doi: 10.1016/j.pocean.2014.01.004
Boyce, D. G., Lewis, M. R., and Worm, B. (2010). Global phytoplankton decline
over the past century. Nature, 466, 591–596. doi: 10.1038/nature09268
Frontiers in Marine Science | www.frontiersin.org 12 April 2018 | Volume 5 | Article 130
Kavanaugh et al. Aloha From the Edge
Boyce, D. G., Lewis, M. R., and Worm, B. (2011). Boyce et al. reply. Nature, 472,
E8–E9. doi: 10.1038/nature09953
Campbell, L., Liu, H., Nolla, H. A., and Vaulot, D. (1997). Annual variability of
phytoplankton and bacteria in the subtropical North Pacific Ocean at Station
ALOHA during the 1991–1994 ENSO event. Deep Sea Res. Part I Oceanogr.
Res. Pap. 44, 167–192. doi: 10.1016/S0967-0637(96)00102-1
Chai, F., Jiang, M., Barber, R., Dugdale, R., and Chao, Y. (2003). Interdecadal
variation of the transition zone chlorophyll front: a physical-biological
model simulation between 1960 and 1990. J. Oceanogr. 59, 461–475.
doi: 10.1023/A:1025540632491
Chavez, F. P., Messié, M., and Pennington, J. T. (2011).Marine primary production
in relation to climate variability and change. Ann. Rev. Mar. Sci. 3, 227–260.
doi: 10.1146/annurev.marine.010908.163917
Chelton, D. B., Schlax, M. G., and Samelson, R. M. (2011). Global
observations of nonlinear mesoscale eddies. Prog. Oceanogr. 91, 167–216.
doi: 10.1016/j.pocean.2011.01.002
Church, M. J., Mahaffey, C., Letelier, R. M., Lukas, R., Zehr, J. P., and Karl, D.
M. (2009). Physical forcing of nitrogen fixation and diazotroph community
structure in the North Pacific subtropical gyre. Glob. Biogeochem. Cycles
23:GB2020. doi: 10.1029/2008GB003418
Corno, G., Karl, D. M., Church, M. J., Letelier, R. M., Lukas, R., Bidigare,
R. R., et al. (2007). Impact of climate forcing on ecosystem processes in
the North Pacific Subtropical Gyre. J. Geophys. Res. Oceans 112:C04021.
doi: 10.1029/2006JC003730
Di Lorenzo, E., Schneider, N., Cobb, K., M., Franks, P. J. S., Chhak, K., Miller, A. J.,
et al. (2008). North Pacific Gyre Oscillation links ocean climate and ecosystem
change. Geophys. Res. Lett. 35:L08607. doi: 10.1029/2007GL032838
Di Lorenzo, E., Fiechter, J., Schneider, N., Bracco, A., Miller, A. J., Franks, P. J. S.,
et al., (2009). Nutrient and salinity decadal variations in the central and eastern
North Pacific. Geophys. Res. Lett. 36:L14601. doi: 10.1029/2009GL038261
DiTullio, G. R., and Laws, E. A. (1991). Impact of an atmospheric-oceanic
disturbance on phytoplankton community dynamics in the North Pacific
Central Gyre. Deep Sea Res. Part A Oceanogr. Res. Pap. 38, 1305–1329.
doi: 10.1016/0198-0149(91)90029-F
Doney, S. C., Lima, I., Feely, R. A., Glover, D. M., Lindsay, K., Mahowald,
N., et al. (2009). Mechanisms governing interannual variability in upper-
ocean inorganic carbon system and air–sea CO2 fluxes: physical climate and
atmospheric dust. Deep Sea Res. Part II Top. Stud. Oceanogr. 56, 640–655.
doi: 10.1016/j.dsr2.2008.12.006
Dore, J. E., Lukas, R., Sadler, D. W., Church, M. J., and Karl, D. M.
(2009). Physical and biogeochemical modulation of ocean acidification in
the central North Pacific. Proc. Natl. Acad. Sci. U.S.A. 106, 12235–12240.
doi: 10.1073/pnas.0906044106
Emerson, S., Quay, P., Karl, D., Winn, C., Tupas, L., and Landry, M. (1997).
Experimental determination of the organic carbon flux from open-ocean
surface waters. Nature 389, 951–954. doi: 10.1038/40111
Fong, A. A., Karl, D. M., Lukas, R., Letelier, R. M., Zehr, J. P., and Church, M.
J. (2008). Nitrogen fixation in an anticyclonic eddy in the oligotrophic North
Pacific Ocean. ISME J. 2, 663–676. doi: 10.1038/ismej.2008.22
Franz, B. A. (2009). Methods for Assessing the Quality and Consistency of Ocean
Color Products.NASA Goddard Space Flight Center, Ocean Biology Processing
Group. Available online at: https://oceancolor.gsfc.nasa.gov/docs/methods/
sensor_analysis_methods/
Franz, B. A., Bailey, S. W., Werdell, P. J., and McClain, C. R. (2007). Sensor-
independent approach to the vicarious calibration of satellite ocean color
radiometry. Appl. Opt. 46:5068. doi: 10.1364/AO.46.005068
Gille, S. T. (2014). Meridional displacement of the Antarctic Circumpolar Current.
Phil. Trans. R. Soc. A 372:20130273. doi: 10.1098/rsta.2013.0273
Glover, D.M., Jenkins, W.J., and Doney, S.C. (2011).Modeling Methods for Marine
Science. Cambridge: Cambridge University Press.
Guidi, L., Calil, P. H., Duhamel, S., Björkman, K. M., Doney, S. C., Jackson, G.
A., et al. (2012). Does eddy-eddy interaction control surface phytoplankton
distribution and carbon export in the North Pacific Subtropical Gyre?
J. Geophys. Res. 117:G02024. doi: 10.1029/2012JG001984
Hammond, M. L., Beaulieu, C., Sahu, S. K., and Henson, S. A. (2017),
Assessing trends and uncertainties in satellite-era ocean chlorophyll
using space-time modeling. Glob. Biogeochem. Cycles 31, 1103–1117.
doi: 10.1002/2016GB005600
Henson, S. A., Sarmiento, J. L., Dunne, J. P., Bopp, L., Lima, I., Doney, S.
C., et al. (2010). Detection of anthropogenic climate change in satellite
records of ocean chlorophyll and productivity. Biogeosciences 7, 621–640.
doi: 10.5194/bg-7-621-2010
Hu, C., Lee, Z., and Franz, B. (2012). Chlorophyll a algorithms for oligotrophic
oceans: a novel approach based on three-band reflectance difference. J. Geophys.
Res. Oceans 117:C01011. doi: 10.1029/2011JC007395
Irwin, A. J., and Oliver, M. J. (2009). Are ocean deserts getting larger?Geophys. Res.
Lett. 36:L18609. doi: 10.1029/2009GL039883
Juranek, L. W., and Quay, P. D. (2013). Using triple isotopes of dissolved
oxygen to evaluate global marine productivity. Ann. Rev. Mar. Sci. 5, 503–524.
doi: 10.1146/annurev-marine-121211-172430
Karl, D. M. (2010). Oceanic ecosystem time-series programs: ten lessons learned.
Oceanography 23, 104–125. doi: 10.5670/oceanog.2010.27
Karl, D. M., Bidigare, R. R., and Letelier, R. M. (2001). Long-term changes
in plankton community structure and productivity in the North Pacific
Subtropical Gyre: the domain shift hypothesis. Deep Sea Res. Part
II Top. Stud. Oceanogr. 48, 1449–1470. doi: 10.1016/S0967-0645(00)
00149-1
Karl, D. M., and Church, M. J. (2017). Ecosystem structure and dynamics in the
North Pacific Subtropical Gyre: new views of an old ocean. Ecosystems 20,
433–457. doi: 10.1007/s10021-017-0117-0
Karl, D. M., Letelier, R., Hebel, D., Tupas, L., Dore, J., Christian, J., et al. (1995).
Ecosystem changes in the North Pacific subtropical gyre attributed to the
1991-92 El Niño. Nature 373, 230–234. doi: 10.1038/373230a0
Karl, D. M., and Lukas, R. (1996). The Hawaii Ocean Time-series (HOT) program:
background, rationale and field implementation. Deep Sea Res. Part II Top.
Stud. Oceanogr. 43, 129–156. doi: 10.1016/0967-0645(96)00005-7
Kavanaugh, M.T., Emerson, S. R., Lockwood, D. M., Quay, P.D., and Letelier,
R. M. (2014a). Physicochemical and biological controls on primary and net
community production across NE Pacific seascapes. Limnol. Oceanogr. 59,
2013–2027. doi: 10.4319/lo.2014.59.6.2013
Kavanaugh, M. T., Hales, B., Saraceno, M., Spitz, Y. H., White, A. E., and Letelier,
R. M. (2014b). Hierarchical and dynamic seascapes: a quantitative framework
for scaling pelagic biogeochemistry and ecology. Prog. Oceanogr. 120, 291–304.
doi: 10.1016/j.pocean.2013.10.013
Kavanaugh, M. T., Oliver, M., Chavez, F., Letelier, R. M., Muller-Karger,
F., and Doney, S. C. (2016). Seascapes as a new vernacular for ocean
monitoring, management and conservation. ICES J. Mar. Sci. 73, 1839–1850.
doi: 10.1093/icesjms/fsw086
Letelier, R. M., Bidigare, R. R., Hebel, D. V., Ondrusek, M., Winn, C. D.,
and Karl, D. M. (1993). Temporal variability of phytoplankton community
structure based on pigment analysis. Limnol. Oceanogr. 38, 1420–1437.
doi: 10.4319/lo.1993.38.7.1420
Letelier, R. M., Dore, J. E., Winn, C. D., and Karl, D. M. (1996). Seasonal
and interannual variations in photosynthetic carbon assimilation at Station
ALOHA. Deep Sea Res. Part II Top. Stud. Oceanogr. 43, 467–490.
doi: 10.1016/0967-0645(96)00006-9
Letelier, R. M., Karl, D. M., Abbott, M. R., Flament, P., Freilich, M., Lukas, R., et al.
(2000). Role of late winter mesoscale events in the biogeochemical variability of
the upper water column of the North Pacific Subtropical Gyre. J. Geophys. Res.
Oceans 105, 28723–28739. doi: 10.1029/1999JC000306
Letelier, R. M., White, A. E., Bidigare, R. R., Barone, B., Church, M. J., and Karl, D.
M. (2017). Light absorption by phytoplankton in the North Pacific Subtropical
Gyre. Limnol. Oceanogr.62, 1526–1540. doi: 10.1002/lno.10515
Levitus, S., Antonov, J. I., Boyer, T. P., Baranova, O. K., Garcia, H. E.,
Locarnini, R. A., et al. (2012). World ocean heat content and thermosteric
sea level change (0–2000m), 1955–2010. Geophys. Res. Lett. 39:L10603.
doi: 10.1029/2012GL051106
Li, B., Karl, D. M., Letelier, R. M., and Church, M. J. (2011). Size-dependent
photosynthetic variability in the North Pacific Subtropical Gyre. Mar. Ecol.
Prog. Ser. 440, 27–40. doi: 10.3354/meps09345
Lomas, M. W., Steinberg, D. K., Dickey, T., Carlson, C. A., Nelson, N. B., Condon,
R. H., et al. (2010). Increased ocean carbon export in the Sargasso Sea linked
to climate variability is countered by its enhanced mesopelagic attenuation.
Biogeosciences 7, 57–70, doi: 10.5194/bg-7-57-2010
Luo, Y.-W., Ducklow, H. W., Friedrichs, M. A. M., Church, M. J. Karl, D. M.,
and Doney, S. C. (2012). Interannual variability of primary production and
Frontiers in Marine Science | www.frontiersin.org 13 April 2018 | Volume 5 | Article 130
Kavanaugh et al. Aloha From the Edge
dissolved organic nitrogen storage in the North Pacific Subtropical Gyre.
J. Geophys Res. 117:G03019. doi: 10.1029/2011JG001830
Mantua, N. J., Hare, S. R., Zhang, Y., Wallace, J. M., and Francis, R. C.
(1997). A Pacific interdecadal climate oscillation with impacts on salmon
production. Bull. Am. Meteorol. Soc. 78, 1069–1079. doi: 10.1175/1520-
0477(1997)078<1069:APICOW>2.0.CO;2
Marra, J. (2009). Net and gross productivity: weighing in with 14C. Aquat.
Microbial. Ecol. 56, 123–131. doi: 10.3354/ame01306
Martin, J. H., Knauer, G. A., Karl, D. M., and Broenkow, W.W. (1987). VERTEX:
carbon cycling in the northeast Pacific.Deep Sea Res. Part A Oceanogr. Res. Pap.
34, 267–285. doi: 10.1016/0198-0149(87)90086-0
McCune, B., Grace, J. B., and Urban, D. L. (2002). Analysis of Ecological
Communities Vol. 28. Gleneden Beach, OR: MjM software design.
McQuatters-Gollop, A., Reid, P. C., Edwards, M., Burkill, P. H., Castellani, C.,
Batten, S., et al. (2011). Is there a decline in marine phytoplankton?Nature 472,
E6–E7. doi: 10.1038/nature09950
Messié, M. and Chavez, F. P. (2011). Global modes of sea surface temperature
variability in relation to regional climate indices. J. Climate 24, 4313–4330.
doi: 10.1175/2011JCLI3941.1
Moore, J. K., Lindsay, K., Doney, S. C., Long, M. C., and Misumi, K.
(2013). Marine ecosystem dynamics and biogeochemical cycling in the
Community Earth System Model CESM1(BGC). Clim. J. 26, 9291–9321.
doi: 10.1175/JCLI-D-12-00566.1
Nicholson, D., Stanley, R. H. and Doney, S. C. (2014). The triple oxygen isotope
tracer of primary productivity in a dynamic ocean model. Glob. Biogeochem.
Cycles 28, 538–552. doi: 10.1002/2013GB004704
Oliver, M. J., and Irwin, A. J. (2008). Objective global ocean biogeographic
provinces. Geophys. Res. Lett. 35:L15601. doi: 10.1029/2008GL034238
Pei, S., and Laws, E. A. (2013). Does the 14 C method estimate net
photosynthesis? Implications from batch and continuous culture studies of
marine phytoplankton. Deep Sea Res. Part I Oceanogr. Res. Pap. 82, 1–9.
doi: 10.1016/j.dsr.2013.07.011
Pei, S., and Laws, E. A. (2014). Does the 14 C method estimate net photosynthesis?
II. Implications from cyclostat studies of marine phytoplankton. Deep Sea Res.
Part I Oceanogr. Res. Pap. 91, 94–100. doi: 10.1016/j.dsr.2014.05.015
Polovina, J. J., Howell, E. A., and Abecassis, M. (2008). Ocean’s least
productive waters are expanding. Geophys. Res. Lett. 35:L03618.
doi: 10.1029/2007GL031745
Quay, P. D., Peacock, C., Björkman, K., and Karl, D. M. (2010). Measuring primary
production rates in the ocean: Enigmatic results between incubation and non-
incubationmethods at Station ALOHA, Global Biogeochem.Cycles 24:GB3014.
doi: 10.1029/2009GB003665
Saba, V. S., Friedrichs, M. A. M., Carr, M.-E., Antoine, D., Armstrong, R. A.,
Asanuma, I., (2010). Challenges of modeling depth-integrated marine primary
productivity over multiple decades : a case study at BATS and HOT. Glob.
Biogeochem. Cycles. 24:GB3020. doi: 10.1029/2009GB003655
Sakamoto, C.M., Karl, D.M., Jannasch, H.W., Bidigare, R. R., Letelier, R.M.,Walz,
P. M., et al. (2004). Influence of Rossby waves on nutrient dynamics and the
plankton community structure in the North Pacific subtropical gyre. J. Geophys.
Res. Oceans 109:C05032. doi: 10.1029/2003JC001976
Siegel, D.A., Behrenfeld, M. J., Maritorena, S., McClain, C. R., Antoine, D.,
Bailey, S. W., et al. (2013). Regional to global assessments of phytoplankton
dynamics from the SeaWiFS mission. Remote Sens. Environ. 135, 77–91.
doi: 10.1016/j.rse.2013.03.025
Signorini, S. R., Franz, B. A., and McClain, C. R. (2015). Chlorophyll variability in
the oligotrophic gyres: mechanisms, seasonality and trends. Front. Mar. Sci. 2:1.
doi: 10.3389/fmars.2015.00001
Signorini, S. R., and McClain, C. R. (2012). Subtropical gyre variability as seen
from satellites. Remote Sens. Lett. 3, 471–479. doi: 10.1080/01431161.2011.
625053
Sverdrup, H. U., Johnson, M. W., and Fleming, R. H. (1942). The Oceans, Their
Physics, Chemistry, and General Biology. Vol. 1087. New York, NY: Prentice-
Hall.
Vaillancourt, R. D., Marra, J., Seki, M. P., Parsons, M. L., and Bidigare, R.
R. (2003). Impact of a cyclonic eddy on phytoplankton community
structure and photosynthetic competency in the subtropical North
Pacific Ocean. Deep Sea Res. Part I Oceanogr. Res. Pap. 50, 829–847.
doi: 10.1016/S0967-0637(03)00059-1
Venrick, E. L. (1995). “Scales of variability in a stable environment: phytoplankton
in the central North Pacific,” in Ecological Time Series. eds T. M. Powell and J.
H. Steele(Boston, MA: Springer).
Venrick, E. L., McGowan, J. A., Cayan, D. R., and Hayward, T. L. (1987). Climate
and chlorophyll a: long-term trends in the central North Pacific Ocean. Science
238, 70–72. doi: 10.1126/science.238.4823.70
Ward, J. (1963). Hierarchical grouping to optimize an objective function. J. Am.
Stat. Assoc. 58, 236–244. doi: 10.1080/01621459.1963.10500845
White, A. E., Barone, B., Letelier, R. M., and Karl, D. M. (2017).
Productivity diagnosed from the diel cycle of particulate carbon in
the North Pacific Subtropical Gyre. Geophys. Res. Lett. 44, 3752–3760.
doi: 10.1002/2016GL071607
White, A. E., Letelier, R. M., Whitmire, A. L., Barone, B., Bidigare, R. R., Church,
M. J., et al. (2015). Phenology of particle size distributions and primary
productivity in the North Pacific subtropical gyre (Station ALOHA). J. Geophys.
Res. Oceans 120, 7381–7399. doi: 10.1002/2015JC010897
Wilson, C., and Adamec, D. (2001). Correlations between surface chlorophyll
and sea surface height in the tropical Pacific during the 1997–1999 El
Niño-Southern Oscillation event. J. Geophys. Res. Oceans 106, 31175–31188.
doi: 10.1029/2000JC000724
Winn, C. D., Campbell, L., Christian, J. R., Letelier, R. M., Hebel, D. V., Dore,
J. E., et al. (1993). Seasonal variability in the phytoplankton community of
the North Pacific Subtropical Gyre. Glob. Biogeochem. Cycles 9, 605–620.
doi: 10.1029/95GB02149
Wright, S. W., Jeffrey, S. W., Mantoura, R. F. C., Llewellyn, C. A., Bjørnland, T.,
and Repeta, D. (1991). Improved HPLCmethod for the analysis of chlorophylls
and carotenoids from marine phytoplankton. Mar. Ecol. Prog. Ser. 77,
183–196.
Wolter, K., and Timlin, M. S. (1993). “Monitoring ENSO in COADS with a
seasonally adjusted principal component index,” in Proceedings of the17th
Climate Diagnostics Workshop, Vol. 5257 (Norman, OK).
Zhang, Y., Wallace, J. M., and Battisti, D. S. (1997). ENSO-
like interdecadal variability: 1900–93. J. Clim. 10, 1004–1020.
doi: 10.1175/1520-0442(1997)010<1004:ELIV>2.0.CO;2
Conflict of Interest Statement: The authors declare that the research was
conducted in the absence of any commercial or financial relationships that could
be construed as a potential conflict of interest.
Copyright © 2018 Kavanaugh, Church, Davis, Karl, Letelier and Doney. This is an
open-access article distributed under the terms of the Creative Commons Attribution
License (CC BY). The use, distribution or reproduction in other forums is permitted,
provided the original author(s) and the copyright owner are credited and that the
original publication in this journal is cited, in accordance with accepted academic
practice. No use, distribution or reproduction is permitted which does not comply
with these terms.
Frontiers in Marine Science | www.frontiersin.org 14 April 2018 | Volume 5 | Article 130