Embed Size (px)
Citation preview
1CALIFORNIA ALMOND YIELD FORECASTING TOOL
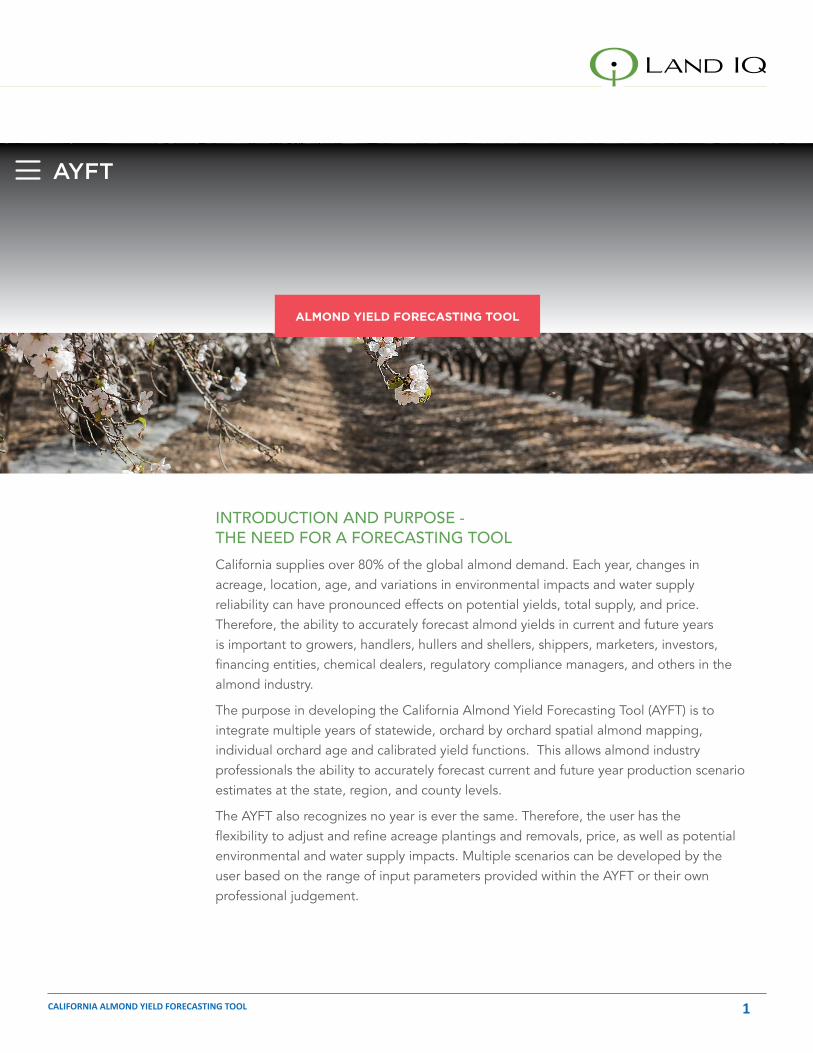
INTRODUCTION AND PURPOSE - THE NEED FOR A FORECASTING TOOLCalifornia supplies over 80% of the global almond demand. Each year, changes in acreage, location, age, and variations in environmental impacts and water supply reliability can have pronounced effects on potential yields, total supply, and price. Therefore, the ability to accurately forecast almond yields in current and future years is important to growers, handlers, hullers and shellers, shippers, marketers, investors, financing entities, chemical dealers, regulatory compliance managers, and others in the almond industry.
The purpose in developing the California Almond Yield Forecasting Tool (AYFT) is to integrate multiple years of statewide, orchard by orchard spatial almond mapping, individual orchard age and calibrated yield functions. This allows almond industry professionals the ability to accurately forecast current and future year production scenario estimates at the state, region, and county levels.
The AYFT also recognizes no year is ever the same. Therefore, the user has the flexibility to adjust and refine acreage plantings and removals, price, as well as potential environmental and water supply impacts. Multiple scenarios can be developed by the user based on the range of input parameters provided within the AYFT or their own professional judgement.
ALMOND YIELD FORECASTING TOOL
AYFT
Accuracies & Acceptance
Forecasting MethodsLocationAcreageAgeYield
Forecasting In Five Steps1 Plantings2 Removals3 Price4 Environmental Impacts5 Water Supply Impacts
Output Results
Accessing AYFT
2CALIFORNIA ALMOND YIELD FORECASTING TOOL 2CALIFORNIA ALMOND YIELD FORECASTING TOOL
ACCURACY, INDUSTRY ACCEPTANCE, AND COMMITMENT – TRUSTING THE RESULTSThe foundation of any reliable almond yield forecasting effort requires three key components:
1. assessing the location, acreage, and age of each individual orchard
2. developing accurate, location-specific yield production functions
3. possessing the ability to adjust results due to positive or negative production impacts
Land IQ is a specialized agricultural science and remote sensing firm that pairs scientific knowledge of agronomic systems with advanced remote sensing technologies, custom modeling, and analytical methods to map agricultural land use crop conditions in California and the western United States. Since 2010, Land IQ has been mapping almonds throughout California with increased accuracies each year:
• Acreage: Approaching 99% accuracy
• Age: Greater than 95% accuracy at +/- 1 year
• Field Delineations: Positional accuracies of each field edge are +/- 6 feet at a confidence interval of 95%
• Yield Relationship: Vary by less than 2% when comparing actual versus predicted yields for nearly a decade
The spatial analysis results developed by Land IQ for almonds are considered by many in the industry to be the most accurate and timely information available. This information has been vetted and is used by the Almond Board of California, the State of California, the United States Department of Agriculture, researchers, and industry professionals.
It is our commitment at Land IQ to continue to provide this critical and highly accurate decision-making information on an ongoing basis. The user of the AYFT can be assured that the underlying data are the most accurate, trusted, and timely information available.
METHODS - HOW ALMOND YIELDS ARE FORECASTEDThe foundational components of accurately estimating almond yields consist of comprehensively understanding and precisely quantifying statewide individual orchard:
• Location
• Acreage
• Age
• Yield
Accuracies & Acceptance
Forecasting MethodsLocationAcreageAgeYield
Forecasting In Five Steps1 Plantings2 Removals3 Price4 Environmental Impacts5 Water Supply Impacts
Output Results
Accessing AYFT
3CALIFORNIA ALMOND YIELD FORECASTING TOOL 3CALIFORNIA ALMOND YIELD FORECASTING TOOL
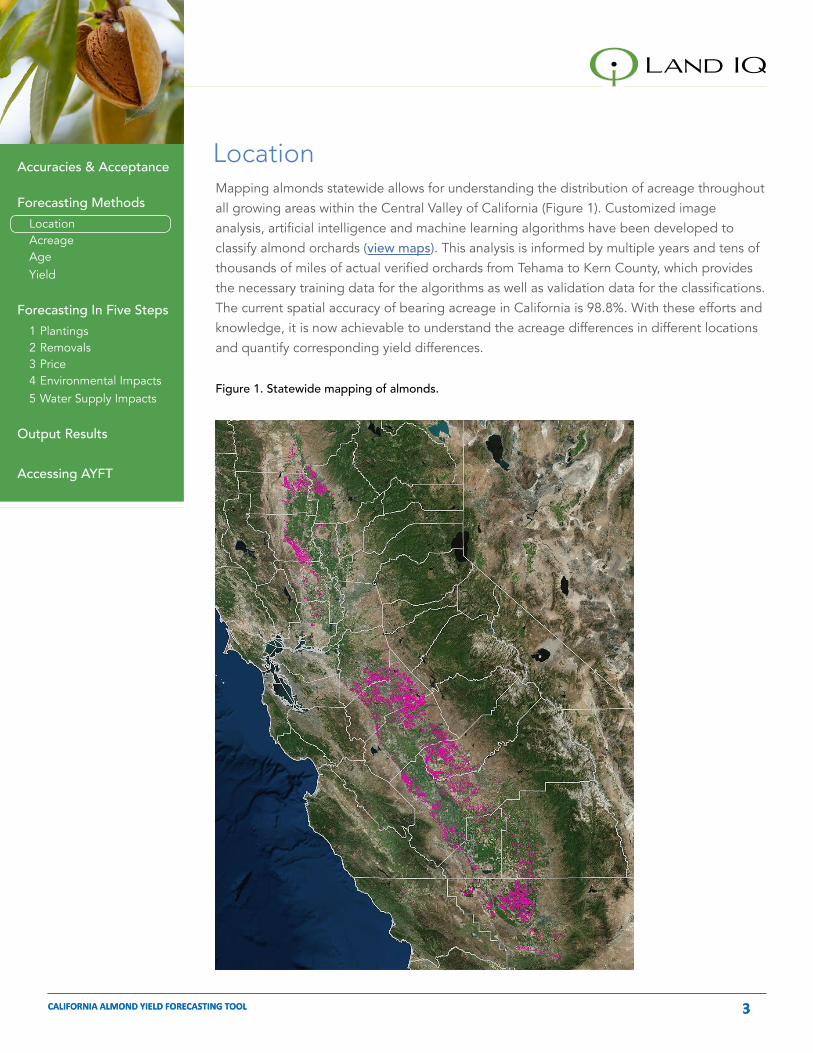
Mapping almonds statewide allows for understanding the distribution of acreage throughout all growing areas within the Central Valley of California (Figure 1). Customized image analysis, artificial intelligence and machine learning algorithms have been developed to classify almond orchards (view maps). This analysis is informed by multiple years and tens of thousands of miles of actual verified orchards from Tehama to Kern County, which provides the necessary training data for the algorithms as well as validation data for the classifications. The current spatial accuracy of bearing acreage in California is 98.8%. With these efforts and knowledge, it is now achievable to understand the acreage differences in different locations and quantify corresponding yield differences.
Figure 1. Statewide mapping of almonds.
Location

Accuracies & Acceptance
Forecasting MethodsLocationAcreageAgeYield
Forecasting In Five Steps1 Plantings2 Removals3 Price4 Environmental Impacts5 Water Supply Impacts
Output Results
Accessing AYFT
4CALIFORNIA ALMOND YIELD FORECASTING TOOL 4CALIFORNIA ALMOND YIELD FORECASTING TOOL
Since 2010, Land IQ has been mapping the actual irrigated area of every individual almond orchard within the state of California (Figure 2). Irrigated field boundary positional accuracies are +/- 6 feet at a 95% confidence interval. Bearing almond orchards (2 acres and larger) are now mapped every year.
Figure 2. Example of individual orchard mapping of irrigated area only.
Acreage

Accuracies & Acceptance
Forecasting MethodsLocationAcreageAgeYield
Forecasting In Five Steps1 Plantings2 Removals3 Price4 Environmental Impacts5 Water Supply Impacts
Output Results
Accessing AYFT
5CALIFORNIA ALMOND YIELD FORECASTING TOOL 5CALIFORNIA ALMOND YIELD FORECASTING TOOL
Each mapping year, Land IQ not only maps all almond orchards within the state, but also applies a separate algorithm to quantify the age of each individual orchard (Figure 3). The accuracy of this estimate is greater than 95% at +/- 1 year (view maps). This information is used in the AYFT to account for yield differences according to orchard age.
Figure 3. Age classification of individual orchards.
Age
Accuracies & Acceptance
Forecasting MethodsLocationAcreageAgeYield
Forecasting In Five Steps1 Plantings2 Removals3 Price4 Environmental Impacts5 Water Supply Impacts
Output Results
Accessing AYFT
6CALIFORNIA ALMOND YIELD FORECASTING TOOL 6CALIFORNIA ALMOND YIELD FORECASTING TOOL
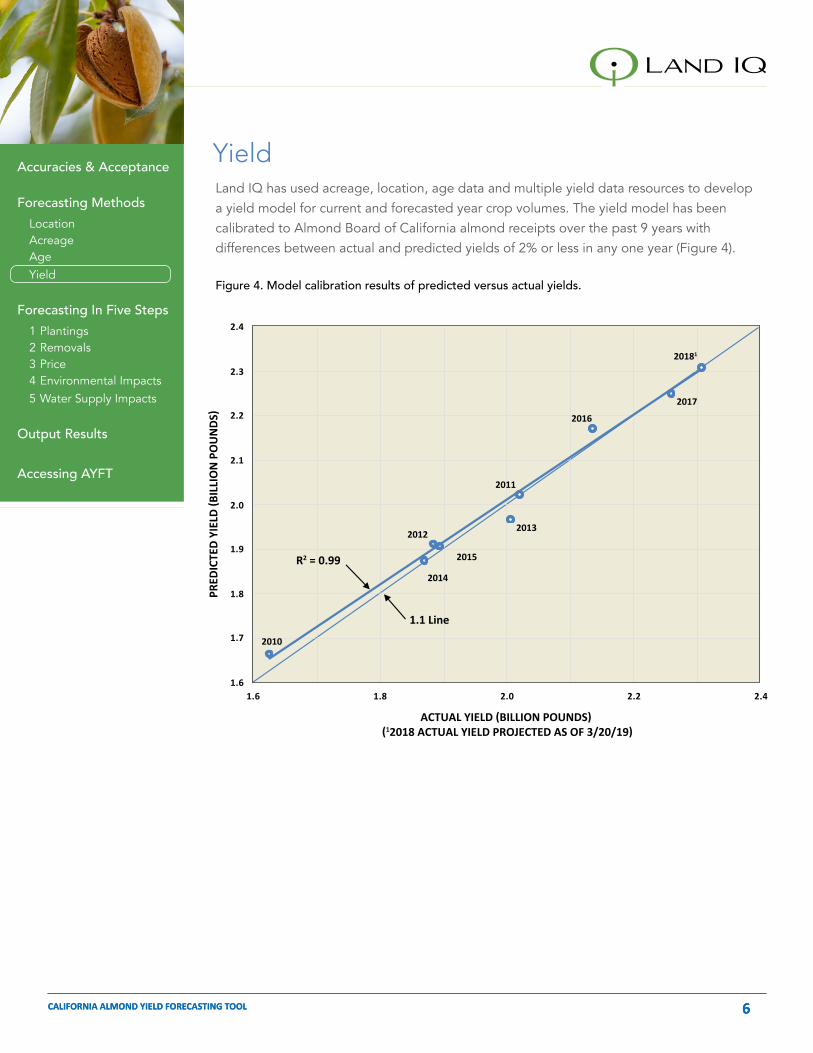
R2 = 0.99
1.6
1.7
1.8
1.9
2.0
2.1
2.2
2.3
2.4
1.6 1.8 2.0 2.2 2.4
PRED
ICTE
D Y
IELD
(BIL
LIO
N P
OU
ND
S)
ACTUAL YIELD (BILLION POUNDS) (12018 ACTUAL YIELD PROJECTED AS OF 3/20/19)
2015
2010
2013
2011
2012
2014
2016
2017
20181
1.1 Line
Land IQ has used acreage, location, age data and multiple yield data resources to develop a yield model for current and forecasted year crop volumes. The yield model has been calibrated to Almond Board of California almond receipts over the past 9 years with differences between actual and predicted yields of 2% or less in any one year (Figure 4).
Figure 4. Model calibration results of predicted versus actual yields.
Yield
Accuracies & Acceptance
Forecasting MethodsLocationAcreageAgeYield
Forecasting In Five Steps1 Plantings2 Removals3 Price4 Environmental Impacts5 Water Supply Impacts
Output Results
Accessing AYFT
7CALIFORNIA ALMOND YIELD FORECASTING TOOL 7CALIFORNIA ALMOND YIELD FORECASTING TOOL
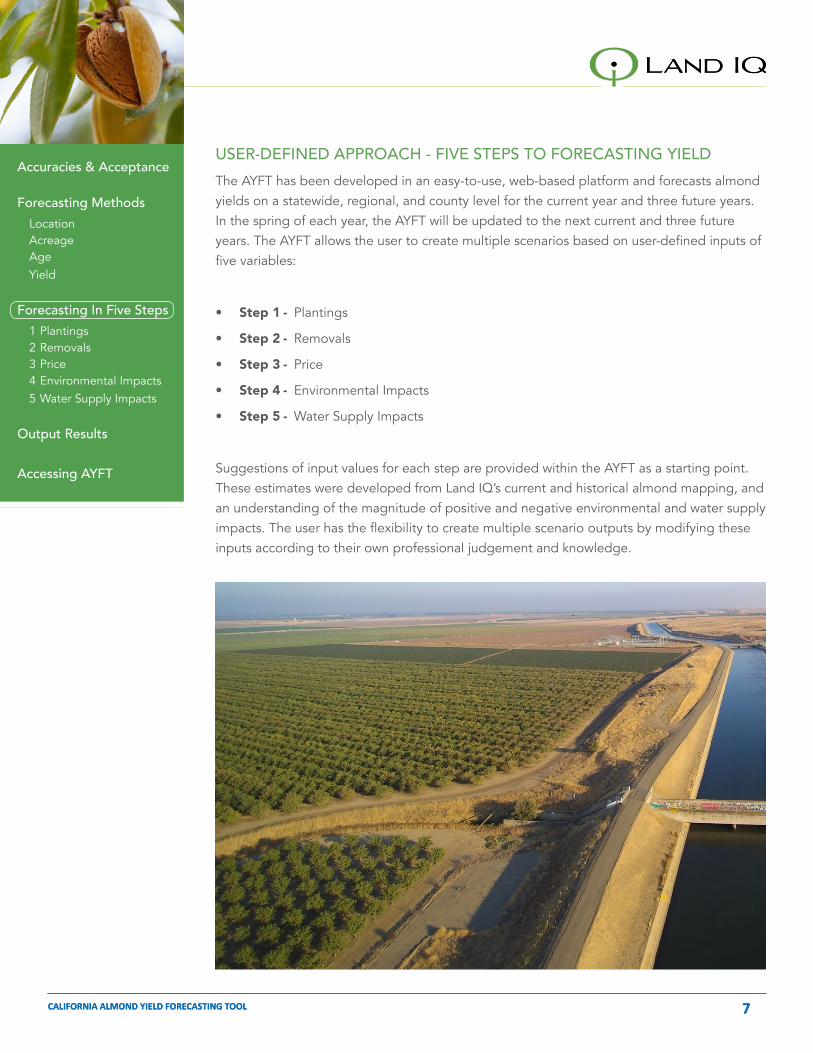
USER-DEFINED APPROACH - FIVE STEPS TO FORECASTING YIELDThe AYFT has been developed in an easy-to-use, web-based platform and forecasts almond yields on a statewide, regional, and county level for the current year and three future years. In the spring of each year, the AYFT will be updated to the next current and three future years. The AYFT allows the user to create multiple scenarios based on user-defined inputs of five variables:
• Step 1 - Plantings
• Step 2 - Removals
• Step 3 - Price
• Step 4 - Environmental Impacts
• Step 5 - Water Supply Impacts
Suggestions of input values for each step are provided within the AYFT as a starting point. These estimates were developed from Land IQ’s current and historical almond mapping, and an understanding of the magnitude of positive and negative environmental and water supply impacts. The user has the flexibility to create multiple scenario outputs by modifying these inputs according to their own professional judgement and knowledge.
Accuracies & Acceptance
Forecasting MethodsLocationAcreageAgeYield
Forecasting In Five Steps1 Plantings2 Removals3 Price4 Environmental Impacts5 Water Supply Impacts
Output Results
Accessing AYFT
8CALIFORNIA ALMOND YIELD FORECASTING TOOL 8CALIFORNIA ALMOND YIELD FORECASTING TOOL
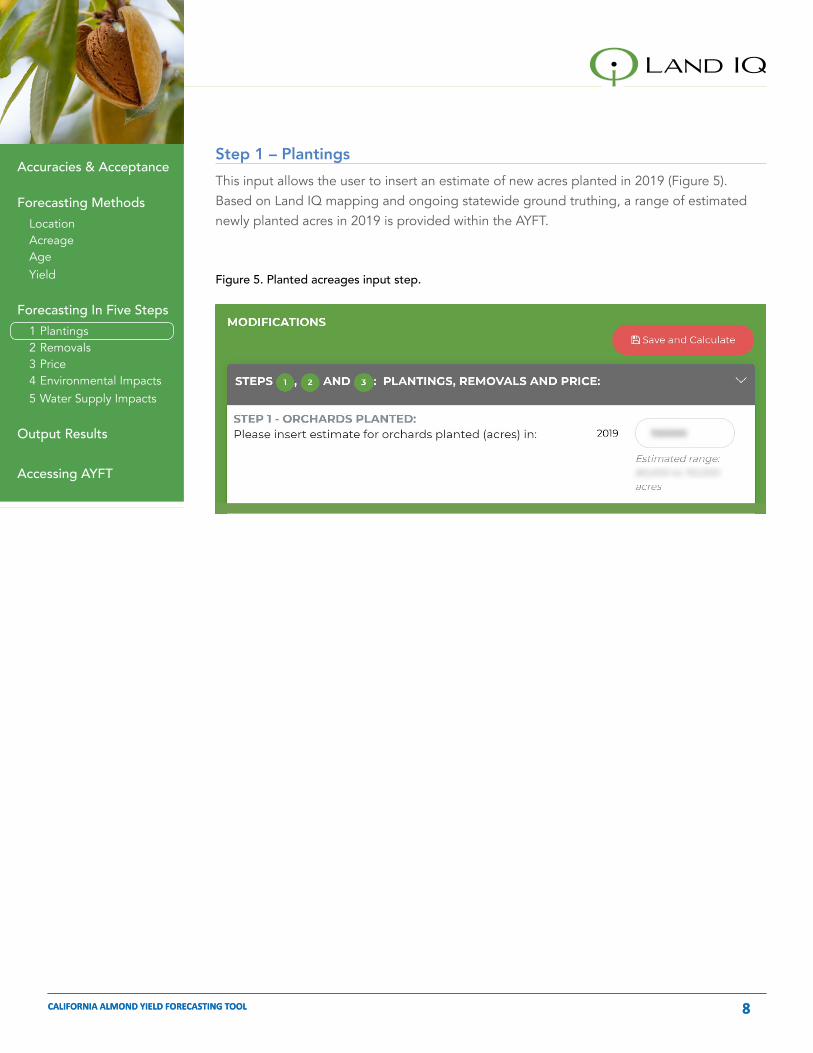
Step 1 – Plantings This input allows the user to insert an estimate of new acres planted in 2019 (Figure 5). Based on Land IQ mapping and ongoing statewide ground truthing, a range of estimated newly planted acres in 2019 is provided within the AYFT.
Figure 5. Planted acreages input step.

Accuracies & Acceptance
Forecasting MethodsLocationAcreageAgeYield
Forecasting In Five Steps1 Plantings2 Removals3 Price4 Environmental Impacts5 Water Supply Impacts
Output Results
Accessing AYFT
9CALIFORNIA ALMOND YIELD FORECASTING TOOL 9CALIFORNIA ALMOND YIELD FORECASTING TOOL
Step 2 – Removals This input allows the user to insert an estimate of orchards removed in 2019, 2020, 2021 and 2022 (Figure 6). A range of removal acreage for each year is provided within the AYFT based on Land IQ mapping and projections.
Figure 6. Removed acreages input step.
Accuracies & Acceptance
Forecasting MethodsLocationAcreageAgeYield
Forecasting In Five Steps1 Plantings2 Removals3 Price4 Environmental Impacts5 Water Supply Impacts
Output Results
Accessing AYFT
10CALIFORNIA ALMOND YIELD FORECASTING TOOL 10CALIFORNIA ALMOND YIELD FORECASTING TOOL
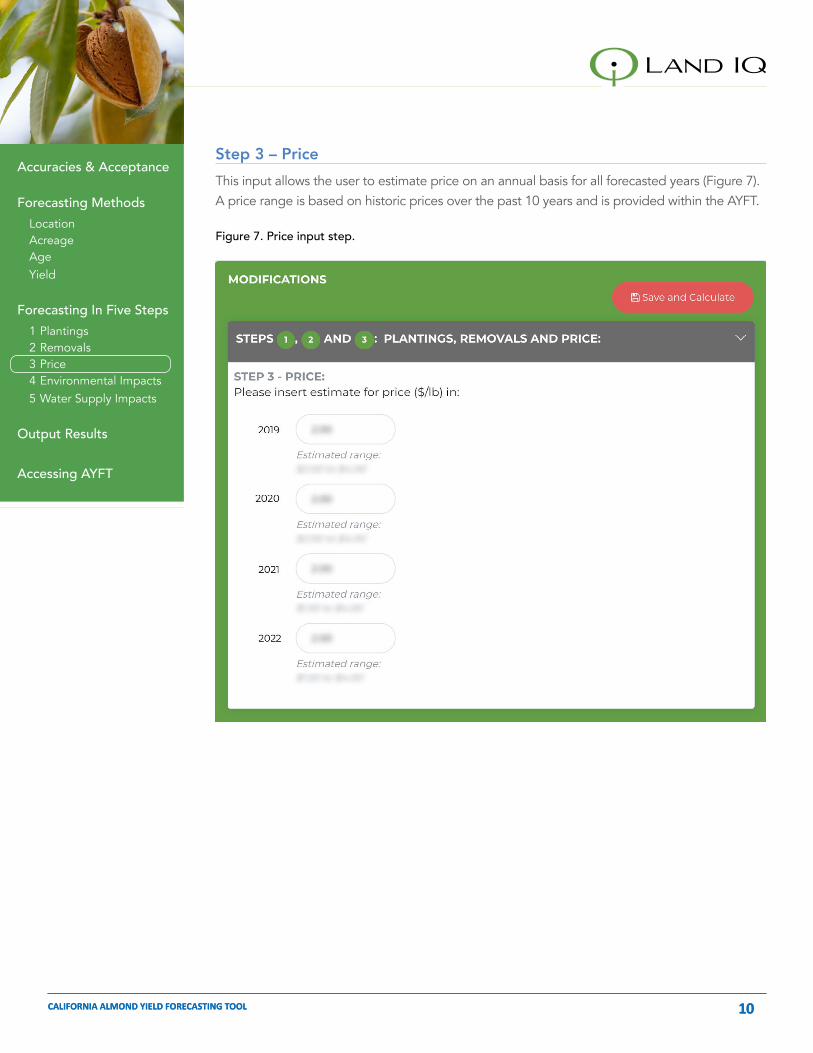
Step 3 – PriceThis input allows the user to estimate price on an annual basis for all forecasted years (Figure 7). A price range is based on historic prices over the past 10 years and is provided within the AYFT.
Figure 7. Price input step.
Accuracies & Acceptance
Forecasting MethodsLocationAcreageAgeYield
Forecasting In Five Steps1 Plantings2 Removals3 Price4 Environmental Impacts5 Water Supply Impacts
Output Results
Accessing AYFT
11CALIFORNIA ALMOND YIELD FORECASTING TOOL 11CALIFORNIA ALMOND YIELD FORECASTING TOOL
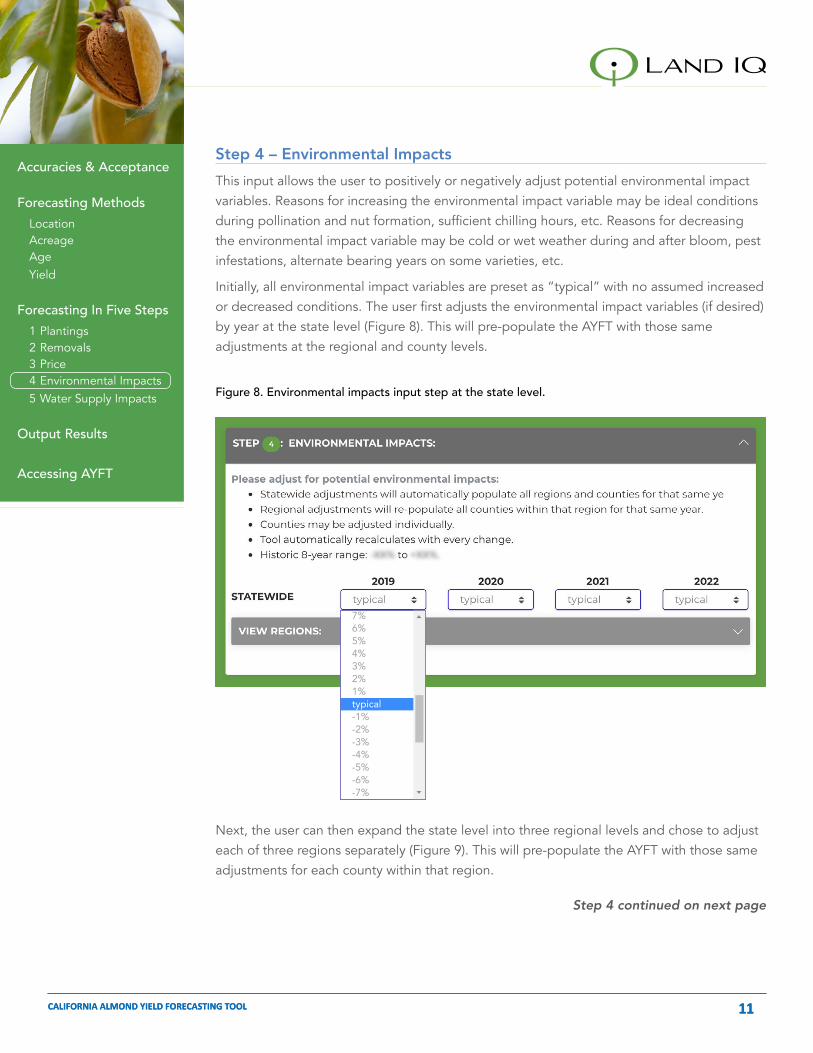
Step 4 – Environmental ImpactsThis input allows the user to positively or negatively adjust potential environmental impact variables. Reasons for increasing the environmental impact variable may be ideal conditions during pollination and nut formation, sufficient chilling hours, etc. Reasons for decreasing the environmental impact variable may be cold or wet weather during and after bloom, pest infestations, alternate bearing years on some varieties, etc.
Initially, all environmental impact variables are preset as “typical” with no assumed increased or decreased conditions. The user first adjusts the environmental impact variables (if desired) by year at the state level (Figure 8). This will pre-populate the AYFT with those same adjustments at the regional and county levels.
Step 4 continued on next page
Figure 8. Environmental impacts input step at the state level.
7%6%5%4%3%2%1%typical-1%-2%-3%-4%-5%-6%-7%
Next, the user can then expand the state level into three regional levels and chose to adjust each of three regions separately (Figure 9). This will pre-populate the AYFT with those same adjustments for each county within that region.
Accuracies & Acceptance
Forecasting MethodsLocationAcreageAgeYield
Forecasting In Five Steps1 Plantings2 Removals3 Price4 Environmental Impacts5 Water Supply Impacts
Output Results
Accessing AYFT
12CALIFORNIA ALMOND YIELD FORECASTING TOOL 12CALIFORNIA ALMOND YIELD FORECASTING TOOL
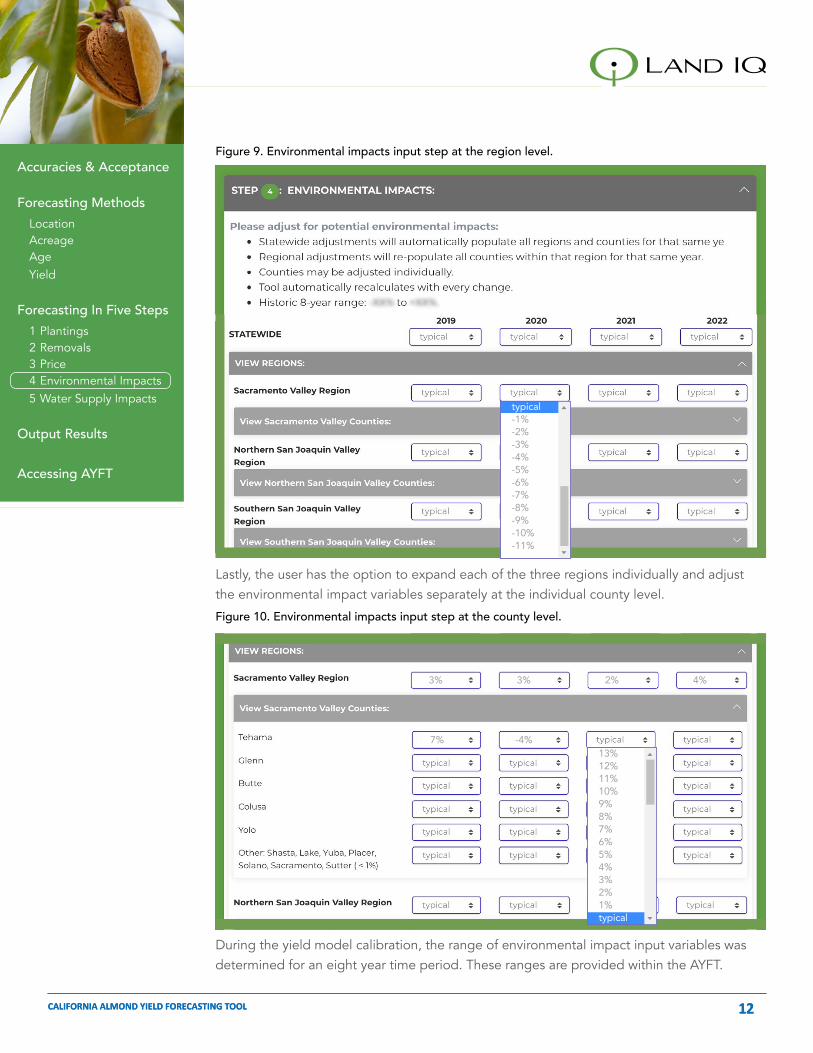
Figure 9. Environmental impacts input step at the region level.
Lastly, the user has the option to expand each of the three regions individually and adjust the environmental impact variables separately at the individual county level.
During the yield model calibration, the range of environmental impact input variables was determined for an eight year time period. These ranges are provided within the AYFT.
Figure 10. Environmental impacts input step at the county level.
13%12%11%10%9%8%7%6%5%4%3%2%1%typical
7%
3% 3% 2% 4%
-4%
typical-1%-2%-3%-4%-5%-6%-7%-8%-9%-10%-11%

Accuracies & Acceptance
Forecasting MethodsLocationAcreageAgeYield
Forecasting In Five Steps1 Plantings2 Removals3 Price4 Environmental Impacts5 Water Supply Impacts
Output Results
Accessing AYFT
13CALIFORNIA ALMOND YIELD FORECASTING TOOL 13CALIFORNIA ALMOND YIELD FORECASTING TOOL
Figure 11. Water supply impacts input step at the state, region, and county levels.
Step 5 – Water Supply ImpactsThe Water Supply Impacts input data step functions identically in format to the Environmental Impacts input step at the state, region, and county levels (Figure 11). The initial default “typical” year assumes no positive or negative water supply impacts. Some examples of water supply impacts may include full water supply or drought, implementation of Sustainable Groundwater Management Act in some areas and not others, and differing annual water allocations from the State and Federal water projects.
During the yield model calibration, the range of water supply impact input variables was determined for an eight year time period. These ranges are provided within the AYFT.
6%
-3% -2% 3% -3%
-1%San Joaquin
Stanislaus
Merced
Madera
Other: Contra Costa, Calaveras (<1%)
Northern San Joaquin Valley Region
View Northern San Joaquin Valley Counties:
Southern San Joaquin Valley Region
7%6%5%4%3%2%1%typical-1%-2%-3%-4%-5%-6%-7%

Accuracies & Acceptance
Forecasting MethodsLocationAcreageAgeYield
Forecasting In Five Steps1 Plantings2 Removals3 Price4 Environmental Impacts5 Water Supply Impacts
Output Results
Accessing AYFT
14CALIFORNIA ALMOND YIELD FORECASTING TOOL 14CALIFORNIA ALMOND YIELD FORECASTING TOOL
Results – Yield & Price Outputs The structure of the AYFT allows for continued development of multiple scenarios with the confidence that the background data are the most accurate and timely available. As any user-defined change in input values for any of the five steps occurs, the AYFT automatically updates the yield projections. The results are clearly provided in numerical format at all times for the current and future three years at the statewide, regional, and county levels (Figure 12).
Figure 12. Example of results output at state, region, and county levels.

Accuracies & Acceptance
Forecasting MethodsLocationAcreageAgeYield
Forecasting In Five Steps1 Plantings2 Removals3 Price4 Environmental Impacts5 Water Supply Impacts
Output Results
Accessing AYFT
15CALIFORNIA ALMOND YIELD FORECASTING TOOL 15CALIFORNIA ALMOND YIELD FORECASTING TOOL
The AYFT is privately licensed and access is based on an annual subscription and agreement basis. Access will be provided once payment is received and an End User License Agreement is signed.
To access the AYFT, please contact:
Casey Gudel, MS
530.514.2562
Joel Kimmelshue, PhD
916.517.2482