Embed Size (px)
Citation preview

ALMA MATER STUDIORUM UNIVERSITÀ DI BOLOGNA
SCUOLA DI SCIENZE
Corso di Laurea specialistica in Biologia Marina
Outdoor production of Isochrysis galbana (T-iso) in
industrial scale photobioreactors and modelling of its
photosynthesis and respiration rate
Tesi di laurea in Dinamica del fitoplancton
Relatore: Presentata da:
Prof. Rossella Pistocchi Davide Ippoliti
Correlatore:
Prof. Francisco Gabriel Acién Fernández
II sessione
Anno Accademico 2014/2015

2
1. INTRODUCTION ...................................................................... 3
1.1. Microalgae ............................................................................ 3
1.2. Mass cultivation of microalgae ............................................. 5
1.3. Microalgae for Aquaculture ................................................ 11
1.4. Isochrysis galbana (T-iso) production and models ............ 13
2. OBJECTIVES ........................................................................... 16
3. MATERIALS AND METHODS ............................................. 17
3.1. Microorganisms and culture conditions .............................. 17
3.2. Laboratory photobioreactors ............................................... 18
3.3. Outdoor photobioreactors ................................................... 19
3.4. Measurement of photosynthesis and respiration rate .......... 23
3.5. Biomass concentration, fluorescence of chlorophylls and biochemical composition ............................................................. 26
3.6. Light utilization by the cultures .......................................... 27
3.7. Software and statistical analysis ......................................... 28
4. RESULTS AND DISCUSSIONS ............................................. 29
4.1. Photosynthesis and respiration rate models ........................ 29
4.2. Application of the photosynthesis rate model to industrial-scale T-PBRs ............................................................................... 44
4.3. Outdoor production of Isochrysis galbana (T-iso) ............. 49
5. CONCLUSIONS ...................................................................... 62
6. ACKNOWLEDGEMENTS ...................................................... 63
7. REFERENCES ......................................................................... 64

3
1. INTRODUCTION
1.1. Microalgae
Algae are primarily oxygen-releasing photosynthetic organisms
with simple body plans having no roots, stems, or leaves. They are
mostly aquatic organisms and they can be found attached to a
substrate like plants, some are motile like animals, some are simply
suspended in water, some grow loosely on soil, trees, and animals,
and some form symbiotic relationships with other organisms. They
do not belong to a single monophyletic group and therefore cannot
be easily defined. The internal cell structure and morphology of
algae is vey various. Eukaryotic algal cells are characterized by a
nucleus and usually one or more chloroplasts, mitochondria, Golgi
bodies, endoplasmic reticulum, and other typical eukaryotic
organelles (Richmond and Hu, 2013). Numerous books, scientific
journals, and internet websites are dedicated exclusively to
compiling our knowledge of algae. Nevertheless, it is still difficult
to give a precise and clear definition for “algae” (Lee, 2008;
Graham et al., 2009). Microalgae are unicellular species, and they
can be found individually, or in colonies (in chains or groups).
Some species are very small, and their sizes can range from a few
micrometers (µm) to some hundreds of micrometers.
Microalgae have a long evolutionary history that has determined the
presence of organisms with very diversified characteristics. For this
they have different shapes and colours. This morphological
variation exists not only among species but also among different
life stages of the same species (Richmond and Hu, 2013). They
appear in different forms as amoeboid, palmelloid, coccoid,
4
filamentous, flagellate, and sarcinoid. Large biomolecules are
classified into broad major groups: carbohydrates, lipids, nucleic
acids, and proteins. These groups are similar to those found in other
living organisms, but the algae provide an exceptional diversity of
biomolecules (Richmond and Hu, 2013). In recent years
commercial companies have shown interest in this diversity, and
today algae are grown for the express purpose of harvesting these
compounds. There are extensive publications on algal biochemistry,
and the precise biochemical product can be manipulated to some
degree by altering the growth conditions (Hu, 2004; Beer et al.,
2009). The diversity of algae is amazing at several levels. Species
diversity is measured by the number of described species and there
is general agreement that many species have not yet been described
(Andersen, 1992; Norton et al., 1996). Algal diversity can be
measured according to different purposes of study: biochemical
pathways, ecological roles, endosymbiotic genomes, morphology,
and reproductive strategies. The recent discovery of cryptic
endosymbiotic genomes is significant, for example, predominately
green algal genes in diatoms (Moustafa et al., 2009). Endosymbiotic
events, and even horizontal gene transfers, have been major genetic
mixing pots that have shuffled genomes, created gene duplications,
and allowed for gene replacements. These have contributed
significantly to algal diversity at all levels. (Richmond and Hu,
2013)
Despite their diversity, microalgae are specially adapted to an
aquatic environment. They are mainly photosynthetic organisms,
and therefore necessary for life on earth. Recent studies show they
produce approximately half of the atmospheric oxygen and use

5
simultaneously the greenhouse gas carbon dioxide to grow
photoautotrophically (Falkowski e Raven, 2007). Microalgae
perform the primary production and they are also at the base of the
food web and provide energy for all the trophic levels above.
1.2. Mass cultivation of microalgae
Over recent decades, interest in microalgae has grown enormously.
In particular, due to their biodiversity these organisms are used in
many sectors: the production of chemicals, dietary supplements,
and in the aquaculture sector (Muller-Feuga, 2013). Microalgae can
be also used in wastewater treatment and they have been proposed
as biofuels source to reduce global warming problem (Chisti 2007;
Benemann and Oswald 1996). Whatever the final application of
microalgae its production is based on the same principles as light
availability, sufficient mass and heat transfer and adequate control
of culture parameters (Acièn et al 2013). The present production of
microalgal biomass is low ( 9,000 t dry matter per year) but the
price of biomass is high (from 30 to 300 € kg-1), nevertheless the
size of these markets is growing considerably (Brennan and
Owende 2010). The biomass productivity of any microalgae culture
system is a function of environmental conditions and usually
geographical and climatic conditions in the selected location
determines overall year-round conditions such as solar radiation and
temperature (Incropera and Thomas 1978). To optimize the biomass
productivity, the microalgae are grown inside structures called
photobioreactors (PBR). Their design and orientation has to be
selected to maximize the amount of solar energy intercepted,

6
whereas the geometry of the reactor determines the distribution of
the intercepted radiation on the culture surface (Acien et al. 2001;
Sierra et al. 2008). Solar radiation on the reactor surface along with
biomass concentration determine the average irradiance inside the
culture, and consequently the growth rate and achievable biomass
productivity (Acièn et al. 2013). Light is the main factor that
influences photosynthesis and, therefore, the maximum productivity
can be achieved only with an adequate design of the reactor and of
its operation mode according to the light availability.
Currently, there are different types of photobioreactors which are
classified according either to their design or the best way to
accomplish microalgae growth requirements. The simplest and
cheapest are the open reactors. They have the advantage of high
solar radiation availability, low power consumption and sufficiently
low mass transfer cost, but have disadvantages related to an easy
contamination risk and a limited control of culture conditions
(Acièn et al. 2013). The most common are the raceways, and they
are typically used on a commercial scale for the cultivation of
microalgae and cyanobacteria, such as Arthrospira platensis and
Dunaliella salina, although low-scale production of other strains
has also been reported (Richmond and Cheng-Wu 2001; Jiménez et
al. 2003; Moreno et al. 2003; Moheimani and Borowitzka 2007;
Radmann et al. 2007).

7
Fig. 1 – Pre-industrial open raceways in the campus pilot plant. (University of Almeria)
In recent decades the closed photobioreactors have been developed.
Their advantage, as compared to open ponds or tanks, is that the
light path length is noticeably reduced leading to higher cell
densities, which diminishes the chance of contamination and
facilitates harvesting. Furthermore, cultures in closed PBRs do not
suffer from severe evaporative losses and temperature, pH changes
and growth conditions can be more easily controlled, therefore, it is
possible to improve the production and quality of the resulting
biomass and to reduce the production costs (Norsker et al. 2011;
Acién et al. 2013).
The most widely used closed system is the tubular photobioreactor.
It consists of a solar collector tubing through which the culture
flows, recirculated by aeration or mechanical pumps. To remove

8
oxygen, the culture is passed through a bubble column or tank,
where air is supplied to avoid the achievement of damaging
(dissolved) oxygen levels. In this bubble column, air can be
supplied but also CO2 can be injected for carbonation, and a heat
exchanger can be included for temperature control (Acièn et al
2013). The helical tubular system is laid vertically as an
arrangement of transparent, coiled polyethylene tubes arranged
around an open circular framework (Watanabe et al. 1995; Zhu and
Jiang 2008). In these structures the presence of the tubes causes
reciprocal shading. This variable, in addition to the tube diameter,
determines the solar radiation availability for this type of
photobioreactor.
The main disadvantage of these reactors is the power consumption
necessary to recirculate the liquid in the tubular loop. Nevertheless
they allow the production of a wide variety of microalgae strains
compared to the other systems.

9
Fig. 2 – Pre-industrial tubular photobioreactors in the campus pilot plant. (University of Almeria)
Another type of closed photobioreactor is the flat panel. It consists
of joined transparent plates to store the culture, where the culture is
illuminated from one or both sides and stirred by aeration. Flat
panels are promising although currently show different problems:
fouling, maintenance work, and unavailability of suitable
machinery for process automation.

10
Fig. 3 – Flat panel in the campus pilot plant. (University of Almeria) In addition, different reactors can be used at the same time in the
called hybrid systems to improve the entire system: for example the
use of closed photobioreactors to maintain and produce inoculum
for large open reactors. Whatever the photobioreactor design their
productivity is severely limited by the amount of energy received
from the sun (Acién et al. 2012).
11
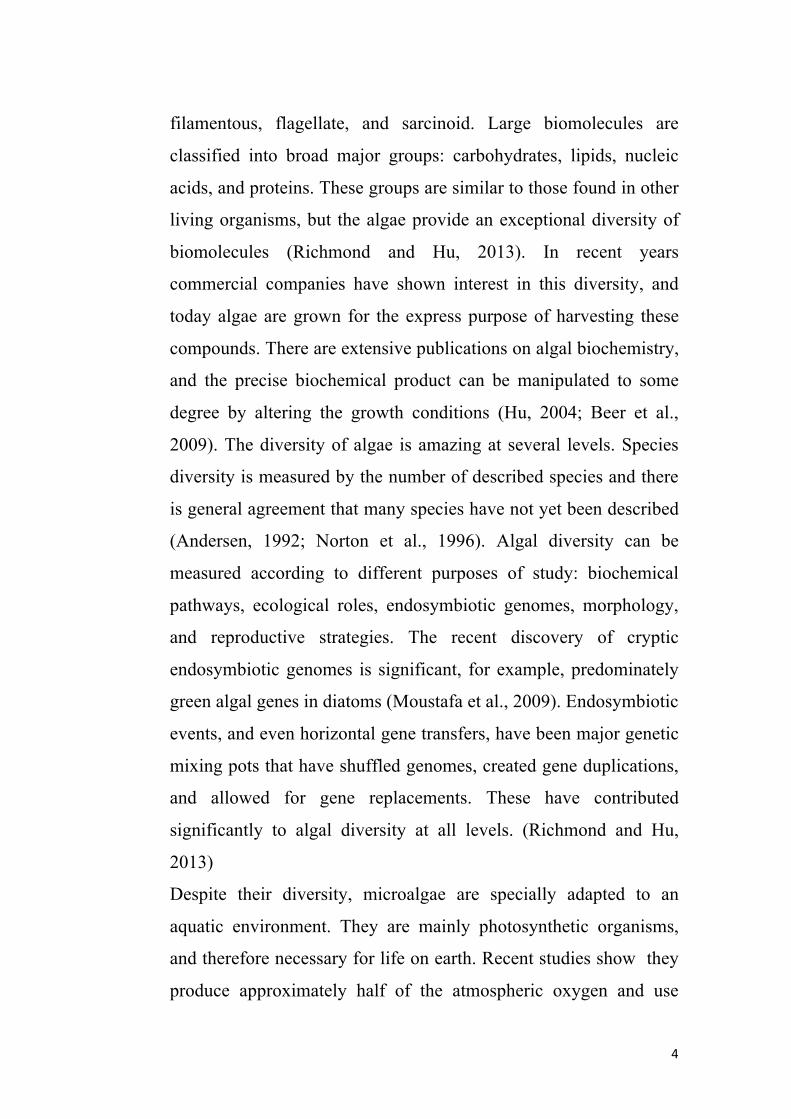
1.3. Microalgae for Aquaculture
With an expanding aquaculture industry, the demand for live
microalgae is also increasing.
Fig. 4 – The state of world fisheries and aqualculture. (FAO 2014)
For this reason the demand of oil and proteins to prepare feeds is
increasing and, at the same time, that of live microalgae required
for early larvae stages development. Therefore, their use as food in
aquaculture remains the major reason for their production (Brown
et al., 1997; Pulz and Gross, 2004). Microalgae are an essential
food source in the rearing of many species, especially the larvae and
spat of bivalve molluscs, penaeid prawn larvae and live food
organisms such as rotifers which, in turn, are used to rear the larvae
of marine finfish and crustaceans. The importance of algae in
aquaculture is not surprising as algae are the natural food source of
these animals (Borowitzka and Siva, 2007). There are two main
sources of algal species used in aquaculture. These are: natural

12
populations of phytoplankton, either as they are found in nature or
from cultures enriched by adding nutrients; and unialgal cultures.
Unialgal cultures are fundamental when a high quality feed source
with known nutritional properties is required. Bacteria-free algal
cultures also reduce the risk of introducing unwanted pathogens
into the animal cultures which can result in mortality of some of the
animals cultured. In recent years extensive studies have been
undertaken to determine the nutritional requirements of the target
species and the biochemical composition of algae which possibly
can be used as a food source (de Roeck-Holtzhauer et al., 1993;
Brown and Farmer, 1994). Filtering mollusks consuming natural
phytoplankton represented 18% of total aquaculture production
(Richmond and Hu, 2013). Using microalgae, these animal
productions are completely sustainable. Traditional microalgae
production in aquaculture represents one of the main problems in
the development of a number of processes due to the typically low
productivity and poor quality of the resulting biomass, along with
contamination and high production costs (Muller-Feuga, 2013;
Boeing, 2000). The microalgal production systems used by fish
farmers are normally simple and traditional with few, if any, control
systems, but this is expensive and leads to variable microalgal
biochemical composition. Optimization of microalgal culture
conditions is therefore necessary to reduce production costs and
meet the demand of hatchery managers for an easy, cheap and
reliable method of producing microalgae of high nutritional value
(Coutteau and Sorgeloos, 1992). Continuous and semicontinuous
culture is an attractive alternative to batch production.

13
1.4. Isochrysis galbana (T-iso) production and models
Several strains belonging to the genus Isochrysis
(Prymnesiophyceae) are among the most widely used microalgae in
aquaculture. Isochrysis aff. galbana Green ‘Tahiti’ (T-iso) is one of
most commonly used strains because of its biochemical profile
(fatty acids, ascorbic acid, etc.) (Muller-Feuga, 2013). T-iso is
supposed to be an excellent candidate for mass culture because of
its ability to adapt to a wide range of temperatures and photon flux
densities (Saoudi-Helis et al., 1994; Marchetti et al., 2012).
Fig. 5 - Sample of Isochrysis galbana in the pre-industrial tubular.
photobioreactors (Estación Experimental Las Palmerillas, Almeria)
However very few references are reported about the outdoor
production of this strain, the commercial production of this strain
being much lower than others as Nannochloropsis or Tetraselmis
also used as feed for early larvae stages.
Whatever the reactor and the microalgae used, outdoor
photobioreactors are subject to daily variations in culture

14
parameters that influence their overall yield (Camacho et al., 1999;
van Bergeijk et al., 2010; Mendoza et al., 2013; Fernández et al.,
2014). In order to adequately design outdoor photobioreactors, it is
necessary to know the influence of culture conditions on the
photosynthesis rate as a primary step in determining the biomass
productivity of any photosynthetic system. The utilization of
average variable values, whether daily or weekly, only provides
partial information. Greater accuracy can be obtained by using
instantaneous variable values, and models which take into account
the rapid response of microalgae cells to culture condition
variations (Costache et al., 2013). There are already publications on
models that describe the photosynthetic response to environmental
changes under nutrient-unlimited culture conditions such as
irradiation, temperature, pH and dissolved oxygen. The
photosynthesis rate has been reported as increasing hyperbolically
with irradiance up to values above which it decreases due to
photoinhibition (Molina et al. 1996). Researchers have developed
several models on irradiation (Platt et al., 1980; Eilers and Peeters,
1988; Papadakis et al., 2005; Bernard and Rémond, 2012). Another
important factor influencing photosynthesis is temperature, and the
models produced up to now have been able to describe the most
optimal condition of growth and productivity (Bernard and
Rémond, 2012; Ras et al., 2013; Guedes et al., 2011; Perez et al.,
2008). Less information has been reported on the influence of pH or
dissolved oxygen on the microalgae photosynthesis rate. Large
variations in pH can reduce microorganism productivity (Camacho
et al., 1999; Ying et al., 2014; not et al., 2015); but these values
remain almost stable (7.5 - 8.0) in closed tubular photobioreactors
15
because of the on-demand injection of CO2. Conversely, in this type
of photobioreactor, the high concentration of dissolved oxygen can
increase considerably (Camacho et al., 1999; Acién et al., 2013).
Several studies reported dissolved oxygen concentrations as high as
500 %Sat. causing photosynthesis inhibition and eventually leading
to culture death (Weissman et al. 1988; Marquez et al. 1995; Singh
et al. 1995; Mendoza et al., 2013). In addition, it can be useful to
observe and to model the respiration trend to understand how, and
how much, this activity influences photosynthesis with accurate
values of net photosynthesis being obtained by adding the values
for oxygen consumed during the dark period to the oxygen
production during the light period.

16
2. OBJECTIVES
The objectives of this work were to study the influence of major
environmental parameters (irradiance, temperature, pH and
dissolved oxygen) on determining the net photosynthesis and the
respiration rates of Isochrysis galbana. The results were used to
develop an overall model that allows the simulation of the net
photosynthesis and respiration rates under different culture
conditions. The model was validated by experimental data assembly
obtained under different culture conditions to those tested.
Furthermore, the model was used to simulate the daily behaviour of
outdoor cultures performed in tubular photobioreactors, thus
verifying their validity. An other objective was to demonstrate the
feasibility of the outdoor production of this strain at industrial scale,
and to determine the optimal conditions to perform it. Experiments
were performed in continuous mode, modifying the dilution rate,
also monitoring the environmental conditions (solar irradiance,
temperature), and the culture parameters (dissolved oxygen,
temperature, pH). The biomass productivity and quality of biomass
produced was analysed as dependent variables, in addition to the
quantum yield and overall behaviour of the cultures. This research
represents a necessary step in the scale-up of whatever microalgae
production process, to prevent fails due to inadequate performance
of the strain at real scale/conditions.

17
3. MATERIALS AND METHODS
3.1. Microorganisms and culture conditions
The strain used, Isochrysis aff. galbana (T-Iso), was obtained from
the Universidad de Santiago de Compostela. Stock cultures were
maintained photoautotrophically in spherical flasks (1.0 l capacity)
using Algal medium (Bionova, Santiago de Compostela, Spain).
The inoculum was maintained with aeration and an on-demand CO2
supply under continuous illumination at 100 µE m−2 s−1, at 25 °C.
Fig. 6 – Inoculum of Isochrysis galbana (Estación Experimental Las
Palmerillas, Almeria)

18
For the experiments, the inoculum was transferred to laboratory-
scale tubular photobioreactors and to industrial-scale outdoor
tubular photobioreactors (T-PBRs). Details of the reactors used are
next provided.
3.2. Laboratory photobioreactors
To simulate the environmental conditions prevailing into the
cultures performed in outdoor T-PBRs, an indoor system simulating
outdoor conditions was developed. Thus, laboratory culture was
performed in a stirred tank reactor made with a section of the same
polymethylmethacrylate (PMMA) tube than that used in outdoor T-
PBRs (0.09 m diameter, 0.5 m high, 0.8 l capacity), obtained only
by covering one of the extremes. The reactor thus build-up was
inoculated with 20% of the volume of inoculum and completing
with fresh Algal medium. Then, it was operated in batch mode to
achieve a biomass concentration higher than 1.0 g/L, next being
operated in semicontinuous mode, by replacing 20% of the culture
volume daily with fresh medium, till the steady state is reached,
after 10 days. The reactor was magnetically stirred to simulate the
mixing existing in outdoor T-PBRs. Concerning illumination, the
reactor was illuminated artificially by one side simulating the solar
cycle, using four Philips PL-32 W/840/4p white-light lamps, with a
maximal irradiance of 1000 µE·m-2·s-1 (measured in the centre of
the reactor when empty). The light lamps used mainly provided
disperse radiation, but because lamps were only located in one side
of the reactor the light distribution approaches that found inside the

19
greenhouse where the outdoor T-PBRs are located. The pH was
controlled by on-demand injection of pure CO2 at pH 8.0. Whereas
the temperature was controlled by regulating the air temperature in
the chamber on which the reactor was located.
Fig. 7 – Cultivation of Isochrysis galbana in laboratory photobioreactors
(Estación Experimental Las Palmerillas, Almeria)
The culture temperature modifies along the day, ranging from 30°C
during the simulated noon to 25°C during the simulated night,
average daily temperature of the culture being 28±3ºC. On the
reactor the dissolved oxygen concentration was maintained lower
than 200 %Sat. by the on-demand injection of air into the reactors,
also to simulate the conditions prevailing in outdoor T-PBRs.
3.3. Outdoor photobioreactors
Outdoor cultures were performed in industrial T-PBRs of 3.0 m3
capacity. The microalgal production facility used is situated inside a
20
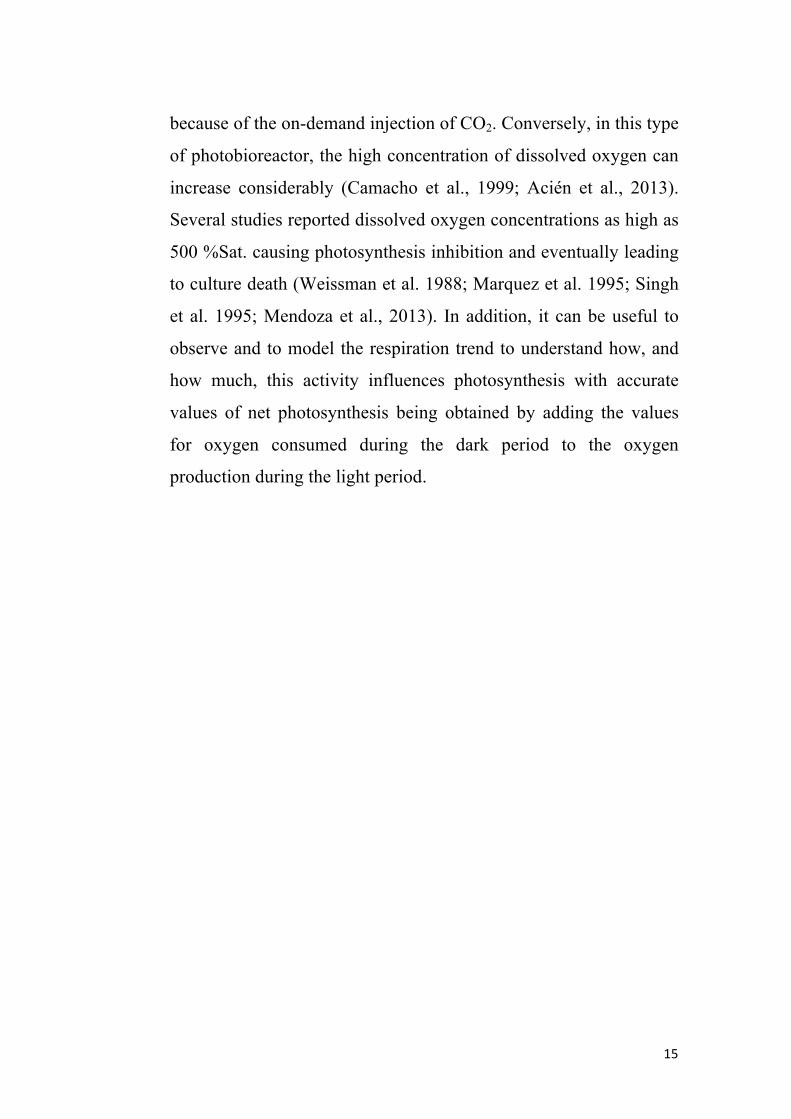
greenhouse at the “Estación Experimental Las Palmerillas”, which
belongs to Fundación CAJAMAR (Almería, Spain).
Fig. 8 – Greenhouses and laboratory owned by Fundación CAJAMAR
(Almería, Spain).
The facility consists of ten tubular fence-type photobioreactors built
as previously described (Fernández et al., 2014). Each
photobioreactor is made of a 400 m-long PMMA tube, 0.09 m in
diameter, with a bubble column (3.5 m high and 0.4 m in diameter)
for degassing and heat exchange.

21
Fig. 9 – Cultivation of Isochrysis galbana in outdoor photobioreactors.
(Estación Experimental Las Palmerillas, Almeria)
The pH, temperature and dissolved oxygen at the end of the loop
are measured using Crison probes (Crison Instruments, Spain),
connected to an MM44 control-transmitter unit (Crison Instruments,
Spain), in turn connected to a PC control unit, allowing complete
monitoring and control of the facility. Each reactor is bubbled at a
constant airflow rate of 200 l·min-1, whereas the pH is controlled by
on-demand injection of pure CO2 at 3 l·min-1. The culture
temperature is controlled by passing cooling water at 1500 l·h-1

22
(when needed - as determined by the computer control) through an
internal heat exchanger located in the bubble column of each
photobioreactor. The reactor was operated in continuous mode by
harvesting 20% of the culture volume daily, which was then
replaced by fresh medium. The culture medium was prepared online
using a fertigation unit with a 4 m3·h-1 capacity. The culture
medium was sterilized prior to introduction into the PBRs during
the daylight period. The pH, DO, temperature in each PBR, and
radiation inside the greenhouse and inside the laboratory were
recorded daily.
Fig. 10 - Schematic diagram of the production process for Isochrysis galbana
biomass using recycled culture medium in a closed circuit (J. Camacho-
Rodríguez et al. 2013)

23
The data capture system and control software (developed in
DaqFactory 5.0, Azeotech Inc.) controlled and monitored all
activities in the facility.
3.4. Measurement of photosynthesis and respiration
rate
Photosynthesis and respiration measurements were performed in a
specifically designed equipment, by measuring the variation of
dissolved oxygen concentration under controlled conditions.
Samples from steady-state culture on the laboratory photobioreactor
were taken and diluted to 0.15 g·l-1 to achieve a diluted culture. The
samples were placed in a 100 ml cylindrical stirred glass chamber
(0.04 m diameter, 0.10 m height), in which irradiance (QSL-1000,
Walz, Germany), temperature (pt-100), pH (Crison 5343,
Barcelona, Spain) and dissolved oxygen (Crison 5002, Barcelona,
Spain) probes were located. The irradiance sensor was located in
the centre of the glass chamber whereas the other sensors were
located close to the surface to avoid shadows into the system. To
illuminate the system two sets of four fluorescent lamps (Osram 80
W) were placed at right and left of the glass chamber, the intensity
of the lamps being automatically regulated to obtain the desired
irradiance inside the center of the chamber once the sample was
added.

24
Fig. 11 - Sample of Isochrysis galbana during the measurement of
photosynthesis and respiration rate. ((Estación Experimental Las Palmerillas,
Almeria)
Due to the utilization of diluted cultures, the both side illumination
and the short light path of the sample chamber used, the maximum
deviation of irradiance at which the cells were exposed to into the
system was 10%. Each sample was subjected to repeated 5 min
light-dark periods for a maximum of 30 min to measure and register
the variation of culture parameters (dissolved oxygen, pH and
temperature) under whichever conditions. The entire system was
computer controlled using DaqFactory software. Data allow us
confirming that during measurements no relevant variations of

25
temperature or pH took place, whereas dissolved oxygen variations
allowed calculating the photosynthesis and respiration rate. Gross
photosynthesis rate was calculated from slope of dissolved oxygen
accumulation during light period, whereas respiration rate was
calculated from slope of dissolved oxygen accumulation during
dark period, net photosynthesis rate being calculated as the sum of
both gross photosynthesis and respiration rate to include respiration
performed during light period. Three consecutive measurements
were performed to obtain mean values of photosynthesis and
respiration rates.
Photosynthesis and respiration rate of samples exposed to different
irradiancies inside the glass chamber were measured. Moreover
experiments were performed also modifying the pH of the samples.
To obtain this the pH of fresh medium used to dilute the sample
from the laboratory photobioreactor was adjusted by adding HCl or
NaOH, to desired value then the photosynthesis and respiration rate
of final diluted sample being measured. Concerning temperature a
similar strategy was used, the temperature being adjusted by using
cold or warm culture medium to dilute the sample. Finally
experiments were performed modifying the dissolved oxygen by
bubbling pure oxygen or pure nitrogen into the fresh medium
solution used to dilute the sample. For each measurement a new
sample from the laboratory photobioreactor in steady state was
used, to avoid accumulation of effects.

26
3.5. Biomass concentration, fluorescence of chlorophylls
and biochemical composition
Either for laboratory or outdoor cultures the microalgal biomass
concentration was measured by dry weight measurements. 50 mL
aliquots of the cell suspension were filtered through 0.7 µm
Millipore filter paper, washed with 30 mL of ammonium formate,
and the filters containing the algae were dried in an oven at 80°C
for 24 h.
The physiological status of the cells was determined by chlorophyll
fluorescence (Fv/Fm) using a fluorimeter (AquaPen-C AP-C 100;
Photon Systems Instruments, Czech Republic).
The biochemical composition of the biomass was determined after
collecting, centrifuging (Sigma Sartorius 4-15, Sartorius A.G.,
Germany) and freeze-drying (Telstar Cryodos 50, Telstar, Spain)
culture samples at the steady state of each experiment. The protein
content was determined following a modification of the Lowry
method (López et al., 2010). The total lipid content was quantified
using the method proposed by Kochert (1978). Total ash was
determined by incineration of a 0.5 g sample in an oven at 450ºC
for 48 h. Finally, carbohydrates were estimated as the difference
(out of a hundred) after subtracting the lipid, protein and ash
content. To avoid interferences due to ash content the biochemical
composition is expressed on ash free basis.

27
3.6. Light utilization by the cultures
The biomass extinction coefficient (Ka), was calculated from the
average absorption value in the visible range (400-700 nm),
measured in a double beam Helios Alpha spectrophotometer. The
extinction coefficient was calculated by dividing the average
absorption by the biomass concentration (Cb) and the cuvette light
path (p) (Equation 1).
Ka =Abs!""!!""C! · p
Equation 1
The average irradiance at which cells are exposed inside a culture
(Iav) is a function of irradiance in the absence of cells (Io), the
biomass extinction coefficient (Ka), the biomass concentration (Cb)
and the light path inside the reactor (p). It can be approximated
using Equation 2 (Molina et al. 1997).
Iav =I!
K!C! · p· 1 − exp −K!C! · p Equation 2
Quantum yield (ΨE) is defined in microalgal cultures as the amount
of biomass generated by the unit of radiation (usually a mole of
photons) absorbed by the culture. Since it represents the ratio
between the biomass generated and the absorbed photon flux, it can
be calculated using Equation 3 (Molina et al. 1997) as a function of
the volumetric biomass productivity (Pb) and the photon flux
absorbed in the volume unit (Fvol). The photon flux absorbed
through the reactor volume can be obtained from the average
irradiance (Iav) on a culture volume; this can be calculated using
Equation 4 (Molina et al. 1997).

28
𝛹! =P!F!"#
Equation 3
F!"# = Iav · K! · C! Equation 4
Photosynthetic efficiency was calculated as the ratio of energy
stored in the biomass produced to energy impinging on the reactor
surface (Equation 5). The combustion heat of the biomass (H) was
calculated considering the specific caloric value of the lipids (38.9
kJ/g), proteins (24 kJ/g) and carbohydrates (16.6 kJ/g), and by
knowing the biochemical composition of the biomass. This
equation uses the volume to surface ratio (V/S) of the reactor, and
the PAR to global ratio of light, which was 2 E·MJ-1.
𝑃𝐸 =P! · H · VI · S
Equation 5
3.7. Software and statistical analysis
DaqFactory (Azeotech, USA) was used to control the
photobioreactors. Statistical analysis of the data was carried out
using the Statgraphics Centurion XVI software package. Non-linear
regression was used to fit experimental data to the proposed models
and to determine characteristic parameter values. Linear regression
was used to evaluate the influence of the dilution rate relatively to
the variables studied. Microsoft Excel was used to perform
simulations using the developed models.

29
4. RESULTS AND DISCUSSIONS
4.1. Photosynthesis and respiration rate models
Microalgae productivity is influenced by various factors but under
unlimited nutrient conditions, the most important are irradiance,
temperature, pH and dissolved oxygen. To optimize the
productivity of whichever strain in real-scale reactors, the most
accurate method is to expose it to different conditions directly in
industrial-scale photobioreactors. However, this would require high
costs and a long time. Alternatively, the influence of these factors
can be studied in the laboratory simulating outdoor conditions to
develop models that must subsequently be verified outdoors; most
of these models analyse the production of oxygen (photosynthesis
and respiration) as the first step in the biomass production process
(Costache et al., 2013; Yun and Park, 2003; Vejrazka et al., 2013),
this was the method used in the present work. Therefore, to model
the response of Isochrysis galbana cells to environmental factors,
experiments were performed measuring the oxygen production rate
under light conditions and the respiration rate under dark
conditions, with controlled environmental variables. These
measurements allowed us to calculate the cells’ net photosynthesis
from the difference between these two measurements. Samples
were collected from laboratory cultures operated in indoor
continuous mode but simulating outdoor conditions to maximize the
applicability of the developed models. Thus, experimental values of
biomass concentration and productivity measured indoors were
close to those measured outdoors, ranging from 0.6 to 0.9 gbiomass·l-1

30
and from 0.2 to 0.3 gbiomass·l-1·day-1. These values are higher than
those previously reported for this strain under outdoor conditions -
being 0.075 g·l-1·day-1 in tubular photobioreactors (van Bergeijk,
Salas-Leiton and Cañavate, 2010) and 0.13 g·l-1·day-1 in flat panels
(Zhang and Richmond, 2003), thus verifying the adequacy of the
culture conditions. Moreover, this strategy validates the
experiments themselves and their applicability in simulating real
outdoor cultures.
Concerning irradiance, it was observed that the net photosynthesis
rate increased from zero at zero irradiance up to values of 565
mgO2·gbiomass·h-1 at an irradiance of 600 µE·m-2·s-1, then decreased
due to photo-inhibition to 394 mgO2·gbiomass·h-1 at an irradiance of
2000 µE·m-2·s-1 (Figure 12A). According to these data, the
photosynthesis rate is maximal at an irradiance ranging from 500 to
1000 µE·m-2·s-1. Furthermore, it is confirmed that this strain is less
tolerant to high irradiance than other commercial strains such as
Haematococcus pluvialis, Chlorella vulgaris and Scenedesmus
almeriensis (Costache et al., 2013; Yun and Park, 2003; Jeon, Cho
and Yun, 2006). Nevertheless, the maximum daily irradiance to
which the T-PBRs were exposed during this research (April to
June) ranged from 600 to 900 µE·m-2·s-1, within the experimentally-
determined optimal value range. Concerning respiration, at zero
irradiance the respiration rate was 37 mgO2·gbiomass·h-1, increasing
with irradiance up to 111 mgO2·gbiomass·h-1 at an irradiance of 400
µE·m-2·s-1, then remaining constant whatever the irradiance in the
range tested (Figure 12B). This upward trend in the respiration rate
is also confirmed by other strains such as Coelastrum sphaericum
and Scenedesmus falcatus (Grobbelaar and Soeder, 1985). The

31
oxygen production rate is the difference between these two
parameters, representing the production of oxygen under light
conditions, which is proportional to the biomass production rate.
The data demonstrated that the oxygen production rate is negative
under dark conditions, with an irradiance level equal to 15 µE·m-
2·s-1 being necessary to achieve an oxygen production rate equal to
zero (the compensation point) (Figure 12C).

32
Fig. 12 - Influence of irradiance on the net photosynthesis (A), respiration (B) and oxygen production rate (C) of Isochrysis galbana at 29ºC, pH=7.5 and DO2=7.6 mg/L. Lines correspond to fit the proposed models (Equation 6, Equation 7).

33
At an irradiance higher than 15 µE·m-2·s-1, the net photosynthesis
rate is much higher than the respiration rate, thus the oxygen
production rate fits to the behaviour observed for the net
photosynthesis rate. According to these results, the maximal
respiration rate is 20% of the maximal photosynthesis rate; this ratio
being strain specific (Geider and Osborne, 1989). From these data it
could be concluded that the net photosynthesis rate can be fitted to
the Eiler and Peters model (Eq. 6) (Eilers and Peeters, 1988)
whereas the respiration rate can be fitted to the hyperbolic model
with no inhibition (Eq. 7).
c+b·I+a·II=PO2(I) 2
Equation 6
I+IkRO2max·I+RO2min=RO2(I) nn
n
Equation 7
The response of the net photosynthesis rate to irradiance is
modulated by other environmental conditions such as temperature,
pH and dissolved oxygen. The experiments carried out allow us to
calculate the normalized net photosynthesis rate as a function of
these culture conditions. Data showed that temperature and pH
exhibit similar behaviour, with the net photosynthesis rate being
zero at 12ºC and pH 3, increasing to a maximum of 36ºC and pH
7.5, then decreasing to zero at maximum values of 45ºC and pH 10
(Figure 13A,B). It was unexpected that the optimal temperature for
maximizing the photosynthesis rate was close to 36ºC. This
temperature is high when compared to previously reported optimal
temperatures for this strain, ranging from 25ºC to 30ºC (Marchetti
et al., 2012; Renaud et al., 2002; Claquin et al., 2008). Regarding
the pH, tolerance to this parameter is different for each strain. For
most microalgae growth it is optimal at pH values between 7.0 and

34
8.0; however for others such as Spirulina, alkaline pH is
recommended; pH has even been reported as useful in controlling
contaminants in mixed cultures (Goldman et al., 1982). Regarding
the dissolved oxygen concentration, the net photosynthesis rate is
maximal at dissolved oxygen concentrations from zero to 11 mg·l-1,
then exponentially decreases to zero at 20 mg·l-1 due to oxygen
inhibition (Figure 13C).

35
Fig.13 - Influence of temperature (A), pH (B) and dissolved oxygen concentration (C) on the normalized photosynthesis rate of Isochrysis galbana at 600 µE/m2·s. Experiments performed under standard conditions for other culture conditions (29ºC, pH=7.5 and DO2=7.6 mg/L). Lines correspond to fit the proposed models (Equation 8, Equation 9, Equation 10).

36
It’s important to note that this is a relevant parameter because
oxygen is produced during photosynthesis and can accumulate in
high concentrations in closed photobioreactors, reducing the
photosynthesis rate and favouring culture photorespiration
(Mendoza et al., 2013). Therefore, in high dissolved oxygen
concentrations, photorespiration takes place; the oxygen binds to
the Rubisco enzyme and modifies its role from carboxylase to
oxygenase, reducing carbohydrate synthesis (Badger et al., 2000).
Variation in the normalized net photosynthesis rate with
temperature and pH can be fitted to the cardinal model developed
for bacteria (Rosso et al., 1993) and validated for microalgae
(Bernard and Rémond, 2012). According to this model, the net
photosynthesis rate is a function of the difference between the
variables (temperature, pH) and the characteristic values of the
strain (maximal, minimal and optimal), defined only in the range of
tolerable values. Other authors proposed models based on the
Arrhenius equation (Costache et al., 2013; Pérez et al. 2008) or a
non-linear correlation (Blanchard et al., 1996; Moisan, Moisan and
Abbott, 2002) to consider the influence of temperature on the
microalgae cultures. Thus, equation 8 and equation 9 allow us to
model the response of the net photosynthesis rate to temperature
and pH according to the cardinal model (Bernard and Rémond,
2012). A model considering inhibition by product, as previously
reported (Costache et al., 2013) can be used to model the response
to dissolved oxygen concentration (Eq. 10).

37
2T)]-Tmin+tTmax)(TPop-(TPopt-TPopt)-Tmin)(T-ptTmin)[(TPo-(TPoptTmin)-(T Tmax)-(T=(T)PO2
2
Equation 8
2pH)]-pHmin+ptpHmax)(pHo-(pHopt-pHopt)-pHmin)(pH-optpHmin)[(pH-(pHoptpHmin)-(pH pHmax)-(pH
=(pH)PO22
Equation 9
m
⎟⎠
⎞⎜⎝
⎛DO2max
DO2 -1=(DO2)PO2
Equation 10
An analogous study was performed concerning the respiration rate.
The variation in the normalized respiration rate with the
temperature, pH and dissolved oxygen shows the same behaviour
(Figure 14), which was analogous to that previously observed for
the variation in the net photosynthesis rate with temperature and
pH.

38
Fig.14 - Influence of temperature (A), pH (B) and dissolved oxygen concentration (C) on the normalized respiration rate of Isochrysis galbana. Experiments performed under standard conditions for other culture conditions (29ºC, pH=7.5 and DO2=7.6 mg/L). Lines correspond to fit the proposed models (Equation 11, Equation 12, Equation 13).
39
The respiration rate was zero at values of 12ºC, pH 3 and 0 mg·l-1,
but it increased with the temperature, pH and dissolved oxygen to
be maximal at 32ºC, pH 7.5 and 16 mg·l-1, then decreased to zero at
maximal values of 46ºC, pH 10 and 26 mg·l-1. The influence of
temperature and pH on the respiration rate is related to the
adequacy of the culture conditions to the optimal ones required by
the strain, whereas the influence of dissolved oxygen concentration
is related to the nutrient availability or excess; in this case, the
dissolved oxygen required for respiration. According to these
results, the variation in the normalized respiration rate to changes in
temperature or pH agree with the previously-reported cardinal
model, whereas the influence of dissolved oxygen can be modelled
using nutrient limitation-inhibition models. However, because the
cardinal model also reproduces the observed pattern, and to reduce
the variety of the equations used, this cardinal model has also been
employed to model the influence of dissolved oxygen on the
respiration rate. Thus, the following equations are used to model the
respiration rate’s response to temperature (Eq. 11), pH (Eq. 12) and
dissolved oxygen (Eq. 13).
2T)]-Tmin+tTmax)(TRop-(TRopt-TRopt)-Tmin)(T-ptTmin)[(TRo-(TRoptTmin)-(T Tmax)-(T=(T)RO2
2
Equation 11
2pH)]-pHmin+ptpHmax)(pHo-(pHopt-pHopt)-pHmin)(pH-optpHmin)[(pH-(pHoptpHmin)-(pH pHmax)-(pH=(pH)RO2
2
Equation 12
2DO2)]-DO2min+2optDO2max)(DO-(DO2opt-DO2opt)-2DO2min)(DO-O2optDO2min)[(D-(DO2optDO2min)-(DO2 DO2max)-(DO2
=(DO2)RO22
Equation 13

40
The proposed equations allows us to model the photosynthesis and
respiration rates as a function of the culture conditions the cells are
exposed to inside the culture over a short period, but possibly
conditions that are not supported over long periods, or whose
performance modifies as a function of exposure time. To determine
the “validity time” of the model, it is necessary to evaluate the
tolerance of Isochrysis galbana cells to more adverse culture
conditions. From the experimental data, the most unexpected value
was the optimal temperature of 36ºC. It is possible that although the
photosynthesis rate increases with temperature over a short period,
over longer periods other adverse effects occur at such a
temperature and, thus, the overall performance of the cells
diminishes. To study the model validity time, a culture was
continuously exposed to a temperature of 36ºC, samples being
taken at different times to study the variations in the photosynthesis
and respiration rates over time. Data show that the net
photosynthesis rate was stable for at least 100 minutes, then slightly
decreased after 150 minutes (Figure 15A), thus confirming the
tolerance of this strain to high temperatures for a maximal two-hour
period. Regarding the respiration rate, it was constant the whole
time, there was no observable tendency for exposure time to high
temperature (Figure 15B). Because the net photosynthesis rate was
much higher than the respiration rate under the standard conditions
used, the oxygen production rate behaved similarly to that discussed
for the net photosynthesis rate (Figure 15C).

41
Fig.15 - Variation in the net photosynthesis rate (A), respiration rate (B) and oxygen production rate (C) with time for Isochrysis galbana cells exposed to high temperature (35ºC) for a long period. Measurements performed under the standard culture conditions (I=600 µE/m2·s , pH=7.5, DO2=10 mg/L).
0
100
200
300
400
500
600
700
800
900
0 50 100 150 200 250 300
Net pho
tosynthe
sis rate (m
gO2/gbiomass·∙h)
Time (min)
A)
0
20
40
60
80
100
120
140
160
0 50 100 150 200 250 300
Respira
tion rate (m
gO2/gbiomass·∙h)
Time (min)
B)
0
100
200
300
400
500
600
700
800
0 50 100 150 200 250 300
Oxygen prod
uctio
n rate (m
gO2/gbiomass·∙h)
Time (min)
C)

42
According to these results, the net photosynthesis and respiration
rates can be modelled by combining these equations to obtain a
general equation representing the overall strain behaviour based on
the observed patterns. Thus, equation 14 and equation 15 allow us
to modelled the net photosynthesis and respiration rates as a
function of the culture conditions (irradiance, temperature, pH and
dissolved oxygen) to which the cells are exposed.
PO2(DO2)·PO2(pH)·PO2(T)PO2(I)·=PO2 Equation 14
RO2(DO2)·RO2(pH)·RO2(T)RO2(I)·=RO2 Equation 15
In order to determine the optimal values of the characteristic
parameters included in these models, we performed a non-linear
regression of the entire data to the experimental data set.
Table 1.- Values for the proposed model’s parameter characteristics (Equations
6-15) obtained by non-linear regression of the experimental values of the net
photosynthesis rate and respiration rate under the experimental conditions
tested.
Net photosynthesis rate Respiration rate Parameter Value Units Parameter Value Units a 3.42E-07 RO2min 52.17 mgO2/L·h b 9.30E-04 RO2max 153.00 mgO2/L·h c 2.90E-01 Ik 1152.00 µE/m2·s PO2max 641.01 mgO2/L·h n 1.90 Ik 186.05 µE/m2·s Tmin 12.84 ºC Im 921.23 µE/m2·s Tmax 45.82 ºC alfa 3.45 Topt 33.00 ºC Tmin 11.88 ºC pHmin 3.00 Tmax 46.15 ºC pHmax 10.00 Topt 35.73 ºC pHopt 7.50 pHmin 2.24 DO2min 0.70 mgO2/L pHmax 10.00 DO2max 23.27 mgO2/L pHopt 7.34 DO2opt 11.96 mgO2/L KO2 19.99 mgO2/L z 2.90

43
The value of characteristic parameters obtained is shown in table 1
whereas the correlation between experimental and simulated values
obtained using the proposed model (Equation 6-15) and the
characteristic parameter values obtained is shown in figure 16.
Fig.16 - Correlation between experimental and simulated values of the net photosynthesis rate (A) and respiration rate (B) of Isochrysis galbana. Simulated values obtained using the proposed models (Equation 6-15) and the parameter characteristic values shown in table 1.
One can observe how the proposed model simulates the
experimental values of the net photosynthesis and respiration rates;
with the correlation for the net photosynthesis rate being even
y = 0.9777xR² = 0.896
0
100
200
300
400
500
600
700
0 100 200 300 400 500 600 700
Simulated
net pho
tosynthe
sis rate
(mgO
2/gbiomass·∙h)
Experimental net photosynthesis rate (mgO2/gbiomass·∙h)
A)
y = 0.9255xR² = 0.6116
0
20
40
60
80
100
120
140
0 20 40 60 80 100 120 140
Simulated
respira
tion rate
(mgO
2/gbiomass·∙h)
Experimental respiration rate (mgO2/gbiomass·∙h)
B)

44
higher than that for the respiration rate. According to these results,
it is demonstrated that the developed model reproduces the
photosynthesis and respiration rates of Isochrysis not only for short
time periods (minutes) but also for long periods (up to two hours);
thus making them sufficiently robust to be exposed to real outdoor
conditions where changes in the culture conditions, especially
temperature, take place slowly in line with the solar cycle.
4.2. Application of the photosynthesis rate model to
industrial-scale T-PBRs
The model has been validated to study the performance of
Isochrysis galbana cultures grown in an industrial-scale tubular
photobioreactor. For this, experimental data of the average
irradiance, temperature, pH and dissolved oxygen measured on-line
in the reactor during a solar cycle in steady-state has been used
(Figure 17A). Data show that the average irradiance inside the
culture ranges daily from zero to 1000 µE·m-2·s-1 confirming that
the cells are mainly light-limited, even at noon when there is high
solar irradiance (up to 1600 µE·m-2·s-1). Moreover, during the solar
cycle, the temperature ranges from 19.0ºC to 29.7ºC, whereas the
pH varies from 7.6 to 8.1, and the dissolved oxygen from 5.1 to
14.4 mg·l-1. These values are close to those previously reported for
outdoor cultures of Isochrysis in outdoor photobioreactors (van
Bergeijk, Salas-Leiton and Cañavate, 2010; Zhang and Richmond,
2003). Concerning temperature variation, this modifies by up to
10ºC, according to the solar cycle, because the control system only
allows us to avoid overheating of the culture inside the reactor.

45
Furthermore, the average value was 24.3ºC, far from the optimal
photosynthesis rate value determined at 36ºC (Figure 13A) but
close to the previously-reported optimal rate, at 21ºC (van Bergeijk,
Salas-Leiton and Cañavate, 2010). The temperature effect is very
important on outdoor microalgal cultures subject to daily culture
condition variations (particularly irradiance and temperature) for
which simultaneous adverse conditions can take place (van
Bergeijk, Salas-Leiton and Cañavate, 2010). The negative effect of
low temperature and high irradiance has already been demonstrated
when occurring in the first hours of the morning in outdoor raceway
ponds, with these conditions enhancing the photoinhibition
phenomena. The utilization of closed photobioreactors rather than
open raceways allows us to improve temperature control, making it
possible to increase the night-time temperature and to avoid
overheating at noon - but this involves a higher production cost
(Acién et al., 2013). The variation in pH is minimal, up to 0.5 pH
units, due to the control system’s adequacy in supplying CO2 and
controlling pH. The average pH value is 7.9, close to the optimal
value determined for photosynthesis rate of Isochrysis T-iso, of 7.5
(Figure 13B). Microalgae culture productivity can be influenced not
only by the mean pH value but also by local pH gradients that take
place when pure carbon dioxide is supplied (Fernández et al.,
2014). The data obtained show the optimal pH range is between 7.0
and 8.0 - therefore to optimize productivity in the T-PBRs, it was
enough to use the on-demand injection of pure CO2 to keep the pH
lower than 8.0. Finally, the average dissolved oxygen concentration
was 9.1 mg·l-1, close to air saturation, but at noon, values up to 14.4
mg·l-1 were measured due to the system’s inability to remove all the

46
oxygen produced by photosynthesis. According to the
photosynthesis model, dissolved oxygen concentrations above 11
mg·l-1 reduce cell performance (Figure 13C), and therefore
represent a relevant reduction in productivity.
From these experimental values of temperature, pH and dissolved
oxygen, the normalized photosynthesis rate can be calculated by
Equation 8 to Equation 10 (Figure 17B). Results confirm that pH
was adequately controlled and did not reduce the photosynthesis
rate, whereas temperature and dissolved oxygen varied greatly
through the solar cycle, values being far from optimal, and thus the
normalized photosynthesis rate was less than maximal. A larger
contribution to a reduced photosynthesis rate came from the
inadequacy of the culture conditions because of temperature and
dissolved oxygen deviations taking place during the light period.
The integral of values during the light period was 0.97 for
PO2(pH), whereas it was 0.61 for PO2(T) and 0.77 for PO2(DO2).
These results indicate that the photosynthesis rate can be increased
39% by optimizing the temperature control and 27% by optimizing
the dissolved oxygen concentration inside the culture - thus
photosynthesis can be more than doubled by optimizing both
parameters at the same time (PO2(T-pH-DO2) being 0.44).
To better understand these phenomena, figure 6C shows the
expected photosynthesis rate based on average irradiance inside the
culture (considering optimal values of temperature, pH, and
dissolved oxygen) (Eq. 6), and calculated considering all the culture
conditions (irradiance, temperature, pH and dissolved oxygen) (Eq.
14). It can be observed that net photosynthesis, as a function solely
of irradiance (PO2(I)), is much higher than that calculated when

47
considering all the culture parameters (PO2(I-T-pH-DO2)),
especially at noon when light availability is maximal. Thus, the
integral of PO2(I) values allows us to calculate the maximal oxygen
production, 0.92 gO2·l-1·day-1, whereas the integral of PO2(I-T-pH-
DO2) allows us to calculate the real oxygen production, 0.42 gO2·l-
1·day-1. In this way, it is confirmed that the photosynthesis rate can
be doubled by optimizing the control of the culture conditions in the
reactors used.

48
Fig.17 - Daily variation in culture parameters of Isochrysis galbana culture in an industrial-scale tubular photobioreactor operated in continuous mode at 0.4 1/day. A) Experimental values of average irradiance, temperature, pH and dissolved oxygen to which the cells are exposed inside the culture; B) Influence of culture conditions (T, pH, DO2) in the normalized photosynthesis rate according to the proposed equations (Equation 13-15); C) Net photosynthesis rate as a function of irradiance (Equation 6) and of all the variables (I, T, pH, DO2) (Equation 14).
0
5
10
15
20
25
30
0
10
20
30
40
50
60
70
80
90
100
0 4 8 12 16 20 24
Dissolved oxygen
(mgO
2/L), p
H
Irrad
iance (m
icroE/m2·∙s), Tem
perature (ºC)
Hour
Iav
T
pH
DO2
A)
0.0
0.2
0.4
0.6
0.8
1.0
1.2
0 4 8 12 16 20 24
Normalized
net pho
tosynthe
sis rate
Hour
PO2(T) PO2(pH)
PO2(DO2) PO2(T·∙pH·∙DO2)
B)
0
20
40
60
80
100
120
140
0 4 8 12 16 20 24
Net pho
tosynthe
sis rate (m
gO2/L·∙h)
Hour
PO2(I)
PO2(I·∙T·∙pH·∙DO2)
C)

49
Moreover, by comparing the real oxygen production, calculated
using the proposed model, with the experimental biomass
productivity measured, of 0.22 gbiomass·l-1·day-1, the oxygen to
biomass ratio can be calculated a value of 1.94 gO2·gbiomass-1. In
outdoor cultures of Scenedesmus almeriensis carried out in open
raceway reactors, an oxygen-to-biomass ratio of 1.46 gO2 gbiomass-1
was measured when using flue gas to control pH and to supply CO2;
whereas a ratio of 0.99 gO2 gbiomass-1 was measured when using pure
CO2 (Mendoza et al., 2013). The oxygen yield value reported here
agrees with that previously reported, thus confirming the proposed
model’s validity in determining oxygen production as a function of
culture conditions; and, moreover, loss of productivity due to
deviation in the culture conditions. It is therefore a useful tool for
taking decisions regarding the implementation of different control
strategies.
4.3. Outdoor production of Isochrysis galbana (T-iso)
To determine the feasibility of producing Isochrysis galbana T-iso
in outdoor industrial scale tubular photobioreactors experiments
were performed by modifying the dilution rate under standard
conditions. Experiments were performed in April-May (2015), the
cultures performing adequately at the dilution rates tested.
Subsequently, to evaluate the influence of the various factors linear
correlations were made between the various parameters and the
dilution (Table 2).

50
Tab. 2 – P-Values obtained by linear correlations (Pearson) between the
parameters and the rate of dilution
Results show as increasing the dilution rate from 0.15 to 0.35 1/h
the biomass concentration on steady state diminishes from 1.1 to
0.7 g/L (P-Value < -0.05: significant difference, Tab. 2), but the
chlorophyll fluorescence remained constant, at values of 0.58 to
0.65 (P-Value > 0.05: no significant difference, Tab. 2) , in all the
experiments (Figure 18A). The reduction of biomass concentration
with the increase of dilution rate represents the behaviour expected
from light limited cultures, whereas the maintenance of
fluorescence of chlorophylls with the increase of dilution rate
indicates that this variable has not influence on the status of the
photosynthetic apparatus. Regarding biomass productivity, it
increased with the increase of dilution rate (P-Value < 0.05:
significant difference, Tab. 2), thus confirming that the cultures
were light limited under the imposed culture conditions, and that
higher biomass productivity could be reached by operating at higher
dilution rates (Figure 18B). However, the dilution rate was not
Parameter P-Value Parameter P-Value Biomass concentration --0.003528 pH minimum 0.238610 Fluorescence of chlorophylls 0.253081 Temperature average 0.547727 Volumetric productivity 0.006219 Temperature maximum -0.037913 Areal productivity 0.006219 Temperatura minimum 0.138590 Extinction coefficient 0.005737 Average irradiance 0.007631 Dissolved oxygen average 0.097486 Protein content 0.002218 Dissolved oxygen maximum 0.142337 Lipid content -0.070122 Dissolved oxygen minimum 0.042923 Carbohydrate content -0.082813 pH average 0.045145 Photosynthetic efficiency 0.015367 pH maximum 0.090452 Quatum yield 0.006739
51
increased over 0.35 1/day because the biomass concentration in
steady state was lowered below a critical value of 0.8 g/L. In this
case the T-iso cultures in outdoor conditions can be unstable. The
maximal biomass productivity achieved was 0.25 g/Lday equivalent
to 20 g/m2·day due to the V/S ratio of the photobioreactors utilized.
With respect to the light availability, results shows as increasing the
dilution rate the extinction coefficient of the biomass increased, at
the same time the average irradiance inside the culture also
increased (both P-Values < 0.05: significant difference, Tab. 2), in
spite of constant solar radiation (Figure 18C).

52
Fig.18 - Variation of (A) biomass concentration and fluorescence of chlorophylls, (B) volumetric and areal productivity, and (C) extinction coefficient and average irradiance inside the culture, with the dilution rate, of Isochrysis galbana T-iso cultures performed in 3.0 m3 industrial scale tubular photobioreactors.

53
Thus, on the days when the experiments were performed the solar
radiation was stable, daily average radiation ranging from 350 to
360 W/m2. These results confirmed that the cultures were not
photo-limited, and that photo-limitation was not present or was
negligible. Thus, the extinction coefficient increased from 0.23 to
0.30 m2/g, whereas the average irradiance increased from 17 to 22
µE/m2·s when the dilution rate was increased from 0.15 to 0.35
1/day.
To determine if the productivity of the cultures was negatively
affected by the culture conditions, the experimental dissolved
oxygen, pH and temperature values were registered and analysed.
Maximum, minimum and average daily values are shown in Figure
19.
54
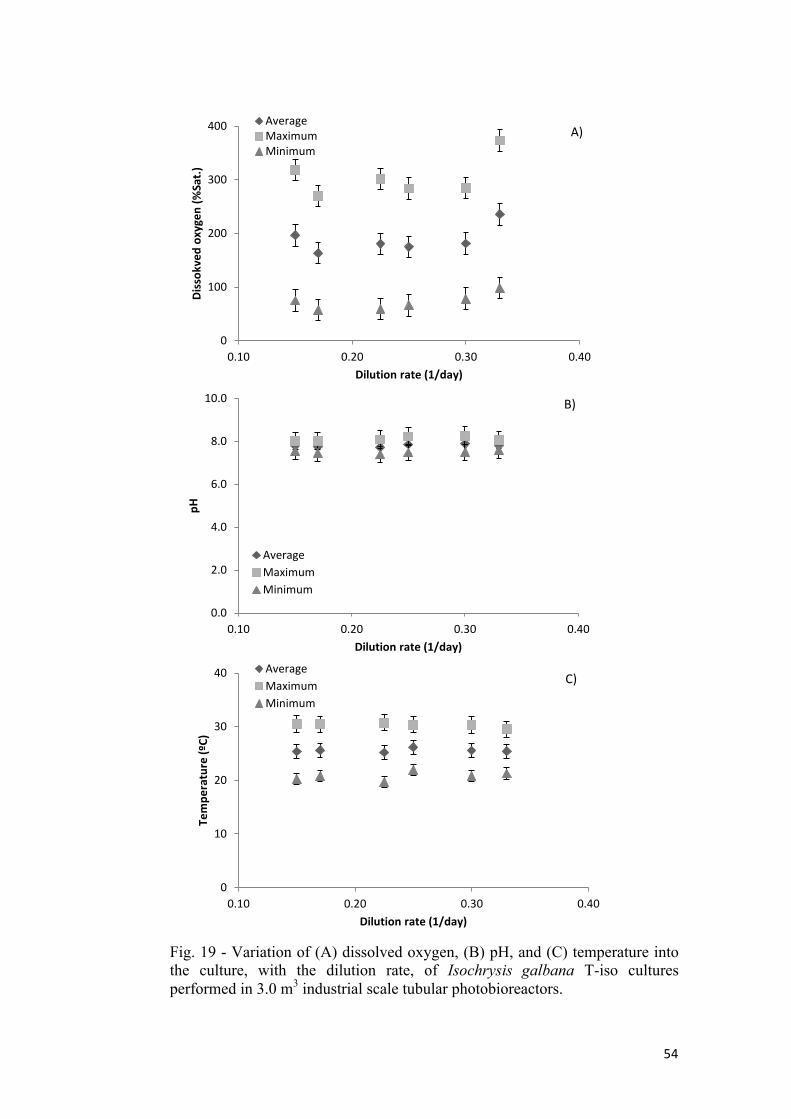
Fig. 19 - Variation of (A) dissolved oxygen, (B) pH, and (C) temperature into the culture, with the dilution rate, of Isochrysis galbana T-iso cultures performed in 3.0 m3 industrial scale tubular photobioreactors.
0
100
200
300
400
0.10 0.20 0.30 0.40
Dissok
ved oxygen
(%Sat.)
Dilution rate (1/day)
AverageMaximumMinimum
A)
0.0
2.0
4.0
6.0
8.0
10.0
0.10 0.20 0.30 0.40
pH
Dilution rate (1/day)
AverageMaximumMinimum
B)
0
10
20
30
40
0.10 0.20 0.30 0.40
Tempe
rature (ºC)
Dilution rate (1/day)
AverageMaximumMinimum
C)

55
Data show as the dissolved oxygen largely modifies along the day,
ranging from minimum values of 70%Sat during the night to more
than 300%Sat at noon, the average daily value being 170%Sat.
However, no clear influence of imposed dilution rate was observed
(Tab. 2). According to these results the reactors mass transfer
capacity was not enough to remove all the oxygen produced at
noon, thus photo-respiration phenomena can occur and diminish the
productivity of the cultures. Regarding the pH, variations along the
day resulted really low, lower than 0.5, with no differences being
observed as a function of dilution rate (Tab. 2). Finally, regarding
temperature, data shows as the temperature modifies along the day
from 20ºC during the night to maximum of 31ºC at noon. No
heating systems were used but the cultures increased its temperature
with the solar radiation due to the absorption of heat by radiation.
This heat absorption could increase the temperature over 40ºC, but
the reactors had a cooling system to prevent overheating and death
of the cultures, and the system worked adequately according to the
results. These experimental values are close to those previously
reported for cultures of Isochrysis in outdoor photobioreactors (van
Bergeijk et al., 2010; Zhang et al., 2003).
The biochemical composition of the biomass was analysed. To
avoid the ash content influence the data are expressed in ash free
basis. Results show as the dilution rate modifies the biochemical
composition of the biomass: the higher the imposed dilution rate the
higher was the protein content (P-Value <0.05 : significant
difference, Tab.2). It was also found a correlation with the decrease
of the lipid content, although not statistically significant (P-Value =
-0.07 : no significant difference, Tab. 2) (Figure 20).

56
Fig. 20 - Variation of biochemical composition (protein, lipids and carbohydrates) of the biomass with the dilution rate, of Isochrysis galbana T-iso cultures performed in 3.0 m3 industrial scale tubular photobioreactors.
Protein content increased from 35 to 45% when the dilution rate
increased from 0.15 to 0.35 1/day, the lipids content reducing from
28 to 20%. Carbohydrate content did not show a clear tendency
with the dilution rate variation, it represents between 28 to 30% of
the biomass. The protein and lipid content variation with increasing
the dilution rate is an expected behaviour due to the faster growth
rate of the cells, thus requiring more proteins and storing less
energy as lipids. However, it is very important to be capable to
produce whatever strain at stable dilution rate, as this allows to
maintain a stable biochemical composition of the biomass.
Tubular photobioreactors are recommended as the most suitable for
the outdoor production of microalgae strains which can be easily
contaminated, such as Isochrysis galbana (T-iso). On these reactors
it is possible to provide a better control of culture conditions, thus
being reliable to produce microalgae in continuous mode. However,

57
the tolerance of whatever strain to grown in this type of reactors
must be tested under real conditions. Thus, although on these
reactors different mechanisms can be used to control the pH,
dissolved oxygen and temperature, the daily variation of these
parameters along the solar period and including along the reactor
due to the existence of gradients, can diminish the productivity or
simply kill the cells.
The performed experiments demonstrated that Isochrysis galbana
(T-iso) can be produced in industrial size tubular photobioreactors
in continuous mode. The results indicate that the cultures mainly
perform as light limited cultures, thus the biomass productivity
increase by increasing the dilution rate. The chlorophyll
fluorescence remained constant whatever the imposed dilution rate,
therefore it was not observed photosynthetic apparatus stress. The
biomass showed an adequate and stable composition, being rich in
proteins and lipids, the most valuable components when used as
feed in aquaculture.
The productivity measured during experiments, of 0.16-0.23
g/L·day, is in the range previously reported for this strain or even
higher. Thus, at indoor conditions biomass productivities from 0.2
to 0.3 gbiomass·l-1·day-1 has been reported (in this study) whereas at
outdoor conditions a value of 0.075 g·l-1·day-1 has been reported in
tubular photobioreactors (van Bergeijk et al. 2010), and 0.13 g·l-
1·day-1 in flat panels (Zhang,C.W. 2003). However, these
productivities are much lower than those reported in tubular
photobioreactors using different strains. This can be due to the
lower growth rate of Isochrysis galbana T-iso versus other strains
or to the higher influence of culture deviation conditions versus the

58
optimal one for this microalga. By using the proposed model and
considering the culture parameters variation (dissolved oxygen, pH
and temperature) inside the reactors along the day, the normalized
photosynthesis rate can be calculated. Results demonstrate that the
pH was adequately controlled in the reactor, the normalized
photosynthesis rate being 0.97 at whatever dilution rate (Figure 21).
Fig. 21 - Influence of deviation of culture conditions versus the optimal reported for Isochrysis galbana T-iso into the normalized photosynthesis rate at different dilution rates tested. Data from experiments performed in 3.0 m3 industrial scale tubular photobioreactors.
The optimal pH for this strain was reported to be 8.0, although the
tolerance to deviations of this parameter are different according to
the strain. For most microalgae the growth is optimal at pH values
between 7.0 and 8.0; however for others as Spirulina alkaline pH is
recommended, considering that the high pH has been reported to be
useful for the control of contaminants in mixed cultures (Goldman
1982). However, dissolved oxygen has a larger variation during the
day, reaching values higher than 150 %Sat. that has been reported
as maximal tolerable for this strain without reduction of
0.0
0.2
0.4
0.6
0.8
1.0
1.2
0.10 0.20 0.30 0.40
Normalized
pho
tosynthe
sis rate
Dilution rate (1/day)
Dissolved oxygenpHTemperatureOverall (DO2*pH*T)

59
photosynthesis capacity. On this way the normalized photosynthesis
rate due to dissolved oxygen concentration was in the range of 0.7-
0.8, thus indicating that inadequate dissolved oxygen concentration
reduces the performance of the cultures between 30 and 20%. It has
been reported that the net photosynthesis rate is maximum at
dissolved oxygen concentration from zero to 11 mg·l-1, then
exponentially decreasing to reach zero at 20 mg·l-1 due to inhibition
by oxygen. It’s worth noticing that this is a relevant parameter
because oxygen is produced during photosynthesis and it can
accumulate in high concentrations in closed photobioreactors,
reducing the photosynthesis rate and favouring the photorespiration
of the cultures (Mendoza et al., 2013). Therefore, in high dissolved
oxygen concentrations photorespiration takes place; the oxygen
binds to the Rubisco enzyme and modifies its role from carboxylase
to oxygenase, reducing carbohydrate synthesis (Badger et al.,
2000). Regarding temperature, a similar trend is observed due to
low temperature during the morning, with the normalized
photosynthesis rate due to temperature ranging from 0.65 to 0.63.
The optimal temperature for I. galbana T-iso has been reported to
be close to 36ºC (in this study), although other authors reported
values ranging from 25ºC to 30ºC (Renaud et al., 2002; Claquin et
al., 2008; Marchetti et al., 2012). Because the unfavourable
dissolved oxygen concentration, pH or temperature has a
multiplicative influence into the overall behaviour of the culture,
the final normalized photosynthesis rate can be calculated by
multiplying individual factors. Results shows as the overall
normalized photosynthesis rate range from 0.37 to 0.55, thus
60
indicating that biomass production achieved is approximately half
than the maximum achievable under optimal conditions.
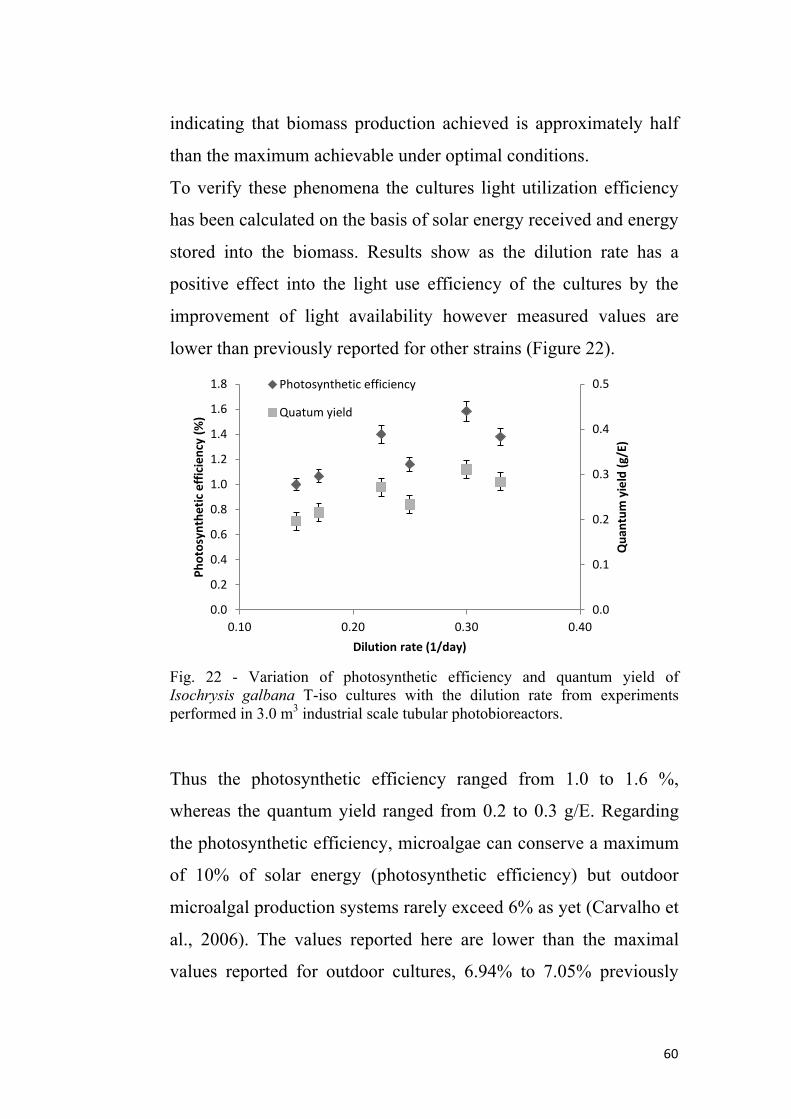
To verify these phenomena the cultures light utilization efficiency
has been calculated on the basis of solar energy received and energy
stored into the biomass. Results show as the dilution rate has a
positive effect into the light use efficiency of the cultures by the
improvement of light availability however measured values are
lower than previously reported for other strains (Figure 22).
Fig. 22 - Variation of photosynthetic efficiency and quantum yield of Isochrysis galbana T-iso cultures with the dilution rate from experiments performed in 3.0 m3 industrial scale tubular photobioreactors.
Thus the photosynthetic efficiency ranged from 1.0 to 1.6 %,
whereas the quantum yield ranged from 0.2 to 0.3 g/E. Regarding
the photosynthetic efficiency, microalgae can conserve a maximum
of 10% of solar energy (photosynthetic efficiency) but outdoor
microalgal production systems rarely exceed 6% as yet (Carvalho et
al., 2006). The values reported here are lower than the maximal
values reported for outdoor cultures, 6.94% to 7.05% previously
0.0
0.1
0.2
0.3
0.4
0.5
0.0
0.2
0.4
0.6
0.8
1.0
1.2
1.4
1.6
1.8
0.10 0.20 0.30 0.40Qua
ntum
yield (g
/E)
Photosynthetic efficien
cy (%
)
Dilution rate (1/day)
Photosynthetic efficiency
Quatum yield
61
reported for Chlorella sp. cultures in thin-layer reactors (Doucha et
al., 2006; Doucha et al., 2009), or 3.6% reported for Scenedesmus
cultures in large tubular photobioreactors (Acién et al., 2012).
Regarding the quantum yield, measured values are lower than the
values of 0.5 g/E reported for Muriellopsis sp., 0.43 g/E reported
for P. subcapitata and 1.3 g/E reported for N. gaditana (Morales-
Amaral, et al., 2015; Sepulveda et al., 2015). For Isochrysis
galbana, a maximal value of 0.62 g/E was reported indoors
although this reduced to 0.1 g/E when calculated from outdoor
cultures (Molina et al., 1997).

62
5. CONCLUSIONS
Irradiance, temperature, pH and dissolved oxygen are relevant
variables determining the performance of Isochrysis galbana
cultures. In collaboration with the researchers at the “Universidad
de Almeria” a complete photosynthesis and respiration rate model
for Isochrysis galbana based on these variables was developed. The
model’s validity was verified outdoors using industrial-scale tubular
photobioreactors. The model allowed us to determine that
inadequate temperature and dissolved oxygen in the outdoor tubular
photobioreactors could reduce productivity by half that of the
maximal level according to light availability. The developed model
is a power tool for the design and management of Isochrysis
galbana-based outdoor processes, to take decisions about the
implementation of profitable control strategies. In addition, the
method used to construct this model is applicable to other strains
allowing us to optimize microalgae-based processes. Concerning
the production, the data confirm that Isochrysis galbana has a
growth rate lower than other strains. However, it is confirmed that
the photosynthesis rate can be doubled by optimizing the control of
the culture conditions in the reactors used.
Furthermore, this study showed that the productivity increases with
increasing dilution rate, so future studies considering higher rate
could be useful.

63
6. ACKNOWLEDGEMENTS
This research was supported by the Erasmus+ traineeship
programme of the Università di Bologna and the CO2ALGAEFIX
project (LIFE10 ENV/ES/000496) led by AlgaEnergy company. I
am most grateful to the Estación Experimental Las Palmerillas of
the Fundación Cajamar for collaborating in this research. This
research was supported by the Junta de Andalucía and the Plan
Andaluz de Investigación (BIO 173).

64
7. REFERENCES
Acién, F.G., Sevilla, J.M.F., Perez, J.A.S., Grima, E.M., Chisti, Y.,
2001. Airlift-driven external-loop tubular photobioreactors for
outdoor production of microalgae: assessment of design and
performance. Chem Eng Sci 56:2721–2732
Acién, F.G., Fernández, J.M., Molina, E., 2013. Photobioreactors
for the production of microalgae, Reviews in Environmental
Science and Biotechnology. 1-21.
Acién, F.G., Fernández, J.M., Molina-Grima, E., 2013. Economics
of Microalgae Biomass Production, Biofuels from Algae. 313-
325.
Andersen, R.A., 1992. The biodiversity of eukaryotic algae. Biodiv.
Conserv. 1: 267–292.
Badger, M.R., Von Caemmerer, S., Ruuska, S., Nakano, H., Laisk,
A., Allen, J.F., Asada, K., Matthijs, H.C.P., Griffiths, H., 2000.
Electron flow to oxygen in higher plants and algae: Rates and
control of direct photoreduction (Mehler reaction) and rubisco
oxygenase, Philos. Trans. R. Soc. B Biol. Sci. 355, 1433-1446.
Beer, L.L., Boyd, E.S., Peters, J.W. & Posewitz, M.C., 2009
Engineering algae for biohydrogen and biofuel production.
Curr. Opin. Biotechnol. 20: 264–271.
Benemann J.R., Oswald W.J., 1996. Systems and economic
analysis of microalgae ponds for conversion of CO2 to
biomass. Final report. US DOE-NETL no: DOE/PC/ 93204–
T5. Prepared for the Energy Technology Center, Pittsburgh,
USA

65
Bernard, O., Rémond, B., 2012. Validation of a simple model
accounting for light and temperature effect on microalgal
growth, Bioresour. Technol. 123, 520-527.
Blanchard, G.F., Guarini, J., Richard, P., Gros, P., Mornet, F., 1996.
Quantifying the short-term temperature effect on light-
saturated photosynthesis of intertidal microphytobenthos, Mar.
Ecol. Prog. Ser. 134, 309-313.
Borowitzka, M. A., Siva, C. J., 2007. The taxonomy of the genus
Dunaliella (Chlorophyta, Dunaliellales) with emphasis on the
marine and halophilic species. App. Phyc. 19, 567-590.
Boeing, P., 2000. Larval Feed Alternatives, Global Aquaculture
Advocate. 3(1), 48-50.
Brennan, L., Owende, P., 2010. Biofuels from microalgaea review
of technologies for production, processing, and extractions of
biofuels and co-products. Renew Sustain Energy Rev 14:217–
232.
Brown, M. R., Farmer, C. L., 1994. Riboflavin content of six
species of microalgae used in mariculture. J. of App. Phyc. 6,
61-65.
Brown, M. R., Jeffrey, S. W., Volkman, J. K., Dunstan, G. A.,
1997. Nutritional properties of microalgae for mariculture.
Aquaculture, 151: 315-331.
Cabello, J., Toledo-Cervantes, A., Sánchez, L., Revah, S., Morales,
M., 2015. Effect of the temperature, pH and irradiance on the
photosynthetic activity by Scenedesmus obtusiusculus under
nitrogen replete and deplete conditions, Bioresour. Technol.
181, 128-135.

66
Camacho, F., Acién, F.G., Sánchez, J.A., García, F., Molina, E.,
1999. Prediction of dissolved oxygen and carbon dioxide
concentration profiles in tubular photobioreactors for
microalgal culture, Biotechnology and Bioengineering. 62, 71-
86.
Carvalho, A. P., Meireles, L. A., Malcata, F. X., 2006. Microalgal
reactors: a review of enclosed system designs and
performances. Biotechnology progress, 22(6), 1490-1506.
Chisti,Y., 2007. Biodiesel from microalgae. Biotechnol Adv
25:294–306.
Claquin, P., Probert, I., Lefebvre, S., Veron, B., 2008. Effects of
temperature on photosynthetic parameters and TEP production
in eight species of marine microalgae, Aquatic Microb. Ecol.
51, 1-11.
Costache, T.A., Gabriel Acien, F., Morales, M.M., Fernández-
Sevilla, J.M., Stamatin, I., Molina, E., 2013. Comprehensive
model of microalgae photosynthesis rate as a function of
culture conditions in photobioreactors, Appl. Microbiol.
Biotechnol. 97, 7627-7637.
Coutteau, P., Sorgeloos, P., 1992. The use of algal substitutes and
the requirement for live algae in the hatchery and nursery
rearing of bivalve molluscs: an international survey. J. of
Shell. Reas. 11, 467-476.
de Roeck-Holtzhauer, Y., Claire, C., Bresdin, F., Amicel, L.,
Derrien, A., 1993. Vitamin, Free Amino Acid and Fatty Acid
Compositions of Some Marine Planktonic Microalgae Used in
Aquaculture. Botanica Marina. 36, 321-325.

67
Doucha, J., Lívanský, K., 2006. Productivity, CO2/O2 exchange
and hydraulics in outdoor open high density microalgal
(Chlorella sp.) photobioreactors operated in a Middle and
Southern European climate. J. of Appl. Phyc. 18(6), 811-826.
Doucha, J., Lívanský, K., 2009. Outdoor open thin-layer microalgal
photobioreactor: potential productivity. Journal of applied
phycology, 21(1), 111-117.
Eilers, P.H.C., Peeters, J.C.H., 1988. A model for the relationship
between light intensity and the rate of photosynthesis in
phytoplankton, Ecol. Model. 42, 199-215.
Falkowski, P.G. & Raven, J.A., 2007. Aquatic Photosynthesis, 2nd
edn. 484. Princeton University Press, Princeton, NJ
Fernández, I., Acién, F.G., Berenguel, M., Guzmán, J.L., 2014.
First principles model of a tubular photobioreactor for
microalgal production, Industrial and Engineering Chemistry
Research. 53, 11121-11136.
Geider, R.J., Osborne, B.A., 1989. Respiration and microalgal
growth: a review of the quantitative relationship between dark
respiration and growth, New Phytol. 112, 327-341.
Goldman, J.C., Riley, C.B., Dennett, M.R., 1982. The effect of pH
in intensive microalgal cultures. II. Species competition, J.
Exp. Mar. Biol. Ecol. 57, 15-24.
Graham, L.E., Graham, J.M. & Wilcox, L.W. 2009 Algae, 2nd edn.
Benjamin Cummings, San Francisco, CA. 616.
Grobbelaar, J.U., Soeder, C.J., 1985. Respiration losses in
planktonic green algae cultivated in raceway ponds, J.
Plankton Res. 7, 497-506.

68
Guedes, A.C., Amaro, H.M., Pereira, R.D., Malcata, F.X., 2011.
Effects of temperature and pH on growth and antioxidant
content of the microalga Scenedesmus obliquus, Biotechnol.
Prog. 27, 1218-1224.
Hu, Q., 2004 Environmental effects on cell composition. In:
Handbook of Microalgal Culture. Biotechnology and Applied
Phycology (ed. A. Richmond). Black- well Publishing,
Oxford. 83–93.
Jeon, Y.C., Cho, C.W., Yun, Y., 2006. Oxygen evolution rate of
photosynthetic microalga Haematococcus pluvialis depending
on light intensity and quality, Stud. Surf. Sci. Catal. 159, 157-
160.
Jimenez, C., Cossio, B.R., Niell, F.X., 2003. Relationship between
physicochemical variables and productivity in open ponds for
the production of Spirulina: a predictive model of algal yield.
Aquaculture 221:331–345
Kochert, G. 1978. Quantitation of the macromolecular components
of microalgae. Handbook of Phycological Methods.
Physiological and Biochemical Methods. Cambridge
University Press London,. 189-195.
Lee, R.E.. 2008 Phycology, 4th edn. Cambridge University Press,
Cambridge, MA. 547.
Lopez, C. V. G., Garcíaa, M. C. C., Acién, F. G., Bustosb C. S.,
Chisti, Y., Sevilla, J. M. S., 2010 Protein measurements of
microalgal and cyanobacterial biomass. Bio. Tech. 101, 7587–
7591.
Marchetti, J., Bougaran, G., Le Dean, L., Mégrier, C., Lukomska,
E., Kaas, R., Olivo, E., Baron, R., Robert, R., Cadoret, J.P.,

69
2012. Optimizing conditions for the continuous culture of
Isochrysis affinis galbana relevant to commercial hatcheries,
Aquaculture. 326-329, 106-115.
Marquez, F.J., Sasaki, K., Nishio, N., Nagai, S. 1995. Inhibitory
effect of oxygen accumulation on the growth of Spirulina
platensis. Biotechnol Lett. 17, 225–228.
Mendoza, J.L., Granados, M.R., de Godos, I., Acién, F.G., Molina,
E., Heaven, S., Banks, C.J., 2013. Oxygen transfer and
evolution in microalgal culture in open raceways, Bioresour.
Technol. 137, 188-195.
Moheimani, N.R., Borowitzka, M.A., 2007. Limits to productivity
of the alga Pleurochrysis carterae (haptophyta) grown in
outdoor raceway ponds. Biotechnol Bioeng 96:27–36
Moisan, J.R., Moisan, T.A., Abbott, M.R., 2002. Modelling the
effect of temperature on the maximum growth rates of
phytoplankton populations, Ecol. Model. 153, 197-215.
Molina, G. E., Fernandez, J.M., Sanchez, J.A., Garcia, F., 1996. A
study on simultaneous photolimitation and photoinhibition in
dense microalgal cultures taking into account incident and
averaged irradiances. J Biotechnol 45:59–69.
Molina G. E., Camacho, F. G., Pérez, J. S., Fernandez, F. A.,
Sevilla, J. F. 1997. Evaluation of photosynthetic efficiency in
microalgal cultures using averaged irradiance. Enzyme and
microbial technology. 21(5), 375-381.
Morales-Amaral, D. M. M., Gómez-Serrano, C., Acién, F. G.,
Fernández-Sevilla, J. M., Molina, G. E., 2015. Production of
microalgae using centrate from anaerobic digestion as the
nutrient source. Algal Research, 9, 297-305.
70
Moreno, J., Vargas, M.A., Rodriguez, H., Rivas, J., Guerrero, M.G.
2003. Outdoor cultivation of a nitrogen-fixing marine
cyanobacterium, Anabaena sp. ATCC 33047. Biomol Eng
20:191–197
Moustafa, A., Beszteri, B., Maier, U.G., Bowler, C., Valentin, K. &
Bhattacharya, D., 2009. Genomic footprints of a cryp- tic
plastid endosymbiosis in diatoms. Science 324(5935): 1724–
1726.
Muller-Feuga, A., 2013. Microalgae for Aquaculture: The Current
Global Situation and Future Trends, Handb. of Microalgal
Cult. : Appl. Phycology and Biotechnol. 613-627.
Norsker, N., Barbosa, M.J., Vermuë, M.H., Wijffels, R.H., 2011.
Microalgal production - A close look at the economics,
Biotechnol. Adv. 29, 24-27.
Norton, T.A., Andersen, R.A. & Melkonian, M., 1996. Algal
biodiversity. Phycologia 35: 308–326.
Papadakis, I.A., Kotzabasis, K., Lika, K., 2005. A cell-based model
for the photoacclimation and CO2-acclimation of the
photosynthetic apparatus, Biochim. Biophys. Acta Bioenerg.
1708, 250-261.
Pérez, B., Pina, E. C., 2008. I., Pérez Rodríguez, L. Kinetic model
for growth of Phaeodactylum tricornutum in intensive culture
photobioreactor. Biochemical Engineering Journal. 40, 520-
525.
Platt, T., Gallegos, C.L., Harrison, W.G., 1980. Photoinhibition of
photosynthesis in natural assemblages of marine
phytoplankton. J. Mar. Res. 38, 687-701.

71
Pulz, O., Gross, W., 2004. Valuable products from biotechnology of
microalgae. App. Micr. and Biot. 65, 635-648
Ras, M., Steyer, J., Bernard, O., 2013. Temperature effect on
microalgae: A crucial factor for outdoor production, Reviews
in Environmental Science and Biotechnology. 12, 153-164.
Renaud, S.M., Thinh, L., Lambrinidis, G., Parry, D.L., 2002. Effect
of temperature on growth, chemical composition and fatty acid
composition of tropical Australian microalgae grown in batch
cultures, Aquaculture. 211, 195-214.
Rosso, L., Lobry, J.R., Flandrois, J.P., 1993. An unexpected
correlation between cardinal temperatures of microbial growth
highlighted by a new model, J. Theor. Biol. 162, 447-463.
Radmann, E.M., Reinehr, C.O., Costa, J.A.V., 2007. Optimization
of the repeated batch cultivation of microalga Spirulina
platensis in open raceway ponds. Aquaculture 265:118–126
Richmond, A., Cheng-Wu, Z., 2001. Optimization of a flat plate
glass reactor for mass production of Nannochloropsis sp.
outdoors. J Biotechnol 85(3):259–269
Richmond, A., Hu, Q., 2013. Handbook of Microalgal Culture:
Applied Phycology and Biotechnology. 1-16, 615-628.
Saoudi-Helis, L., Dubacq, J.-., Marty, Y., Samain, J.-., Gudin, C.,
1994. Influence of growth rate on pigment and lipid
composition of the microalga Isochrysis aff. galbana clone
T.iso, J. Appl. Phycol. 6, 315-322.
Sepúlveda, C., Acién, F. G., Gómez, C., Jiménez-Ruíz, N.,
Riquelme, C., Molina G. E., 2015. Utilization of centrate for
the production of the marine microalgae Nannochloropsis
gaditana. Algal Research. 9, 107-116.
72
Sierra, E., Acién, F.G., Fernandez, J.M., Garcia, J.L., Gonzalez, C.,
Molina, E., 2008. Characterization of a flat plate photobi-
oreactor for the production of microalgae. Chem Eng J
138:136–147
Singh, D.P., Singh, N., Verma, K., 1995. Photooxidative damage to
the cyanobacterium Spirulina platensis mediated by singlet
oxygen. Curr Microbiol. 31, 44–48
Tredici, M. R., 2004. Mass production of microalgae: photobior-
eactors. In: Richmond A (ed) Handbook of microalgal culture
biotechnology and applied phycology. Blackwell Publishing,
Iowa, Chapter 9, 179–214.
van Bergeijk, S.A., Salas-Leiton, E., Cañavate, J.P., 2010. Low and
variable productivity and low efficiency of mass cultures of
the haptophyte Isochrysis aff. galbana (T-iso) in outdoor
tubular photobioreactors, Aquacult. Eng. 43, 14-23.
Vejrazka, C., Janssen, M., Benvenuti, G., Streefland, M., Wijffels,
R.H., 2013. Photosynthetic efficiency and oxygen evolution of
Chlamydomonas reinhardtii under continuous and flashing
light, Appl. Microbiol. Biotechnol. 97, 1523-1532.
Watanabe, Y., Delanoue, J., Hall, D.O., 1995. Photosynthetic per-
formance of a helical tubular photobioreactor incorporating the
cyanobacterium Spirulina platensis. Biotechnol Bioeng
47:261–269
Weissman, J.C., Goebel, R.P., Benemann, J.R., 1988. Photobiore-
actor design: mixing, carbon utilization, and oxygen
accumulation. Biotechnol Bioeng 31:336–344

73
Ying, K., Gilmour, D.J., Zimmerman, W.B., 2014. Effects of CO2
and pH on growth of the microalga Dunaliella salina, J.
Microb. Biochem. Technol. 6, 167-173.
Yun, Y., Park, J.M., 2003. Kinetic modeling of the light-dependent
photosynthetic activity of the green microalga Chlorella
vulgaris, Biotechnol. Bioeng. 83, 303-311.
Zhang, C.W., Richmond, A., 2003. Sustainable, high-yielding
outdoor mass cultures of Chaetoceros muelleri var. subsalsum
and Isochrysis galbana in vertical plate reactors, Mar.
Biotechnol. 5, 302-310.
Zhu, Y.H., Jiang, J.G., 2008. Continuous cultivation of Dunaliella
salina in photobioreactor for the production of b-carotene. Eur
Food Res Technol 227:953–959