Embed Size (px)
Citation preview
Alma Mater Studiorum – Università di Bologna
DOTTORATO DI RICERCA IN FISICA
Ciclo XXVIII
Settore Concorsuale di afferenza: 02/D1
Settore Scientifico disciplinare: FIS/07
TIME DOMAIN AND SPATIALLY RESOLVED NMR:
ADVANCED APPLICATIONS TO POROUS MEDIA OF INTEREST
TO ENVIRONMENTAL SUSTAINABILITY
AND HUMAN HEALTHCARE
Presentata da Leonardo Brizi
Coordinatore Dottorato Relatore
Prof. Gastone Castellani Prof.ssa Paola Fantazzini
Esame finale anno 2016

To Sara…

SUMMARY
1 INTRODUCTION ................................................................................................... 9
2 NUCLEAR MAGNETIC RESONANCE IN POROUS MEDIA ......................... 17
2.1 RELAXATION OF FLUIDS IN POROUS MEDIA .......................................................... 17
2.2 DIFFUSION OF FLUIDS IN POROUS MEDIA .............................................................. 19
2.3 TWO-DIMENSIONAL NMR .................................................................................. 20
2.3.1 Relaxation correlation: T1-T2 relaxation-relaxation .................................... 22
2.3.2 Relaxation correlation: T2-T2 exchange-relaxation ..................................... 24
2.3.3 Diffusion-relaxation (D-T2) ........................................................................ 25
2.4 LAPLACE INVERSION .......................................................................................... 26
2.4.1 One-Dimensional Laplace Inversion........................................................... 27
2.4.2 Two-Dimensional Laplace Inversion .......................................................... 28
3 INSTRUMENTAL SETUPS ................................................................................. 30
3.1 INSTRUMENTS .................................................................................................... 30
3.1.1 Single-Sided NMR: the MOUSE Profile ...................................................... 30
3.1.2 Electromagnet Jeol ..................................................................................... 33
3.1.3 Artoscan Tomograph .................................................................................. 33
3.1.4 Halbach Magnet: Benchtop MRI tomograph .............................................. 34
3.2 PULSE SEQUENCES.............................................................................................. 35
3.2.1 One-Dimensional NMR Pulse Sequences .................................................... 36
3.2.2 Two-Dimensional NMR Pulse Sequences .................................................... 40
4 ADVANCED APPLICATIONS: ENVIRONMENTAL SUSTAINABILITY ..... 45
4.1 CULTURAL HERITAGE ........................................................................................ 45
4.1.1 Protective compounds ................................................................................ 46
4.1.2 Consolidative compounds ........................................................................... 60
4.2 CLIMATE CHANGE: EFFECTS OF OCEAN WARMING AND ACIDIFICATION ON CORALS75
4.2.1 First experiment: NMR study of corals along the Mediterranean Temperature
Gradient ............................................................................................................. 77
4.2.2 Second experiment: Coral skeletal porosity changes with ocean acidification
acclimation ......................................................................................................... 82
5 ADVANCED APPLICATIONS: HUMAN HEALTHCARE ............................... 88
5.1 BONE TISSUE AND OSTEOPOROSIS ....................................................................... 89

5.1.1 Materials and methods ................................................................................ 90
5.1.2 Results and discussions ............................................................................... 94
5.1.3 Conclusions................................................................................................. 99
5.2 CELLULAR COMPARTMENTALIZATION................................................................ 100
5.2.1 Materials and methods .............................................................................. 101
5.2.2 Results and discussions ............................................................................. 102
5.2.3 Conclusions............................................................................................... 108
6 CONCLUSIONS ................................................................................................... 110
7 REFERENCES ..................................................................................................... 115

LIST OF FIGURES
FIGURE 3.1 - SKETCH OF THE OPERATIONAL PRINCIPLE OF THE MOUSE. (1) SENSITIVE VOLUME, (2)
MAGNETIC FIELD B0 AND (3) THE COIL. ...................................................................................... 31
FIGURE 3.2: MOUSE PM10 MOUNTED ON A LIFT AND KEA II SPECTROMETER................................... 32
FIGURE 3.3: MRI APPARATUS BASED ON THE ARTOSCAN TOMOGRAPH ............................................... 34
FIGURE 3.4: A) SKETCH OF MAGNET GEOMETRY. B) MAGNET. C) TOMOGRAPH.................................... 35
FIGURE 3.5: SKETCH OF THE CPMG PULSE SEQUENCE. ...................................................................... 36
FIGURE 3.6 SCHEME OF THE SATURATION RECOVERY PULSE SEQUENCE. ............................................ 38
FIGURE 3.7: SKETCH OF THE STIMULATED ECHO SEQUENCE. .............................................................. 39
FIGURE 3.8: EXAMPLE OF T1-T2 DATA MATRIX Y ON THE LEFT, AND THE RESULTING MAP ON THE RIGHT.
................................................................................................................................................ 41
FIGURE 3.9: SKETCH OF THE CPMG-CPMG SEQUENCE. .................................................................... 42
FIGURE 4.1: MRI IMAGES OF AN INTERNAL SECTION OF THE SAMPLES OF LECCE STONE, OVER TIME OF
WATER ABSORPTION FROM THE TREATED FACE. NT IS THE UNTREATED SAMPLE. N215 IS THE
SAMPLE TREATED WITH FLUOROELASTOMER, SC2-PFPESOL AND SC2-PFPESUSP ARE THE
SAMPLES TREATED WITH SC2-PFPE IN SOLUTION AND IN SUSPENSION, RESPECTIVELY. THE LUT
REPRESENTS THE SIGNAL INTENSITY IN ARBITRARY UNITS. ......................................................... 50
FIGURE 4.2: WATER MASS PER DRY MASS (%) ABSORBED FROM THE TREATED FACE OF THE SAMPLES OF
FIGURE 4.1 AS A FUNCTION OF TIME. .......................................................................................... 51
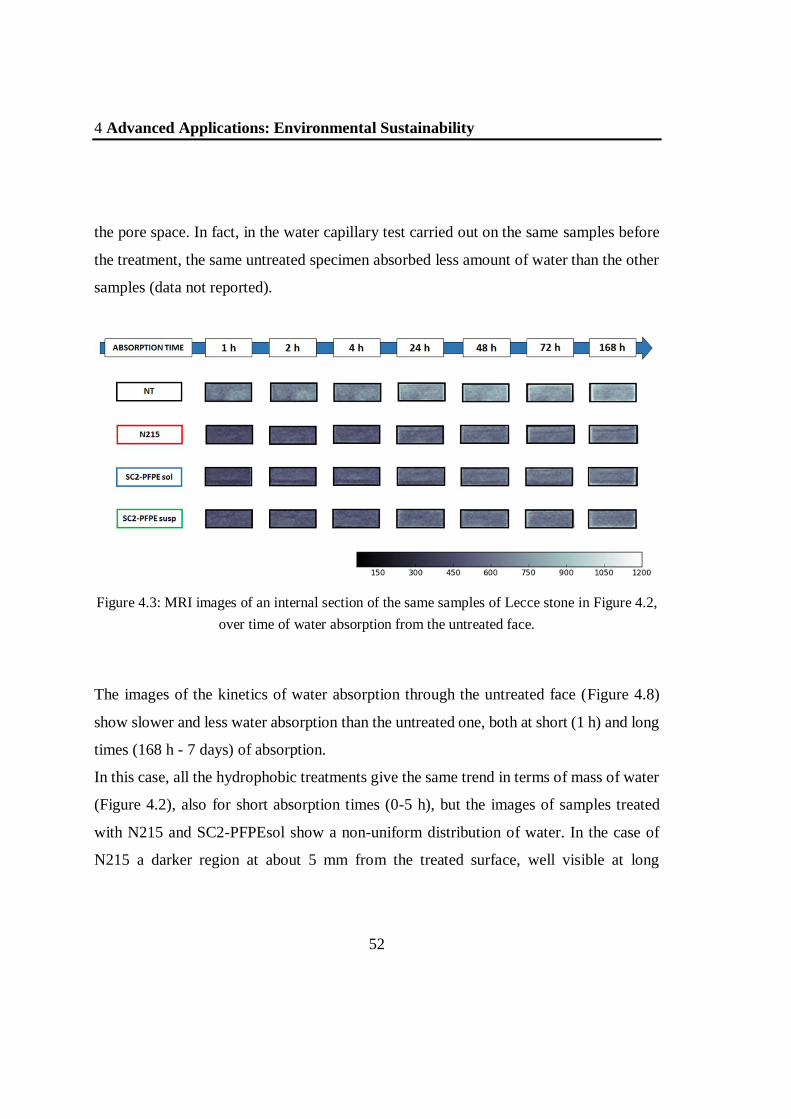
FIGURE 4.3: MRI IMAGES OF AN INTERNAL SECTION OF THE SAME SAMPLES OF LECCE STONE IN FIGURE
4.2, OVER TIME OF WATER ABSORPTION FROM THE UNTREATED FACE. ......................................... 52
FIGURE 4.4: WATER MASS PER DRY MASS (%) ABSORBED FROM THE UNTREATED FACE OF THE SAMPLES
OF FIG.4-1 AS A FUNCTION OF TIME. ........................................................................................... 53
FIGURE 4.5: THREE-DIMENSIONAL RECONSTRUCTED MRI IMAGE OF THE LECCE STONE SAMPLE TREATED
WITH SC2-PFPESOL AFTER 4 HOURS OF WATER ABSORPTION THROUGH THE UNTREATED FACE. .. 54
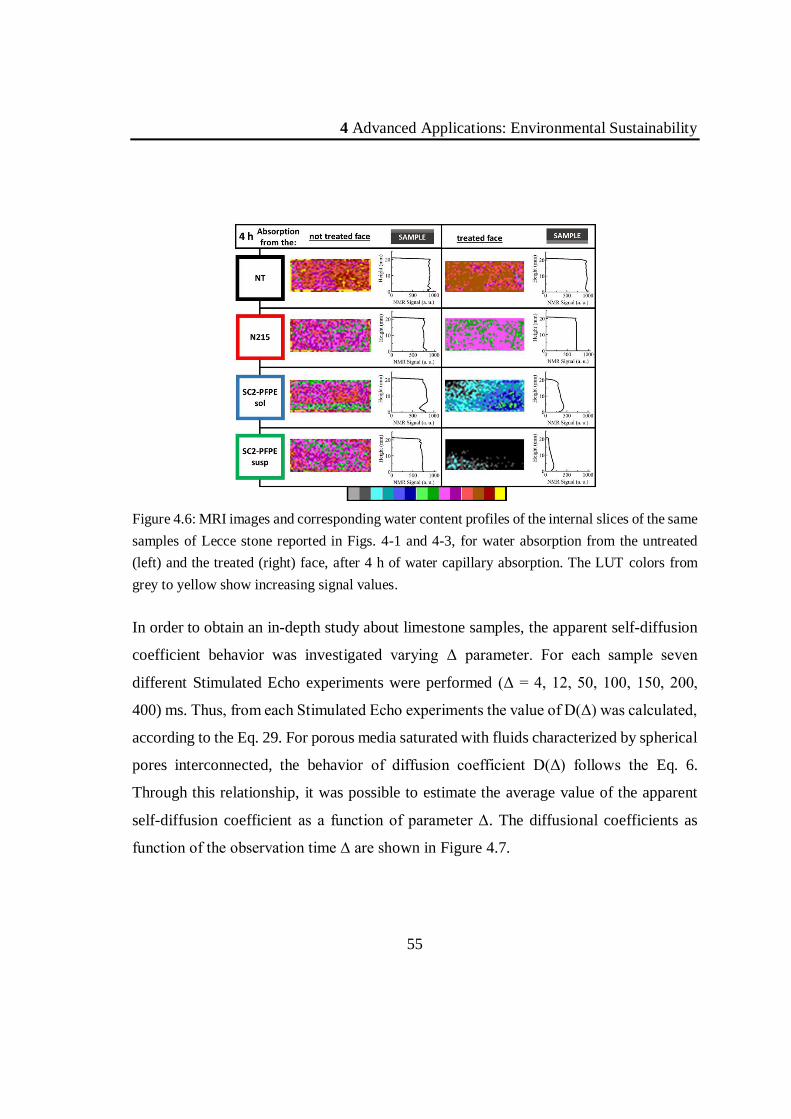
FIGURE 4.6: MRI IMAGES AND CORRESPONDING WATER CONTENT PROFILES OF THE INTERNAL SLICES OF
THE SAME SAMPLES OF LECCE STONE REPORTED IN FIGS. 4-1 AND 4-3, FOR WATER ABSORPTION
FROM THE UNTREATED (LEFT) AND THE TREATED (RIGHT) FACE, AFTER 4 H OF WATER CAPILLARY
ABSORPTION. THE LUT COLORS FROM GREY TO YELLOW SHOW INCREASING SIGNAL VALUES. ..... 55
FIGURE 4.7: DIFFUSIONAL COEFFICIENT AS FUNCTION OF Δ. UNTREATED SAMPLE. ............................. 56
FIGURE 4.8: REFERENCE SAMPLE. T1-T2 MAP ON THE LEFT AND D-T2 MAP FOR Δ=4 MS ON THE RIGHT. 57
FIGURE 4.9: D-T2 MAPS OF REFERENCE SAMPLE FOR MIXING TIME VALUES Δ = 4 MS AND 50 MS. ......... 58
FIGURE 4.10: SCHEMATIC OF CONSOLIDANTS APPLIED TO MAASTRICHT STONE. .................................. 61
FIGURE 4.11: DISTRIBUTION OF TRANSVERSE RELAXATION TIMES FOR SAMPLES IN THE DESICCATOR, ON
THE LEFT, AND SAMPLES IN THE CONDITION OF RH=75%, ON THE RIGHT. REFERENCE (BLACK), NEW
SYNTHETIZED COMPOUND (GREEN), NANO-SILICA (PINK), ETHYL SILICATE (RED) AND
FLUOROELASTOMER (BLUE)....................................................................................................... 65
FIGURE 4.12: DISTRIBUTION OF TRANSVERSE RELAXATION TIMES OBTAINED FROM CPMG DATA
ACQUIRED BY MOUSE PM 25 FOR THE REFERENCE SAMPLE. IN BLUE, THE DISTRIBUTION OF
TRANSVERSE RELAXATION TIMES FOR THE SAMPLE FULLY-SATURATED AND IN BLACK FOR THE
SAMPLE IN CONDITION OF RH=75%. .......................................................................................... 69
FIGURE 4.13: FROM THE LEFT: IMAGES, PROFILES OBTAINED BY THE VARIAN MRI TOMOGRAPH, AND
PROFILES FROM NMR-MOUSE PM25. FROM TOP TO BOTTOM THE SAMPLES TREATED WITH
ESTEL, NANO-SILICA, FLUOROELASTOMER, NEW SYNTHETIZED COMPOUND............................. 71
FIGURE 4.14: T2-T2 MAPS: FROM LEFT TO RIGHT INCREASING MIXING TIME . FROM TOP TO BOTTOM THE
DIFFERENT TREATMENTS: ESTEL, NANO-SILICA, FLUOROELASTOMER, NEW SYNTHETIZED
COMPOUND. .............................................................................................................................. 72
FIGURE 4.15: TRANSVERSE RELAXATION TIME DISTRIBUTIONS OF THE 1H NMR SIGNAL FROM SAMPLES
OF CLEANED CORAL SKELETONS, AFTER WATER SATURATION OF THE CONNECTED PORE SPACE. ... 79
FIGURE 4.16: ON THE LEFT, T2 DISTRIBUTION OF A DRY CORAL (BLUE LINE) AFTER 1 MONTH IN A
DESICCATOR AND THAT OF THE SAME CORAL AFTER FULL WATER SATURATION (RED LINE). ON THE
RIGHT, THE MIP RESULTS FOR THE SAME CORAL ARE SHOWN. .................................................... 80
FIGURE 4.17: EXAMPLES OF T2 RELAXATION TIME DISTRIBUTIONS OF 1H NMR SIGNAL FROM CLEANED
SKELETONS OF B. EUROPAEA AFTER WATER SATURATION OF THE CONNECTED PORE-SPACE. ........ 84
FIGURE 4.18: A) NMR MACRO-SCALE PORE VOLUME FRACTION IS REPORTED. C), D) AND E) SCATTERPLOT
REPORTED FOR THE TD-NMR POROSITIES AT MACRO- MICRO- AND NANO- FOR DIFFERENT PH
VALUES. ................................................................................................................................... 85
FIGURE 5.1: MICRO-CT SKYSCAN 1072(ON THE LEFT). EXAMPLE OF A 2D RECONSTRUCTION (ON THE
RIGHT). ..................................................................................................................................... 91
FIGURE 5.2: EXAMPLES OF PIG BONE SAMPLES USED IN THE EXPERIMENT. .......................................... 92
FIGURE 5.3: SKETCH OF THE SETUP FOR FOUR CPMG EXPERIMENTS ON BONE SAMPLES. ..................... 93
FIGURE 5.4: T1 AND T2 DISTRIBUTIONS OF THE BULK MARROW. .......................................................... 95
FIGURE 5.5: COMPARISON NMR VS MICRO-TC OF THE BONE MARROW PERCENT IN FUNCTION OF THE
DEPTH INSIDE THE SAMPLE. TO COMPUTE THIS NMR PARAMETER, THE NMR PROFILE SIGNAL FROM
THE BONE SAMPLE WAS DIVIDED BY THE PROFILE SIGNAL COMING FROM THE BULK MARROW SAMPLE
(WITHOUT BONE) AT THE SAME DEPTH. ...................................................................................... 96
FIGURE 5.6: MICRO-CT IMAGE OF: A) CONDILO IB; B) CONDILO IIB; C) TESTA IIA; ........................... 97
FIGURE 5.7: SIGNAL INTENSITY, FROM CPMG DATA, OF THE BONE SAMPLES. .................................... 98
FIGURE 5.8: EXAMPLES OF T1 DISTRIBUTIONS OF THE 1H-NMR SIGNAL FROM CM (RED, DASHED LINE),
CELLS (BLUE, SOLID LINE) AND HOMOGENATE (GREEN, DOTTED LINE) AFTER ILT OF THE
CORRESPONDENT RELAXATION CURVES SHOWN IN THE INSERT. DATA WERE TAKEN WITHIN THIRTY
MINUTES FROM SAMPLE PREPARATION. RESULTS ARE REPRESENTATIVE OF ALL THE ANALYZED
SAMPLES. ................................................................................................................................ 103
FIGURE 5.9: EXAMPLES OF T2 RELAXATION TIME DISTRIBUTIONS OF THE SAME SAMPLES OF FIG. 5.8, CM
(RED, DASHED LINE), CELLS (BLUE, SOLID LINE) AND HOMOGENATE (GREEN, DOTTED LINE)
AFTER ILT OF THE CORRESPONDENT RELAXATION CURVES SHOWN IN THE INSET. DATA WERE TAKEN
WITHIN THIRTY MINUTES FROM SAMPLE PREPARATION. RESULTS ARE REPRESENTATIVE OF ALL THE
ANALYZED SAMPLES. .............................................................................................................. 104
FIGURE 5.10: A SELECTION OF T2 RELAXATION TIME DISTRIBUTIONS OF THE 1H-NMR SIGNAL FROM A
SAMPLE OF CELLS IN CULTURE MEDIUM AT DIFFERENT TIMES AFTER PREPARATION OF THE SAMPLE.
IT’S CLEAR THE PROGRESSIVE SHIFT TO SHORTER RELAXATION TIMES OF THE DISTRIBUTION
RELATED TO THE COMPARTMENT ASSIGNED TO EXTRACELLULAR WATER (PEAK AT LONGER T2). THE
AREAS UNDER THE DISTRIBUTIONS ARE PROPORTIONAL TO THE SIGNAL INTENSITIES, PROPORTIONAL
TO THE NUMBER OF 1H NUCLEI CONTRIBUTING TO THE SIGNAL. THE TOTAL AREA DID NOT CHANGE
OVER TIME. ............................................................................................................................. 106
FIGURE 5.11: SCHEME OF THE COMPARISON OF NMR RESULTS AND OPTICAL MICROSCOPY
OBSERVATIONS. ...................................................................................................................... 108

1 Introduction
9
1 INTRODUCTION
The research performed during the three years of PhD study at the Department of Physics
and Astronomy (DIFA) of the University of Bologna is part of a long-term project
developed at the Nuclear Magnetic Resonance (NMR) Laboratory of this department,
which goal is the advancement of theoretical approaches, methodologies, algorithms, and
applications of Magnetic Resonance for fluids in Porous Media (shortly MRPM) [1].
The MRPM Community is now a vast community of scientists from all over the world,
who recognize in Magnetic Resonance an instrument of choice for the characterization of
porous media and of fluids inside in a vast range of different materials. The scene was
different in 1990, when a series of conferences on these themes was promoted at the
University of Bologna. Now this conference series is called International Bologna MRPM
conferences and is spread all over the world; after being held in many countries in Europe,
USA and New Zealand, the 13th edition will turn back to Bologna in September 2016.

1 Introduction
10
One can say that now MRPM studies have acquired the dignity of a new interdisciplinary
discipline.
Now, MRPM methodologies have become increasingly important tools to investigate
pore space as well as surface and fluid properties in a wide class of heterogeneous high
surface-to-volume ratio systems, of natural or synthetic origin, of organic or inorganic
nature. Porous rocks, porcelains, zeolites, colloids, emulsions, gels, suspensions, as well
as biological systems as bones, cartilage, cells and foods are in the mainstream of
materials studied [2]–[5]. Structure, fluid-flow properties, water absorption, water
diffusion and exchange among compartments are typical phenomena examined.
This thesis is an example of the different fields in which the same techniques, methods of
data acquisition and algorithms for data analysis can be applied to get unique information,
from system characterized by a wide range of scale lengths, which in some cases can span
from a few nanometers to the macroscale level, and by compartments in which water can
be confined under different regimes of diffusion and exchange.
From the beginning, these techniques and interpretation models were applied to both solid
porous media and biological systems that, for many aspects, can be considered as porous
media. In this thesis the same methods of data tacking and analysis will be applied to both
rocks and biological systems. The biological systems will be solid porous media, as bone
and corals, but also human cells.
The growth of MRPM from the end of the 1940s was bound for years to the development
in oil industry of Nuclear Magnetic well Logging (NML) projects. The idea on the basis
of these projects was to detect the NMR signal of oil and water down in the oil-wells at
the depth of thousands of meters, to evaluate the fraction oil-to-water in the pore space of
the rock formation around the well. In these first works the origin can be found of

1 Introduction
11
techniques later developed for applications other than well logging or petrophysical
studies, that is, field-cycling and ex-situ techniques. This last technique allows one to get
NMR signal from samples placed outside the magnet. Part of this thesis will be devoted
to apply this technique.
The MRPM work at Bologna began in the mid-eighties. New correlations were found
among parameters from NMR relaxation measurements and such oilfield parameters as
porosity, permeability to fluid flow, irreducible water saturation, residual oil saturation,
and surface-to-volume ratio, and fast algorithms were developed to give the different
NMR parameters. Interest in valid interpretation of data led to extensive work also on
the inversion of multiexponential relaxation data and the effects of inhomogeneous fields
from susceptibility differences on distributions of relaxation times. In the last few years
extensive developments were made of combined magnetic resonance imaging and
relaxation measurements in different fields [1].
The last advancements, object of this thesis, regard measurements in highly homogeneous
magnetic fields and in the presence of the magnetic field gradient of single-sided devices.
The experiments performed are single and multi-dimensional NMR experiments. In
particular, during this thesis project two-dimensional correlation analyses have been
settled and exploited, including relaxation-relaxation, relaxation-diffusion, relaxation
exchange. These techniques allow one to study surface-to-volume, tortuosity and
connectivity in solid porous media and water exchange and compartmentation in cells.
The most important MRPM techniques applied in this thesis are Relaxometry,
Diffusometry and Imaging (MRI) of 1H nuclei of liquid water confined inside the pore
space of the porous material. Everybody knows MRI, due to the huge impact it has had
1 Introduction
12
on medicine, thanks to its impressive diagnostic power. Nevertheless, very few experts
know that MRI can be applied to visualize in a non-destructive manner internal sections
of porous media saturated with water [6], with the possibility of 3D reconstructions of the
structure of the pore space occupied by water. While imaging allows one to get
information at the sample-scale, relaxation data give information at the pore-scale.
Relaxometry and MRI can be combined in Relaxation-Imaging, which allows the
spatially-resolved study of NMR parameters connected with the pore space. Diffusometry
allows one to measure apparent self-diffusion coefficient of water inside the pore space,
and measurements performed allowing increasing diffusion times allow one to determine
surface-to-volume ratio and tortuosity of the pores. Measurements allowing for increasing
exchange time allow one to determine connectivity among pores. These techniques are
also applicable by means of portable instruments or instruments that can in any case be
transported for measurements in situ.
A part of this thesis is devoted to Cultural Heritage applications. Until recent years no
one would have thought of employing NMR techniques for materials and objects of
historical-artistic-archaeological interest. This was true because for the study of materials
people thought mainly of NMR Spectroscopy, a technique for high resolution in
chemistry. The scene changed when it was thought to apply to Cultural Heritage the
wealth of knowledge and technology developed in the field of MRPM, that can now be
profitably applied to the preservation of the Cultural Heritage [7] for both laboratory
research and in situ diagnosis on porous media like rocks, ornamental stones, bricks,
cements, mortars, wood. What makes MRPM appealing for Cultural Heritage is the
capability of probing in non-destructive and non-invasive manner water molecules inside
1 Introduction
13
the pore space [8]. It is well known that water is the main deterioration agent for porous
materials, in which gases and water can diffuse from the environment. This gives rise to
the dissolution of the binder and the creation of internal mechanical stresses. Water also
dissolves pollutants from the atmosphere, causing acidic corrosion of stone. Quantitative
measurement of the moisture contained in a porous material and of lengths characteristic
of the pore space can be analyzed before and after treatment with protective and/or
consolidative product, and followed in time, in such a way that they can furnish
information useful for diagnosis and therefore for planning the most appropriate
conservation, restoration, and maintenance procedures. The results presented in this thesis
demonstrate the great advancements that MRPM can determine, as compared to the
traditional methods, in the study of the water-surface interactions in the presence of
conservative products, their uniform or non-uniform distribution inside the samples, the
efficacy of protective and consolidative treatments. This research has been performed in
collaboration with the “Istituto di Geologia e Georisorse – CNR” of Florence, and in
Germany in collaboration with the research group at the Department of Macromolecular
Chemistry of the RWTH University of Aachen.
The same techniques applied to stones of interest to cultural heritage can be applied to
other porous media. In this thesis they have been applied to the skeletons of corals and
human (or animal) bones. They are solid porous media, with a multi-scale length of pore
sizes. If the pore space is saturated with fluids containing 1H nuclei, MRPM methods
allow one to quantify the porosity at different scale lengths.
In the case of the coral skeletons, important correlations have been found between the
porosity at the macroscale and the level of acidity of the sea water when the corals have
1 Introduction
14
grown. Important conclusions have been drown about a possible acclimation process of
the corals in a world subjected to climate change, with ocean warming and acidification,
This research has been performed in collaboration with the group of Marine-Biology of
the Department BiGEA (University of Bologna).
In the case of bones, the goal of the project was to propose and test an innovative and
non-invasive procedure for the diagnosis of osteoporosis by means of a portable, low-
cost, low field NMR instrument. The results show that the values of an important
parameter, the bone volume-to-total volume ratio, determined with the proposed
procedure are consistent with the values obtained for comparison with CT analysis. This
research has been performed in collaboration with the “Laboratorio di Tecnologie
Biomediche - Istituto Ortopedico Rizzoli” of Bologna.
For the analysis of bones, as well for the samples examined for the research on Cultural
Heritage, NMR single-sided instruments have been utilized.
For some aspects, also cells can be considered as “porous media”, even if in this case
there are not solid surface to confine water, but membranes. The relaxometry can be used
to detect the changes of the cellular environments and the water compartmentalization. In
this thesis results are reported of the analysis of changes of a cellular population under
stress. The behavior of the NMR signals (in terms of relaxation times and relative signal
fractions) allowed us to distinguish three phases, consistent with the results of optical
microscopy analyses. This research has been performed in collaboration with the group
of Biophysics of the Department of Physics and Astronomy of the University of Bologna.

1 Introduction
15
In summary, time-domain and spatially resolved NMR techniques developed in the field
of Magnetic Resonance for fluids in Porous Media have been successfully applied to
study various porous systems of different nature and origin, containing hydrogenous
fluids. The unifying principle of this work is showing how the NMR analyses performed
with these techniques can be extended to a multiplicity of porous material and how these
methods are able to investigate the structure of the pore space and other features in a non-
destructive manner, on the intact sample, from the macroscopic scale to the nanometric
one. Moreover, the results of this thesis demonstrate that the same experimental NMR
procedures can be successfully applied to perform researches in important topics that deal
with the Sustainability of Environment and Human Healthcare.
An important part of my work during the PhD, beside contributing to the planning of the
experiments, to data acquisition and interpretation, has been devoted to: (i) the
implementation of the technology of multi-dimensional data acquisition and analysis at
the NMR laboratory of the Department DIFA; (2) the setup of the single-sided NMR
instrument, constituted by the NMR MOUSE, the lift for its automatic movement, and
the console for NMR experiment acquisition. An important experience on the use of this
instrument has been acquired during my research period (6 months) spent in Germany
(University of Aachen and Forschungszentrum of Jülich).
This thesis consists of 6 chapters. The first one is this Introduction. In the second chapter
the theory of mono and multi-dimensional time-domain NMR is exposed. The third
chapter describes the experimental setups and instruments used. The fourth chapter is

1 Introduction
16
related to the researches devoted to the Environment Sustainability, the fifth to the Human
Healthcare. In the last chapter the conclusions are summarized.
2 Nuclear Magnetic Resonance in Porous Media
17
2 NUCLEAR MAGNETIC
RESONANCE IN POROUS
MEDIA
The physical phenomenon of 1H Nuclear Magnetic relaxation, in molecular fluids, is
mostly caused by dipolar interactions between nuclear spin of nuclei that constitute the
fluid. In various hydrogenous liquids, the main source of relaxation is the dipolar
relaxation of protons of the same molecule. Usually small molecules (in this case water
molecules) are characterized by a fast rotational diffusion that makes the correlation time
short and thus the relaxation is weak. In this chapter, relaxation and diffusion processes
of hydrogenous fluid confined in porous media are discussed.
2.1 Relaxation of fluids in porous media
NMR relaxation and diffusion are fundamental phenomena for investigating the dynamics
of nuclei and their interaction with surrounding environment. In fluids that saturate
porous media, some physical processes participate in the relaxation. The most significant
contribution is related to the diffusion at the surface of pores, where spins experience
relaxation at the boundary of liquid-solid [9], [10]. In order to describe this behavior, the
surface relaxivity parameter ρ, related to properties of the solid matrix and of the fluid at

2 Nuclear Magnetic Resonance in Porous Media
18
the solid-liquid interface, is considered. The so called surface relaxation is the physical
phenomenon that characterized the interaction between the solid surface and the
molecular fluid [11].
Considering a fully saturated pore of volume Vp, with a surface layer of liquid of thickness
d and volume VL = dS, where S is the total surface of the pore, the effective relaxation is
an average between the contribution of the bulk and the surface, since the water molecule
moves between the bulk volume of the pore and the thin layer at the surface. Relaxation
parameters T1,2 are described by the following equation:
1
𝑇1,2=
1
𝑇1𝑏,2𝑏+
𝑑 ∙ 𝑆
𝑉𝑃∙
1
𝑇1𝑠,2𝑠 Eq. 1
Where indexes b denotes the bulk relaxation and s the relaxation at the surface. Defining
the surface relaxivity ρ1,2 ≡ d / T1s,2s the above equation become the well-known equation:
1
𝑇1,2=
1
𝑇1𝑏,2𝑏+ 𝜌1,2 ∙
𝑆
𝑉𝑃 Eq. 2
with ρ1 and ρ2 surface relaxivity for T1 and T2 relaxation respectively. This relationship is
justified by the assumption of fast diffusion according to which molecules diffuse quickly
between the surface and the bulk volume. This assumption is valid in a wide class of
porous media saturated with water as reported in literature [12], [13], [14], where the
validity of this assumption is verified by the comparison between Mercury Injection
Porosimetry (MIP) and NMR analyses.

2 Nuclear Magnetic Resonance in Porous Media
19
2.2 Diffusion of fluids in porous media
The porous structure of the medium confines the motion of fluid molecules and often this
feature determines a reduction of the measured diffusion coefficient D(t) [15], called
apparent diffusion coefficient, respect to its bulk value D0. The bulk diffusion coefficient
is an important parameter to describe the translational diffusion under the condition of
random Brownian motion. The Einstein’s definition is valid for times t much larger than
times that characterize molecular collisions
⟨[𝑟′(𝑡) − 𝑟(0)]2⟩ = 2𝑑𝑖𝑚 𝐷0 𝑡 Eq. 3
Where <…> is the mean square displacement of diffusing molecules over all initial r(0)
and final r’(t) positions, dim is the dimensionality of the system and 0 is the index of D for
indicating the bulk condition.
In porous media, since the solid matrix is not permeable by water, the motion of fluid
molecules is restricted. In particular, for an open porous material with interconnected
pores, the apparent diffusion coefficient D(t) shows two different behaviors depending
on the time interval given to molecules for diffusing.
At short diffusion time [16], molecules diffuse a distance (D0 t)1/2 that is comparable to
the characteristic length scale of the pore and, for this reason, molecules are sensitive only
to the confining geometry of the pore. The attenuation of the diffusion coefficient results
to be
𝐷(𝑡)
𝐷0≈ 1 − 𝐴√𝐷0 𝑡
𝑆
𝑉𝑃 Eq. 4
2 Nuclear Magnetic Resonance in Porous Media
20
Where A is a dimensionality constant (𝐴 =4
9√𝜋 for spherical pores). The second behavior
occurs when the diffusion mean square displacement is larger than the pore size. In this
situation, if pores are well-connected, diffusing molecules move around the grains in such
a way that the total distance in order to achieve a displacement x is larger than x. Thus,
the reduction of D(t), at long diffusion time, approaches a constant value related to the
tortuosity factor α according to the following equation:
𝐷(𝑡 → ∞)
𝐷0≈
1
𝛼 Eq. 5
For porous media saturated with fluids characterized by spherical pores interconnected,
the attenuation of the diffusion coefficient follows the equation [17]:
𝐷(𝑡)
𝐷0= 1 −
4√𝐷0𝑡
9√𝜋
𝑆𝑉𝑃
+ (1 −1𝛼)
𝐷0𝑡𝐷0𝜃
(1 −1𝛼) +
4√𝐷0𝑡
9√𝜋
𝑆𝑉𝑃
+ (1 −1𝛼)
𝐷0𝑡𝐷0𝜃
Eq. 6
Where θ is a fitting parameter with dimensions of time and it represents the typical time
that the molecules need to diffuse a macroscopic distance l to reach the tortuosity limit
[18] θ = l2/D0.
2.3 Two-dimensional NMR
Usually, the one-dimensional NMR concerns an experiment in which signals are acquired
as a function of a controlled variable parameter of the specific rf pulse sequence used. On
2 Nuclear Magnetic Resonance in Porous Media
21
the contrary, the multi-dimensional NMR, in particular two-dimensional NMR, refers to
an experiment performed by controlling two different variable parameters. In order to
obtain the two-parameter correlation function, a two-dimensional Inverse Laplace
Transform (ILT) is required. The two-dimensional NMR methods exploited in this thesis
regard the following two correlation functions: Exchange-Relaxation (T2-T2) and
Diffusion-Relaxation (D-T2).
In a conventional 2D-NMR experiment, where the two dimensions are the parameters x
and y, a data matrix M is sampled for variable times 1 and 2. The relationship between
acquired data and the correlation function F(x, y) is given by a Fredholm integral of the
first kind with the tensor product kernel:
𝑀(𝜏1, 𝜏2) = ∬ 𝐹(𝑥, 𝑦)𝑘1(𝑥, 𝜏1 )𝑘2(𝑦, 𝜏2) 𝑑𝑥𝑑𝑦 Eq. 7
Where k1 and k2 are continuous and smooth functions. For fluids in connected porous
media, characterized by diffusion between pores, the diffusion phenomenon cannot be
assumed as independent from relaxation and is described [19] by equation Eq. 8.
Indeed, the evolution of magnetization in the presence of diffusion and relaxation
phenomena is described by the Bloch-Torrey equation [20]:
𝛿
𝛿𝑡𝑚(𝑟, 𝑡) = 𝐷0𝛻2𝑚(𝑟, 𝑡) − 𝜇𝑚(𝑟, 𝑡) Eq. 8
where µ is the bulk relaxation rate and m is the relative difference of the magnetization
and its equilibrium. The acquired signal is 𝑀(𝑡) = ∫ 𝑚(𝑟, 𝑡)𝑑𝑣 .

2 Nuclear Magnetic Resonance in Porous Media
22
The general solution of the Eq. 8 can be written as a sum of eigenmodes:
𝑚(𝑟, 𝑡) = 𝑒−𝜇𝑡 ∑ 𝑎𝑖𝑒−
𝑡𝜏𝑖
∞
𝑖=0
Eq. 9
where ai are the weights of the eigenmodes in the magnetization, ϕi are normalized
eigenfunctions and i normalized eigenvalues. ϕi with i ≠ j are orthogonal and satisfy:
𝐷0𝛻2𝜙𝑖(𝑟) +1
𝜏𝑖= 0 Eq. 10
with the boundary condition at the pore surface 𝐷�̂� ∙ ∇𝜙𝑖 + 𝜌𝜙𝑖 = 0 where �̂� is the unit
vector normal to the pore surface S. Generally, the two eigensystems related to T1 and T2
processes are different because the surface relaxivity ρ assumes different values for T1
and for T2.
2.3.1 Relaxation correlation: T1-T2 relaxation-relaxation
The typical T1-T2 experiment uses the IR-CPMG as pulse sequence. In this case spins
show two different dynamics. In the first period ta, the magnetization evolves according
to a T1 process and it is described by L-modes. At the end of this period, the magnetization
m1(r,ta) is
𝑚1(𝒓, 𝑡𝑎) = ∑ 𝑎𝑖𝜙𝑖𝐿(𝒓)𝑒
−𝑡𝑎
𝑇1𝑖
∞
𝑖=0
Eq. 11
2 Nuclear Magnetic Resonance in Porous Media
23
where ai is determined by the magnetization at the end of the first π pulse, m0(r) = -1.
The second period starts with the π/2 pulse. The pulse rotates the magnetization to the
transverse plane and the pin dynamics follows a T2 process governed by T-modes. The
CPMG echo signal, m(r,ta,tb), evolves according the Eq.12.
𝑚(𝒓, 𝑡𝑎 , 𝑡𝑏) = ∑ 𝑏𝑗𝜙𝑗𝑇(𝒓)𝑒
−𝑡𝑏
𝑇2𝑗
∞
𝑗=0
Eq. 12
where 𝑏𝑗 = ∫ 𝑚1(𝒓, 𝑡𝑎)𝜙𝑗𝑇(𝒓)𝑑𝑣. In the time-domain, the signal is the integral of the
magnetization:
𝑆(𝑡𝑎 , 𝑡𝑏) = ∫ 𝑚(𝒓, 𝑡𝑎 , 𝑡𝑏)𝑑𝑣 = ∑ 𝑠𝑖𝑗𝑒−
𝑡𝑎𝑇1𝑖
− 𝑡𝑏
𝑇2𝑗
𝑖,𝑗
Eq.13
Using the notation ⟨𝜙𝑗 |𝜓𝑖
⟩ = ∫ 𝜙𝑗∗ 𝜓𝑖
𝑑𝑣 , where 𝜙𝑗∗ is the complex conjugate of 𝜙𝑗
,
𝑠𝑖𝑗 = ⟨𝜙𝑗𝑇|1⟩⟨𝜙𝑗
𝑇|𝜙𝑖𝐿⟩⟨𝜙𝑖
𝐿|1⟩. The |1⟩ represents a constant function within the pore.
After a Laplace inversion, the resulting spectrum is
𝑠12(𝑇2𝑏, 𝛥, 𝑇2
𝑎) = ∑⟨1|𝜙𝑖𝑇⟩⟨𝜙𝑖
𝑇|𝜙𝑟𝐿⟩⟨𝜙𝑟
𝐿|1⟩ × 𝛿(𝑇1 − 𝑇1,𝑖)
𝑖,𝑗,𝑟
𝛿(𝑇2 − 𝑇2,𝑗) Eq.14
Signals with i = j are called diagonal and with i ≠ j off-diagonal.
2 Nuclear Magnetic Resonance in Porous Media
24
2.3.2 Relaxation correlation: T2-T2 exchange-relaxation
A T2-T2 experiment uses a pulse sequence composed by two CPMG with a time interval
Δ interposed. During the time period ta related to the first CPMG sequence, the
magnetization dynamics is described by T-modes (ϕiT). At the end of the period, the
magnetization m1(r, ta) results to be:
𝑚1(𝒓, 𝑡𝑎) = ∑ 𝑎𝑖𝜙𝑖𝑇(𝒓)𝑒
−𝑡𝑎𝑇2𝑖
∞
𝑖=0
Eq. 15
After the time interval Δ, where the magnetization relaxes according to the T1 process,
another train of CPMG pulses is used for acquiring data. The evolution of the detected
signal m(r, ta, tb) is:
𝑚(𝒓, 𝑡𝑎 , 𝑡𝑏) = ∑ 𝑏𝑗𝜙𝑗𝑇(𝒓)𝑒
−𝑡𝑏
𝑇2𝑗
∞
𝑗=0
Eq. 16
where 𝑏𝑗 = ∫ 𝑚1(𝒓, 𝑡𝑎)𝜙𝑗𝑇(𝒓)𝑑𝑣. In the time-domain, the signal is the integral of the
magnetization:
𝑆(𝑡𝑎 , 𝑡𝑏) = ∫ 𝑚(𝒓, 𝑡𝑎 , 𝑡𝑏)𝑑𝑣 = ∑ 𝑠𝑖𝑗𝑒−
𝑡𝑎𝑇2𝑖
− 𝑡𝑏
𝑇2𝑗
𝑖,𝑗
Eq. 17
Using the notation ⟨𝜙𝑗 |𝜓𝑖
⟩ = ∫ 𝜙𝑗∗ 𝜓𝑖
𝑑𝑣 , where 𝜙𝑗∗ is the complex conjugate of 𝜙𝑗
,
𝑠𝑖𝑗 = ⟨𝜙𝑗𝑇|1⟩⟨𝜙𝑗
𝑇|𝜙𝑖𝑇⟩⟨𝜙𝑖
𝑇|1⟩. The |1⟩ represents a constant function within the pore.
After a Laplace inversion, the resulting spectrum is
2 Nuclear Magnetic Resonance in Porous Media
25
𝑠22(𝑇2𝑏, 𝛥, 𝑇2
𝑎) = ∑⟨1|𝜙𝑖𝑇⟩⟨𝜙𝑖
𝑇|𝜙𝑟𝐿⟩⟨𝜙𝑟
𝐿| ⟩⟨𝜙𝑗𝑇|1⟩𝑒
− ∆
𝑇1𝑟 ×
𝑖,𝑗,𝑟
× × 𝛿(𝑇2𝑎 − 𝑇2𝑖) 𝛿(𝑇2
𝑏 − 𝑇2𝑗)
Eq. 18
During the period Δ, spins relax according to the T1 process, thus, the magnetization
dynamics is described by L-modes. When Δ = 0 → ∑ |𝜙𝑟𝐿⟩⟨𝜙𝑟
𝐿|𝑟 = 1 and the spectrum is
𝑠22(𝑇2𝑏, 𝛥, 𝑇2
𝑎) = ∑ ⟨1|𝜙𝑝𝑇⟩⟨𝜙𝑞
𝑇|1⟩ × 𝛿(𝑇2𝑎 − 𝑇2𝑝)
𝑝,𝑞,𝑟
𝛿(𝑇2𝑏 − 𝑇2𝑞) Eq. 19
and only diagonal signals survive. When Δ is long, the weight distribut ion is controlled
by the non-orthogonality between 𝜙𝑝𝑇 and 𝜙𝑞
𝑇 , and off-diagonal peaks appear in the
resulting map.
Further details about the specific experiment performed in this thesis are discussed in the
section 3.2.2.2.
2.3.3 Diffusion-relaxation (D-T2)
The correlation function D-T2 is often studied by the use of a STE-CPMG, a Stimulated
Echo sequence followed by a CPMG sequence, with Pulsed Field Gradients (PFG). In
this situation, the spin dynamics has two different behaviors. The first is encoded by the
first gradient pulse and the second is decoded by a second identical gradient after a time
interval Δ. Thus, the magnetization after the first gradient m1(r, 1) is
2 Nuclear Magnetic Resonance in Porous Media
26
𝑚1(𝑟, 𝛥, 𝑞) = ∑ 𝑎𝑗𝜙𝑗 (𝑟)𝑒−𝑖𝑞𝑟𝑒
𝛥𝑇1𝑗
∞
𝑗=0
Eq. 20
where 𝑎𝑗 = ⟨1|𝑒−𝑖𝒒𝒓|𝜙𝑗 ⟩ = ∫ 𝑒−𝑖𝒒𝒓 𝜙𝑗
(𝒓)𝑑𝒓. T1j corresponds to decay time constants
and L-modes describe the magnetization. After a time interval Δ, a second identical
gradient is pulsed. Then, the second part of the sequence is a CPMG, thus spins are
governed by ϕT modes. The echo signal m(r, Δ, t) evolves according to
𝑚(𝒓, 𝛥, 𝑡) = ∑ 𝑏𝑗𝜙𝑗𝑇(𝒓)𝑒
−𝑡
𝑇2𝑗∞𝑗=0 Eq. 21
where 𝑏𝑗 = ∫ 𝑚1(𝒓, ℎ, 𝒒)𝜙𝑗𝑇(𝒓)𝑑𝑣 . The resulting time-domain signal over the total
volume is
𝑆(𝛥, 𝒒, 𝑡) = ∫ 𝑚(𝒓, 𝛥, 𝒒)𝑑𝑣 = ∑ 𝑠𝑙𝑗(𝒒)𝑒−
𝛥𝑇1𝑙
−𝑡
𝑇2𝑗
𝑙,𝑗
Eq. 22
where 𝑠𝑙𝑗(𝑞) = ⟨1|𝑒𝑖𝒒𝒓|𝜙𝑙 ⟩⟨𝜙𝑙
|𝑒−𝑖𝒒𝒓|𝜙𝑗𝑇⟩⟨𝜙𝑗
𝑇|1⟩ .
Further details about the specific experiment performed for this thesis are discussed in
the subsection 3.2.2.3.
2.4 Laplace Inversion
In NMR relaxometry and diffusometry most of data analyses are performed by the use of
a Laplace inversion in order to obtain the distribution of relaxation times or diffusion
parameters. This kind of inversion is ill-conditioned and small noise can drastically affect
2 Nuclear Magnetic Resonance in Porous Media
27
the resulting distribution [21]. One of the most common way to solve this problem is
described in this subchapter, where the essential mathematics for approaching the ILT
problem is presented.
2.4.1 One-Dimensional Laplace Inversion
The one-dimensional Laplace inversion consist in the determination of the relaxation
times distribution A(T) from the acquired dataset M(), and 𝑀(𝜏) = ∫ 𝑒−𝜏
𝑇 𝐴(𝑇)𝑑𝑇 + 휀,
where T is the relaxation constant and ε is the noise. In discretized matrix form, the
previous equation can be rewritten as
𝑀 = 𝐾𝐴 + 𝐸 Eq. 23
M is the data vector and N the noise vector. Matrix K is the kernel and A is the discretized
version of A(T). Thus, M and K are known and the true solution A satisfies the criterion
‖𝑀 − 𝐾𝐴‖ < 𝜎, where ‖ ‖ is the vector norm and σ is the variance of the noise. In the
real case, several solutions satisfy the criterion. In order to find a unique solution a certain
criterion is chosen (i.e. stability against noise) and a regularization method [22] is applied.
A fit to the data is obtained through the minimization of the following expression:
‖𝑀 − 𝐾𝐴‖2 + 𝛼‖𝐴‖2 Eq. 24
where the first term calculates the difference between the data and the fit, and the second
is the regularization terms controlled by the parameter α. The regularization finds a

2 Nuclear Magnetic Resonance in Porous Media
28
smooth solution with a small 2-norm ‖ 𝐴2‖. The minimization is usually accelerated by
the use of Singular Value Decomposition (SVD) of the matrix K.
2.4.2 Two-Dimensional Laplace Inversion
Two-dimensional NMR experiments are performed by controlling two different
parameters 1 and 2 of the pulse sequence. Most of sequences are designed in order to
acquire data that exhibit a behavior described by the Eq. 7, where the kernel k is split into
two independent components k1 and k2,
k(τ1, τ2, x, y) = k1(τ1, x)k2(τ2, y) . Eq. 25
Here x and y are the distribution parameters (T1, T2 and D). In this case, previous equation
can be written in matrix notation as:
𝑀 = 𝐾1𝐴𝐾2𝑇 + 𝐸 Eq. 26
where M and E are two-dimensional data matrixes of data and noise, respectively. The
elements of the kernel matrixes are defined by (𝐾1)𝑖𝑗 = 𝑘1(1𝑖 , 𝑥1𝑗) and (𝐾2)𝑖𝑗 =
𝑘2(2𝑖 , 𝑥2𝑗).
SVD of matrices K1 and K2 is performed to reduce their dimension. Then the minimization
of
‖𝑀 − 𝐾1𝐴𝐾2𝑇‖2 + 𝛼‖𝐴‖2 Eq. 27
is calculated.

2 Nuclear Magnetic Resonance in Porous Media
29
The tensor product nature of the kernel K is an advantage because for 2D NMR
experiment sizes of K matrix make not possible the direct computation of the SVD. When
the SVD is calculated for K1 and K2, the two-dimensional inversion problem (Eq. 26) is
converted to the one-dimensional case (Eq. 23).

3 Instrumental Setups
30
3 INSTRUMENTAL SETUPS
In this chapter NMR instruments and pulse sequences used for investigating porous media
are described. During my doctorate I exploited the possibility to manage different
instruments in NMR laboratories of Bologna (Department of Physics and Astronomy,
Department DICAM, University of Bologna). This instruments are: a relaxometer based
on a Jeol C-H 60 electromagnet, a tomograph based on the Artoscan permanent magnet
and a NMR MOUSE Profile PM10. Moreover, I spent a period abroad, in Aachen and
Jülich, Germany, where I had the opportunity to deepen my knowledge about single-sided
NMR by the use of MOUSE Profile PM25 (Research Centre of Jülich). In the same
Institute, I also realized MRI on a tomograph based on a Varian superconducting magnet.
3.1 Instruments
3.1.1 Single-Sided NMR: the MOUSE Profile
The NMR MOUSE (MObile Universal Surface Explorer) is a single-sided NMR
instrument [23], [24]. Unilateral magnets are characterized by a strong magnetic field
gradient G0 perpendicular to the magnet surface. The Figure 3.1 depicts the basic
operational principle of the instrument.

3 Instrumental Setups
31
Figure 3.1 - Sketch of the operational principle of the MOUSE. (1) sensitive volume, (2)
magnetic field B0 and (3) the coil.
The radiofrequency coil, that generates the B1 and acquires the relaxation signal, is
located between the Northern and the Southern magnetic poles. The magnet is based on
a U-shape geometry. In order to improve the constancy of the magnetic field gradient, the
two magnets of the U-shape are split into four magnetic blocks. The sensitive volume is
17 mm x 17 mm in the XY plane for the MOUSE PM10 and 25 mm x 25 mm for the
PM25. The thickness can be varied in the range 100-300 µm changing parameters as the
pulse length and the acquisition sampling rate. Inside the sensitive volume, the magnetic
field B0 = 0.327 T for both the PM10 and the PM25, corresponding to a Larmor frequency
for 1H nuclei 𝜈0 = 13.9 MHz. The fundamental feature is the strong magnetic field
gradient that is G010 = 14 T/m for the PM10 and G025 = 7 T/m for the PM25, as declared
by the constructor.
An interesting feature concern the capability to vary the distance h of the coil respect to
the sensitive volume through the insertion of spacers between the coil plate and the
3 Instrumental Setups
32
surface of the magnet. For the PM10 the maximum value of h is h10 = 10 mm, while for
PM25 h25 = 25 mm. The distance h allows to conduct NMR analyses inside a sample, just
approaching the instrument to the sample, i.e. wall paintings [25], or just leaving the
sample on the instrument plate.
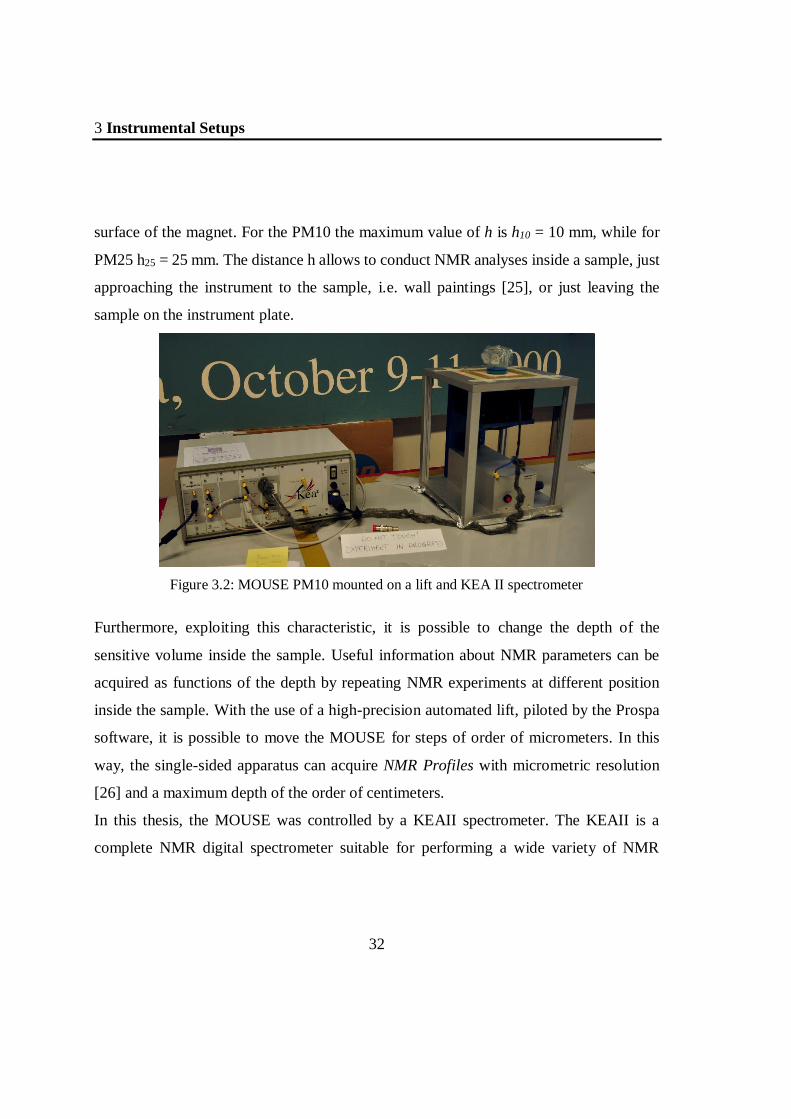
Figure 3.2: MOUSE PM10 mounted on a lift and KEA II spectrometer
Furthermore, exploiting this characteristic, it is possible to change the depth of the
sensitive volume inside the sample. Useful information about NMR parameters can be
acquired as functions of the depth by repeating NMR experiments at different position
inside the sample. With the use of a high-precision automated lift, piloted by the Prospa
software, it is possible to move the MOUSE for steps of order of micrometers. In this
way, the single-sided apparatus can acquire NMR Profiles with micrometric resolution
[26] and a maximum depth of the order of centimeters.
In this thesis, the MOUSE was controlled by a KEAII spectrometer. The KEAII is a
complete NMR digital spectrometer suitable for performing a wide variety of NMR

3 Instrumental Setups
33
experiments. It consists of many mules depicted in Figure 3.2, all powered from a 24 DC
input. It is connected to the PC via USB interface and it is managed by the software.
3.1.2 Electromagnet Jeol
The apparatus located in the NMR laboratory of the Physics and Astronomy Department
of the University of Bologna, is an in-house relaxometer based on a C60 H-L
electromagnet controlled by the PC-NMR portable console (Stelar). Measurements
reported in this thesis were performed at a frequency of 20.15 MHz for 1H nuclei
corresponding to a B0 = 0.473 T. The coil has a cylindrical shape and it is located between
polar expansion of the magnet where the field has the maximum homogeneity. The
sensitive volume has a diameter d = 8 mm and a thickness l = 5 mm.
The acquisition is performed by the software AcqStelarNMR/FFC developed by Stelar.
3.1.3 Artoscan Tomograph
The Artoscan (Esaote S.p.A., Genova, Italy) is a tomograph characterized by a 0.2 T
permanent magnet, operating at 8 MHz for 1H nuclei. An important feature is the
dimension of the magnet bore that allows to analyze samples of sizes up to 10 cm. The
high homogeneity of the magnetic field and the possibility to use coil with different sizes
make this instrument useful also for NMR relaxometry studies.

3 Instrumental Setups
34
Figure 3.3: MRI apparatus based on the Artoscan Tomograph
3.1.4 Halbach Magnet: Benchtop MRI tomograph
The Benchtop MRI Tomograph is based on a cylindrical Halbach magnet characterized
by a large sensitive volume in a highly homogeneous static magnetic field B0 = 0.6T,
perpendicular to the cylinder axis. The magnet is composed by several individual block
of permanent magnets aligned according to the geometry depicted in schematic of Figure
3.4a.

3 Instrumental Setups
35
Figure 3.4: a) Sketch of magnet geometry. b) Magnet. c) Tomograph
The cylindrical coil is placed inside the magnet with the axis parallel to the magnet axis.
The diameter of the coil is 60 mm and the height of the region in the homogeneous B0 is
h = 60 mm. The instrument is designed for MRI analyses of medium-size samples, but I
used this instrument for 2D-NMR relaxometry analysis. A KEA II spectrometer
connected to a Personal Computer was used for piloting the experiment. The Benchtop
MRI Tomograph is located in the NMR laboratory of Agrosphere Department of the
Research Centre of Juelich, Germany. Moreover, in the same research Centre, I
performed magnetic resonance imaging experiments on Varian tomograph based on a 1.5
T superconducting magnet suitable for analysis of large sample (i.e in-vivo study of trees).
3.2 Pulse sequences
In this subchapter, NMR pulse sequences are described. In particular, following
descriptions are referred to pulse sequences dedicated to single-sided instruments and
executed by the KEAII spectrometer.

3 Instrumental Setups
36
MRI experiments in this thesis were performed by the use of a basic Spin Echo Multi-
Slice sequence and no further specifications about imaging experiments are described in
the following section.
3.2.1 One-Dimensional NMR Pulse Sequences
3.2.1.1 CPMG – Transverse Relaxation Time
One of the most frequently used RF sequence for characterizing the transverse relaxation
time T2 is the CPMG pulse sequence [27], [28]. A sketch of the sequence is presented in
the Figure 3.5.
Figure 3.5: Sketch of the CPMG pulse sequence.
It consists of an initial π/2 pulse followed by a train of π pulses. The time interval between
two π pulses is called te, echo time. The π pulse refocuses the magnetization dephasing
due to B0 inhomogeneity and it forms an echo of the signal at the measuring time t = 2 te.
3 Instrumental Setups
37
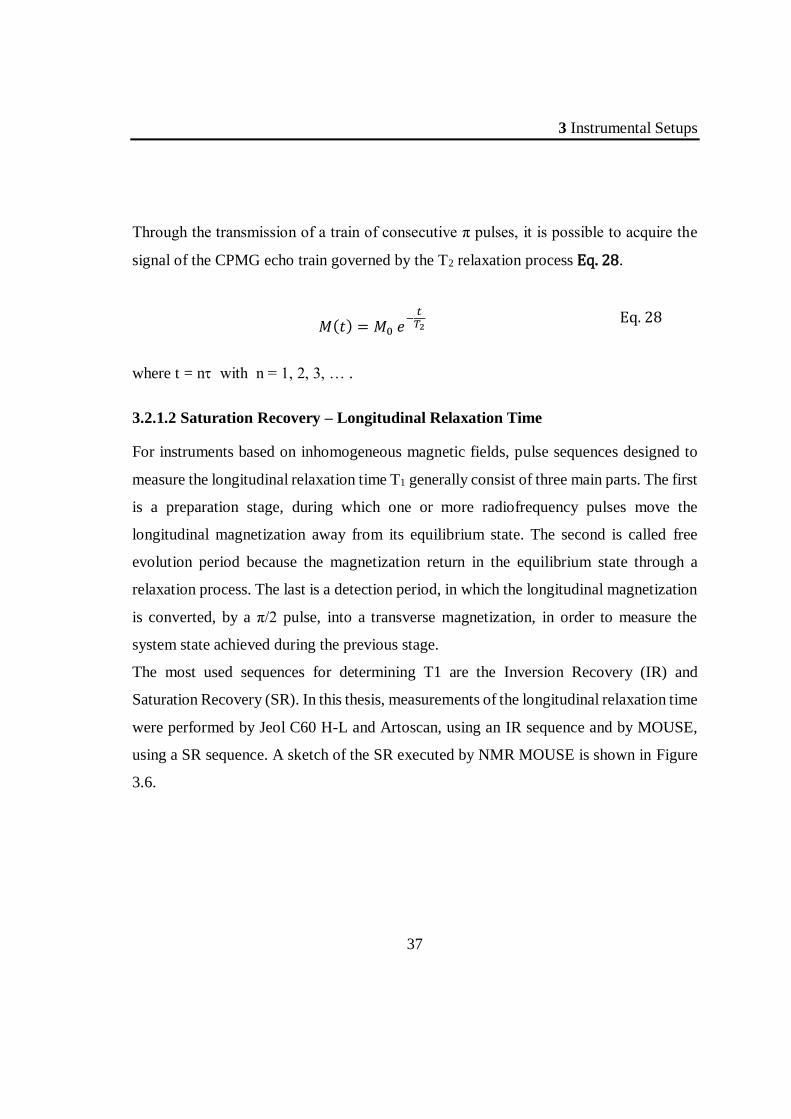
Through the transmission of a train of consecutive π pulses, it is possible to acquire the
signal of the CPMG echo train governed by the T2 relaxation process Eq. 28.
𝑀(𝑡) = 𝑀0 𝑒−
𝑡𝑇2
Eq. 28
where t = n with n = 1, 2, 3, … .
3.2.1.2 Saturation Recovery – Longitudinal Relaxation Time
For instruments based on inhomogeneous magnetic fields, pulse sequences designed to
measure the longitudinal relaxation time T1 generally consist of three main parts. The first
is a preparation stage, during which one or more radiofrequency pulses move the
longitudinal magnetization away from its equilibrium state. The second is called free
evolution period because the magnetization return in the equilibrium state through a
relaxation process. The last is a detection period, in which the longitudinal magnetization
is converted, by a π/2 pulse, into a transverse magnetization, in order to measure the
system state achieved during the previous stage.
The most used sequences for determining T1 are the Inversion Recovery (IR) and
Saturation Recovery (SR). In this thesis, measurements of the longitudinal relaxation time
were performed by Jeol C60 H-L and Artoscan, using an IR sequence and by MOUSE,
using a SR sequence. A sketch of the SR executed by NMR MOUSE is shown in Figure
3.6.
3 Instrumental Setups
38
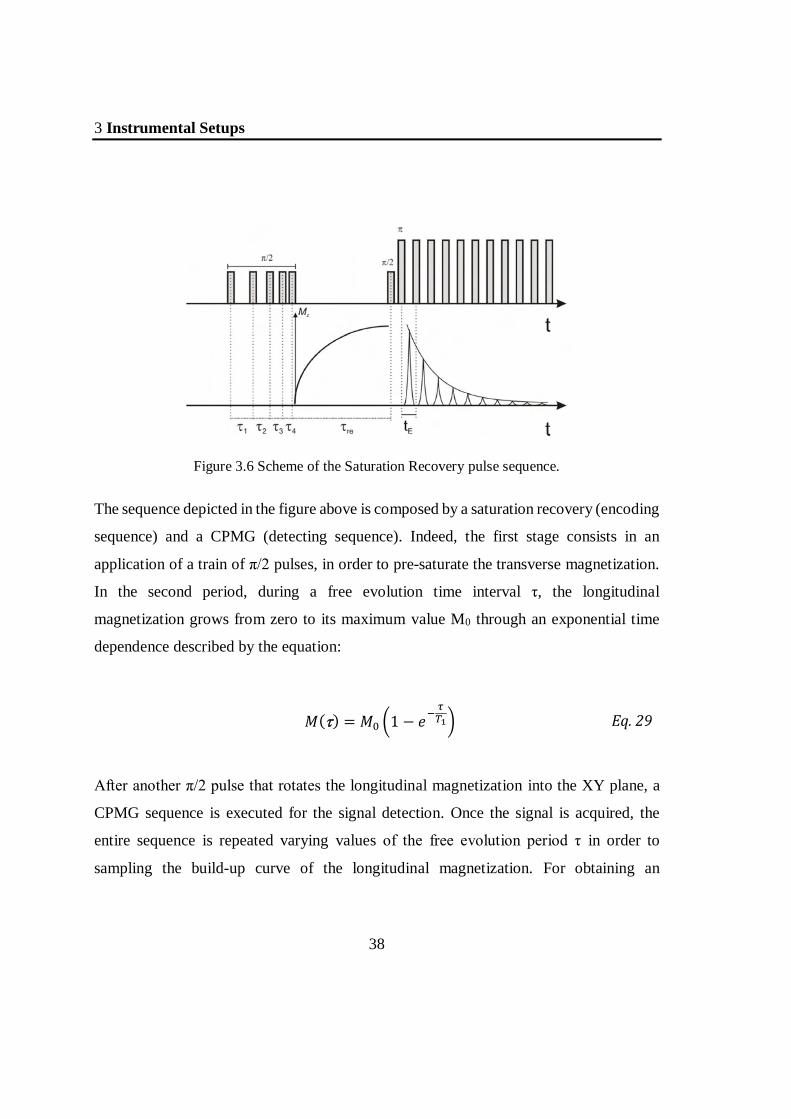
Figure 3.6 Scheme of the Saturation Recovery pulse sequence.
The sequence depicted in the figure above is composed by a saturation recovery (encoding
sequence) and a CPMG (detecting sequence). Indeed, the first stage consists in an
application of a train of π/2 pulses, in order to pre-saturate the transverse magnetization.
In the second period, during a free evolution time interval τ, the longitudinal
magnetization grows from zero to its maximum value M0 through an exponential time
dependence described by the equation:
𝑀() = 𝑀0 (1 − 𝑒−
𝜏𝑇1)
Eq. 29
After another π/2 pulse that rotates the longitudinal magnetization into the XY plane, a
CPMG sequence is executed for the signal detection. Once the signal is acquired, the
entire sequence is repeated varying values of the free evolution period τ in order to
sampling the build-up curve of the longitudinal magnetization. For obtaining an
3 Instrumental Setups
39
appropriate sampling τ is varied logarithmically because the acquired process is expected
to be an exponential.
Extrapolating for t = 0 the magnetization value of acquired CPMGs it is possible to follow
the trend of the longitudinal magnetization M() and to estimate the longitudinal
relaxation times distribution through Laplace Inversion of data.
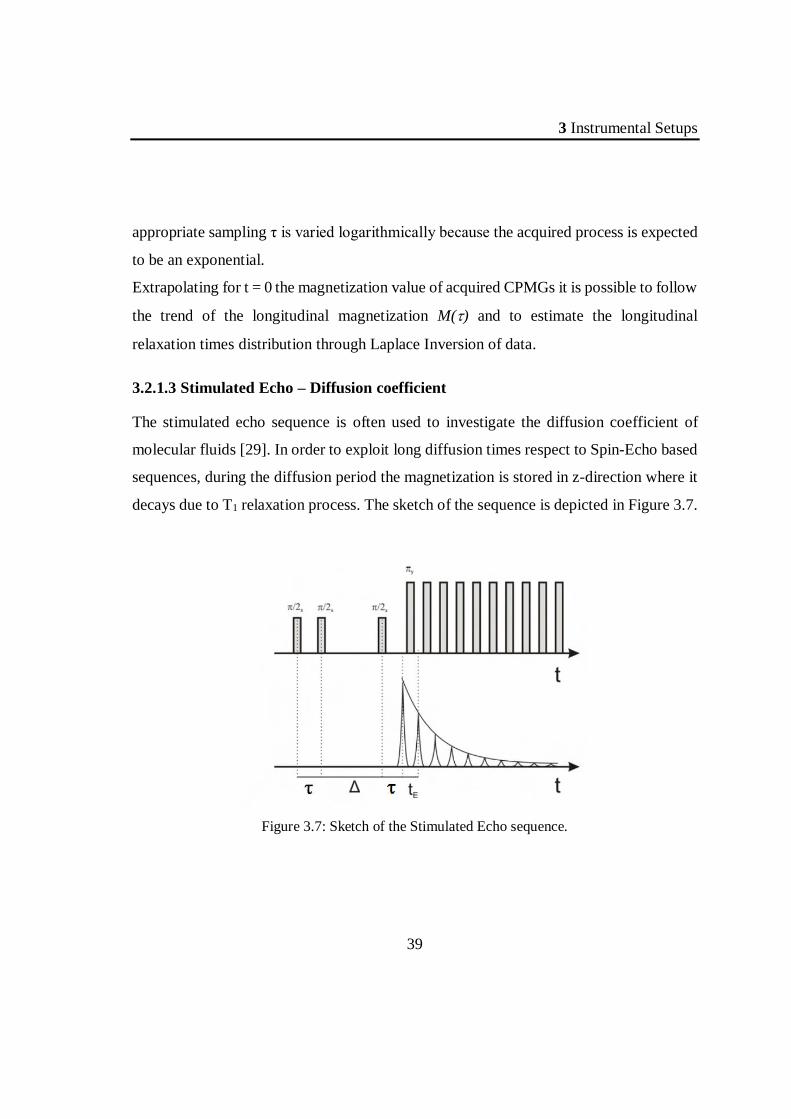
3.2.1.3 Stimulated Echo – Diffusion coefficient
The stimulated echo sequence is often used to investigate the diffusion coefficient of
molecular fluids [29]. In order to exploit long diffusion times respect to Spin-Echo based
sequences, during the diffusion period the magnetization is stored in z-direction where it
decays due to T1 relaxation process. The sketch of the sequence is depicted in Figure 3.7.
Figure 3.7: Sketch of the Stimulated Echo sequence.

3 Instrumental Setups
40
The first pulse is a π/2. After a time τ, a second π/2x is applied with the consequent rotation
of the y-component of magnetization into the z-axis, in which the relaxation occurs
according the time constant T1. This period is allowed to evolve for a time Δ and then the
stored longitudinal magnetization is converted into transverse magnetization by the use
of another π/2x pulse. In the last stage, the signal is acquired by a CPMG sequence.
The signal attenuation caused by the diffusion process occurred during the evolution time
interval Δ result to be:
𝑙𝑛 (𝑆
𝑆0) = −𝛾2𝐺2𝜏2𝐷 (𝛥 +
2
3𝜏)
Eq. 30
G is the intensity of the field gradient, D the diffusion coefficient, γ the gyromagnetic
ratio and is the encoding time.
In the case of molecular fluids filled porous media, the Stimulated Echo sequence makes
possible the evaluation of the SVR of the confining geometry [30]. Indeed, varying the
value of Δ parameter, the behavior of the diffusion coefficient D(Δ) can be analyzed in
order to obtain an estimation of the SVR according to the Eq. 4 described in the
Subchapter 2.2.
3.2.2 Two-Dimensional NMR Pulse Sequences
3.2.2.1 Saturation Recovery – CPMG: T1-T2 Correlation
The analysis of T1-T2 correlation function was performed by the MOUSE PM25 on
porous media filled with water. The pulse sequence used for this study is described in
3 Instrumental Setups
41
subsection 3.2.1.2 with an important difference. In the sequence previously described, the
CPMG is executed only for extrapolating a value of the magnetization, while, in this case,
the sequence is entirely stored for each value of . In this way, by repeating the SR-CPMG
varying for m times, and acquiring signals through the use of n echoes of the CPMG
sequence, a data matrix Y of sizes m x n is stored.
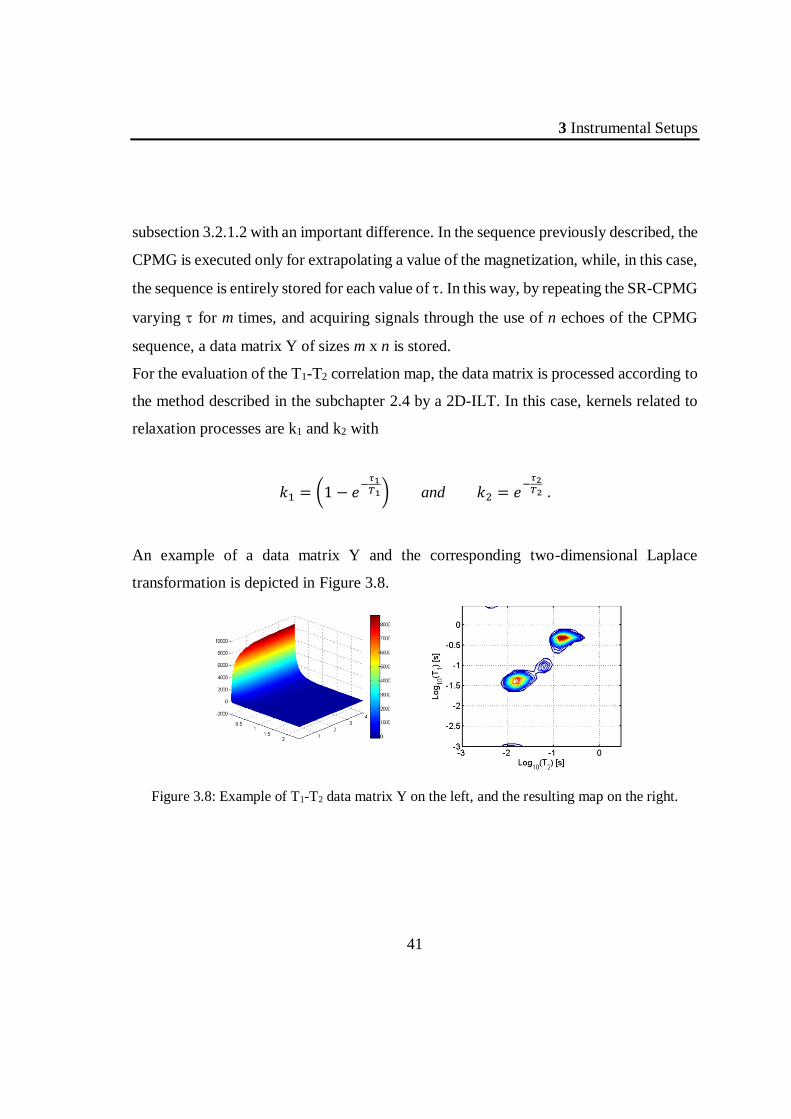
For the evaluation of the T1-T2 correlation map, the data matrix is processed according to
the method described in the subchapter 2.4 by a 2D-ILT. In this case, kernels related to
relaxation processes are k1 and k2 with
𝑘1 = (1 − 𝑒−
𝜏1𝑇1) and 𝑘2 = 𝑒
−𝜏2𝑇2 .
An example of a data matrix Y and the corresponding two-dimensional Laplace
transformation is depicted in Figure 3.8.
Figure 3.8: Example of T1-T2 data matrix Y on the left, and the resulting map on the right.
3 Instrumental Setups
42
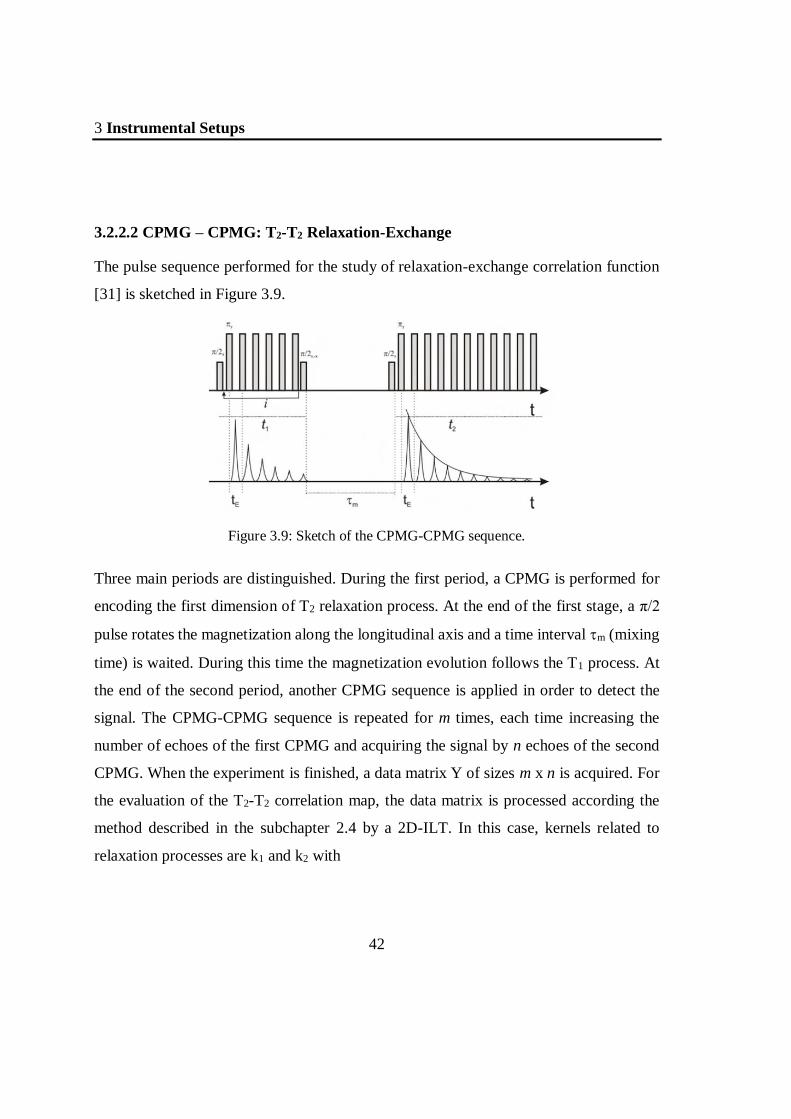
3.2.2.2 CPMG – CPMG: T2-T2 Relaxation-Exchange
The pulse sequence performed for the study of relaxation-exchange correlation function
[31] is sketched in Figure 3.9.
Figure 3.9: Sketch of the CPMG-CPMG sequence.
Three main periods are distinguished. During the first period, a CPMG is performed for
encoding the first dimension of T2 relaxation process. At the end of the first stage, a π/2
pulse rotates the magnetization along the longitudinal axis and a time interval m (mixing
time) is waited. During this time the magnetization evolution follows the T1 process. At
the end of the second period, another CPMG sequence is applied in order to detect the
signal. The CPMG-CPMG sequence is repeated for m times, each time increasing the
number of echoes of the first CPMG and acquiring the signal by n echoes of the second
CPMG. When the experiment is finished, a data matrix Y of sizes m x n is acquired. For
the evaluation of the T2-T2 correlation map, the data matrix is processed according the
method described in the subchapter 2.4 by a 2D-ILT. In this case, kernels related to
relaxation processes are k1 and k2 with
3 Instrumental Setups
43
𝑘1 = 𝑒−
𝜏1𝑇2 and 𝑘2 = 𝑒
−𝜏2𝑇2 .
In general, the exchange process is detectable through the map by the presence of off-
diagonal peaks for values of m longer than the shorter T1 relaxation class. Usually these
peaks are symmetric respect to the principal diagonal and their coordinates are
representative of relaxation rates of different classes of pores. But the interpretation of
2D exchange-relaxation maps is not trivial [32]. The reason is in the interaction between
exchange and relaxation processes during different periods of the pulse sequence. Indeed,
the relaxation, probed during the encoding periods, implies that exchange can never be
restricted to the mixing period and must also be considered during the encoding periods.
As a consequence, the two-dimensional relaxation exchange map cannot be interpreted
as pure exchange maps but as exchange probability densities. Moreover, due to this
behavior, relaxation exchange maps are often non symmetric and peak positions are
shifted from the cross coordinates of the apparent relaxation rates identified on the
diagonal.
3.2.2.3 Stimulated Echo - CPMG: D-T2 Correlation
The diffusion coefficient D of a hydrogenous fluid can be mapped in correlation with the
T2 relaxation process. The specific sequence executed by NMR MOUSE PM25 is a
Stimulated Echo – CPMG [33], [34]. As in the case of SR-CPMG sequence, the sequence
used for this study is the same of the one describe in the one-dimensional experiment of
Stimulated Echo sequence, Figure 3.7, subsection 3.2.1.3. Also in this situation the
CPMG is acquired and n number of echoes are entirely stored. The combination STE-
CPMG is repeated for m times, varying the encoding parameter . In this way, at the end
of the experiment the data matrix Y of sizes m x n is stored for a fixed value of Δ. For the
3 Instrumental Setups
44
evaluation of the D-T2 exchange-relaxation map, the data matrix is processed according
the method described in the subchapter 2.4 by a 2D-ILT. In this case, kernels related to
diffusion and relaxation processes are k1 and k2 with
𝑘1 = 𝑒−𝛾2𝐺2𝜏12𝐷(𝛥+
2
3 𝜏1) and 𝑘2 = 𝑒
−𝜏2𝑇2 .
Correlation D-T2 maps. In particular, as the value of parameter Δ, time leaved for the
diffusion process, increases, much more time is given to spins for moving. In a restricted
geometry, like inside a porous medium, the value of the diffusion coefficient is attenuated,
due to SVR of the confining pore, as a function of the diffusion time Δ. Thus, increasing
the value of Δ and crossing the information about the transverse relaxation process to the
one about the diffusion phenomenon, it possible to distinguish different classes of pores
and follow their own diffusion behaviors.
4 Advanced Applications: Environmental Sustainability
45
4 ADVANCED APPLICATIONS:
ENVIRONMENTAL
SUSTAINABILITY
4.1 Cultural Heritage
The preservation of historical buildings and outdoor cultural assets is a necessity for the
humankind because the artworks are the testimony of our past, as well as an economic
resource for the present and future times. The main causes of degradation of stones, the
more important porous materials for these artifacts, are linked to chemical-physical
processes that influence the ingress and diffusion of water (liquid or vapour) into the
porous structure. Water, in fact, in the condensed phase dissolves CO2 and pollutants from
the atmosphere, causing acidic corrosion of the stone or the binder, and it is responsible
of internal mechanical stresses caused by freezing-thawing cycles or salt crystallization
[35]–[38].
In this NMR study, I tested the efficiency of protectives and consolidants applied for
preserving carbonate stone material, of interest to Cultural Heritage, from the damage
caused by atmospheric agents.
4 Advanced Applications: Environmental Sustainability
46
4.1.1 Protective compounds
The use of hydrophobic compounds, typically synthetic polymers, is a common practice
to protect surfaces from water [39], [40]. However, it has been demonstrated that the
efficiency and durability of the treatments depend on the characteristics of the compounds
used, on the treatment procedure and on the chemical-mineralogical nature of the
substrate. In particular, for an effective preservation of the substrate [40], the protective
agent must have a uniform distribution, good penetration into the porous structure, and
low propensity to pore blockage. Last but not least, the protective compound must be
soluble in benign solvent for operators and environment.
Among the protective agents used to protect porous materials, perfluoropolyethers have
many of the properties required for an ideal protection, such as high stability, water
repellency and low surface tension. Unfortunately, these compounds are soluble only in
chlorofluorocarbons (CFC) and in supercritical CO2, therefore their use as protective
agents for historical stone artifacts has been abandoned since 1995.
Therefore, this work was focused on the preparation of a new low average molecular
weight protective agent containing short pendant perfluoropolyether segments linked to
an oligo(succinamide) chain (SC2-PFPE) in order to realize a compound characterized
by the protective action of the perfluoropolyethers and the solubility in environmental
friendly solvents. The product was synthetized and the treatments were performed by M.
Camaiti (CNR-IGG, Florence).
4.1.1.1 Materials and methods
Samples (5x5x2 cm3) of Lecce stone, a biocalcarenite with total porosity P=46-48%,
porosity accessible to water PH2O= 39%, were used to test the performances of the

4 Advanced Applications: Environmental Sustainability
47
protective treatments. The pore-space of this stone is macroscopically very homogeneous
but there is a substantial range of pore and pore-channel sizes: Mercury Injection
Porosimetry gives a range from 0.01 m to a few micrometers, with a sharp peak at just
over 2 m.[8]
The hydrophobic treatments were performed on only one 5x5 cm2 surface of the prismatic
stone samples using SC2-PFPE and a commercial fluoroelastomer (N215) as a reference.
SC2-PFPE is an oligo(ethylensuccinamide) containing low molecular pendant
perfluoropolyether segments. The compound was applied both as 0.5% (w/w) solution in
a mixture of 2-propanol:H2O (70:30, w/w), and as 1% (w/w) suspension in a mixture of
2-propanol:H2O (70:30, w/w). N215 was applied as 1% (w/w) ethyl acetate solution. For
all products the amount of solution/suspension to be applied was calculated considering
a final theoretical amount of active compound on the stone surface of 10 g/m2. The
solution/suspension was deposed on the stone sample by pipette. The solvent was
evaporated at laboratory conditions and then the stone specimens were dried in desiccator
to determine the mass of active product actually applied before subjecting them to the
tests for performance evaluations. Three samples for each treatment were prepared. All
of them were used for the water capillary absorption test and then two were used for the
vapor permeability test and the third for the photo-stability measurements. One of the two
specimens used for the evaluation of vapor permeability was later used for the MRI
analysis.
MRI images were collected using Artoscan (Esaote S.p.A., Genova, Italia), a tomograph
based on a 0.2 T permanent magnet, operating at 8 MHz for 1H nuclei. Multi-slice Spin-
echo sequences were used to obtain at the same time a number of adjacent axial sections
on each sample sufficient to cover all the sample (thickness of each slice = 5 mm, gap
4 Advanced Applications: Environmental Sustainability
48
between slices = 1 mm, pixel size = 0.78 x 0.78 mm2, Repetition Time (TR) = 900 ms,
Echo Time (TE) = 10 ms, number (N) of Scans = 8). Bright regions in MRI images reveals
the presence of water (the signal is due to the 1H nuclei magnetization). The signal in each
pixel is proportional to the water amount in the corresponding voxel only if the nuclear
magnetization is allowed to reach the equilibrium after each acquisition sequence. In
porous media, wide distributions of longitudinal and transverse relaxation times T1 and
T2, due to wide distributions of pore sizes, are observed. In order to allow all components
to reach the equilibrium, it is necessary to have an echo time TE much shorter than the
shortest T2 component inside the sample and a repetition time TR much longer than the
longest T1 component in the sample. These conditions conflict with instrumental
limitations (minimum TE is 10 ms) and measurement duration, which is proportional to
TR. MRI images were taken at increasing intervals of time during capillary water
absorption, from one hour up to a week. Images were analyzed by an in-house software
in order to quantify the water signal (in arbitrary units) inside the samples, in a scale that
was the same for all the samples. From each slice, the algorithm also created a signal
profile along the shortest side of the sample by the sum, for each row of the image, of the
values of all the pixels. In order to characterize the spatial distribution of the water in the
stone, the three-dimensional view of the sample was reconstructed starting from the two-
dimensional slices, by implementing an algorithm under the Enthought Canopy
environment, a Python academic free distribution for scientific and analytic computing.
MOUSE PM 25 was used in order to realize a 1D diffusometry study and 2D correlation
maps. All the following analyses were executed with the sensitive volume centered About
diffusometry, the Stimulated Echo sequence was applied with Pulse Length = 12 µs, TR
= 5 s, TE = 80 µs, number of echoes = 512, varying from 0.08 ms to 0.4 ms with 32

4 Advanced Applications: Environmental Sustainability
49
steps and for each experiment the mixing time Δ was varied and it assumed the following
values (4, 12, 50, 100, 150, 200 and 400) ms. In this way, according to the Eq. 30, the
value of D(Δ) was calculate, for each Δ, and the SVR was evaluated following the Eq. 6.
2D NMR was performed by STE-CPMG and SR-CPMG pulse sequences, in order to
study correlation functions D-T2 and T1-T2 and, respectively. The STE-CPMG was set
up with the same parameters of 1D STE with the exception of a higher number of echoes
in the CPMG sequence (4000 echoes) in order to sample the entire relaxation signal. The
SR-CPMG was performed with the following parameters: the SR was sampled with 128
points logarithmically spaced from a value of 0.1 ms to a value of 6 s, while the CPMG
was set with the same parameters used in the STE-CPMG. The 2D inversion was
performed by an algorithm based on the work of Venkataramanan [41].
4.1.1.2 Results and discussion
MRI is a method, not conventional for these kind of investigations, that allows the
visualization of liquid water inside a porous material and allows to test the hypothesis on
the different penetration depth and distribution of the products in the different treatments.
The evaluation of the protective efficacy by UNI-EN 15801-2010 method [42] is obtained
by water absorption through the treated face. On the contrary, the MRI analyses were
performed with water absorption through both the treated and the untreated face, giving
clear and reliable results. Indeed, in the extreme condition of the hydrophobic product
concentrated on the treated surface, the absorption through the treated face would produce
dark images (typically black), because the hydrophobic compound would block the
ingress of liquid water. On the contrary, the absorption carried out through the untreated
face would determine bright images, similar to those of the not treated samples. The
4 Advanced Applications: Environmental Sustainability
50
hydrophobic treatments performed in this work never gave rise to the limit condition
exposed above, and the different behavior and properties of these stone protective agents
and treatments were clearly demonstrated through the comparison of the MRI images
acquired after water absorption through both the treated and the untreated face.
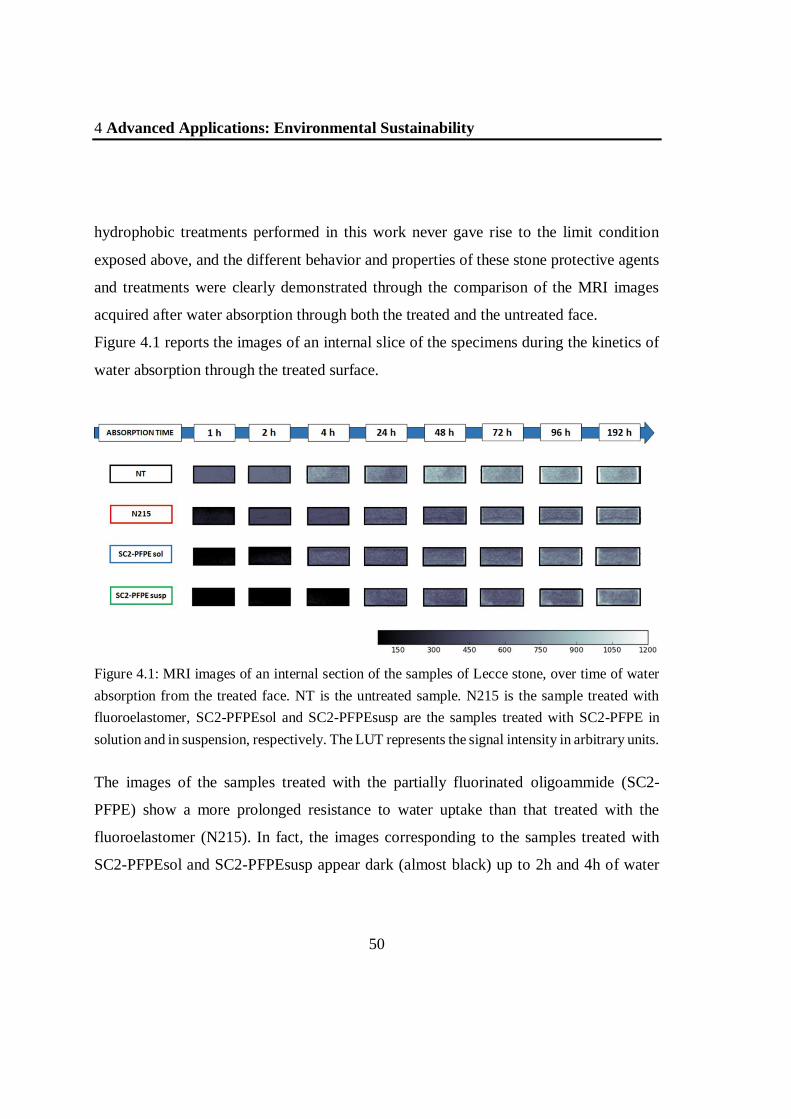
Figure 4.1 reports the images of an internal slice of the specimens during the kinetics of
water absorption through the treated surface.
Figure 4.1: MRI images of an internal section of the samples of Lecce stone, over time of water
absorption from the treated face. NT is the untreated sample. N215 is the sample treated with
fluoroelastomer, SC2-PFPEsol and SC2-PFPEsusp are the samples treated with SC2-PFPE in
solution and in suspension, respectively. The LUT represents the signal intensity in arbitrary units.
The images of the samples treated with the partially fluorinated oligoammide (SC2-
PFPE) show a more prolonged resistance to water uptake than that treated with the
fluoroelastomer (N215). In fact, the images corresponding to the samples treated with
SC2-PFPEsol and SC2-PFPEsusp appear dark (almost black) up to 2h and 4h of water
4 Advanced Applications: Environmental Sustainability
51
absorption, respectively, while those of the sample treated with N215 show slow but
progressive ingress of water already at 1h of absorption. After longer absorption times
(up to 192 h – 8 days) water can penetrate and is distributed in the entire sample for all
the treatments, confirming the substantial absence of closed pores, in accordance with the
high residual permeability to vapor (data not reported). By comparing the gray levels of
the images with the look up table (LUT) the final amount of water absorbed appears less
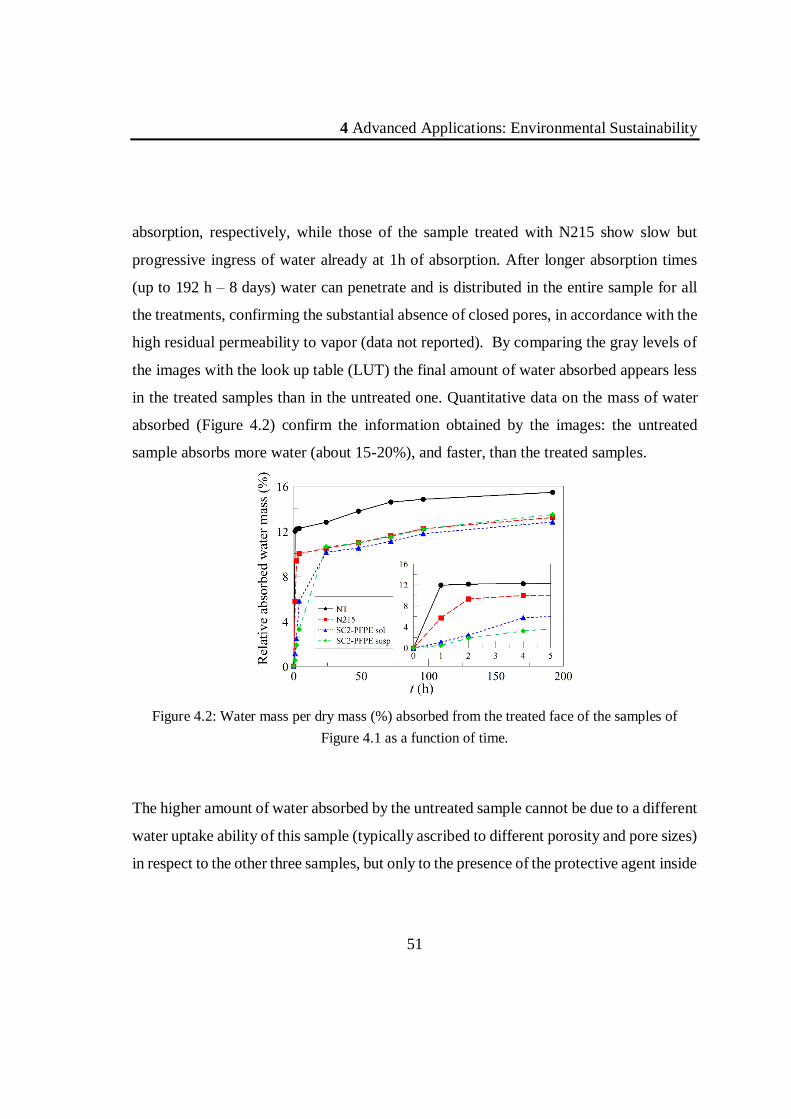
in the treated samples than in the untreated one. Quantitative data on the mass of water
absorbed (Figure 4.2) confirm the information obtained by the images: the untreated
sample absorbs more water (about 15-20%), and faster, than the treated samples.
Figure 4.2: Water mass per dry mass (%) absorbed from the treated face of the samples of
Figure 4.1 as a function of time.
The higher amount of water absorbed by the untreated sample cannot be due to a different
water uptake ability of this sample (typically ascribed to different porosity and pore sizes)
in respect to the other three samples, but only to the presence of the protective agent inside
4 Advanced Applications: Environmental Sustainability
52
the pore space. In fact, in the water capillary test carried out on the same samples before
the treatment, the same untreated specimen absorbed less amount of water than the other
samples (data not reported).
Figure 4.3: MRI images of an internal section of the same samples of Lecce stone in Figure 4.2,
over time of water absorption from the untreated face.
The images of the kinetics of water absorption through the untreated face (Figure 4.8)
show slower and less water absorption than the untreated one, both at short (1 h) and long
times (168 h - 7 days) of absorption.
In this case, all the hydrophobic treatments give the same trend in terms of mass of water
(Figure 4.2), also for short absorption times (0-5 h), but the images of samples treated
with N215 and SC2-PFPEsol show a non-uniform distribution of water. In the case of
N215 a darker region at about 5 mm from the treated surface, well visible at long

4 Advanced Applications: Environmental Sustainability
53
absorption times (≥ 24h) (Figure 4.1 and Figure 4.3), indicates that the polymer is
concentrated near the treated face. On the contrary, in the case of SC2-PFPEsol a darker
region is visible at about 5 mm from the untreated face.
Figure 4.4: Water mass per dry mass (%) absorbed from the untreated face of the samples of
Fig.4-1 as a function of time.
This region is already visible after 1h of water absorption if the test is performed through
the untreated face (Figure 4.3), and after longer times (4h) when it is carried out through
the treated face (Figure 4.1). This effect is observed in the entire sample, not only in the
section shown in Figure 4.1 and Figure 4.3. Figure 4.5 is a three-dimensional view of
this specimen in false colors, reconstructed from all the adjacent slices, after 4 hours of
water absorption through the untreated face. This behavior is justified with a high
propensity of SC2-PFPEsol to penetrate inside the porous medium, with an accumulation
of the product at the face opposite to the treated one due to the limited thickness of the
specimen (2 cm). Since the initial kinetics of water absorption through the untreated face

4 Advanced Applications: Environmental Sustainability
54
is similar for all the treatments (inset of Figure 4.4), the accumulated protective agent
does not seem to substantially reduce the water ingress in this sample.
Figure 4.5: Three-dimensional reconstructed MRI image of the Lecce stone sample treated with
SC2-PFPEsol after 4 hours of water absorption through the untreated face.
As known, the velocity of water ingress is governed by the smallest pores, the results
shown above suggest that SC2-PFPEsol is mainly distributed in medium-large size pores.
The high hydrophobicity of SC2-PFPE, as suggested by the low wettability of the treated
surface, is responsible for lowering the concentration of liquid water in the region of the
protective agent accumulation, as well as for reducing the vapor condensation. This last
consideration justifies the lower values of the vapor permeability observed for SC2-
PFPEsol treatment in respect to the other two treatments (data not reported).
Finally, the different hydrophobic effect given by the three treatments is well summarized
in Figure 4.6, where for each sample an internal section is shown along with the
corresponding profile of water absorbed after 4 hours of capillary absorption through both
the treated and the untreated face.
4 Advanced Applications: Environmental Sustainability
55
Figure 4.6: MRI images and corresponding water content profiles of the internal slices of the same
samples of Lecce stone reported in Figs. 4-1 and 4-3, for water absorption from the untreated
(left) and the treated (right) face, after 4 h of water capillary absorption. The LUT colors from
grey to yellow show increasing signal values.
In order to obtain an in-depth study about limestone samples, the apparent self-diffusion
coefficient behavior was investigated varying Δ parameter. For each sample seven
different Stimulated Echo experiments were performed (Δ = 4, 12, 50, 100, 150, 200,
400) ms. Thus, from each Stimulated Echo experiments the value of D(Δ) was calculated,
according to the Eq. 29. For porous media saturated with fluids characterized by spherical
pores interconnected, the behavior of diffusion coefficient D(Δ) follows the Eq. 6.
Through this relationship, it was possible to estimate the average value of the apparent
self-diffusion coefficient as a function of parameter Δ. The diffusional coefficients as
function of the observation time ∆ are shown in Figure 4.7.

4 Advanced Applications: Environmental Sustainability
56
0 1x10⁻⁵
2x10⁻⁵
3x10⁻⁵
0.0
0.2
0.4
0.6
0.8
1.0
(D0)1/2
m
D(
)/D
0
Figure 4.7: Diffusional coefficient as function of Δ. Untreated sample.
Data, black points, were fitted by the Eq. 6, and the result is plotted as a red line. The
initial slope of the trend is depended on the surface to volume ratio of the confining
geometry. Thus, assuming pores as spheres, the average pore radius was estimated.
Results of this procedure are shown in Table 4.1.
Sample S/V Ravg
(μm)
SC2-PFPE sol 2,0E+05 15
SC2-PFPEsusp 1,4E+05 21
N215 3,1E+05 10
Reference 8,3E+04 36 Table 4.1: SVR and average pore size estimated for Lecce stone samples.
All the treated samples exhibit higher surface to volume ratios than the reference. This
effect can be explained by the action of hydrophobic treatment that creates a thin layer of
the product inducing a reduction of the average pore sizes.
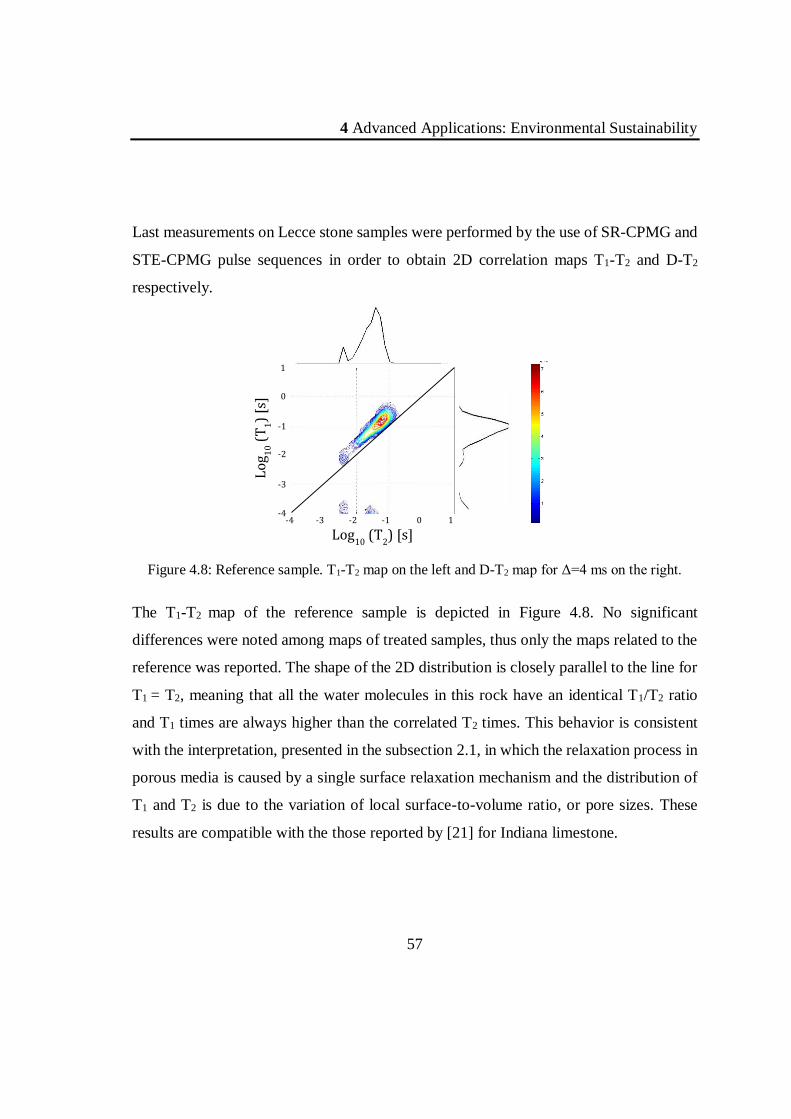
4 Advanced Applications: Environmental Sustainability
57
Last measurements on Lecce stone samples were performed by the use of SR-CPMG and
STE-CPMG pulse sequences in order to obtain 2D correlation maps T1-T2 and D-T2
respectively.
Figure 4.8: Reference sample. T1-T2 map on the left and D-T2 map for Δ=4 ms on the right.
The T1-T2 map of the reference sample is depicted in Figure 4.8. No significant
differences were noted among maps of treated samples, thus only the maps related to the
reference was reported. The shape of the 2D distribution is closely parallel to the line for
T1 = T2, meaning that all the water molecules in this rock have an identical T1/T2 ratio
and T1 times are always higher than the correlated T2 times. This behavior is consistent
with the interpretation, presented in the subsection 2.1, in which the relaxation process in
porous media is caused by a single surface relaxation mechanism and the distribution of
T1 and T2 is due to the variation of local surface-to-volume ratio, or pore sizes. These
results are compatible with the those reported by [21] for Indiana limestone.
-4 -3 -2 -1 0 1 Log
10 (T
2) [s]
Lo
g 10 (
T1)
[s]
-4
-3
-2
-1
0
1

4 Advanced Applications: Environmental Sustainability
58
Figure 4.9: D-T2 maps of reference sample for mixing time values Δ = 4 ms and 50 ms.
Figure 4.9 depicts an example of D-T2 maps obtained for the reference with = 4 ms and
50 ms. For a mixing time = 4 ms, the map shows that the component with shortest T2
times (between 1 ms and 10 ms, Figure 4.8) disappears while the remaining component
exhibits a diffusion coefficient similar to bulk water. This effect indicates that the
magnetization of the water in small pores (short transverse relaxation times), is totally
decayed because the diffusion motion has accelerated the surface relaxation process,
while for water in large pores, the effect of the diffusion has not influenced the effective
relaxation rate (the measured diffusion coefficient for this component is similar to the one
of bulk water). The map with = 50 ms shows an attenuation of the diffusion coefficient
respect to the bulk value and the enhancement of the effect described for = 4 ms.
Increasing Δ, the attenuation of the signal-to-noise ratio made not possible a punctual
analysis of the resulting maps. A more efficient measurement procedure will be applied
in order to overcome this issue.

4 Advanced Applications: Environmental Sustainability
59
4.1.1.3 Conclusions
The new oligo(ethylensuccinamide) containing low molecular pendant
perfluoropolyether segments, easily synthesized by two-step poly-condensation
reactions, shows suitable characteristics to be used as protective agent in porous materials,
like calcareous stones. Its low solubility in alcohols or hydro-alcoholic solvents makes
possible its application on the surfaces without any environmental negative impact. The
presence of low molecular pendant perfluoropolyether segments guarantees good stability
to UV irradiation (data not shown), and, at the same time, greatly improves the water
repellence in respect to others fluorinated compounds (i.e. fluoroelastomer). The high
hydrophobic properties are due to the orientation of the fluorinated segments at the
interface air/stone surface, while the not fluorinated amidic groups of the
oligo(ethylensuccinamide) interact, via hydrogen bonds, with the stone giving a good
permanence of the product on the surface also after ageing (UV irradiation and wet-dry
cycles (data not shown)N215 slightly reduces the water uptake but the better performance
of SC2-PFPE due to the influence of the hydrophobic perfluoropolyether pendant
segments is evident, in accordance with their ability to arrange at the interface
substrate/air in consequence of the strong segregation due to their low surface free energy
[43], [44].
This study has also confirmed that MRI is an excellent technique for evaluating the
performances of hydrophobic compounds and, in particular, of these fluorinated products.
Indeed, traditional methods cannot give information on the spatial distribution of the
product on the surface of the internal surfaces of the pore space, but allow to formulate
hypotheses that only MRI can validate. The images give also further information about
the distribution of the products (the accumulation of the fluoroelastomer at the treated
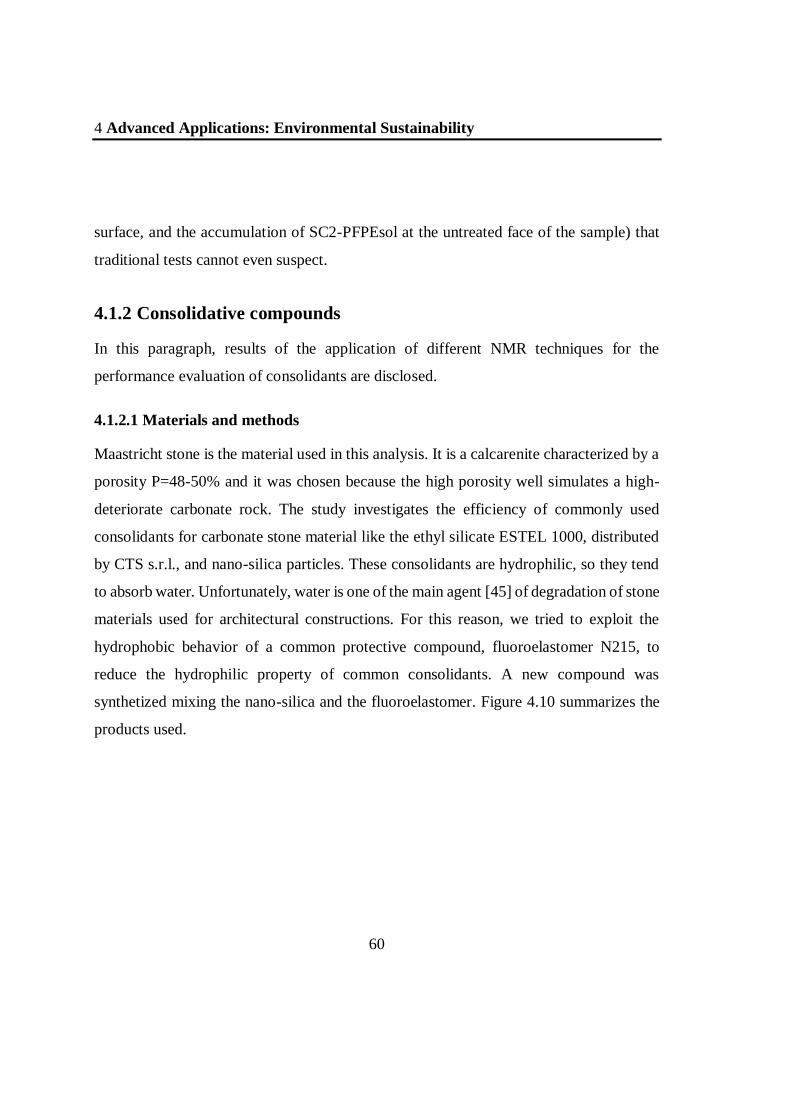
4 Advanced Applications: Environmental Sustainability
60
surface, and the accumulation of SC2-PFPEsol at the untreated face of the sample) that
traditional tests cannot even suspect.
4.1.2 Consolidative compounds
In this paragraph, results of the application of different NMR techniques for the
performance evaluation of consolidants are disclosed.
4.1.2.1 Materials and methods
Maastricht stone is the material used in this analysis. It is a calcarenite characterized by a
porosity P=48-50% and it was chosen because the high porosity well simulates a high-
deteriorate carbonate rock. The study investigates the efficiency of commonly used
consolidants for carbonate stone material like the ethyl silicate ESTEL 1000, distributed
by CTS s.r.l., and nano-silica particles. These consolidants are hydrophilic, so they tend
to absorb water. Unfortunately, water is one of the main agent [45] of degradation of stone
materials used for architectural constructions. For this reason, we tried to exploit the
hydrophobic behavior of a common protective compound, fluoroelastomer N215, to
reduce the hydrophilic property of common consolidants. A new compound was
synthetized mixing the nano-silica and the fluoroelastomer. Figure 4.10 summarizes the
products used.

4 Advanced Applications: Environmental Sustainability
61
Figure 4.10: Schematic of consolidants applied to Maastricht stone.
The application of consolidants was executed by a pipette covering the entire surface of
one of the largest face of the stone sample, this face is called treated face. Syntheses and
treatments were
Performed by Mara Camaiti (CNR-IGG, Florence). The Maastricht stone was treated with
different quantities of products. In particular, the amounts of product applied for
treatments were calculate in order to fill specific percentages of the porosity of the stone
2.5%, 5% and 10%. In the table below applied quantities are listed. The application of the
products was similar to the procedure used in subsection 4.1.1.1.

4 Advanced Applications: Environmental Sustainability
62
Table 4.2: Details about the consolidating treatments.
The experiment consisted in two main steps.
1) Controlled Relative Humidity (RH): the water vapor absorbed by the stone was
monitored under controlled conditions of RH. The determination of transverse relaxation
4 Advanced Applications: Environmental Sustainability
63
time behavior allows to quantify and understand the behavior of the water into the porous
structure of the stone.
First of all, samples were left a couple of week inside a desiccator to reach the condition
“dry”. After this period, they were weighted by an electronic balance and sealed in
custom-made glass boxes for preserving the dry state. Once the stone was sealed, the box
was leant on the NMR probe MOUSE PM25 and analyzed by a CPMG pulse sequence
with a Pulse Length = 12 µs, TR = 2.5 s, TE = 80 µs, number of echoes = 800 and 9000
Scans. The MOUSE was used in the configuration with 10 mm spacers inserted. The
signal was acquired in a volume of sizes 25x25x0.3 mm3 located in the middle of the
sample, 10 mm from the treated face. The Inverse Laplace Transform was performed by
the software UPENwin (University of Bologna) based on the algorithm UPEN [46], [47].
To control RH, a fully-saturated NaCl+H2O solution is used in a glovebox, assuring a
constant RH of 75%. The temperature was stable 25 °C. Samples were located into the
glovebox for three days, the minimum time period tested to reach the saturation of water
vapor. After this period samples were weighted, then they were sealed into the glass boxes
and they were measured by the MOUSE using the same procedure used for the dry
samples.
2) Full Saturation: Dry samples were weighted. Then they were saturated under vacuum
(pressure reached inside the chamber Ps=1 mbar) with deionized water. After the process
samples were weighted and promptly sealed into glass boxes, to avoid the alteration of
the condition.
MRI images were collected using a tomograph (Varian) based on a 1.5 T superconductor
magnet. Spin-echo Multi-slice sequences were used to obtain at the same time a number
of adjacent axial sections with a FOV = 60x40 mm2. The thickness size of each slice was
4 Advanced Applications: Environmental Sustainability
64
1 mm, the gap between slices 0.1 mm, the pixel size 0.23x0.16 mm2, TR= 2.5 s, TE= 4
ms and the number of scans 4. Data were processed by the free-license software ImageJ
in order to obtain a signal intensity profile. For the analysis, a rectangular ROI was taken
around the shape of the sample section and the value of the calculated profile was
averaged all over the slices.
MOUSE PM25 was used in order to collect proton density profiles of saturated samples.
Stones were positioned on the flat coil of the device with the treated face oriented to the
instrument. A CPMG sequence was used for estimating the proton density. Principal
parameters of the sequence were: Pulse Length = 12 µs, TR = 5 s, TE = 80 µs, number of
echoes = 2048, resolution = 300 µm and number of Scans = 32. In order to obtain the
profile, the automated lift was set with a step size Stp = 300 µm for a total distance of
22.2 mm.
Two-dimensional NMR relaxometry measurements were collected by the Benchtop MRI
Tomograph (Magritek) based on a 0.5 T Halbach magnet. T2-T2 relaxation-exchange
experiment was performed by a CPMG-CPMG pulse sequence (Pulse Length = 44 µs,
TR = 5 s, TE = 300 µs, number of echoes = 2800, number of Steps = 128 and number of
Scans = 16) repeated varying the Mixing Time according to the following values: 0.5, 10,
50, 100, 150 ms. A software based on the algorithm of Venkataramanan [41] performed
the two-dimensional Inverse Laplace Transform to the collected data matrix (2800x128)
in order to realize a 64x64 map.
In the following subsections, the principal results are discussed.

4 Advanced Applications: Environmental Sustainability
65
4.1.2.2 Controlled Relative Humidity results and discussions
Figure 4.11: Distribution of transverse relaxation times for samples in the desiccator, on the left,
and samples in the condition of RH=75%, on the right. Reference (black), new synthetized
compound (green), nano-silica (pink), ethyl silicate (red) and fluoroelastomer (blue).
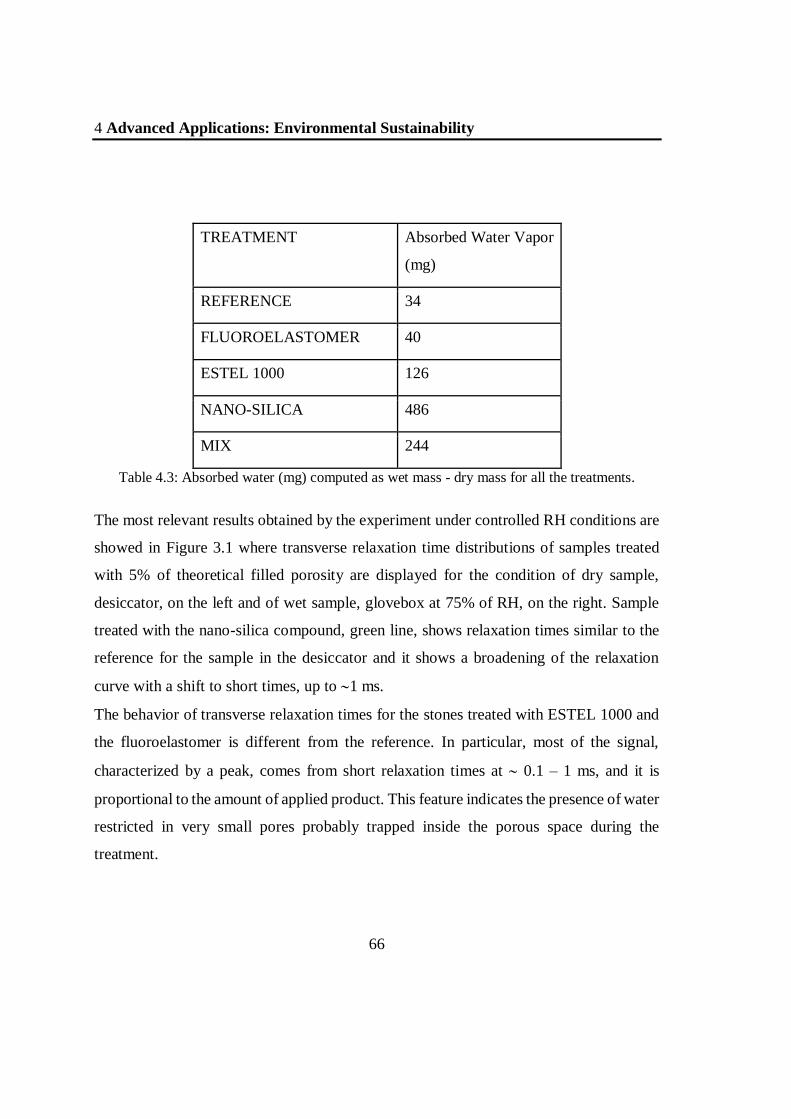
4 Advanced Applications: Environmental Sustainability
66
TREATMENT Absorbed Water Vapor
(mg)
REFERENCE 34
FLUOROELASTOMER 40
ESTEL 1000 126
NANO-SILICA 486
MIX 244
Table 4.3: Absorbed water (mg) computed as wet mass - dry mass for all the treatments.
The most relevant results obtained by the experiment under controlled RH conditions are
showed in Figure 3.1 where transverse relaxation time distributions of samples treated
with 5% of theoretical filled porosity are displayed for the condition of dry sample,
desiccator, on the left and of wet sample, glovebox at 75% of RH, on the right. Sample
treated with the nano-silica compound, green line, shows relaxation times similar to the
reference for the sample in the desiccator and it shows a broadening of the relaxation
curve with a shift to short times, up to 1 ms.
The behavior of transverse relaxation times for the stones treated with ESTEL 1000 and
the fluoroelastomer is different from the reference. In particular, most of the signal,
characterized by a peak, comes from short relaxation times at 0.1 – 1 ms, and it is
proportional to the amount of applied product. This feature indicates the presence of water
restricted in very small pores probably trapped inside the porous space during the
treatment.
4 Advanced Applications: Environmental Sustainability
67
For the fluoroelastomer, there are no relevant differences in the relaxation curves of dry
and wet conditions, confirming the results of the electronic balance that shows only a very
small amount of water vapor absorbed by the stone in the RH condition, see Table 4.2.
The ESTEL treated sample, according to weight showed in Table 4.2 absorbed a
considerable quantity of water revealed by the increased area under the peak of the wet
condition respect to the dry condition.
Green colored curves show the relaxation behavior of the sample treated with the new
synthetized compound. The trend is intermediate between the nano-silica and the
ESTEL1000 ones, confirming what was expected during the synthesis of this product.
Furthermore, the electronic balance results show an intermediate amount of absorbed
water between the ESTEL and the nano-silica, in agreement with the initial idea of trying
to reduce the hydrophilic property of the silicate particles by the use of a fluoroelastomer.
The experiment of monitoring samples in controlled RH conditions allowed us to study
the behavior of stone samples treated with consolidants in conditions that well simulate
the natural conditions of exposure of the calcarenite to water vapor.
4.1.2.3 Full-Saturation under vacuum experiment results and discussions
Single-sided and high-field tomograph analyses
Samples fully saturated under high vacuum were weighted by an electronic balance in
order to quantify the relative water mass contained into the samples (Table 4.3).

4 Advanced Applications: Environmental Sustainability
68
Table 4.4: Masses of samples before and after full-saturation with deionized water.
The reference Maastricht’s stone absorbed a mass-relative amount of water of 37 %. It is
easy to note that, in all the treated samples, the capability to get water decreases as the
product amount increases, confirming that the compound entered in the stone and
partially filled the empty space of the pores.
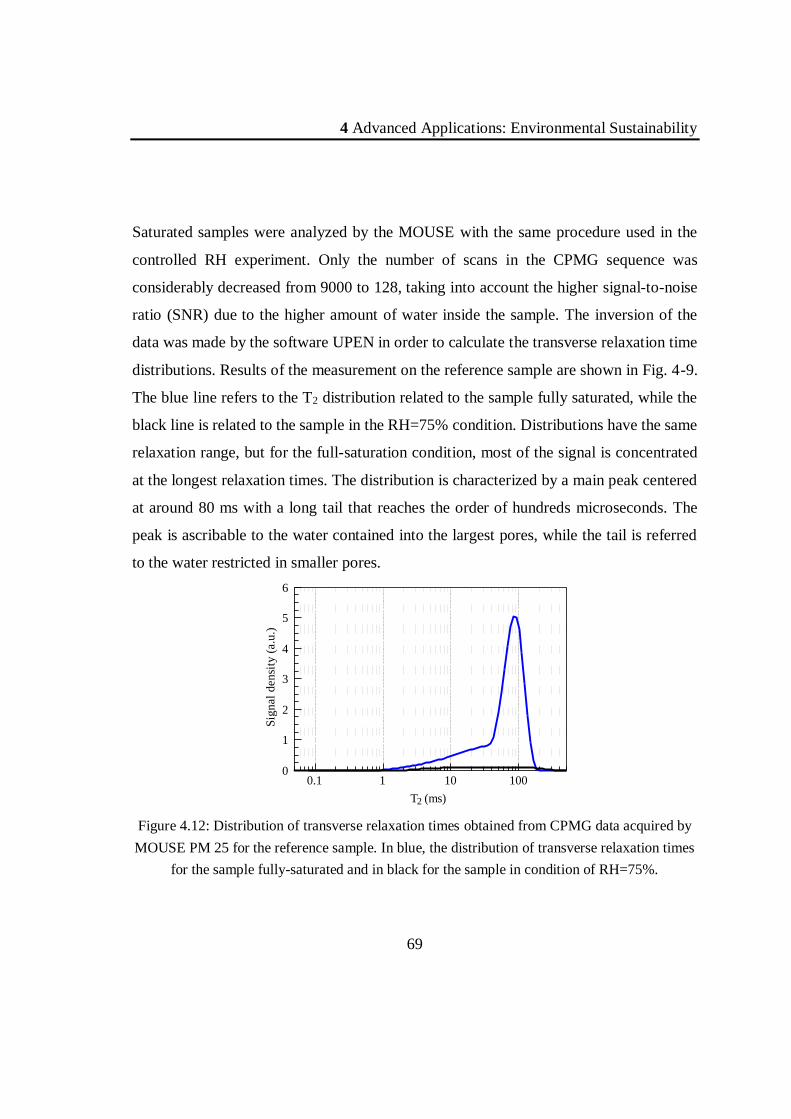
4 Advanced Applications: Environmental Sustainability
69
Saturated samples were analyzed by the MOUSE with the same procedure used in the
controlled RH experiment. Only the number of scans in the CPMG sequence was
considerably decreased from 9000 to 128, taking into account the higher signal-to-noise
ratio (SNR) due to the higher amount of water inside the sample. The inversion of the
data was made by the software UPEN in order to calculate the transverse relaxation time
distributions. Results of the measurement on the reference sample are shown in Fig. 4-9.
The blue line refers to the T2 distribution related to the sample fully saturated, while the
black line is related to the sample in the RH=75% condition. Distributions have the same
relaxation range, but for the full-saturation condition, most of the signal is concentrated
at the longest relaxation times. The distribution is characterized by a main peak centered
at around 80 ms with a long tail that reaches the order of hundreds microseconds. The
peak is ascribable to the water contained into the largest pores, while the tail is referred
to the water restricted in smaller pores.
T2 (ms)
0.1 1 10 100
Sig
nal
den
sity
(a.u
.)
0
1
2
3
4
5
6
Figure 4.12: Distribution of transverse relaxation times obtained from CPMG data acquired by
MOUSE PM 25 for the reference sample. In blue, the distribution of transverse relaxation times
for the sample fully-saturated and in black for the sample in condition of RH=75%.
4 Advanced Applications: Environmental Sustainability
70
In order to monitor the penetration depth and the distribution of the consolidant inside the
stone material [48], [49], each sample was analyzed by the NMR MOUSE PM 25 using
a proton density profile procedure [50], and results are shown on the right side of the
Figure 4.13. To validate the profile results obtained by the portable NMR probe, the spin-
echo imaging data acquired by the superconductor tomograph were evaluated. Intensity
values of each pixel column are plotted in order to obtain an intensity profile. As it is
possible to note, the water content inside the fully-saturated samples is clearly constant
all over the stone, indicating a good penetration and a uniform distribution of the
consolidant. Only in the last profile, related to sample treated with the new synthetized
compound, is evident the difference of the water content between the first 10 mm and the
rest of the stone. This evidence was completely cleared by the MRI analysis using the
Varian tomograph. Indeed, looking at the profile obtained from the analysis of the images,
the signal intensity of the profile has the same trend of the single-sided probe results and
one can link this behavior to a bad distribution of the compound inside the stone. But it
is possible to ascribe this behavior to the presence of inhomogeneity of the stone, in
particular to the presence of a whole fossil mollusk shell, detectable by the large dark area
in the last image in Figure 4.13.

4 Advanced Applications: Environmental Sustainability
71
Figure 4.13: from the left: images, profiles obtained by the Varian MRI tomograph, and profiles
from NMR-MOUSE PM25. From top to bottom the samples treated with ESTEL, Nano-Silica,
Fluoroelastomer, New synthetized compound.
Halbach analysis. The two-dimensional T2-T2 relaxation-exchange experiment,
performed by the Halbach apparatus, was accomplished by the use of the CPMG-CPMG
pulse sequences in order to monitor the connectivity of the pore space after the application
of the treatment.

4 Advanced Applications: Environmental Sustainability
72
Figure 4.14: T2-T2 maps: from left to right increasing mixing time . From top to bottom the
different treatments: ESTEL, Nano-Silica, Fluoroelastomer, New synthetized compound.
One of the most important parameter is the mixing time Δ. In Figure 4.14 the results of
T2-T2 measurements are shown for samples treated with 5% of theoretical filled porosity
with a Δ of 0.5 ms, 10 ms and 150 ms. As expected, with the shortest mixing time, 2D

4 Advanced Applications: Environmental Sustainability
73
maps of the first column, the shape of the correlation function is symmetrical respect to
the main diagonal. As the Δ increases, water molecules have more time for moving from
one class of pore to another one, so the probability increases to exchange their
magnetizations. Indeed, for Δ = 10 ms and Δ = 150 ms, it is possible to note the formation
of off-diagonal peaks and the disappearance of the shortest component on the diagonal.
The off-diagonal peaks represent the exchange of magnetization between water molecules
belonging to two different sites, one with the transversal relaxation time longer than the
other. For each sample it is possible to observe the formation of peaks that show an
exchange between water molecules having relation times of around 10 ms and 100 ms.
The presence of these peaks in each map with a Δ ≥ 10 ms tells us that consolidation
treatments, used in this study, do not change the connectivity properties of the stone
material, assuring that compounds enter in the stone without a blockage of the pore
structure. This is one of the most important characteristic that a conservative treatment
must have to be used as a restoration compound for Cultural Heritage.
4.1.2.4 Conclusions
All the consolidative products analyzed showed appropriate characteristics for the use as
consolidative agents for the limestone material used in this study. Indeed, compounds
have a good capacity to penetrate into the porous medium and they show a uniform
distribution inside the stone.
The sample treated with ethyl silicate trapped a considerable quantity of water during the
application of the treatment and, in condition of 75% of relative humidity, it absorbed an
intermediate amount of water vapor. Viceversa, the stone specimen treated with nano-
silica did not trap H2O during the treatment but absorbed the highest amount of water

4 Advanced Applications: Environmental Sustainability
74
vapor. The fluoroelastomer has the tendency to snare H2O molecules during its
application and, as a result of its hydrophobic property [51], [39], it captured the minimum
amount of water vapor among all the tested compounds. The new synthetized product did
not trap the water during the treatment, while the nano-silica did, and, in the controlled
relative humidity condition, it absorbed an amount of water vapor intermediate between
the values measured for the fluoroelastomer and the nano-silica.
Common consolidants, characterized by hydrophilic properties, absorbed considerable
amount, 100-400 mg, of water in condition that well simulate the natural one (75% RH),
but the water is one of the main agent that deteriorates the stone material. The attempt to
reduce their hydrophilic behavior mixing the fluoroelastomer and the nano-silica showed
encouraging results.
All the compounds maintain the connectivity behavior of the stone matrix unchanged as
demonstrated by T2-T2 experiment. This is a fundamental characteristic of a conservative
compound to be used for Cultural Heritage purposes.
This study has shown how the combination of different NMR techniques, applied in the
time domain and spatially resolved, is a powerful approach for the evaluation of the
efficiency of consolidative compounds. Furthermore, the comparison between the high-
field MRI and low-filed single-sided profile analyses allowed to validate the capability
of the portable probe to get robust information for possible in-situ applications.
4 Advanced Applications: Environmental Sustainability
75
4.2 Climate Change: effects of Ocean Warming and
Acidification on corals
One of the most important environmental issue of our time is the global climate change,
that will strongly affect a broad variety of terrestrial and marine lifeforms. It is expected
that effects of climate change will influence more the marine communities than terrestrial
ones, in particular in temperate areas. The expected increase of temperature is one of the
greatest challenge for the marine ecosystems survival, especially for corals. For these
reasons, in this work, Mediterranean corals were selected as a natural model for studying
the effects on marine calcifying organisms of global climate change, that determines
ocean warming and acidification.
TD-NMR, and in particular magnetic resonance relaxometry of water 1H nuclei for
analyzing internally connected skeletal porosity, has several advantages compared to
other methods because it is a non-destructive and non-invasive procedure, allowing intact
specimens to be further analyzed with other techniques. In the studies reported in this
thesis, the transverse magnetization component, with transverse relaxation time T2, was
studied. In porous media saturated by water, under the assumptions that the relaxation
rate of the unconfined water is negligible and the molecular diffusion is fast enough to
maintain the magnetization uniform within the pores, the distribution of T2 corresponds
to specific “pore-size” distributions. The area below each distribution is proportional to
the total NMR signal and therefore is proportional to the volume of water saturating the
skeletal pore volume.
For the first time, the porosity and the pore-space structure of the skeletons of
scleractinian corals were analyzed by this technique. In a first experiment, two coral
species, Balanophyllia europaea (B. europaea) (zooxanthellate) and Leptopsammia

4 Advanced Applications: Environmental Sustainability
76
pruvoti (L. prouvoti) (nonzooxanthellate), were taken from three different sites on the
western Italian coast along a temperature gradient. In the second experiment B.europaea
corals were collected along a pH gradient generated by a underwater CO2 vent located
close to the Panarea Island.
The first research has been published with the title “A Time-Domain Nuclear Magnetic
Resonance Study of Mediterranean Scleractinian Corals Reveals Skeletal-Porosity
Sensitivity to Environmental Changes” by P. Fantazzini, S. Mengoli, S. Evangelisti, L.
Pasquini, M. Mariani, L. Brizi, S. Goffredo, E. Caroselli, F. Prada, G. Falini, O. Levy, Z.
Dubinsky, on Environmental Science & Technology, 47: 12679-12686 (2013). The paper
and useful references can be found in the online version (doidoi.org/10.1021/es402521b
controllare) and/or in the appendix of the printed version of this thesis.
The second research has been published with the title “Gains and losses of coral skeletal
porosity changes with ocean acidification acclimation” by P. Fantazzini, S. Mengoli, L.
Pasquini, V. Bortolotti, L. Brizi, M. Mariani, M. Di Giosia, S. Fermani, B. Capaccioni,
E. Caroselli, F. Prada, F. Zaccanti, O. Levy, Z. Dubinsky, J. A. Kaandorp, P. Konglerd,
J. U. Hammel, Y. Dauphin, J-P. Cuif, J. C. Weaver, K. E. Fabricius, W. W., P. Fratzl, G.
Falini, S. Goffredo, Open Access on Nature Communications, 6, Article number: 7785
(p. 1-7). The paper and useful references can be found in the online version
(doi:10.1038/ncomms8785) and/or in the appendix of the printed version of this thesis.
The collaboration, project leader for the University of Bologna Stefano Goffredo
(Department BiGEA), has involved many international groups from Europe, USA and
Israel.

4 Advanced Applications: Environmental Sustainability
77
This research has received funding from the European Research Council under the
European Union’s Seventh Framework Programme (FP7/2007-2013)/ERC Grant 249930
(Coral- Warm: Corals and global warming: the Mediterranean versus the Red Sea).
My personal contribution is related to NMR measurements and analyses, interpreted on
the light of all the parameters furnished by the research group.
4.2.1 First experiment: NMR study of corals along the Mediterranean
Temperature Gradient
4.2.1.1 Materials and methods
Specimens of B. europaea L. pruvoti were randomly collected by SCUBA diving between
1 July 2010 and 4 February 2011 from the three sites, Calafuria (CL), Palinuro (PL) and
Pantelleria Isle (PN), along a latitudinal gradient (CL: 43°27’N, 10°21’E; PL: 40°02’N,
15°16’E; PN: 36°45’N, 11°57’E) and a sea surface temperature (SST) gradient (CL:
18.840.08 °C; PL: 19.72 0.07°C; PN: 20.61 0.07°C) from the same locations where
the porosity of the two species has been studied previously. Coral tissue was totally
removed and corals cleaned. Skeletal cleaned dry mass (m) was measured with a precision
balance. The corals were then placed into a dryer chamber and evacuated by a rotary
mechanical pump down to a vacuum of 10-2 mbar, and, after 6 hours, water was gently
introduced, to fully saturate them. Finally, the pump was switched off and the chamber
was vented to the ambient atmosphere. For NMR measurements, the corals were removed
from the water container and very rapidly placed on wet paper in order to remove the
4 Advanced Applications: Environmental Sustainability
78
excess of water on the external surfaces. Then each specimen was put on the bottom of a
glass tube, sealed and measured.
A home-built relaxometer based on a 0.2 T permanent magnet with a coil ≈ 2 cm in
diameter in order to analyze the entire coral, without the need to break it into small pieces,
and equipped with a Spinmaster console (Stelar, Mede, Pavia, Italy) was used. The Carr-
Purcell-Meiboom-Gill (CPMG) sequence with TE=200 s was used for T2 relaxation time
measurements. Inverse Laplace Transform was performed on relaxation decay data in
order to obtain T2 distributions by the algorithm UPEN (Uniform-Penalty inversion
algorithm), implemented in UpenWin software.
The total NMR signal (SNMR), represented by the area below each T2 distribution, is
proportional to the volume of water saturating the pore-space volume VP. Therefore, one
can write SNMR = kVP, where k is a constant depending on instrumental conditions that
should be the same for similar specimens. Dividing this signal by the total volume, one
gets a value proportional to the total porosity of the specimen (in this case including the
empty oral cavity).
Furthermore, the fraction of water with relaxation times over a given interval of the
distribution corresponds to the pore volume fraction over a corresponding pore-size
range. “NMR macroporosity”, “macroporosity” for short, will indicate the fraction of VP
where the larger pores are weakly coupled by water diffusion to the smaller ones on the
local relaxation time scale. If the slope of the distribution shows a strong increase at a
certain T2 value, it is possible to choose this T2 value as the point of separation between
“smaller” and “larger” pores. This relaxation time will be called the “cutoff”. The macro-
porosity is then defined as the fraction of 1H signal with a T2 larger than the cutoff, divided

4 Advanced Applications: Environmental Sustainability
79
by the total 1H signal. Operatively, it is the ratio of the area under the distribution for T2
larger than the cutoff to the total area under the distribution.
4.2.1.2 Results and discussions
The TD-NMR analysis showed that the distributions of all the coral skeletons are
characterized by a major peak at long relaxation times and a long tail, of smaller
amplitude, up to three orders of magnitudes wide. The major shape difference between
the two coral species was the length of the tail. The major difference among the
distributions inside each group was given by the total area, due to the wide range of
masses and volumes of the specimens examined. Examples are given in Figure 4.15,
along the indication of the “macroporosity” area and a picture of a skeleton.
Figure 4.15: Transverse relaxation time distributions of the 1H NMR signal from samples of
cleaned coral skeletons, after water saturation of the connected pore space.
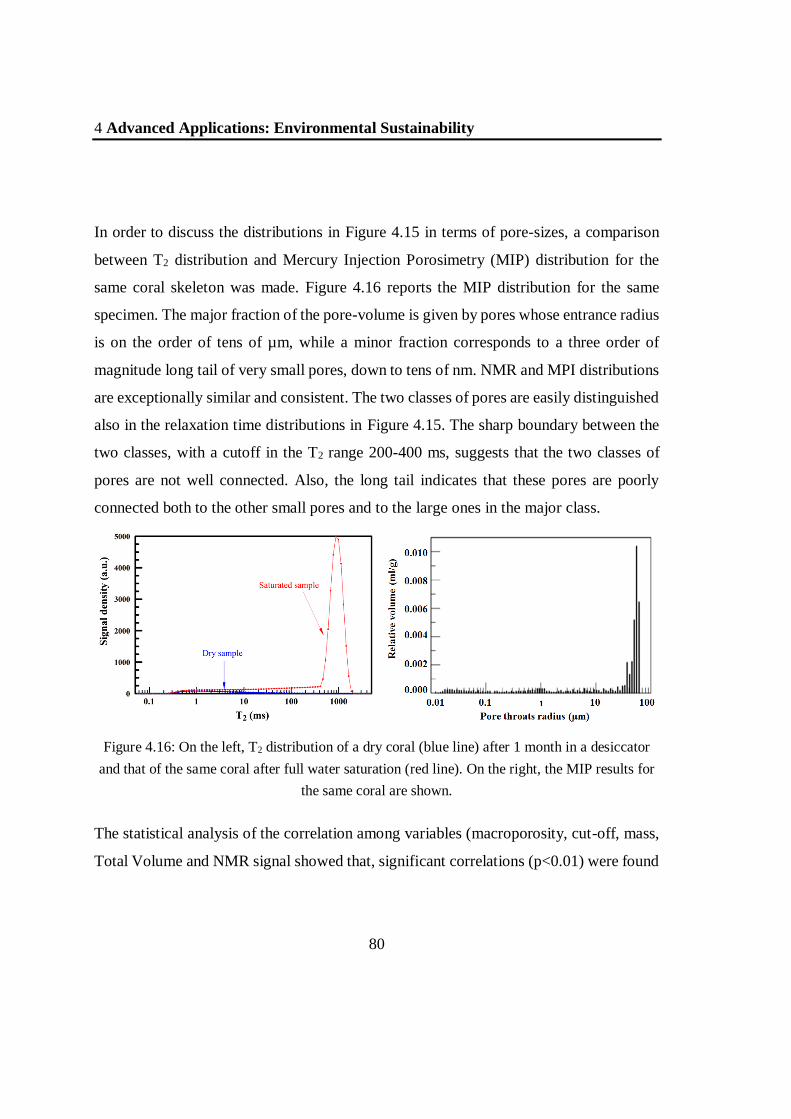
4 Advanced Applications: Environmental Sustainability
80
In order to discuss the distributions in Figure 4.15 in terms of pore-sizes, a comparison
between T2 distribution and Mercury Injection Porosimetry (MIP) distribution for the
same coral skeleton was made. Figure 4.16 reports the MIP distribution for the same
specimen. The major fraction of the pore-volume is given by pores whose entrance radius
is on the order of tens of µm, while a minor fraction corresponds to a three order of
magnitude long tail of very small pores, down to tens of nm. NMR and MPI distributions
are exceptionally similar and consistent. The two classes of pores are easily distinguished
also in the relaxation time distributions in Figure 4.15. The sharp boundary between the
two classes, with a cutoff in the T2 range 200-400 ms, suggests that the two classes of
pores are not well connected. Also, the long tail indicates that these pores are poorly
connected both to the other small pores and to the large ones in the major class.
Figure 4.16: On the left, T2 distribution of a dry coral (blue line) after 1 month in a desiccator
and that of the same coral after full water saturation (red line). On the right, the MIP results for
the same coral are shown.
The statistical analysis of the correlation among variables (macroporosity, cut-off, mass,
Total Volume and NMR signal showed that, significant correlations (p<0.01) were found

4 Advanced Applications: Environmental Sustainability
81
for pairs variables mass and total volume, mass and SNMR, and total volume and SNMR,
in both species. In particular, macroporosity and cut-off, and macroporosity and mass
were significantly correlated for both species (p < 0.01 for B. europaea, and p < 0.05 for
L. pruvoti). More information can be found in the quoted published paper.
The higher the mass, the larger the macroporosity and the longer the cutoff. If the mass
increases, both the cutoff and the ratio between the fraction of the two pore classes
change, with smallest pores becoming less abundant. This effect is stronger for B.
europaea than for L. pruvoti. This is consistent with the gradual “filling up” of the smaller
pores with the growth of the coral.
4.2.1.3 Conclusions
For both species, the sea temperature does not significantly affect mass (p > 0.1). A
significant relationship between macroporosity and sea surface temperature exists only
for B. europaea (p<0.05). This is consistent with the result of a previous investigation,
that showed a dependence of the porosity on the temperature for B. europaea but not for
L. pruvoti. The increase of porosity with temperature in zooxanthellate species
NMR results indicate that this effect could be accompanied by an increase in the fraction
of the largest pores in the pore space.
This study shows that TD-NMR is a useful noninvasive and nondestructive method which
can be applied to investigate the pore-space architecture of scleractinian corals, measuring
differences between species and growing sites, and sensitivity to environmental changes.
The results show that TD-NMR parameters are sensitive to changes in the pore structure
of the coral skeletons. In particular, a parameter related to the porosity, is larger for L.
pruvoti than for B. europaea, confirming previous non-NMR results. The NMR
4 Advanced Applications: Environmental Sustainability
82
macroporosity, describing the fraction of the total pore volume with pore sizes larger than
10−20 μm, has a significant correlation with the mass of the specimen and, for B.
europaea, with the temperature of the growing site. This phenomenon, that was observed
in the zooxanthellate species, could depend on an inhibition of the photosynthetic process
at high temperatures that involves an attenuation of calcification. This effect could reduce
the resistance to mechanical stresses of the coral, causing possible negative consequences
for population density and space colonization.
For these reasons, the effect could have particular importance in determining
consequences of global warming on these species.
The TD-NMR method, applied for the first time in this work, has been then applied in a
further study concerning the effects of ocean acidification on the skeletal properties of
corals, presented in the next section (4.2.2).
About all the details related to the paper published on Environmental Science and
Technology and references, see the link: dx.doi.org/10.1021/es402521b
4.2.2 Second experiment: Coral skeletal porosity changes with ocean
acidification acclimation
Here the TD-NMR method developed in Section 4.2.1 was used to study the acclimation
potential of the stony coral B. europaea living along a pH gradient caused by a
Mediterranean CO2 vent that serves as a natural long-term experimental setting, located
near Panarea Island. A multi-length scale analysis of skeletal features was conducted in
parallel to the TD-NMR analysis, exploiting different techniques like Scanning Electron
Microscope (SEM) imaging, Micro Computed Tomography (µCT), Nano-indentation,
Small Angle X-ray Scattering (SAXS) and Atomic Force Microscope (AFM). The
4 Advanced Applications: Environmental Sustainability
83
potentiality of TD-NMR method was to allow the detection of the multi-length scale of
the skeleton pore-space by means of a single measurement on the intact skeleton.
4.2.2.1 Materials and Method
The skeletons of 44 corals were analyzed. Corals, of similar age (mean age 12 years), had
lived along the CO2-pH gradient. A 0.2T permanent magnet operating at 8MHz, equipped
with a coil ~2cm in diameter, was used for acquisition of the transverse relaxation curve
of the 1H nuclei of water molecules saturating the cleaned coral skeletons. A Spinmaster
console (Stelar, Mede, Pavia, Italy) was used for automatic pulse sequence transmission
and data acquisition. The transverse relaxation data were acquired by using the CPMG
sequence with TE = 200 ms.
The distributions of T2 were obtained through mathematical inversion of the experimental
transverse relaxation curves, as those shown in Figure 4.15. As usual, the ordinate-labeled
signal density is an approximation to dS/(d lnT2), where S is the extrapolated signal per
Neper (factor of e) of relaxation time. In this study cut-offs were determined in such a
way to devide the area under the distribution in nano- micro- and macro-scale pore
volume. The nano-, micro-, and macroscale pore volume fractions multiplied by the
skeletal porosity (PA), allowed the computation of the TD-NMR nano-, micro-, and
macroscale porosities, respectively.
4.2.2.2 Results and discussions
Figure 4.17 shows the TD-NMR results obtained for the 44 coral skeletons in the three
selected sites at different pH values.
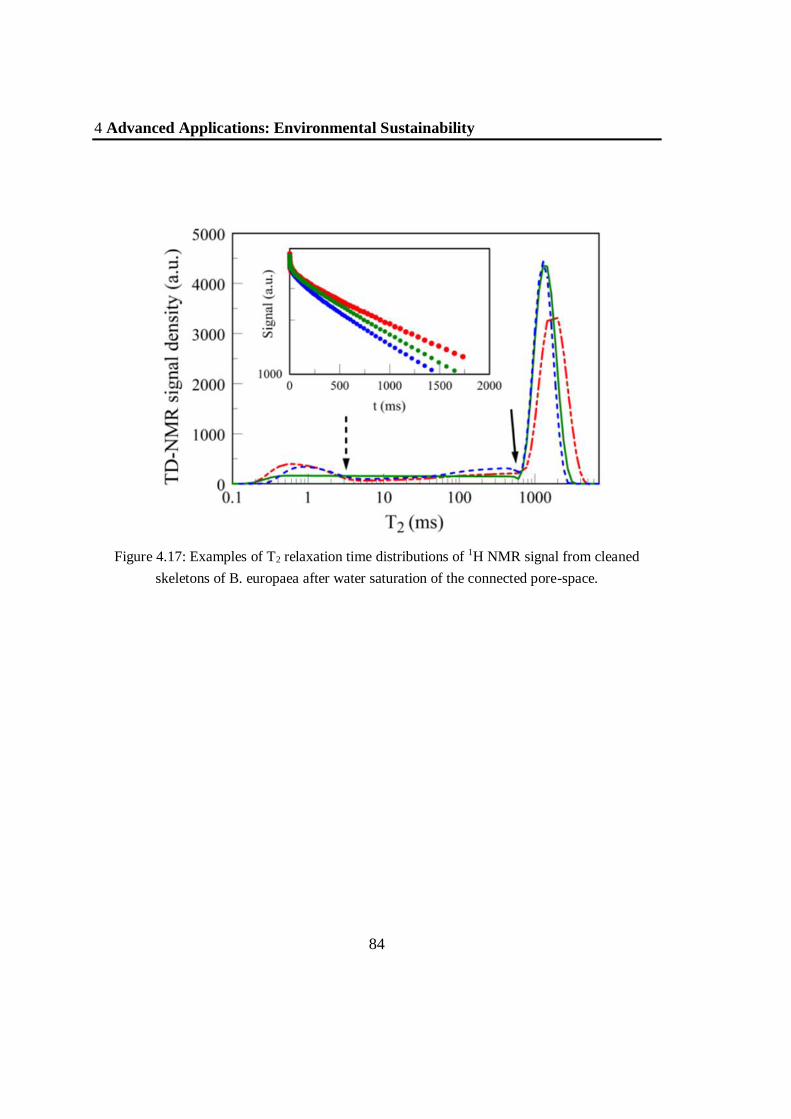
4 Advanced Applications: Environmental Sustainability
84
Figure 4.17: Examples of T2 relaxation time distributions of 1H NMR signal from cleaned
skeletons of B. europaea after water saturation of the connected pore-space.
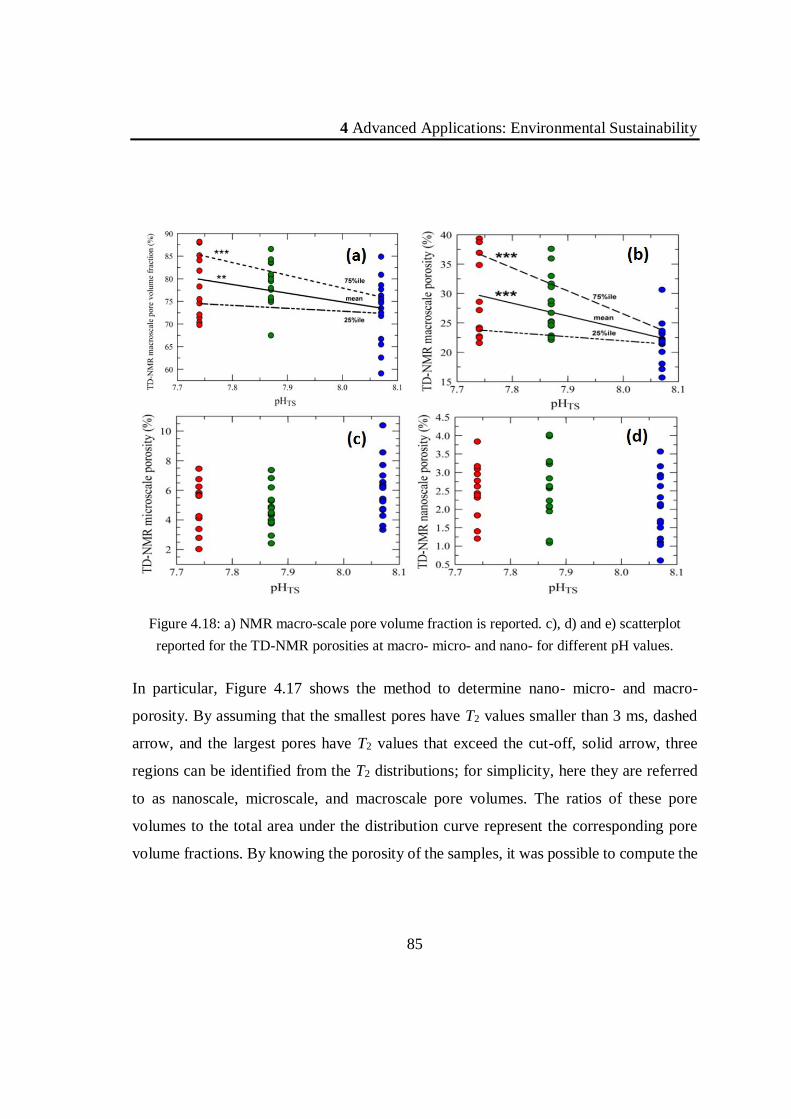
4 Advanced Applications: Environmental Sustainability
85
Figure 4.18: a) NMR macro-scale pore volume fraction is reported. c), d) and e) scatterplot
reported for the TD-NMR porosities at macro- micro- and nano- for different pH values.
In particular, Figure 4.17 shows the method to determine nano- micro- and macro-
porosity. By assuming that the smallest pores have T2 values smaller than 3 ms, dashed
arrow, and the largest pores have T2 values that exceed the cut-off, solid arrow, three
regions can be identified from the T2 distributions; for simplicity, here they are referred
to as nanoscale, microscale, and macroscale pore volumes. The ratios of these pore
volumes to the total area under the distribution curve represent the corresponding pore
volume fractions. By knowing the porosity of the samples, it was possible to compute the
4 Advanced Applications: Environmental Sustainability
86
corresponding contributions to the porosity. Macro-, micro-, and nano-scale porosity are
plotted against pH (Total Scale) in Figure 4.18. The sum of macro- micro- and
nanoporosity corresponds to the total porosity. The regressions shown in Figure 4.18 a)
and b) are statistically significant; the regressions shown in c), and d) are not statistically
significant.
One of the most important results was the combination of NMR results with the values of
the linear extension rates of the corals obtained by the marinescience group. It was found
that this parameter does not vary notwithstanding the increase of macroporosity with
increasing acidity of the sea.
4.2.2.3 Conclusions
Weight measurements, combined with TD-NMR data represent a non-destructive
technique for determining skeletal porosity over length scales spanning from tens of
nanometers to tens of micrometres. Results reported here for B. europaea make this
species not representative of the generalized response of all coral species to ocean
acidification, but they are consistent with observations made on other reef-building
scleractinians. as the results show that the skeletal linear extension rate remains constant
even if the calcification rates and bulk skeletal density decreases (porosity increases) as
functions of reduced aragonite saturation. This phenomenon can be explained by
considering an acclimation process of the corals to balance the reduced net calcification
rate with an increased macroporosity to maintain constant linear extension. This multi-
scale analysis shows that at the nano- and micro-scales, all the skeletal characteristics
including biomineral density, are unchanged. Bulk density decrease is dependent on the
increase of macroporosity as the pH decrease, while the linear extension rate remains
4 Advanced Applications: Environmental Sustainability
87
constant. These observations provide consistent clues regarding the sensitivity of this
species to global climate change predicted for the coming decades.
In this study, it has been demonstrated that the almost universally employed measure of
coral biomineralization, namely the rate of linear extension, might not be a reliable metric
for assessing coral health and resilience in a warming and acidifying ocean. Indeed, in
conditions of decreasing seawater pH, although corals tend to acclimate by maintaining
linear extension rate and gross skeletal morphology in order to reach sexual maturity, they
reduce skeletal resistance to environmental challenges, affecting the long-term
survivability of the species.
About all the details related to the paper published on Nature Communications and
references, see the link:
http://www.nature.com/ncomms/2015/150717/ncomms8785/full/ncomms8785.html

5 Advanced Applications: Human Healthcare
88
5 ADVANCED APPLICATIONS:
HUMAN HEALTHCARE
Whereas everyone knows that NMR can be applied to obtain very important
morphological and functional images of human body by MRI, other less known NMR
applications can be not less important. Here NMR applications based on the acquisition
of NMR signals in the Time Domain will be considered and shown their importance for
human healthcare.
In this chapter two examples will be presented. The first one will be the use of single-
sided devices to detect the signal locally inside a bone to determine the ratio Bone
Volume/Total Volume (BV/TV), an important parameter for osteoporosis diagnosis. The
second example will consider the detection and quantification of the morphological
changes and water compartmentalization that occur when cells are subjected to stress.
The first research has not yet been published and is still in progress. The second research
has been published as “Water compartmentalization, cell viability and morphology
changes monitored under stress by 1H-NMR relaxometry and phase contrast optical
microscopy“ by L. Brizi, G. Castellani, P. Fantazzini, M. Mariani, D. Remondini, I.
Zironi, J. Physics D: Applied Physics, 48: 415401 (9 pp) (2015). The paper and useful
references can be found in the online version (http://dx.doi.org/10.1088/0022-
3727/48/41/415401) and/or in the appendix of the printed version of this thesis.

5 Advanced Applications: Human Healthcare
89
5.1 Bone tissue and Osteoporosis
Osteoporosis is a disease characterized by loss of bone tissue, with alterations of bone
mineral density (BMD) and architecture, leading to high risk of bone fractures. Dual X-
rays Absorptiometry is the gold standard technique, even if it does not measure bone
microarchitecture. The importance of assessing bone microarchitecture in addition to
BMD for osteoporosis diagnosis has been emphasized in a number of publications.
NMR has been widely applied to assess porosity and pore-size distribution in porous
media. Applications have been reported for trabecular bone porosity assessment as well
[2], [4], [52], [53]. Here the preliminary results will be reported of a research conducted
at the Department DIFA of the University of Bologna, in collaboration with the “Istituto
Ortopedico Rizzoli” of Bologna and partially funded by the “Fondazione del Monte di
Bologna e Ravenna”. The goal of the proposal is to establish a new NMR method, based
on the use of a mobile NMR single-sided device, for the diagnosis of osteoporosis,
through the acquisition of the signal from fingers. The device is mounted on a lift for
automatic shift of the magnet in order to get signal from selected internal sensitive
volumes, as described in the Section 3.1.1. Here we report the results obtained on animal
bone samples built in the shape of cylinders in order to simulate human fingers. Signals
have been acquired from four internal sections of the samples and normalized to the signal
of bulk marrow samples, in order to determine the ratio Bone Volume to Total volume
(BV/TV). The results have been compared with BV/TV obtained by micro-Computed
Tomography and a good agreement has been found. These results, based on a new and
5 Advanced Applications: Human Healthcare
90
original idea, demonstrate the feasibility of the characterization of the microarchitecture
of the bone by this method.
5.1.1 Materials and methods
5.1.1.1 NMR measurements
NMR analysis was performed by the single-sided apparatus described in Section 3.1.1
based on the Profile NMR-MOUSE PM10 (Magritek), a portable low magnetic field
permanent magnet. In order to characterize the T1 and T2 relaxation behaviors, a
Saturation Recovery and a CPMG sequences were used. The NMR Profile measurement
was executed according to the procedure described in Section 3.1.1 for obtaining a profile
related to the proton density of the medium. NMR measurements and analyses were
performed at DIFA in collaboration with Marco Barbieri.
5.1.1.2 Micro-Computed Tomography
Samples were analyzed by a Skyscan micro-CT mod. 1072 (Bruker MicroCT, Konthich,
Belgium) at the Laboratory of Medical Technology of the Istituto Ortopedico (IOR)
Rizzoli of Bologna. The x-ray source was set at 50kV and 200µA with a resolution (pixel
size) of 19.54 µm. Each scan was performed with a sample rotation on 180° on its axis,
with a rotation step of 0.9° producing 206 projections.
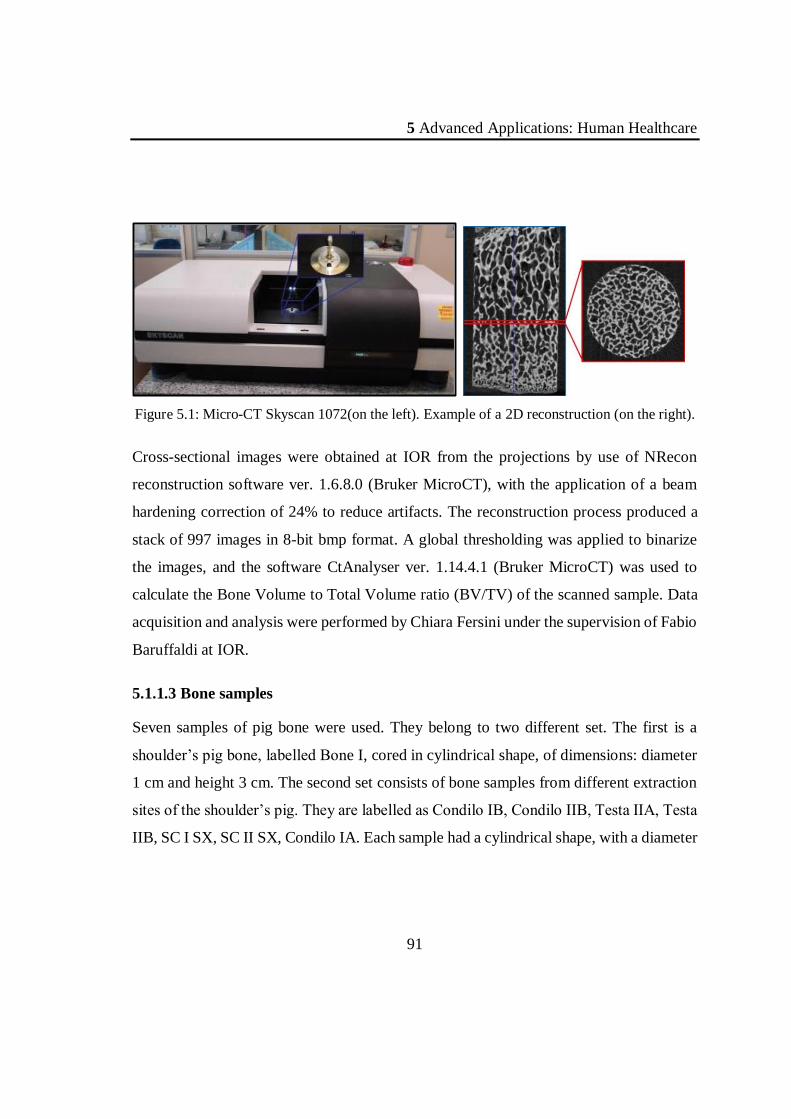
5 Advanced Applications: Human Healthcare
91
Figure 5.1: Micro-CT Skyscan 1072(on the left). Example of a 2D reconstruction (on the right).
Cross-sectional images were obtained at IOR from the projections by use of NRecon
reconstruction software ver. 1.6.8.0 (Bruker MicroCT), with the application of a beam
hardening correction of 24% to reduce artifacts. The reconstruction process produced a
stack of 997 images in 8-bit bmp format. A global thresholding was applied to binarize
the images, and the software CtAnalyser ver. 1.14.4.1 (Bruker MicroCT) was used to
calculate the Bone Volume to Total Volume ratio (BV/TV) of the scanned sample. Data
acquisition and analysis were performed by Chiara Fersini under the supervision of Fabio
Baruffaldi at IOR.
5.1.1.3 Bone samples
Seven samples of pig bone were used. They belong to two different set. The first is a
shoulder’s pig bone, labelled Bone I, cored in cylindrical shape, of dimensions: diameter
1 cm and height 3 cm. The second set consists of bone samples from different extraction
sites of the shoulder’s pig. They are labelled as Condilo IB, Condilo IIB, Testa IIA, Testa
IIB, SC I SX, SC II SX, Condilo IA. Each sample had a cylindrical shape, with a diameter
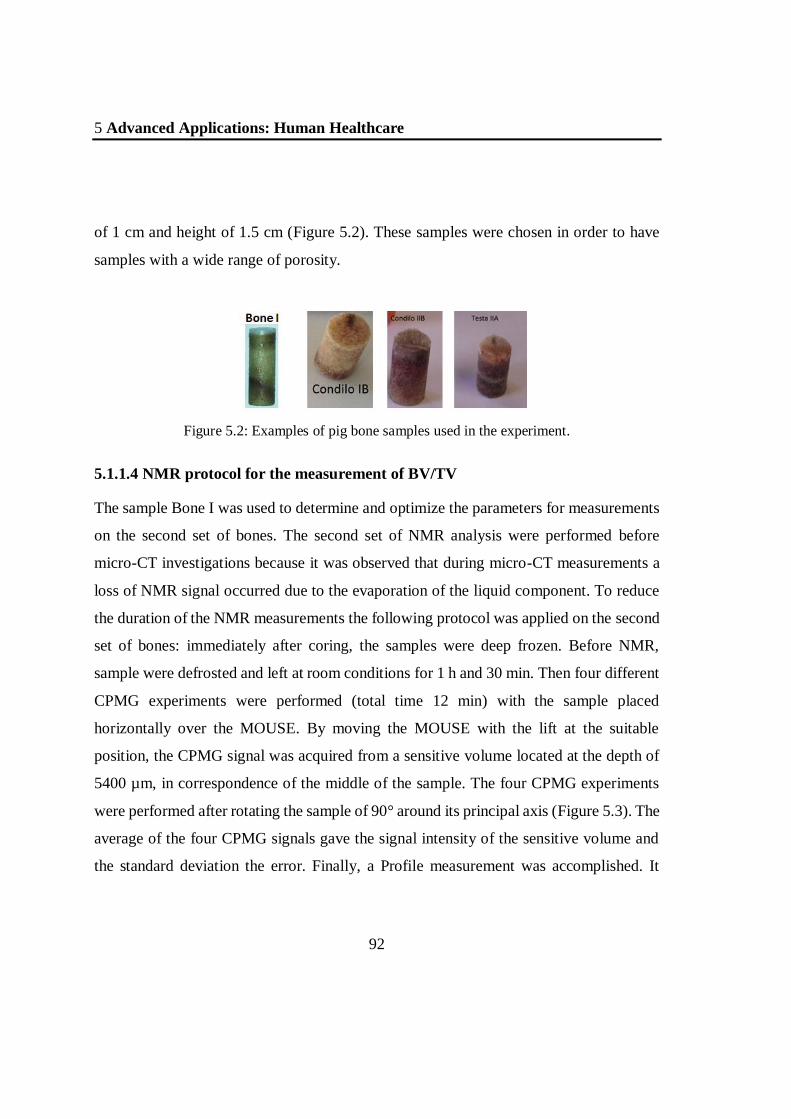
5 Advanced Applications: Human Healthcare
92
of 1 cm and height of 1.5 cm (Figure 5.2). These samples were chosen in order to have
samples with a wide range of porosity.
Figure 5.2: Examples of pig bone samples used in the experiment.
5.1.1.4 NMR protocol for the measurement of BV/TV
The sample Bone I was used to determine and optimize the parameters for measurements
on the second set of bones. The second set of NMR analysis were performed before
micro-CT investigations because it was observed that during micro-CT measurements a
loss of NMR signal occurred due to the evaporation of the liquid component. To reduce
the duration of the NMR measurements the following protocol was applied on the second
set of bones: immediately after coring, the samples were deep frozen. Before NMR,
sample were defrosted and left at room conditions for 1 h and 30 min. Then four different
CPMG experiments were performed (total time 12 min) with the sample placed
horizontally over the MOUSE. By moving the MOUSE with the lift at the suitable
position, the CPMG signal was acquired from a sensitive volume located at the depth of
5400 µm, in correspondence of the middle of the sample. The four CPMG experiments
were performed after rotating the sample of 90° around its principal axis (Figure 5.3). The
average of the four CPMG signals gave the signal intensity of the sensitive volume and
the standard deviation the error. Finally, a Profile measurement was accomplished. It
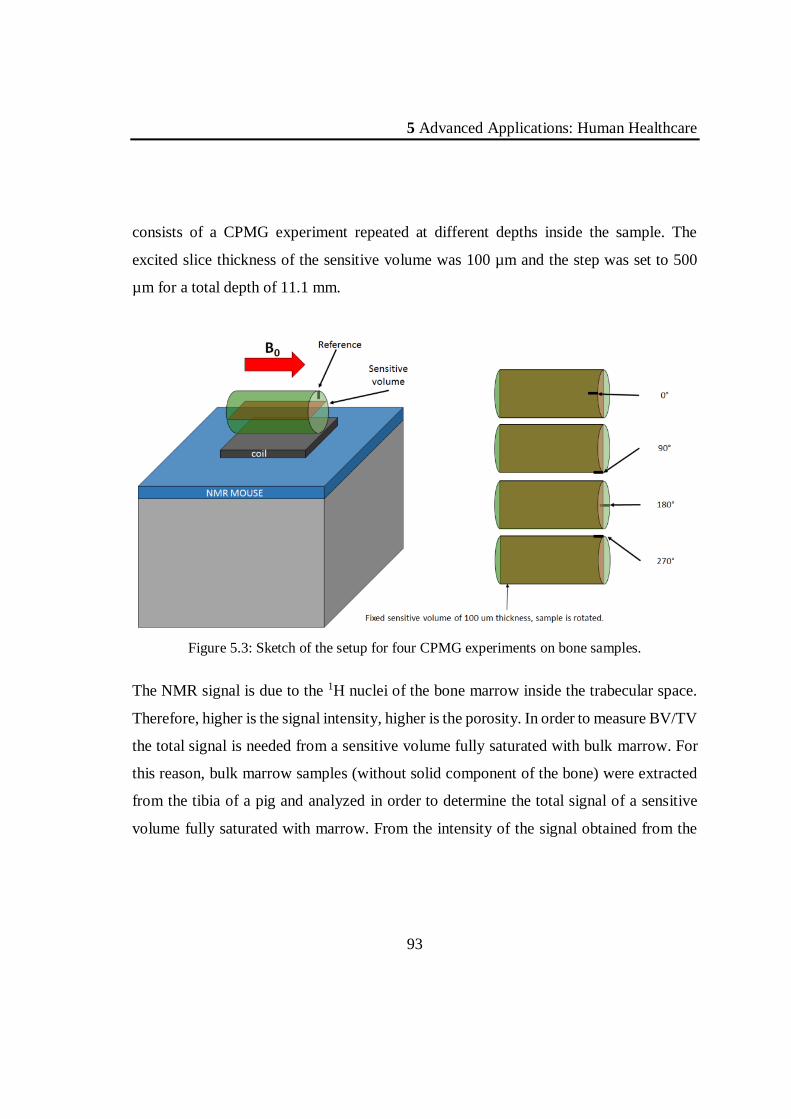
5 Advanced Applications: Human Healthcare
93
consists of a CPMG experiment repeated at different depths inside the sample. The
excited slice thickness of the sensitive volume was 100 µm and the step was set to 500
µm for a total depth of 11.1 mm.
Figure 5.3: Sketch of the setup for four CPMG experiments on bone samples.
The NMR signal is due to the 1H nuclei of the bone marrow inside the trabecular space.
Therefore, higher is the signal intensity, higher is the porosity. In order to measure BV/TV
the total signal is needed from a sensitive volume fully saturated with bulk marrow. For
this reason, bulk marrow samples (without solid component of the bone) were extracted
from the tibia of a pig and analyzed in order to determine the total signal of a sensitive
volume fully saturated with marrow. From the intensity of the signal obtained from the

5 Advanced Applications: Human Healthcare
94
marrow of the bone samples, it is possible to calculate the BV/TV parameter in the follow
way:
BV/TV = (1- Sbone/Smarrow ) ∙ 100% ,
where Sbone is the NMR signal from the marrow inside the bone sample and Smarrow is the
NMR signal from the bulk marrow sample.
5.1.2 Results and discussions
5.1.2.1 Characterization of the bulk marrow sample (without bone)
T1 distributions were obtained from the saturation recovery measurements. They showed
a peak at 75 ms with a tail at longer relaxation times. The T2 distributions showed a T2
peak at 30 ms. Figure 5.4 shows the longitudinal and transverse relaxation times
distributions obtained. Measurements (data not reported) of the profile measurements on
this sample showed that the signal intensity was roughly constant within the marrow.
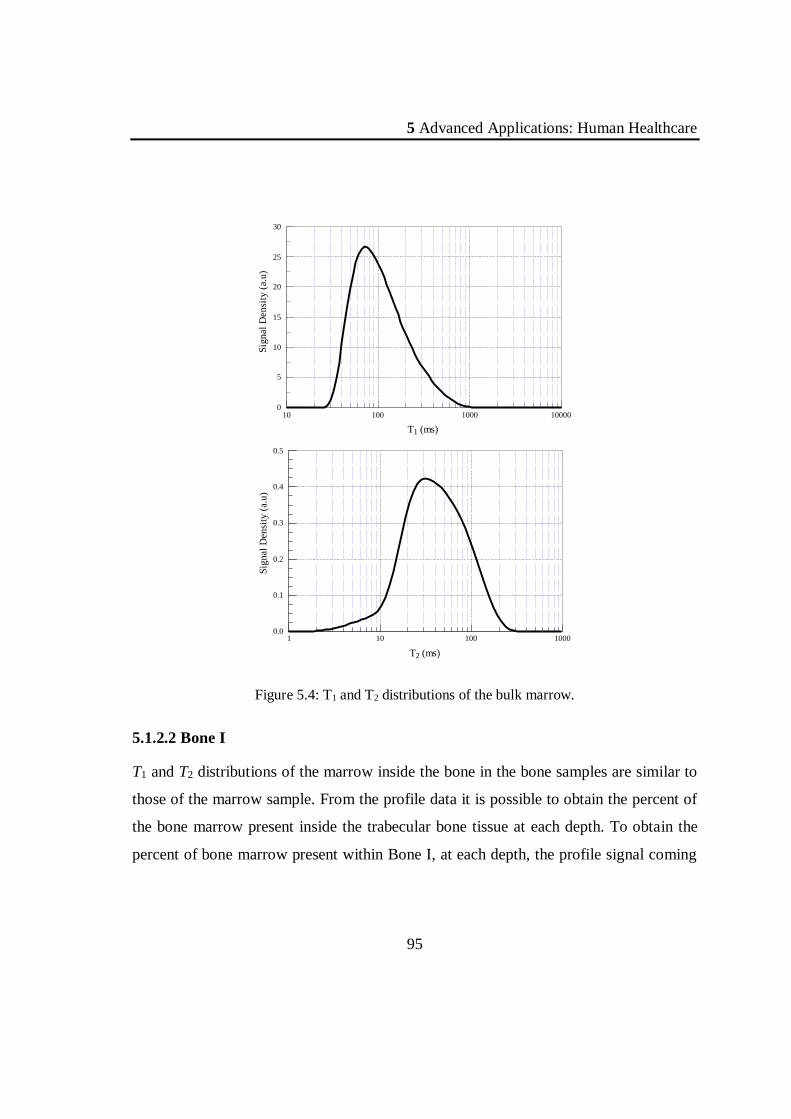
5 Advanced Applications: Human Healthcare
95
T1 (ms)
10 100 1000 10000
Sig
nal
Den
sity
(a.
u)
0
5
10
15
20
25
30
T2 (ms)
1 10 100 1000
Sig
nal
Den
sity
(a.
u)
0.0
0.1
0.2
0.3
0.4
0.5
Figure 5.4: T1 and T2 distributions of the bulk marrow.
5.1.2.2 Bone I
T1 and T2 distributions of the marrow inside the bone in the bone samples are similar to
those of the marrow sample. From the profile data it is possible to obtain the percent of
the bone marrow present inside the trabecular bone tissue at each depth. To obtain the
percent of bone marrow present within Bone I, at each depth, the profile signal coming
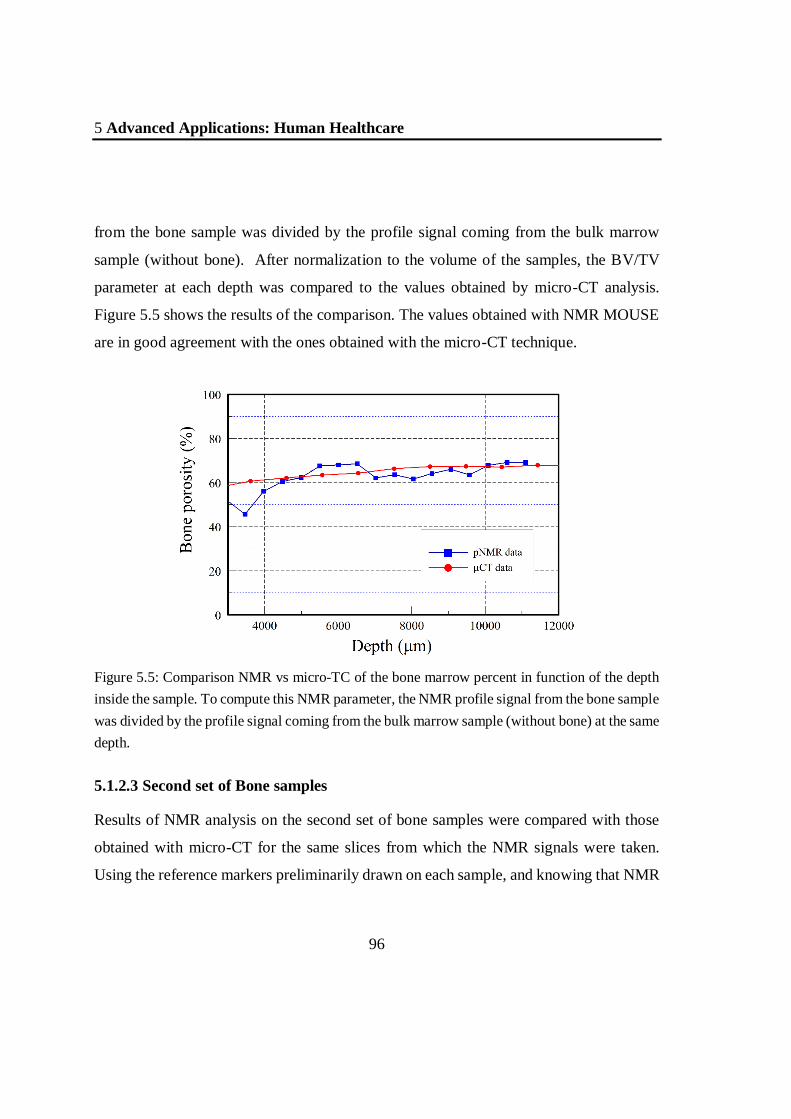
5 Advanced Applications: Human Healthcare
96
from the bone sample was divided by the profile signal coming from the bulk marrow
sample (without bone). After normalization to the volume of the samples, the BV/TV
parameter at each depth was compared to the values obtained by micro-CT analysis.
Figure 5.5 shows the results of the comparison. The values obtained with NMR MOUSE
are in good agreement with the ones obtained with the micro-CT technique.
Figure 5.5: Comparison NMR vs micro-TC of the bone marrow percent in function of the depth
inside the sample. To compute this NMR parameter, the NMR profile signal from the bone sample
was divided by the profile signal coming from the bulk marrow sample (without bone) at the same
depth.
5.1.2.3 Second set of Bone samples
Results of NMR analysis on the second set of bone samples were compared with those
obtained with micro-CT for the same slices from which the NMR signals were taken.
Using the reference markers preliminarily drawn on each sample, and knowing that NMR

5 Advanced Applications: Human Healthcare
97
signal is obtained from a 100 μm thick slice placed at the depth of 5400 μm inside the
sample, for each sample it was possible to perform a micro-CT analysis roughly over the
same four slices analyzed with the NMR MOUSE. The micro-CT images of one analyzed
slice for three samples are reported in Figure 5.6 as example.
Figure 5.6: Micro-CT image of: a) Condilo IB; b) Condilo IIB; c) Testa IIA;
It is important to remark that growth cartilage is present in some samples. In micro-CT
analysis these two tissues can be distinguished, and in principle it is possible to assess the
micro-architectural structure of the bone alone and of the cartilage alone, by the selection
of a different threshold value for the signal. In NMR analysis, this differentiation cannot
be made. The signal comes from the 1H nuclei present both in the inter-trabecular spaces
of the bone tissue and inside the growth cartilage. Figure 5.7 shows the NMR signal
obtained for the six samples. Table 5.1 shows the comparison of the values of BV/TV
determined on the same samples by NMR and by micro-CT, along with the cartilage
content (%) as determined by micro-CT.
The comparison shows how in four sample (Condilo IB, Condilo IIB, SC I SX and SC II
SX) the difference between the bone volume fraction measured by NMR and by micro-
CT is ≤ 4%. On the contrary, for Testa IIA and Testa IIB the spread increases up to 10%.
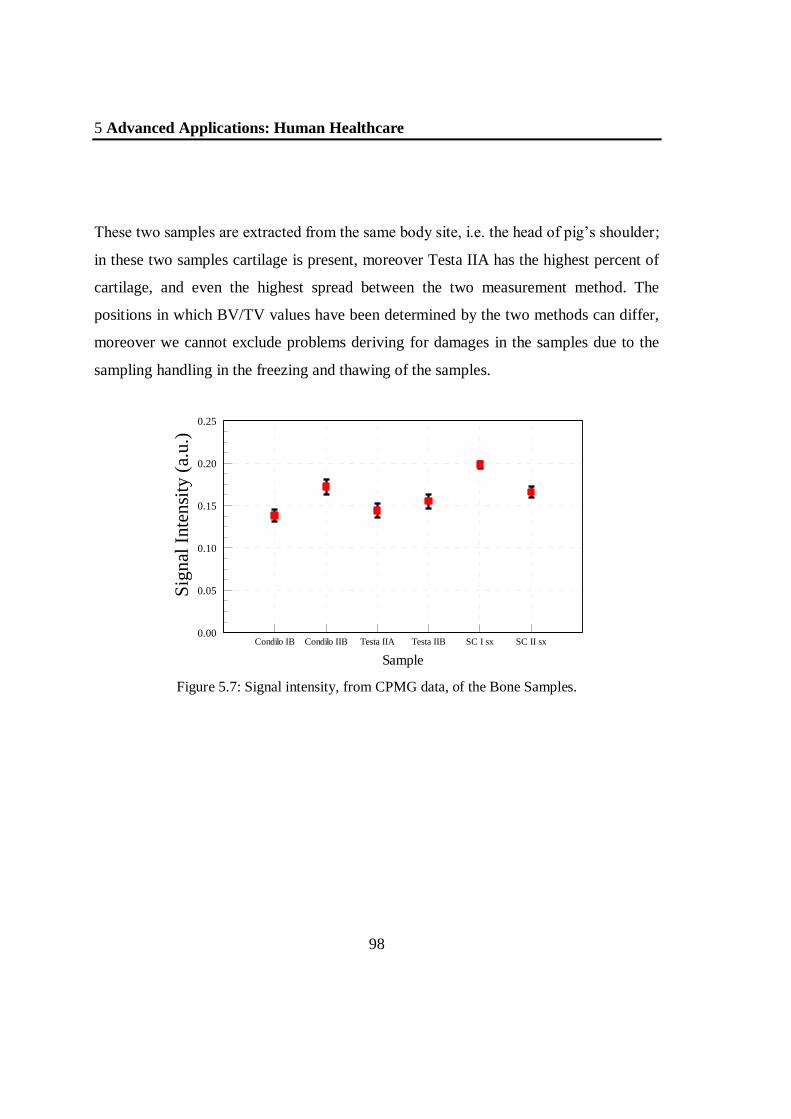
5 Advanced Applications: Human Healthcare
98
These two samples are extracted from the same body site, i.e. the head of pig’s shoulder;
in these two samples cartilage is present, moreover Testa IIA has the highest percent of
cartilage, and even the highest spread between the two measurement method. The
positions in which BV/TV values have been determined by the two methods can differ,
moreover we cannot exclude problems deriving for damages in the samples due to the
sampling handling in the freezing and thawing of the samples.
Sample
Condilo IB Condilo IIB Testa IIA Testa IIB SC I sx SC II sx
Sig
nal
In
ten
sity
(a.
u.)
0.00
0.05
0.10
0.15
0.20
0.25
Figure 5.7: Signal intensity, from CPMG data, of the Bone Samples.
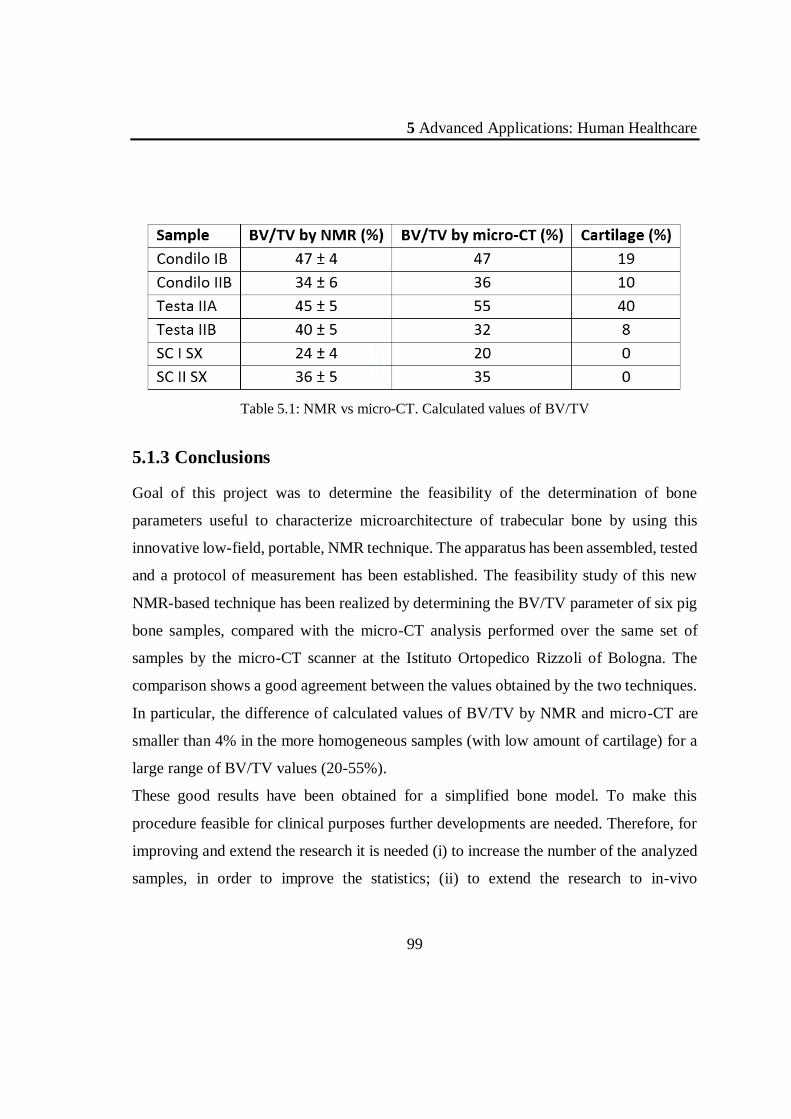
5 Advanced Applications: Human Healthcare
99
Table 5.1: NMR vs micro-CT. Calculated values of BV/TV
5.1.3 Conclusions
Goal of this project was to determine the feasibility of the determination of bone
parameters useful to characterize microarchitecture of trabecular bone by using this
innovative low-field, portable, NMR technique. The apparatus has been assembled, tested
and a protocol of measurement has been established. The feasibility study of this new
NMR-based technique has been realized by determining the BV/TV parameter of six pig
bone samples, compared with the micro-CT analysis performed over the same set of
samples by the micro-CT scanner at the Istituto Ortopedico Rizzoli of Bologna. The
comparison shows a good agreement between the values obtained by the two techniques.
In particular, the difference of calculated values of BV/TV by NMR and micro-CT are
smaller than 4% in the more homogeneous samples (with low amount of cartilage) for a
large range of BV/TV values (20-55%).
These good results have been obtained for a simplified bone model. To make this
procedure feasible for clinical purposes further developments are needed. Therefore, for
improving and extend the research it is needed (i) to increase the number of the analyzed
samples, in order to improve the statistics; (ii) to extend the research to in-vivo
5 Advanced Applications: Human Healthcare
100
experiments, in order to characterize the signal from tissues different from the trabecular
bone tissue, but present in fingers; (iii) to evaluate the possibility to deepen the
investigation of the micro-architectural structure of the trabecular bone using relaxation
times distributions and 2D NMR relaxometry approaches.
The obtained results demonstrate the feasibility of the method, opening a new way for the
diagnosis of osteoporosis, with an apparatus that does not use ionizing radiations, is low-
cost and is portable. This last characteristic makes the method eligible for screening of
the population at risk of osteoporosis.
5.2 Cellular compartmentalization
Over the years, water compartments, intra-extra cellular water exchange and membrane
permeability have been extensively studied in a wide class of tissues and cells with 1H-
NMR relaxometry. The measured values for the mean residence times of water in cells
depend on measurement conditions and system analyzed. Reported values are 9.8-14 ms
for normal human erythrocytes in the range 20-25°C; 40 ms at 37°C for isolated rodent
hepatocytes; about 50 ms for F98 glioma cells; in the range 350 ms-1.0 s (from 32°C to
5.0°C) for fresh baker’s yeast.
A recent interest for the studies of cellular compartmentalization and water exchange by
NMR relaxometry is due to the introduction of paramagnetic contrast agents and magnetic
liposomes and nanoparticles, used also in theranostics, to improve the contrast in MRI.
These contrast agents change the relaxivity of protons of internal and external water, so
that the changed values of the relaxation times improve the contrast in the images. Many
of the studies on the effects of contrast agents in cells do not take into account possible

5 Advanced Applications: Human Healthcare
101
changes in intra-extracellular water exchange over the time after the contrast agent
injection.
In this study, the changes of the quasi-continuous distributions of water 1H relaxation
times have been analyzed and compared with parallel analysis of phase contrast optical
microscopy observations on populations of T98G cells kept up to 400 hours under stress
conditions.
5.2.1 Materials and methods
Measurements were performed on glioblastoma multiform cells (T98G), derived from a
human tumor. Control measurements were performed on the supplemented culture
medium and on a sample of cells pellet insulted by a rotating blade. Details about samples
preparations for NMR and phase contrast optical microscopy are available on the quoted
article.
NMR measurements were performed with an in-house relaxometer based on a C60 H-L
Jeol electromagnet providing a B0=0.473 T static magnetic field, corresponding to a
Larmor frequency ~20.15 MHz for the 1H nuclei, equipped with a PC-NMR portable
console (Stelar s.r.l., Mede, Pavia, Italy). Measurements for T1 were performed with an
Aperiodic-Pulse-Sequence Saturation Recovery ({[π/2 + (π/2)/10)]x10 - ti - π/2 – FID
acquisition}), the comb of ten [π/2 + (π/2)/10] are used to better kill the signal in the static
magnetic field direction. The π/2 length was 4.1 µs; 64 ti values were chosen in the range
5 ms – 12 s, logarithmically increasing, to have the same sensitivity in the wide range (up
to 4 decades) of relaxation times expected for this kind of samples. Transverse relaxation
curves were acquired by a CPMG sequence (TR=12 s, TE=200s) covering the entire
relaxation curve. TE was chosen as short as possible (compatibly with the instrumentation
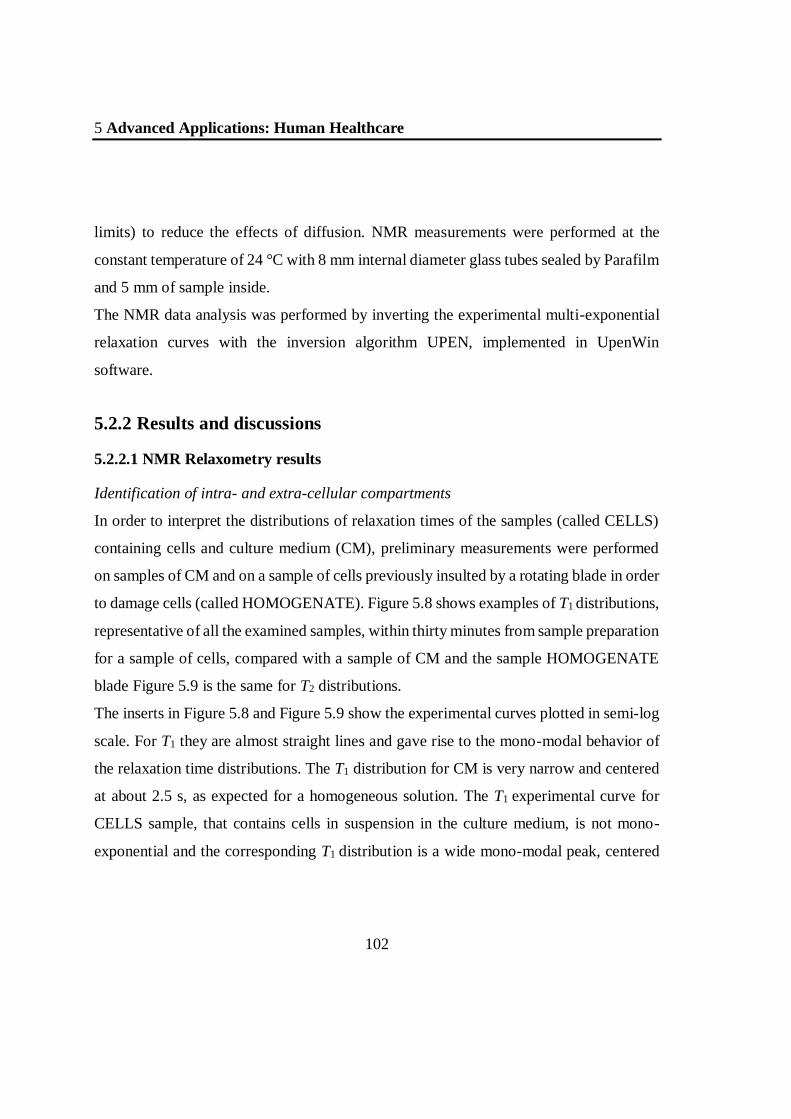
5 Advanced Applications: Human Healthcare
102
limits) to reduce the effects of diffusion. NMR measurements were performed at the
constant temperature of 24 °C with 8 mm internal diameter glass tubes sealed by Parafilm
and 5 mm of sample inside.
The NMR data analysis was performed by inverting the experimental multi-exponential
relaxation curves with the inversion algorithm UPEN, implemented in UpenWin
software.
5.2.2 Results and discussions
5.2.2.1 NMR Relaxometry results
Identification of intra- and extra-cellular compartments
In order to interpret the distributions of relaxation times of the samples (called CELLS)
containing cells and culture medium (CM), preliminary measurements were performed
on samples of CM and on a sample of cells previously insulted by a rotating blade in order
to damage cells (called HOMOGENATE). Figure 5.8 shows examples of T1 distributions,
representative of all the examined samples, within thirty minutes from sample preparation
for a sample of cells, compared with a sample of CM and the sample HOMOGENATE
blade Figure 5.9 is the same for T2 distributions.
The inserts in Figure 5.8 and Figure 5.9 show the experimental curves plotted in semi-log
scale. For T1 they are almost straight lines and gave rise to the mono-modal behavior of
the relaxation time distributions. The T1 distribution for CM is very narrow and centered
at about 2.5 s, as expected for a homogeneous solution. The T1 experimental curve for
CELLS sample, that contains cells in suspension in the culture medium, is not mono-
exponential and the corresponding T1 distribution is a wide mono-modal peak, centered

5 Advanced Applications: Human Healthcare
103
at a shorter time (about 1.5 s). The T1 distribution of the HOMOGENATE is similar to
that of CM, with a wider.
Figure 5.8: Examples of T1 distributions of the 1H-NMR signal from CM (red, dashed line),
CELLS (blue, solid line) and HOMOGENATE (green, dotted line) after ILT of the correspondent
relaxation curves shown in the insert. Data were taken within thirty minutes from sample
preparation. Results are representative of all the analyzed samples.

5 Advanced Applications: Human Healthcare
104
Figure 5.9: Examples of T2 relaxation time distributions of the same samples of Fig. 5.8, CM (red,
dashed line), CELLS (blue, solid line) and HOMOGENATE (green, dotted line) after ILT of the
correspondent relaxation curves shown in the inset. Data were taken within thirty minutes from
sample preparation. Results are representative of all the analyzed samples.
Figure 5.9 shows the results of the same analysis performed for T2 of the same samples
of Figure 5.8. The experimental relaxation curve for CELLS is clearly multi-exponential
and the inversion determines a distribution characterized by two peaks, one centered at
about 250 ms, and a second at longer T2 (2 s), at about the same position of the main
peak of CM.
On the basis of the results on all the three kind of samples, the component at about 250
ms in CELL has been assigned to 1H nuclei of water confined inside the cells. The small
feature at about the same value in the HOMOGENATE is likely due to a small amount
of cells not disrupted or fragments of them. Therefore, the first peak (P1) has been
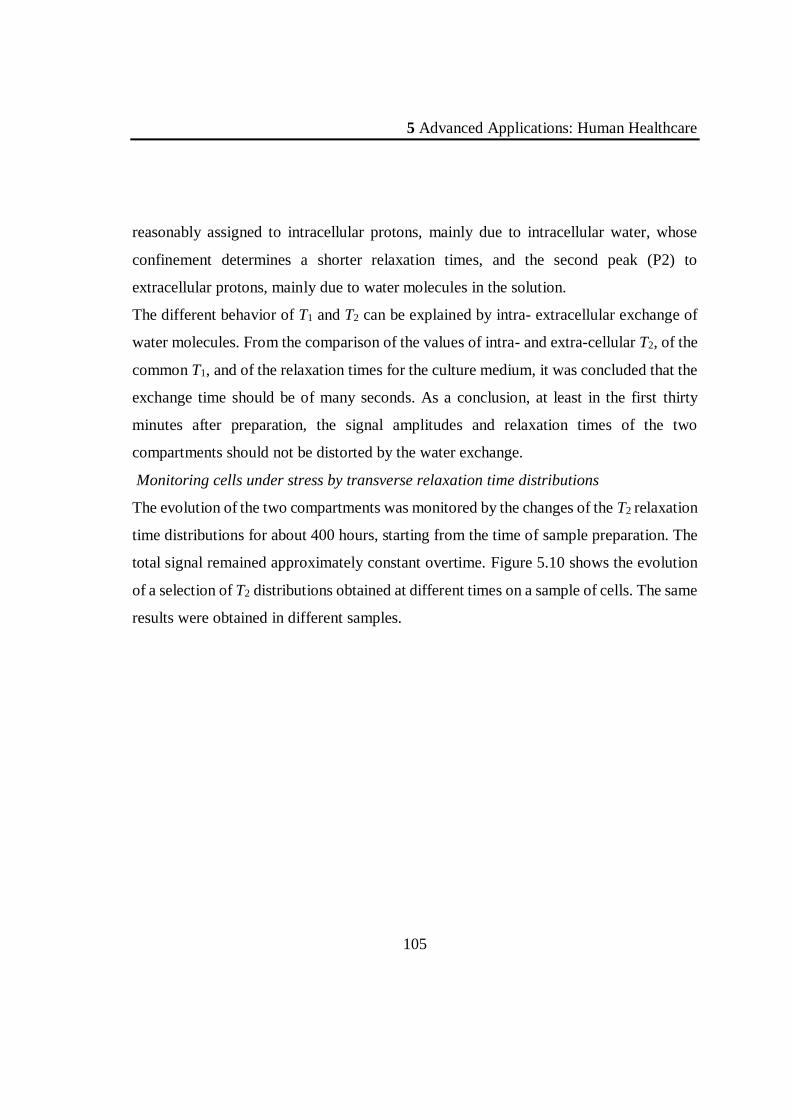
5 Advanced Applications: Human Healthcare
105
reasonably assigned to intracellular protons, mainly due to intracellular water, whose
confinement determines a shorter relaxation times, and the second peak (P2) to
extracellular protons, mainly due to water molecules in the solution.
The different behavior of T1 and T2 can be explained by intra- extracellular exchange of
water molecules. From the comparison of the values of intra- and extra-cellular T2, of the
common T1, and of the relaxation times for the culture medium, it was concluded that the
exchange time should be of many seconds. As a conclusion, at least in the first thirty
minutes after preparation, the signal amplitudes and relaxation times of the two
compartments should not be distorted by the water exchange.
Monitoring cells under stress by transverse relaxation time distributions
The evolution of the two compartments was monitored by the changes of the T2 relaxation
time distributions for about 400 hours, starting from the time of sample preparation. The
total signal remained approximately constant overtime. Figure 5.10 shows the evolution
of a selection of T2 distributions obtained at different times on a sample of cells. The same
results were obtained in different samples.
5 Advanced Applications: Human Healthcare
106
Figure 5.10: A selection of T2 relaxation time distributions of the 1H-NMR signal from a sample
of cells in culture medium at different times after preparation of the sample. It’s clear the
progressive shift to shorter relaxation times of the distribution related to the compartment assigned
to extracellular water (peak at longer T2). The areas under the distributions are proportional to the
signal intensities, proportional to the number of 1H nuclei contributing to the signal. The total area
did not change over time.
From the analysis of relaxation times of the two peaks important features were
determined. (i) the progressive narrowing of the Full Width at Half Maximum of the peak
assigned to the intra-cellular compartment starting from the 40th hour, suggesting an
increase of the homogeneity of this compartment; (ii) the insensitiveness of the short-T2
component over time; (iii) the shift with time of the whole extracellular component

5 Advanced Applications: Human Healthcare
107
towards shorter times till merging with the values of the intracellular component after
about 200 hours.
From the analysis of the relative variations of the weights of the two compartments three
main time intervals (phases) can be determined: (i) during the first 40-50 hours there is a
monotonic increase (from 30% to 40%) of the number of extra-cellular protons at the
expenses of the confined ones, maybe due to the water released by the cells under stress
and/or dead; (ii) after this first period and until about 100 hours there is a decrease of the
weight of P2 down to 20%, during this period T2 of P2 decreases drastically, while P1
does not change; (iii) from the 100th hour the weights do not change any more, suggesting
that the system has reached a final equilibrium.
These results can be interpreted as a progressive cell membrane disruption because the
distinction between intra- and extra-cellular compartments is reduced. Moreover, data
suggest the formation of fragmented membranes in which the extracellular fluid can
remain snared.
5.2.2.2 Phase contrast optical microscopy results
Analysis of cell population treated with trypan blue for viability monitoring
By this technique it was observed that at the beginning most of the cells are still alive,
viable, and are characterized by a light reflection of the cell membrane, differently from
the non-viable cells. Then the number of viable cells starts to decrease. It was possible to
manually count the viable cells and, as expected, an exponential decay was observed.
From the fit to an exponential function from three different experiment, the population
half-life was determined and resulted 42 ± 5 h.
5 Advanced Applications: Human Healthcare
108
5.2.3 Conclusions
The combination of the results obtained by NMR relaxometry and optical observations is
depicted in Fig. 5.11.
Figure 5.11: Scheme of the comparison of NMR results and optical microscopy observations.
By combining 1H-NMR and optical microscopy it was concluded that the processes
related to water exchanges and remodeling of cellular compartments when cells are
subjected to stress can be divided into three main phases. In the first phase (up to 40-50h)
corresponding to the cell population half-life, as quantified by the optical microscopy,
NMR analysis shows that the weight of the NMR peak P1 decrease significantly.
Microscopy cannot detect this decrease, which might be due to a progressive modification
of cell membranes, with release of intra-cellular water likely through larger membrane
pores, but maintaining their integrity. In the second phase, up to 100 h, the number of

5 Advanced Applications: Human Healthcare
109
cells with damaged membrane becomes larger than the number of undamaged ones with
a progressive formation of water bubbles inside cells as observed by optical morphology
analysis (images not reported). The trend of the P1 component is inverted. Probably, while
the cell membrane integrity is reduced, the extra-cellular water enters by passive
processes and release parts of cell membrane and organelles into extra-cellular space.
These fragments could create a confinement for the extra-cellular fluid, causing the
observed increase of P1 component and the shortening of the transverse relaxation time
of the P2 component. After 100 h, most of cells are non-viable. The merging of the two
NMR peaks and the constancy of the weights of P1 and P2 indicate that the system has
reached a final equilibrium.
In conclusion, the comparison of 1H-NMR relaxometry and optical microscopy
observations showed good agreement, and validate the use of NMR as a non-destructive,
non-invasive technique useful for monitoring modifications of membrane permeability
by identifying compartments, following their remodeling and detecting water exchange
between them.

6 Conclusions
110
6 CONCLUSIONS
In this thesis, time-domain and spatially resolved NMR techniques have been applied to
study porous systems of different nature and origin, containing hydrogenous fluids. The
unifying principle of this work is showing how the NMR analyses performed with these
techniques can be extended to a multiplicity of porous material and how these methods
are able to investigate the structure of the pore space and other features in a non-
destructive manner, on the intact sample, from the macroscopic scale to the nanometric
one. The results of this thesis demonstrates that the same experimental NMR procedures
can be successfully applied to perform researches in current important topics that deal
with Environment Sustainability and Human Healthcare.
During my doctorate, I exploited for new and advanced applications the expertise
developed on porous media by the Bologna NMR research group, about one-dimensional
NMR relaxometry and imaging. The most important contributions I have added to the
competences of the research group are in the fields of the NMR diffusometry and two-
dimensional NMR techniques. I set up new hardware to automatize experiments with the
single-sided device, implemented the most recent 2D pulse sequences and supported
experimentally the development of a data analysis algorithm for 2D Laplace inversion,
based on the 1D ILT UPEN.

6 Conclusions
111
A general theoretical framework for the experiments in the field of NMR for fluids in
porous media was described at the beginning of this thesis. Relaxation and diffusion
processes have been shown to be fundamental phenomena for investigating the structure
in terms of pore-size distribution and connectivity of the medium confining fluids. One-
dimensional and two-dimensional NMR methods were discussed and their applicability
through radiofrequency pulse sequences was tested and then validated.
Relaxometry was applied to the study of coral skeleton modifications due to Ocean
Acidification. Skeletal porosity over length scales spanning from tens of nanometers to
tens of micrometers was evaluated, giving precious information about the capability of
coral to acclimate under adverse conditions (low pH). The results of this study have
demonstrated that the almost universally employed measure of coral biomineralization,
namely the rate of linear extension, is not a reliable metric for the evaluation of coral
health and resilience in a warming and acidifying ocean.
Another application of NMR relaxometry was about the study of water
compartmentalization for monitoring viability and morphology changes of cell
populations kept under stress conditions. The main result showed that under the
experimental conditions considered, three main phases characterize the processes relative
to water exchange and remodeling of cellular compartments under stress.
Parallel experiments performed by MRI and NMR single-sided techniques were executed
in order to test the efficiency of protectives and consolidants applied for preserving and
restore, from the damage caused by atmospheric agents, carbonate building materials of
interest to Cultural Heritage. The study confirmed that quantitative MRI and NMR
profiles are excellent tools for evaluating the performance of protective compounds.
Indeed, traditional methods cannot give information on the spatial distribution of the
6 Conclusions
112
protective product on the surface of the internal pore space. They allow to formulate
hypotheses that only spatially-resolved NMR can validate. Images and single-sided
profiles give localized information about the distribution of the products, as in the case of
the accumulation of the fluoroelastomer at the treated surface, and the accumulation of
the new synthetized compound SC2-PFPEsol at the untreated face of the sample. This
information is of extreme interest to better know the behavior of the products at the
interface air-pore surface, in order to improve both the choice of the product and the
treatment procedure.
The same approach was adopted to study the performance of consolidant compounds and
results have indicated that treatments showed appropriate characteristics for the use as
consolidative agents for the limestone material. All the analyzed compounds presented a
good capacity to penetrate into the porous medium and they were distributed uniformly
inside the stone. NMR relaxometry performed on these samples under controlled RH
conditions showed that most common products, ESTEL 1000 and Nano-Silica, absorbed
considerable amount of water vapor respect to the untreated sample, due to their
hydrophilic nature. The new synthetized compound, a mix of a dispersion of nano-silica
particles and a fluoroelastomer, was an attempt to reduce this hydrophilic behavior and
revealed encouraging results.
In the course of the study on protective and consolidative compounds, new experimental
approaches were developed, with particular attention to the analysis of the apparent
diffusion coefficient and the 2D analyses. By the study of the decrease of the apparent
diffusion coefficient in samples treated with protective agents as the diffusion time was
increased, the reduction of the average pore size could be quantified. Two-dimensional
NMR techniques were exploited for investigating the connectivity behavior of the stone
6 Conclusions
113
matrix due to the application of consolidative treatments. T2-T2 maps confirmed that
consolidated samples showed an exchange behavior similar to the not treated one. This
was an important result, because it demonstrated that the treatments did not occlude the
pore. The conservation of the connectivity is one of the most important characteristic of
a compound to be used as a consolidant for Cultural Heritage purposes.
Another porous medium studied was the bone tissue. NMR profile techniques were
applied to detect locally the signal inside a bone, to determine the ratio Bone
Volume/Total Volume (BV/TV), an important parameter for osteoporosis diagnosis. By
single-sided analysis, the BV/TV parameter was determined for six pig bone samples and
it was compared with the results of micro-CT analysis. The comparison showed a good
agreement between the values obtained by the two different techniques, validating the
applicability of this innovative procedure for the diagnosis of the osteoporosis.
The results presented in this thesis demonstrate that time-domain and spatially resolved
NMR techniques are excellent tools for investigating the structure of porous materials
and the behavior of fluids inside.
Magnetic Resonance for fluids in Porous Media is now a well-established discipline.
Even it is not in the mainstream of NMR, its importance is more and more evident, not
only for the porous media community, but also for the theoretical and experimental
developments that it allows in many different fields. The porous media can be considered
as useful models to mimic other systems, not necessarily porous. As a matter of fact, this
thesis is as an example of the plenty of information that can be obtained in different
systems by experimental setups able to exploit physical phenomena like relaxation,
diffusion and their combination. The same theoretical approaches and the same
techniques can be applied, for example, to study nerves and muscles.

6 Conclusions
114
Objects of this thesis are systems important for the environmental sustainability and the
human health care. The same NMR techniques can be applied to all these system, even if
they are so different and belong to so different fields. The unifying principle is given by
the fact that in all these systems there are 1H nuclei, that can be subjected to NMR
relaxation and to molecular diffusion. The relaxation can be influenced by the walls (solid
as in stone or bone, and non-solid, as in cells) and these wall restrict the diffusion. These
phenomena make Relaxometry, Diffusometry, Profiling, Imaging, and the 2D techniques
unique instruments to study these systems. Moreover, as demonstrated in this thesis, the
experiments are performed in a non-destructive way on the intact sample, and give
information on the multi-scale lengths of these systems.
7 References
115
7 REFERENCES
[1] P. Fantazzini, “Magnetic resonance for fluids in porous media at the University of
Bologna.,” Magn. Reson. Imaging, vol. 23, no. 2, pp. 125–31, Feb. 2005.
[2] P. Fantazzini, C. Garavaglia, and G. Guglielmi, “From porous media to trabecular
bone relaxation analysis: spatial variation of marrow 1H relaxation time
distributions detected in vitro by quasi-continuous distribution analysis,” Magn.
Reson. Imaging, vol. 19, no. 3–4, pp. 477–480, Apr. 2001.
[3] P. Fantazzini, R. Viola, S. M. Alnaimi, and J. H. Strange, “Combined MR-
Relaxation and MR-Cryoporometry in the study of bone microstructure,” Magn.
Reson. Imaging, vol. 19, no. 3–4, pp. 481–484, Apr. 2001.
[4] P. Fantazzini, F. Galassi, V. Bortolotti, R. J. S. Brown, and F. Vittur, “The search
for negative amplitude components in quasi-continuous distributions of relaxation
times: the example of 1 H magnetization exchange in articular cartilage and
hydrated collagen,” New J. Phys., vol. 13, no. 6, p. 065007, Jun. 2011.
[5] L. L. Latour, K. Svoboda, P. P. Mitra, and C. H. Sotak, “Time-Dependent
Diffusion of Water in a Biological Model System,” Proc. Natl. Acad. Sci. U. S. A.,
vol. 91, no. 4, pp. 1229–1233, 1994.
[6] M. Gombia, V. Bortolotti, R. J. S. Brown, M. Camaiti, and P. Fantazzini, “Models
of water imbibition in untreated and treated porous media validated by quantitative
magnetic resonance imaging,” J. Appl. Phys., vol. 103, no. 9, p. 094913, 2008.
[7] M. Brai, M. Camaiti, C. Casieri, F. De Luca, and P. Fantazzini, “Nuclear magnetic
resonance for cultural heritage.,” Magn. Reson. Imaging, vol. 25, no. 4, pp. 461–
5, May 2007.
[8] M. Camaiti, V. Bortolotti, and P. Fantazzini, “Stone porosity, wettability changes
and other features detected by MRI and NMR relaxometry: a more than 15-year
study.,” Magn. Reson. Chem., vol. 53, no. 1, pp. 34–47, Jan. 2015.
[9] H. C. Torrey, J. Korringa, D. O. Seevers, and J. Uebersfeld, “Magnetic spin
pumping in fluids contained in porous media,” Phys. Rev. Lett., vol. 3, no. 9, pp.
418–419, 1959.
7 References
116
[10] R. L. Kleinberg and M. A. Horsfield, “Transverse Relaxation Processes in Porous
Sedimentary Rock,” vol. 19, pp. 9–19, 1990.
[11] G. . Borgia, A. Brancolini, R. J. . Brown, P. Fantazzini, and G. Ragazzini, “Water-
air saturation changes in restricted geometries studied by proton relaxation,” Magn.
Reson. Imaging, vol. 12, no. 2, pp. 191–195, Jan. 1994.
[12] G. C. Borgia, R. J. S. Brown, and P. Fantazzini, “Nuclear magnetic resonance
relaxivity and surface-to-volume ratio in porous media with a wide distribution of
pore sizes,” J. Appl. Phys., vol. 79, no. 7, p. 3656, 1996.
[13] C. Casieri, F. De Luca, and P. Fantazzini, “Pore-size evaluation by single-sided
nuclear magnetic resonance measurements: Compensation of water self-diffusion
effect on transverse relaxation,” J. Appl. Phys., vol. 97, no. 4, p. 043901, 2005.
[14] G. C. Borgia, R. J. S. Brown, and P. Fantazzini, “Different ‘average’ nuclear
magnetic resonance relaxation times for correlation with fluid-flow permeability
and irreducible water saturation in water-saturated sandstones,” J. Appl. Phys., vol.
82, no. 9, p. 4197, 1997.
[15] P. Mitra, P. Sen, L. Schwartz, and Le Doussal P, “Diffusion propagator as a probe
of the structure of porous media.,” Phys. Rev. Lett., vol. 68, no. 24, pp. 3555–3558,
Jun. 1992.
[16] P. P. Mitra, P. N. Sen, and L. M. Schwartz, “Short-time behavior of the diffusion
coefficient as a geometrical probe of porous media,” Phys. Rev. B, vol. 47, no. 14,
pp. 8565–8574, 1993.
[17] P. N. Sen, “Time-dependent diffusion coefficient as a probe of geometry,”
Concepts Magn. Reson. Part A Bridg. Educ. Res., vol. 23, no. 1, pp. 1–21, 2004.
[18] T. M. de Swiet and P. N. Sen, “Time dependent diffusion coefficient in a
disordered medium,” J. Chem. Phys., vol. 104, no. 1, p. 206, 1996.
[19] Y.-Q. Song, L. Zielinski, and S. Ryu, “Two-Dimensional NMR of Diffusion
Systems,” Phys. Rev. Lett., vol. 100, no. 24, p. 248002, 2008.
[20] H. C. Torrey, “Bloch Equations with Diffusion Terms,” Phys. Rev., vol. 104, no.
3, pp. 563–565, Nov. 1956.
[21] Y.-Q. Song, L. Venkataramanan, M. D. Hürlimann, M. Flaum, P. Frulla, and C.
Straley, “T1–T2 Correlation Spectra Obtained Using a Fast Two-Dimensional
Laplace Inversion,” J. Magn. Reson., vol. 154, no. 2, pp. 261–268, 2002.
[22] A. N. Tikhonov and V. Y. Arsenin, “Solutions of ill-posed problems,” in Physical
Review, V. Winston, Ed. 1977.
[23] B. Blümich, P. Blümler, G. Eidmann, a. Guthausen, R. Haken, U. Schmitz, K.
Saito, and G. Zimmer, “The NMR-MOUSE: Construction, excitation, and

7 References
117
applications,” Magn. Reson. Imaging, vol. 16, no. 5–6, pp. 479–484, 1998.
[24] B. Blümich, J. Perlo, and F. Casanova, “Mobile single-sided NMR,” Prog. Nucl.
Magn. Reson. Spectrosc., vol. 52, no. 4, pp. 197–269, 2008.
[25] B. Blümich, F. Casanova, J. Perlo, F. Presciutti, C. Anselmi, and B. Doherty,
“Noninvasive testing of art and cultural heritage by mobile NMR.,” Acc. Chem.
Res., vol. 43, no. 6, pp. 761–70, Jun. 2010.
[26] J. Perlo, F. Casanova, and B. Blümich, “Profiles with microscopic resolution by
single-sided NMR,” J. Magn. Reson., vol. 176, no. 1, pp. 64–70, 2005.
[27] H. Carr and E. Purcell, “Effects of Diffusion on Free Precession in Nuclear
Magnetic Resonance Experiments,” Phys. Rev., vol. 94, no. 3, pp. 630–638, May
1954.
[28] S. Meiboom and D. Gill, “Modified Spin-Echo Method for Measuring Nuclear
Relaxation Times,” Rev. Sci. Instrum., vol. 29, no. 8, p. 688, 1958.
[29] J. E. Tanner, “Use of the Stimulated Echo in NMR Diffusion Studies,” J. Chem.
Phys., vol. 52, no. 5, p. 2523, 1970.
[30] L. J. Zielinski and M. D. Hürlimann, “Probing short length scales with restricted
diffusion in a static gradient using the CPMG sequence,” J. Magn. Reson., vol.
172, no. 1, pp. 161–167, 2005.
[31] K. E. Washburn and P. T. Callaghan, “Tracking pore to pore exchange using
relaxation exchange spectroscopy.,” Phys. Rev. Lett., vol. 97, no. 17, p. 175502,
Oct. 2006.
[32] M. Van Landeghem, A. Haber, J.-B. D’espinose De Lacaillerie, and B. Blümich,
“Analysis of multisite 2D relaxation exchange NMR,” Concepts Magn. Reson.
Part A, vol. 36A, no. 3, pp. 153–169, Jun. 2010.
[33] M. D. Hürlimann, “Diffusion and relaxation effects in general stray field NMR
experiments.,” J. Magn. Reson., vol. 148, no. 2, pp. 367–378, 2001.
[34] M. . Hürlimann and L. Venkataramanan, “Quantitative Measurement of Two-
Dimensional Distribution Functions of Diffusion and Relaxation in Grossly
Inhomogeneous Fields,” J. Magn. Reson., vol. 157, no. 1, pp. 31–42, 2002.
[35] M. F. Striegel, E. Bede Guin, K. Hallett, D. Sandoval, R. Swingle, K. Knox, F.
Best, and S. Fornea, “Air pollution, coatings, and cultural resources,” Prog. Org.
Coatings, vol. 48, no. 2–4, pp. 281–288, Dec. 2003.
[36] H. Cai and X. Liu, “Freeze-thaw durability of concrete: ice formation process in
pores,” Cem. Concr. Res., vol. 28, no. 9, pp. 1281–1287, Sep. 1998.
[37] L. A. Rijniers, L. Pel, H. P. Huinink, and K. Kopinga, “Salt crystallization as
damage mechanism in porous building materials--a nuclear magnetic resonance
7 References
118
study.,” Magn. Reson. Imaging, vol. 23, no. 2, pp. 273–6, Feb. 2005.
[38] S. J. Haneef, J. B. Johnson, C. Dickinson, G. E. Thompson, and G. C. Wood,
“Effect of dry deposition of NOx and SO2 gaseous pollutants on the degradation
of calcareous building stones,” Atmos. Environ. Part A. Gen. Top., vol. 26, no. 16,
pp. 2963–2974, Nov. 1992.
[39] G. C. Borgia, M. Camaiti, F. Cerri, P. Fantazzini, and F. Piacenti, “Hydrophobic
Treatments for Stone Conservation - Influence of the Application Method on
Penetration, Distribution and Efficiency,” Stud. Conserv., vol. 48, no. 4, pp. 217–
226, Dec. 2003.
[40] F. Piacenti, “Chemistry for the conservation of the cultural heritage,” Sci. Total
Environ., vol. 143, no. 1, pp. 113–120, Mar. 1994.
[41] L. Venkataramanan, Y. Q. Song, and M. D. Hürlimann, “Solving Fredholm
integrals of the first kind with tensor product structure in 2 and 2.5 dimensions,”
IEEE Trans. Signal Process., vol. 50, no. 5, pp. 1017–1026, 2002.
[42] “UNI-EN 15801-2010. Conservation of cultural property – Test methods.
Determination of water absorption by capillarity,” 2010.
[43] E. Casazza, A. Mariani, L. Ricco, and S. Russo, “Synthesis, characterization, and
properties of a novel acrylic terpolymer with pendant perfluoropolyether
segments,” Polymer (Guildf)., vol. 43, no. 4, pp. 1207–1214, Feb. 2002.
[44] D. R. Iyengar, S. M. Perutz, C.-A. Dai, C. K. Ober, and E. J. Kramer, “Surface
Segregation Studies of Fluorine-Containing Diblock Copolymers †,”
Macromolecules, vol. 29, no. 4, pp. 1229–1234, Jan. 1996.
[45] S. Siegesmund, T. Weiss, and A. Vollbrecht, Natural stone, weathering
phenomena, conservation strategies and case studies. Geological Society Special
Publications No. 205 2002. The Geological Society, London, ISBN 1-86239-123-
8.
[46] G. C. Borgia, R. J. Brown, and P. Fantazzini, “Uniform-penalty inversion of
multiexponential decay data.,” J. Magn. Reson., vol. 132, no. 1, pp. 65–77, May
1998.
[47] G. . Borgia, R. J. . Brown, and P. Fantazzini, “Uniform-Penalty Inversion of
Multiexponential Decay Data,” J. Magn. Reson., vol. 147, no. 2, pp. 273–285, Dec.
2000.
[48] V. Bortolotti, M. Camaiti, C. Casieri, F. De Luca, P. Fantazzini, and C. Terenzi,
“Water absorption kinetics in different wettability conditions studied at pore and
sample scales in porous media by NMR with portable single-sided and laboratory
imaging devices.,” J. Magn. Reson., vol. 181, no. 2, pp. 287–95, Aug. 2006.
7 References
119
[49] M. Camaiti, C. Casieri, F. De Luca, P. Fantazzini, and C. Terenzi, “The Use of
Portable Single-Sided Relaxometry and Laboratory Imaging NMR Devices in
Stone Conservation,” Stud. Conserv., Jul. 2013.
[50] E. Danieli and B. Blümich, “Single-sided magnetic resonance profiling in
biological and materials science,” J. Magn. Reson., vol. 229, pp. 142–154, 2013.
[51] G. C. Borgia, M. Camaiti, F. Cerri, P. Fantazzini, and F. Piacenti, “Study of water
penetration in rock materials by Nuclear Magnetic Resonance Tomography:
hydrophobic treatment effects,” J. Cult. Herit., vol. 1, no. 2, pp. 127–132, Jun.
2000.
[52] R. J. S. Brown and P. Fantazzini, “Conditions for initial quasilinear T 2 − 1 versus
τ for Carr-Purcell-Meiboom-Gill NMR with diffusion and susceptibility
differences in porous media and tissues,” Phys. Rev. B, vol. 47, no. 22, pp. 14823–
14834, Jun. 1993.
[53] G. C. Borgia, R. J. S. Brown, and P. Fantazzini, “Scaling of spin-echo amplitudes
with frequency, diffusion coefficient, pore size, and susceptibility difference for
the NMR of fluids in porous media and biological tissues,” Phys. Rev. E, vol. 51,
no. 3, pp. 2104–2114, Mar. 1995.
Further useful references about Subchapters 4.2 and 5.2 can be found in papers:
Subchapter 4.2:
1. Fantazzini P, Mengoli S, Evangelisti S, Pasquini L, Mariani M, Brizi L, et al. A
time-domain nuclear magnetic resonance study of mediterranean scleractinian
corals reveals skeletal-porosity sensitivity to environmental changes. Environ Sci
Technol. 2013;47(22):12679–86.
2. 1. Fantazzini P, Mengoli S, Pasquini L, Bortolotti V, Brizi L, Mariani M, et al.
Gains and losses of coral skeletal porosity changes with ocean acidification
acclimation. Nat Commun [Internet]. 2015;6:7785. Available from:
http://www.nature.com/doifinder/10.1038/ncomms8785
Subchapter 5.2:
1. Brizi L, Castellani G, Fantazzini P, Mariani M, Remondini D, Zironi I. Water
compartmentalization, cell viability and morphology changes monitored under
stress by 1H-NMR relaxometry and phase contrast optical microscopy. J Phys D
Appl Phys [Internet]. IOP Publishing; 2015;48(41):415401.

7 References
120
ACKNOWLEDGEMENTS
It is my pleasure to thank to whom have contributed to this work.
A special thanks to Prof. Paola Fantazzini for her constant support, guidance and
motivation throughout these years.
About specific collaborations, I thank to:
Cultural Heritage:
- Dr. Mara Camaiti for the contribution related to the preparation, synthesis
and application of treatments.
- Prof. Villiam Bortolotti for the assistance in the MRI measurements on
protective compounds.
- Dr. Sabina Haber-Pohlmeier for the support in NMR experiments on samples
treated with consolidants.
Climate Change:
All the coauthors of papers:
- Fantazzini P, Mengoli S, Evangelisti S, Pasquini L, Mariani M, Brizi L, et
al. A time-domain nuclear magnetic resonance study of Mediterranean
scleractinian corals reveals skeletal-porosity sensitivity to environmental
changes. Environ Sci Technol. 2013;47(22):12679–86.
- Fantazzini P, Mengoli S, Pasquini L, Bortolotti V, Brizi L, Mariani M, et al.
Gains and losses of coral skeletal porosity changes with ocean acidification
acclimation. Nat Commun. 2015;6:7785.
7 References
121
The research leading to these results has received funding from the European Research
Council under the European Union’s Seventh Framework Programme (FP7/2007–2013)/
ERC grant agreement n° 249930—CoralWarm: Corals and global warming: the
Mediterranean versus the Red Sea.
Bone tissue and Osteoporosis:
- Dr. F. Baruffaldi and Dr. C. Fersini for the supply of bone samples and
micro-CT analyses
- Marco Barbieri for the experimental work, as part of his master's thesis in
Physics under my supervision.
- The “Fondazione del Monte di Bologna e Ravenna” for the partial support
to this project, which made possible the acquisition of the NMR console
KEA II.
Cellular compartmentalization
- All the coauthors of the paper: Brizi L, Castellani G, Fantazzini P, Mariani
M, Remondini D, Zironi I. Water compartmentalization, cell viability and
morphology changes monitored under stress by 1 H-NMR relaxometry and
phase contrast optical microscopy. J Phys D Appl Phys.
- Nico Curti for the help with optical microscopy measurements.
- Robert James Sidford Brown for useful discussions.
Thanks to all my friends.
Last but not least, a huge thanks to my family!