Embed Size (px)
Citation preview
8/3/2019 Alluvium Translated
http://slidepdf.com/reader/full/alluvium-translated 1/44
PROALUV Alluvium Mapping in Northeast Brazil,1:100,000 scale, using satellite imagesLANDSAT 7 ETM + Sensor and SRTM
(Shuttle Radar Topographic Mission) productslike Slope
Author:
Carlos Eugênio da Silveira Arraes
Engenheiro de MinasRemote Sensing applied to Geology
8/3/2019 Alluvium Translated
http://slidepdf.com/reader/full/alluvium-translated 2/44
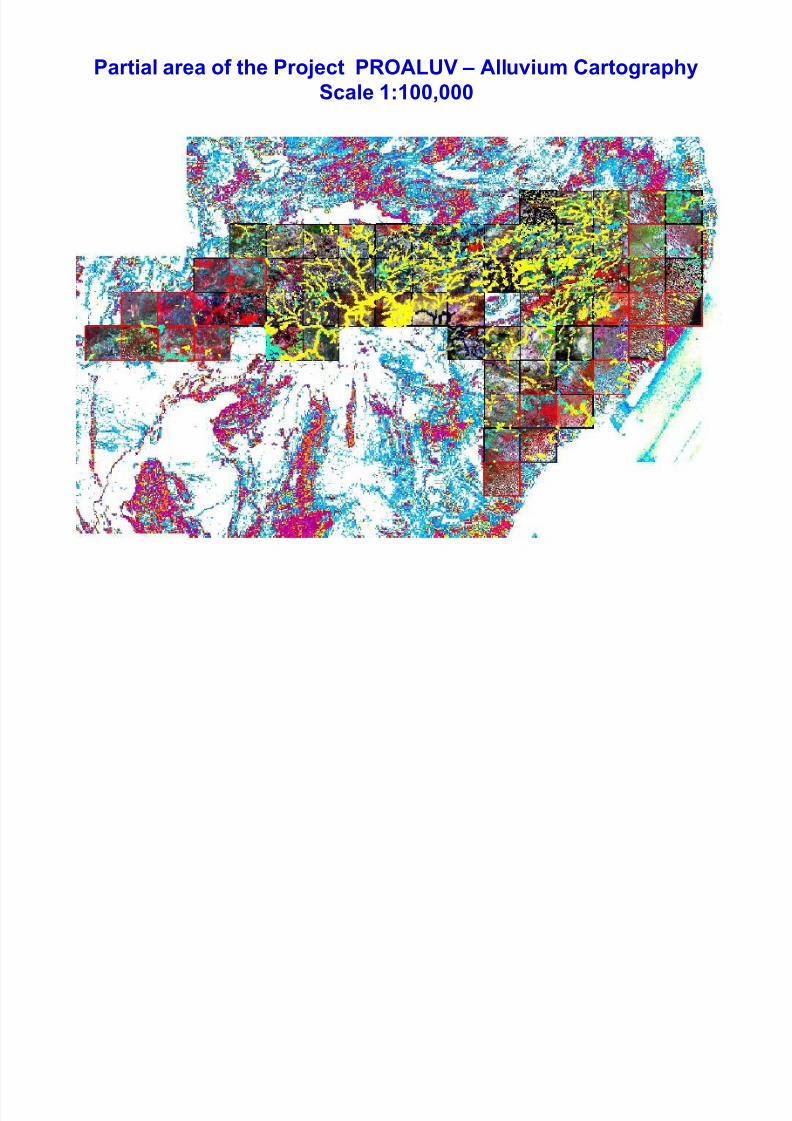
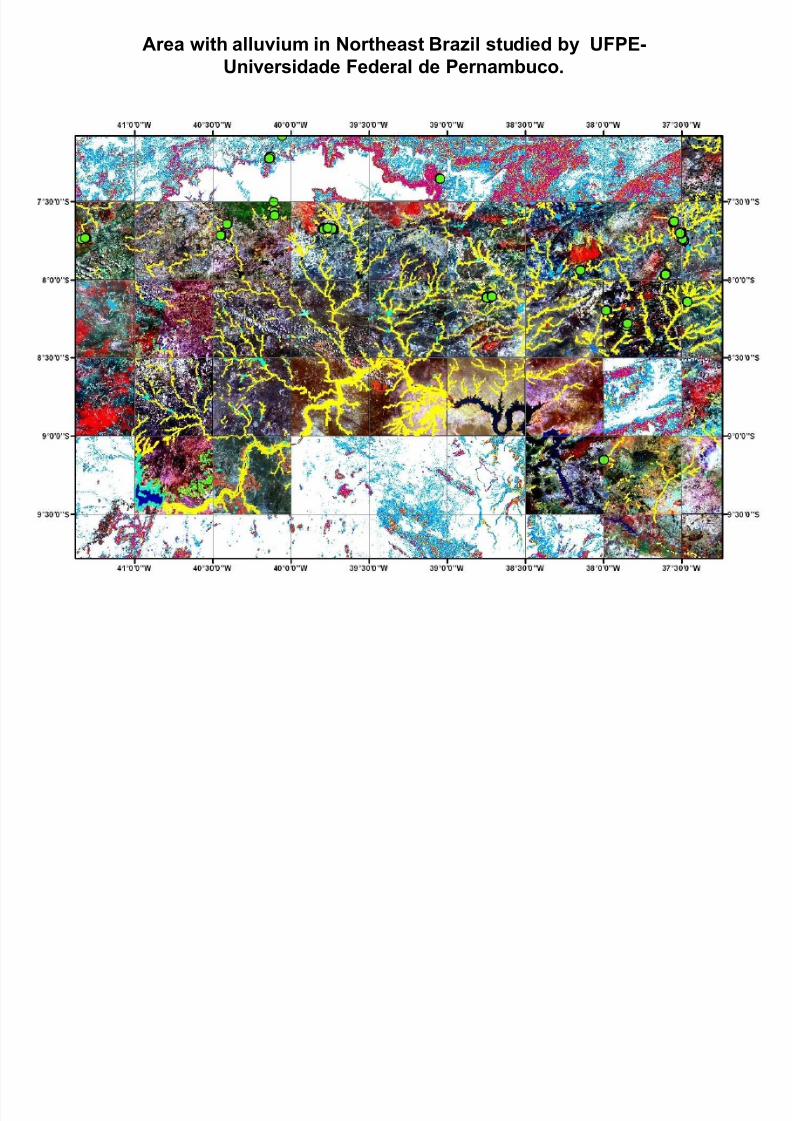
Partial area of the Project PROALUV ± Alluvium CartographyScale 1:100,000
8/3/2019 Alluvium Translated
http://slidepdf.com/reader/full/alluvium-translated 3/44
Identification of alluvium They occupy areas adjacent of the drainages with
slopes, evaluated in ArcGis, essentially less than 2degrees.
Are identified with the help of the spectral responseof healthy vegetation that occurs on the wet alluviumalong the drainages contrasting with thesurrounding more dry vegetation.
Alluvial sediments on riverbeds are different of theadjacent sediments, mainly, by a higher content of quartz derived by the river stream transport power
8/3/2019 Alluvium Translated
http://slidepdf.com/reader/full/alluvium-translated 4/44
8/3/2019 Alluvium Translated
http://slidepdf.com/reader/full/alluvium-translated 5/44
8/3/2019 Alluvium Translated
http://slidepdf.com/reader/full/alluvium-translated 6/44
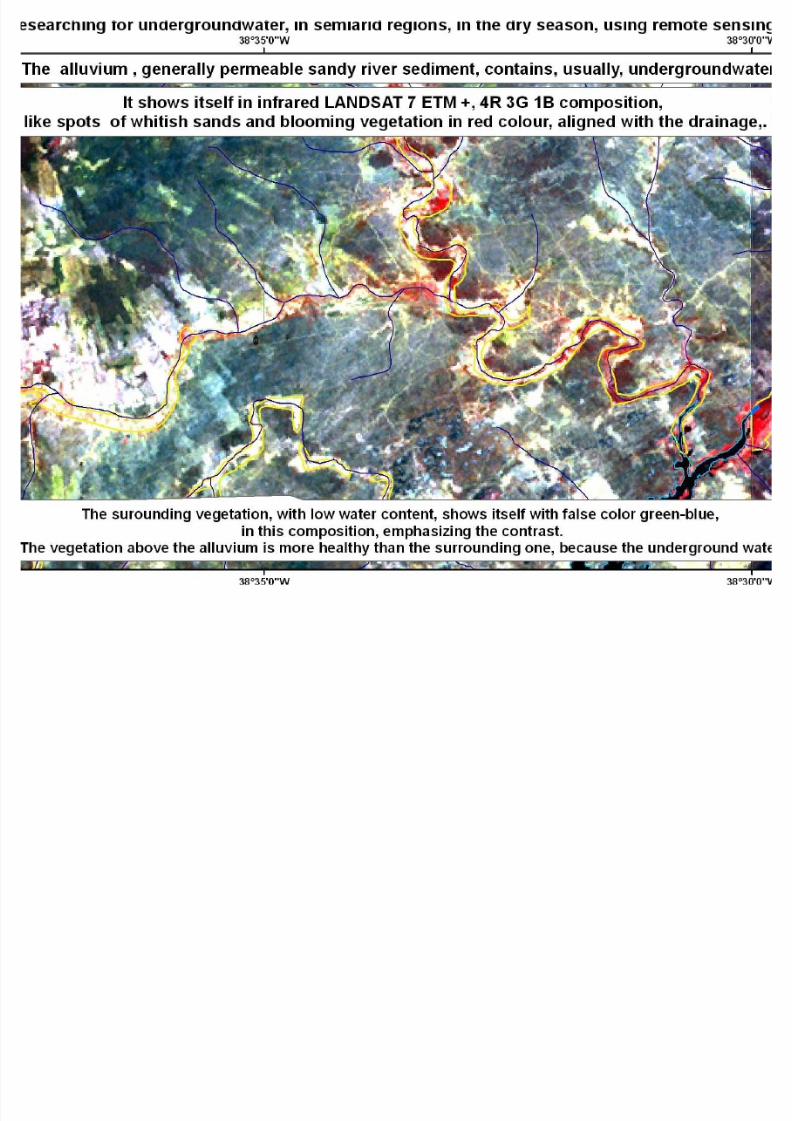
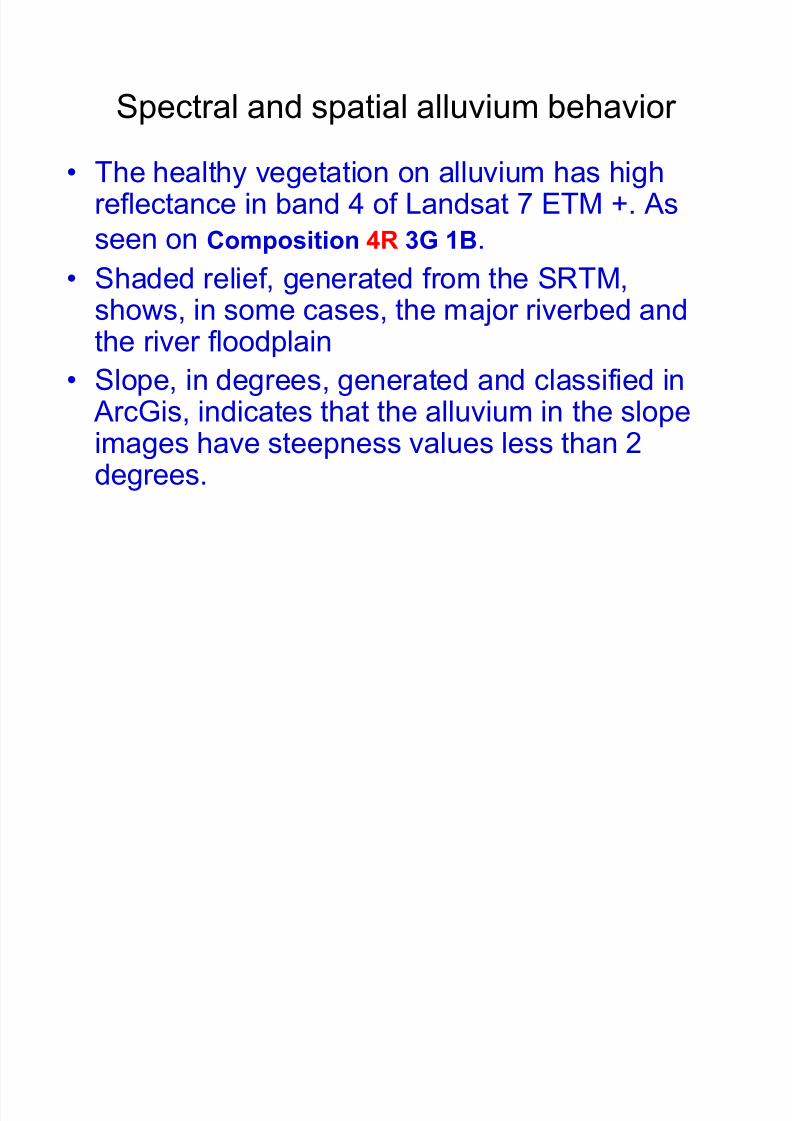
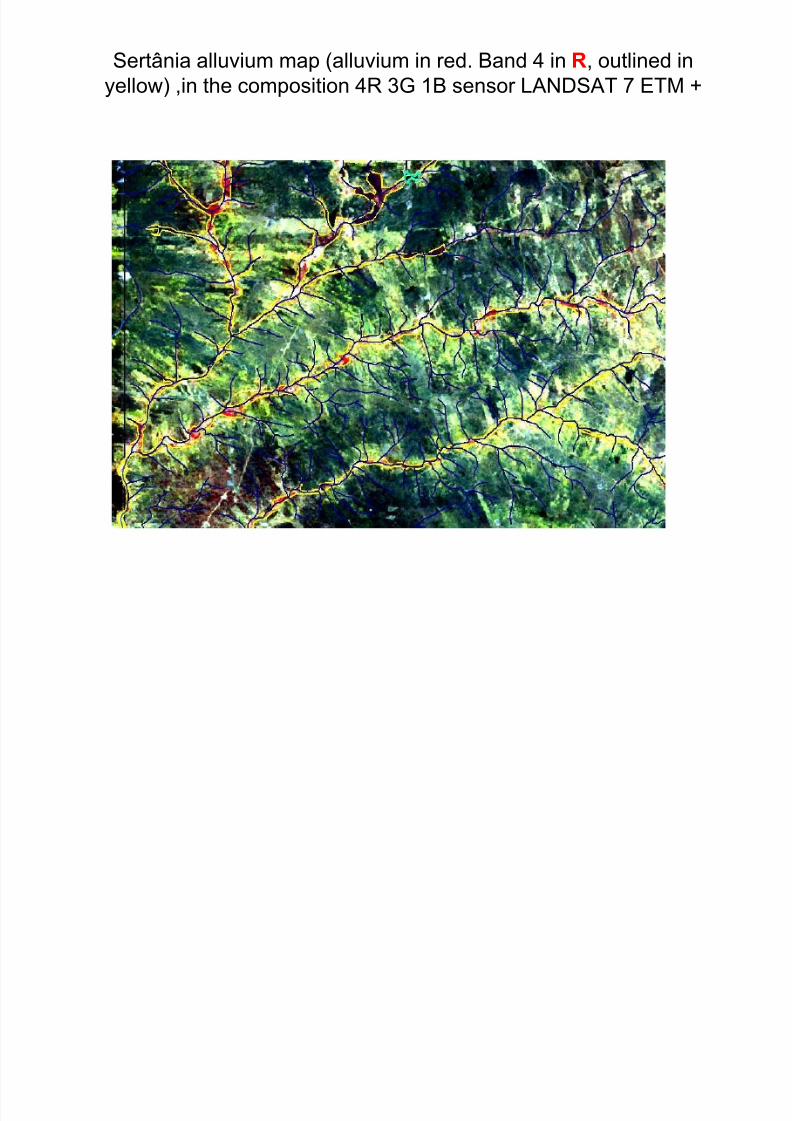
Spectral and spatial alluvium behavior
The healthy vegetation on alluvium has highreflectance in band 4 of Landsat 7 ETM +. As
seen on Composition 4R 3G 1B.
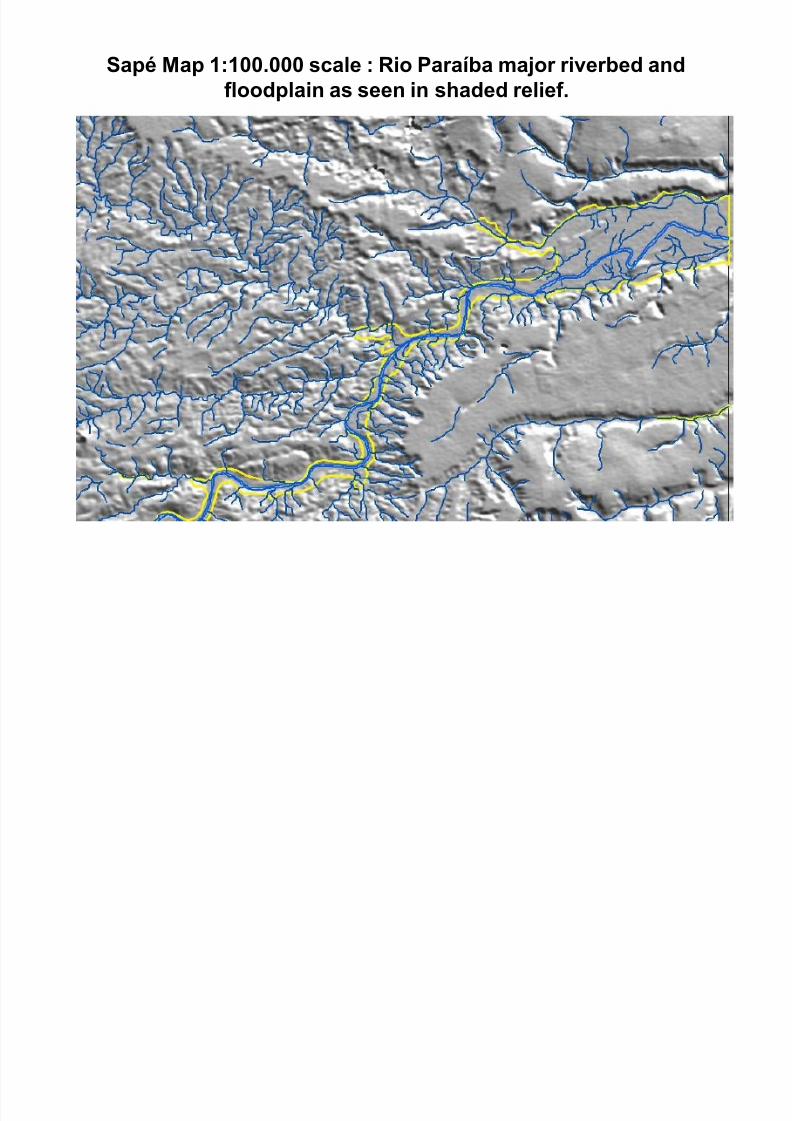
Shaded relief, generated from the SRTM,shows, in some cases, the major riverbed andthe river floodplain
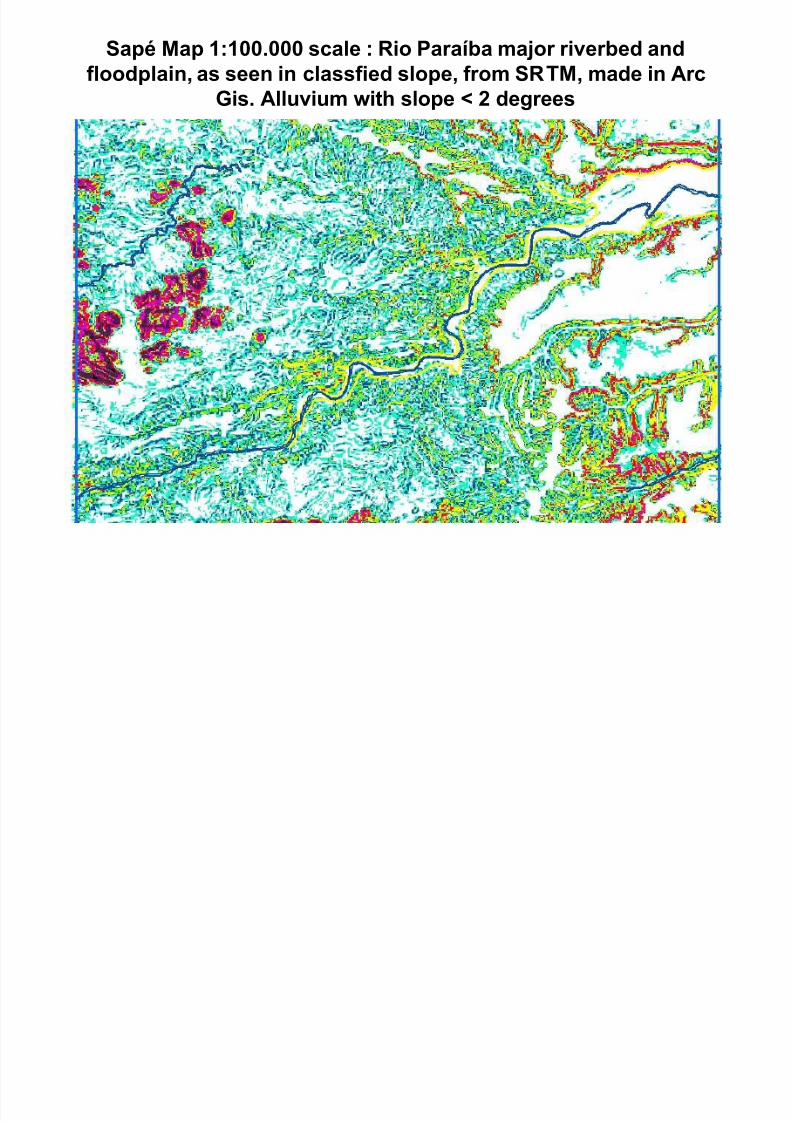
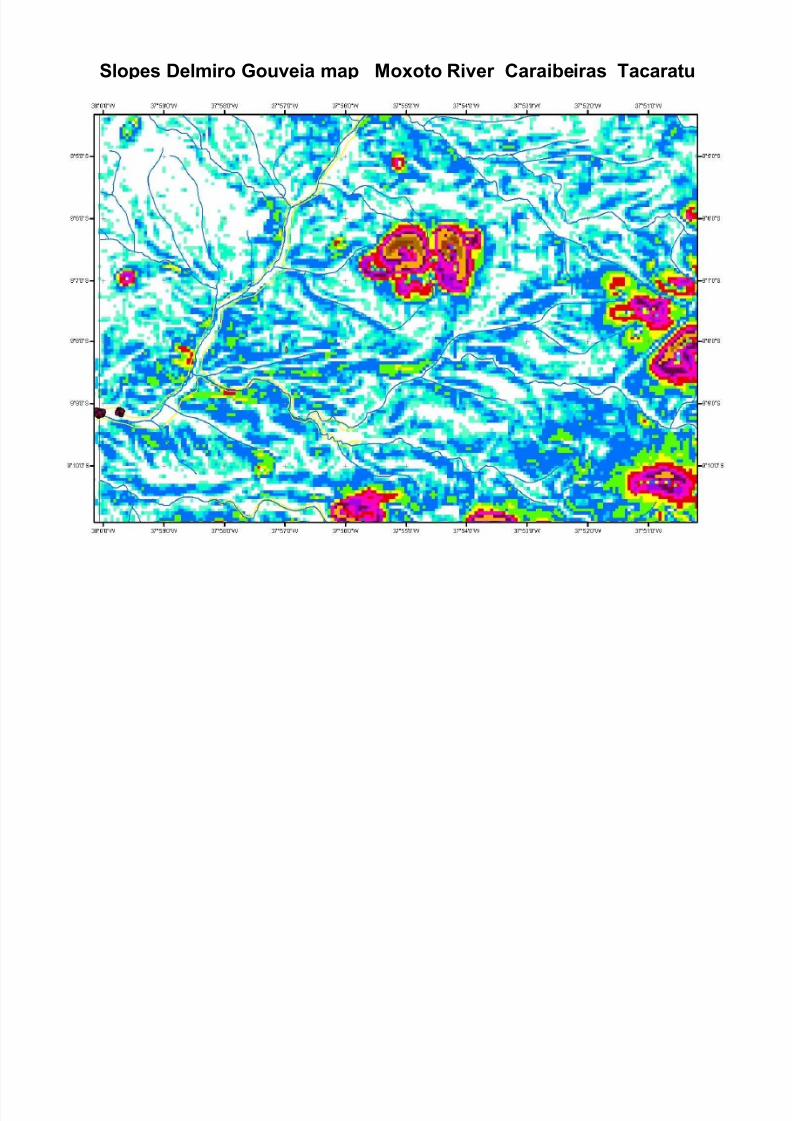
Slope, in degrees, generated and classified in
ArcGis, indicates that the alluvium in the slopeimages have steepness values less than 2degrees.
8/3/2019 Alluvium Translated
http://slidepdf.com/reader/full/alluvium-translated 7/44
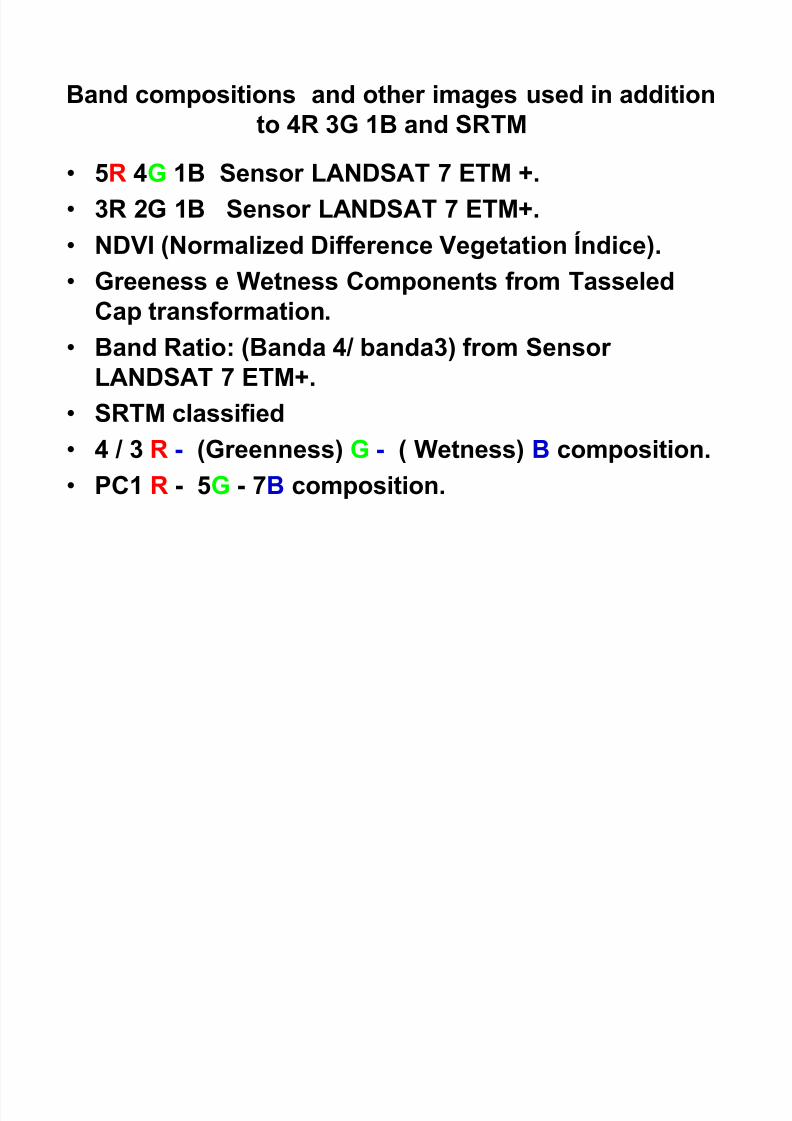
Band compositions and other images used in additionto 4R 3G 1B and SRTM
5R 4G 1B Sensor LANDSAT 7 ETM +.
3R 2G 1B Sensor LANDSAT 7 ETM+.
NDVI (Normalized Difference Vegetation Índice).
Greeness e Wetness Components from TasseledCap transformation.
Band Ratio: (Banda 4/ banda3) from Sensor LANDSAT 7 ETM+.
SRTM classified 4 / 3 R - (Greenness) G - ( Wetness) B composition.
PC1 R - 5G - 7B composition.
8/3/2019 Alluvium Translated
http://slidepdf.com/reader/full/alluvium-translated 8/44
LIMITATIONS OF METHODS AND MATERIALS
One must consider the limitations arising from the size of the pixels of images, composed by the bands of Landsat 7 ETM + (pixel:30m) and
by Slope image, generated from the SRTM (pixel 90m) in ARC GIS .The measured values obtained in the images, are not suitable for direct application calculations in the field.
Slope profiles generated in ARC GIS should be studied consideringthe spatial limitations of such pixels.
The widths of the alluvium to be studied, should exclude riversidevegetation stains, constituted by ocasional irrigated crops, in themargin with no alluvial sediments.
In addition to the restrictions of spatial resolution (pixels of 30m and90m) we must consider the restrictions of the spectral resolution of the materials. The bands of the Landsat 7 ETM + sensor , hardly
distinguish alluvial sands of devastated leucocratic outcrops on theriver floodplains levels.
The scale of 1:100,000 shows an indicative mapping of thesealluviuns.
8/3/2019 Alluvium Translated
http://slidepdf.com/reader/full/alluvium-translated 9/44
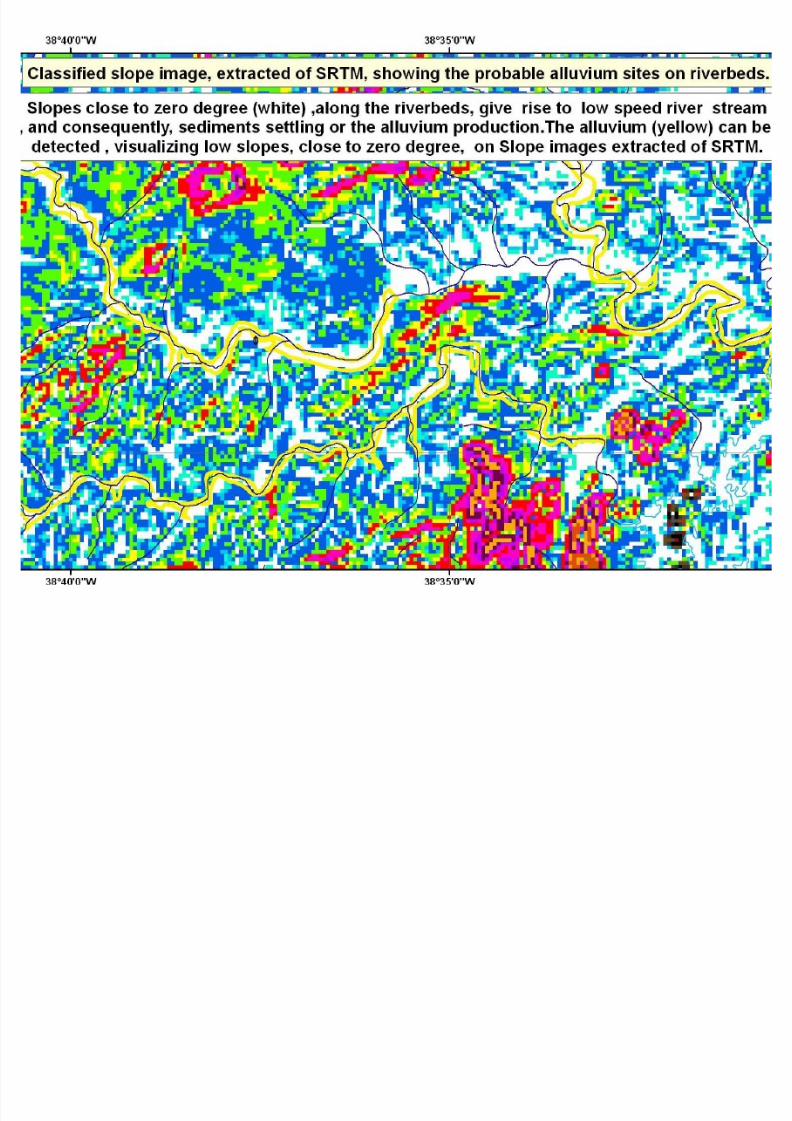
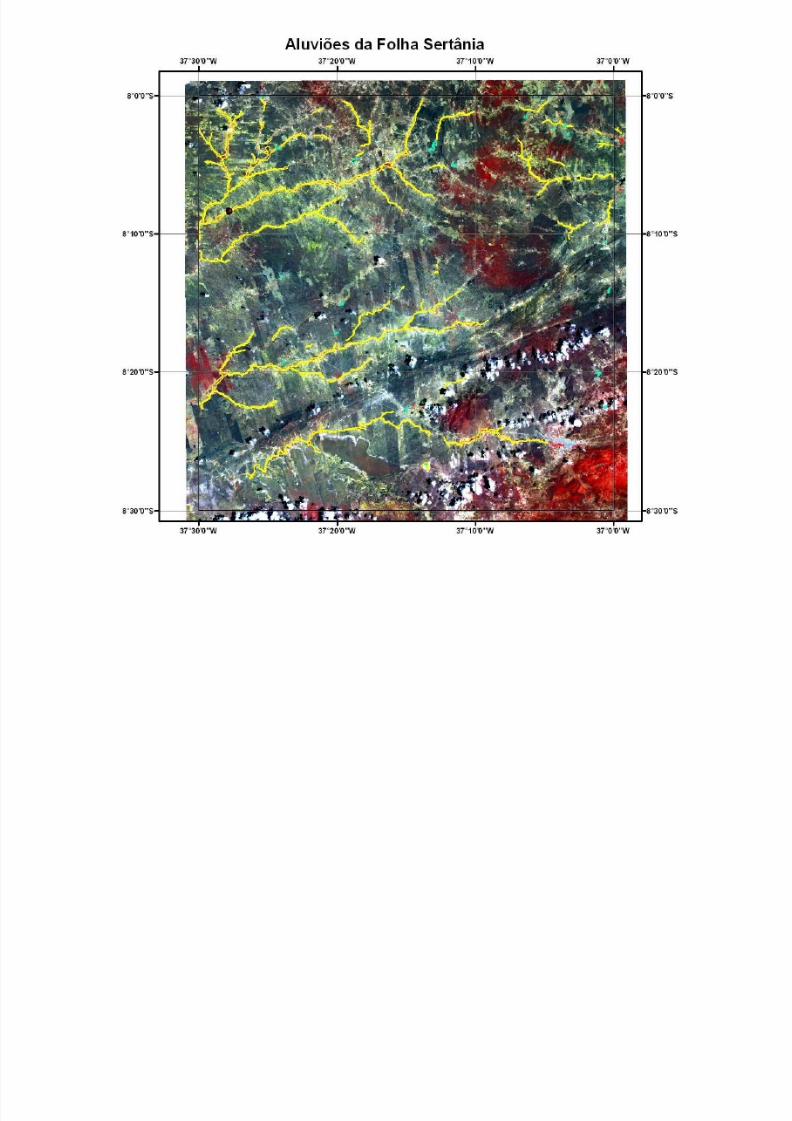
Sertânia alluvium map (alluvium in red. Band 4 in R, outlined in
yellow) ,in the composition 4R 3G 1B sensor LANDSAT 7 ETM +
8/3/2019 Alluvium Translated
http://slidepdf.com/reader/full/alluvium-translated 10/44
8/3/2019 Alluvium Translated
http://slidepdf.com/reader/full/alluvium-translated 11/44
Sapé Map 1:100.000 scale : Rio Paraíba major riverbed andfloodplain, as seen in classfied slope, from SRTM, made in Arc
Gis. Alluvium with slope < 2 degrees
8/3/2019 Alluvium Translated
http://slidepdf.com/reader/full/alluvium-translated 12/44
8/3/2019 Alluvium Translated
http://slidepdf.com/reader/full/alluvium-translated 13/44
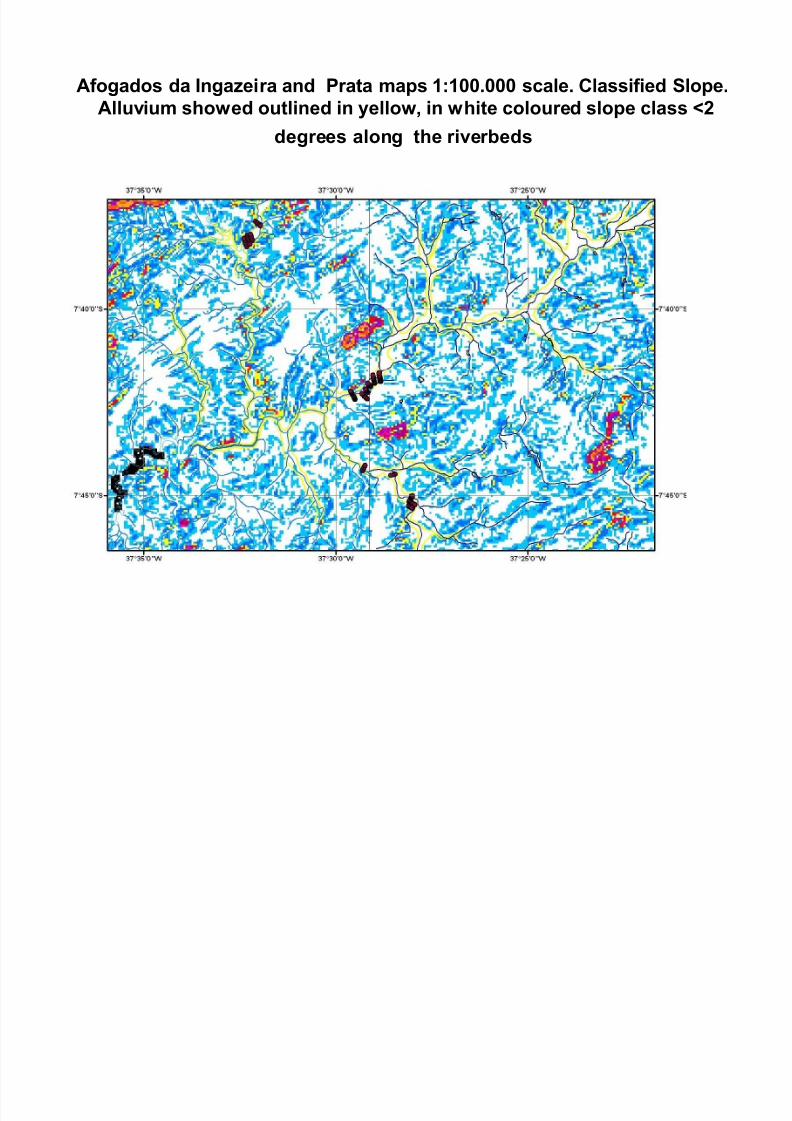
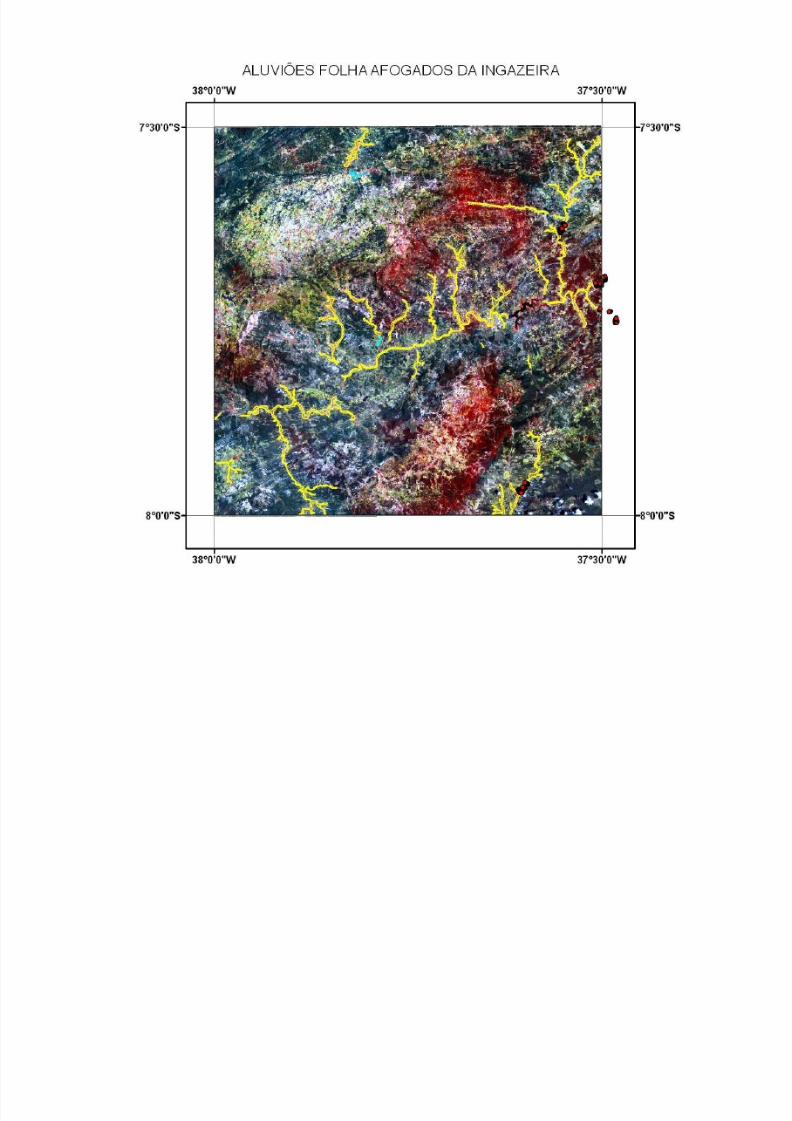
Afogados da Ingazeira and Prata maps 1:100.000 scale. Classified Slope.Alluvium showed outlined in yellow, in white coloured slope class <2
degrees along the riverbeds
8/3/2019 Alluvium Translated
http://slidepdf.com/reader/full/alluvium-translated 14/44
8/3/2019 Alluvium Translated
http://slidepdf.com/reader/full/alluvium-translated 15/44
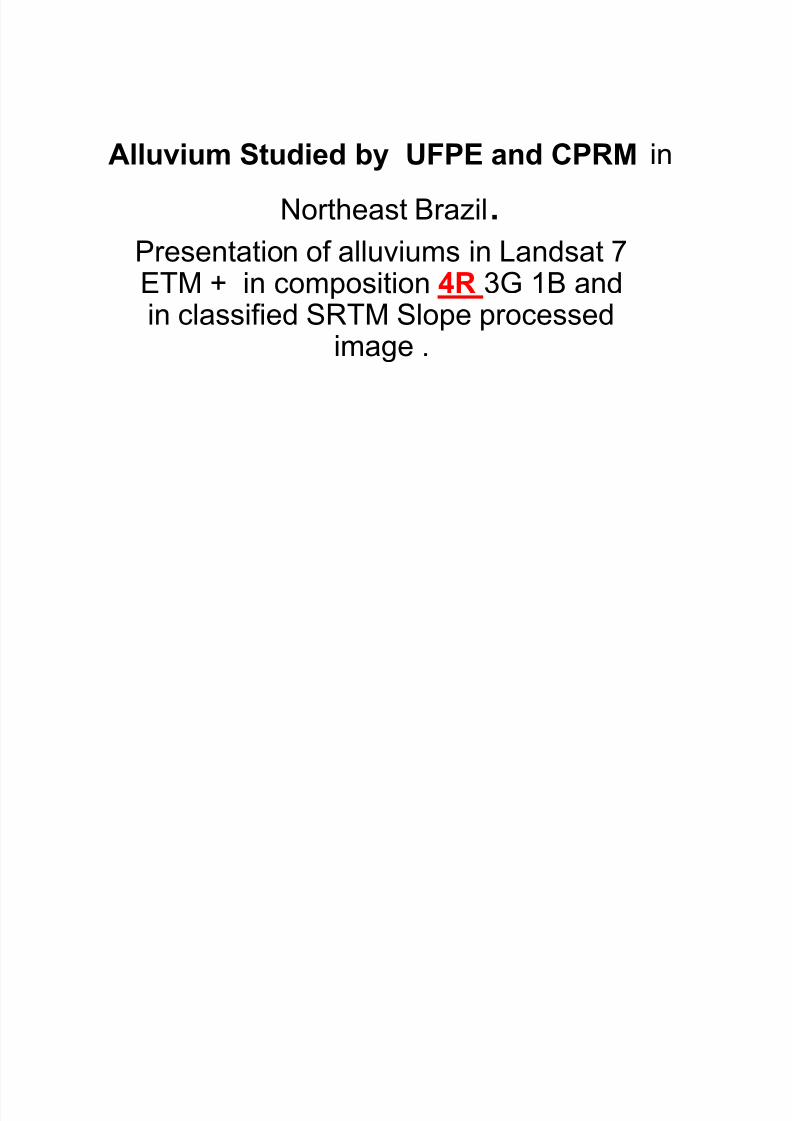
LANDSAT 7 ETM+ 4R 3G 1B image in Afogados da Ingazeira e PrataCounties maps Alluviuns in red( 4R) outlined in yellow.
8/3/2019 Alluvium Translated
http://slidepdf.com/reader/full/alluvium-translated 16/44
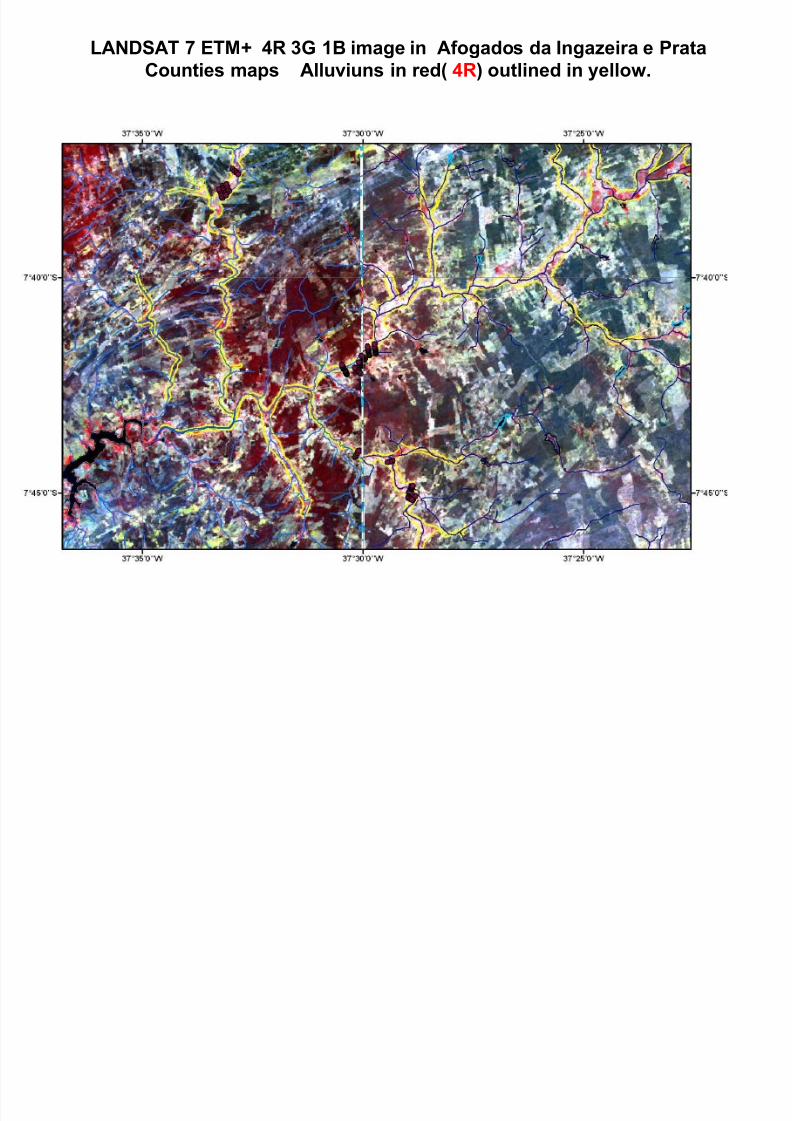
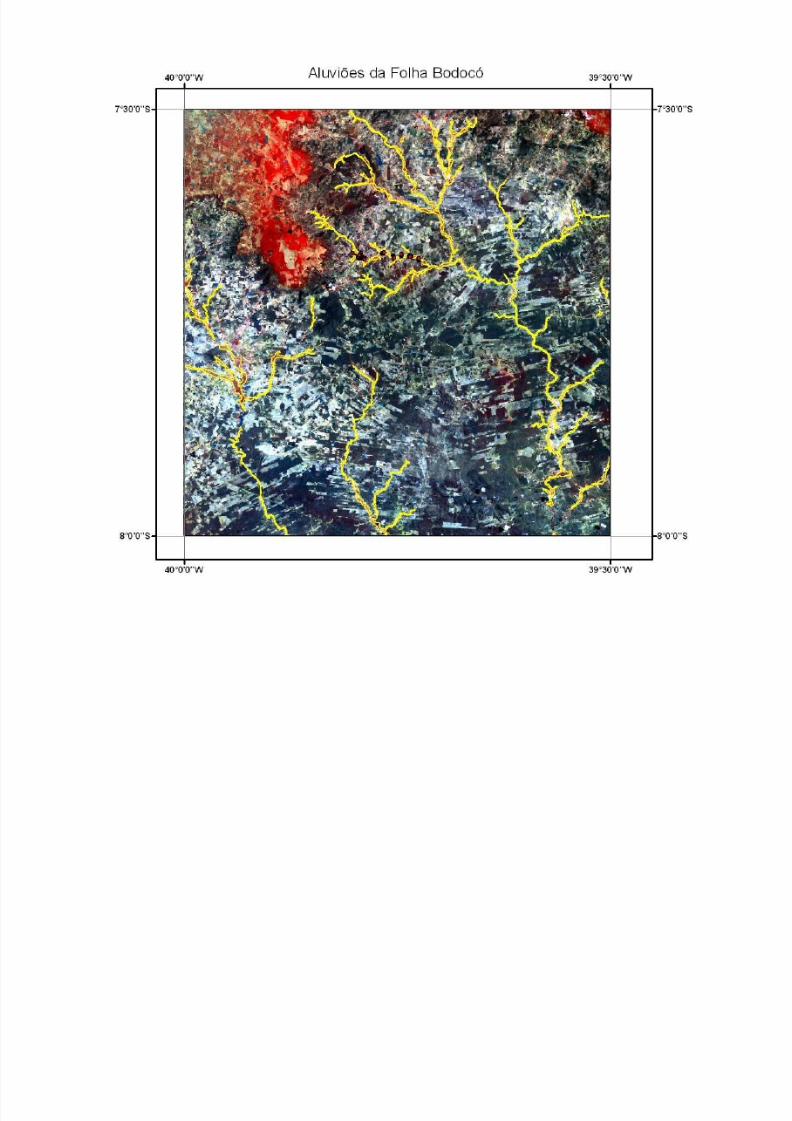
Processed Slope image from SRTM, with alluviuns outlined in yellow andwells in brown dots, in Bodocó County map
Alluvions are on riverbed, with slow slope < 2 degrees showed in whitecontoured in blue
8/3/2019 Alluvium Translated
http://slidepdf.com/reader/full/alluvium-translated 17/44
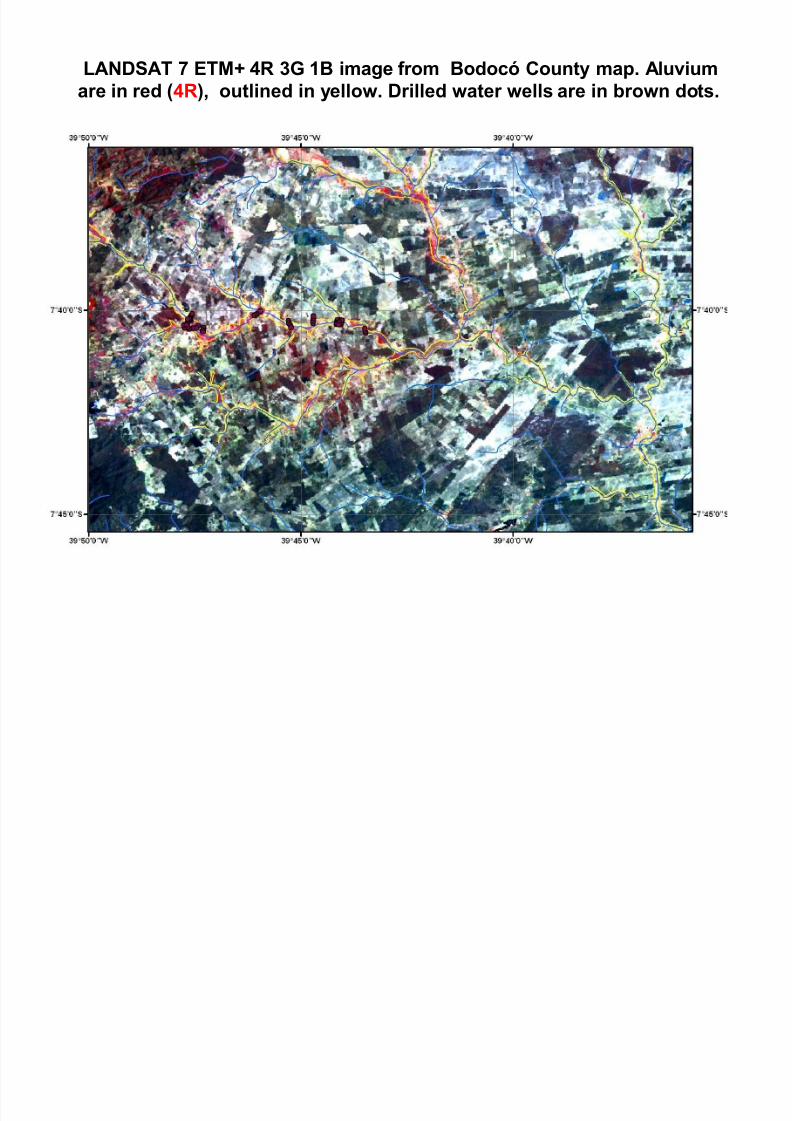
LANDSAT 7 ETM+ 4R 3G 1B image from Bodocó County map. Aluviumare in red (4R), outlined in yellow. Drilled water wells are in brown dots.
8/3/2019 Alluvium Translated
http://slidepdf.com/reader/full/alluvium-translated 18/44
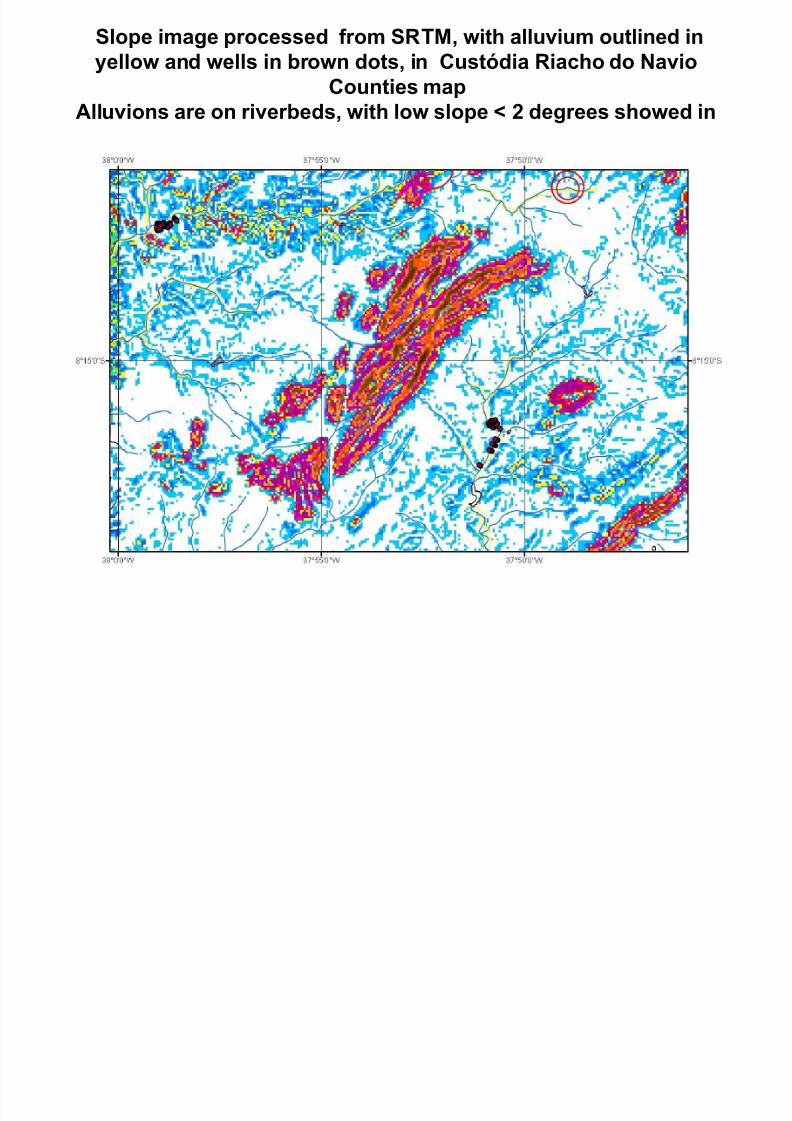
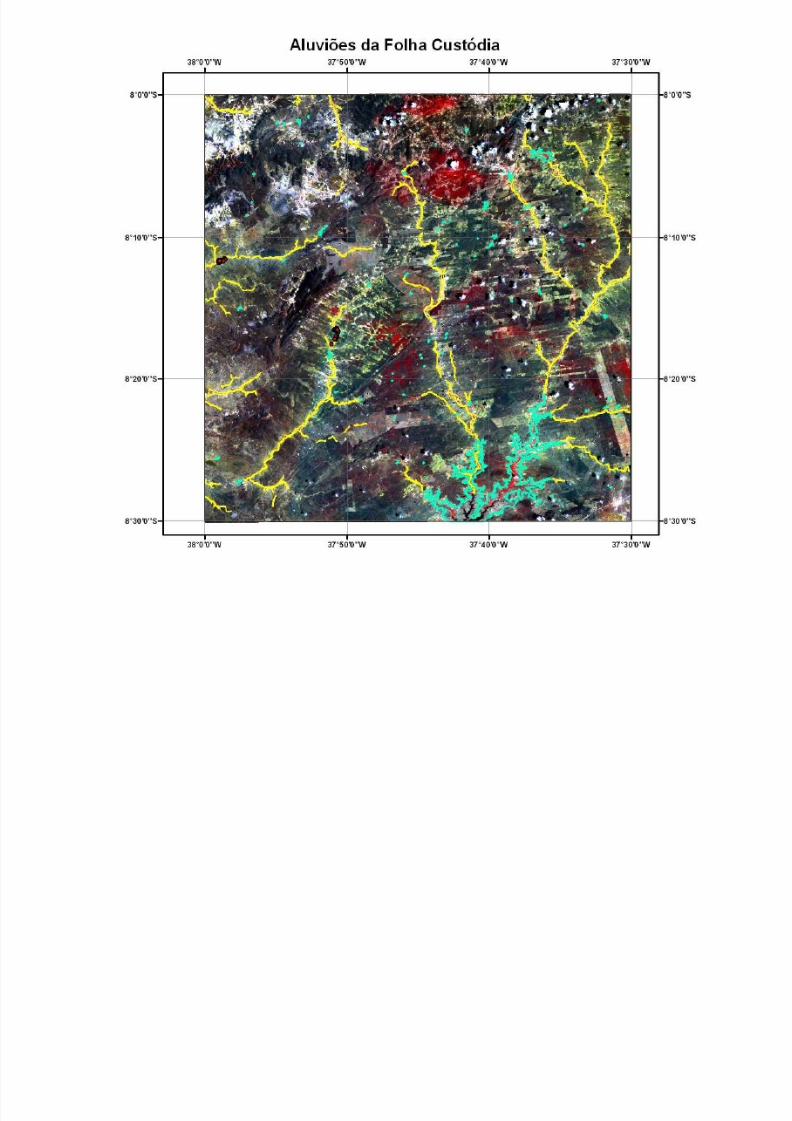
Slope image processed from SRTM, with alluvium outlined inyellow and wells in brown dots, in Custódia Riacho do Navio
Counties mapAlluvions are on riverbeds, with low slope < 2 degrees showed in
white, contoured in yellow
8/3/2019 Alluvium Translated
http://slidepdf.com/reader/full/alluvium-translated 19/44
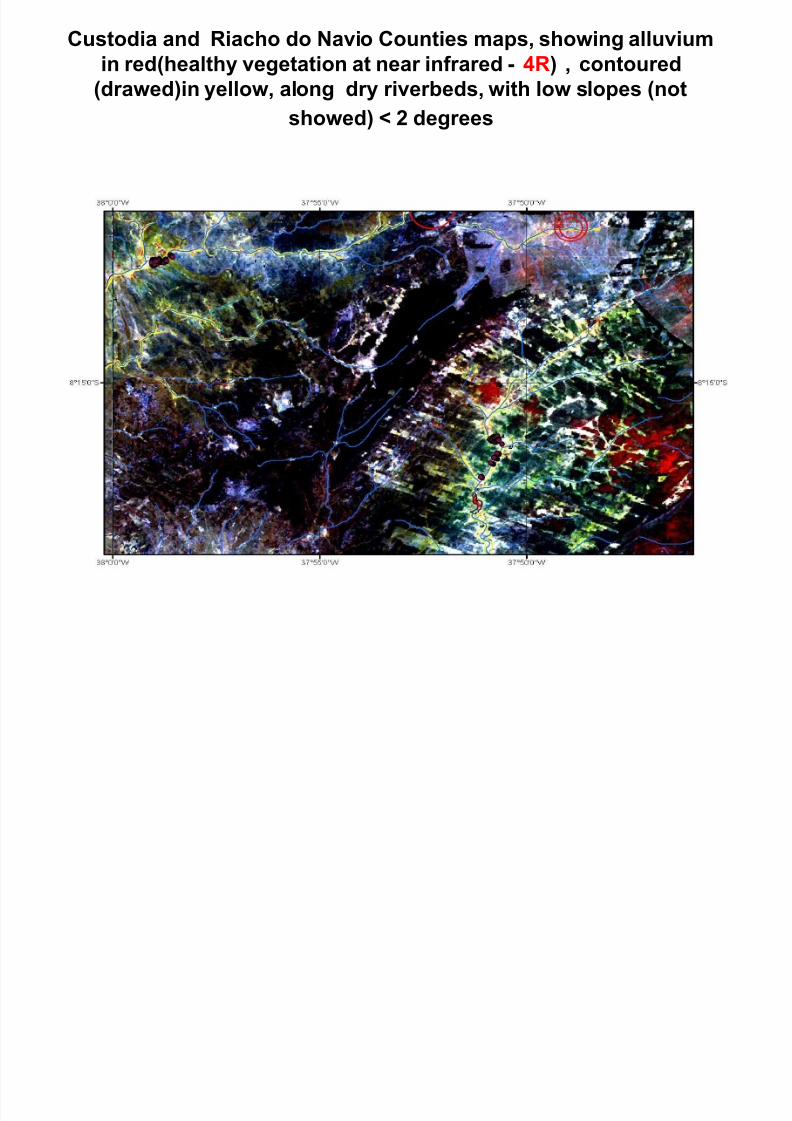
Custodia and Riacho do Navio Counties maps, showing alluviumin red(healthy vegetation at near infrared - 4R) , contoured
(drawed)in yellow, along dry riverbeds, with low slopes (notshowed) < 2 degrees
8/3/2019 Alluvium Translated
http://slidepdf.com/reader/full/alluvium-translated 20/44
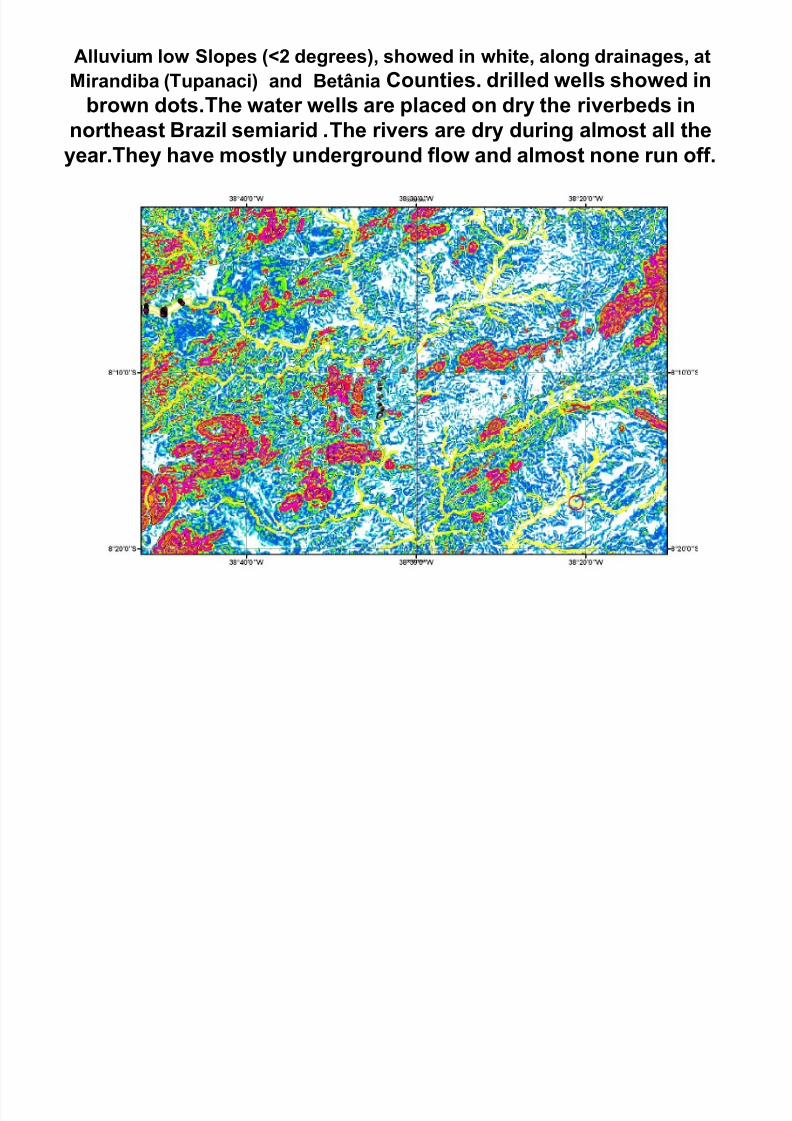
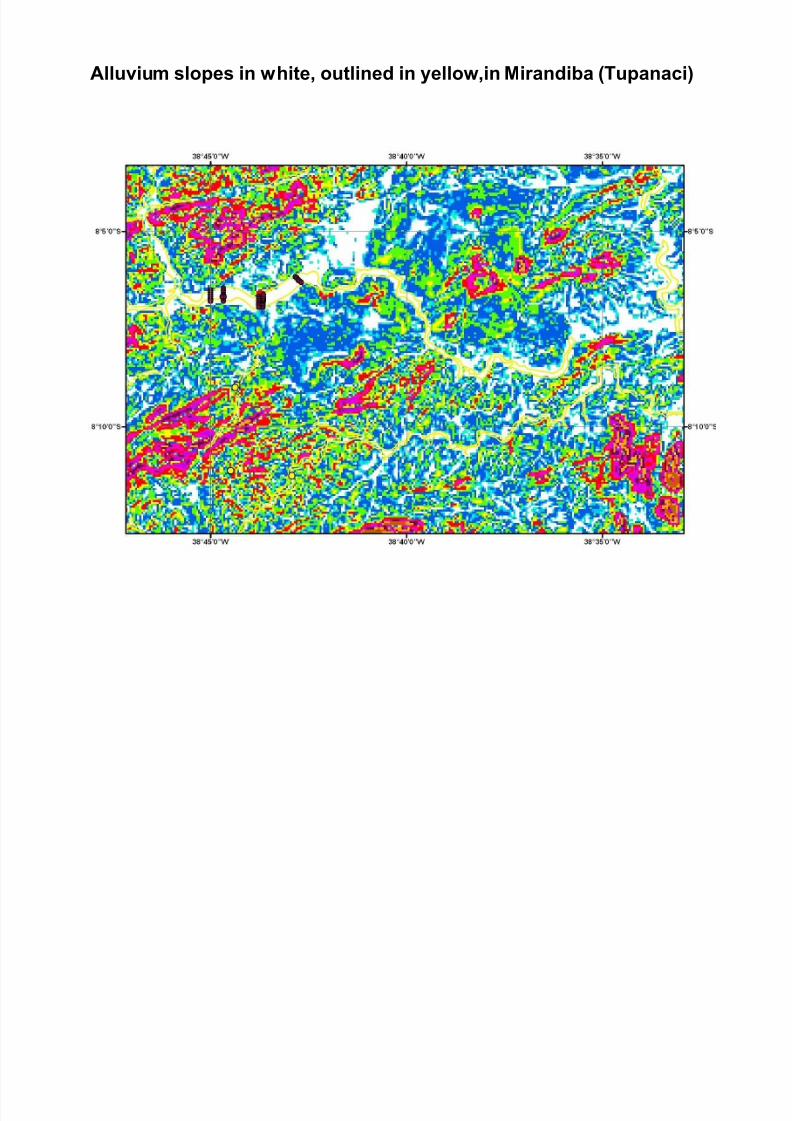
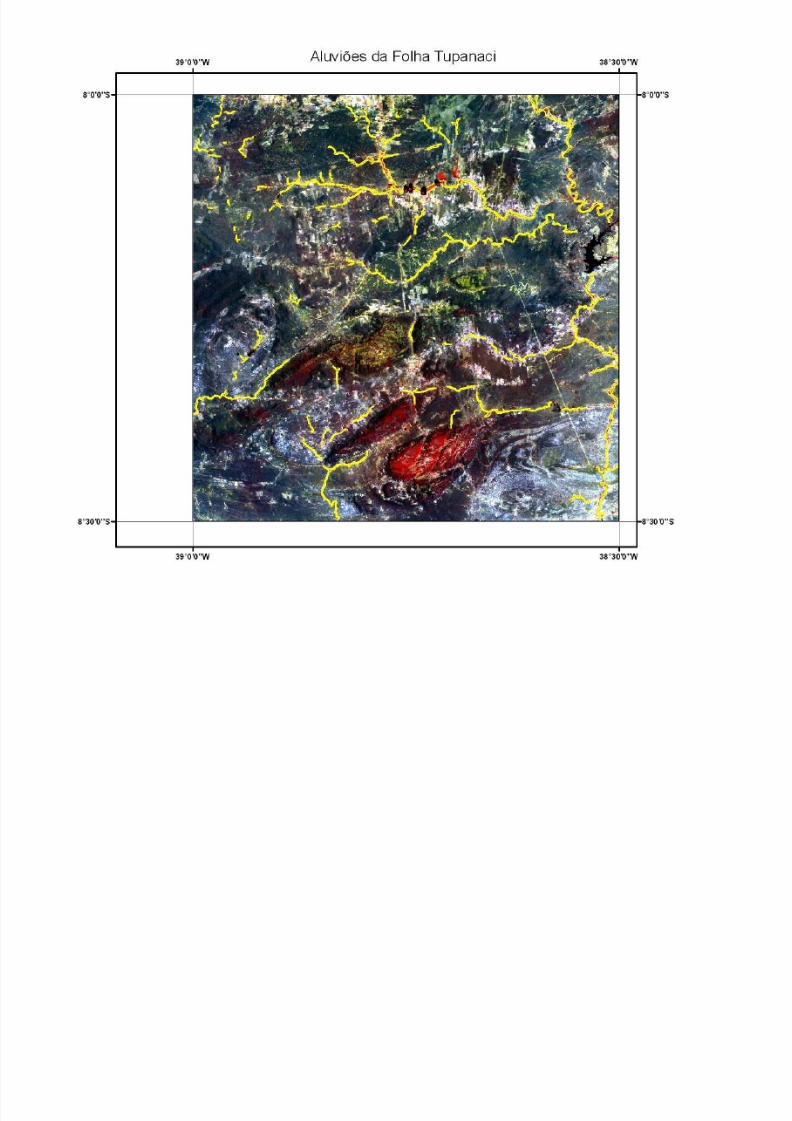
Alluvium low Slopes (<2 degrees), showed in white, along drainages, atMirandiba (Tupanaci) and Betânia Counties. drilled wells showed in
brown dots.The water wells are placed on dry the riverbeds in
northeast Brazil semiarid .T
he rivers are dry during almost all theyear.They have mostly underground flow and almost none run off.
8/3/2019 Alluvium Translated
http://slidepdf.com/reader/full/alluvium-translated 21/44
Alluvium slopes in white, outlined in yellow,in Mirandiba (Tupanaci)
8/3/2019 Alluvium Translated
http://slidepdf.com/reader/full/alluvium-translated 22/44
8/3/2019 Alluvium Translated
http://slidepdf.com/reader/full/alluvium-translated 23/44
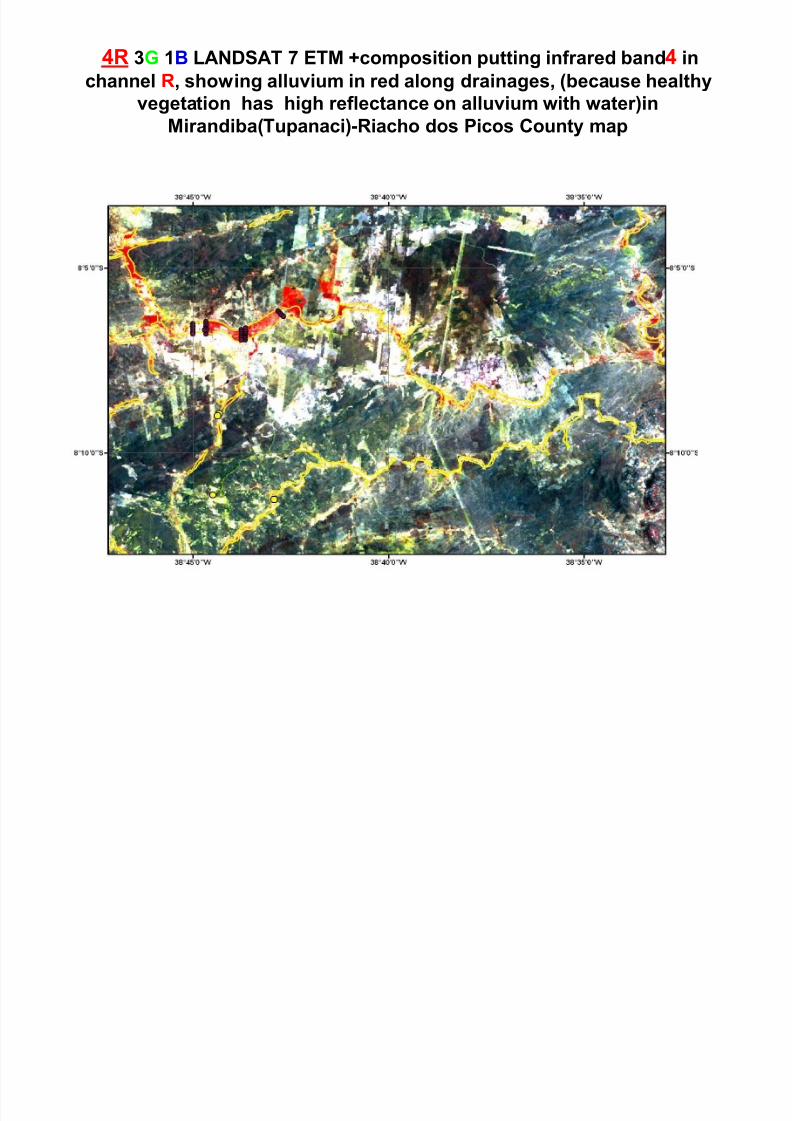
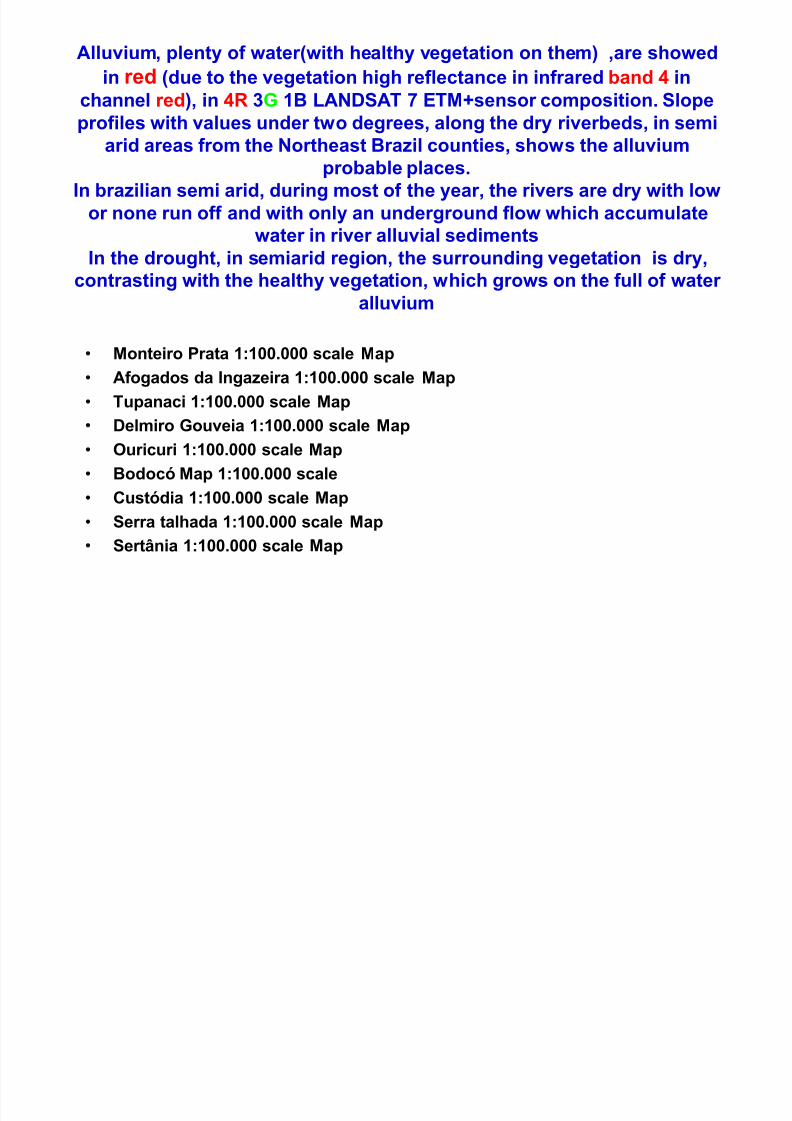
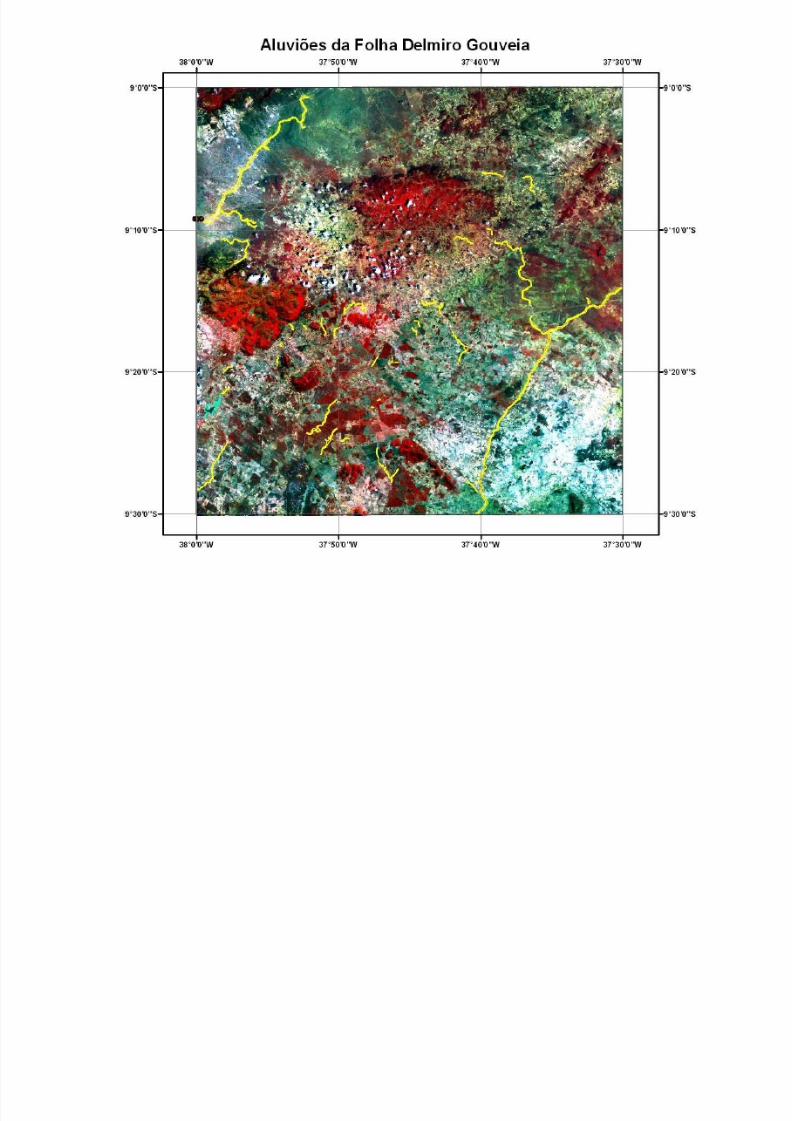
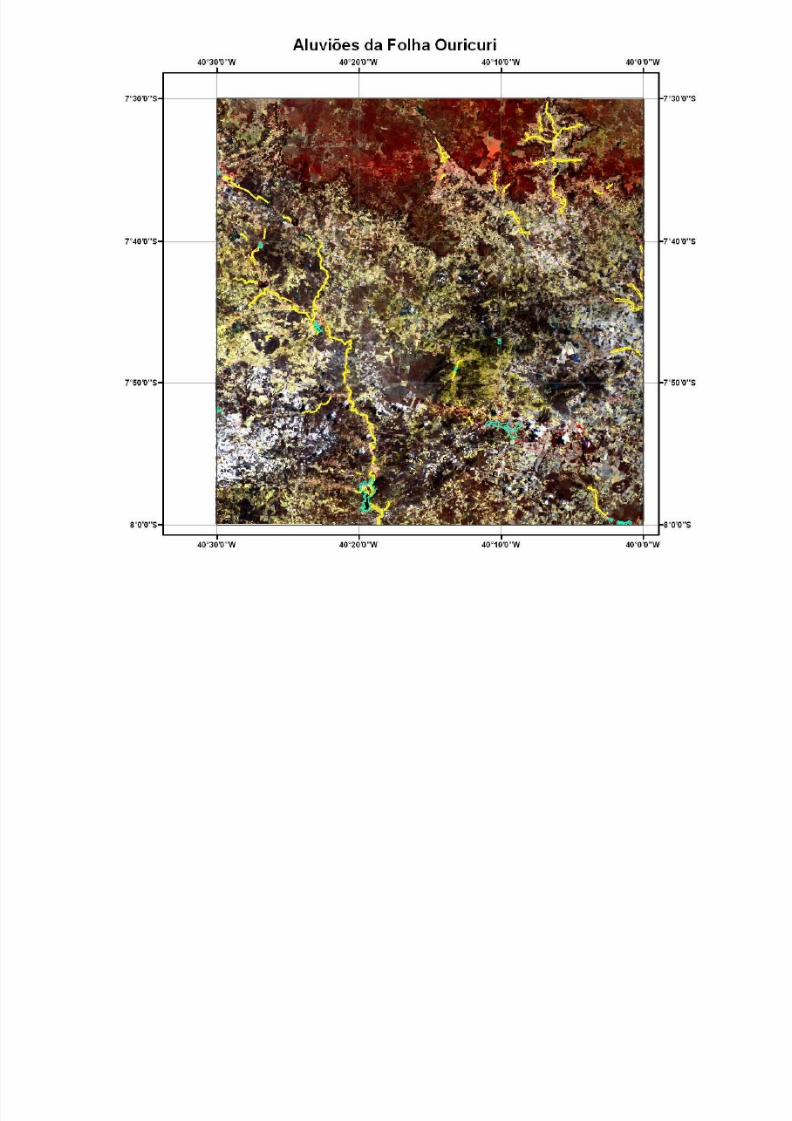
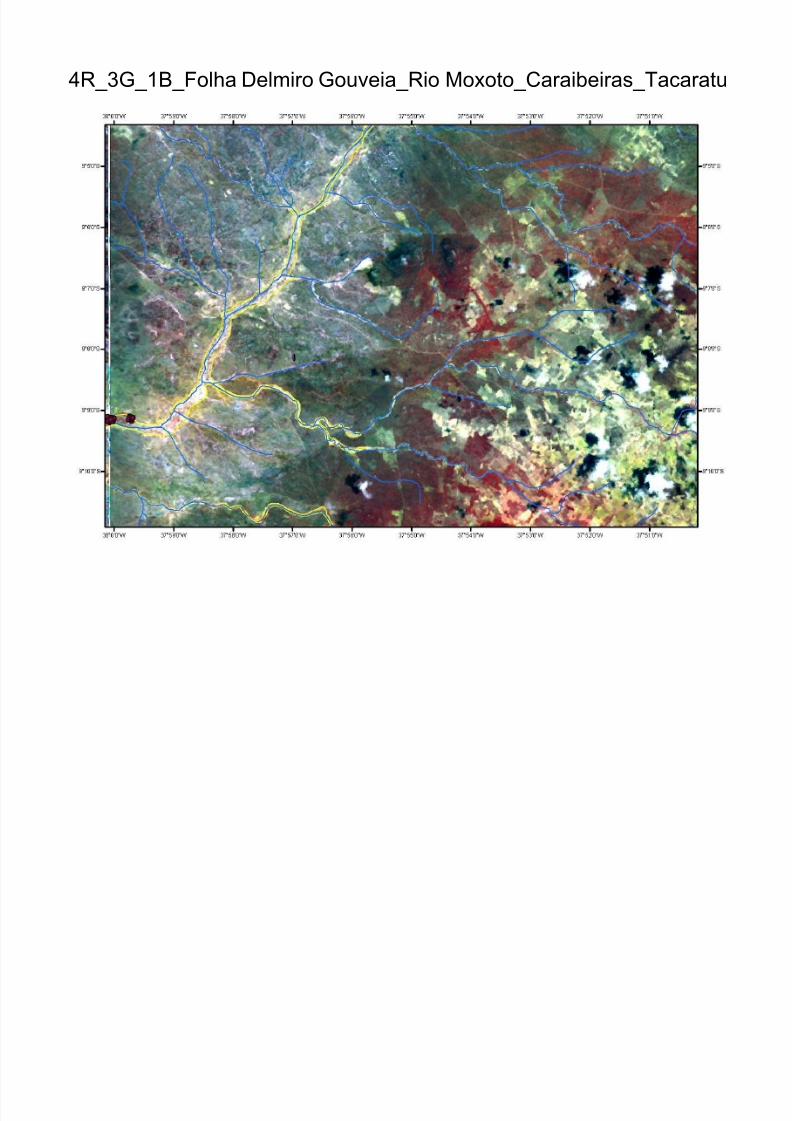
Alluvium, plenty of water(with healthy vegetation on them) ,are showedin red (due to the vegetation high reflectance in infrared band 4 in
channel red), in 4R 3G 1B LANDSAT 7 ETM+sensor composition. Slopeprofiles with values under two degrees, along the dry riverbeds, in semi
arid areas from the Northeast Brazil counties, shows the alluviumprobable places.
In brazilian semi arid, during most of the year, the rivers are dry with lowor none run off and with only an underground flow which accumulate
water in river alluvial sedimentsIn the drought, in semiarid region, the surrounding vegetation is dry,
contrasting with the healthy vegetation, which grows on the full of water alluvium
Monteiro Prata 1:100.000 scale Map
Afogados da Ingazeira 1:100.000 scale Map
Tupanaci 1:100.000 scale Map
Delmiro Gouveia 1:100.000 scale Map Ouricuri 1:100.000 scale Map
BodocóMap 1:100.000 scale
Custódia 1:100.000 scale Map
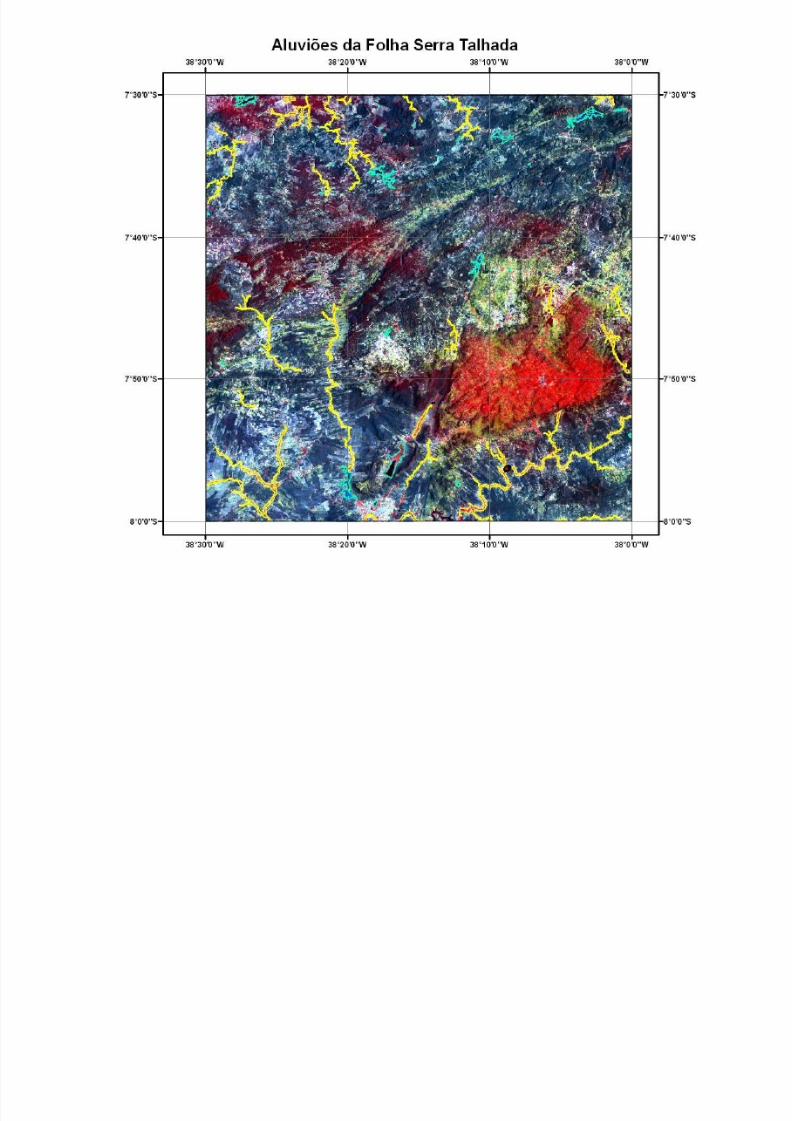
Serra talhada 1:100.000 scale Map
Sertânia 1:100.000 scale Map
8/3/2019 Alluvium Translated
http://slidepdf.com/reader/full/alluvium-translated 24/44
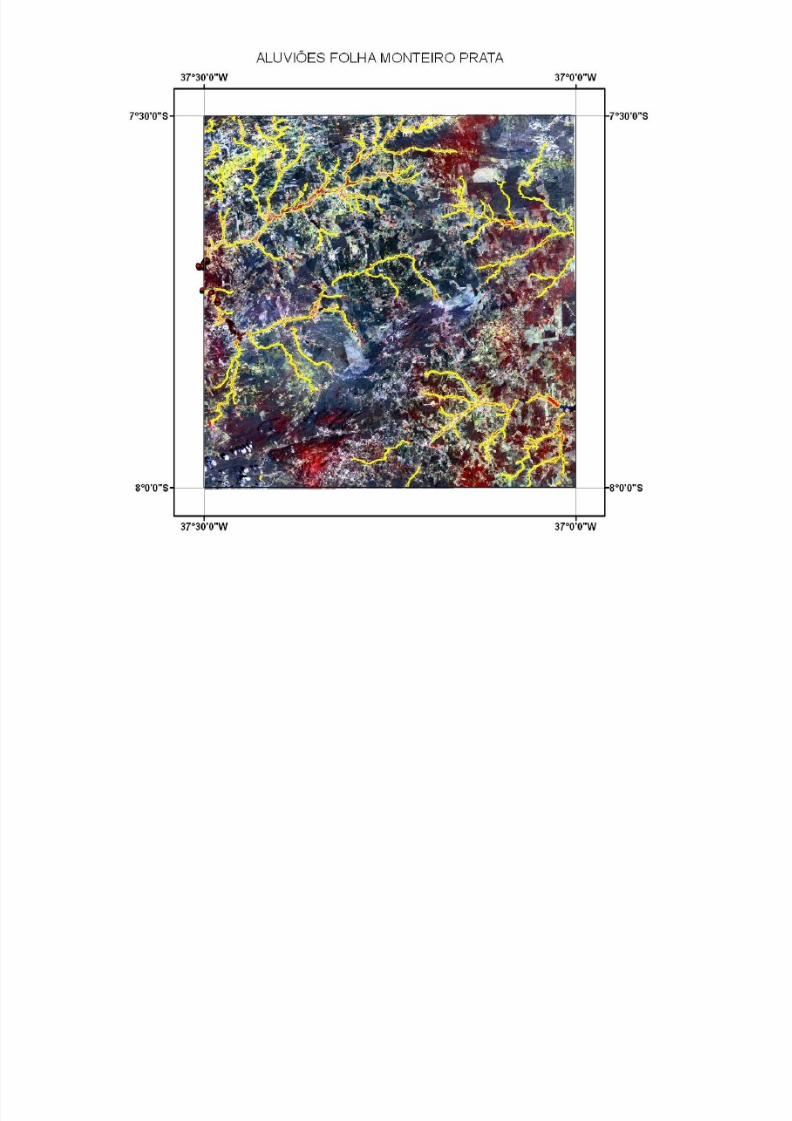
Aluviões na Folha Monteiro Prata
8/3/2019 Alluvium Translated
http://slidepdf.com/reader/full/alluvium-translated 25/44
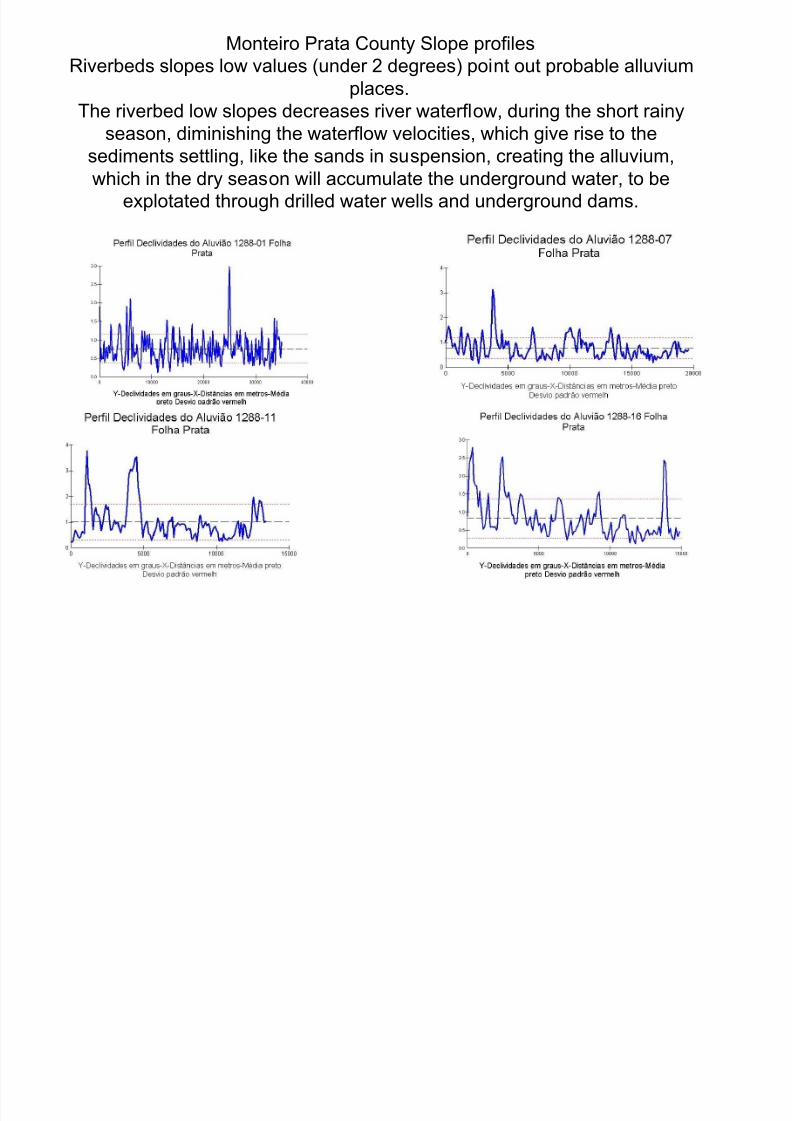
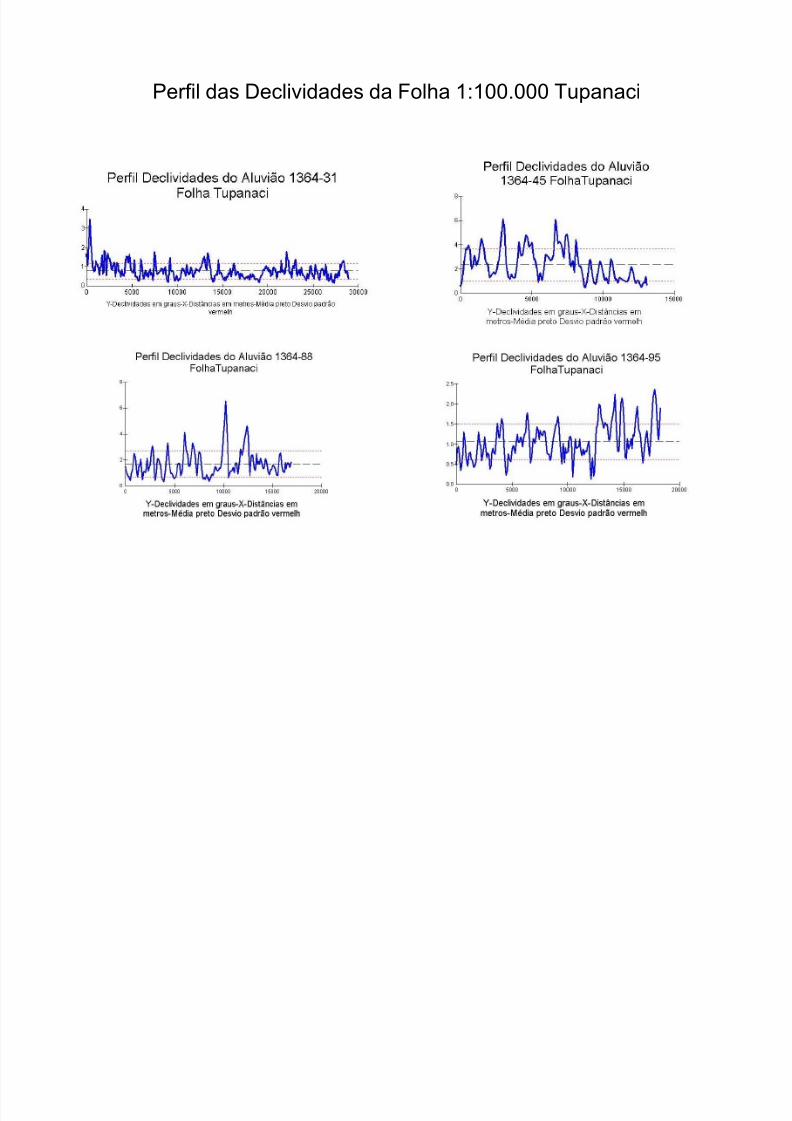
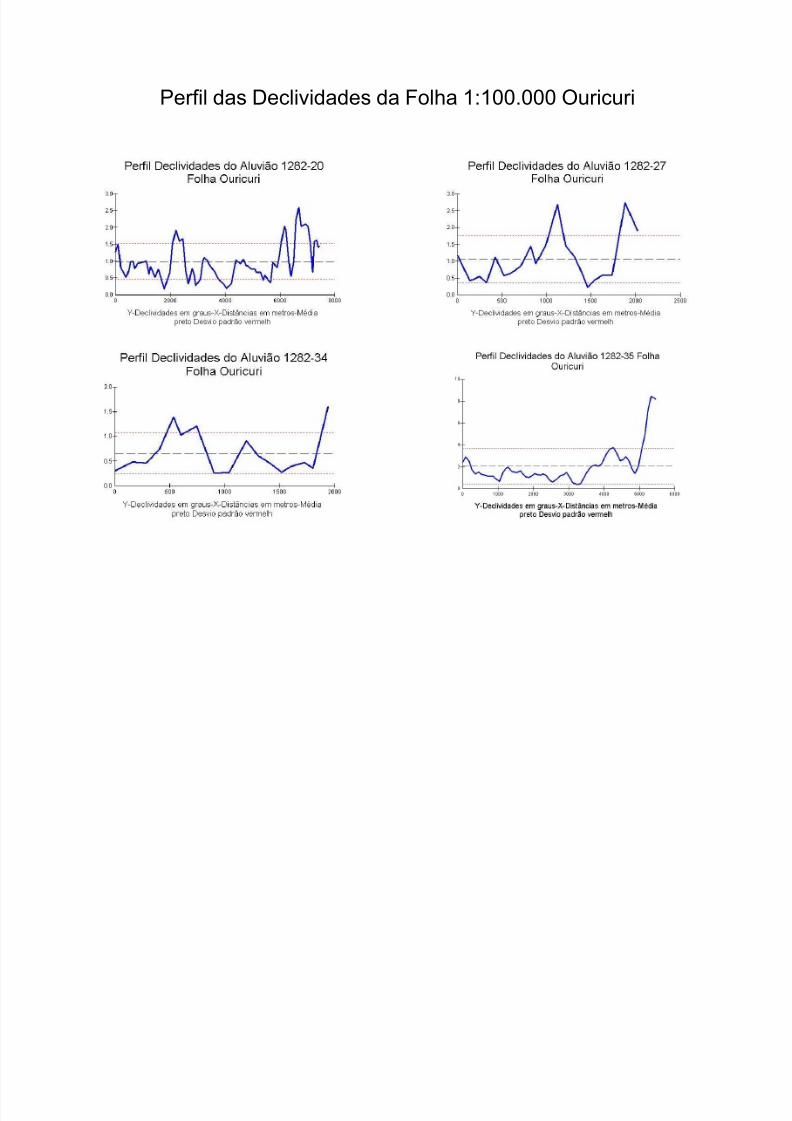
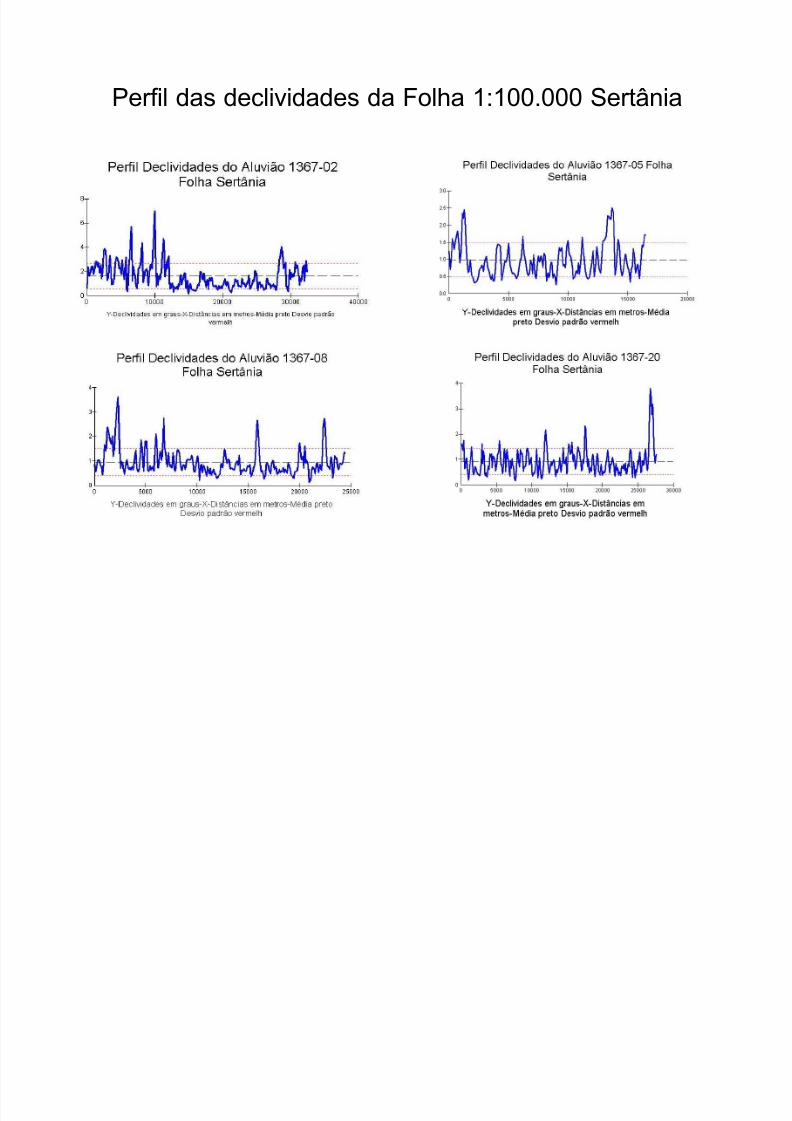
Monteiro Prata County Slope profiles
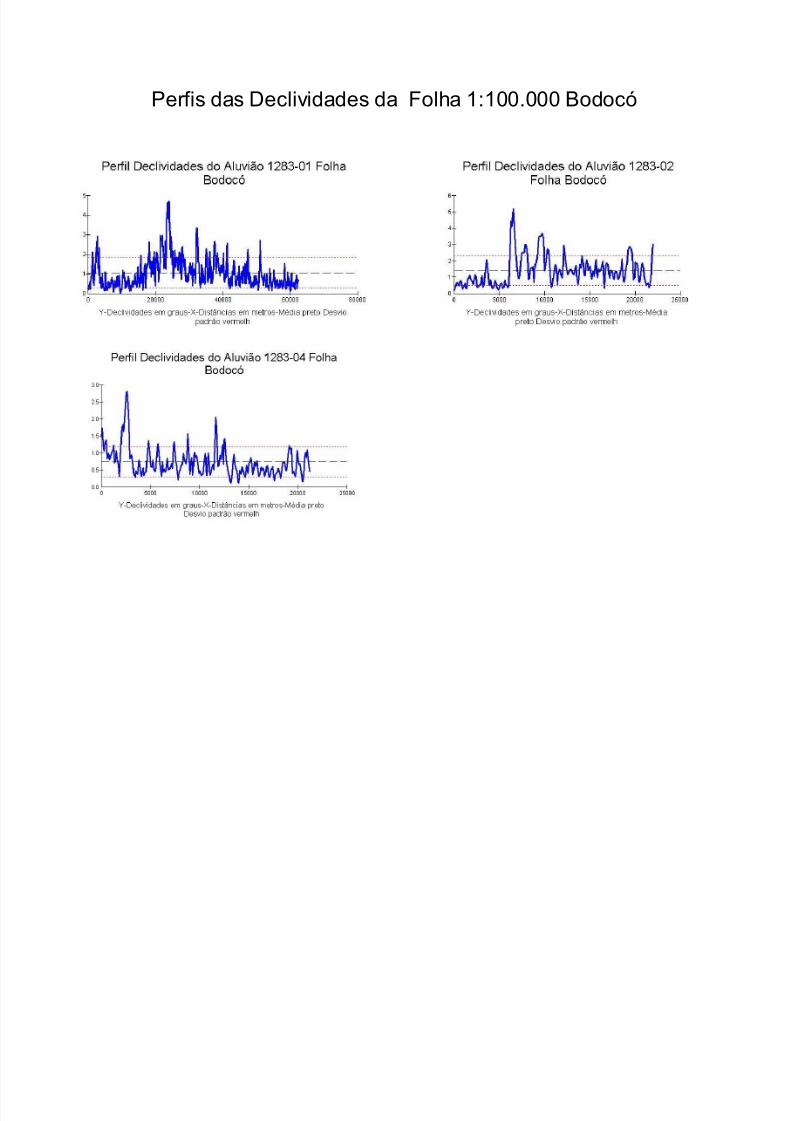
Riverbeds slopes low values (under 2 degrees) point out probable alluvium
places.
The riverbed low slopes decreases river waterflow, during the short rainy
season, diminishing the waterflow velocities, which give rise to thesediments settling, like the sands in suspension, creating the alluvium,
which in the dry season will accumulate the underground water, to be
explotated through drilled water wells and underground dams.
8/3/2019 Alluvium Translated
http://slidepdf.com/reader/full/alluvium-translated 26/44
8/3/2019 Alluvium Translated
http://slidepdf.com/reader/full/alluvium-translated 27/44
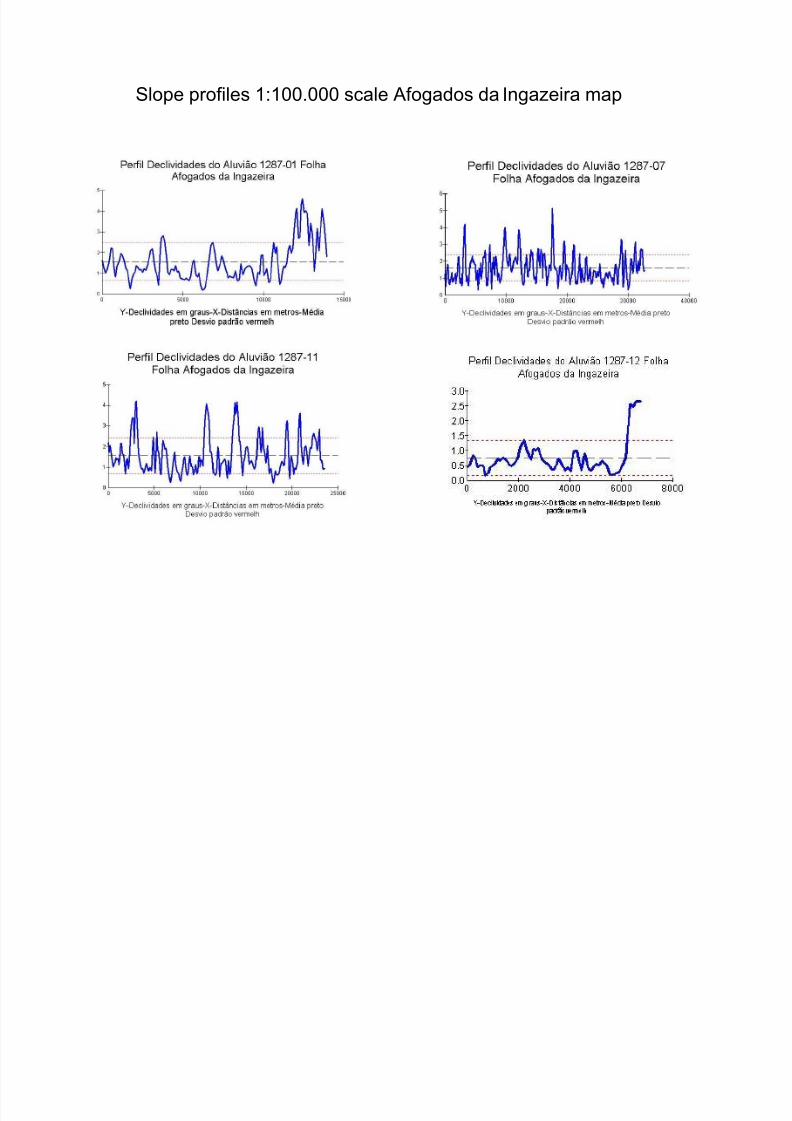
Slope profiles 1:100.000 scale Afogados da Ingazeira map
8/3/2019 Alluvium Translated
http://slidepdf.com/reader/full/alluvium-translated 28/44
8/3/2019 Alluvium Translated
http://slidepdf.com/reader/full/alluvium-translated 29/44
Perfil das Declividades da Folha 1:100.000 Tupanaci
8/3/2019 Alluvium Translated
http://slidepdf.com/reader/full/alluvium-translated 30/44
8/3/2019 Alluvium Translated
http://slidepdf.com/reader/full/alluvium-translated 31/44
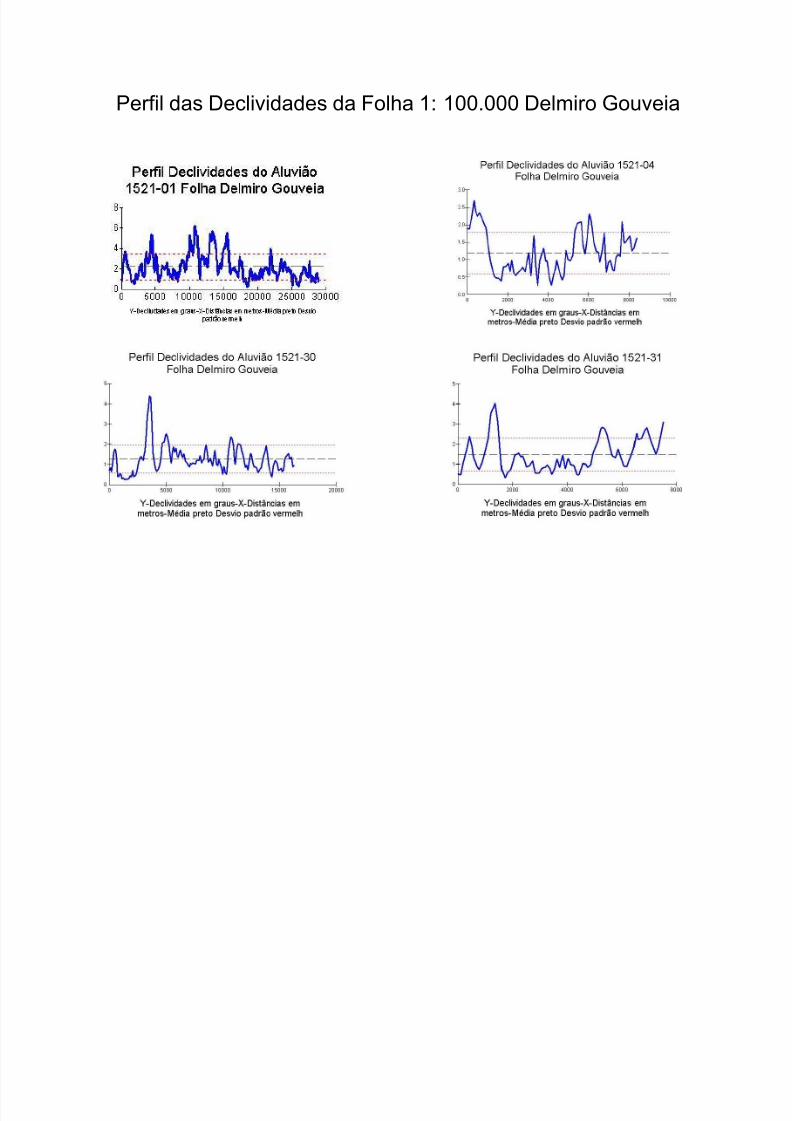
Perfil das Declividades da Folha 1: 100.000 Delmiro Gouveia
8/3/2019 Alluvium Translated
http://slidepdf.com/reader/full/alluvium-translated 32/44
8/3/2019 Alluvium Translated
http://slidepdf.com/reader/full/alluvium-translated 33/44
Perfil das Declividades da Folha 1:100.000 Ouricuri
8/3/2019 Alluvium Translated
http://slidepdf.com/reader/full/alluvium-translated 34/44
8/3/2019 Alluvium Translated
http://slidepdf.com/reader/full/alluvium-translated 35/44
Perfis das Declividades da Folha 1:100.000 Bodocó
8/3/2019 Alluvium Translated
http://slidepdf.com/reader/full/alluvium-translated 36/44
8/3/2019 Alluvium Translated
http://slidepdf.com/reader/full/alluvium-translated 37/44
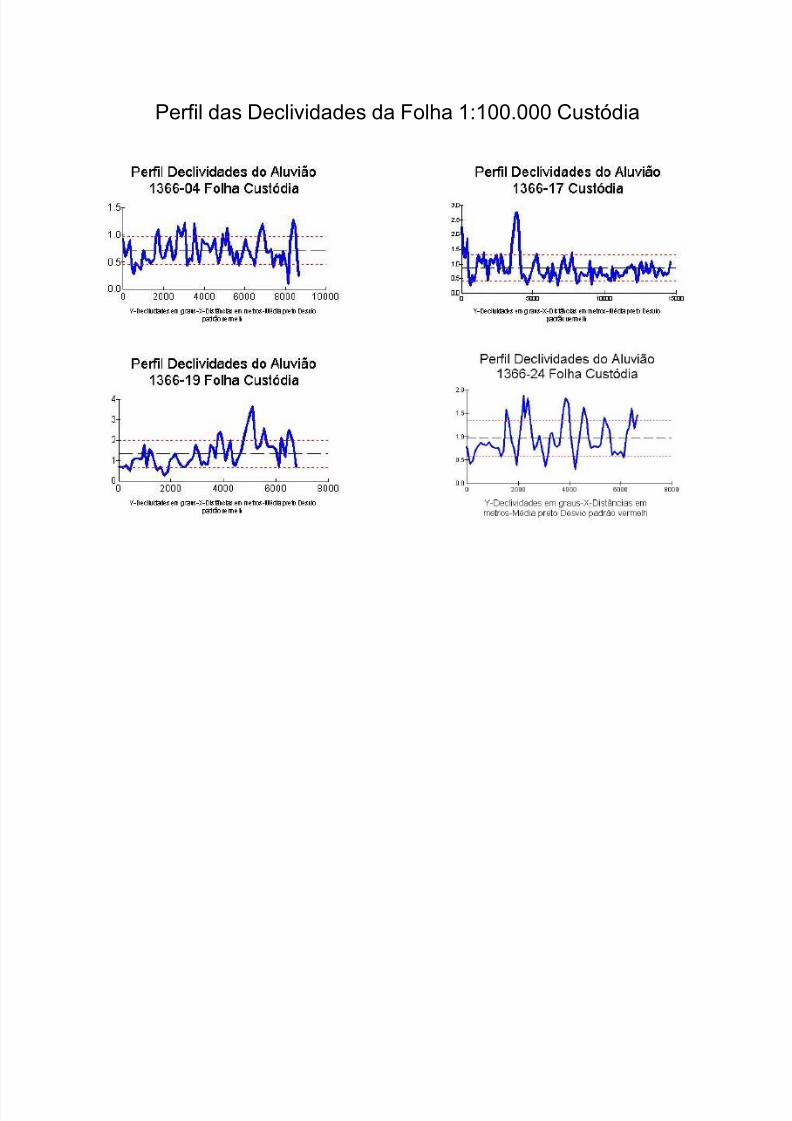
Perfil das Declividades da Folha 1:100.000 Custódia
8/3/2019 Alluvium Translated
http://slidepdf.com/reader/full/alluvium-translated 38/44
8/3/2019 Alluvium Translated
http://slidepdf.com/reader/full/alluvium-translated 39/44
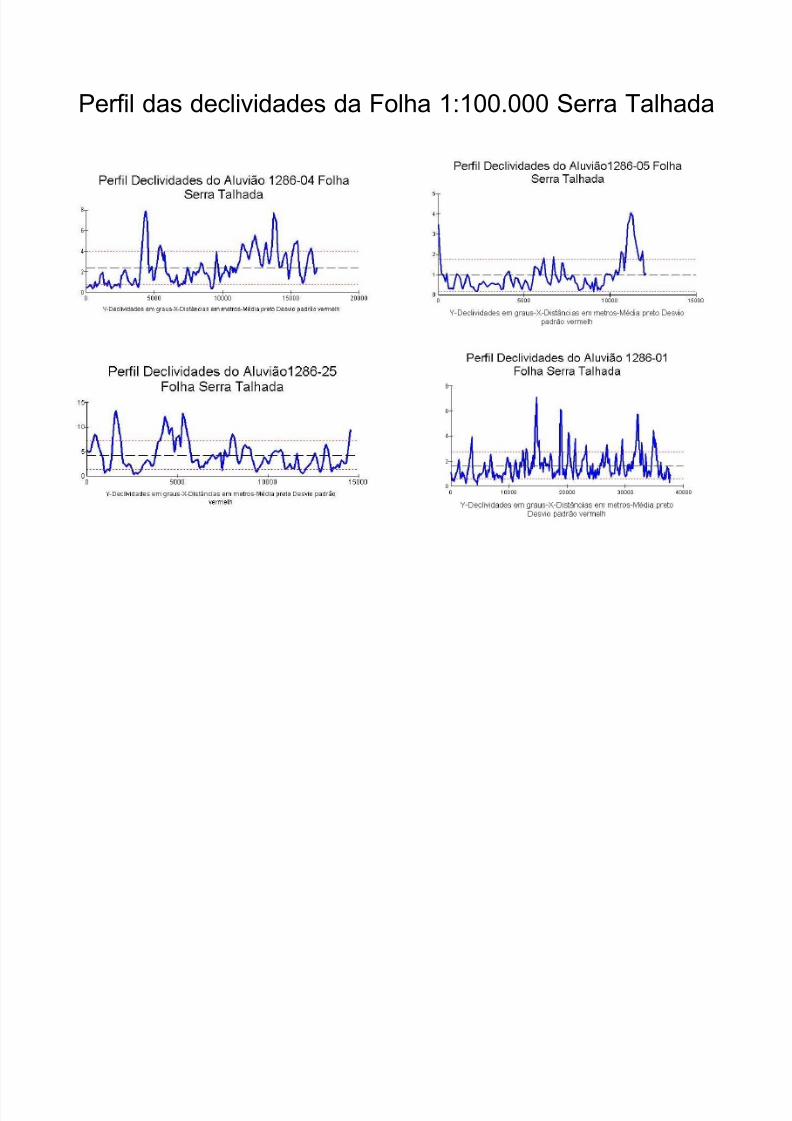
Perfil das declividades da Folha 1:100.000 Serra Talhada
8/3/2019 Alluvium Translated
http://slidepdf.com/reader/full/alluvium-translated 40/44
8/3/2019 Alluvium Translated
http://slidepdf.com/reader/full/alluvium-translated 41/44
8/3/2019 Alluvium Translated
http://slidepdf.com/reader/full/alluvium-translated 42/44
4R_3G_1B_Folha Delmiro Gouveia_Rio Moxoto_Caraibeiras_Tacaratu
8/3/2019 Alluvium Translated
http://slidepdf.com/reader/full/alluvium-translated 43/44
Slopes Delmiro Gouveia map_ Moxoto River_Caraibeiras_Tacaratu
8/3/2019 Alluvium Translated
http://slidepdf.com/reader/full/alluvium-translated 44/44
Conclusions
The spectral patterns favorable to alluviumidentification (healthy vegetation along theriverbeds, contrasting with surrounding dryvegetation ) found in satellite images, should beconfronted with the slope images, in order to ensurethe existence of a alluvium and not a colluviumvegetation. However, due to the pixel size of theslope(derived from SRTM) is 90m, may occur,sporadically, that an alluvium, with a width of 30 m,for example, may appear to have a slope of 5 degrees. It is easy to understand since we pay
attention to the fact that, a very small width of alluvium(less than 90m) would be represented in amixed pixel, in the image slope, which would includethe width of this alluvium and part of the steeper slope marginal area.