Embed Size (px)
Citation preview
doi:10.1016/j.jmb.2008.12.032 J. Mol. Biol. (2009) 387, 390–406
Available online at www.sciencedirect.com
Allostery Wiring Diagrams in the Transitions that Drivethe GroEL Reaction Cycle
Riina Tehver1, Jie Chen1 and D. Thirumalai1,2⁎
1Biophysics Program, Institutefor Physical Science andTechnology, University ofMaryland, College Park,MD 20742, USA2Department of Chemistryand Biochemistry, Universityof Maryland, College Park,MD 20742, USAReceived 28 September 2008;received in revised form5 December 2008;accepted 8 December 2008Available online24 December 2008
*Corresponding author. BiophysicsCollege Park, MD 20742, USA. E-mAbbreviations used: ENM, elastic
analysis.
0022-2836/$ - see front matter © 2008 E
Determining the network of residues that transmit allosteric signals iscrucial to understanding the function of biological nanomachines. Duringthe course of a reaction cycle, biological machines in general, and Escherichiacoli chaperonin GroEL in particular, undergo large-scale conformationalchanges in response to ligand binding. Normal mode analyses, based onstructure-based coarse-grained models where each residue is representedby an α carbon atom, have been widely used to describe the motionsencoded in the structures of proteins. Here, we propose a new Cα–side chainelastic network model of proteins that includes information about thephysical identity of each residue and accurately accounts for the side-chaintopology and packing within the structure. Using the Cα–side chain elasticnetwork model and the structural perturbation method, which probes theresponse of a local perturbation at a given site at all other sites in thestructure, we determine the network of key residues (allostery wiringdiagram) responsible for the T→R and R″→T transitions in GroEL. Anumber of residues, both within a subunit and at the interface of twoadjacent subunits, are found to be at the origin of the positive cooperativityin the ATP-driven T→R transition. Of particular note are residues G244,R58, D83, E209, and K327. Of these, R38, D83, and K327 are highlyconserved. G244 is located in the apical domain at the interface between twosubunits; E209 and K327 are located in the apical domain, toward the centerof a subunit; R58 and D83 are equatorial domain residues. The allosterywiring diagram shows that the network of residues are interspersedthroughout the structure. Residues D83, V174, E191, and D359 play a criticalrole in the R″→T transition, which implies that mutations of these residueswould compromise the ATPase activity. D83 and E191 are also highlyconserved; D359 is moderately conserved. The negative cooperativity bet-ween the rings in the R″→T transition is orchestrated through severalinterface residues within a single ring, including N10, E434, D435, and E451.Signal from the trans ring that is transmitted across the interface betweenthe equatorial domains is responsible for the R″→T transition. The cocha-peronin GroES plays a passive role in the R″→T transition. Remarkably, thebinding affinity of GroES for GroEL is allosterically linked to GroELresidues 350–365 that span helices K and L. The movements of helices K andL alter the polarity of the cavity throughout the GroEL functional cycle andundergo large-scale motions that are anticorrelated with the other apicaldomain residues. The allostery wiring diagrams for the T→R and R″→Ttransitions of GroEL provide a microscopic foundation for the cooperativity(anticooperativity) within (between) the ring (rings). Using statisticalcoupling analysis, we extract evolutionarily linked clusters of residues inGroEL and GroES. We find that several substrate protein binding residuesas well as sites related to ATPase activity belong to a single functional
Program, Institute for Physical Science and Technology, University of Maryland,ail address: [email protected] model; SPM, structural perturbation method; SCA, statistical coupling
lsevier Ltd. All rights reserved.
391Allostery Wiring Diagrams of GroEL
network in GroEL. For GroES, the mobile loop residues and GroES/GroESinterface residues are linked.
© 2008 Elsevier Ltd. All rights reserved.
Keywords: allostery wiring diagram; chaperonin GroEL; structural pertur-bation method; functional residues; evolutionary imprints
Edited by D. CaseIntroduction
Repeated cycling between distinct allosteric statesis required for the functions of numerous biologicalnanomachines. During a typical reaction cycle, bio-logical machines (for example, Escherichia coli cha-peronin GroEL,1 ATP synthase,2 and molecularmotors3,4) visit a number of states triggered byligand binding. The transitions between the variousstructures are often powered by hydrolysis of ATP,binding, or release of ligands. Determining thestructural elements and specific residues that areresponsible for transmitting the allosteric signal isthe key to understanding how molecular machineswork. More generally, it is suspected that a networkof residues that are interspersed throughout thestructure conspire to bring about the large-scaleconformational changes between distinct allostericstates.5 The network of residues, which may bethought of as transmitting signals along the mostprobable dynamical route for facilitating the func-tionally relevant structural transitions, is referred toas the allosteric wiring diagram. Structure-basedmethods are generally needed to determine theallostery wiring diagram.6 We also use a sequence-analysis-based method to extract functionallyrelated networks.7,8
The large conformational changes in the allosterictransitions make it currently impractical to usestandard molecular dynamics simulations to reliablyobtain the dynamical pathways connecting two statesin a reaction cycle. A practical method to study thedominant conformational changes between twoallosteric states is to use a normal mode analysis.9–17
The theoretical rationale for the method is basedon the assumption that a protein is normally at thefree-energy minimum in its native state with smalldeviations from the minimum. Based on thisassumption, one can build a harmonic elastic net-work using the structures of the states that arevisited during the reaction cycle of a nanomachineor an enzyme. Significant conformational changesare often associated with only a few low-frequencynormal modes. This is in accord with the expectationthat protein structures have evolved to accommo-date biologically necessary transitions as efficientlyas possible. In accord with this expectation, exam-ination of the dynamical trajectories connecting thevarious states of GroEL shows considerable plasti-city in the structural transitions.18
Normal modes are most easily calculated usingstructure-based coarse-grained models. In the usualelastic network model (ENM), a given protein struc-ture is represented using the coordinates of the Cα
atoms and the associated contact maps.19 A contactbetween two Cα atoms i and j exists if the distancebetween them is less than a cutoff value. With thisdefinition, a two-dimensional contact map can beconstructed. However, detailed analyses of proteinstructures that have been used to obtain statisticalpotentials show that besides direct interactionbetween side chains, there are substantial numbersof interactions between side chains and the back-bone atoms.20 It is likely that Cα–side chaininteractions add substantially to the dense packingof proteins. In order to take such interactions intoaccount, we propose a new and more detailed, butstill computationally tractable, ENM that includesinformation about the physical identity of eachresidue in addition to the system topology. We des-cribe each amino acid using two interaction centers,one representing the Cα atom and the other thecenter of mass of the side chain. Such Cα–side chainmodels have been profitably used in simulations ofprotein folding.21,22 In the context of the normalmode analysis, the inclusion of the side chains givesa more accurate description of the topology of theprotein and the packing within the structure. Wealso incorporate information about the chemical andphysical characteristics of the amino acids byincluding residue-specific spring constants.We use the Betancourt–Thirumalai potential23 to
scale the strength of interactions in the Cα–side chainENM. The van der Waals radii of the side chains areused as the length scale for contact distances. (Formore details, see the Methods section).We demonstrate the efficacy of the Cα–side chain
ENM by analyzing the allosteric transitions thatGroEL undergoes during its reaction cycle. Theassociated allostery wiring diagrams of GroELT→Rand R″→T transitions are constructed based on theCα–side chain ENM using the structural perturba-tion method (SPM) approach. A network of residuesinterspersed throughout the subunit and at theinterface between the adjacent subunits accounts forthe positive cooperativity in the ATP-driven T→Rtransition. Similarly, the origin of negative coopera-tivity is linked to residues that lie at the interfacebetween the equatorial domains across the two ringsas well as those that are at the interface between theequatorial domains within a ring.We also study the potential functional relation-
ships between different residues within GroEL se-quence using evolutionary data. Statistical couplinganalysis (SCA)7,8 yields a functional wiring diagramthat incorporates several ATPase rate related andsubstrate protein or GroES binding residues forGroEL. For GroES, we find a linkage between sev-
392 Allostery Wiring Diagrams of GroEL
eral GroEL binding residues and GroES/GroESinterface residues.
Results and Discussion
Allosteric states in GroEL
The chaperonin GroEL,24–27 an ATP-consumingmachine that rescues substrate proteins that areotherwise destined to aggregate, has been thor-oughly studied using both Cα28,29 and all-atom30
models. GroEL is a molecular chaperonin whosespectacular (driven by the binding of ATP, cocha-peronin GroES, and the substrate protein) allosterictransitions facilitate the folding of cytosolicproteins.1,25 The intact GroEL particle is made upof two heptameric rings stacked back to back. Eachsubunit of the GroELmolecule is a 548-residue chainthat is usually divided into the apical (residues 191–376), equatorial (1–133, 409–548), and intermediate(134–190, 377–408) domains. Figures 1a and 2aillustrate the three domains in red, green, andblue, respectively. Assembly of the machine intotwo heptameric rings creates two large inner cavitieswhere the substrate proteins are sequestered tran-siently (for a few seconds) during the reactioncycle.31 Each of the two GroEL rings undergoesthe same, but out of phase, complex allosteric cycleconsisting of a series of conformational changes bet-ween T, R, R′, and R″ states (Fig. 3). High-resolutioncrystal structures have been determined for GroELin the T and R″ states.1,32 An approximate structurefor the R state, based on cryoelectron microscopymeasurements, is also known.33 In the T state, aGroEL ring can bind various substrate proteins. ATPbinding triggers a transition to the R state. Subse-quent cochaperonin GroES binding and ATP hydro-lysis drive GroEL, via the R' state, to the R″ state. Inresponse to a signal from the opposite trans ring,GroES, ADP, and the substrate protein are releasedand the GroEL ring returns from the R″ to the Tstate. All the conformational changes are associatedwith large structural rearrangements or domainmovements that also enable structural changes inthe substrate protein and are thus essential for theproper function of the chaperonin. In particular,the change in the microenvironment that thesubstrate protein feels as the reaction cycle proceedsis intimately related to the annealing function ofGroEL.25,34 Thus, allostery and rescue of thesubstrate protein are intimately coupled.25 We usethe Cα–side chain ENM-based models in conjunc-tion with SPM to map the allostery wiring diagramsfor the various allosteric transitions.
Single-subunit T→R transition is dominated bythe lowest-energy mode
The GroEL functional cycle begins with thetransition from the T to the R state that is triggeredby ATP binding. To study the T→R transition anddetermine the key residues that support it, we
performed the normal mode analysis of the transitionusing the Cα–side chain ENM (see Methods) repre-sentations of the Protein Data Bank (PDB) structures1AON (chain H in the T state) and 2C7E (chain A inthe R state). In Fig. 4a, we plot the overlap [Eq. (2) inMethods] of each of the lowest 50 normal-modeeigenvectors associated with the transition betweenthe T and R states. The lowest-energy (nonzero)eigenmode, mode 7, has an overlap of 0.83, and thusdescribes the transition between the structuresremarkably well. The second highest overlap modeis mode 9 with a significantly lower overlap of 0.26.The overlaps of all other modes are relativelyinsignificant (Fig. 4a). Thus, the T→R transition iswell described by a single low-energy mode.Mode 7 corresponds to a counterclockwise twist
and a slight upward tilt of the apical domain withrespect to the equatorial domain with the inter-mediate domain residues acting as hinges. Figure 5ashows the amplitudes of vibration [see Eq. (3) inMethods] of all the residues in mode 7. The hingeresidues in the intermediate domain show signifi-cantly smaller fluctuations than do the residues inother domains. The highest-amplitude region corre-sponds to apical domain residues 340–370 or helicesK (339–353) and L (361–371) and the loop connectingthem.28,35 The dramatic movement of helices K andL during the R→R″ transition, which was firstidentified in a previous study,13 results in the changein the polarity of residues that line the inner cavity.The change in the microenvironment of the cavity asthe reaction cycle proceeds is the fundamentalreason that GroEL is an annealing machine.We see that in the dominant mode, the helices
undergo significant movement even prior to theR→R″ transition. The correlations between diffe-rent residues in mode 7 are shown in Fig. 6a. Theorientational cross-correlations between the fluctua-tions of residues are calculated as eiM ·eiM where eiMis the unit vector in the direction of the displacementof the ith residue in a given mode M. While thecorrelations within each domain are generally high,there are a few exceptions. In particular, the residues334–371, which include helices K and L, movetogether in a correlated fashion but are anticor-related (eiM ·eiM ≈ −1) with most of the rest of theapical domain (see Fig. 6a).
Allostery wiring diagram for the single-subunitT→R transition
The network that transmits allostery in proteins orthe allostery wiring diagram can be predicted usingthe SPM (see Methods). To the best of our knowl-edge, the wiring diagram that is specifically respon-sible for the GroEL T→R transition has not beencalculated before. According to SPM, mutations ofthe residues that are most critical to an allosterictransition (“hot-spot” residues) lead to the largestchange in significant normal modes. The responseof GroEL T-state mode 7 to local perturbations(mutations) in Fig. 5b shows that many of theresidues that show significant response to local
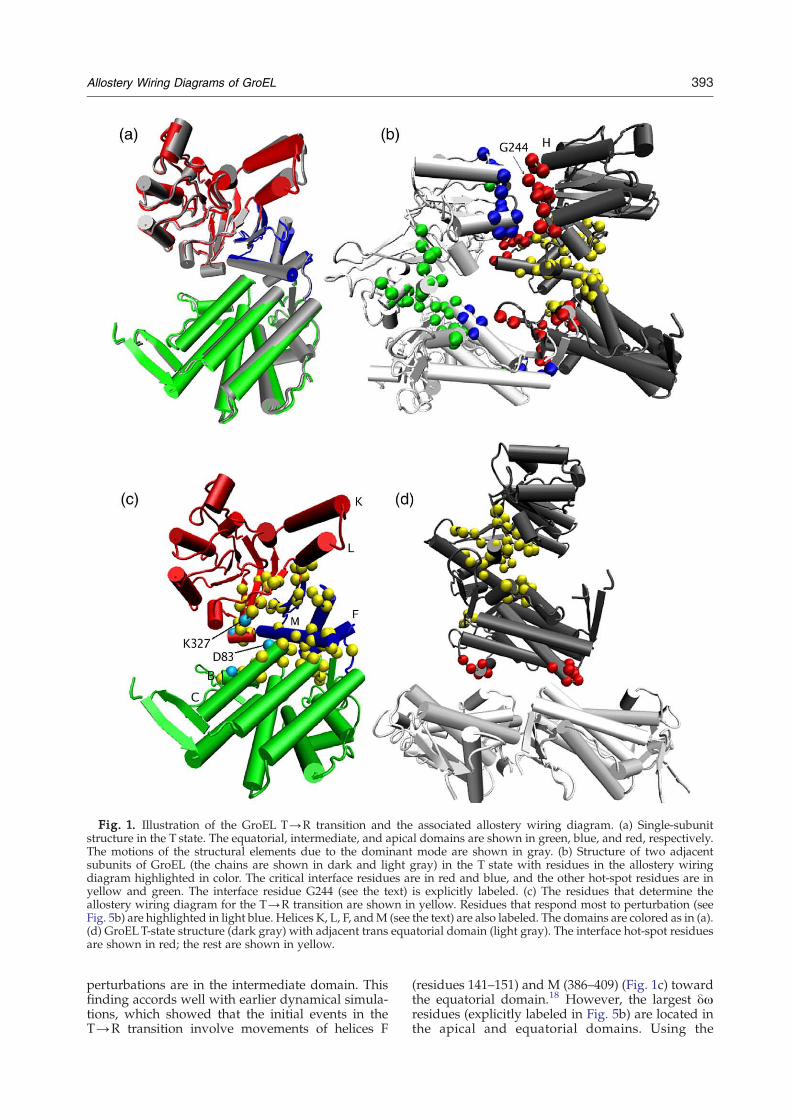
Fig. 1. Illustration of the GroEL T→R transition and the associated allostery wiring diagram. (a) Single-subunitstructure in the T state. The equatorial, intermediate, and apical domains are shown in green, blue, and red, respectively.The motions of the structural elements due to the dominant mode are shown in gray. (b) Structure of two adjacentsubunits of GroEL (the chains are shown in dark and light gray) in the T state with residues in the allostery wiringdiagram highlighted in color. The critical interface residues are in red and blue, and the other hot-spot residues are inyellow and green. The interface residue G244 (see the text) is explicitly labeled. (c) The residues that determine theallostery wiring diagram for the T→R transition are shown in yellow. Residues that respond most to perturbation (seeFig. 5b) are highlighted in light blue. Helices K, L, F, andM (see the text) are also labeled. The domains are colored as in (a).(d) GroELT-state structure (dark gray) with adjacent trans equatorial domain (light gray). The interface hot-spot residuesare shown in red; the rest are shown in yellow.
393Allostery Wiring Diagrams of GroEL
perturbations are in the intermediate domain. Thisfinding accords well with earlier dynamical simula-tions, which showed that the initial events in theT→R transition involve movements of helices F
(residues 141–151) and M (386–409) (Fig. 1c) towardthe equatorial domain.18 However, the largest δωresidues (explicitly labeled in Fig. 5b) are located inthe apical and equatorial domains. Using the
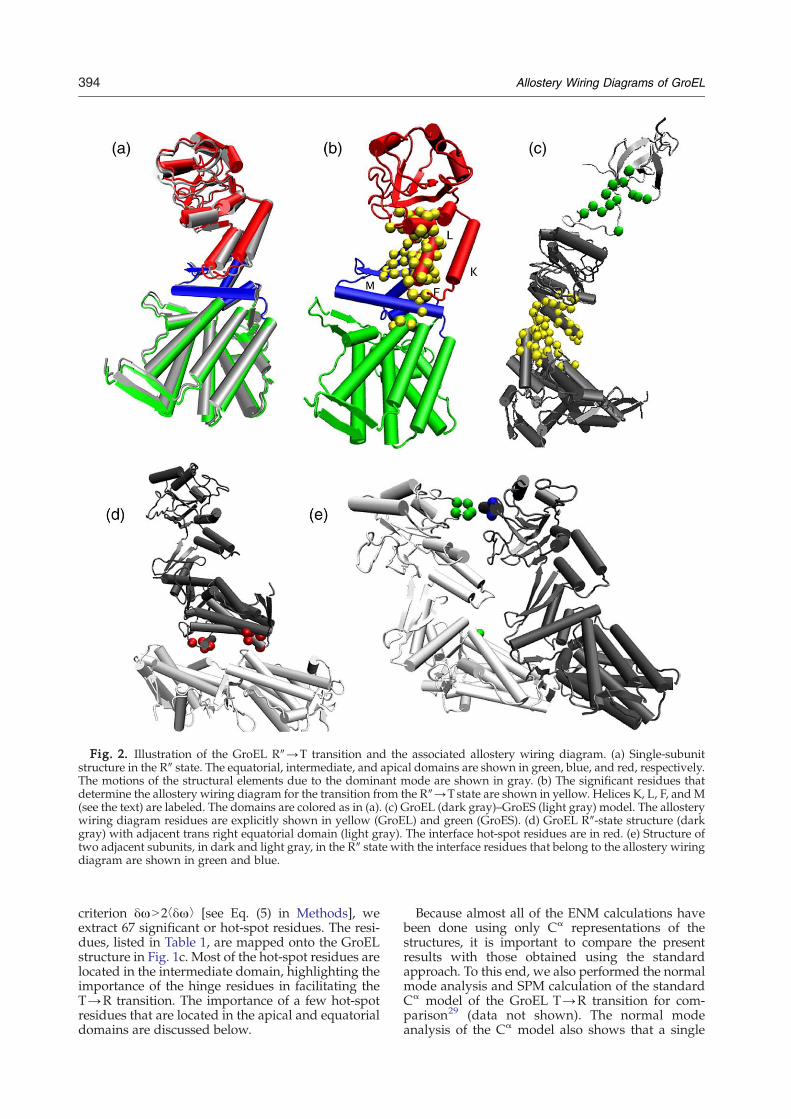
Fig. 2. Illustration of the GroEL R″→T transition and the associated allostery wiring diagram. (a) Single-subunitstructure in the R″ state. The equatorial, intermediate, and apical domains are shown in green, blue, and red, respectively.The motions of the structural elements due to the dominant mode are shown in gray. (b) The significant residues thatdetermine the allostery wiring diagram for the transition from the R″→T state are shown in yellow. Helices K, L, F, andM(see the text) are labeled. The domains are colored as in (a). (c) GroEL (dark gray)–GroES (light gray) model. The allosterywiring diagram residues are explicitly shown in yellow (GroEL) and green (GroES). (d) GroEL R″-state structure (darkgray) with adjacent trans right equatorial domain (light gray). The interface hot-spot residues are in red. (e) Structure oftwo adjacent subunits, in dark and light gray, in the R″ state with the interface residues that belong to the allostery wiringdiagram are shown in green and blue.
394 Allostery Wiring Diagrams of GroEL
criterion δωN2⟨δω⟩ [see Eq. (5) in Methods], weextract 67 significant or hot-spot residues. The resi-dues, listed in Table 1, are mapped onto the GroELstructure in Fig. 1c. Most of the hot-spot residues arelocated in the intermediate domain, highlighting theimportance of the hinge residues in facilitating theT→R transition. The importance of a few hot-spotresidues that are located in the apical and equatorialdomains are discussed below.
Because almost all of the ENM calculations havebeen done using only Cα representations of thestructures, it is important to compare the presentresults with those obtained using the standardapproach. To this end, we also performed the normalmode analysis and SPM calculation of the standardCα model of the GroEL T→R transition for com-parison29 (data not shown). The normal modeanalysis of the Cα model also shows that a single
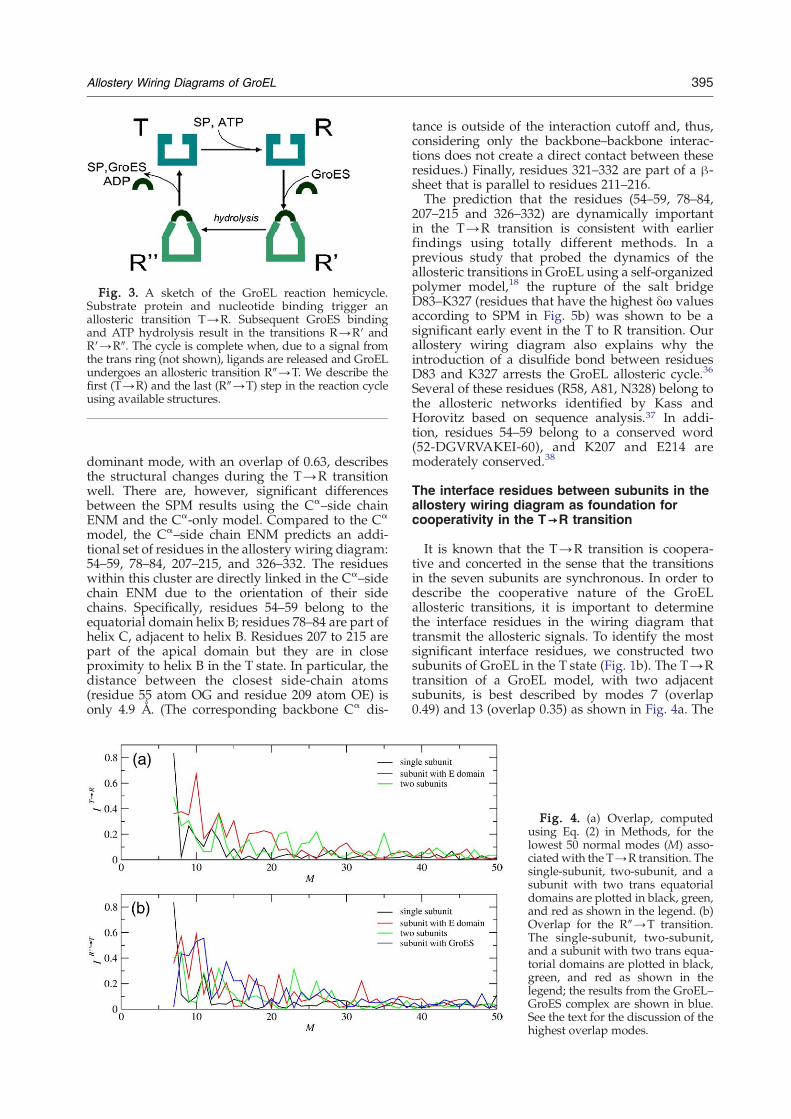
Fig. 3. A sketch of the GroEL reaction hemicycle.Substrate protein and nucleotide binding trigger anallosteric transition T→R. Subsequent GroES bindingand ATP hydrolysis result in the transitions R→R′ andR′→R″. The cycle is complete when, due to a signal fromthe trans ring (not shown), ligands are released and GroELundergoes an allosteric transition R″→T. We describe thefirst (T→R) and the last (R″→T) step in the reaction cycleusing available structures.
395Allostery Wiring Diagrams of GroEL
dominant mode, with an overlap of 0.63, describesthe structural changes during the T→R transitionwell. There are, however, significant differencesbetween the SPM results using the Cα–side chainENM and the Cα-only model. Compared to the Cα
model, the Cα–side chain ENM predicts an addi-tional set of residues in the allostery wiring diagram:54–59, 78–84, 207–215, and 326–332. The residueswithin this cluster are directly linked in the Cα–sidechain ENM due to the orientation of their sidechains. Specifically, residues 54–59 belong to theequatorial domain helix B; residues 78–84 are part ofhelix C, adjacent to helix B. Residues 207 to 215 arepart of the apical domain but they are in closeproximity to helix B in the T state. In particular, thedistance between the closest side-chain atoms(residue 55 atom OG and residue 209 atom OE) isonly 4.9 Ǻ. (The corresponding backbone Cα dis-
tance is outside of the interaction cutoff and, thus,considering only the backbone–backbone interac-tions does not create a direct contact between theseresidues.) Finally, residues 321–332 are part of a β-sheet that is parallel to residues 211–216.The prediction that the residues (54–59, 78–84,
207–215 and 326–332) are dynamically importantin the T→R transition is consistent with earlierfindings using totally different methods. In aprevious study that probed the dynamics of theallosteric transitions in GroEL using a self-organizedpolymer model,18 the rupture of the salt bridgeD83–K327 (residues that have the highest δω valuesaccording to SPM in Fig. 5b) was shown to be asignificant early event in the T to R transition. Ourallostery wiring diagram also explains why theintroduction of a disulfide bond between residuesD83 and K327 arrests the GroEL allosteric cycle.36
Several of these residues (R58, A81, N328) belong tothe allosteric networks identified by Kass andHorovitz based on sequence analysis.37 In addi-tion, residues 54–59 belong to a conserved word(52-DGVRVAKEI-60), and K207 and E214 aremoderately conserved.38
The interface residues between subunits in theallostery wiring diagram as foundation forcooperativity in the T→R transition
It is known that the T→R transition is coopera-tive and concerted in the sense that the transitionsin the seven subunits are synchronous. In order todescribe the cooperative nature of the GroELallosteric transitions, it is important to determinethe interface residues in the wiring diagram thattransmit the allosteric signals. To identify the mostsignificant interface residues, we constructed twosubunits of GroEL in the T state (Fig. 1b). The T→Rtransition of a GroEL model, with two adjacentsubunits, is best described by modes 7 (overlap0.49) and 13 (overlap 0.35) as shown in Fig. 4a. The
Fig. 4. (a) Overlap, computedusing Eq. (2) in Methods, for thelowest 50 normal modes (M) asso-ciatedwith the T→R transition. Thesingle-subunit, two-subunit, and asubunit with two trans equatorialdomains are plotted in black, green,and red as shown in the legend. (b)Overlap for the R″→T transition.The single-subunit, two-subunit,and a subunit with two trans equa-torial domains are plotted in black,green, and red as shown in thelegend; the results from the GroEL–GroES complex are shown in blue.See the text for the discussion of thehighest overlap modes.
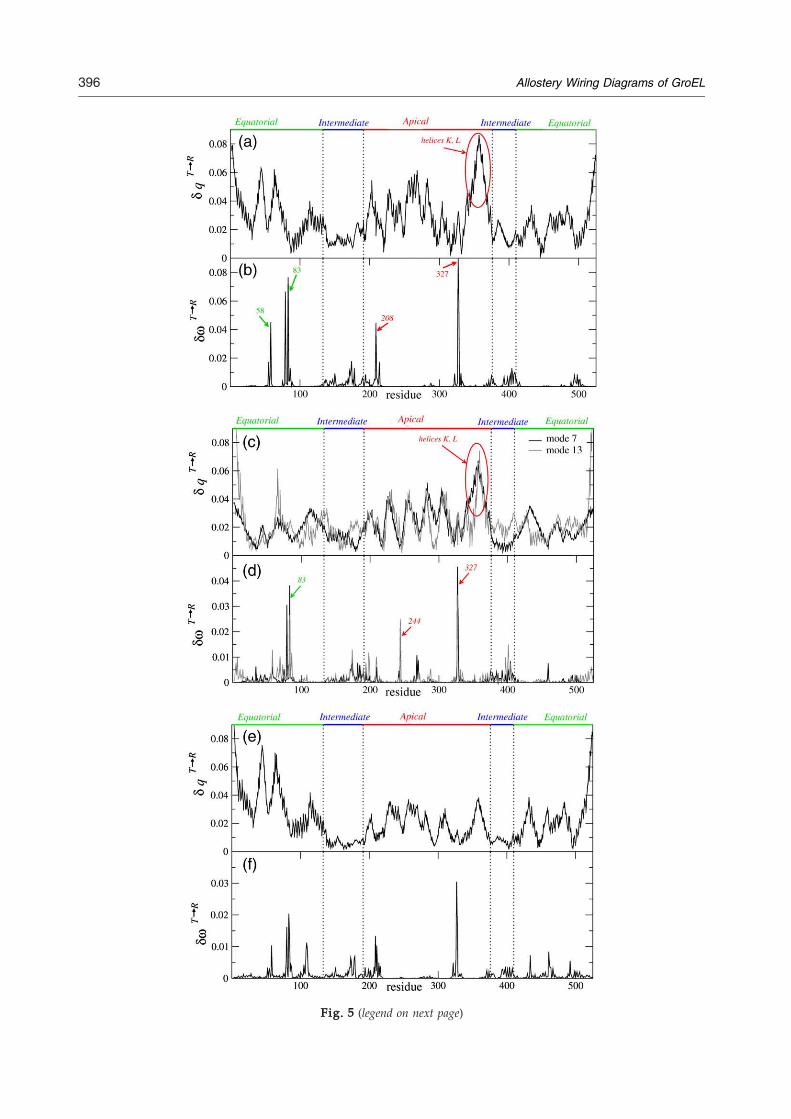
Fig. 5 (legend on next page)
396 Allostery Wiring Diagrams of GroEL
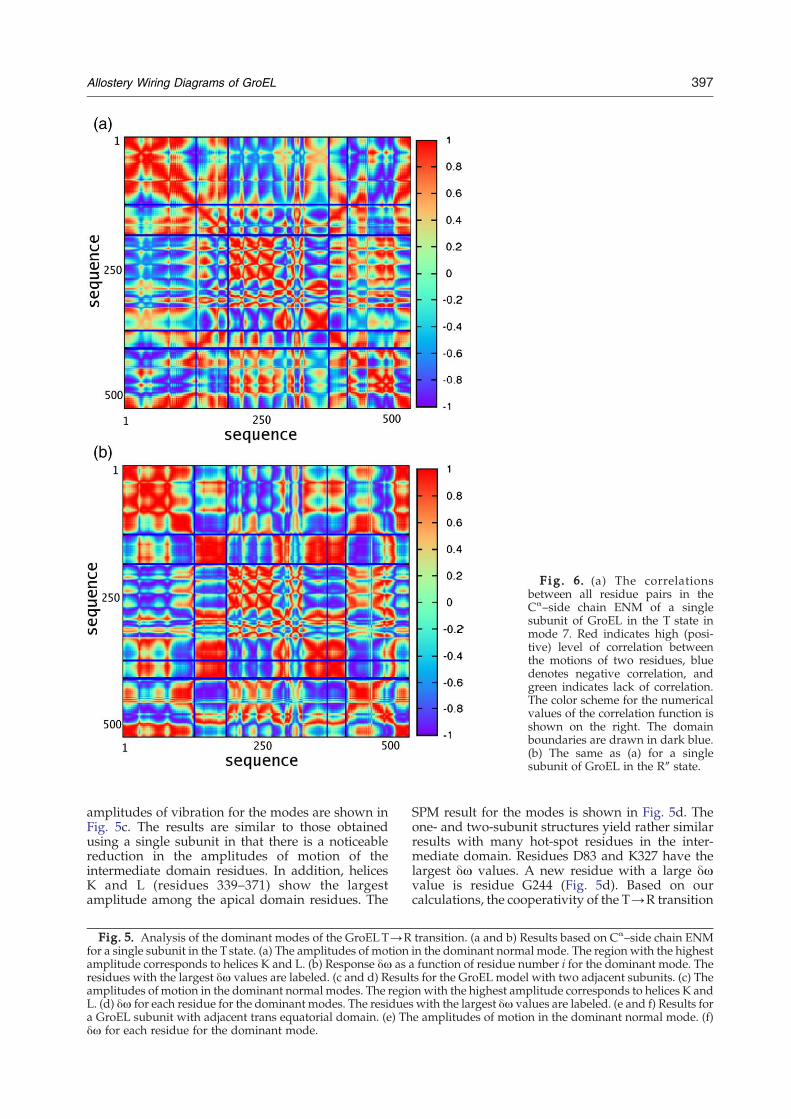
Fig. 6. (a) The correlationsbetween all residue pairs in theCα–side chain ENM of a singlesubunit of GroEL in the T state inmode 7. Red indicates high (posi-tive) level of correlation betweenthe motions of two residues, bluedenotes negative correlation, andgreen indicates lack of correlation.The color scheme for the numericalvalues of the correlation function isshown on the right. The domainboundaries are drawn in dark blue.(b) The same as (a) for a singlesubunit of GroEL in the R″ state.
397Allostery Wiring Diagrams of GroEL
amplitudes of vibration for the modes are shown inFig. 5c. The results are similar to those obtainedusing a single subunit in that there is a noticeablereduction in the amplitudes of motion of theintermediate domain residues. In addition, helicesK and L (residues 339–371) show the largestamplitude among the apical domain residues. The
Fig. 5. Analysis of the dominant modes of the GroELT→Rfor a single subunit in the T state. (a) The amplitudes of motionamplitude corresponds to helices K and L. (b) Response δω asresidues with the largest δω values are labeled. (c and d) Resulamplitudes of motion in the dominant normal modes. The regioL. (d) δω for each residue for the dominant modes. The residuea GroEL subunit with adjacent trans equatorial domain. (e) Thδω for each residue for the dominant mode.
SPM result for the modes is shown in Fig. 5d. Theone- and two-subunit structures yield rather similarresults with many hot-spot residues in the inter-mediate domain. Residues D83 and K327 have thelargest δω values. A new residue with a large δωvalue is residue G244 (Fig. 5d). Based on ourcalculations, the cooperativity of the T→R transition
transition. (a and b) Results based on Cα–side chain ENMin the dominant normal mode. The region with the highesta function of residue number i for the dominant mode. Thets for the GroEL model with two adjacent subunits. (c) Then with the highest amplitude corresponds to helices K ands with the largest δω values are labeled. (e and f) Results fore amplitudes of motion in the dominant normal mode. (f)
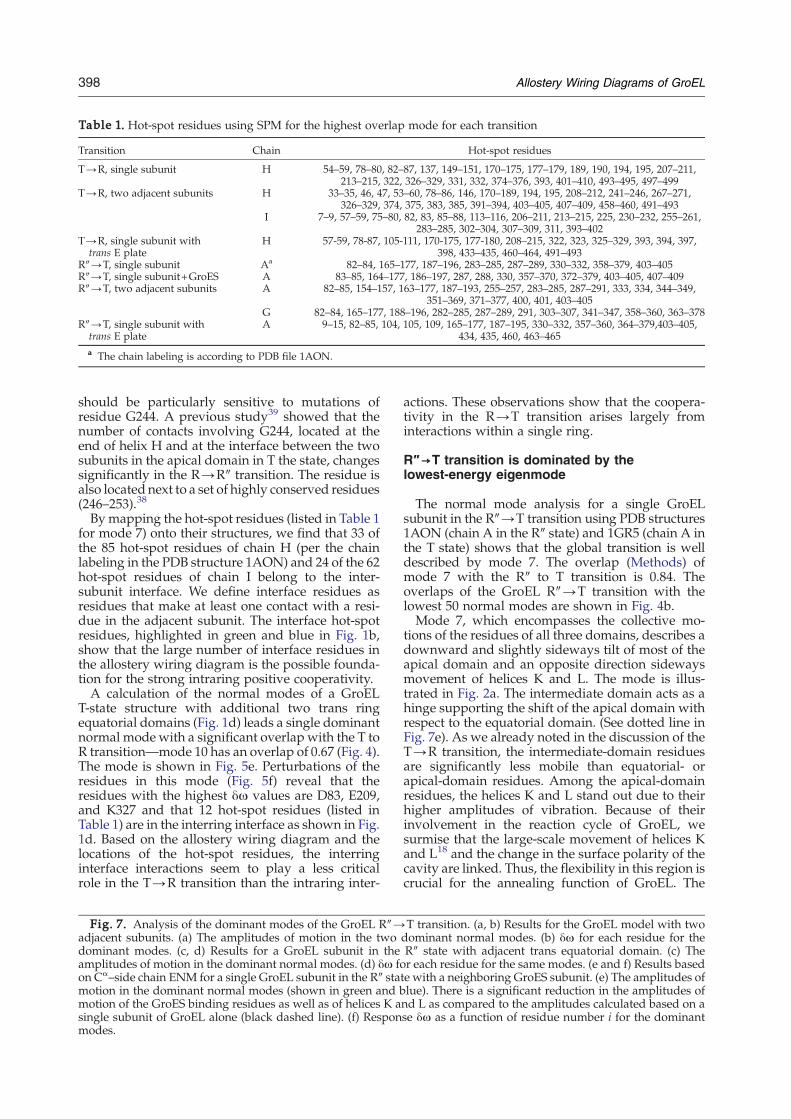
Table 1. Hot-spot residues using SPM for the highest overlap mode for each transition
Transition Chain Hot-spot residues
T→R, single subunit H 54–59, 78–80, 82–87, 137, 149–151, 170–175, 177–179, 189, 190, 194, 195, 207–211,213–215, 322, 326–329, 331, 332, 374–376, 393, 401–410, 493–495, 497–499
T→R, two adjacent subunits H 33–35, 46, 47, 53–60, 78–86, 146, 170–189, 194, 195, 208–212, 241–246, 267–271,326–329, 374, 375, 383, 385, 391–394, 403–405, 407–409, 458–460, 491–493
I 7–9, 57–59, 75–80, 82, 83, 85–88, 113–116, 206–211, 213–215, 225, 230–232, 255–261,283–285, 302–304, 307–309, 311, 393–402
T→R, single subunit withtrans E plate
H 57-59, 78-87, 105-111, 170-175, 177-180, 208–215, 322, 323, 325–329, 393, 394, 397,398, 433–435, 460–464, 491–493
R″→T, single subunit Aa 82–84, 165–177, 187–196, 283–285, 287–289, 330–332, 358–379, 403–405R″→T, single subunit+GroES A 83–85, 164–177, 186–197, 287, 288, 330, 357–370, 372–379, 403–405, 407–409R″→T, two adjacent subunits A 82–85, 154–157, 163–177, 187–193, 255–257, 283–285, 287–291, 333, 334, 344–349,
351–369, 371–377, 400, 401, 403–405G 82–84, 165–177, 188–196, 282–285, 287–289, 291, 303–307, 341–347, 358–360, 363–378
R″→T, single subunit withtrans E plate
A 9–15, 82–85, 104, 105, 109, 165–177, 187–195, 330–332, 357–360, 364–379,403–405,434, 435, 460, 463–465
a The chain labeling is according to PDB file 1AON.
398 Allostery Wiring Diagrams of GroEL
should be particularly sensitive to mutations ofresidue G244. A previous study39 showed that thenumber of contacts involving G244, located at theend of helix H and at the interface between the twosubunits in the apical domain in T the state, changessignificantly in the R→R″ transition. The residue isalso located next to a set of highly conserved residues(246–253).38
By mapping the hot-spot residues (listed in Table 1for mode 7) onto their structures, we find that 33 ofthe 85 hot-spot residues of chain H (per the chainlabeling in the PDB structure 1AON) and 24 of the 62hot-spot residues of chain I belong to the inter-subunit interface. We define interface residues asresidues that make at least one contact with a resi-due in the adjacent subunit. The interface hot-spotresidues, highlighted in green and blue in Fig. 1b,show that the large number of interface residues inthe allostery wiring diagram is the possible founda-tion for the strong intraring positive cooperativity.A calculation of the normal modes of a GroEL
T-state structure with additional two trans ringequatorial domains (Fig. 1d) leads a single dominantnormal mode with a significant overlap with the T toR transition—mode 10 has an overlap of 0.67 (Fig. 4).The mode is shown in Fig. 5e. Perturbations of theresidues in this mode (Fig. 5f) reveal that theresidues with the highest δω values are D83, E209,and K327 and that 12 hot-spot residues (listed inTable 1) are in the interring interface as shown in Fig.1d. Based on the allostery wiring diagram and thelocations of the hot-spot residues, the interringinterface interactions seem to play a less criticalrole in the T→R transition than the intraring inter-
Fig. 7. Analysis of the dominant modes of the GroEL R″→adjacent subunits. (a) The amplitudes of motion in the twodominant modes. (c, d) Results for a GroEL subunit in theamplitudes of motion in the dominant normal modes. (d) δω foon Cα–side chain ENM for a single GroEL subunit in the R″ stamotion in the dominant normal modes (shown in green and bmotion of the GroES binding residues as well as of helices K asingle subunit of GroEL alone (black dashed line). (f) Responmodes.
actions. These observations show that the coopera-tivity in the R→T transition arises largely frominteractions within a single ring.
R″→T transition is dominated by thelowest-energy eigenmode
The normal mode analysis for a single GroELsubunit in the R″→T transition using PDB structures1AON (chain A in the R″ state) and 1GR5 (chain A inthe T state) shows that the global transition is welldescribed by mode 7. The overlap (Methods) ofmode 7 with the R″ to T transition is 0.84. Theoverlaps of the GroEL R″→T transition with thelowest 50 normal modes are shown in Fig. 4b.Mode 7, which encompasses the collective mo-
tions of the residues of all three domains, describes adownward and slightly sideways tilt of most of theapical domain and an opposite direction sidewaysmovement of helices K and L. The mode is illus-trated in Fig. 2a. The intermediate domain acts as ahinge supporting the shift of the apical domain withrespect to the equatorial domain. (See dotted line inFig. 7e). As we already noted in the discussion of theT→R transition, the intermediate-domain residuesare significantly less mobile than equatorial- orapical-domain residues. Among the apical-domainresidues, the helices K and L stand out due to theirhigher amplitudes of vibration. Because of theirinvolvement in the reaction cycle of GroEL, wesurmise that the large-scale movement of helices Kand L18 and the change in the surface polarity of thecavity are linked. Thus, the flexibility in this region iscrucial for the annealing function of GroEL. The
T transition. (a, b) Results for the GroEL model with twodominant normal modes. (b) δω for each residue for theR″ state with adjacent trans equatorial domain. (c) Ther each residue for the same modes. (e and f) Results basedte with a neighboring GroES subunit. (e) The amplitudes oflue). There is a significant reduction in the amplitudes ofnd L as compared to the amplitudes calculated based on ase δω as a function of residue number i for the dominant
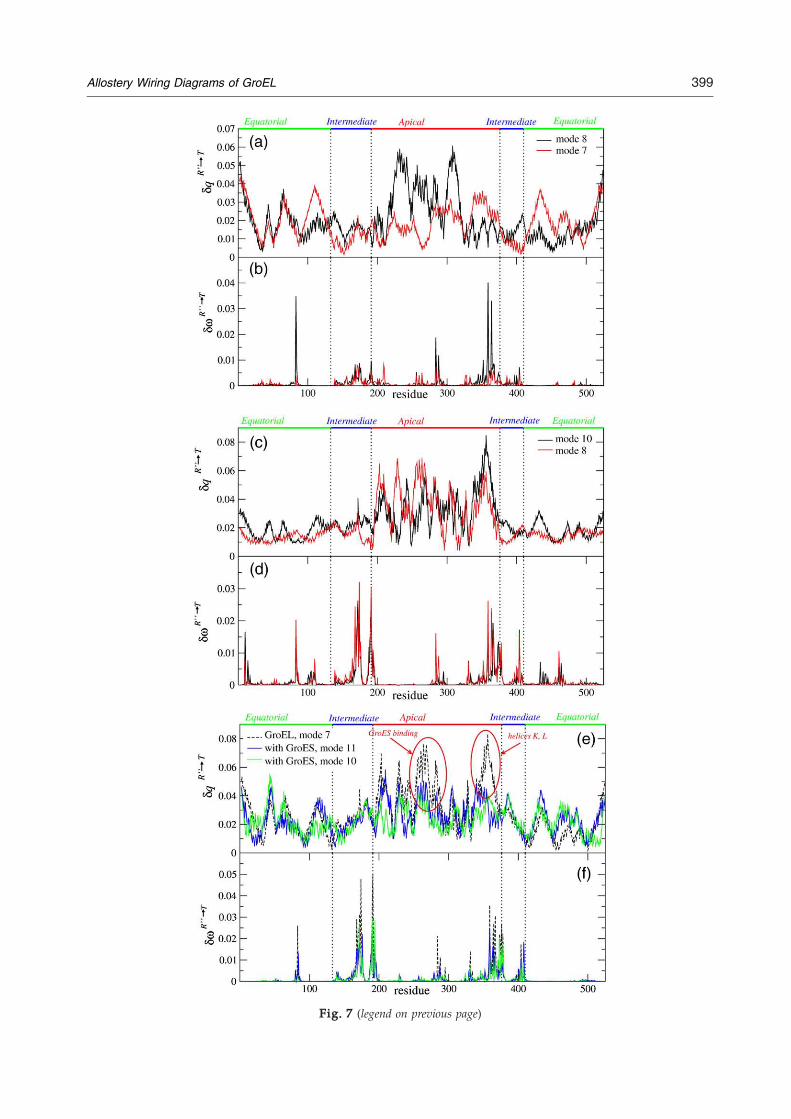
Fig. 7 (legend on previous page)
399Allostery Wiring Diagrams of GroEL
400 Allostery Wiring Diagrams of GroEL
correlations between the motions of residues inmode 7 are shown in Fig. 6b. The amount of cor-relation within each domain is striking. The notableexceptions are helices K and L that are correlatedwith the adjacent intermediate-domain residuesrather than the other apical-domain residues.The response of mode 7 to perturbations (dotted
line in Fig. 7f) identifies 61 residues as part of theallostery wiring diagram. Most of the hot-spotresidues are located in the intermediate domain. Afew of the residues are located in the equatorial orapical domains, especially in helix L, which, asnoted earlier, moves opposite to the direction ofmost of the apical domain. The locations of the hot-spot residues, listed in Table 1, are also shown on theGroEL R″-state structure in Fig. 2b. The residueswith the highest δω values are D83, V174, E191, andD359, and we therefore expect that the R″→Ttransition is most sensitive to mutations of theseresidues. Of those residues, D359 is moderatelyconserved, D83 is highly conserved, and E191 is atthe beginning of a conserved word.38 The relevanceof E191 is supported by earlier experiments thatshowed that the mutation E191G inhibits GroELfunctionality.40
GroES plays a passive role in the R″→Ttransition
In the R″ state, the GroEL apical domain is cappedby GroES. To determine how the presence ofGroES affects the normal modes and influences theallostery, we performed a normal mode analysis ofthe GroEL–GroES complex, illustrated in Fig. 2c. Inthe presence of GroES, the R″→T transition is nolonger described by a single normal mode. Instead,mode 11 gives an overlap of 0.56 and mode 10 anoverlap of 0.53 with the transition (Fig. 4b). Bothmodes describe a tilt of the apical domain towardthe equatorial domain, as discussed in the previoussection. The amplitudes of motion of all the GroELresidues in both of the modes (Fig. 7e) reveal tworegions where the presence of GroES suppressesGroEL residue fluctuations. First, many apicaldomain residues between 225 and 275 are part ofthe GroES binding region and the reduction in theirvibration amplitudes is not unexpected. However,the second region (residues 350–365) spans the re-gion associated with helices K and L and the loopconnecting them, and is not in direct contact withGroES. We had already noted that many of theresidues in this region were hot-spot residues thatare linked to the annealing function of GroEL. Wefind the plausible signaling pathway linking GroESbinding residues and helices K and L remarkable.Experiments have shown that the GroEL mutantD361K lacks the ability to bind GroES.41 Ourcalculations suggest that the residues 350–365 arealso allosterically linked to GroES binding residues,and mutations of several of those residues couldchange the affinity of GroEL for GroES.From the SPM analysis of the GroEL–GroES
structure (Fig. 7f), the residues with large δω or
hot-spot residues were identified (see Table 1). Theresidues with the highest δω values are either at ornear positions D83, V174, E191, and D359. Remark-ably, there are no hot-spot residues among theGroES binding residues, highlighting the passiverole of GroES in the R″→T transition. We predictthat mutations of the GroES binding residues shouldhave a minimal effect on the GroEL R″→T transi-tion, which involves release of GroES and ADP.In addition, we also found the wiring diagram of
GroES that corresponds to the normal mode 11 ofthe GroEL–GroES complex. The locations of GroEShot-spot residues are shown in Fig. 2c. Kass andHorovitz,37 using correlated mutations in GroELand GroES, found networks where mutations ofcochaperonin residues were statistically linked tomutations of chaperonin residues. They identifiedGroES residues S21, L27, S35, and Y71 as beingrelevant (Table 2 of Ref. 37). We find that GroESresidues S21 and S35 are indeed hot-spot residues.Also, residues 68–70, which neighbor residue Y71,are hot-spot residues. Surprisingly, none of theGroES hot-spot residues belong to the GroELbinding motif,42 which is perhaps related to thefunctional proximity of the requirement that theGroEL binding should be promiscuous. Bioinfor-matic analysis39 has also determined that, with theexception of G24, none of the GroES mobile loop(binding) residues were conserved.
Allostery wiring diagram that transmits thesignal from the trans ring
The GroEL cis ring transition from R″ to T state istriggered by a signal from the trans ring.25 Wetherefore calculated the normal modes of the GroELR″-state structure together with two trans ringequatorial domains as illustrated in Fig. 2d. Forthis system, modes 10 (overlap 0.59) and 8 (overlap0.57) describe the R″→T transition most accurately.Inclusion of the trans ring equatorial domain signi-ficantly reduced the amplitudes of vibration of theadjacent cis equatorial domain (Fig. 7c). In addition,the exact motion of residues of helices K and L (inmode 10) and GroES binding region (mode 8) arealso reduced. These findings again highlight theallosteric connections between these residues.The inclusion of the trans ring has allowed us to
find several new hot-spot residues in the equatorialdomain that trigger intraring communication. The20 residues, obtained using SPM at the interringinterface, are 9–15, 104, 105, 109–111, 434, 435, and460–465. The relatively large number of criticalinterring interface residues highlights the impor-tance of the interface between the rings, and hencethe role of the trans ring on the R″→T transition.This is in sharp contrast to the lack of GroES inter-face residues among hot-spot residues for the R″→Ttransition or the smaller number of trans ringinterface residues in the T→R transition. These ob-servations show that the signal from the trans ring,resulting in negative cooperativity, arises almostexclusively from interactions across equatorial
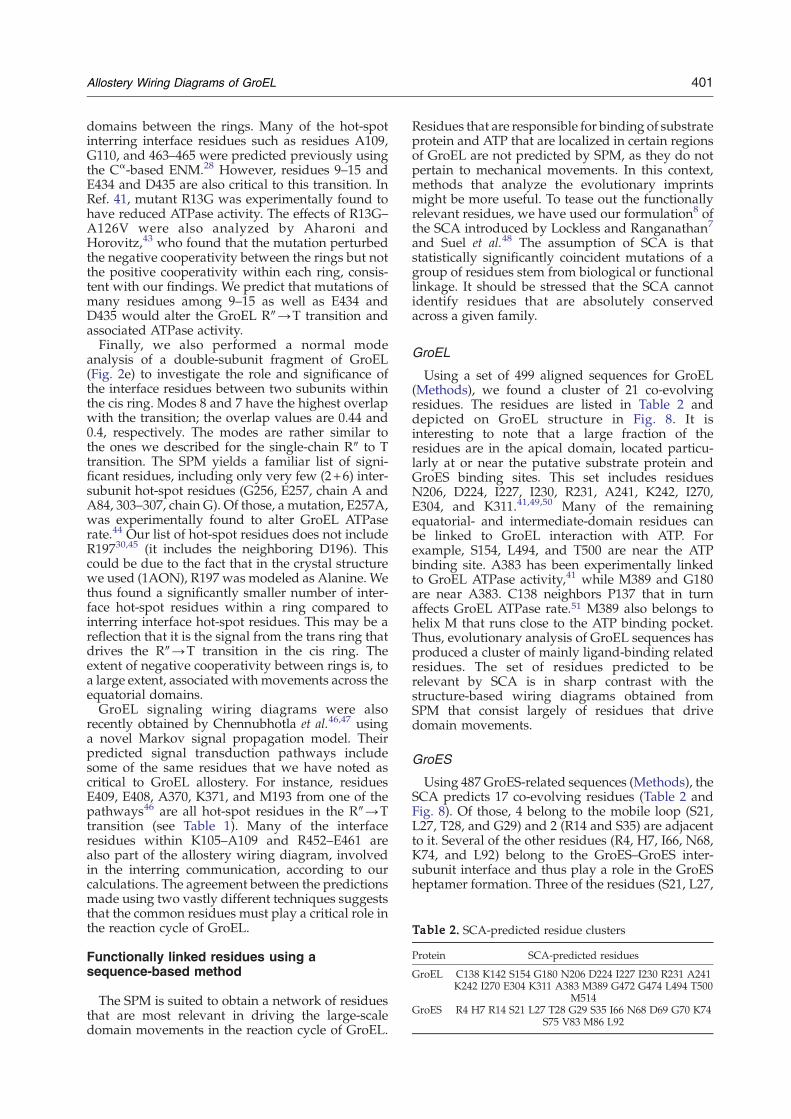
Table 2. SCA-predicted residue clusters
Protein SCA-predicted residues
GroEL C138 K142 S154 G180 N206 D224 I227 I230 R231 A241K242 I270 E304 K311 A383 M389 G472 G474 L494 T500
M514GroES R4 H7 R14 S21 L27 T28 G29 S35 I66 N68 D69 G70 K74
S75 V83 M86 L92
401Allostery Wiring Diagrams of GroEL
domains between the rings. Many of the hot-spotinterring interface residues such as residues A109,G110, and 463–465 were predicted previously usingthe Cα-based ENM.28 However, residues 9–15 andE434 and D435 are also critical to this transition. InRef. 41, mutant R13G was experimentally found tohave reduced ATPase activity. The effects of R13G–A126V were also analyzed by Aharoni andHorovitz,43 who found that the mutation perturbedthe negative cooperativity between the rings but notthe positive cooperativity within each ring, consis-tent with our findings. We predict that mutations ofmany residues among 9–15 as well as E434 andD435 would alter the GroEL R″→T transition andassociated ATPase activity.Finally, we also performed a normal mode
analysis of a double-subunit fragment of GroEL(Fig. 2e) to investigate the role and significance ofthe interface residues between two subunits withinthe cis ring. Modes 8 and 7 have the highest overlapwith the transition; the overlap values are 0.44 and0.4, respectively. The modes are rather similar tothe ones we described for the single-chain R″ to Ttransition. The SPM yields a familiar list of signi-ficant residues, including only very few (2+6) inter-subunit hot-spot residues (G256, E257, chain A andA84, 303–307, chain G). Of those, a mutation, E257A,was experimentally found to alter GroEL ATPaserate.44 Our list of hot-spot residues does not includeR19730,45 (it includes the neighboring D196). Thiscould be due to the fact that in the crystal structurewe used (1AON), R197 was modeled as Alanine. Wethus found a significantly smaller number of inter-face hot-spot residues within a ring compared tointerring interface hot-spot residues. This may be areflection that it is the signal from the trans ring thatdrives the R″→T transition in the cis ring. Theextent of negative cooperativity between rings is, toa large extent, associated with movements across theequatorial domains.GroEL signaling wiring diagrams were also
recently obtained by Chennubhotla et al.46,47 usinga novel Markov signal propagation model. Theirpredicted signal transduction pathways includesome of the same residues that we have noted ascritical to GroEL allostery. For instance, residuesE409, E408, A370, K371, and M193 from one of thepathways46 are all hot-spot residues in the R″→Ttransition (see Table 1). Many of the interfaceresidues within K105–A109 and R452–E461 arealso part of the allostery wiring diagram, involvedin the interring communication, according to ourcalculations. The agreement between the predictionsmade using two vastly different techniques suggeststhat the common residues must play a critical role inthe reaction cycle of GroEL.
Functionally linked residues using asequence-based method
The SPM is suited to obtain a network of residuesthat are most relevant in driving the large-scaledomain movements in the reaction cycle of GroEL.
Residues that are responsible for binding of substrateprotein and ATP that are localized in certain regionsof GroEL are not predicted by SPM, as they do notpertain to mechanical movements. In this context,methods that analyze the evolutionary imprintsmight be more useful. To tease out the functionallyrelevant residues, we have used our formulation8 ofthe SCA introduced by Lockless and Ranganathan7
and Suel et al.48 The assumption of SCA is thatstatistically significantly coincident mutations of agroup of residues stem from biological or functionallinkage. It should be stressed that the SCA cannotidentify residues that are absolutely conservedacross a given family.
GroEL
Using a set of 499 aligned sequences for GroEL(Methods), we found a cluster of 21 co-evolvingresidues. The residues are listed in Table 2 anddepicted on GroEL structure in Fig. 8. It isinteresting to note that a large fraction of theresidues are in the apical domain, located particu-larly at or near the putative substrate protein andGroES binding sites. This set includes residuesN206, D224, I227, I230, R231, A241, K242, I270,E304, and K311.41,49,50 Many of the remainingequatorial- and intermediate-domain residues canbe linked to GroEL interaction with ATP. Forexample, S154, L494, and T500 are near the ATPbinding site. A383 has been experimentally linkedto GroEL ATPase activity,41 while M389 and G180are near A383. C138 neighbors P137 that in turnaffects GroEL ATPase rate.51 M389 also belongs tohelix M that runs close to the ATP binding pocket.Thus, evolutionary analysis of GroEL sequences hasproduced a cluster of mainly ligand-binding relatedresidues. The set of residues predicted to berelevant by SCA is in sharp contrast with thestructure-based wiring diagrams obtained fromSPM that consist largely of residues that drivedomain movements.
GroES
Using 487 GroES-related sequences (Methods), theSCA predicts 17 co-evolving residues (Table 2 andFig. 8). Of those, 4 belong to the mobile loop (S21,L27, T28, and G29) and 2 (R14 and S35) are adjacentto it. Several of the other residues (R4, H7, I66, N68,K74, and L92) belong to the GroES–GroES inter-subunit interface and thus play a role in the GroESheptamer formation. Three of the residues (S21, L27,
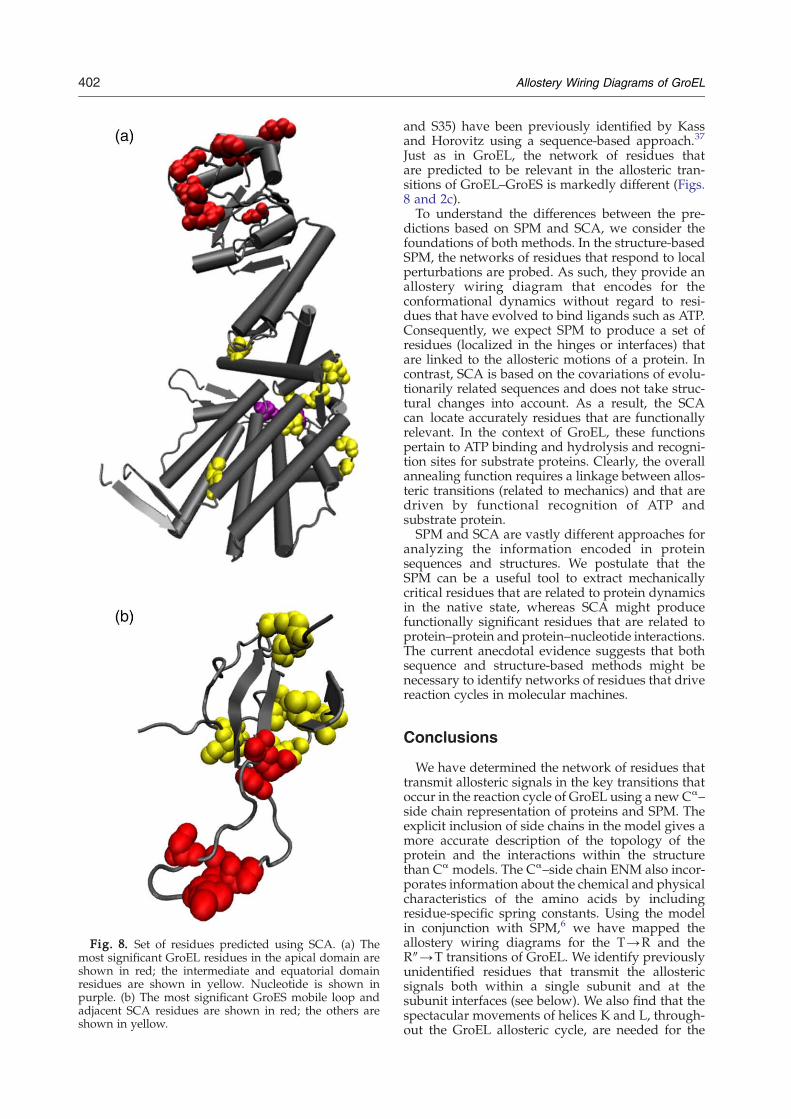
Fig. 8. Set of residues predicted using SCA. (a) Themost significant GroEL residues in the apical domain areshown in red; the intermediate and equatorial domainresidues are shown in yellow. Nucleotide is shown inpurple. (b) The most significant GroES mobile loop andadjacent SCA residues are shown in red; the others areshown in yellow.
402 Allostery Wiring Diagrams of GroEL
and S35) have been previously identified by Kassand Horovitz using a sequence-based approach.37
Just as in GroEL, the network of residues thatare predicted to be relevant in the allosteric tran-sitions of GroEL–GroES is markedly different (Figs.8 and 2c).To understand the differences between the pre-
dictions based on SPM and SCA, we consider thefoundations of both methods. In the structure-basedSPM, the networks of residues that respond to localperturbations are probed. As such, they provide anallostery wiring diagram that encodes for theconformational dynamics without regard to resi-dues that have evolved to bind ligands such as ATP.Consequently, we expect SPM to produce a set ofresidues (localized in the hinges or interfaces) thatare linked to the allosteric motions of a protein. Incontrast, SCA is based on the covariations of evolu-tionarily related sequences and does not take struc-tural changes into account. As a result, the SCAcan locate accurately residues that are functionallyrelevant. In the context of GroEL, these functionspertain to ATP binding and hydrolysis and recogni-tion sites for substrate proteins. Clearly, the overallannealing function requires a linkage between allos-teric transitions (related to mechanics) and that aredriven by functional recognition of ATP andsubstrate protein.SPM and SCA are vastly different approaches for
analyzing the information encoded in proteinsequences and structures. We postulate that theSPM can be a useful tool to extract mechanicallycritical residues that are related to protein dynamicsin the native state, whereas SCA might producefunctionally significant residues that are related toprotein–protein and protein–nucleotide interactions.The current anecdotal evidence suggests that bothsequence and structure-based methods might benecessary to identify networks of residues that drivereaction cycles in molecular machines.
Conclusions
We have determined the network of residues thattransmit allosteric signals in the key transitions thatoccur in the reaction cycle of GroEL using a new Cα–side chain representation of proteins and SPM. Theexplicit inclusion of side chains in the model gives amore accurate description of the topology of theprotein and the interactions within the structurethan Cα models. The Cα–side chain ENM also incor-porates information about the chemical and physicalcharacteristics of the amino acids by includingresidue-specific spring constants. Using the modelin conjunction with SPM,6 we have mapped theallostery wiring diagrams for the T→R and theR″→T transitions of GroEL. We identify previouslyunidentified residues that transmit the allostericsignals both within a single subunit and at thesubunit interfaces (see below). We also find that thespectacular movements of helices K and L, through-out the GroEL allosteric cycle, are needed for the
403Allostery Wiring Diagrams of GroEL
alterations in the polarity of the cavity. During theT→R and R″→T transitions, the K and L helicesmove in a concerted manner, but are always anti-correlated to the other apical domain residues. Thecoordinated movement of helices K and L, whichwas previously linked to the switch of the polarity ofthe GroEL cavity during the R→R″ transition,18 iscrucial for the annealing function of GroEL.The allostery wiring diagram for the T→R
transition is predominantly localized in the inter-mediate domain hinge. In addition, a few apical andequatorial domain residues, including R58, D83,E209, and K327, also play a crucial role. The chargedK327 is particularly critical to the T→R transition. Itfollows that mutations of any the residues in thewiring diagram or creation of disulfide bonds bet-ween them (including D83–K327)36 should mea-surably change the GroEL T→R transition.The origin of intraring cooperativity is dictated by
residues at the interface of two adjacent subunits.We find a large number of intraring interface resi-dues in the wiring diagram, providing amicroscopicfoundation for the origin of the intraring positivecooperativity. In particular, G244 is critical to theconcerted transition. Relatively few interring inter-face residues are important to the T→R transition,in sharp contrast to the allostery wiring diagram ofthe R″→T transition (see below), which highlightsthat intraring interactions, and not interring inter-actions, determine the positive cooperativity withina ring.The R″→T transition is supported by an allostery
wiring diagram that also consists of a large numberof intermediate domain hinge residues and a fewresidues in the apical and equatorial domains (Fig.2b and Table 1). We find the R″→T transition isparticularly sensitive to mutations of residues D83,V174, E191, and D359, and hence mutations of theseresidues should compromise the transition and theassociated ATPase rate significantly. Dynamicsinvolving themultisubunit R″-state structures reveala new picture for the allosteric communicationbetween the subunits in the R″→T transition. Thewiring diagram includes interring interface residuesthat provide a communication pathway for thesignal from the trans ring. The large number ofsignificant interring interface residues furnishes uswith a detailed structural foundation for the impor-tance of the negative cooperativity between therings. The negative cooperativity between the ringsis sensitive tomutations of the interface residuesN10and E461 and the a few adjacent residues. Interfaceresidues E434 and D435 also are critical in determin-ing communication between the rings. There arerelatively few intraring interface residues that arecritical to the R″→T transition and, thus, based onthe allostery wiring diagram, we conjecture that it isthe communication between the rings that is criticalto the R″→T transition. The relative motions of theinterface between the rings determine the extent ofnegative cooperativity.Remarkably, in the R″→T transition, the wiring
diagram of GroEL does not include any GroES
binding residues. Neither does the wiring diagramof GroES include any GroEL binding residues,leading us to conclude that the role of GroES ispurely passive in the R″→T transition. We do find,however, an allosteric connection between theGroES binding sites and GroEL helices K and L.We thus predict that mutations of the residues of thehelices will affect the affinity of GroES for GroEL,even though these residues are not part of the GroESbinding site. The GroES residues that are importantto the chaperonin allosteric cycle include residuesS21 and S35 and residues that are adjacent to themas well as residues N68–G70. It is also likely thatmutations in K and L helices could affect the releaseof GroES and, hence, the efficiency of the intactmachine. Our results clearly show that positivecooperativity involves a network of residues withina single ring, while the origin of negative coopera-tivity is linked to interactions between the interfacesof interring equatorial domains. It is worth empha-sizing that these subtle effects are difficult to realizein the SR1 construct that completely arrests theR″→T transition.We have also analyzed the co-evolution of muta-
tions of GroEL and GroES residues. Using SCA, wehave mapped a markedly different, yet functionallyrelevant, wiring diagrams for GroEL and GroES. Wefind that several substrate protein and GroES bind-ing residues (N206, D224, I227, I230, R231, A241,K242, I270, E304, K311) and ATPase-rate- or ATP-binding-related residues (S154, L494, T500, A383)belong to the same evolutionarily linked cluster inGroEL. For GroES, we find an association betweenseveral mobile loop residues (S21, L27, T28, G29)and GroES/GroES interface residues (R4, H7, I66,N68, K74, L92).The two different methods (SPM and SCA) used
to analyze GroEL and GroES yield rather differentallostery wiring diagrams. There are only a fewresidues common to both the networks (GroELresidues G180 and R231, GroES residue S21), butthe coincidences are not statistically significant.The predicted differences can be understood basedon the foundations of the methods. The determi-nation of the allostery wiring diagram using SCAis based on evolutionary covariation of residues.The sequence-based prediction could be linked tothe functional relationship or interactions betweena protein and its ligands. Because in SCA only oneconserved site (j) in a subalignment of a multiplesequence alignment is treated as a perturbation,only covariation with respect to j can be extracted.It is clear that multiple variations in sequencepositions can affect function. The inability toprobe sequence covariation at multiple positionsis an inherent weakness of SCA. The SPM isbased on protein structures and thus producessets of transition-specific residues that are struc-turally or mechanically important. In contrast toSCA, the SPM automatically accounts for collec-tive behavior and hence is physically a moreappropriate method for determining the allosterywiring diagram.
404 Allostery Wiring Diagrams of GroEL
Methods
Elastic network models
We introduce a Cα–side chain ENM where each aminoacid (except Gly) is represented by the coordinates of theCα atom and that of the center of mass of the side-chainheavy atoms. For Gly, only the Cα atom is used. Weimpose a harmonic potential between all interaction sites(Cα and side chain) that are within a cutoff radius Rc in thefolded structure. In the structure-based elastic networkrepresentation of the protein, the potential energy is
E =12
Xi;j:d0ijbRc
nij dij � d0ij� �2
ð1Þ
where dij is the distance between interaction sites i and j, dij0
is the corresponding distance in the native structure, andκij is the spring constant (see below). The sum is over allpairs of sites that are in contact in the native conformation.Sites i and j are in contact if dij is less than a cutoff distance,Rc, whose value is chosen so that the B-factors using theenergy function in Eq. (1) and the measured values areas close as possible.28 The Rc values for differentallosteric transitions in GroEL are given in Table 3.The spring constants, κij, are chosen based on the physical
and chemical properties of the residues.We use κij=ɛij/(σi/2+σj/2)
2 where ɛij is the Betancourt–Thirumalai potential23
and σi is the van der Waals diameter of the residue i. TheBetancourt–Thirumalai potential, a statistical effective pairpotential between amino acid residues, is constructed basedon empirical knowledge of the contact frequencies of aminoacids in known protein structures.
Normal mode analysis
We perform a normal mode analysis using the energyfunction in Eq. (1) and obtain a spectrum of frequencies forthe normal modes along with the corresponding eigen-vectors. Since only a few of the lowest-frequency normalmodes often describe the allosteric transitions, wecompute the overlap between the conformational changesbased on the crystal structures of the two allosteric states(α and β) and the eigenvector aM of theMth normal mode(calculated based on the state α)52 using
IaYhM =
Pa iMDr iffiffiffiffiffiffiffiffiffiffiffiffiffiffiffiffiffiffiffiffiffiffiffiffiffiffiffiPa 2iM
PDr 2i
q ð2Þ
where Δri is the change in the position of the ith sitebetween α and β. It follows from Eq. (2) that 0≤ IM≤1. The
Table 3. Cutoff values in the Cα–side chain ENMcalculations
Transition and model Rc (Ǻ)
T→R, single subunit 10T→R, two adjacent subunits 8T→R, single subunit with trans equatorial (e) plate 10R″→T, single subunit 10R″→T, single subunit+GroES 12R″→T, two adjacent subunits 10R″→T, single subunit with trans E plate 10
Rc, the cutoff value for native contacts, is obtained by best fit toexperimentally determined B-factors.28
closer the value is to 1, the better a given allosterictransition is represented by mode M.The relative amplitude of a site i in modeM is calculated
from the normalized eigenvectors aiM using:
yqaYhiM =
ffiffiffiffiffiffiffiffiffiffiffiffiffiffiffiffiffiffiffiffiffiffiffiffiffiffiffiffiffiffiffiffiffiffia2ixM + a2iyM + a2izM
qð3Þ
where aig denotes the displacement of the site i in the γdirection.
Structural perturbation method
The SPM is best explained in terms of propagation ofresponse of a local perturbation in an ordered system.Normal modes are the elementary excitations that transmitthe local vibrations in ordered solids. In solids, localperturbation propagates throughout the sample coherentlyindicative of a long-range order. Similarly, the extent towhich a residue at a given site in a structure responds to aperturbation far away can be used to assess allostericcoupling. The SPM allows us to quantify how strong thecoupling is to a mutation at a particular site. The greater theresponse (higher δωiM, see below), the more significant aspecific residue is to a given mode. The high δωiM residuesmap anetwork or an allostericwiring diagram that providesthe energetic foundation for the allosterically significantmodes. In general, it is found that the residues in theallostery wiring diagram are also strongly conserved.6
In practice, SPM probes the response of a normal modeM to a mutation of a residue i. In the context of normalmode analysis, perturbation of the spring constant arounda site mimics the effect of a mutation. The response to sucha perturbation is calculated using
yxaYhiM =
12
Xj:d0ijbRc
ynij dij;M � d0ij� �2
ð4Þ
where δκij is the perturbed spring constant and (dij,M−dij0) isthe change in the distance between residues i and j in amode M. It should be stressed that the SPM probes globalresponse to short-range perturbations [Eq. (4)], which is thehallmark of allostery. The residues that are associated withhigh δωiM values are considered most critical to thesignificant modes and thus can be identified as the hot-spot residues for a given transition. The higher the δω valueof a residue, the more important it is to the transition. Inpractice, we use the criterion δωiMN2⟨δωM⟩ to determinethe hot-spot residues, where ⟨δωM⟩ is given by
hyNMi =XNi = 1
yNiM=N ð5Þ
with N being the total number of residues. To obtain thespecific residues listed in Table 1, we used a local average(average over the side chain and Cα of the site i and itsnearest neighbors) value in the highest overlapmode for δωi.
Statistical coupling analysis
In order to identify the residues that are evolutionarilylinked, we used the sequence-based SCA.7,48 In thereformulation of the SCA,8 the statistical “free energy” atposition i in a multiple sequence alignment is defined as,
DGi
kTT =
ffiffiffiffiffiffiffiffiffiffiffiffiffiffiffiffiffiffiffiffiffiffiffiffiffiffiffiffiffiffiffiffiffiffiffiffiffiffiffiffi1Ci
X20x = 1
pxi lnpxipx
� �� �2vuut ð6Þ
405Allostery Wiring Diagrams of GroEL
where kT∗ is an arbitrary energy unit, Ci is the number oftypes of amino acids that appear at position i, px is themean frequency of amino acid of type x in the alignment.pxi =
nxiNi, where ni
x is the number of times an amino acid oftype x appears at a position i, and Ni =
P20x = 1 nxi . This
definition of free energy resembles the sequence entropySi = �P20
x = 1 pxi ln pxi
=ln 20ð Þ.The basic hypothesis of the SCA is that a covariation
between two positions i and j may be inferred bycomparing the statistical properties of the multiplesequence alignment and a subalignment of sequences(derived from the original multiple sequence alignment) inwhich a given amino acid is conserved (Sj=0) at j(restricted subalignments). The restriction, Sj=0, in thesubalignment is referred to as a sequence perturbation.The effect of the perturbation is assessed from the statis-tical free-energy change,
DDGij
kTT =
ffiffiffiffiffiffiffiffiffiffiffiffiffiffiffiffiffiffiffiffiffiffiffiffiffiffiffiffiffiffiffiffiffiffiffiffiffiffiffiffiffiffiffiffiffiffiffiffiffiffiffiffiffiffiffiffiffiffiffiffiffiffiffiffiffiffiffiffiffiffi1Ci
X20x = 1
pxi;Rlnpxi;Rpx
� �� pxi ln
pxipx
� �� �2vuut ð7Þ
where pxi;R = nxi;R=Ni;R and nxi,r is the number of restrictedsequences in the subalignment in which amino acid xappears in the ith position, and Ni;R =
P20x = 1 nxi;R.
In practice, we performed a standard PSI-BLAST queryfor GroEL (based on 1AON.pdb chain A) and GroES(1AON.pdb, chain O). The 500 best matches were obtainedand realigned using Clustalw package.53 We manuallydeleted the sequences that were too long or too short inorder to minimize long gaps in the alignment. Wewere leftwith 499 aligned sequences, each 587 residues long,including gaps, for GroEL, and 487 sequences of 139residues, including gaps, for GroES. In subsequentclustering of the restricted subalignments, we only con-sidered the ones that contained at least 55% of the fullmultiple sequence alignment. This criterion was based onthe requirement that all subalignments obey the centrallimit theorem.8
We performed a hierarchical clustering of ΔΔGij byusing the Euclidean distance as a measure of the similarityof two vectors.8 We obtained robust clusters of positions iand perturbations j and considered a residue significantwhen it was present in both the clustered positions andclustered perturbations. Our final clusters contained 21significant residues for GroEL and 17 for GroES.
Acknowledgements
R.T. is a Ruth A. Kirschstein postdoctoral fellowand her work was supported by the National Insti-tute of General Medical Sciences (1F32GM082009).D.T. is grateful to the National Institutes of Health(1R01GM067851-01) and the Air Force Office ofScientific Research (FA9550-07-1-0098) for support.
References
1. Xu, Z., Horwich, A. L. & Sigler, P. B. (1997). The crystalstructure of the asymmetric GroES(ADP)7 chaperonincomplex. Nature, 388, 741–750.
2. Boyer, P. D. (1997). The ATP synthase—a splendidmolecular machine. Annu. Rev. Biochem. 66, 717–749.
3. Vale, R. D. & Milligan, R. A. (2000). The way things
move: looking under the hood of molecular motors.Science, 288, 88–95.
4. Houdusse, A. & Sweeney, H. L. (2001). Myosinmotors: missing structures and hidden springs. Curr.Opin. Struct. Biol. 11, 182–194.
5. Zheng,W., Brooks, B. R. & Thirumalai, D. (2006). Low-frequency normal modes that describe allosterictransitions in biological nanomachines are robust tosequence variations. Proc. Natl Acad. Sci. USA, 103,7664–7669.
6. Zheng, W., Brooks, B. R., Doniach, S. & Thirumalai, D.(2005). Network of dynamically important residues inthe open/closed transition in polymerases is stronglyconserved. Structure, 13, 565–577.
7. Lockless, S. W. & Ranganathan, R. (1999). Evolution-ary conserved pathways of energetic connectivity inprotein families. Science, 286, 295–299.
8. Dima, R. & Thirumalai, D. (2006). Determination ofnetwork of residues that regulate allostery in proteinfamilies using sequence analysis. Protein Sci. 15,258–268.
9. Levitt, M., Sander, C. & Stern, P. S. (1983). Normal-mode dynamics of a protein: bovine pancreatic trypsininhibitor. Int. J. Quant. Chem. 10, 181–199.
10. Go, N. (1983). Theoretical-studies of protein folding.Annu. Rev. Biophys. Bioeng. 12, 183–210.
11. Ma, J. (2003). Usefulness and limitations of normalmode analysis in modeling dynamics of biomolecularcomplexes. Structure, 13, 373–380.
12. Bahar, I. & Rader, A. J. (2005). Coarse-grained normalmode analysis in structural biology. Curr. Opin. Struct.Biol. 388, 586–592.
13. Maragakis, P. & Karplus, M. (2005). Large amplitudeconformational change in proteins explored with aplastic network model: adenylate kinase. J. Mol. Biol.352, 807–822.
14. Rader, A. J., Chennubhotla, C., Yang, L. W. & Bahar, I.(2006). The Gaussian network model: theory andapplications. In Normal Mode Analysis. Theory andApplications to Biological and Chemical Systems (Cui, Q.& Bahar, I., eds), pp. 41–64, Chapman & Hall CRCPress, Chicago, IL.
15. Sanejouand, Y. H. (2006). Functional information fromslow mode shapes. In Normal Mode Analysis. Theoryand Applications to Biological and Chemical Systems (Cui,Q. & Bahar, I., eds), pp. 91–109, Chapman & Hall CRCPress, Chicago, IL.
16. Tama, F. & Brooks, C. L., III (2006). Symmetry, form,and shape: Guiding principles for robustness inmacromolecular machines. Annu. Rev. Biophys. Biomol.Struct. 35, 115–133.
17. Schröder, G. F., Brunger, A. T. & Levitt, M. (2007).Combining efficient conformational sampling with adeformable elastic network model facilitates structurerefinement at low resolution. Structure, 15, 1630–1641.
18. Hyeon, C., Lorimer, G. H. & Thirumalai, D. (2006).Dynamics of allosteric transitions in GroEL. Proc. NatlAcad. Sci. USA, 103, 18939–18944.
19. Tirion, M. M. (1996). Large amplitude elastic motionsin proteins from a single-parameter, atomic analysis.Phys. Rev. Lett. 77, 1905–1908.
20. Buchete, N. V., Straub, J. E. & Thirumalai, D. (2004).Development of novel statistical potentials for proteinfold recognition. Curr. Opin. Struct. Biol. 14, 225–232.
21. Cheung, M. S., Klimov, D. & Thirumalai, D. (2005).Molecular crowding enhances native state stabilityand refolding rates. Proc. Natl Acad. Sci. USA, 102,4753–4758.
22. Klimov, D. K. & Thirumalai, D. (2000). Mechanisms
406 Allostery Wiring Diagrams of GroEL
and kinetics of β-hairpin formation. Proc. Natl Acad.Sci. USA, 97, 2544–2549.
23. Betancourt, M. R. & Thirumalai, D. (1999). Pairpotentials for protein folding: choice of referencestates and sensitivity of predicted motive states tovariations in the interaction schemes. Protein Sci. 8,361–389.
24. Xu, Z. & Sigler, P. B. (1998). GroEL/GroES: structureand function of a two-stroke foldingmachine. J. Struct.Biol. 124, 129–141.
25. Thirumalai, D. & Lorimer, G. H. (2001). Chaperonin-mediated protein folding. Annu. Rev. Biophys. Biomol.Struct. 30, 245–269.
26. Horwich, A. L., Farr, G. W. & Fenton, W. A. (2006).GroEL–GroES-mediated protein folding. Chem. Rev.106, 1917–1930.
27. Lin, Z., Madan, D. & Rye, H. S. (2008). GroEL sti-mulates protein folding through forced unfolding.Nat. Struct. Mol. Biol. 15, 303–311.
28. Zheng, W., Brooks, B. R. & Thirumalai, D. (2007).Allosteric transitions in the chaperonin GroEL arecaptured by a dominant normal mode that is mostrobust to sequence variations. Biophys. J. 93, 2289–2299.
29. Keskin, O., Bahar, I., Flatow, D., Covell, D. G. &Jernigan, R. L. (2002). Molecular mechanisms ofchaperonin GroEL–GroES function. Biochemistry, 42,491–501.
30. Ma, J. & Karplus, M. (1998). The allosteric mechanismof the chaperonin GroEL: a dynamic analysis. Proc.Natl Acad. Sci. USA, 95, 8502–8507.
31. Grason, J., Gresham, J. & Lorimer, G. (2008). Setting thechaperonin timer: a two-stroke, two-speed, proteinmachine. Proc. Natl Acad. Sci. USA, 105, 17339–17344.
32. Braig, K., Otwinowski, Z., Hegde, R., Boisvert, D. C.,Joachimiak, A., Horwich, A. L. & Sigler, P. B. (1994).The crystal structure of the bacterial chaperoninGroEL at 2.8 Ǻ. Nature, 371, 578–586.
33. Ranson, N. A., Farr, G. W., Roseman, A. M., Gowen,B., Fenton, W. A., Horwich, A. L. & Saibil, H. R. (2001).ATP-bound states of GroEL captured by cryo-electronmicroscopy. Cell, 107, 869–879.
34. Betancourt, M. R. & Thirumalai, D. (1999). Exploringthe kinetic requirements for enhancement of proteinfolding rates in the GroEL cavity. J. Mol. Biol. 287,627–644.
35. Yang, Y. (2006). Site-directed mutagenesis of GroEL:developing a system for monitoring allosteric move-ments by flourescence resonance energy transfer.Master's thesis, University of Maryland, CollegePark, MD.
36. Murai, N., Makino, Y. & Yoshida, M. (1996). GroELlocked in a closed conformation by an interdomaincross-link can bind ATP and polypeptide but cannotprocess further reaction steps. J. Biol. Chem. 271,28229–28234.
37. Kass, I. & Horovitz, A. L. (2002). Mapping pathwaysof allosteric communication in GroEL by analysis ofcorrelated mutations. Proteins, 48, 611–617.
38. Brocchieri, L. & Karlin, S. (2000). Conservation amongHSP60 sequences in relation to structure, function,and evolution. Protein Sci. 9, 476–486.
39. Stan, G., Thirumalai, D., Lorimer, G. H. & Brooks, B. R.(2003). Annealing function of GroEL: structural andbioinformatic analysis. Biophys. Chem. 100, 453–467.
40. Klein, G. & Georgopoulos, C. (2001). Identification ofimportant amino acid residues that modulate bindingof Escherichia coli GroEL to its various cochaperones.Genetics, 158, 507–517.
41. Fenton, W. A., Kashi, Y., Furtak, K. & Horwich, A. L.(1994). Residues in chaperonin GroEL required forpolypeptide binding and release.Nature, 371, 614–619.
42. Stan, G., Brooks, B. R., Lorimer, G. H. & Thirumalai,D. (2005). Identifying natural substrates for chaper-onins using a sequence-based approach. Protein Sci.14, 193–201.
43. Aharoni, A. & Horovitz, A. (1996). Inter-ring commu-nication is disrupted in the GroEL mutant Arg13 Gly:Ala126 Val with known crystal structure. J. Mol. Biol.258, 732–735.
44. Danziger, O., Shimon, L. & Horovitz, A. (2006).Glu257 in GroEL is a sensor involved in couplingpolypeptide substrate binding to stimulation of ATPhydrolysis. Protein Sci. 15, 1270–1276.
45. Yifrach, O. &Horovitz, A. (1994). Nested cooperativityin the ATPase activity of the oligomeric chaperoninGroEL. Biochemistry, 34, 5303–5308.
46. Chennubhotla, C., Yang, Z. & Bahar, I. (2008).Coupling between global dynamics and signal trans-duction pathways: a mechanism of allostery forchaperonin GroEL. Mol. BioSyst. 4, 287–292.
47. Chennubhotla, C. & Bahar, I. (2006). Markov propa-gation of allosteric effects in biomolecular systems:application to GroEL–GroES. Mol. Syst. Biol. 2, 36.
48. Suel, G. M., Lockless, S. W., Wall, M. A. & Ranga-nathan, R. I. (2003). Evolutionary conserved networksof residues mediate allosteric communication inproteins. Nat. Struct. Biol. 10, 59–68.
49. Buckle, A. M., Zahn, R. & Fersht, A. R. (1997). Astructural model for GroEL–polypeptide recognition.Proc. Natl Acad. Sci. USA, 94, 3571–3575.
50. Chen, L. L. & Sigler, P. B. (1999). The crystal structureof a GroEL/peptide complex: plasticity as a basis forsubstrate diversity. Cell, 99, 757–768.
51. Bochkareva, E. S., Horovitz, A. & Girshovich, A. S.(1994). Direct demonstration that ATP is in contactwith Cys-137 in chaperonin GroEL. J. Biol. Chem. 269,44–46.
52. Zheng, W. & Doniach, S. (2003). A comparative studyof motor-protein motions by using a simple elastic-network model. Proc. Natl Acad. Sci. USA, 100,13253–13258.
53. Thompson, J. D., Higgins, D. G. & Gibson, T. J. (1994).CLUSTALW: improving the sensitivity of progressivemultiple sequence alignment through sequenceweighting, position-specific gap penalties and weightmatrix choice. Nucleic Acids Res. 22, 4673–4680.


![6. Wiring Diagram - weidefamily.net coil Transmission control module ... WIRING DIAGRAM 6. Wiring Diagram. MEMO: 21 WIRING DIAGRAM ... 76 6-3 [D6R2] WIRING DIAGRAM 6](https://img.pdfslide.us/doc/110x75/5aa0cc3b7f8b9a62178ea5e7/6-wiring-diagram-coil-transmission-control-module-wiring-diagram-6-wiring.jpg)