Embed Size (px)
Citation preview

© 2015. Published by The Company of Biologists Ltd.
Allometry in Physarum plasmodium during free locomotion : Size versus
shape, speed and rhythm
Shigeru Kuroda1,*, Seiji Takagi2, Toshiyuki Nakagaki1 and Tetsuo Ueda1
1Research Institute for Electric Science, Hokkaido University, N20W10,
Kita-ku Sapporo, Hokkaido 001-0020, Japan
2The School of Systems Information Science, Future University
Hakodate, 116-2 Kamedanakano-cho, Hakodate, Hokkaido 041-8655, Japan
*Correspondence should be addressed to Shigeru Kuroda:
Jour
nal o
f Exp
erim
enta
l Bio
logy
• A
dvan
ce a
rtic
le
http://jeb.biologists.org/lookup/doi/10.1242/jeb.124354Access the most recent version at J Exp Biol Advance Online Articles. First posted online on 8 October 2015 as doi:10.1242/jeb.124354http://jeb.biologists.org/lookup/doi/10.1242/jeb.124354Access the most recent version at
First posted online on 8 October 2015 as 10.1242/jeb.124354
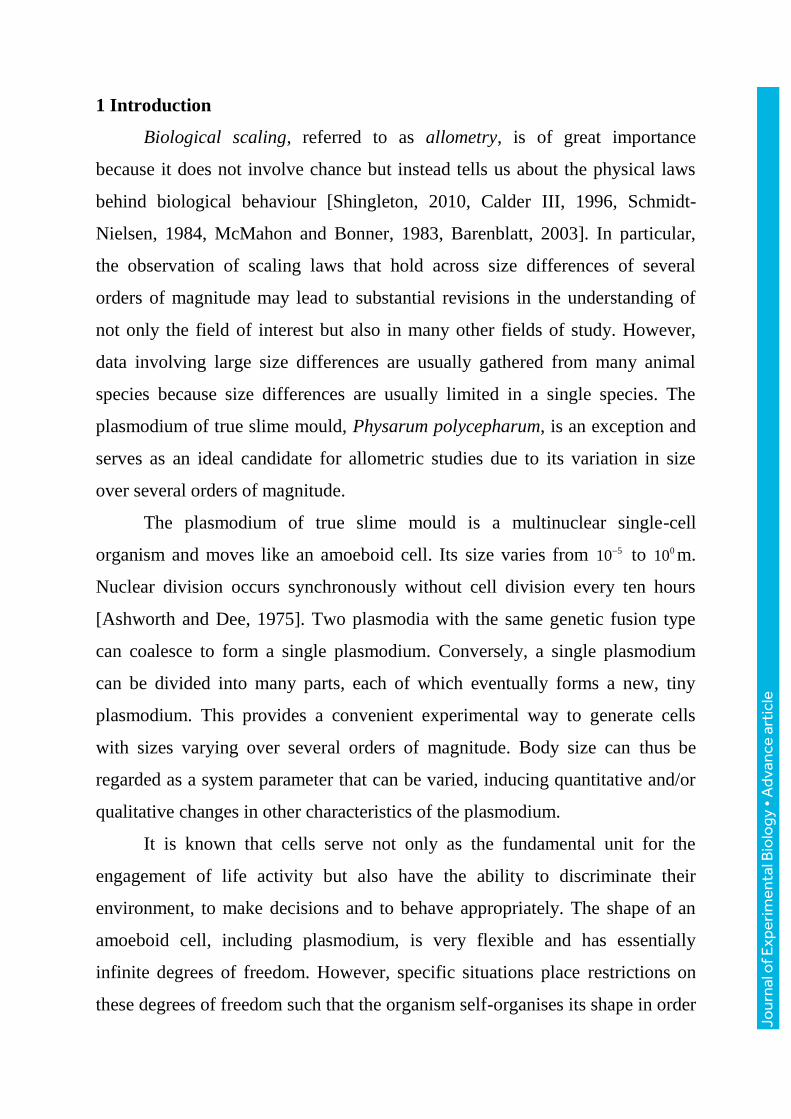
Abstract
Physarum plasmodium is a giant unicellular organism whose size varies
by more than three orders of magnitude in length. Using plasmodia ranging
from 100 m to 10cm, we investigated the size dependency of their thickness
distributions and locomotion speeds during free locomotion. (1) In the
longitudinal direction, the organism is thickest close to the front, and decreases
exponentially in thickness towards the rear. The slenderness ratio varies with
body size according to a power law such that large plasmodia are long and flat,
whereas small plasmodia are short and thick. (2) The mean locomotion speed is
proportional to the mean maximum thickness of the frontal part. By conducting
a dimensional analysis, possible physical models are discussed. (3) The intrinsic
period of the thickness oscillation is related to shuttle streaming (period 1-2
min) and increases logarithmically with body size. (4) Various characteristics
exhibit size-independent, long-period ( 20 10 min) oscillations including speed,
shape, and intrinsic thickness oscillation period. These variations are closely
coupled to the formation of the entire cell shape including the undulation of
thickness along the longitudinal axis and the branching timing of the frontal tip.
Based on these experimental results together with those reported previously, we
propose a simple mathematical model for cell locomotion.
Keywords
cell locomotion; scaling; self-organization; Physarum plasmodium;
dimensional analysis; spatial memory; localization of locomotion machinery;
traveling wave;
Summary statement
We investigated allometric relationships in the plasmodium of Physarum
polycepharum which is an ideal candidate for allometric studies due to its
variation in size over several orders of magnitude.
Jour
nal o
f Exp
erim
enta
l Bio
logy
• A
dvan
ce a
rtic
le
1 Introduction
Biological scaling, referred to as allometry, is of great importance
because it does not involve chance but instead tells us about the physical laws
behind biological behaviour [Shingleton, 2010, Calder III, 1996, Schmidt-
Nielsen, 1984, McMahon and Bonner, 1983, Barenblatt, 2003]. In particular,
the observation of scaling laws that hold across size differences of several
orders of magnitude may lead to substantial revisions in the understanding of
not only the field of interest but also in many other fields of study. However,
data involving large size differences are usually gathered from many animal
species because size differences are usually limited in a single species. The
plasmodium of true slime mould, Physarum polycepharum, is an exception and
serves as an ideal candidate for allometric studies due to its variation in size
over several orders of magnitude.
The plasmodium of true slime mould is a multinuclear single-cell
organism and moves like an amoeboid cell. Its size varies from 510 to 010 m.
Nuclear division occurs synchronously without cell division every ten hours
[Ashworth and Dee, 1975]. Two plasmodia with the same genetic fusion type
can coalesce to form a single plasmodium. Conversely, a single plasmodium
can be divided into many parts, each of which eventually forms a new, tiny
plasmodium. This provides a convenient experimental way to generate cells
with sizes varying over several orders of magnitude. Body size can thus be
regarded as a system parameter that can be varied, inducing quantitative and/or
qualitative changes in other characteristics of the plasmodium.
It is known that cells serve not only as the fundamental unit for the
engagement of life activity but also have the ability to discriminate their
environment, to make decisions and to behave appropriately. The shape of an
amoeboid cell, including plasmodium, is very flexible and has essentially
infinite degrees of freedom. However, specific situations place restrictions on
these degrees of freedom such that the organism self-organises its shape in order
Jour
nal o
f Exp
erim
enta
l Bio
logy
• A
dvan
ce a
rtic
le
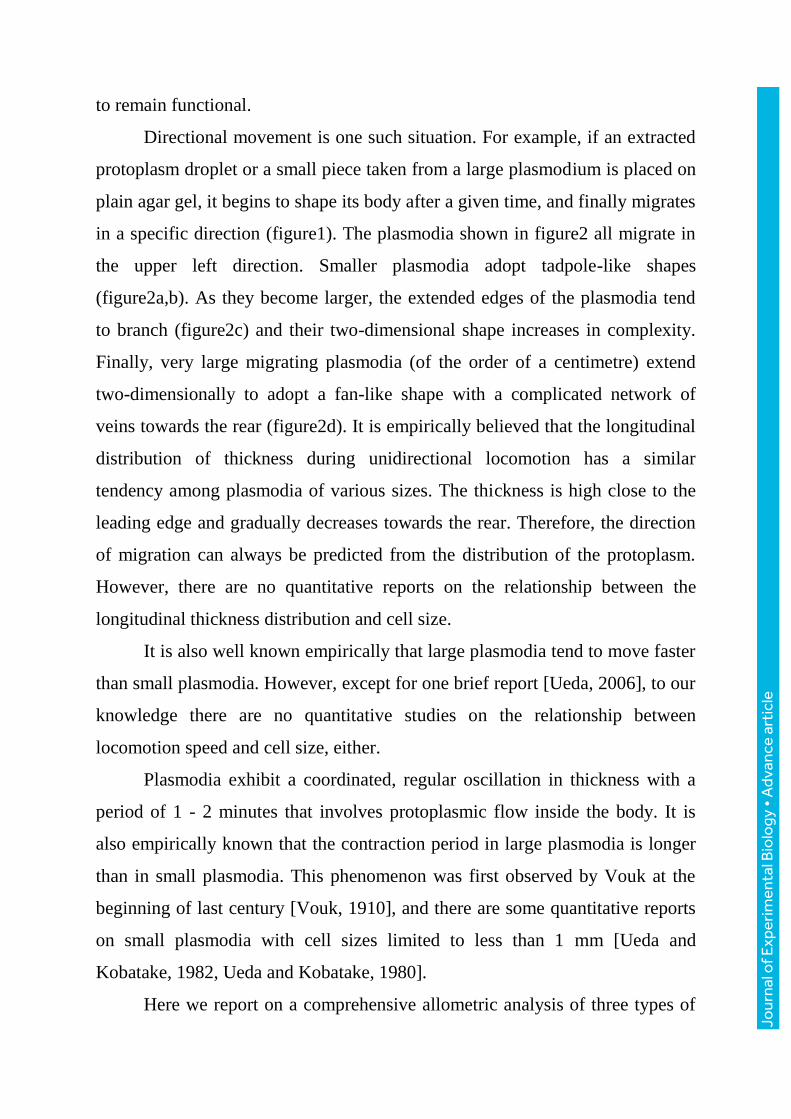
to remain functional.
Directional movement is one such situation. For example, if an extracted
protoplasm droplet or a small piece taken from a large plasmodium is placed on
plain agar gel, it begins to shape its body after a given time, and finally migrates
in a specific direction (figure1). The plasmodia shown in figure2 all migrate in
the upper left direction. Smaller plasmodia adopt tadpole-like shapes
(figure2a,b). As they become larger, the extended edges of the plasmodia tend
to branch (figure2c) and their two-dimensional shape increases in complexity.
Finally, very large migrating plasmodia (of the order of a centimetre) extend
two-dimensionally to adopt a fan-like shape with a complicated network of
veins towards the rear (figure2d). It is empirically believed that the longitudinal
distribution of thickness during unidirectional locomotion has a similar
tendency among plasmodia of various sizes. The thickness is high close to the
leading edge and gradually decreases towards the rear. Therefore, the direction
of migration can always be predicted from the distribution of the protoplasm.
However, there are no quantitative reports on the relationship between the
longitudinal thickness distribution and cell size.
It is also well known empirically that large plasmodia tend to move faster
than small plasmodia. However, except for one brief report [Ueda, 2006], to our
knowledge there are no quantitative studies on the relationship between
locomotion speed and cell size, either.
Plasmodia exhibit a coordinated, regular oscillation in thickness with a
period of 1 - 2 minutes that involves protoplasmic flow inside the body. It is
also empirically known that the contraction period in large plasmodia is longer
than in small plasmodia. This phenomenon was first observed by Vouk at the
beginning of last century [Vouk, 1910], and there are some quantitative reports
on small plasmodia with cell sizes limited to less than 1 mm [Ueda and
Kobatake, 1982, Ueda and Kobatake, 1980].
Here we report on a comprehensive allometric analysis of three types of
Jour
nal o
f Exp
erim
enta
l Bio
logy
• A
dvan
ce a
rtic
le
characteristics (shape, speed and rhythm) in plasmodia with sizes ranging from
100 m to 10cm, that is, for plasmodia differing by three orders of magnitude in
length during free locomotion. For each plasmodium, we obtained one-
dimensional locomotion data over the course of 6-8 hours. We observe well-
defined allometric relations with the shape and locomotion speed. The physical
basis of our findings is then discussed using dimensional analysis. While we
also observe size-dependent property in the intrinsic thickness oscillation
period, we identify a significant, size-independent, long-term variation in the
intrinsic thickness oscillation period. This long-term variation was also found in
the locomotion speed and the shape. We discuss the evolution of body shape is
tightly coupled with the long-term variations. Two examples are presented. One
is undulations in the longitudinal distribution of thickness and the other is the
timing of branching of the frontal part of migrating plasmodia. Both are
discussed from the viewpoint of the dynamic encoding of temporal information
to the spatial structure. A simple mathematical model describing this type of
phenomenon is then presented.
2 Materials and Methods
2.1 Organism and culture
The plasmodium of Physarum polycephalum (strain HU195 x HU200)
[Akitaya et al., 1985] was fed with oat flakes (Quaker Oats Co.) on agar gel at
24 C in the dark [Ueda et al., 1975]. Agar gels used for all experiments were
nutrient-free (Wako Pure Chemicals Inc.) and their concentration were fixed at
1.0% weight by volume.
2.2 Preparation of plasmodia with various sizes using giant
plasmodia
Before experimental use, the organism was allowed to move on plain agar
gel overnight. Using the frontal part, various sizes of plasmodia (n=54) were
prepared as described previously (see [Ishigami et al., 1987] for smaller sizes
(volume < 0.1mm3 (n=18)) and [Takagi et al., 2007] for larger sizes (volume >
Jour
nal o
f Exp
erim
enta
l Bio
logy
• A
dvan
ce a
rtic
le
0.1mm3 (n=36)).
The smaller plasmodia were placed on plain agar gel in Petri dishes (9cm
in diameter) and were allowed to move freely. After a few hours, the organisms
exhibited locomotion that was almost one-dimensional in nature and adopted
tadpole-like shapes (figure2a,b). Larger plasmodia had more than one advancing
front (figure2c), and still larger organisms adopted a fan-like shape with a sheet-
like leading edge (figure2d). Therefore, in order to limit the number of
advancing fronts to one or to confine locomotion to one dimension, the larger
plasmodia were placed on narrow agar gel lanes (width = 1.0 (n=3), 1.5 (n=4),
4.0 (n=24) or 8 (n=5) mm and length = 17 or 25 cm) which were separated from
the adjacent lanes using PET film (100 m thickness) placed on the agar gel.
These plasmodia were also allowed to move freely and after a few hours they
exhibited stable, almost one-dimensional locomotion with shapes distributed in
the longitudinal direction of the lane and a sheet-like leading edge (figure2e)
[Takagi et al., 2007]. The experiments were conducted at room temperature
( 24 C 1 ) and the humidity inside the apparatus was maintained at around 90%
relative humidity (RH) using a plastic lid that was lifted a little.
The small plasmodia used in the study of branching timing were
separately prepared from protoplasm droplets to control their body size [Takagi
and Ueda, 2008]. Their free migration on agar gel was then observed.
2.3 Measurements of thickness of plasmodia by image analysis
The plasmodia were illuminated from below using an infrared beam
( 950nm ) that was passed through light diffuser plates and viewed from
above [Takagi et al., 2007]. The transmitted light images were magnified using
either a lens (NIKKOR-H Auto 28mm f/3.5; Nikon or 55mm telecentric f/2.8;
Computar) or a microscope (C-DSD115; Nikon) and captured using a CCD
camera (XC-ST70; Sony) or a cooled CCD camera (Retiga EXi Fast 1394
Mono Cooled; QImaging Corp.). They were stored in a personal computer as
time-lapse images covering approximately twelve hours, where the time-lapse
Jour
nal o
f Exp
erim
enta
l Bio
logy
• A
dvan
ce a
rtic
le
interval periods were 12 (n=45), 20 (n=3) and 30 (n=6) seconds. The spatial
resolution of the images were 0.008-0.027 [mm/pixel] for the smaller plasmodia
and 0.072-0.363 [mm/pixel] for the larger plasmodia. The field of view was
720x480 or 696x520 [pixel x pixel].
Pixel values in the images were converted to optical density (OD) values,
which were calculated as 010
( / )log I I , where I and 0I are the transmitted and
incident light intensities, respectively. A calibration table relating the OD to the
thickness of the plasmodium was constructed for each measurement apparatus
by confining the protoplasmic sol in glass tubes with various known diameters
[Takagi and Ueda, 2008] or by placing the protoplasm between a glass slide and
a glass cover with a small tilt angle. The thickness of the plasmodium under
study was linearly interpolated from these calibration tables.
Thus, the thickness of a plasmodium h(x, t) was obtained as a function of
position x and time (or frame) t. We analysed the resulting spatiotemporal
patterns using programs that we developed in-house as plug-in software for the
ImageJ image processing software [Rasband, 2011].
2.4 Data analysis
2.4.1 Longitude coordinate and measurement of locomotion speed
The plasmodia exhibited stable locomotion in an almost one-dimensional
manner. However, in experiments using tiny plasmodia and no lane, it was
occasionally (once or twice per recording) observed that the plasmodium
changed direction sharply ( > 90 ) or flipped its front and tail. Such frames were
removed from the further analysis. For each plasmodium, we obtained one-
dimensional locomotion data over the course of 6-8 hours. In this paper, the
mean values of various characteristics (averaged over the measurement time)
were examined and denoted by overbar on the symbols. To analyse the
directional movement of a plasmodium, we introduced a longitude curve
coinciding roughly with the centre line of the trail and also containing the
frontal tip and body axis as far as possible in every frame (figure3a). The
Jour
nal o
f Exp
erim
enta
l Bio
logy
• A
dvan
ce a
rtic
le
longitude curve and its perpendicular lines are referred to as the longitude
coordinate for locomotion, which is used to describe the shape and movement
of the plasmodium. The coordinates of the leading edge, ( )fx t , and tail edge,
( )bx t , on the longitude axis were determined for each frame, t, using a threshold
criterion (figure3a). The locomotion speed of the plasmodium was calculated
from the distance moved by the leading edge along the longitude axis during a
fixed time interval ( = 4t or 8 min). We refer to points lying on the longitude
axis between ( )fx t and ( )bx t as body points in the following analysis. To outline
the body area of the plasmodium in each frame, for each body point x, a
connected body components, ( , )x t , on the perpendicular axis centered at x was
determined using a threshold criterion; the width of the plasmodium, w(x,t), was
obtained as the length of ( , )x t ; the maximum width, max ( )w t , and the mean
width, mean ( )w t , were given by ( , )max x x xf b
w x t and ( , )xb
xf
w x t dx , respectively. The
volume, V, of the plasmodium was estimated by body area thickness, such
that ( ) ( ) ( , )
= ( , )x t x x t y x tb f
V h y t dydx .
2.4.2 Measurement and characterisation of longitudinal size and
shape
Figure4a shows the relationship between the volume and the width of the
plasmodia. For the larger plasmodia [V > 0.1 mm3], the maximum width was
independent of the volume because their bodies were laterally confined by the
narrow lane. To quantify the longitudinal size which is independent on the
width, we estimate the volume per unit width, ( )lV t [mm3/mm], which is
calculated as volume / mean width, mean( ) = / ( )lV t V w t (Figure4b).
We refer to the contour of thickness distribution of the plasmodium in the
longitudinal direction as the longitudinal shape. More precisely, on the
longitude axis for a unidirectionally migrating plasmodium, the longitudinal
shape of the plasmodium at a given time is estimated as
Jour
nal o
f Exp
erim
enta
l Bio
logy
• A
dvan
ce a
rtic
le
{( , ( , )) ; is a body point at }x h x t x t , where ( , )( , ) = ( , )max y x th x t h y t is the maximum
thickness along the perpendicular axis centered at x. The three quantities
max max( , , )( )Lx h x t were measured to describe the longitudinal shape, where the
length ( )Lx t is the distance from the leading edge to the tail edge, max ( )h t
( = ( , )max xh x t ) is the maximum thickness and max ( )x t is the distance from the
frontal tip to the position of maximum thickness. Whenever the longitudinal
shape is described, we use a moving longitude coordinate, the origin of which is
always set at the position of the leading edge on the (fixed) longitude axis of the
plasmodium; the direction of the longitude axis is reversed such that = fx x x
(figure3b).
2.4.3 Determination of intrinsic period of thickness oscillation 0T
It is known that plasmodia show oscillations in thickness with a period of
60-120s. These oscillations are coordinated along the longitudinal body axis
with some phase gradient and produce protoplasmic shuttle streaming
[Alexopoulos et al., 1996, Kessler, 1982, Kamiya, 1959]. This rhythmic
contraction also gives rise to a to-and-fro motion of the leading edge during
each cycle. However, although the oscillations are often regarded as ‘regular
oscillation’, the period of the oscillation in each plasmodium is not strictly
constant but variable in time [Coggin and Pazun, 1996]. In this paper, using
spatiotemporal thickness data along the longitudinal axis, h(x,t), we estimated
the intrinsic period of the thickness oscillation for each time t, 0 ( )T t . A more
complete description is given in the Appendix.
2.4.4 Averaging of variables over intrinsic period of thickness
oscillation
The regular oscillation in thickness may induce oscillation in various
other variables including the longitudinal shape and the locomotion speed with
the same intrinsic period. To get rid of this short-term, regular variation from
our further analysis, each variable max max( ) { ( ), ( ), ( ), ( ), ( , )}Lz t x t h t x t v t h x t was
Jour
nal o
f Exp
erim
enta
l Bio
logy
• A
dvan
ce a
rtic
le
averaged over the period 0 ( )T t such that ( )/2
0
0= ( )/2
0
( ) := ( ) / ( )t T t
s t T tz t z t s ds T t
.
2.4.5 Statistical analysis
In order to estimate the power-law-type functional relationship between
two variables, major axis regression between the logarithmically transformed
variables was employed because all the variables were subject to measurement
errors in this study [Sokal and Rohlf, 1994]. The fitting result is denoted as
= a ay bx , where a a means that the 95% confidence interval of a is
( , )a a a a . Moreover, the correlation coefficient, r, of the variables was
estimated by Pearson’s method after the logarithmic transformation. The
probability value of the t-test on r (0 : = 0H r ) was placed in the text only when
the probability was more than 1.0e-10. The tail of the longitudinal shape
( max 2x x x ) was fitted using the exponential function maxexp( ( )/ )x x ,
where 2x is the position at which the thickness is equal to max0.3h at that time.
The exponent is referred to as the exponential decay distance in this paper.
The semi-logarithmic relationship of the intrinsic period of thickness oscillation
( 0T ) on a longitudinal variable ( max, ,l LV x x or maxh ) was estimated by non-linear
regression which was performed using the nls package with a port algorithm of
version 2.14.2 of the R software [R Development Core Team, 2012]. The
correlation coefficient between each longitudinal variable and 0T was also
estimated after the logarithmic transformation of the longitudinal variable. The
period of the large, long-term variation of a variable max 0( ) { , , }z t h T v , 1( )T z , was
estimated as follows: firstly, the auto-correlation function of the time-series of
z(t) was calculated after a band-pass filter (period = 3-40 min) was applied. The
period was then evaluated as the smallest time-lag at which the auto-correlation
function had a positive peak. The time-lag maximising the cross-correlation
between x, max 0{ , , }y h T v , ( , )x y , was estimated as follows: firstly, the very
slow (hourly) oscillatory component (>60 min) of each variable was removed
Jour
nal o
f Exp
erim
enta
l Bio
logy
• A
dvan
ce a
rtic
le
by subtracting the mean value averaged over a period (=30 min). The time-lag
maximising the correlation between ( )x t and ( )y was then extracted from
the range 20 20 min.
3 Results
3.1 Size dependence of longitudinal shape
Figure5a shows examples of the longitudinal shape of plasmodia with
three different sizes. Their thickness decreases exponentially towards the rear
after the thickness reaches its maximum value in the leading part. Moreover, the
exponential decay distance ( ) follow the volume per unit width (lV ) such that
0.59 0.04
lV
; r=0.97 (p<1.0e-16) (figure5b). The exponential decay of the
thickness indicates that almost all protoplasm is concentrated in the frontal part.
However, we often observed a protuberance in the caudal region, especially in
smaller plasmodia.
Figure5c shows the longitudinal size dependency of the characteristics
( Lx , maxh , maxx ) of the longitudinal shape of the plasmodia, where Lx is the body
length, maxh is the maximum thickness and maxx is the distance from the frontal
tip to the position of maximum thickness. The following allometric
relationships hold: 0.40 0.03
max lh V ; = 0.97r , 0.50 0.04
max lx V ; = 0.97r , 0.66 0.02
L lx V ;
= 0.99r . The growth rate of the body length ( Lx ) with respect to the volume per
unit width ( lV ) is larger than the other two characteristics ( maxx , maxh ). This
shows that large plasmodia are long and flat, whereas small plasmodia are short
and thick (Figure5d).
The clear allometric relationships above indicate that we can adopt
whichever characteristic ( lV , Lx , maxx or maxh ) we like to describe the
longitudinal size.
3.2 Longitudinal size dependency of locomotion speed
Figure6 shows the dependence of locomotion speed (v) on the maximum
thickness of the plasmodium. The locomotion speed is almost proportional to
Jour
nal o
f Exp
erim
enta
l Bio
logy
• A
dvan
ce a
rtic
le
the maximum thickness of the plasmodium ( 0.94 0.10
maxv h ; r=0.93). The other
characteristics also have allometric relationships with the locomotion speed
(Data points fit to the curve 0.39 0.04
= 0.071 lv V
; r=0.94, 0.59 0.06= 0.020 Lv x ; r=0.94,
0.77 0.12
max= 0.076v x ; r=0.88).
3.3 Longitudinal size dependency of intrinsic period 0T
Figure7 shows the dependence of the intrinsic period of the thickness
oscillation on the maximum thickness of the plasmodium. The period increases
logarithmically with the maximum thickness of the plasmodium
( 0 max10=15.3 ( ) 98.3logT h ; r=0.75). The period also increase logarithmically with
the other characteristics ( 0 10= 6.8 ( ) 92.1log lT V ; r=0.77, 0 10
=10.0 ( ) 82.9log LT x ;
r=0.76, 0 max10=13.5 ( ) 92.6logT x ; r=0.78). Our results are consistent with the
previous studies cited above. However, this is the first study involving
systematic measurements of plasmodia covering a wide range of sizes during
free locomotion.
3.4 Long-term large variation in speed, shape and intrinsic period
During free locomotion, the locomotion speed, longitudinal shape and the
intrinsic period of the thickness oscillation always exhibited large variations
with a period of a few tens of minutes (figure8a). The oscillations in these
parameters often co-varied with fixed time lags but the phase relationships
between them were not identical in the observed plasmodia (figure8b).
However, statistically, the change in the locomotion speed (v) tended to proceed
the few minutes against that in longitudinal shape ( maxh ) (figure8b leftmost
panel; max( , ) = 5.0h v [min] (t-test for H0: > 0 (p < 0.0001) )). The periods of
these long-term oscillations are all independent of the cell size ( 0.10r
(p>0.49)) (figure8c).
Jour
nal o
f Exp
erim
enta
l Bio
logy
• A
dvan
ce a
rtic
le
4 Discussion
4.1 Locomotion speed is scaled by the longitudinal size
We found that the locomotion speed is scaled by the longitudinal size as
the length, maximum thickness or volume per unit width rather than by the
overall cell size. In other words, the plasmodia migrate faster as the aisle gets
narrower, like inside of rotted trees and under ground where the they inhabit.
This indicates that the self-propelled mechanism of directional movement is
confined to the longitudinal section of the body and that the lateral two-
dimensional extension is not directly connected to the factors that govern the
locomotion. A similar result has been reported for the relationship between
locomotion speed and longitudinal size of the pseudo-plasmodium (slug)
Dictyostelium discoideum [Inouye and Takeuchi, 1979, Rieu et al., 2005].
Moreover, the scaling exponent, about 0.6, between the speed and body length
of the plasmodia investigated here is good agreement with that of the slugs on
agar plate, 0.63 0.06
slug slugv L which was obtained by fitting the data points in [Inouye
and Takeuchi, 1979]. This relationship also provides a rough estimate for the
locomotion speed of organisms with smaller size, which is in the range of 1-3
m/min for 10-30 m length.
It should be noted that the scaling discussed in this study is restricted to
almost one-dimensional locomotion and the scaling for two-dimensional
migration may different from the present conclusions. However, even in the
two-dimensional case, if the thickness profile along an extending direction is
similar to the longitudinal shape in the one-dimensional case, we may expect for
the extending speed along the direction to obey the scaling law in one-
dimensional case. Further investigation of this aspect will be left for future
studies.
Jour
nal o
f Exp
erim
enta
l Bio
logy
• A
dvan
ce a
rtic
le
4.2 Alternative physical models fulfill for maxv h
We consider the physics-mechanical meaning of the proportional
relationship between the speed and maximum thickness of the plasmodium.
Insight can be gained by conducting a dimensional analysis under the following
two assumptions. (1) The speed v is proportional to the characteristic length h
[L], v h . (2) The speed v is a function of at most three possible mechanical
quantities, including h, among the following: [FL–4T2] ( density), [FL–1T] (
viscosity), p [FL–2] (pressure in the cell), [FL–1] ( contractile and tensile force
of ectoplasmic cortex per unit arc length ) and D [F] ( drag force with the
substratum), where the contractile and tensile force includes the active force
generated by actomyosin fibrils in the cortex and the passive force due to gel-
like material characteristics of the cortex. Here three is the smallest number of
variables that can represent v as their function, because the number of related
fundamental physical units (F,L,T) is three (Buckingham theorem, see for
instance [McMahon and Bonner, 1983]). These assumptions lead to the
functional relationship = /v const ph as a unique solution.
We now attempt to obtain a migration model for plasmodium that
satisfies the above functional relationship. For simplicity, we can regard a
plasmodium as a dome-shaped ectoplasmic cortex with radius max=h h that
envelops the protoplasmic sol (a highly viscous fluid), and we can assume that
the flow velocity v is identical to the locomotion speed of the plasmodium. The
cortex induces the protoplasmic sol flow due to the pressure difference p
generated by the effective surface tension , where p is proportional to /h ,
(Laplace pressure, see for instance [de Gennes et al., 2004]). By the Stokes
equations, the pressure gradient (p/h) and the viscosity term ( 2/v h ) balance and
thus we have ( / ) = /v p h . Therefore, the following two alternative situations
are implied: (i) When the viscosity coefficient is independent of h,
= ( )h h is followed by the constraint v h . That is, the contraction force
Jour
nal o
f Exp
erim
enta
l Bio
logy
• A
dvan
ce a
rtic
le
generated by the cortex is proportional to the maximum thickness of the
plasmodium. This situation is probable if the thickness of the cortex is
proportional to the maximum thickness of the plasmodium and also to the
contraction force. On the other hand, (ii) if is independent of h, then
1= ( )h h . This requires that the viscosity of the frontal part of small
plasmodia should be larger than that of large plasmodia. One feature that may
give rise to size-dependency of the “effective” viscosity is the channel structure
that is observed in the frontal tip of plasmodia (see for example [Matsumoto et
al., 2008] for the case of small plasmodia). Further analysis is left for future
studies.
4.3 Two examples of the body shape evolution related with the size-
independent, long-term oscillation
It is reasonable to ask about the origin of the difference between the
scalable and the non-scalable properties over several orders of magnitude.
Because the size-dependent properties result from physico-mechanical
processes, they are likely to be quite general properties that hold for a wide
range of organisms. In contrast, one probable reason is that the size-independent
properties result from biochemical processes because chemical reaction speed
mainly depends not on the body size itself but on the chemical characteristics
and the concentration of the substances involved.
We found the size-independent, long-period ( 20 10 min) oscillations
including speed, shape and intrinsic thickness oscillation period. In order to
consider their physiological meanings, we present two examples of body shape
evolution tightly coupled with this oscillation.
4.3.1 Branching of the frontal tip
Under free locomotion on a large enough area with no narrow lane,
branching of the frontal tip was sometimes observed in plasmodia of
intermediate size. These plasmodia is too large to maintain the tadpole-like
shape throughout the measurement period but is not pronounced enough to form
Jour
nal o
f Exp
erim
enta
l Bio
logy
• A
dvan
ce a
rtic
le
a two-dimensional fan-like sheet structure. Figure9 shows an example of a time
course of the locomotion speed for such a plasmodium (0.2 mm3) during free
locomotion. The times at which branching occurred are indicated on the time
course; branching was observed shortly after the slow-down phase of the
locomotion speed. After each branching event, one of the two advancing fronts
stopped extending and disappeared by the time of the next branching event.
4.3.2 Thickness undulation along the longitudinal direction
Figure10 shows a space-time plot of a plasmodium migrating one-
dimensionally in the upper direction on an agar lane. The thickness of the
frontal tip varied with a period of approximately ten minutes. This long-term
oscillation is visible from the stripe pattern parallel to the time axis. In contrast,
the stripe pattern parallel to the spatial axis arises from the shorter thickness
oscillation with an intrinsic period. The labels x and t in the figure indicate
examples of places or times where the thickness of the frontal part became
much larger than the mean value, indicated by the relatively dark contrast. The
time trace of the thickness at a given position decreases exponentially with time
(lower left panel of figure10). As shown in the upper right panel of figure10,
which shows the thickness distribution in the longitudinal direction at a given
time, large fluctuations are superimposed on the base line which exponentially
decreases from the maximum thickness at the frontal tip. We note that similar
fluctuations can be observed in figure5c. Each undulation in the tail corresponds
to a peak in the long-term, large variation of thickness of the frontal tip; this
correspondence gives rise to the stripe pattern parallel to the time axis in the
space-time plot.
Rodiek et al. recently reported two distinct patterns of intracellular
thickness oscillations along the longitudinal body axis depending on the
locomotive speed of the freely migrating small tadpole-shaped plasmodium
[Rodiek et al., 2015] . Interestingly, one of them, referred as multinodal
standing wave-like pattern, seems to have a similar spatial structure with the
Jour
nal o
f Exp
erim
enta
l Bio
logy
• A
dvan
ce a
rtic
le
above mentioned thickness undulation pattern. That is, it has a large amplitude
oscillatory component with a relatively long period, about ten minutes, and a
fairly regular wavelength which is same order to the migratory distance during
the period. Exploring the correspondence further is left for future works.
4.4 Physiological role of the size-independent, long-term large
oscillation
Our observations indicate that plasmodia commonly have an internal
rhythm with a size-independent period that appears in many aspects of the
organism. It is useful to consider the physiological function of this rhythm in the
plasmodium. One of the important purposes of the organism during free
locomotion is exploitation of the surroundings. Thus, the long-term modulation
of speed determines a spatial sampling size of the environment, because in the
slower phase the organism stays in a given area for longer or is afforded a
chance to change direction by branching. On the other hand, the locomotion
speed may be largely modulated by various external signals such as changes in
the temperature, moisture, light level or chemical substances. Therefore,
exposure to such signals during locomotion might be recorded in the form of
thickness undulations in the longitudinal direction. This can be envisaged as a
kind of dynamic encoding of temporal information to the spatial structure.
Moreover, if the branching in small plasmodia is related to the vein network
structure of large plasmodia with a two-dimensional fan-like shape, the events
experienced are also recorded in the form of a two-dimensional mesh pattern in
large plasmodia. Therefore, if the one and two-dimensional body shape at a
given time represents a sequence of episodic events, the shape may influence
the future behaviour of the organism. The body shape of plasmodia could thus
be considered as a prototype of episodic memory.
4.5 Simple mathematical model for cell locomotion with thickness
undulation
In order to explore possibilities for the dynamic encoding of biochemical
Jour
nal o
f Exp
erim
enta
l Bio
logy
• A
dvan
ce a
rtic
le
activities into the body shape of the plasmodium, we try to construct a
mathematical model for cell locomotion.
The exponential decay of the thickness indicates that almost all
protoplasm is concentrated in the frontal part. Takagi et al. [Takagi et al., 2007]
have reported that a frontal tip amputated from a plasmodium during one-
dimensional locomotion can migrate for some time at the same speed as before
without the regular thickness oscillation. This self-migration of the amputated
frontal tip is evidence that migration ability can be localised at the frontal tip.
Furthermore, the fact that the migration lasts for only a short time [Takagi et al.,
2007] suggests that the engine in the frontal tip is a self-organised local
structure that is dynamically and stably maintained in the plasmodium system.
It has also been reported that the polarised intracellular chemical pattern
corresponds to the polarity of the plasmodium, for example the ATP
concentration is higher at the locomotion front and becomes lower towards the
tail [Mori et al., 1986, Ueda et al., 1987]. According to these facts, we can
consider the locomotion of plasmodium as the propagation of a polarised
protoplasm pulse based on an excitable system that can be expressed as a one-
dimensional reaction-diffusion system with two variables, c and h [Takagi et al.,
2007, Ueda et al., 2011]
= ( , ; ),t c xxc D c f c h a (1)
= ( , )t h xxh D h g c h (2)
Here, c = c(x,t) is the concentration of a chemical C that is responsible for the
sol-gel transformation, h = h(x,t) is the thickness of the body, a is the activity
level of C, x is a coordinate along the longitudinal direction, c hD D , 1
which implies that c h where h and c are slow and fast variables,
respectively. We assume that this is an excitable system where the parameter f
gives the bi-stability for c and h is a slow variable. For simplicity, we adopt
f(c,h;a) = c(1–c)(c–a)–h and g(c,h) = c – h, according to a FitzHugh-Nagumo
Jour
nal o
f Exp
erim
enta
l Bio
logy
• A
dvan
ce a
rtic
le
type system. This system has a travelling wave solution with speed ( )v . As
0 , the speed approaches 1
= 22
cv D a
[Kawahara and Tanaka, 1983].
This implies that the speed of the wave front is linearly dependent on the
activity level a and on the square root of the diffusion level cD of the chemical.
We now extend the model by introducing a slow modulation of the activity
level a of the sol-gel transformation only in the frontal region of the wave. We
assume this modulation results from unknown biochemical processes which are
independent of the body size. Figure11 shows a numerical result of the model
where a propagating wave with an oscillatory wave front and an undulating tail
was obtained. Here, the oscillation of the activity level in the frontal part
induces an oscillation of the thickness there (lower panel of figure11a). The
propagation speed of the waves is also temporally modulated as expected from
the exact calculation of the speed of the wave above in the case of constant
activity level (lower panel of figure11a). Figure11b shows a space-time plot of a
propagating solution. The thickness h modulation in the frontal tip remains in
the form of undulations superimposed on the wave whose baseline
exponentially decreases with time or distance from the frontal part. A similar
profile is shown in figure10a for a plasmodium. However, our understanding of
physiological basis, especially the physiological origin of the slow modulation,
is still poor. Further studies should be performed to verify this hypothesis. Jo
urna
l of E
xper
imen
tal B
iolo
gy •
Adv
ance
art
icle
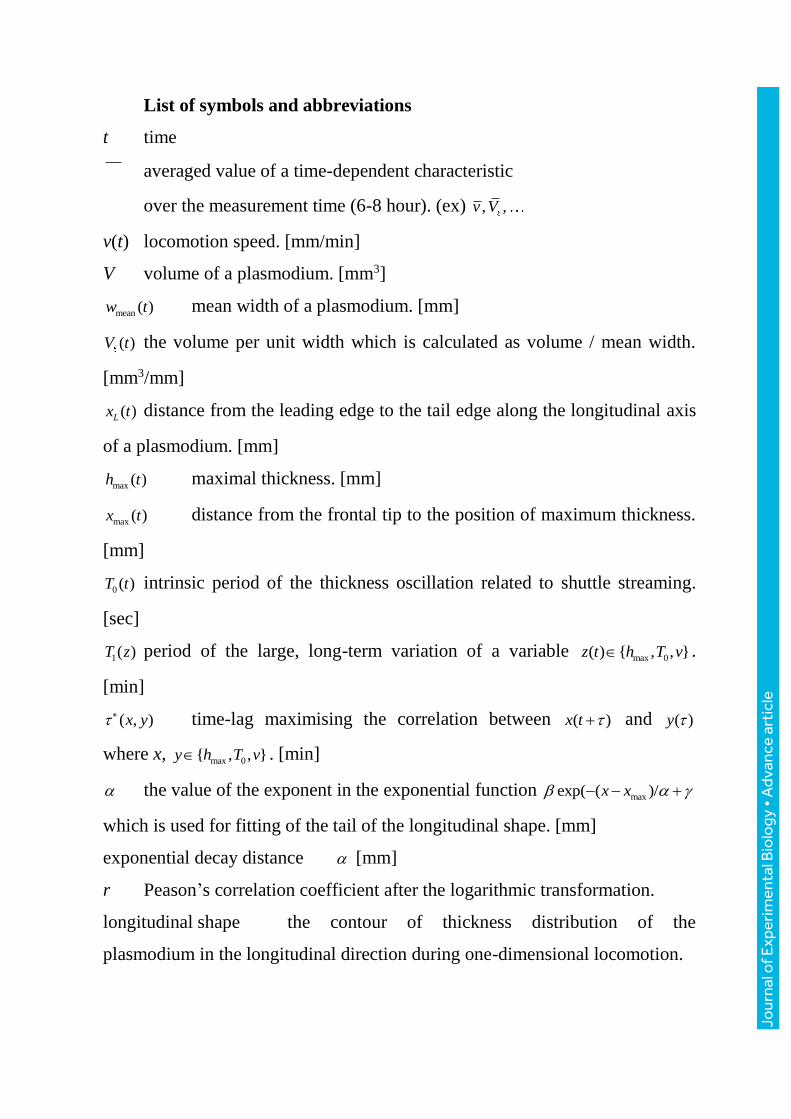
List of symbols and abbreviations
t time
averaged value of a time-dependent characteristic
over the measurement time (6-8 hour). (ex) , ,v V
v(t) locomotion speed. [mm/min]
V volume of a plasmodium. [mm3]
mean ( )w t mean width of a plasmodium. [mm]
( )V t the volume per unit width which is calculated as volume / mean width.
[mm3/mm]
( )Lx t distance from the leading edge to the tail edge along the longitudinal axis
of a plasmodium. [mm]
max ( )h t maximal thickness. [mm]
max ( )x t distance from the frontal tip to the position of maximum thickness.
[mm]
0 ( )T t intrinsic period of the thickness oscillation related to shuttle streaming.
[sec]
1( )T z period of the large, long-term variation of a variable max 0( ) { , , }z t h T v .
[min]
( , )x y time-lag maximising the correlation between ( )x t and ( )y
where x, max 0{ , , }y h T v . [min]
the value of the exponent in the exponential function maxexp( ( )/x x
which is used for fitting of the tail of the longitudinal shape. [mm]
exponential decay distance [mm]
r Peason’s correlation coefficient after the logarithmic transformation.
longitudinal shape the contour of thickness distribution of the
plasmodium in the longitudinal direction during one-dimensional locomotion.
Jour
nal o
f Exp
erim
enta
l Bio
logy
• A
dvan
ce a
rtic
le
Appendix (Determination of intrinsic period of thickness oscillation
0T )
Suppose that ( )fx t and ( )bx t are the positions of the leading edge and tail
edge on the longitudinal axis at time t, respectively, as described in the section
on Data Analysis. Taking the moving coordinate, u, with its origin always at the
leading edge, we obtained the time series of the thickness, ( ) = ( ( ) , )u fh t h x t u t , at
each relative position [0, ]bu u , where = { ( ) ( )}mintb b fu x t x t is the minimum tail
edge of the plasmodium. We now have / (= )bu x M time series for each
plasmodium, where x is a pixelated spatial unit. After respective time series
were normalized in zero mean and unity standard deviation, the M-dim time
series { ( )}uh t were projected on the principal components (PCs), and reduced to
M -dim time series { ( ); =1, , }jh t j M where M is the minimal number such
that the cumulative contribution ratio up to the M -th PC is larger than 70%. To
obtain the oscillatory component with periods in the range of a few ten second
to a few minutes, the thickness variation ( )jh t at each j was derived by
moving-averaging with the time-window 30 s (low-pass filtering) and
subtracting the moving averaged component with the time-window (0)T (high-
pass filtering) where (0)T is a initial putative mean period =80 s. By extracting
the peak times ,{ ; =1, , ( )}j nt n N j of ( )jh t , we obtained a series of the
oscillation period at each j, (1)
1,
2
( ) ( =1, , ( ) 1)jj n
T t n N j
where 1 , 1 ,,
2
= ( )/2j n j nj n
t t t
.
Then we obtained a new putative mean period (1)T by averaging (1)
,{ ( )}j j iT t over j
and ,j it after the removal of outliers. Moreover, a time series for the oscillation
period (1) ( )jT t at each j was reconstructed by linear interpolation of (1)
,( )j j iT t along
time axis. To obtain a more reliable estimation of the oscillation period, we
iterated the above procedure twice after replacing (0)T with (1)T and obtained
(3)T and (3){ ( )}jT t . Finally, (3)T and (3) ( )T t was adopted as the mean intrinsic
Jour
nal o
f Exp
erim
enta
l Bio
logy
• A
dvan
ce a
rtic
le

period, 0T , and the time series of the intrinsic period,
0 ( )T t , of the plasmodium,
where (3) ( )T t was given by average (3){ ( )}jT t over j after the removal of outliers.
Jour
nal o
f Exp
erim
enta
l Bio
logy
• A
dvan
ce a
rtic
le
Acknowledgements
We acknowledge helpful comments about dimensional analysis from Dr.
Yoshimi Tanaka.
Author contributions
All authors gave final approval of the version to be published.
Shigeru Kuroda
• substantial contributions to conception and design,
• substantial contributions to acquisition of data,
• substantial contributions to analysis and interpretation of data;
• drafting the article
• revising the draft critically for important intellectual content
Seiji Takagi
• substantial contributions to analysis and interpretation of data
Toshiyuki Nakagaki
• revising the draft critically for important intellectual content
Tetsuo Ueda
• substantial contributions to conception and design
• revising the draft critically for important intellectual content
Funding statement
This work was supported by the Strategic Japanese-Swedish Research
Cooperative Programme from JST and by JSPS KAKENHI Grant Number
26310202, a Grant-in-Aid for Scientific Research on Innovative Areas
‘Fluctuation and Structure’ (no. 25103006) and ‘Cross talk between moving
cells and microenvironment’ (no. 25111726) from Mext Japan.
Jour
nal o
f Exp
erim
enta
l Bio
logy
• A
dvan
ce a
rtic
le
References
[Akitaya et al., 1985] Akitaya, T., Ohsaka, S., Ueda, T., and Kobatake, Y.
(1985). Oscillations in intracellular atp, camp and cmgp concentration in
relation to rhythmical sporulation under continuous light in the myxomycete
physarum polycephalum. Journal of general microbiology, 131:195–200.
[Alexopoulos et al., 1996] Alexopoulos, C., Mims, C., and Blackwell, M.
(1996). Introductory mycology. John Wiley and Sons Inc., New York.
[Ashworth and Dee, 1975] Ashworth, J. and Dee, J. (1975). The Biology
of Slime Moulds. Edward Arnold.
[Barenblatt, 2003] Barenblatt, G. (2003). Scaling. Cambridege Univ.
Press.
[Calder III, 1996] Calder III, W. (1996). Size, function, and life history.
Dover.
[Coggin and Pazun, 1996] Coggin, S. and Pazun, J. (1996). Dynamic
complexity in physarum polycephalum shuttle streaming. Protoplasma,
194:243–249.
[de Gennes et al., 2004] de Gennes, P.-G., Brochard-Wyart, F., and
Quere, D. (2004). Capillarity and Wetting: Phenomena Drops, Bubbles, Pearls,
Waves. Springer.
[Inouye and Takeuchi, 1979] Inouye, K. and Takeuchi, I. (1979).
Analytical studies on migrating movement of the pseudoplasmodium of
dictyostelium discoideum. Protoplasma, 99:289–304.
[Ishigami et al., 1987] Ishigami, M., Kuroda, K., and Hatano, S. (1987).
Dynamic aspects of the contractile system in physarum. plasmodium. III. cyclic
contraction-relaxation of the plasmodial fragment in accordance with the.
generation-degeneration of cytoplasmic actomyosin fibrils. The journal of cell
biology, 105:381–386.
[Kamiya, 1959] Kamiya, N. (1959). Protoplasmic streaming.
Protoplasmatologia, 8:1–199.
Jour
nal o
f Exp
erim
enta
l Bio
logy
• A
dvan
ce a
rtic
le
[Kawahara and Tanaka, 1983] Kawahara, T. and Tanaka, M. (1983).
Interactions of traveling fronts: An exact solution of a nonlinear diffusion
equation. Physics Letters A, 97:311–314.
[Kessler, 1982] Kessler, D. (1982). Cell biology of Physarum and
Didymium, Vol.1, chapter Plasmodial morphology and motility, pages 145–208.
Academic Press, New York.
[Matsumoto et al., 2008] Matsumoto, K., Takagi, S., and Nakagaki, T.
(2008). Locomotive mechanism of physarum plasmodia based on spatiotemoral
analysis of protoplasmic streaming. Biophysical Jounal, 94.
[McMahon and Bonner, 1983] McMahon, T. and Bonner, J. (1983). On
size and life. Scientific American Library.
[Mori et al., 1986] Mori, Y., Matsumoto, K., Ueda, T., and Kobatake, Y.
(1986). Spatio-temporal organization of intracellular ATP content and
oscillation patterns in response to blue light by physarum polycephalum.
Protoplasma, 135:31–37.
[Rasband, 2011] Rasband, W. (1997-2011). Imagej. U.S. National
institute of health, bethesda, MD, USA http://imageJ.nih.gov/ij.
[R Development Core Team, 2012] R Development Core Team, R. D. C.
(2012). R: a language and environment for statistical computing.
[Rieu et al., 2005] Rieu, J.-P., Barentin, C., Maeda, Y., and Sawada, Y.
(2005). Direct mechanical force measurements during the migration of
dictyostelium slugs using flexible substrata. Biophysical journal, 89:3563–3576.
[Rodiek et al., 2015] Rodiek, B., Takagi, S., Ueda, T., and Hauser, M.
(2015). Patterns of cell thickness oscillations during directional migration of
physarum polycephalum. European physical journal, 10.1007/s00249-015-
1028-7:1–10.
[Schmidt-Nielsen, 1984] Schmidt-Nielsen, K. (1984). Scaling : Why is
animal size so important. Cambrigde Univ. Press.
Jour
nal o
f Exp
erim
enta
l Bio
logy
• A
dvan
ce a
rtic
le
[Shingleton, 2010] Shingleton, A. (2010). Allometry: the study of
biological scaling. Nature education knowledge, 1:2.
[Sokal and Rohlf, 1994] Sokal, R. and Rohlf, F. (1994). Biometry : The
principles and practice of statistics in biological research. W.H. Freeman and
company.
[Takagi et al., 2007] Takagi, S., Nishiura, Y., Nakagaki, T., Ueda, T., and
Ueda, K.-I. (2007). Indecisive behavior of amoeba crossing an environmental
barrier. In Yakubo, K., Amitsuka, H., Ishikawa, G., Machino, K., Nakagaki, T.,
Tanda, S., and Yamada, H. Kichiji, N., editors, Proceedings of Int. Symp. on
Topological aspects of critical systems and networks, pages 86–93.
[Takagi and Ueda, 2008] Takagi, S. and Ueda, T. (2008). Emergence and
transitions of dynamic patterns of thickness oscillation of the plasmodium of the
true slime mold physarum polycephalum. Physica D, 237:420–427.
[Ueda et al., 2011] Ueda, K.-I., Takagi, S., Nishiura, Y., and Nakagaki, T.
(2011). Mathematical model for contemplative amoeboid locomotion. Physical
Review E, 83:021916.
[Ueda, 2006] Ueda, T. (2006). An intelligent slime mold: a self-
organizing system of cell shape and information. In Armbruster, D., Kaneko,
K., and Mikhailov, A., editors, Networks of interacting machines: Production
organization in complex industrial systems and biological cells, volume 3 of
World scientific lecture notes in complex systems, chapter 9, pages 221–245.
World scientific.
[Ueda and Kobatake, 1980] Ueda, T. and Kobatake, Y. (1980).
Contraction rhythm in the plasmodium of physarum polycephalum: Dependence
of the period on the amplitude, temperature and chemical environment. Eur J
Cell Biol, 23:37–42.
[Ueda and Kobatake, 1982] Ueda, T. and Kobatake, Y. (1982). Initiation,
development and termination of contraction rhythm in plasmoida of
myxomycete physarum ploycephalum. J Theor Biol, 97:87–93.
Jour
nal o
f Exp
erim
enta
l Bio
logy
• A
dvan
ce a
rtic
le
[Ueda et al., 1987] Ueda, T., Mori, Y., and Kobatake, Y. (1987). Patterns
in the distribution of intracellular ATP concentration in relation to coordination
of amoeboid cell behavior in physarum polycephalum. Experimental Cell
Research, 169:191–201.
[Ueda et al., 1975] Ueda, T., Terayama, K., Kurihara, K., and Kobatake,
Y. (1975). Threshold phenomena in chemoreception and taxis in slime mold
physarum polycephalum. J Gen Physiol, 65:223–234.
[Vouk, 1910] Vouk, V. (1910). Untersuchungen über die bewegungen der
plasmodien. i. teil. die rhythmik der protoplasmaströmung. Sitzungsber. Kais.
Akad. Wissensch. Wien, math.-naturwiss. Kl., 119:853–876.
Jour
nal o
f Exp
erim
enta
l Bio
logy
• A
dvan
ce a
rtic
le
Figures
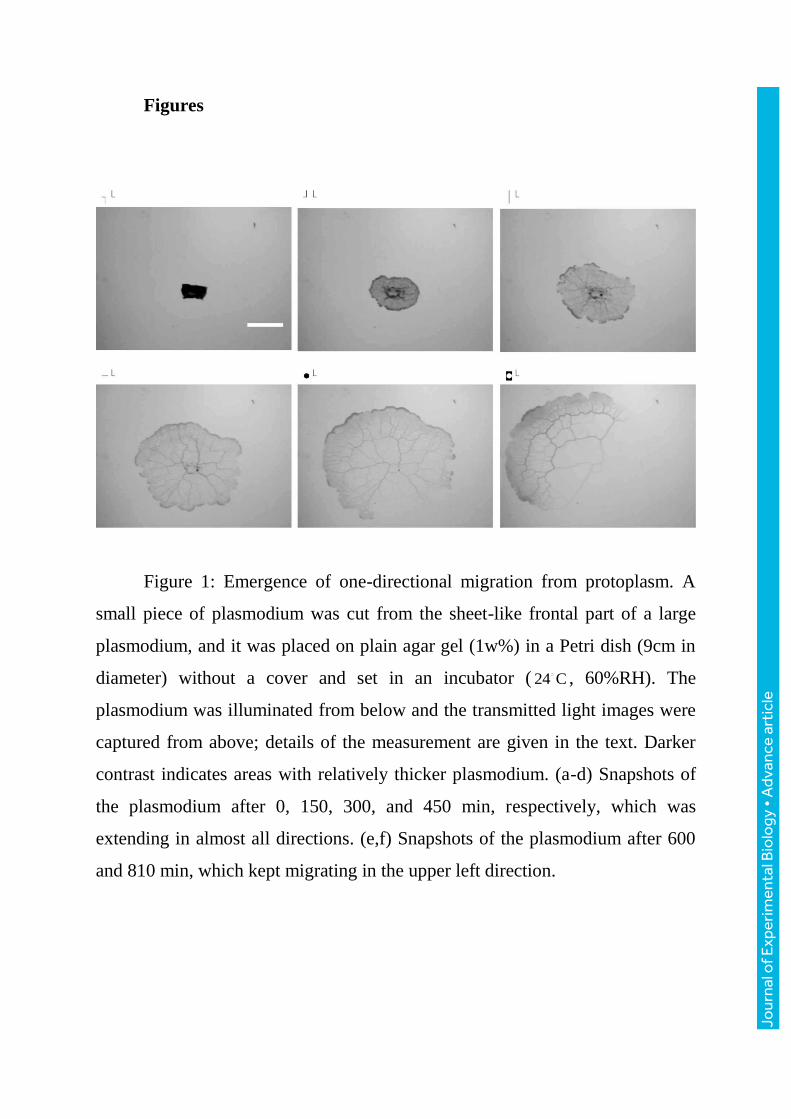
Figure 1: Emergence of one-directional migration from protoplasm. A
small piece of plasmodium was cut from the sheet-like frontal part of a large
plasmodium, and it was placed on plain agar gel (1w%) in a Petri dish (9cm in
diameter) without a cover and set in an incubator ( 24 C , 60%RH). The
plasmodium was illuminated from below and the transmitted light images were
captured from above; details of the measurement are given in the text. Darker
contrast indicates areas with relatively thicker plasmodium. (a-d) Snapshots of
the plasmodium after 0, 150, 300, and 450 min, respectively, which was
extending in almost all directions. (e,f) Snapshots of the plasmodium after 600
and 810 min, which kept migrating in the upper left direction.
Jour
nal o
f Exp
erim
enta
l Bio
logy
• A
dvan
ce a
rtic
le
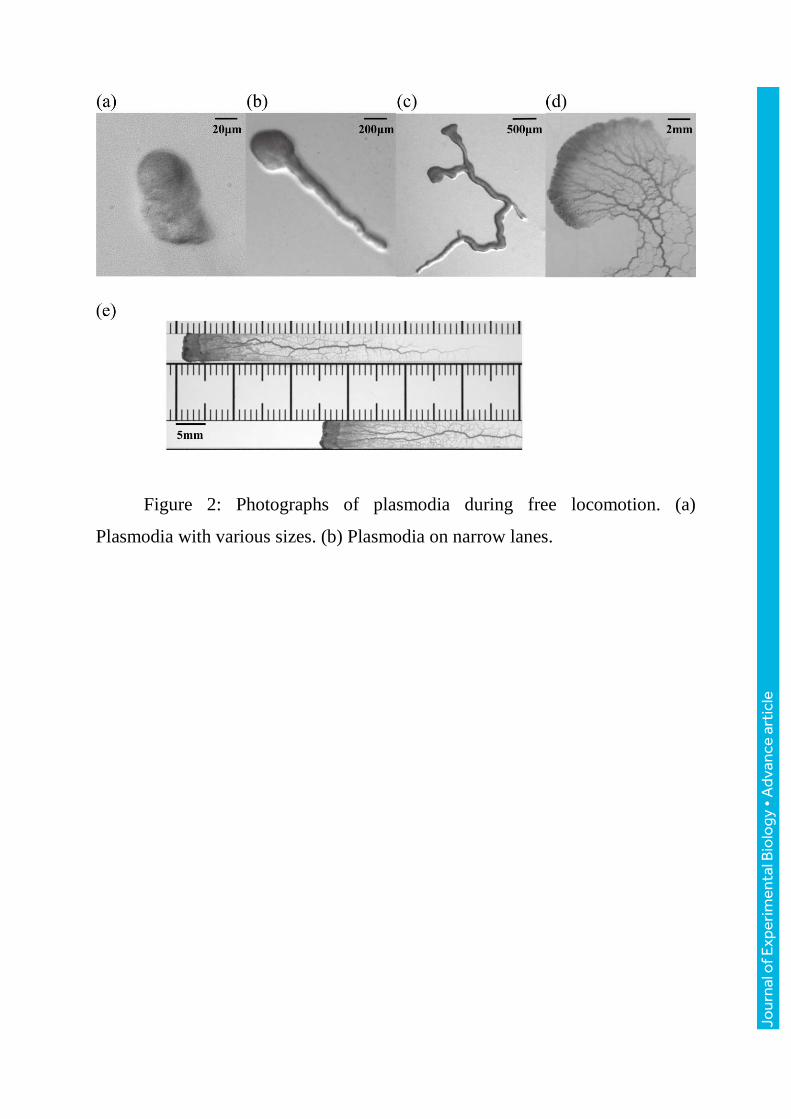
Figure 2: Photographs of plasmodia during free locomotion. (a)
Plasmodia with various sizes. (b) Plasmodia on narrow lanes.
Jour
nal o
f Exp
erim
enta
l Bio
logy
• A
dvan
ce a
rtic
le
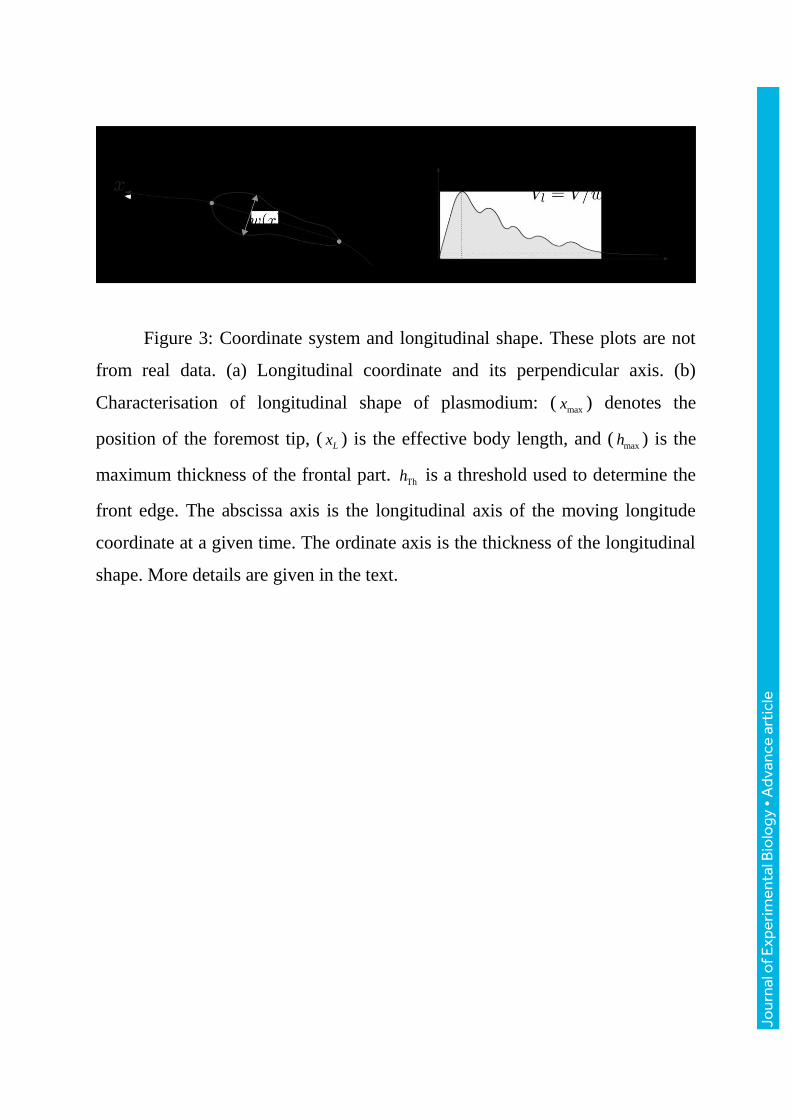
Figure 3: Coordinate system and longitudinal shape. These plots are not
from real data. (a) Longitudinal coordinate and its perpendicular axis. (b)
Characterisation of longitudinal shape of plasmodium: ( maxx ) denotes the
position of the foremost tip, ( Lx ) is the effective body length, and ( maxh ) is the
maximum thickness of the frontal part. Thh is a threshold used to determine the
front edge. The abscissa axis is the longitudinal axis of the moving longitude
coordinate at a given time. The ordinate axis is the thickness of the longitudinal
shape. More details are given in the text.
Jour
nal o
f Exp
erim
enta
l Bio
logy
• A
dvan
ce a
rtic
le
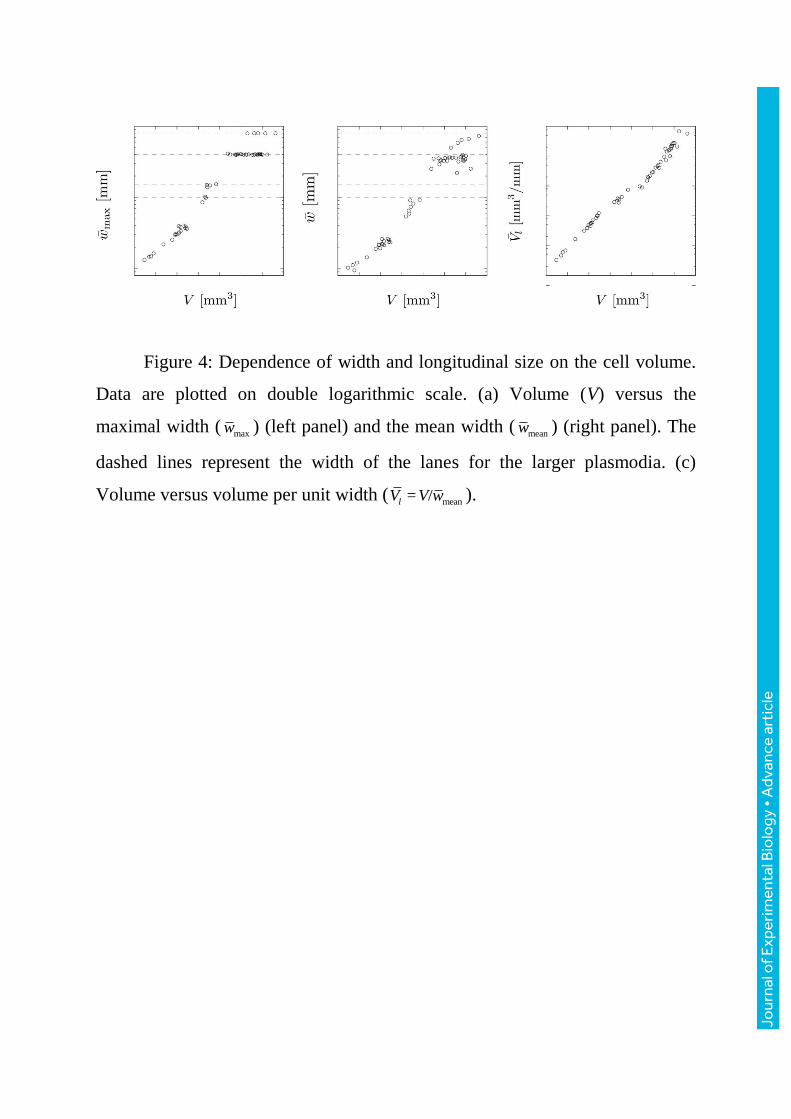
Figure 4: Dependence of width and longitudinal size on the cell volume.
Data are plotted on double logarithmic scale. (a) Volume (V) versus the
maximal width (maxw ) (left panel) and the mean width (
meanw ) (right panel). The
dashed lines represent the width of the lanes for the larger plasmodia. (c)
Volume versus volume per unit width ( mean= /lV V w ).
Jour
nal o
f Exp
erim
enta
l Bio
logy
• A
dvan
ce a
rtic
le
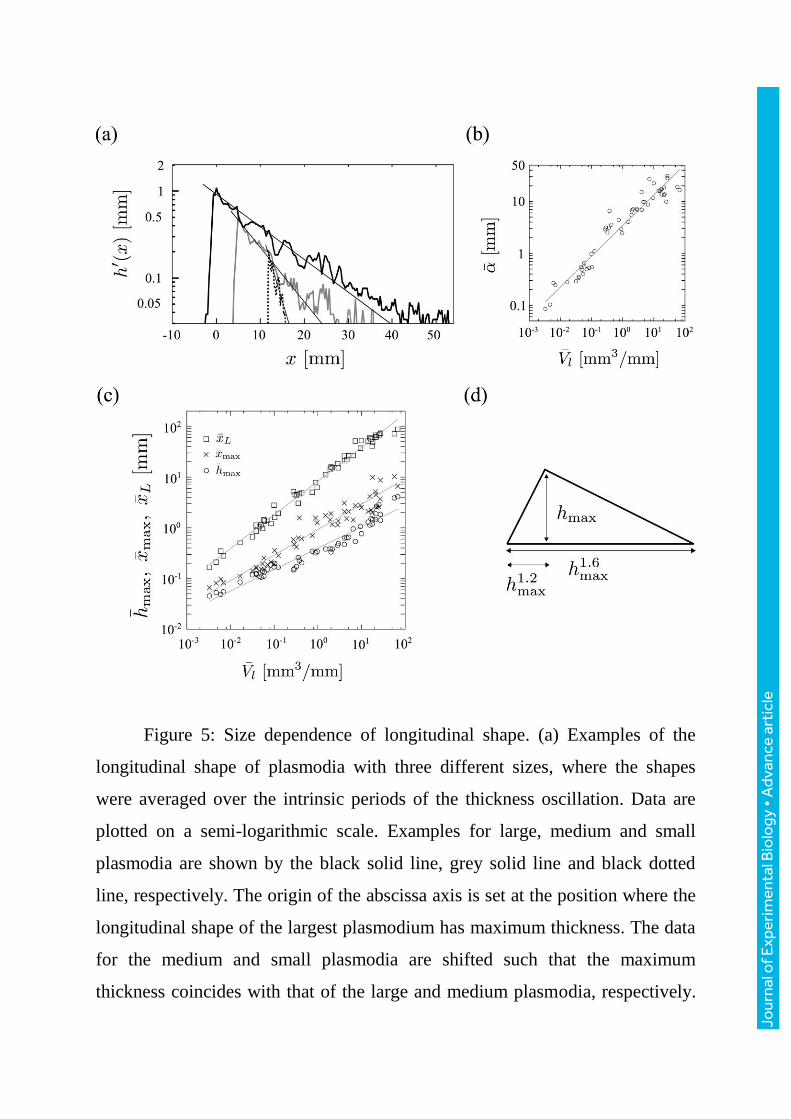
Figure 5: Size dependence of longitudinal shape. (a) Examples of the
longitudinal shape of plasmodia with three different sizes, where the shapes
were averaged over the intrinsic periods of the thickness oscillation. Data are
plotted on a semi-logarithmic scale. Examples for large, medium and small
plasmodia are shown by the black solid line, grey solid line and black dotted
line, respectively. The origin of the abscissa axis is set at the position where the
longitudinal shape of the largest plasmodium has maximum thickness. The data
for the medium and small plasmodia are shifted such that the maximum
thickness coincides with that of the large and medium plasmodia, respectively.
Jour
nal o
f Exp
erim
enta
l Bio
logy
• A
dvan
ce a
rtic
le
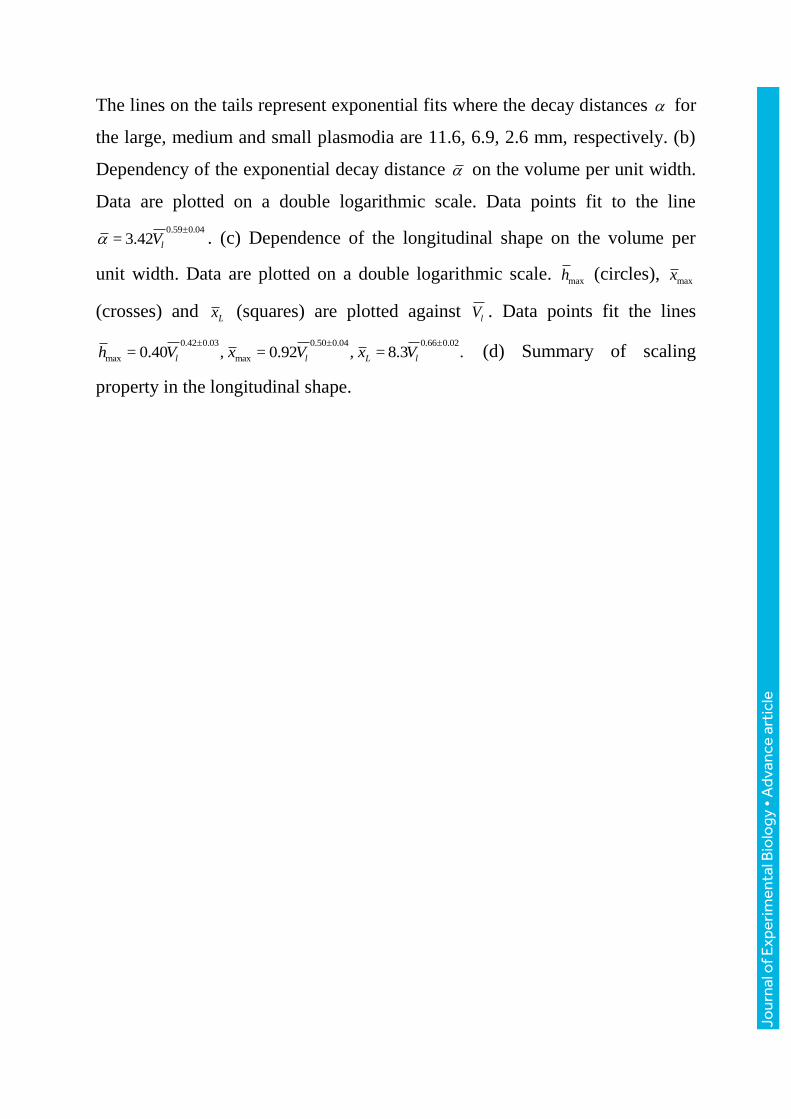
The lines on the tails represent exponential fits where the decay distances for
the large, medium and small plasmodia are 11.6, 6.9, 2.6 mm, respectively. (b)
Dependency of the exponential decay distance on the volume per unit width.
Data are plotted on a double logarithmic scale. Data points fit to the line
0.59 0.04
= 3.42 lV
. (c) Dependence of the longitudinal shape on the volume per
unit width. Data are plotted on a double logarithmic scale. maxh (circles), maxx
(crosses) and Lx (squares) are plotted against
lV . Data points fit the lines
0.42 0.03 0.50 0.04 0.66 0.02
max max= 0.40 , = 0.92 , = 8.3 .l l L lh V x V x V
(d) Summary of scaling
property in the longitudinal shape.
Jour
nal o
f Exp
erim
enta
l Bio
logy
• A
dvan
ce a
rtic
le
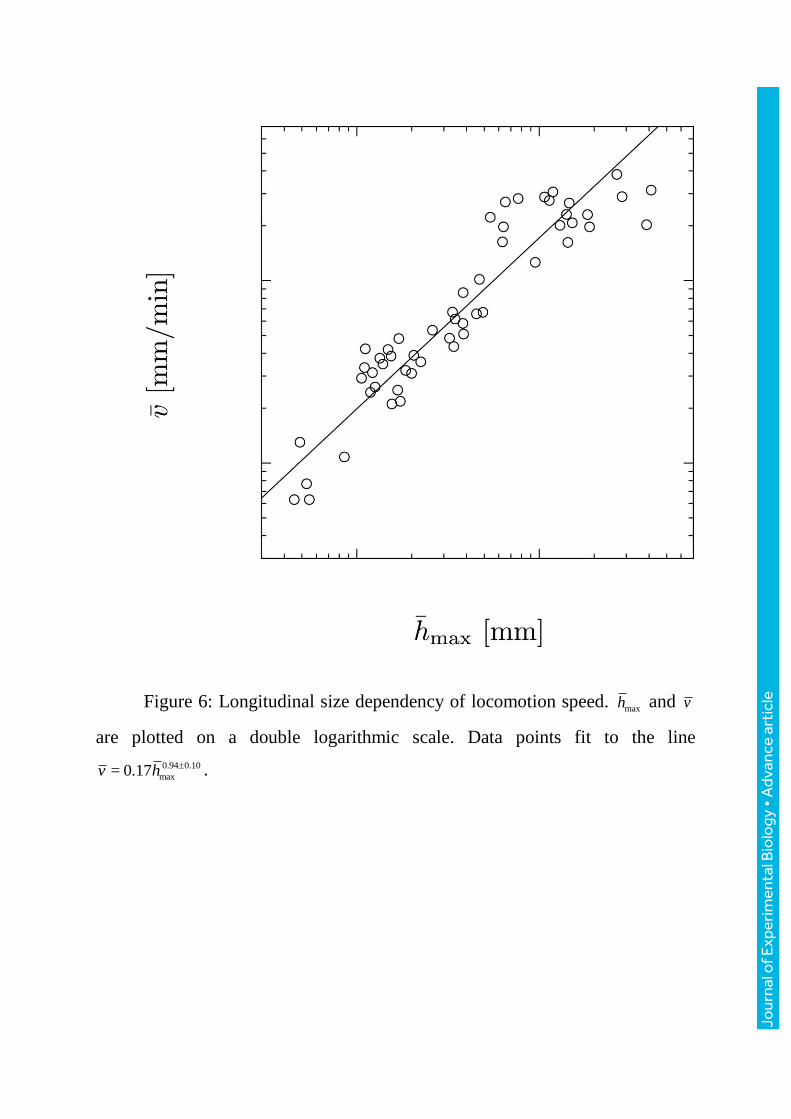
Figure 6: Longitudinal size dependency of locomotion speed. maxh and v
are plotted on a double logarithmic scale. Data points fit to the line
0.94 0.10
max= 0.17v h . Jo
urna
l of E
xper
imen
tal B
iolo
gy •
Adv
ance
art
icle
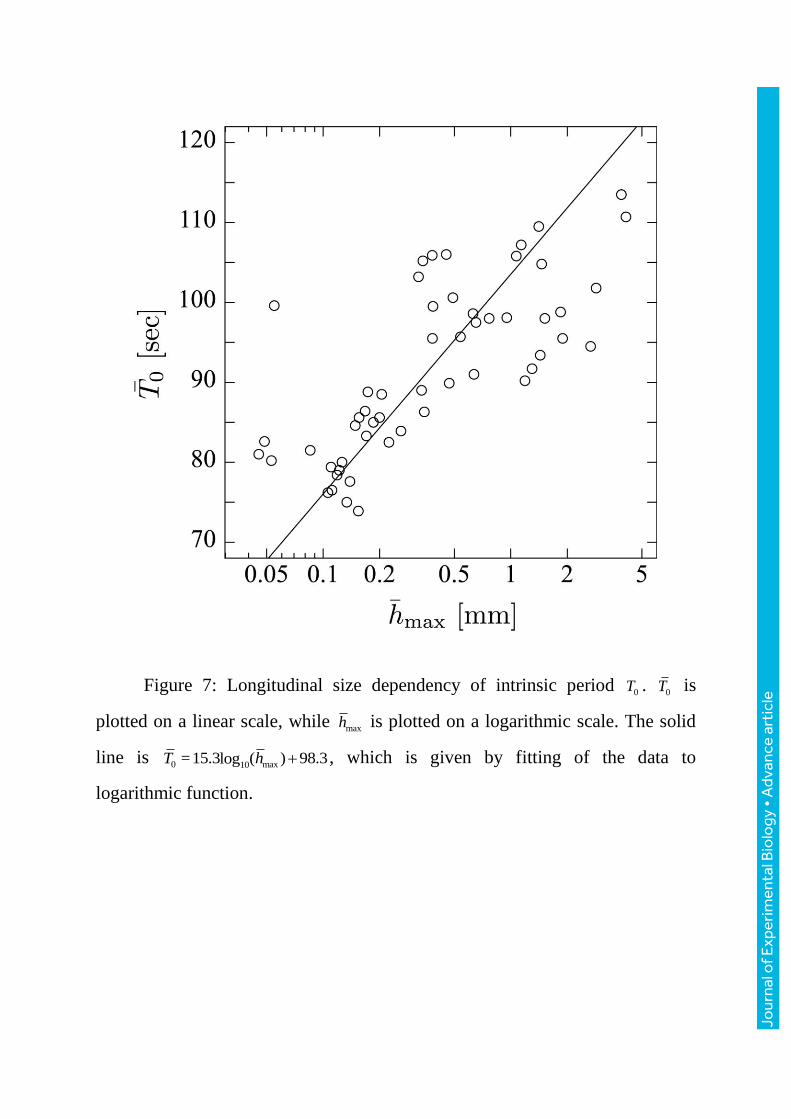
Figure 7: Longitudinal size dependency of intrinsic period 0T . 0T is
plotted on a linear scale, while maxh is plotted on a logarithmic scale. The solid
line is 0 max10=15.3 ( ) 98.3logT h , which is given by fitting of the data to
logarithmic function.
Jour
nal o
f Exp
erim
enta
l Bio
logy
• A
dvan
ce a
rtic
le
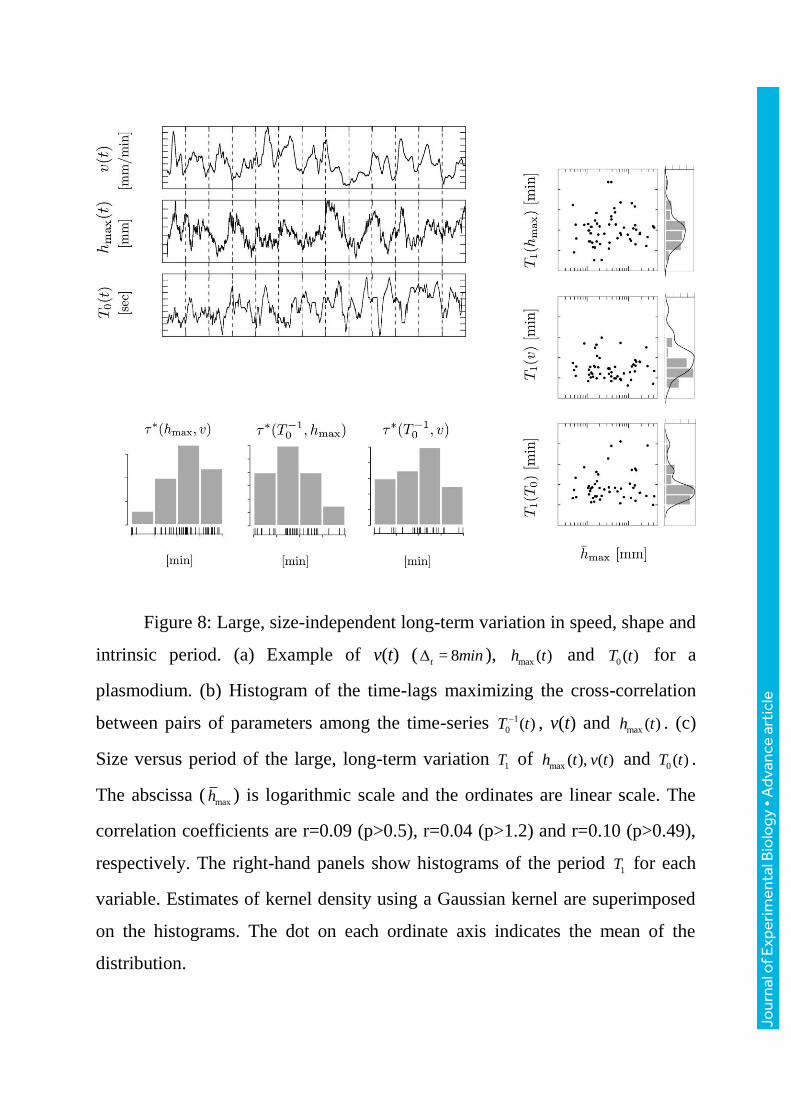
Figure 8: Large, size-independent long-term variation in speed, shape and
intrinsic period. (a) Example of v(t) ( = 8t min ), max ( )h t and 0 ( )T t for a
plasmodium. (b) Histogram of the time-lags maximizing the cross-correlation
between pairs of parameters among the time-series 1
0 ( )T t , v(t) and max ( )h t . (c)
Size versus period of the large, long-term variation 1T of max ( ), ( )h t v t and 0 ( )T t .
The abscissa ( maxh ) is logarithmic scale and the ordinates are linear scale. The
correlation coefficients are r=0.09 (p>0.5), r=0.04 (p>1.2) and r=0.10 (p>0.49),
respectively. The right-hand panels show histograms of the period 1T for each
variable. Estimates of kernel density using a Gaussian kernel are superimposed
on the histograms. The dot on each ordinate axis indicates the mean of the
distribution.
Jour
nal o
f Exp
erim
enta
l Bio
logy
• A
dvan
ce a
rtic
le
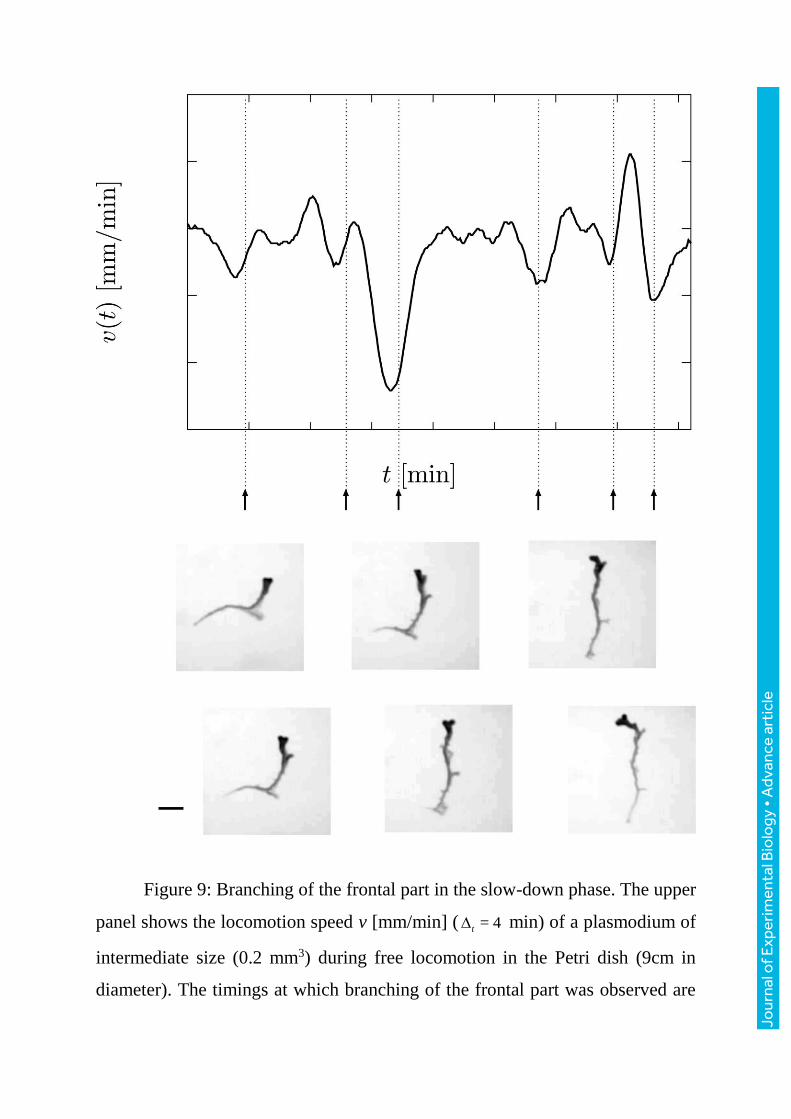
Figure 9: Branching of the frontal part in the slow-down phase. The upper
panel shows the locomotion speed v [mm/min] ( = 4t min) of a plasmodium of
intermediate size (0.2 mm3) during free locomotion in the Petri dish (9cm in
diameter). The timings at which branching of the frontal part was observed are
Jour
nal o
f Exp
erim
enta
l Bio
logy
• A
dvan
ce a
rtic
le
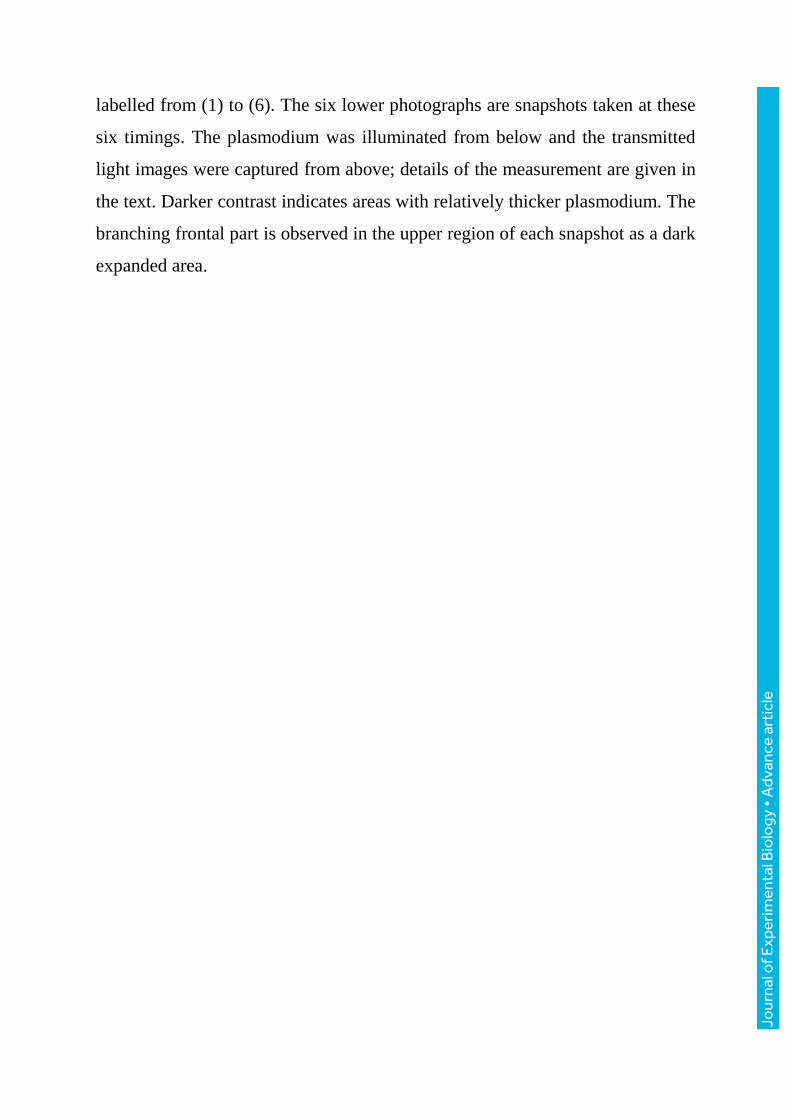
labelled from (1) to (6). The six lower photographs are snapshots taken at these
six timings. The plasmodium was illuminated from below and the transmitted
light images were captured from above; details of the measurement are given in
the text. Darker contrast indicates areas with relatively thicker plasmodium. The
branching frontal part is observed in the upper region of each snapshot as a dark
expanded area.
Jour
nal o
f Exp
erim
enta
l Bio
logy
• A
dvan
ce a
rtic
le
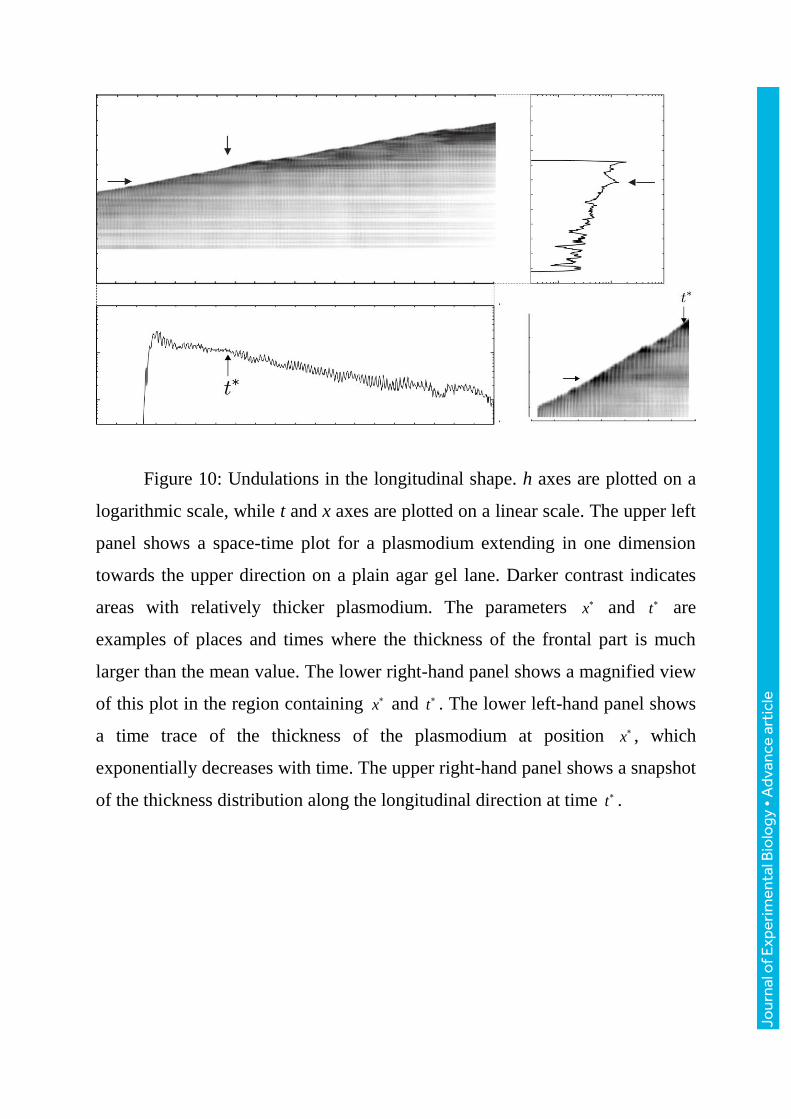
Figure 10: Undulations in the longitudinal shape. h axes are plotted on a
logarithmic scale, while t and x axes are plotted on a linear scale. The upper left
panel shows a space-time plot for a plasmodium extending in one dimension
towards the upper direction on a plain agar gel lane. Darker contrast indicates
areas with relatively thicker plasmodium. The parameters x and t are
examples of places and times where the thickness of the frontal part is much
larger than the mean value. The lower right-hand panel shows a magnified view
of this plot in the region containing x and t . The lower left-hand panel shows
a time trace of the thickness of the plasmodium at position x , which
exponentially decreases with time. The upper right-hand panel shows a snapshot
of the thickness distribution along the longitudinal direction at time t .
Jour
nal o
f Exp
erim
enta
l Bio
logy
• A
dvan
ce a
rtic
le
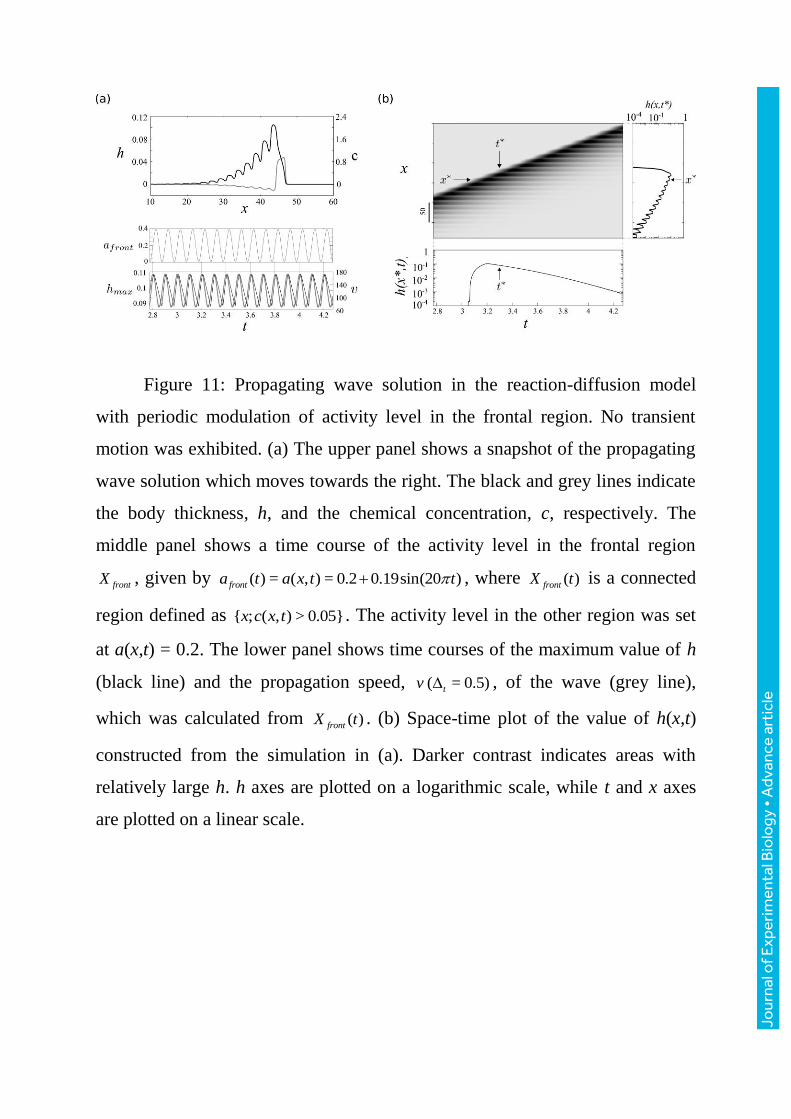
Figure 11: Propagating wave solution in the reaction-diffusion model
with periodic modulation of activity level in the frontal region. No transient
motion was exhibited. (a) The upper panel shows a snapshot of the propagating
wave solution which moves towards the right. The black and grey lines indicate
the body thickness, h, and the chemical concentration, c, respectively. The
middle panel shows a time course of the activity level in the frontal region
frontX , given by ( ) = ( , ) = 0.2 0.19sin(20 )fronta t a x t t , where ( )frontX t is a connected
region defined as { ; ( , ) > 0.05}x c x t . The activity level in the other region was set
at a(x,t) = 0.2. The lower panel shows time courses of the maximum value of h
(black line) and the propagation speed, ( = 0.5)tv , of the wave (grey line),
which was calculated from ( )frontX t . (b) Space-time plot of the value of h(x,t)
constructed from the simulation in (a). Darker contrast indicates areas with
relatively large h. h axes are plotted on a logarithmic scale, while t and x axes
are plotted on a linear scale.
Jour
nal o
f Exp
erim
enta
l Bio
logy
• A
dvan
ce a
rtic
le