Embed Size (px)
Citation preview

Filed: 2016-05-27 EB-2016-0152
Exhibit F3 Tab 1
Schedule 1 Page 1 of 19
ALLOCATION OF 1
SUPPORT SERVICES COSTS 2
3
1.0 PURPOSE 4
The purpose of this evidence is to describe the Support Services costs assigned and 5
allocated to the nuclear business as well as the underpinning cost allocation 6
methodology. 7
8
2.0 OVERVIEW 9
Support services costs assigned and allocated to the nuclear business unit are $448.9M, 10
$437.2M, $442.7M, $445.0M, and $454.1M for the test period 2017 to 2021, as 11
presented in Ex. F3-1-1 Table 3. 12
13
Support Services include Business and Administrative Services, Finance, People and 14
Culture, Commercial Operations and Environment, and Corporate Centre. As centre-led 15
organizations in OPG, Support Services provide support to the nuclear business. A 16
description of Support Services is provided in section 3. 17
18
Support Services costs are either directly assigned or allocated to the regulated 19
businesses. OPG directly assigns costs that are directly related to a business unit. For 20
example, Support Services employees working at, and solely in support of, a business 21
unit would be directly assigned to that business unit. Support Services costs that are 22
associated with services utilized by more than one business unit are allocated based on 23
appropriate cost drivers, which reflect cost causation or benefits received by the 24
business unit. The methods of cost allocation are provided in section 5. 25
26
OPG’s cost allocation methodology is the same as the methodology that was approved 27
by the OEB in EB-2013-0321, EB-2010-0008 and EB-2007-0905. The methodology was 28
reviewed in EB-2013-0321 (Ex. F5-5-1) by independent cost allocation expert HSG 29
Group Inc. (“HSG”). HSG concluded that the methodology to assign and allocate costs 30

Filed: 2016-05-27 EB-2016-0152 Exhibit F3 Tab 1 Schedule 1 Page 2 of 19
met best practices and was consistent with cost allocation precedents established by the 1
OEB, and that the allocated costs met the requirements of the OEB’s “3-prong test”. 2
3
3.0 SUPPORT SERVICES COSTS – TOTAL OM&A 4
Exhibit F3-1-1 Table 1 summarizes the total OPG Support Services costs over the 2013 5
to 2021 period. Support Services costs are relatively stable during the test period. 6
7
Support Services costs decrease over the 2013 to 2015 period that coincides with the 8
implementation of a centre-led organization driven by the Business Transformation 9
initiative. Support Services groups leveraged attrition by not replacing staff that retired, 10
took advantage of economies of scale by consolidating staff that perform similar work, 11
and streamlined processes. 12
13
In 2011, OPG commenced the Business Transformation initiative to improve its cost 14
structure and to design a more efficient and effective organization. This initiative led to 15
the creation of a centre-led organizational structure, reduced the number of OPG 16
employees and introduced changes to eliminate work, improve processes and achieve 17
efficiencies. The Business Transformation initiative is described further at Ex. A4-1-1 of 18
OPG’s evidence in EB-2013-0321. While Business Transformation has ended as a 19
discrete initiative, efforts to continually improve and manage OPG’s resources are 20
embedded in day-to-day operations and business planning processes. 21
22
Only through continuous improvement and increased productivity will OPG be able to 23
achieve the challenging targets set out in its Business Plan. For example, the Business 24
Plan includes the initiatives for Business and Administrative Services (“BAS”) to drive 25
continuous improvement (see OPG’s 2016-2018 Business Plan and three-year financial 26
projection at Ex. A2-2-1 Attachment 1, Appendix 8 for further details). 27
28
In computing the nuclear payment amounts, OPG has applied a 0.3 per cent stretch 29
factor to the revenue requirement resulting from the company’s nuclear Base OM&A and 30
Support Services costs allocated to the nuclear business (see Ex. A1-3-2). OPG’s 31

Filed: 2016-05-27 EB-2016-0152
Exhibit F3 Tab 1
Schedule 1 Page 3 of 19
stretch factor proposal provides a meaningful performance incentive during the term of 1
this Application. The proposed stretch reductions are in addition to efficiencies and 2
performance improvements within the company’s business planning processes. 3
4
Exhibit F3-1-1 Table 3 presents the Support Services costs assigned and allocated to 5
nuclear over the historical, bridge, and test years. Performance initiatives incorporated 6
into the business planning process and the corresponding performance and operational 7
efficiency improvements are reflected in the forecast expenditures in this Application. 8
The Support Services costs shown in this Exhibit do not reflect application of the stretch 9
factor, which is shown separately in Ex. A1-3-2. 10
11
3.1 Business and Administrative Services 12
BAS manages the following functions: Information Technology, Real Estate, and Supply 13
Chain. The BAS functions have not changed since EB-2013-0321. 14
15
Information Technology (“IT”) 16
The IT group oversees OPG's information management and information technology 17
needs. IT is accountable for the strategic planning, management and operations of all 18
business and technical information systems, but does not support process computers 19
that control plant systems and operations. IT also administers OPG’s information 20
management and governing documents framework. 21
22
Information technology services are provided through a combination of internal staff and 23
an outsource service contract with New Horizon System Solutions (“NHSS”), owned by 24
Capgemini. NHSS delivers application and infrastructure management services across 25
OPG. OPG IT provides application management services to Commercial Operations due 26
to the commercially sensitive nature of the applications, as well as specific infrastructure 27
and application management services to staff at the hydroelectric sites. 28
29
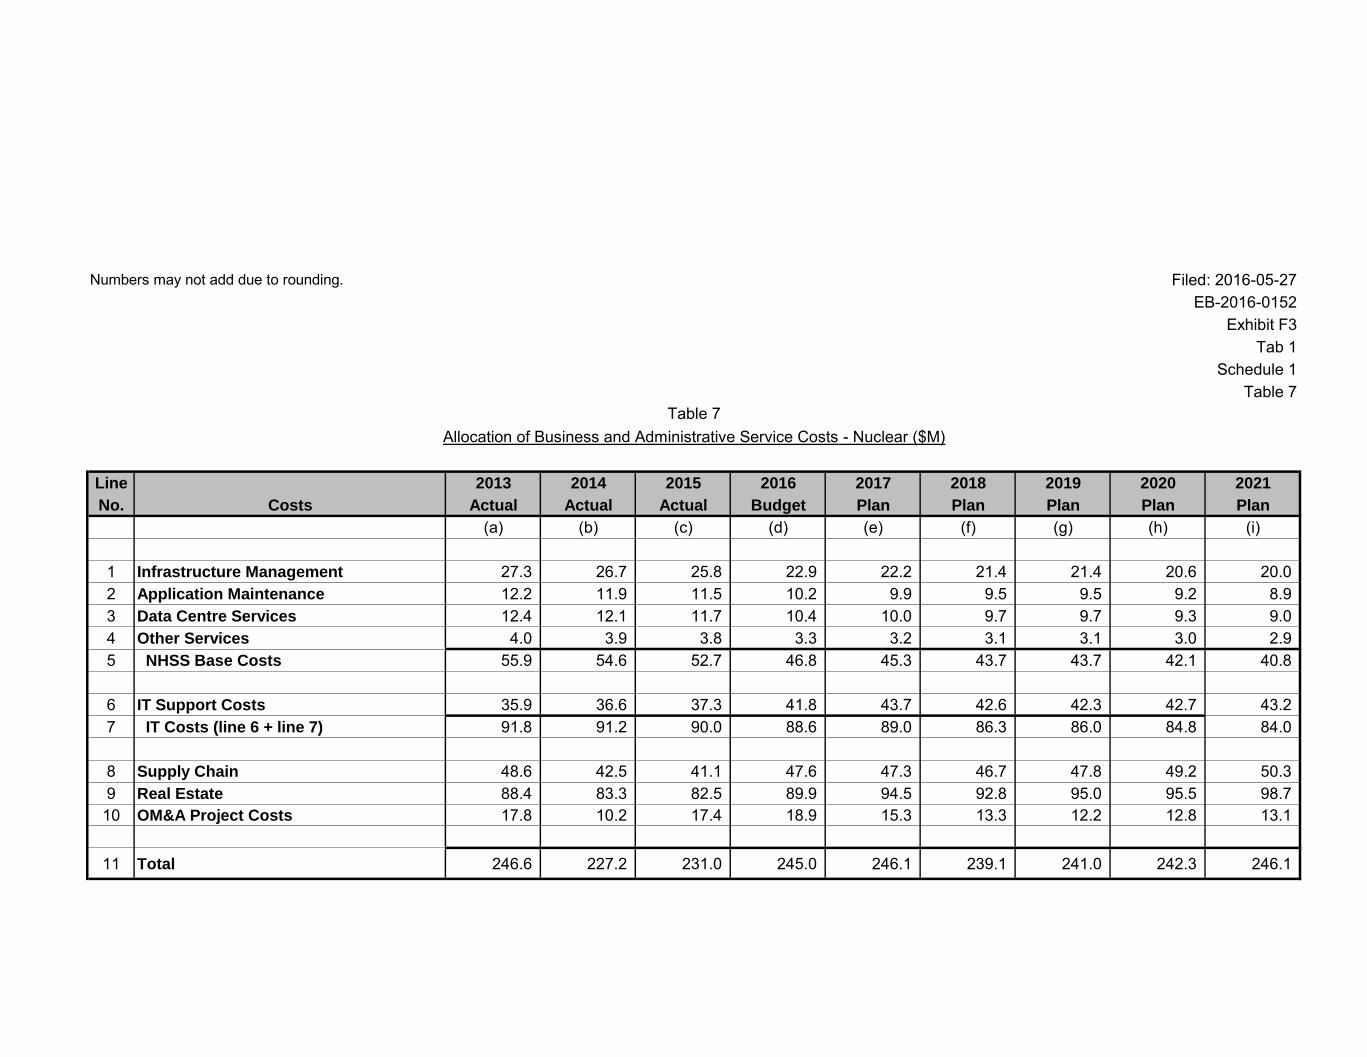
Exhibit F3-1-1 Table 7 presents BAS costs that are assigned and allocated to nuclear 30
over the historical, bridge, and test years. The costs related to NHSS services, which 31
Filed: 2016-05-27 EB-2016-0152 Exhibit F3 Tab 1 Schedule 1 Page 4 of 19
include Infrastructure Management, Application Maintenance, Data Centre Services, and 1
Other Services, are explained in more detail below. 2
3
Infrastructure Management costs refer to volume-based costs for NHSS services such 4
as network management for both data and voice, end-user services such as service 5
desk management and desktop support, IT security, disaster recovery and business 6
continuity planning. 7
8
Application Maintenance costs cover NHSS services for providing day-to-day support for 9
OPG’s business applications including: application maintenance and support, 10
applications operations and monitoring, application upgrades, database and middleware 11
support. IT also works closely with application owners to plan for patches and technical 12
upgrades, life cycle planning, release management, testing and commissioning and 13
overall demand management. 14
15
Data Centre Service costs are NHSS services related to the management of the 16
mainframe and servers, storage and backup system, capacity planning and performance 17
tuning, system operations and monitoring and IT facilities. 18
19
The Other Services, referred to in the tables, include NHSS fixed costs for services such 20
as Account Management (contract governance), Service Management (incident, 21
problem, asset and configuration management as well as operational and service level 22
reporting), Commercial Operations Systems operations, monitoring and support. 23
24
The IT Support Costs identified in the tables refer to the cost of the internal IT support 25
groups providing IT Service and Project Portfolio management, IT Enterprise Strategy 26
and Architecture and IT Programming and Performance Management. 27
28
Real Estate 29
The Real Estate group provides centralized support services through three departments: 30
Real Estate Services, Facilities and Projects, and Business Infrastructure Services. 31

Filed: 2016-05-27 EB-2016-0152
Exhibit F3 Tab 1
Schedule 1 Page 5 of 19
1
Real Estate Services 2
On a corporate-wide basis, Real Estate Services acquires, manages and disposes of 3
real estate rights and interests; manages all commercial leases; consults on municipal 4
planning issues; maintains real estate and property documents; develops and 5
implements accommodation strategies to meet space requirements outside the 6
generating stations; and, provides property tax services for all property owned by OPG. 7
8
Facility and Projects 9
Facility and Projects provides property management services, space planning, furniture 10
and facility project management; and company-wide fleet administration. In addition, 11
emergency response services are provided for all facilities under its control, along with 12
generating station support as requested. 13
14
Business Infrastructure Services 15
Business Infrastructure Services provides a suite of administrative services to OPG 16
clients including: records management and storage; document processing; graphics and 17
printing services; mail and courier service, audio/visual; office equipment and supplies; 18
library services; Real Estate Services call centre; and administrative support for staff 19
located at OPG Head Office, Pickering, and Darlington, as well as other nuclear groups 20
located at certain facilities in Durham Region. 21
22
Real Estate OM&A consists of costs to support these services, as well as costs of 23
managing common real estate assets. The generation businesses are charged an asset 24
service fee related to the use of these common assets (Ex. F3-2-1). 25
26
Exhibit F3-1-1 Tables 7 summarizes Real Estate costs assigned and allocated to nuclear 27
over the historical, bridge, and test years. 28
29
30
31

Filed: 2016-05-27 EB-2016-0152 Exhibit F3 Tab 1 Schedule 1 Page 6 of 19
Supply Chain 1
The Supply Chain group is responsible for procuring services and materials and 2
managing contracts for OPG. Supply Chain focuses on maintaining integrity in the 3
procurement process, delivering value for money and protecting OPG’s assets. In 4
addition, Supply Chain performs market analysis and develops long-term sourcing 5
strategies for the supply of uranium. 6
7
Exhibit F3-1-1 Table 7 summarizes Supply Chain costs assigned and allocated to 8
nuclear over the historical, bridge, and test years. 9
10
3.2 Finance 11
Finance provides strategic advice, services, and support in the areas of controllership, 12
investment planning, treasury and fund management. On behalf of the company, it 13
prepares financial statements and maintains accounting policies and procedures in 14
accordance with U.S. Generally Accepted Accounting Principles. 15
16
Controllership 17
Controllership provides services directly to Nuclear, Hydroelectric, Thermal and Support 18
Services groups. Staff are directly assigned to the business units and are located at the 19
production sites they support. Controllership also provides shared financial services 20
(e.g., accounting, processing of billings, accounts payables, business expenses, etc.), 21
business planning and reporting, and income and commodity tax services. 22
23
Investment Planning 24
Investment Planning develops and evaluates major projects and strategic initiatives, 25
develops guidelines for and provides advice on business cases and lifecycle plans; 26
develops models combining engineering and financial aspects for evaluating business 27
decisions and for valuing capital investments; and designs and conducts risk 28
assessments. 29
30
31
Filed: 2016-05-27 EB-2016-0152
Exhibit F3 Tab 1
Schedule 1 Page 7 of 19
Treasury and Fund Management 1
The Treasury group is responsible for cash management, financial exposure 2
management and capital structure management. The Risk Management and Insurance 3
department is responsible for OPG’s insurance program, claims processing and contract 4
reviews. 5
6
Fund Management has the responsibility for management and oversight of OPG’s 7
Nuclear Used Fuel Fund, Nuclear Decommissioning Fund, and OPG’s Pension Fund. 8
The investment management of these three funds has been outsourced to third party 9
investment managers. Management and oversight of the three funds includes 10
recommending the strategic asset mix of the funds, monitoring compliance with 11
legislation and agreements, selection of investment managers, carrying out due 12
diligence audits, and providing monitoring and oversight of the fund activities. 13
14
CFO Office 15
The CFO Office manages the Finance Business Unit. 16
17
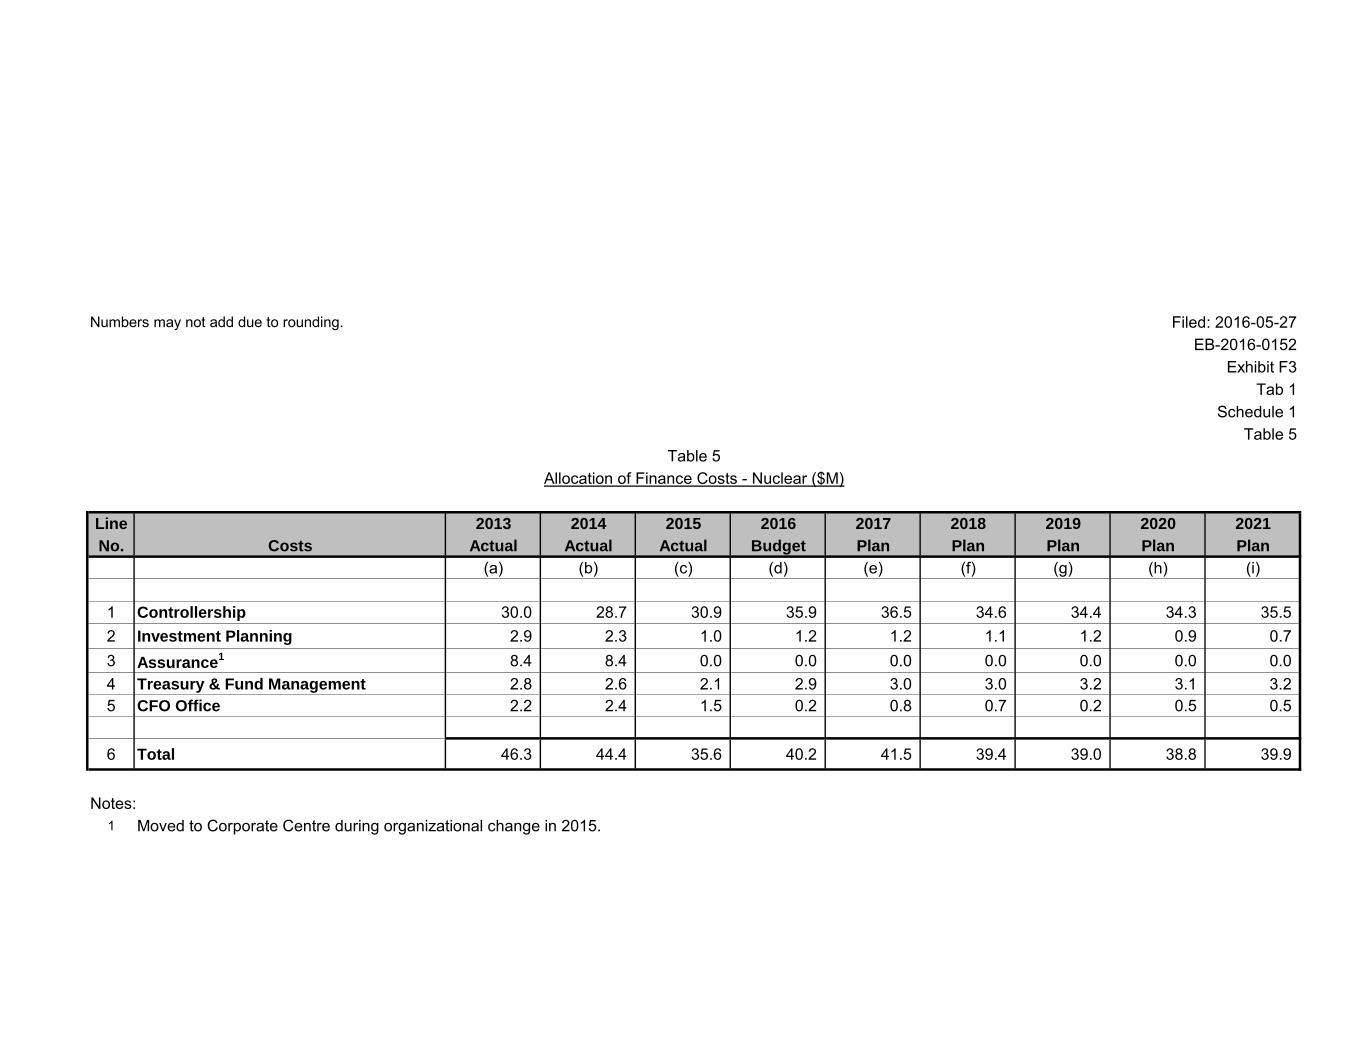
Exhibit F3-1-1 Table 5 summarizes Finance costs assigned and allocated to nuclear 18
over the historical, bridge and test years. 19
20
3.3 People and Culture 21
People and Culture (“P&C”) enables OPG and its leaders to build a productive, engaged 22
workforce with the right people, that have the right skills, in the right roles to achieve 23
business results. The People and Culture function is responsible for labour relations, 24
health and safety standards, compensation and benefits, training, talent management 25
and succession planning. Its specific accountabilities by organization are described 26
below: 27
28
Senior Vice President 29
The Senior VP leads the People and Culture business unit. 30
31
Filed: 2016-05-27 EB-2016-0152 Exhibit F3 Tab 1 Schedule 1 Page 8 of 19
HR Business Partners 1
HR Business Partners provides strategic advice to the business and leads the 2
implementation of P&C programs within a given business unit. 3
4
Total Rewards and Solutions Centre 5
The Total Rewards and Solutions Centre develops and manages the compensation and 6
benefits program to achieve the company’s business objectives and provides analytical 7
support related to work force planning and P&C program management. This group also 8
provides administrative support and services through the operation of an HR Service 9
Centre and transaction processing related to payroll. 10
11
Health, Safety, Employee and Labour Relations 12
Health, Safety, Employee and Labour Relations develops and maintains a health and 13
safety management system and manages all labour relations activities to ensure 14
compliance with collective agreements, labour legislation, and to ensure policies for non-15
represented staff are applied in a manner consistent with the intent of the policies. 16
17
Talent Management and Business Change 18
Talent Management and Business Change takes steps to attract, develop and retain 19
staff with the talents required to meet the company’s needs and co-ordinates succession 20
planning to ensure that critical skills and business knowledge are maintained and to 21
ensure that corporate leadership requirements are met. 22
23
Learning and Development 24
The Learning and Development group develops and delivers training for OPG 25
employees, ensuring all licensing and regulatory requirements are met and that OPG's 26
workforce has the knowledge and skills required for safe and reliable operations. 27
28
Exhibit F3-1-1 Table 9 summarizes People and Culture costs allocated to nuclear over 29
the historical, bridge, and test years. 30
31

Filed: 2016-05-27 EB-2016-0152
Exhibit F3 Tab 1
Schedule 1 Page 9 of 19
3.4 Commercial Operations and Environment 1
Commercial Operations and Environment includes Commercial Contracts, Environment, 2
Regulatory Affairs, Electricity Sales and Trading, and Integrated Revenue Planning 3
sections. 4
5
OPG recently restructured Commercial Operations and Environment by transferring 6
Commercial Contracts, Environment, Regulatory Affairs, Electricity Sales and Trading 7
and Integrated Revenue Planning groups to different divisions within the organization. 8
Despite changes in organizational structure and reporting relationships, OPG continues 9
to present costs as if Commercial Operations and Environment remained intact. 10
Presenting costs in this way allows for ease of comparability between historical, bridge 11
and test years, provides continuity with previous filings and is consistent with the 12
presentation in OPG’s approved 2016-2018 Business Plan (Ex. A2-2-1 Attachment 1). 13
The changes in organizational structure do not have a material impact on the costs 14
forecast for the bridge year and test period and do not have an impact on the cost 15
allocation methodology. 16
17
Commercial Contracts 18
Commercial Contracts includes Fuels, Commercial Services, and Bruce Lease 19
Management departments. The Fuels department is responsible for the procurement 20
and delivery of fuel (excluding uranium), sales of by-products, acquisition of emission 21
allowances and credits, negotiation and contract management for generation and 22
ancillary services with the Independent Electricity System Operator (“IESO”). 23
Commercial Services markets and manages a program for the sale of isotopes and 24
heavy water products, and services for existing and future applications. Bruce Lease 25
Management Office manages contracts with Bruce Power. 26
27
Environment 28
Environment provides operational support to OPG plants and facilities to minimize 29
environmental risks and impacts, reports on OPG’s environmental performance, 30
provides environmental assessment and specialist support and seeks opportunities for 31

Filed: 2016-05-27 EB-2016-0152 Exhibit F3 Tab 1 Schedule 1 Page 10 of 19
environmental leadership. The Environment Division supports OPG in a wide range of 1
environmental subject areas, including aquatic and terrestrial biology, contaminated land 2
and groundwater, radiological environmental management, air and water emissions, 3
waste management, certificates of approval, spills management and legislative 4
monitoring. 5
6
Regulatory Affairs 7
Regulatory Affairs is responsible for OPG's interactions with economic regulators. These 8
include the OEB, IESO, the National Energy Board and other Canadian and U.S. 9
regulators that have an impact on OPG’s operations. Regulatory Affairs provides 10
regulatory intelligence, strategy, and advice and also manages regulatory interactions to 11
obtain approvals and outcomes that allow OPG to accomplish its business goals. 12
13
Electricity and Sales Trading 14
The Electricity Sales and Trading group co-ordinates the offering of OPG’s generation 15
into the IESO market to maximize OPG’s net revenues by integrating and optimizing the 16
generation portfolio and trading activities. This includes outage planning and strategies 17
to optimize production based on market signals; managing generation risks; and 18
engaging in interconnected market electricity trading. 19
20
Integrated Revenue Planning 21
Integrated Revenue Planning provides power market forecasts of OPG unit production, 22
price, revenue, and gross profit margin for OPG units along with appropriate risk 23
measures. This group includes Market Affairs which monitors, provides advice and 24
analysis on potential changes to the market, responds to potential compliance and 25
surveillance issues and provides support for OEB rate submissions. 26
27
Exhibit F3-1-1 Table 3 summarizes Commercial Operations and Environment costs 28
allocated to nuclear over the historical, bridge, and test years. 29
30
31
Filed: 2016-05-27 EB-2016-0152
Exhibit F3 Tab 1
Schedule 1 Page 11 of 19
3.5 Corporate Centre 1
The corporate centre includes: the Executive Office (Chairman, President and CEO 2
offices); Corporate Executive Operations; Law; Corporate Relations and 3
Communications; Corporate Business Development and Enterprise Risk Management; 4
and Assurance. 5
6
OPG recently restructured Corporate Centre by transferring Law, Corporate Relations 7
and Communications and Corporate Business Development and Enterprise Risk 8
Management groups to different divisions within the organization. Despite the changes in 9
organizational structure and reporting relationships, OPG continues to present costs as if 10
Corporate Centre remained intact. Presenting costs in this way allows for ease of 11
comparability between historical, bridge and test years, provides continuity with previous 12
filings and is consistent with the presentation in OPG’s approved 2016-2018 Business 13
Plan (Ex. A2-2-1 Attachment 1). The changes in organizational structure do not have a 14
material impact on the costs forecast for the bridge year and test period and do not have 15
an impact on the cost allocation methodology. 16
17
Executive Office 18
The Executive Office is responsible for the overall management and strategy of the 19
company. 20
21
Corporate Executive Operations 22
The Corporate Executive Operations function supports OPG’s Board of Directors and 23
the Executive Office, and interfaces between the OPG Board, management and OPG’s 24
shareholder. 25
26
Law 27
Law provides legal advice and services to support all business units across OPG, 28
including support for various procurement activities and corporate and commercial 29
matters. Law provides advice related to OPG’s pension and nuclear funds; real estate; 30
Bruce lease and related agreements and water resources; municipal approvals and land 31

Filed: 2016-05-27 EB-2016-0152 Exhibit F3 Tab 1 Schedule 1 Page 12 of 19
use planning; energy markets and regulatory matters, including the OEB payment 1
amount application; environmental approvals and compliance; nuclear licensing; 2
litigation; First Nations and Métis issues; freedom of information request; occupational 3
health and safety compliance; and labour employment and privacy law. 4
5
Corporate Relations and Communications 6
Corporate Relations and Communications supports all of OPG’s business units by 7
directing the planning and delivery of communications and issue management advice, 8
guidance and services to support the business units’ ongoing efforts to earn and 9
maintain the public franchise to operate facilities in Ontario. This includes the 10
development of communications and issue management strategies to improve OPG’s 11
relations with host communities, and further their understanding of the company as a 12
safe, reliable, environmentally responsible operator and steward of the Province’s 13
generating assets. 14
15
Corporate Business Development and Enterprise Risk Management 16
Corporate Business Development (“CBD”) is responsible for developing and maintaining 17
an integrated corporate business development strategy to assess and recommend new 18
business opportunities; establish and maintain an integrated portfolio-based generation 19
and site asset strategy; and develop and implement external and internal partnerships in 20
support of the corporate strategy. CBD explores the concept and definition of major 21
hydroelectric and thermal generation development projects as well as other business 22
development initiatives. CBD also anticipates and develops strategies to deal with 23
project opportunities and challenges. 24
25
Enterprise Risk Management provides a framework that enables the organization to 26
effectively identify, assess, monitor, and report on the key strategic, emerging, external, 27
operational, financial, and transactional risks to the Corporation’s objectives. 28
29
30
31

Filed: 2016-05-27 EB-2016-0152
Exhibit F3 Tab 1
Schedule 1 Page 13 of 19
Assurance 1
The Assurance group includes Internal Audit and Nuclear Oversight. Internal Audit 2
provides independent, objective assurance of the organization’s operations; evaluates 3
the effectiveness of governance and controls; and, maintains a strategic audit plan which 4
includes key risk audits, mandatory audits, cyclical audits, major project audits, contract 5
audits and other audits and reviews. Nuclear Oversight provides assurance that the 6
Nuclear Management System (a condition of OPG’s operating license) is effectively 7
implemented in accordance with OPG’s charter. 8
9
Exhibit F3-1-1 Table 3 summarizes Corporate Centre costs allocated to nuclear over the 10
historical, bridge, and test years. 11
12
4.0 BENCHMARKING STUDY 13
In the EB-2013-0321 Decision (p. 95), OPG was directed to undertake an independent 14
benchmarking study of corporate support functions and costs given the significant 15
changes resulting from the Business Transformation initiative. The Hackett Group 16
(“Hackett”) carried out an independent benchmarking study in respect of that direction, 17
which is filed as Attachment 1 to this Exhibit. 18
19
The study benchmarked OPG against peers in 2010 (before the start of the Business 20
Transformation initiative) and in 2014 to show results in a manner that facilitates a 21
transparent comparison before and after the Business Transformation initiative. 22
Corporate costs assigned and allocated to both nuclear and regulated hydroelectric 23
businesses were included in the scope of the benchmarking study. 24
25
OPG followed Hackett’s independent benchmark methodology to enable OPG’s 26
corporate support functions and costs to be benchmarked against peers on a 27
comparable basis. 28
29
Hackett normalized OPG’s corporate costs based on key demand drivers for each 30
function. For IT, number of end users was used to benchmark costs per end user. For 31
Filed: 2016-05-27 EB-2016-0152 Exhibit F3 Tab 1 Schedule 1 Page 14 of 19
HR, number of employees was used to benchmark costs per employee. For Finance and 1
Executive and Corporate Services (“ECS”), revenues were used to benchmark costs as 2
a percentage of revenues. 3
4
The benchmarking study found that OPG's regulated corporate function costs declined 5
10 per cent from 2010 to 2014 while total regulated OPG headcount declined 11 per 6
cent. It also found that OPG's overall cost benchmark performance at the functional level 7
improved between 2010 and 2014 while comparisons to peer benchmarks varied by 8
function, as shown in Figure 1. 9
10
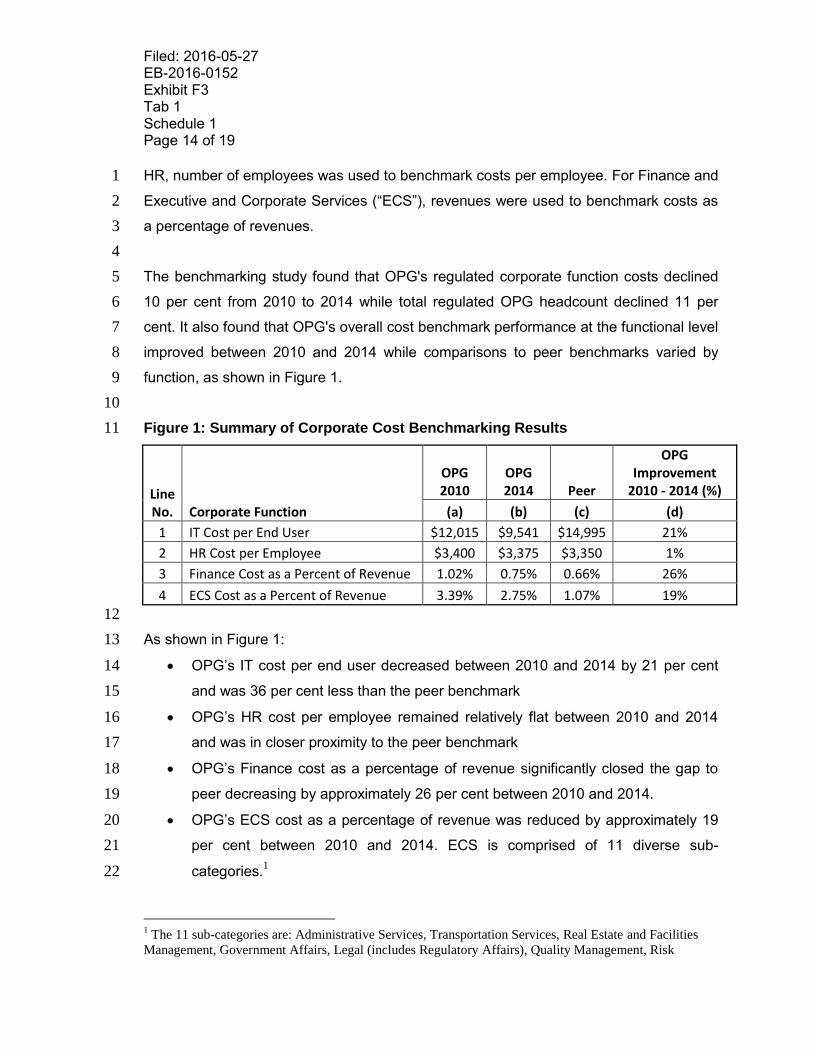
Figure 1: Summary of Corporate Cost Benchmarking Results 11
Line No. Corporate Function
OPG 2010
OPG 2014 Peer
OPG Improvement
2010 - 2014 (%)
(a) (b) (c) (d)
1 IT Cost per End User $12,015 $9,541 $14,995 21%
2 HR Cost per Employee $3,400 $3,375 $3,350 1%
3 Finance Cost as a Percent of Revenue 1.02% 0.75% 0.66% 26%
4 ECS Cost as a Percent of Revenue 3.39% 2.75% 1.07% 19% 12
As shown in Figure 1: 13
OPG’s IT cost per end user decreased between 2010 and 2014 by 21 per cent 14
and was 36 per cent less than the peer benchmark 15
OPG’s HR cost per employee remained relatively flat between 2010 and 2014 16
and was in closer proximity to the peer benchmark 17
OPG’s Finance cost as a percentage of revenue significantly closed the gap to 18
peer decreasing by approximately 26 per cent between 2010 and 2014. 19
OPG’s ECS cost as a percentage of revenue was reduced by approximately 19 20
per cent between 2010 and 2014. ECS is comprised of 11 diverse sub-21
categories.1 22
1 The 11 sub-categories are: Administrative Services, Transportation Services, Real Estate and Facilities
Management, Government Affairs, Legal (includes Regulatory Affairs), Quality Management, Risk

Filed: 2016-05-27 EB-2016-0152
Exhibit F3 Tab 1
Schedule 1 Page 15 of 19
1
The most significant challenges were faced in the ECS areas of Risk Management and 2
Environmental, Health and Safety; Procurement; and, Real Estate and Facilities 3
Management. These were the ECS areas where OPG’s costs were most significant and 4
where the gap between OPG and peers was greatest. 5
6
OPG’s costs associated with Risk Management and Environmental, Health and Safety, 7
and Procurement continue to be driven by nuclear-specific requirements and 8
commitment to upholding OPG’s social license to operate. OPG’s adherence to strict 9
CNSC regulations and its robust safety and environmental programs are examples of 10
key cost drivers in these areas. OPG’s nuclear stations have well-established 11
environmental monitoring programs that are designed to assess impacts on human 12
health and the environment, demonstrate compliance with regulatory limits, validate the 13
effectiveness of containment and effluent controls, and verify predictions made by 14
environmental risk assessments. For example, in addition to all of the conventional 15
environmental requirements, OPG conducts a radiological environmental monitoring 16
program to assess, among other things, radiation exposure to members of the public 17
from OPG’s nuclear generating stations. The Procurement function must address the 18
significant quality requirements for materials that are used in nuclear facilities. In 19
addition, the cost of Procurement activities is affected by aging assets, parts 20
obsolescence and the limited market availability of nuclear qualified suppliers. The 21
majority of the utilities included in OPG’s peer benchmarking group were not nuclear 22
power producers and therefore do not have the same breadth of requirements as OPG 23
in these areas. 24
25
OPG’s Real Estate and Facilities Management costs continue to be driven by business 26
requirements associated with the large number of nuclear and hydroelectric facilities and 27
the geographic spread of the facilities across the province. As noted in Attachment 1 (p. 28
16), OPG’s Real Estate and Facilities Management costs included all facility costs 29
Management and Environmental, Health and Safety, Corporate Communications, Planning and Strategy,
Executive Office and Procurement.

Filed: 2016-05-27 EB-2016-0152 Exhibit F3 Tab 1 Schedule 1 Page 16 of 19
associated with its corporate regulated operations, including facility costs associated 1
with IT, HR and Finance functions. Such facility costs were embedded in each particular 2
function for OPG’s peers. This limitation had an unfavourable impact on OPG’s Real 3
Estate and Facilities Management performance. 4
5
In addition, OPG’s performance in relation to the peer benchmarks for each function is 6
significantly influenced by its labour costs. This is also reflected in OPG’s performance in 7
the compensation benchmarking study carried out by Willis Towers Watson provided at 8
Ex. F4-3-1 Attachment 2. As described in Ex. F4-3-1, OPG’s regulated staff work in a 9
predominantly unionized environment, with approximately 90 per cent of staff belonging 10
to either the PWU or the Society. Given the extent of unionization, collective bargaining 11
plays a dominant role in determining OPG’s labour costs. Collective bargaining directly 12
affects the wages and incentives provided to unionized employees, as well as the 13
pensions and benefits they earn. Collective bargaining also has an indirect impact on the 14
compensation provided to non-unionized positions because internal equity, career 15
development and attracting experienced employees into management positions are 16
important factors in workforce planning and development. As a result, OPG’s 17
performance in relation to the peer benchmarks in the Hackett study would be impacted 18
to the extent that utilities in OPG’s peer group are non-unionized and do not have the 19
same collective bargaining requirements. 20
21
5.0 METHODS OF ALLOCATION 22
The cost allocation methodology is the same as was previously evaluated and accepted 23
by the OEB in EB-2013-0321, EB-2010-0008 and EB-2007-0905. The cost allocation 24
methodology uses two methods to distribute costs among the business units: direct 25
assignment and allocation. In 2013, OPG’s allocation methodology was also 26
independently evaluated by HSG Group Inc and the report was filed to the OEB as part 27
of EB-2013-0321 at Ex. F5-5-1. 28
29
30
31
Filed: 2016-05-27 EB-2016-0152
Exhibit F3 Tab 1
Schedule 1 Page 17 of 19
5.1 Direct Assignment 1
Direct assignment is used when specific resources, both individual employees and 2
specific cost items, used by a particular business unit can be reasonably established. 3
There is specific identification of resources where there is a direct relationship between 4
the costs incurred by a support group and the business unit that causes the costs to be 5
incurred. Estimation of the resources used by the business unit may be based on current 6
time estimates or historical activity. 7
8
5.2 Allocation 9
Allocations are used when more than one business unit uses a resource, but the 10
portions of the resource that each uses cannot be directly established. In these cases, a 11
cost driver is used to allocate the costs of the resource. A cost driver is a formula for 12
sharing the cost of a resource among those who caused the cost to be incurred. There 13
are two types of cost drivers: external and internal drivers. External drivers are based on 14
data that are external to the allocation process. For example, computer hardware costs 15
incurred by the IT group are allocated to business units based on the number of LAN 16
ID’s. Internal drivers are based on values computed as part of the cost allocation 17
process. For example, a supervisor’s salary may be allocated in proportion to the 18
salaries of the people being supervised. 19
20
OPG continues to use three steps when allocating a department’s costs: 21
Step One – Specific Identification of Resources. 22
o The costs of resources specifically identified to a business unit are assigned to it. 23
o Labour costs associated with individuals who support only one business unit are 24
assigned to it. 25
o Non-labour costs directly caused by one business unit are assigned to it. 26
27
Step Two – Estimation of Resources 28
The next step is to identify the resources in each department that directly support more 29
than one business unit and to estimate the resources attributable to each business unit. 30
Filed: 2016-05-27 EB-2016-0152 Exhibit F3 Tab 1 Schedule 1 Page 18 of 19
The costs of these resources are directly assigned to each business unit in proportion to 1
the estimated time required by that business unit. 2
3
Step Three – Assign Cost Drivers 4
OPG uses the appropriate standardized cost drivers for all remaining activities or 5
expenses. 6
7
8
Filed: 2016-05-27 EB-2016-0152
Exhibit F3 Tab 1
Schedule 1 Page 19 of 19
ATTACHMENTS 1
2
Attachment 1: Benchmarking Study of OPG’s Corporate Support Functions and 3
Costs prepared by The Hackett Group 4
5
Note: Attachment 1 is marked “Confidential”, however, OPG has determined it to be non-6
confidential in its entirety. 7
CONFIDENTIAL
Benchmarking Study of OPG’s Corporate Support Functions and CostsApril 2016
Filed: 2016-05-27
EB-2016-0152
Exhibit F3-1-1
Attachment 1
Page 1 of 20
| 2© 2016 The Hackett Group, Inc. All rights reserved. Reproduction of this document or any portion thereof without prior written consent is prohibited.
Contents
Executive Summary
Benchmark Objectives and
Methodology
Peer Overview
Results
Appendix
Statement of Confidentiality and Usage Restrictions
This document contains trade secrets and other information that is company sensitive,
proprietary, and confidential, the disclosure of which would provide a competitive advantage to
others. As a result, the reproduction, copying, or redistribution of this document or the contents
contained herein, in whole or in part, for any purpose is strictly prohibited without the prior
written consent of The Hackett Group.
Copyright © 2016 The Hackett Group, Inc. All rights reserved. World-Class Defined and
Enabled.
Filed: 2016-05-27
EB-2016-0152
Exhibit F3-1-1
Attachment 1
Page 2 of 20

| 3© 2016 The Hackett Group, Inc. All rights reserved. Reproduction of this document or any portion thereof without prior written consent is prohibited.
Ontario Power Generation (OPG) has engaged The Hackett Group to perform an independent benchmarking study of OPG’s corporate support functions and costs
Hackett leveraged its benchmarking and business process implementation expertise to deliver the following cost assessment to Peers for 2010 and 2014
Executive Summary
Overview
General Observations
OPG's total corporate function costs declined 10% from 2010 to 2014 while total
OPG headcount declined 11%
OPG’s overall cost benchmark performance at the functional level improved
between 2010 and 2014 while comparisons to peer benchmarks vary by function
1
2
Filed: 2016-05-27
EB-2016-0152
Exhibit F3-1-1
Attachment 1
Page 3 of 20

| 4© 2016 The Hackett Group, Inc. All rights reserved. Reproduction of this document or any portion thereof without prior written consent is prohibited.
Contents
Executive Summary
Benchmark Objectives and
Methodology
Peer Overview
Results
Appendix
Statement of Confidentiality and Usage Restrictions
This document contains trade secrets and other information that is company sensitive,
proprietary, and confidential, the disclosure of which would provide a competitive advantage to
others. As a result, the reproduction, copying, or redistribution of this document or the contents
contained herein, in whole or in part, for any purpose is strictly prohibited without the prior
written consent of The Hackett Group.
Copyright © 2016 The Hackett Group, Inc. All rights reserved. World-Class Defined and
Enabled.
Filed: 2016-05-27
EB-2016-0152
Exhibit F3-1-1
Attachment 1
Page 4 of 20
| 5© 2016 The Hackett Group, Inc. All rights reserved. Reproduction of this document or any portion thereof without prior written consent is prohibited.
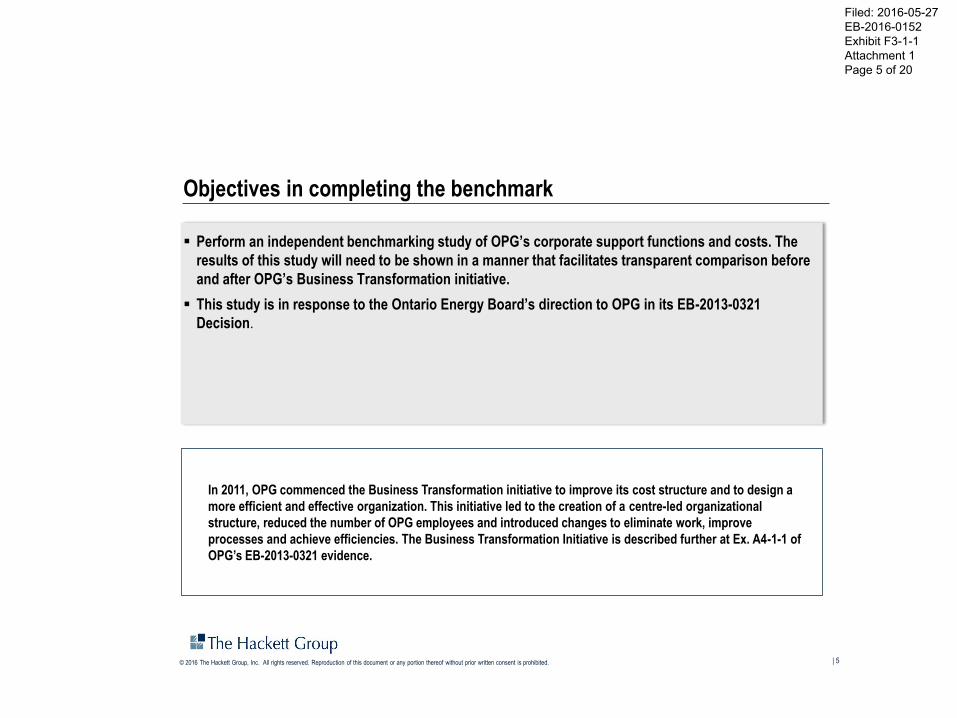
Objectives in completing the benchmark
Perform an independent benchmarking study of OPG’s corporate support functions and costs. The
results of this study will need to be shown in a manner that facilitates transparent comparison before
and after OPG’s Business Transformation initiative.
This study is in response to the Ontario Energy Board’s direction to OPG in its EB-2013-0321
Decision.
In 2011, OPG commenced the Business Transformation initiative to improve its cost structure and to design a
more efficient and effective organization. This initiative led to the creation of a centre-led organizational
structure, reduced the number of OPG employees and introduced changes to eliminate work, improve
processes and achieve efficiencies. The Business Transformation Initiative is described further at Ex. A4-1-1 of
OPG’s EB-2013-0321 evidence.
Filed: 2016-05-27
EB-2016-0152
Exhibit F3-1-1
Attachment 1
Page 5 of 20

| 6© 2016 The Hackett Group, Inc. All rights reserved. Reproduction of this document or any portion thereof without prior written consent is prohibited.
Geographic Scope:
All OPG regulated operations
Benchmark data collection period = Fiscal Year 2010 and 2014
All data is represented in 2014 Canadian Dollars for comparison purposes
PPP (Purchasing Power Parity) was used to adjust the peer data from US to Canadian dollars
A 2%/year inflation rate was applied to the peer companies and OPG’s 2010 costs/revenue to normalize the data to 2014 Canadian Dollars
Out of Scope – The below items were not included in the benchmark to facilitate an apples to apples comparisons to the peer
All offices or operations of the unregulated portion of OPG
Direct functions of the Darlington Refurbishment Project
Integrated Revenue Planning, Electricity Sales & Trading,
Commercial Contracts and Corporate Business Development
For Finance: Revenue cycle, Fund Management, nuclear-specific
costs (e.g., nuclear insurance)
For Human Resources: Workforce Development Services (training)
For Executive and Corporate Services (ECS): Security, Cafeteria
and Catering, Travel Services, Legal – Mergers and Acquisitions
(M&A), nuclear-specific costs (e.g. nuclear facilities costs); Within
Procurement, warehouse management & logistics and product
development, design & support
Data Guidelines and Benchmark Scope
Benchmark Methodology\\\
Peer Group – represents the median of a custom group of companies in multiple industries that have similar size and business complexity to OPG
Data has been normalized based on the key demand drivers for each
function:
Finance, ECS = Revenue ($4.237B in 2010 and $4.849B in
2014)
IT = End User Equivalents (11,011 in 2010, 12,267 in 2014)
HR = Employees (10,305 in 2010 and 9,292 in 2014)
Normalization of Benchmark Data
Benchmark Comparisons
Revenue: External Revenue Only, intercompany revenue not included.
OPG includes revenue associated with regulated operations only. OPG
revenue is adjusted to account for revenue deferred to future periods and
to include revenue in 2010 from newly regulated hydroelectric facilities to
facilitate transparent comparison before and after OPG’s Business
Transformation initiative.
Employees: Full-time, part-time, seasonal, and contingent employees .
OPG includes employees associated with regulated operations only.
End User: An individual (typically either an employee or contractor) that
spends at least 10% of his or her time using a company provided, funded,
supported computing device that is part of the company's IT infrastructure
(i.e. desktops, laptops, hand held devices, etc.) to support his or her
business function. The user must have direct access to internal
applications / systems to execute specific transactions on behalf of the
company. OPG includes end users associated with regulated operations
only.
Filed: 2016-05-27
EB-2016-0152
Exhibit F3-1-1
Attachment 1
Page 6 of 20
| 7© 2016 The Hackett Group, Inc. All rights reserved. Reproduction of this document or any portion thereof without prior written consent is prohibited.
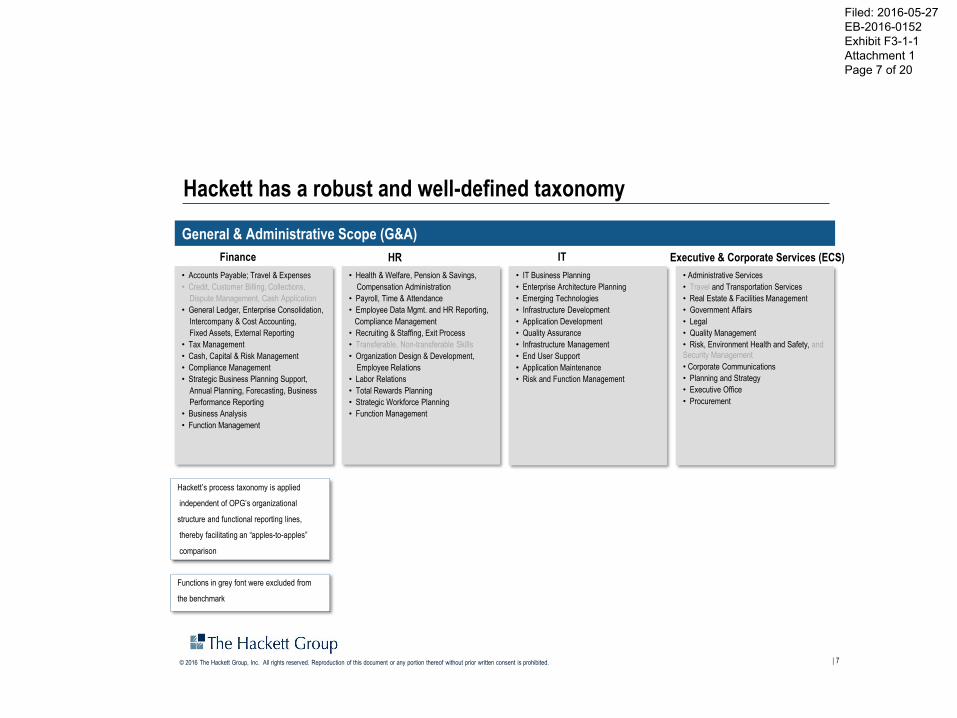
Hackett has a robust and well-defined taxonomy
• Administrative Services
• Travel and Transportation Services
• Real Estate & Facilities Management
• Government Affairs
• Legal
• Quality Management
• Risk, Environment Health and Safety, and
Security Management
• Corporate Communications
• Planning and Strategy
• Executive Office
• Procurement
• Accounts Payable; Travel & Expenses
• Credit, Customer Billing, Collections,
Dispute Management, Cash Application
• General Ledger, Enterprise Consolidation,
Intercompany & Cost Accounting,
Fixed Assets, External Reporting
• Tax Management
• Cash, Capital & Risk Management
• Compliance Management
• Strategic Business Planning Support,
Annual Planning, Forecasting, Business
Performance Reporting
• Business Analysis
• Function Management
• Health & Welfare, Pension & Savings,
Compensation Administration
• Payroll, Time & Attendance
• Employee Data Mgmt. and HR Reporting,
Compliance Management
• Recruiting & Staffing, Exit Process
• Transferable, Non-transferable Skills
• Organization Design & Development,
Employee Relations
• Labor Relations
• Total Rewards Planning
• Strategic Workforce Planning
• Function Management
• IT Business Planning
• Enterprise Architecture Planning
• Emerging Technologies
• Infrastructure Development
• Application Development
• Quality Assurance
• Infrastructure Management
• End User Support
• Application Maintenance
• Risk and Function Management
General & Administrative Scope (G&A)
Hackett’s process taxonomy is applied
independent of OPG’s organizational
structure and functional reporting lines,
thereby facilitating an “apples-to-apples”
comparison
Finance HR IT Executive & Corporate Services (ECS)
Functions in grey font were excluded from
the benchmark
Filed: 2016-05-27
EB-2016-0152
Exhibit F3-1-1
Attachment 1
Page 7 of 20
| 8© 2016 The Hackett Group, Inc. All rights reserved. Reproduction of this document or any portion thereof without prior written consent is prohibited.
Contents
Executive Summary
Benchmark Objectives and
Methodology
Peer Overview
Results
Appendix
Statement of Confidentiality and Usage Restrictions
This document contains trade secrets and other information that is company sensitive,
proprietary, and confidential, the disclosure of which would provide a competitive advantage to
others. As a result, the reproduction, copying, or redistribution of this document or the contents
contained herein, in whole or in part, for any purpose is strictly prohibited without the prior
written consent of The Hackett Group.
Copyright © 2016 The Hackett Group, Inc. All rights reserved. World-Class Defined and
Enabled.
Filed: 2016-05-27
EB-2016-0152
Exhibit F3-1-1
Attachment 1
Page 8 of 20
| 9© 2016 The Hackett Group, Inc. All rights reserved. Reproduction of this document or any portion thereof without prior written consent is prohibited.
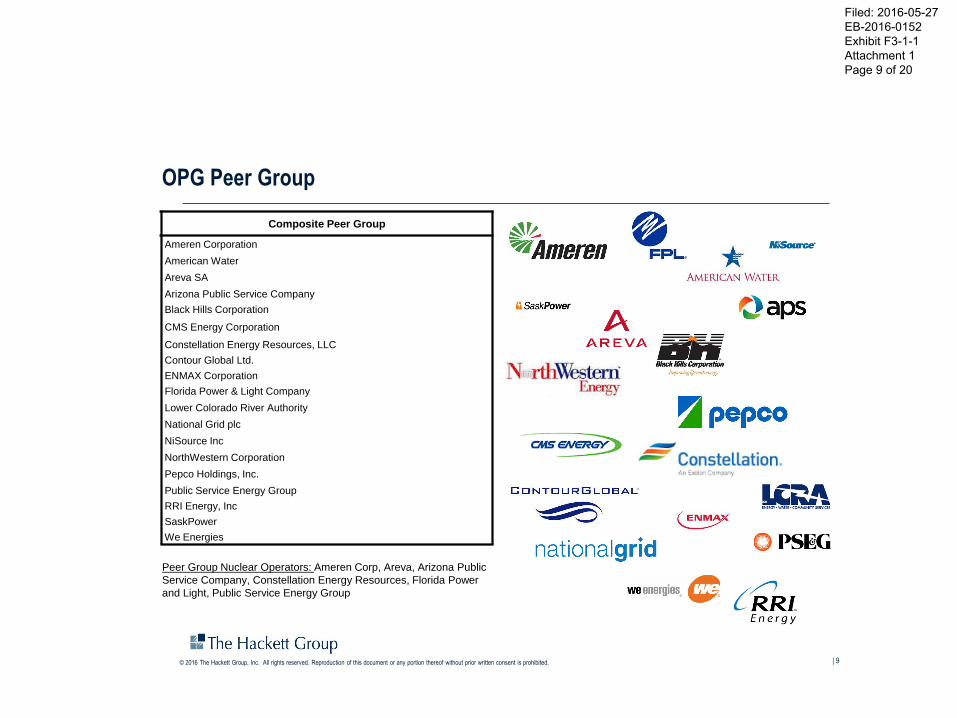
OPG Peer Group
Composite Peer Group
Ameren Corporation
American Water
Areva SA
Arizona Public Service Company
Black Hills Corporation
CMS Energy Corporation
Constellation Energy Resources, LLC
Contour Global Ltd.
ENMAX Corporation
Florida Power & Light Company
Lower Colorado River Authority
National Grid plc
NiSource Inc
NorthWestern Corporation
Pepco Holdings, Inc.
Public Service Energy Group
RRI Energy, Inc
SaskPower
We Energies
Peer Group Nuclear Operators: Ameren Corp, Areva, Arizona Public
Service Company, Constellation Energy Resources, Florida Power
and Light, Public Service Energy Group
Filed: 2016-05-27
EB-2016-0152
Exhibit F3-1-1
Attachment 1
Page 9 of 20

| 10© 2016 The Hackett Group, Inc. All rights reserved. Reproduction of this document or any portion thereof without prior written consent is prohibited.
Contents
Executive Summary
Benchmark Objectives and
Methodology
Peer Overview
Results
Appendix
Statement of Confidentiality and Usage Restrictions
This document contains trade secrets and other information that is company sensitive,
proprietary, and confidential, the disclosure of which would provide a competitive advantage to
others. As a result, the reproduction, copying, or redistribution of this document or the contents
contained herein, in whole or in part, for any purpose is strictly prohibited without the prior
written consent of The Hackett Group.
Copyright © 2016 The Hackett Group, Inc. All rights reserved. World-Class Defined and
Enabled.
Filed: 2016-05-27
EB-2016-0152
Exhibit F3-1-1
Attachment 1
Page 10 of 20
| 11© 2016 The Hackett Group, Inc. All rights reserved. Reproduction of this document or any portion thereof without prior written consent is prohibited.
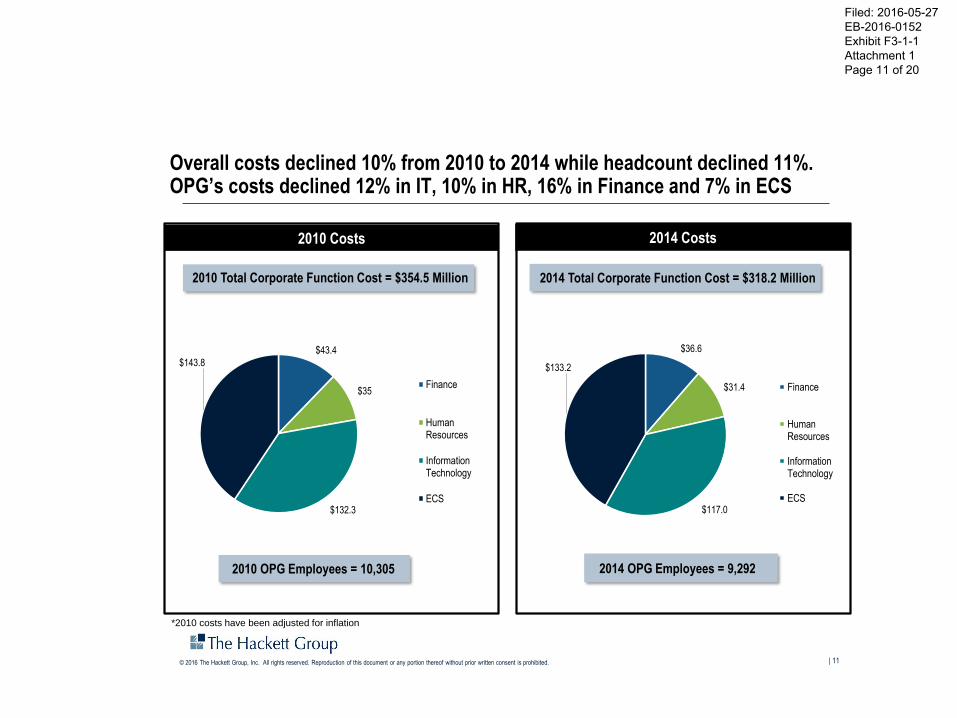
2010 Costs
2010 Total Corporate Function Cost = $354.5 Million
2014 Costs
2014 Total Corporate Function Cost = $318.2 Million
Overall costs declined 10% from 2010 to 2014 while headcount declined 11%. OPG’s costs declined 12% in IT, 10% in HR, 16% in Finance and 7% in ECS
*2010 costs have been adjusted for inflation
2010 OPG Employees = 10,305 2014 OPG Employees = 9,292
$43.4
$35
$132.3
$143.8
Finance
HumanResources
InformationTechnology
ECS
$36.6
$31.4
$117.0
$133.2
Finance
HumanResources
InformationTechnology
ECS
Filed: 2016-05-27
EB-2016-0152
Exhibit F3-1-1
Attachment 1
Page 11 of 20

| 12© 2016 The Hackett Group, Inc. All rights reserved. Reproduction of this document or any portion thereof without prior written consent is prohibited.
OPG IT Cost Per End User has decreased since 2010 and is 36% less than Peers
IT Cost Per End User
$12,015
$9,541
$14,995
OPG 2010 OPG 2014 Peer
Filed: 2016-05-27
EB-2016-0152
Exhibit F3-1-1
Attachment 1
Page 12 of 20
| 13© 2016 The Hackett Group, Inc. All rights reserved. Reproduction of this document or any portion thereof without prior written consent is prohibited.
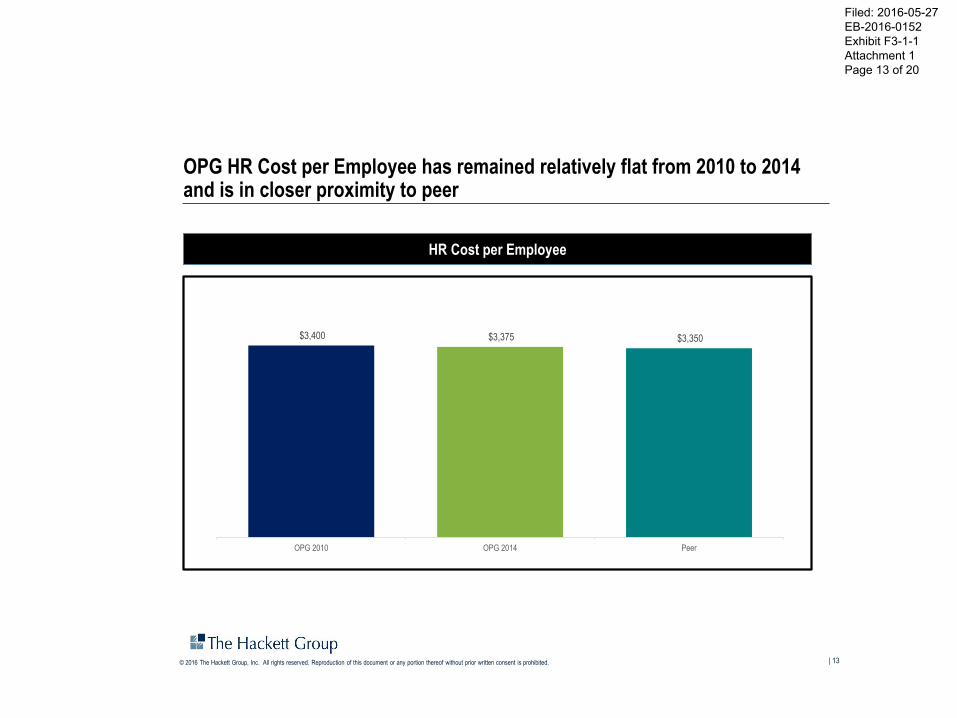
OPG HR Cost per Employee has remained relatively flat from 2010 to 2014 and is in closer proximity to peer
HR Cost per Employee
$3,400 $3,375 $3,350
OPG 2010 OPG 2014 Peer
Filed: 2016-05-27
EB-2016-0152
Exhibit F3-1-1
Attachment 1
Page 13 of 20

| 14© 2016 The Hackett Group, Inc. All rights reserved. Reproduction of this document or any portion thereof without prior written consent is prohibited.
OPG Finance has significantly closed the gap to peer decreasing Finance cost as a Percent of Revenue 26% from 2010 to 2014
.
Finance Cost as a Percent of Revenue
1.02%
0.75%
0.66%
OPG 2010 OPG 2014 Peer
Filed: 2016-05-27
EB-2016-0152
Exhibit F3-1-1
Attachment 1
Page 14 of 20

| 15© 2016 The Hackett Group, Inc. All rights reserved. Reproduction of this document or any portion thereof without prior written consent is prohibited.
OPG ECS Cost as a Percent of Revenue has been reduced by approximately 19% but still has opportunities compared to the Peer
ECS Cost as a Percent of Revenue
3.39%
2.75%
1.07%
OPG 2010 OPG 2014 Peer
Filed: 2016-05-27
EB-2016-0152
Exhibit F3-1-1
Attachment 1
Page 15 of 20

| 16© 2016 The Hackett Group, Inc. All rights reserved. Reproduction of this document or any portion thereof without prior written consent is prohibited.
OPG ECS has opportunities to peer especially in the areas of Risk Management and EHS, Procurement, and Real Estate
ECS Process Cost as a Percent of Revenue
*Numbers may not sum due to rounding
*Real Estate and Facilities Management: OPG’s cost for this sub-category includes all facility costs associated with corporate regulated operations including
facility costs associated with IT, HR, and Finance functions. Such facility costs are embedded in each particular function for OPG’s peer
*Other processes include: Transportation, Quality Management, Government Affairs, and Planning and Strategy
0.66%
0.53%
0.36%
0.30%
0.24%0.21%
0.18% 0.19%
0.12%0.15%
0.04% 0.05%
0.37%
0.11%
0.06%
0.16%
Risk Mgmt, Env Healthand Safety
Procurement Real Estate &Facilities Mgmt
AdministrativeServices
Legal Executive Office CorporateCommunication
Other
OPG 2014 PeerOPG 2014 Process Costs:
Risk Management,
Env. Health and
Safety Procurement
Real Estate &
Facilities
Management Admin Services Legal Executive Office
Corporate
Communication Other
32.3 25.8 17.3 14.5 11.9 10.1 8.5 9.2
Filed: 2016-05-27
EB-2016-0152
Exhibit F3-1-1
Attachment 1
Page 16 of 20

| 17© 2016 The Hackett Group, Inc. All rights reserved. Reproduction of this document or any portion thereof without prior written consent is prohibited.
Contents
Executive Summary
Benchmark Objectives and
Methodology
Peer Overview
Results
Appendix
Statement of Confidentiality and Usage Restrictions
This document contains trade secrets and other information that is company sensitive,
proprietary, and confidential, the disclosure of which would provide a competitive advantage to
others. As a result, the reproduction, copying, or redistribution of this document or the contents
contained herein, in whole or in part, for any purpose is strictly prohibited without the prior
written consent of The Hackett Group.
Copyright © 2016 The Hackett Group, Inc. All rights reserved. World-Class Defined and
Enabled.
Filed: 2016-05-27
EB-2016-0152
Exhibit F3-1-1
Attachment 1
Page 17 of 20

| 18© 2016 The Hackett Group, Inc. All rights reserved. Reproduction of this document or any portion thereof without prior written consent is prohibited.
About The Hackett Group
Profile & Mission
The Hackett Group is an Intellectual Property based consultancy
focusing on enabling General and Administrative performance
improvement through leveraging our intellectual capital, based on over
7,500 benchmarks and performance studies
More than 20,000 performance metrics
More than 1,900 best practices
Best practice process flows and configuration guides
Approach
We help clients to measure current performance compared to peers
and World-class performers
We identify project opportunities and develop a business case
leading to an actionable roadmap, supported by a Transformation
Management Office
We implement recommended change and empower our clients to
improve the organization, processes and the culture that enable
agility, leading to sustainable growth
Results
Sustainable performance improvement leading to an agile enterprise
with lower costs, higher quality and better margins
BEST PRACTICES INTELLIGENCE CENTER™
PROVEN STRATEGIES WHICH REDUCE RISK &
ACCELERATE BENEFIT REALIZATION
BENCHMARKS
SOFTWARE
CONFIGURATION
BEST PRACTICE
PROCESS FLOWS
BEST PRACTICESPERFORMANCE
METRICS
HIGH LEVEL
ROADMAP
DETAILED PROCESS
DESIGN
PROCESS
IMPLEMENTATION
Filed: 2016-05-27
EB-2016-0152
Exhibit F3-1-1
Attachment 1
Page 18 of 20
| 19© 2016 The Hackett Group, Inc. All rights reserved. Reproduction of this document or any portion thereof without prior written consent is prohibited.
Contact Information
For other company information, please contact us under:
The Hackett Group
+1 866 442 2538
Email: [email protected]
www.thehackettgroup.com
The Hackett Group: Atlanta Office
1000 Abernathy Road NW, Suite 1400, Atlanta, GA 30328,
+1 866 442 2538
+1 770 225 3600
The Hackett Group: Frankfurt Office
Torhaus Westhafen
Speicherstraße 59
60327 Frankfurt am Main
+49 69 900 217 0
The Hackett Group: London Office
Martin House
5 Martin Lane
London EC4R 0DP
Phone: +44 20 7398 9100
For information on this material, please contact:
John Philips
Project Director
714-925-0293
Sarah Clark
Benchmark Advisor
770-225-7251
Patty Miller
Senior Director, Benchmark
724-263-2658
Statement of Confidentiality and Usage Restrictions
This document contains trade secrets and other information that is company sensitive,
proprietary, and confidential, the disclosure of which would provide a competitive
advantage to others. As a result, the reproduction, copying, or redistribution of this
document or the contents contained herein, in whole or in part, for any purpose is strictly
prohibited without the prior written consent of The Hackett Group.
Copyright © 2016 The Hackett Group, Inc. All rights reserved. World-Class Defined and
Enabled.
Filed: 2016-05-27
EB-2016-0152
Exhibit F3-1-1
Attachment 1
Page 19 of 20

| 20© 2016 The Hackett Group, Inc. All rights reserved. Reproduction of this document or any portion thereof without prior written consent is prohibited.
Statement of Confidentiality and Usage Restrictions
This document contains trade secrets and information that is sensitive, proprietary, and confidential to The Hackett Group the disclosure of
which would provide a competitive advantage to others. As a result, the information contained herein, including, information relating to
The Hackett Group’s data, equipment, apparatus, programs, software, security keys, specifications, drawings, business informa tion, pricing,
tools, taxonomy, questionnaires, deliverables, including without limitation any benchmark reports, and the data and calculations contained
therein, may not be duplicated or otherwise distributed without The Hackett Group Inc.’s express written approval.
www.thehackettgroup.com
Filed: 2016-05-27
EB-2016-0152
Exhibit F3-1-1
Attachment 1
Page 20 of 20

Numbers may not add due to rounding. Filed: 2016-05-27
EB-2016-0152
Exhibit F3
Tab 1
Schedule 1
Table 1
Line 2013 2014 2015 2016 2017 2018 2019 2020 2021
No. Corporate Costs Actual Actual Actual Budget Plan Plan Plan Plan Plan
(a) (b) (c) (d) (e) (f) (g) (h) (i)
1 Business and Administrative Service1 295.6 281.7 285.5 292.5 292.4 284.4 286.6 287.1 289.6
2 Finance 63.9 59.0 51.4 57.5 58.1 56.0 55.7 54.9 55.8
3 People and Culture 115.1 118.1 115.9 111.2 115.0 113.7 116.3 117.3 119.3
4 Commercial Operations and Environment 37.4 43.0 37.2 44.0 42.8 40.9 41.9 41.3 44.8
5 Corporate Centre 50.8 47.4 61.9 68.2 65.4 65.5 65.7 66.9 67.8
6 Total 562.8 549.2 551.9 573.4 573.7 560.5 566.2 567.5 577.3
Notes:
1 Business and Administrative Service costs exclude amounts captured in the Asset Service Fee.
Table 1
Corporate Support & Administrative Groups - OPG ($M)
Numbers may not add due to rounding. Filed: 2016-05-27
EB-2016-0152
Exhibit F3
Tab 1
Schedule 1
Table 2
Table 2
Allocation of Corporate Support & Administrative Costs - Regulated Hydroelectric ($M)
Intentionally left blank (See Ex. A1-3-1)

Numbers may not add due to rounding. Filed: 2016-05-27
EB-2016-0152
Exhibit F3
Tab 1
Schedule 1
Table 3
Line 2013 2014 2015 2016 2017 2018 2019 2020 2021
No. Corporate Group Actual Actual Actual Budget Plan Plan Plan Plan Plan
(a) (b) (c) (d) (e) (f) (g) (h) (i)
1 Business and Administrative Service 246.6 227.2 231.0 245.0 246.1 239.1 241.0 242.3 246.1
2 Finance 46.3 44.4 35.6 40.2 41.5 39.4 39.0 38.8 39.9
3 People and Culture 91.6 98.2 95.8 92.4 96.2 95.3 97.8 98.5 100.5
4 Commercial Operations and Environment 14.7 19.5 16.8 20.4 20.2 18.9 19.9 19.6 21.8
5 Corporate Centre 29.2 26.9 39.6 44.3 44.9 44.5 45.0 45.8 45.8
6 Total 428.4 416.2 418.8 442.3 448.9 437.2 442.7 445.0 454.1
Table 3
Allocation of Corporate Support & Administrative Costs - Nuclear ($M)

Numbers may not add due to rounding. Filed: 2016-05-27
EB-2016-0152
Exhibit F3
Tab 1
Schedule 1
Table 4
Table 4
Allocation of Finance Costs - Regulated Hydroelectric ($M)
Intentionally left blank (See Ex. A1-3-1)
Numbers may not add due to rounding. Filed: 2016-05-27
EB-2016-0152
Exhibit F3
Tab 1
Schedule 1
Table 5
Line 2013 2014 2015 2016 2017 2018 2019 2020 2021
No. Costs Actual Actual Actual Budget Plan Plan Plan Plan Plan
(a) (b) (c) (d) (e) (f) (g) (h) (i)
1 Controllership 30.0 28.7 30.9 35.9 36.5 34.6 34.4 34.3 35.5
2 Investment Planning 2.9 2.3 1.0 1.2 1.2 1.1 1.2 0.9 0.7
3 Assurance1 8.4 8.4 0.0 0.0 0.0 0.0 0.0 0.0 0.0
4 Treasury & Fund Management 2.8 2.6 2.1 2.9 3.0 3.0 3.2 3.1 3.2
5 CFO Office 2.2 2.4 1.5 0.2 0.8 0.7 0.2 0.5 0.5
6 Total 46.3 44.4 35.6 40.2 41.5 39.4 39.0 38.8 39.9
Notes:
1 Moved to Corporate Centre during organizational change in 2015.
Table 5
Allocation of Finance Costs - Nuclear ($M)
Numbers may not add due to rounding. Filed: 2016-05-27
EB-2016-0152
Exhibit F3
Tab 1
Schedule 1
Table 6
Table 6
Allocation of Business and Administrative Service Costs - Regulated Hydroelectric ($M)
Intentionally left blank (See Ex. A1-3-1)
Numbers may not add due to rounding. Filed: 2016-05-27
EB-2016-0152
Exhibit F3
Tab 1
Schedule 1
Table 7
Line 2013 2014 2015 2016 2017 2018 2019 2020 2021
No. Costs Actual Actual Actual Budget Plan Plan Plan Plan Plan
(a) (b) (c) (d) (e) (f) (g) (h) (i)
1 Infrastructure Management 27.3 26.7 25.8 22.9 22.2 21.4 21.4 20.6 20.0
2 Application Maintenance 12.2 11.9 11.5 10.2 9.9 9.5 9.5 9.2 8.9
3 Data Centre Services 12.4 12.1 11.7 10.4 10.0 9.7 9.7 9.3 9.0
4 Other Services 4.0 3.9 3.8 3.3 3.2 3.1 3.1 3.0 2.9
5 NHSS Base Costs 55.9 54.6 52.7 46.8 45.3 43.7 43.7 42.1 40.8
6 IT Support Costs 35.9 36.6 37.3 41.8 43.7 42.6 42.3 42.7 43.2
7 IT Costs (line 6 + line 7) 91.8 91.2 90.0 88.6 89.0 86.3 86.0 84.8 84.0
8 Supply Chain 48.6 42.5 41.1 47.6 47.3 46.7 47.8 49.2 50.3
9 Real Estate 88.4 83.3 82.5 89.9 94.5 92.8 95.0 95.5 98.7
10 OM&A Project Costs 17.8 10.2 17.4 18.9 15.3 13.3 12.2 12.8 13.1
11 Total 246.6 227.2 231.0 245.0 246.1 239.1 241.0 242.3 246.1
Table 7
Allocation of Business and Administrative Service Costs - Nuclear ($M)
Numbers may not add due to rounding. Filed: 2016-05-27
EB-2016-0152
Exhibit F3
Tab 1
Schedule 1
Table 8
Table 8
Allocation of People and Culture Costs - Regulated Hydroelectric ($M)
Intentionally left blank (See Ex. A1-3-1)

Numbers may not add due to rounding. Filed: 2016-05-27
EB-2016-0152
Exhibit F3
Tab 1
Schedule 1
Table 9
Line 2013 2014 2015 2016 2017 2018 2019 2020 2021
No. Costs Actual Actual Actual Budget Plan Plan Plan Plan Plan
(a) (b) (c) (d) (e) (f) (g) (h) (i)
1 Business Partners 4.1 3.7 3.2 3.2 3.4 3.5 3.5 3.5 3.6
2 Total Rewards & Solutions 9.3 10.0 10.1 10.2 10.5 10.4 10.6 10.8 11.0
3 Heath & Safety Employee & Labour Relations 11.4 12.0 10.5 11.2 12.0 11.7 11.7 12.2 12.8
4 SVP Office 6.2 7.2 5.4 3.7 4.0 4.4 4.8 4.8 5.0
5 Talent Management & Business Change 1.9 2.6 4.9 4.8 4.7 4.4 4.4 4.5 4.6
6 Learning & Development 58.7 62.7 61.7 59.3 61.6 60.9 62.8 62.7 63.5
7 Total 91.6 98.2 95.8 92.4 96.2 95.3 97.8 98.5 100.5
Table 9
Allocation of People and Culture Costs - Nuclear ($M)


![Rlryry€ ['f3#:1'] ft .*, TWm - Madhya Pradesh](https://img.pdfslide.us/doc/110x75/618210195913ce52620937b4/rlryry-f31-ft-twm-madhya-pradesh.jpg)


