Embed Size (px)
Citation preview

Allocation and Social Equity
H. Paul Williams - London School of Economics
Work with Martin Butler
University College Dublin

Allocation Problems - Operational Research
Fairness of Allocation - Social Policy
What is Fair?

12 Grapefruit and 12 Avocados
to be split between Smith and Jones
An Example

Jones derives 100mls of Vitamin F from each Grapefruit
none from each Avocado
Smith derives 50mls of Vitamin F from each Grapefruit
50mls of Vitamin F from each Avocado

How should the fruit be divided?
1. Jones 12G Smith 12A ?
2. Jones 9G Smith 3G 12A ?
3. Jones 8G Smith 4G 12A ?

MODEL
GJ Grapefruit to Jones GS Grapefruit to Smith
AJ Avocados to Jones AS Avocados to Smith
Value to Jones = 100 GJValue to Smith = 50 GS + 50 AS
GJ + GS = 12AJ + AS = 12
What Criterion Should Be Applied?

Utilitarian Maximise 100 GJ + 50 GS + 50 AS
Leads to GJ = 12, GS = 0, AS = 12
(Total ‘Good’ = 1800)
Egalitarian Maximise Minimum (100GJ, 50 GS+ 50 AS)
Leads to GJ = 8, GS = 4, AS = 12
(Total ‘Good’ = 1600)

ALLOCATION OF MEDICAL RESOURCES
Use of QALYs (QUALITY ADJUSTED LIFE YEARS)
Allocate Resources according to greatest QALY Cost

Utilitarian Approach Maximise Total QALYs
subject to resource limits
Favours Young over Old
Favours Unborn over Living e.g. Fertility Treatment

Fair Approach?
Maximise Minimum shortfall of desirable QALYs over whole population

Teacher Allocation
How to spread limited numbers of teachers over different ability groups.

Example
Education
Category Students Desirable Class Size
Desirable Number of Teachers
Special Needs 1 70 3 23.33
Standard A 2 80 5 16
Standard B 3 150 10 15
Gifted 4 300 16 18.75
Very Clever 5 200 15 13.33
Total 800 86.41
How to allocate the 70 available teachers in a “fair” manner?
The negative benefit of a shortfall in a category proportional to number in category/desirable number of teachers.
How should resources be allocated fairly?
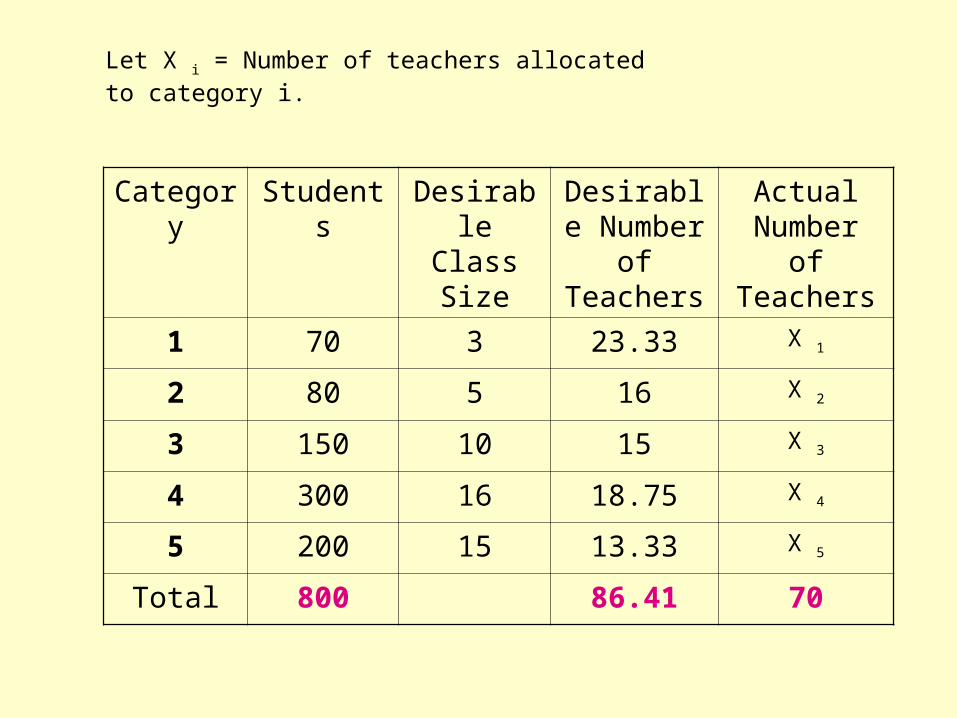
Let X i = Number of teachers allocated to category i.
Category Students Desirable Class Size
Desirable Number of Teachers
Actual Number of Teachers
1 70 3 23.33 X 1
2 80 5 16 X 2
3 150 10 15 X 3
4 300 16 18.75 X 4
5 200 15 13.33 X 5
Total 800 86.41 70

Consider Coalitions. ( Mixed ability classes )
Category Coalition Students Desirable Class Size
Desirable Number of Teachers
Actual Number of Teachers
6 1,2 150 4 37.50 X 6
7 1,2,3 300 6 50 X 7
8 2,3 230 8 28.75 X 8
9 2,3,4 530 11 48.18 X 9
10 3,4 450 14 32.14 X 10
11 3,4,5 650 15 43.33 X 11
12 4,5 500 16 31.25 X 12

Mixed Integer Optimisation Problem
Decide on possible coalitions (if at all) and allocations of teachers within these to
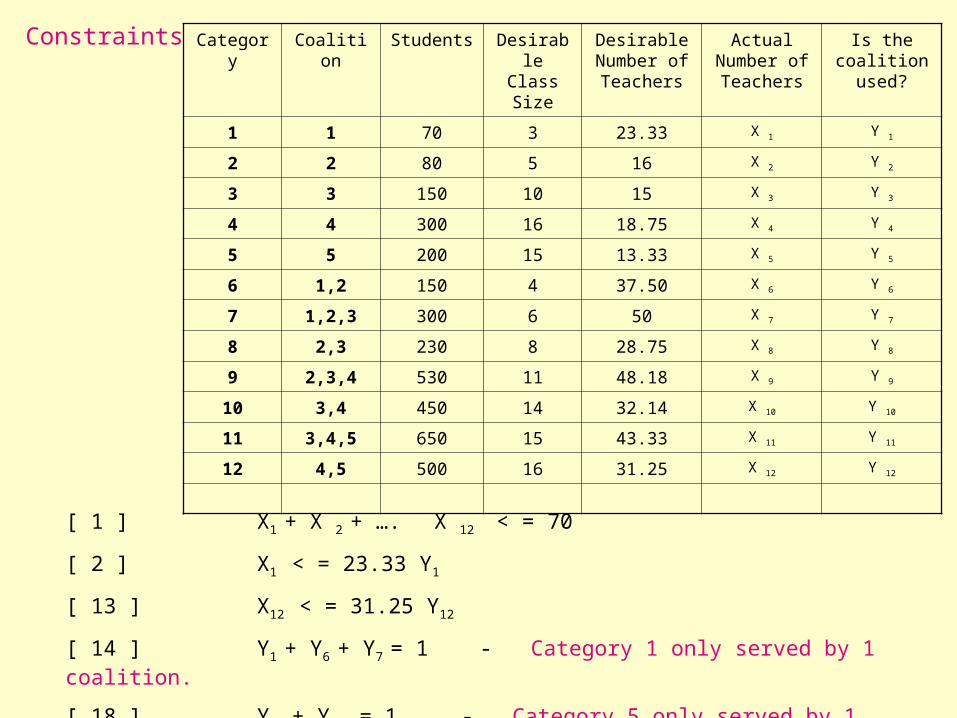
Constraints Category Coalition Students Desirable Class Size
Desirable Number of Teachers
Actual Number of Teachers
Is the coalition
used?
1 1 70 3 23.33 X 1 Y 1
2 2 80 5 16 X 2 Y 2
3 3 150 10 15 X 3 Y 3
4 4 300 16 18.75 X 4 Y 4
5 5 200 15 13.33 X 5 Y 5
6 1,2 150 4 37.50 X 6 Y 6
7 1,2,3 300 6 50 X 7 Y 7
8 2,3 230 8 28.75 X 8 Y 8
9 2,3,4 530 11 48.18 X 9 Y 9
10 3,4 450 14 32.14 X 10 Y 10
11 3,4,5 650 15 43.33 X 11 Y 11
12 4,5 500 16 31.25 X 12 Y 12
[ 1 ] X1 + X 2 + …. X 12 < = 70
[ 2 ] X1 < = 23.33 Y1
[ 13 ] X12 < = 31.25 Y12
[ 14 ] Y1 + Y6 + Y7 = 1 - Category 1 only served by 1 coalition.
[ 18 ] Y11 + Y12 = 1 - Category 5 only served by 1 coalition.
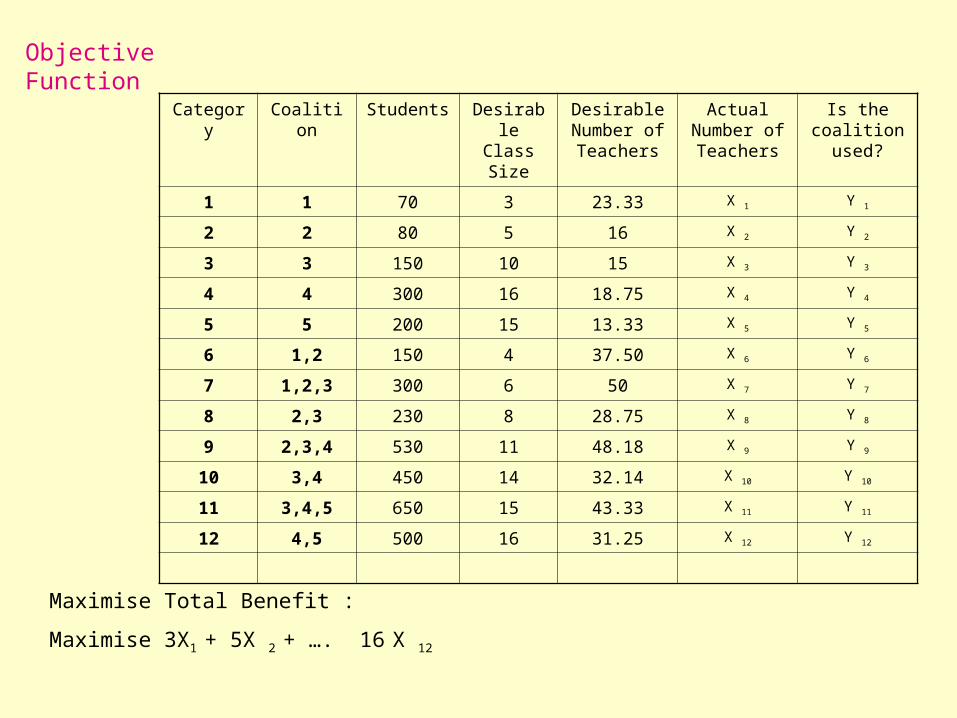
Objective Function
Category Coalition Students Desirable Class Size
Desirable Number of Teachers
Actual Number of Teachers
Is the coalition
used?
1 1 70 3 23.33 X 1 Y 1
2 2 80 5 16 X 2 Y 2
3 3 150 10 15 X 3 Y 3
4 4 300 16 18.75 X 4 Y 4
5 5 200 15 13.33 X 5 Y 5
6 1,2 150 4 37.50 X 6 Y 6
7 1,2,3 300 6 50 X 7 Y 7
8 2,3 230 8 28.75 X 8 Y 8
9 2,3,4 530 11 48.18 X 9 Y 9
10 3,4 450 14 32.14 X 10 Y 10
11 3,4,5 650 15 43.33 X 11 Y 11
12 4,5 500 16 31.25 X 12 Y 12
Maximise Total Benefit :
Maximise 3X1 + 5X 2 + …. 16 X 12

Maximise 3X1 + 5X 2 + …. 16 X 12
Subject to:
[ 1 ] X1 + X 2 + …. X 12 < = 70
[ 2 ] X1 < = 23.33 Y1
…..
[ 13 ] X12 < = 31.25 Y12
[ 14 ] Y1 + Y6 + Y7 = 1
…..
[ 18 ] Y11 + Y12 = 1
X1 , X 2 , …. X 12 > = 0, and integer
Y1 , Y 2 , …. Y 12 = {0,1}
Formulation
Solution is :
Y1 = 1 X1 = 11
Y2 = 1 X2 = 16
Y11 = 1 X11 = 43
Max Benefit = 758

Solution
Coalition Students Desirable Class Size
Desirable Number of Teachers
Actual Number of Teachers
Benefit Teacher
Shortfall
Benefit
Shortfall
1 70 3 23.33 11 33 12.33 37
2 80 5 16 16 80 - -
3 150 10 15
4 300 16 18.75
5 200 15 13.33
1,2 150 4 37.50
1,2,3 300 6 50
2,3 230 8 28.75
2,3,4 530 11 48.18
3,4 450 14 32.14
3,4,5 650 15 43.33 43 645 0.33 5
4,5 500 16 31.25
Total 70 758 42
The Majority Loss of Benefit Falls on Category 1. Is this fair?

Minimise W
Subject to:
[ 1 ] X1 + X 2 + …. X 12 < = 70
[ 2 ] X1 < = 23.33 Y1
…..
[ 13 ] X12 < = 31.25 Y12
[ 14 ] Y1 + Y6 + Y7 = 1
…..
[ 18 ] Y11 + Y12 = 1
[ 19 ] W >= 70Y1 - 3X1
…..
[ 30 ] W >= 500Y12 - 16X12
X1 , X 2 , …. X 12 > = 0, and integer
Y1 , Y 2 , …. Y 12 = {0,1}
MIN – MAX Formulation
Solution is :
Y1 = 1 X1 = 16
Y2 = 1 X2 = 12
Y11 = 1 X11 = 42
Min W = 22

Solution
Coalition Students Desirable Class Size
Desirable Number of Teachers
Actual Number of Teachers
Benefit Teacher
Shortfall
Benefit
Shortfall
1 70 3 23.33 16 48 7.33 22
2 80 5 16 12 60 4 20
3 150 10 15
4 300 16 18.75
5 200 15 13.33
1,2 150 4 37.50
1,2,3 300 6 50
2,3 230 8 28.75
2,3,4 530 11 48.18
3,4 450 14 32.14
3,4,5 650 15 43.33 42 630 1.33 20
4,5 500 16 31.25
Total 70 738 62
In total worse, but would seem to be a “FAIRER” solution.

Fixed Cost Allocation
Examples:
• How should cost of an airport runway be spread among different sizes of aircraft?
• How should cost of a dam be spread among different beneficiaries?
(hydro generators, water sports, irrigation)
• How should cost of an ATM be spread among different credit card companies?

Co-operative Game Theory
Not fair to charge users within a coalition more, in total, than the coalition would be charged (core solutions)
Nucleolus Solution:
Minimise Maximum (i.e. try to equalise) savings of each coalition from forming coalition

Veterinary Science 6Medicine 7Architecture 2Engineering 10Arts 18Commerce 30Agriculture 11Science 29Social Science 7
Example:
Cost of Computer Provision in a University (in 100k)
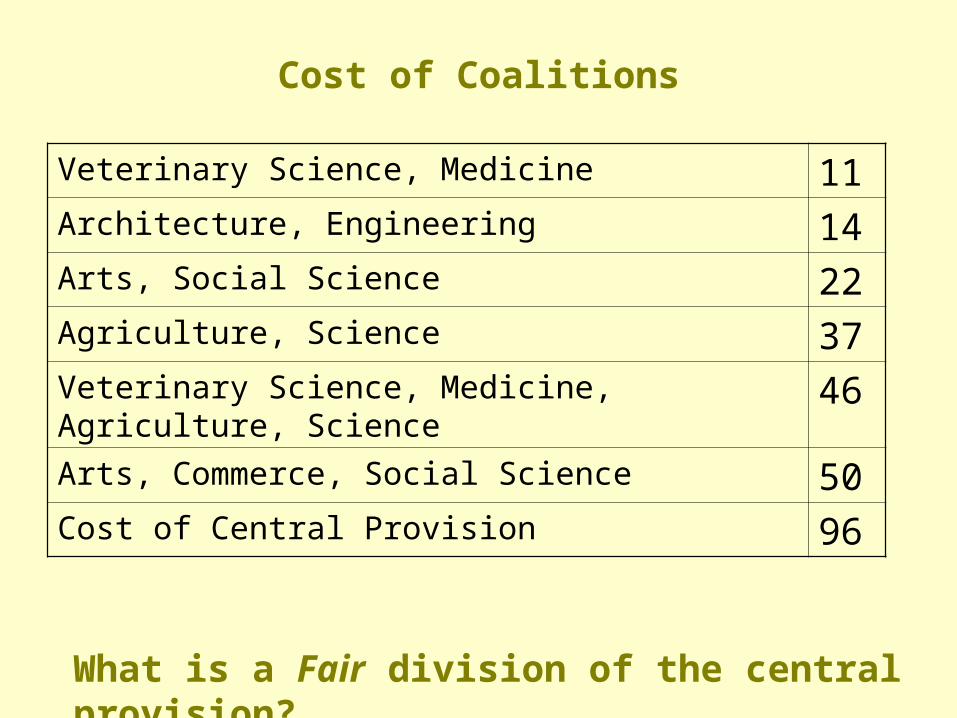
Cost of Coalitions
What is a Fair division of the central provision?
Veterinary Science, Medicine 11Architecture, Engineering 14Arts, Social Science 22Agriculture, Science 37Veterinary Science, Medicine, Agriculture, Science 46Arts, Commerce, Social Science 50Cost of Central Provision 96

Cost of Computer Provision (in £100k)
Independent Cost
A Core
Cost
Nucleolus
Cost
Weighted
Nucleolus Cost
Veterinary Science 6 6 4 1.83Medicine 7 3 1 5Architecture 2 2 0 0Engineering 10 0 8 7.5Arts 18 11 15 16Commerce 30 30 28 24.67Agriculture 11 8 8 9Science 29 29 27 27Social Science 7 7 5 5
96 96 96

Facility LocationCustomer A requires 1 of Facilities 1 or 2 or 3
and 1 of Facilities 4 or 5 or 6
and has a benefit of 8
Customer B requires 1 of Facilities 1 or 4
and 1 of Facilities 2 or 5
and has a Benefit of 11
Customer C requires 1 of Facilities 1 or 5
and 1 of Facilities 3 or 6
and has a Benefit of 19

Fixed Costs of Facilities (1 to 6) 8, 7, 8, 9, 11, 10
How do we split fixed costs of Facilities among Customers who use them?
Optimal Solution (Maximum Benefit – Cost) is to build Facilities 1, 2, 6 and supply all Customers.
There is no satisfactory cost allocation which will lead to this.
Find Optimal Solution (Integer Programming) and then allocate costs.

Possible Allocation
A
Surpluses Customers Facilities
8
B
6
5
4
3
2
8
4
1
11
19
8
7
0
0
0
10
7
8
10
C
1

Allocation from Minimising Maximum Surpluses
A41/3
1
B
6
5
4
3
2
41/3
11
19
8
7
0
0
1010
C
031/3
42/3
8
32/3
31/3
41/3
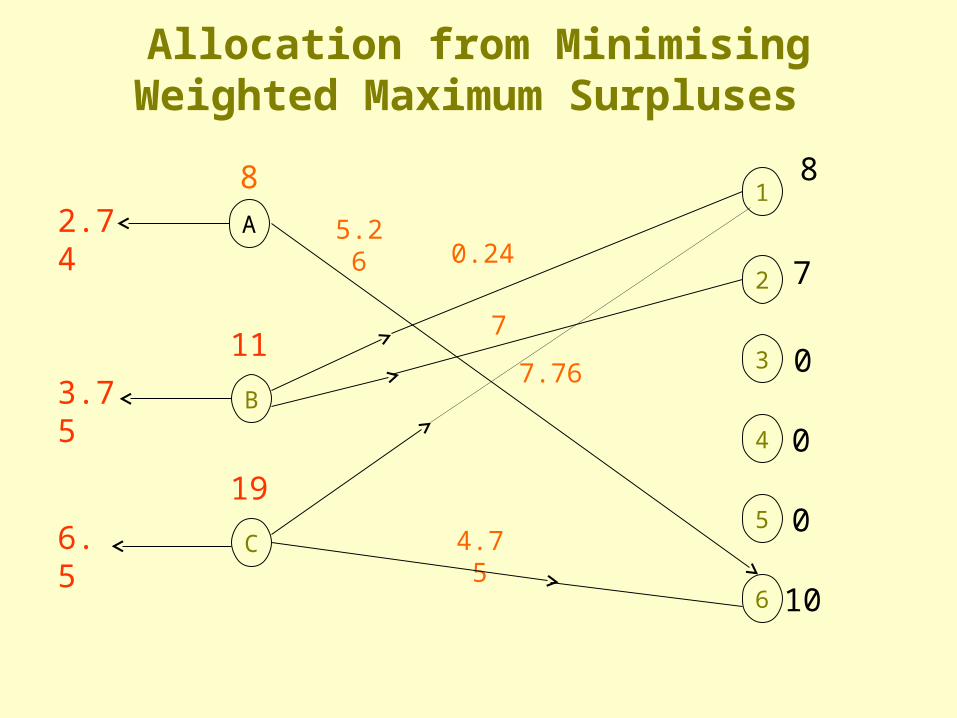
Allocation from Minimising Weighted Maximum Surpluses
8
A2.741
B
6
5
4
3
2
6.5
11
19
7
0
0
10
4.75C
07
7.76
8
5.260.24
3.75

ReferencesM. Butler & H.P. Williams, Fairness versus Efficiency in Charging for the Use of Common Facilities, Journal of the Operational Research Society, 53 (2002)
M. Butler & H.P. Williams, The Allocation of Shared Fixed Costs, European Journal of Operational Research, 170 (2006)
J. Broome, Good, Fairness and QALYS, Philosophy and Medical Welfare, 3 (1988)
J. Rawls, A Theory of Justice, Oxford University Press, 1971
J. Rawls & E. Kelly Justice as Fairness: A Restatement Harvard University Press, 2001
M. Yaari & M. Bar-Hillel, On Dividing Justly, Social Choice Welfare 1, 1984


![005014910 00293 - National Archives of Ireland · 2013-06-18 · Dublin to Julian G. W. Butler of 2 Garscube Murryfield Edinburgh Esquire Effects £1,532 163. 4d. ... Joseph [337]](https://img.pdfslide.us/doc/110x75/5fa3e614d9fd142da16a112d/005014910-00293-national-archives-of-2013-06-18-dublin-to-julian-g-w-butler.jpg)
![Persuasion markers and ideology in eighteenth century ... · Dublin. [Dublin]. 10,017 Butler, Joseph The analogy of religion, natural and revealed, to the constitution and course](https://img.pdfslide.us/doc/110x75/5f3b3cd9df1b6402130187a9/persuasion-markers-and-ideology-in-eighteenth-century-dublin-dublin-10017.jpg)