Embed Size (px)
Citation preview
Economic Research
Allianz Global Wealth Report 2017

Allianz Global Wealth Report 2017
Kathrin BrandmeirDr. Michaela GrimmDr. Michael HeiseDr. Arne Holzhausen

Allia
nz G
loba
l Wea
lth R
epor
t 201
7
5It’s ten years since the eruption of the major financial crisis that almost caused the global financial sys-tem to collapse. What lessons have savers learned from this profound event? The answer is surprising and, at the same time, sobering.
Despite low interest rates, private investors in industrialized countries have, on average, invested around EUR 1 trillion of fresh savings in bank accounts each year since the outbreak of the financial crisis, more than in any other financial product. Last year a record sum of almost EUR 1.4 trillion was achieved. That means they held about EUR 33 trillion of their financial assets in the form of bank deposits at the end of 2016. Such investment behavior has paradoxical results. From this angle, banks are turning out to be the crisis winners, while savers are suffering severe losses due to zero interest rates. In 2016 alone, they are thought to have lost around EUR 300 billion owing to inflation, even though inflation was low.
This was not the intention of the zero interest rate policy pursued since the financial crisis. The aboli-tion of interest on risk-free investments was actually intended to encourage savers to favor higher-risk investments such as shares or long-term investment products, which would help support the economy. What happened was the opposite. However, we won’t achieve anything simply by complaining about these cautious, liquidity-oriented savings habits. That’s not what we aspire to as one of the world’s leading financial service providers. Instead, these figures are an incentive for us to develop better and simpler products for more savers, so that we can finally overcome this “investment lethargy”. Digitali-zation gives us a powerful tool that can make it easier to access modern savings products. Because one thing is clear. Given the challenges that lie ahead – climate change and demographic change spring to mind – long-term, yield-oriented investments are needed in order to protect our prosperity for the generations to come.
The situation with regard to savings is not much better in emerging markets. Private assets have achieved very high growth rates in some cases, even after the financial crisis, with more and more peo-ple sharing in global prosperity and thus becoming part of the new global middle class. However, it is estimated that less than 20% of financial assets are invested in long-term savings products. Often inves-tors simply lack access to investment opportunities beyond a basic bank account. There is widespread need for action. Digitalization could be the key to success in these countries as well.
Our comprehensive analysis of global household assets, which we have continued with this eighth edi-tion of the “Allianz Global Wealth Report”, therefore offers more than just an abundance of interesting and surprising facts and figures. For me, this report is principally an incentive to spur us on in future to fulfill our responsibility to customers and society even better as a leading financial service provider.
Oliver Bäte Chairman of the Board of Management of Allianz SE
Preface

Table of contents
8 Summary
12 Development in global financial assets: Recovery in turbulent times 18 Box: Do you get money to work for you, or do you work for money?
30 Development in global liabilities: A return to debt growth 41 Box: No fears of a rise in interest rates
44 Wealth distribution: Light and shade 58 Box: The impact of unconventional monetary policy on distribution
61 Regional differences: Financial assets in individual regions 62 Latin America 72 North America 82 Western Europe 92 Box: Rich Germany, poor Germany? 96 Eastern Europe 108 Asia 124 Australia and New Zealand
133 Literature 134 Appendix A: Methodological comments 136 Appendix B: Financial assets by country 138 Appendix C: Global Ranking

Summary
Allia
nz G
loba
l Wea
lth R
epor
t 201
7
9
Recovery in turbulent times
The political turbulence during 2016 had
little impact on the development of pri-
vate financial assets. After relatively weak
growth in 2015 (+4.7%), growth picked up
again noticeably last year (+7.1%), with glob-
al gross financial assets climbing to a new
record high of EUR 169.2 trillion. Growth
accelerated in all three asset classes (bank
deposits, securities and insurance policies
and pension funds), although securities
fared the best with global growth of 8.7%,
thanks to the rally on the stock markets at
the end of the year.
Bank deposits defy zero interest rates
Bank deposits remain popular despite zero
interest rates, with two-thirds of new sav-
ings going into banks in 2016. By contrast,
households sold more securities than they
purchased. However, there were signifi-
cant differences in savings habits between
regions, and these differences are reflected
in the functional drivers of asset growth.
Around three-quarters of asset growth in
North America is attributable to changes in
the value of portfolios, compared with about
half of growth in Europe and only around
a quarter in Germany. While American
households get their money to work for them,
the reverse is true in Europe, particularly in
Germany, where investors have to work hard
to achieve asset growth through their own
savings.
Asia is growing at by far the fastest rate
Asia (excluding Japan) was once again the
uncontested leader in 2016, with growth of
15%. The dominance of this region becomes
even clearer in a long-term comparison, par-
ticularly when inflation is also taken into
account. Gross per capita financial assets in
Asia (excluding Japan) grew by almost 11%
per year in real terms in the last decade. The
other two emerging regions, Latin America
and Eastern Europe, achieved growth of only
about 5%, which was still more than twice
as fast as the growth rates in North America
(+2.1% real growth since 2006) and Western
Europe (+1.4%).
China dominates
The slow catch-up process in emerging
countries continued in 2016. The three
regions of Latin America, Eastern Europe
and Asia (excluding Japan) accounted for
just under 23% of global gross financial
assets. This share has more than doubled in
the last ten years. Emerging markets have
an even bigger weighting when it comes
to asset growth, with almost 40% of last
year’s growth attributable to this group of
countries. However, this is largely due to the
development in China, which alone account-
ed for 30% of global growth in 2016.
Debt is growing much faster again
Global household liabilities increased by
5.5% in 2016, the highest rate of growth since
2007. That means that debt also rose faster
than nominal economic output for the first
time since 2009, and the global debt ratio
increased by almost 1 percentage point to
64.6%. Development varied widely between
individual regions. Growth accelerated
slightly – starting from a moderate level – in
Western and Eastern Europe and in North
America. Latin America experienced a
further decline in growth. In Asia (exclud-
ing Japan), on the other hand, debt growth
rose sharply by a further four percentage
points to just under 17%. That means that
this region accounts for almost one-fifth of
global private liabilities of just under EUR
41 trillion, compared with less than 7% ten
years ago.
Sum
mar
y
10
Eastern Europe comes last
If debt is subtracted from gross financial
assets, that leaves net financial assets,
which reached a new global record high of
EUR 128.5 trillion at the close of 2016. That
represents an increase of 7.6% year-on-year.
Although this is slightly below average for
the years since the crisis, it is well above the
previous year’s growth of 4.8%. Despite the
catch-up process, discrepancies between
household assets in richer regions and
those in the world’s poorer regions remain
huge. North America remains the richest
region in the world, with average per capita
assets of EUR 168,130 after deduction of debt
at the end of 2016. This figure is EUR 58,910
in Western Europe and only EUR 4,150 in
Eastern Europe, the poorest region.
Global wealth distribution: Light ...
Development of global wealth distribution
since the turn of the millennium has been
defined by one phenomenon in particular:
rampant growth in the global wealth mid-
dle class. The number of people belonging
to this category has more than doubled
during this period, from around 450 million
in 2000 to over 1 billion today. The vast
majority of those joining the middle class
have come from the wealth lower class, with
almost 600 million people making the leap
since 2000.
... and shade
Despite the emergence of a new global
wealth middle class, the world as a whole
is still a long way from a “fair” distribution
of wealth. If we divide the population of
the countries we have analyzed into global
population deciles based on net per capita
financial assets, it becomes clear that the
richest 10% of the world together own 79%
of net financial assets. Nevertheless, the
concentration of wealth was still as high
as 91% in 2000. A comparison of median
and average assets proves equally sober-
ing. While median net per capita financial
assets come to EUR 3,140, the average figure
is EUR 25,510. In the top decile, average
net per capita financial assets exceed the
EUR 200,000 threshold. Median assets have,
however, risen at an average rate of 15.2% a
year since the turn of the millennium, sig-
nificantly faster than average assets (+4.8%).
The (relative) gap between the two figures is
thus narrowing.
An elephant without its trunk
These global wealth deciles can be used
to recreate the infamous “elephant chart”,
which maps income growth for each per-
centile of the global population, for asset
growth. It is impossible not to notice the
similarities to the original. In particular,
households in the upper middle part of the
global wealth distribution – those joining
the middle class in emerging countries –
have benefited from asset growth in recent
years. However, there is a striking difference
at the top end of the distribution pyramid.
Growth slows considerably in the 10th
decile, the decile with the highest net per
capita financial assets. The elephant has no
trunk. In contrast to the income situation,
assets are growing more slowly at the higher
end of the scale than in the middle.
National wealth distribution: A reversal of the trend following the financial crisis?
Wealth distribution in emerging countries
has tended to improve in recent decades,
while in industrialized nations it has
tended to deteriorate. Exceptions prove the
rule. However, these trends have weakened
since the financial crisis. In industrialized
countries in particular, the trend towards

Allia
nz G
loba
l Wea
lth R
epor
t 201
7
11
less equal distribution has since slowed sig-
nificantly, not least in the US, although the
latter remains one of the countries with very
unequal distribution. A direct comparison
between median and average net per capita
financial assets also highlights this. In the
global rankings of the world’s richest coun-
tries based on median values, the US would
not come top – as it does in the rankings
based on average values – but instead would
be in 13th place.


Development in global financial assets
Recovery in turbulent times
Deve
lopm
ent i
n gl
obal
fina
ncia
l ass
ets
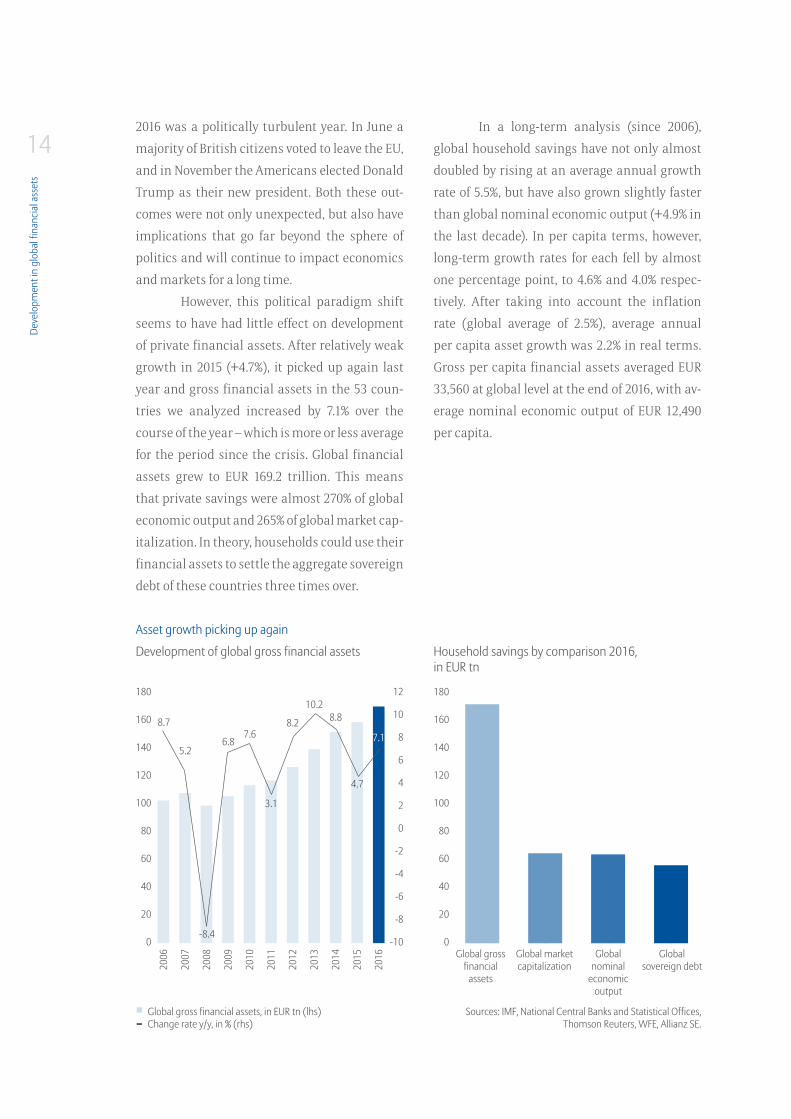
142016 was a politically turbulent year. In June a
majority of British citizens voted to leave the EU,
and in November the Americans elected Donald
Trump as their new president. Both these out-
comes were not only unexpected, but also have
implications that go far beyond the sphere of
politics and will continue to impact economics
and markets for a long time.
However, this political paradigm shift
seems to have had little effect on development
of private financial assets. After relatively weak
growth in 2015 (+4.7%), it picked up again last
year and gross financial assets in the 53 coun-
tries we analyzed increased by 7.1% over the
course of the year – which is more or less average
for the period since the crisis. Global financial
assets grew to EUR 169.2 trillion. This means
that private savings were almost 270% of global
economic output and 265% of global market cap-
italization. In theory, households could use their
financial assets to settle the aggregate sovereign
debt of these countries three times over.
In a long-term analysis (since 2006),
global household savings have not only almost
doubled by rising at an average annual growth
rate of 5.5%, but have also grown slightly faster
than global nominal economic output (+4.9% in
the last decade). In per capita terms, however,
long-term growth rates for each fell by almost
one percentage point, to 4.6% and 4.0% respec-
tively. After taking into account the inflation
rate (global average of 2.5%), average annual
per capita asset growth was 2.2% in real terms.
Gross per capita financial assets averaged EUR
33,560 at global level at the end of 2016, with av-
erage nominal economic output of EUR 12,490
per capita.
Development of global gross financial assets Household savings by comparison 2016, in EUR tn
Asset growth picking up again
Sources: IMF, National Central Banks and Statistical Offices, Thomson Reuters, WFE, Allianz SE.
Global gross financial
assets
Global market capitalization
Global nominal
economic output
Global sovereign debt
Global gross financial assets, in EUR tn (lhs)Change rate y/y, in % (rhs)
2006
2007
2008
2009
2010
2011
2012
2013
2014
2015
2016
180
160
140
120
100
80
60
40
20
0
180
160
140
120
100
80
60
40
20
0
12
10
8
6
4
2
0
-2
-4
-6
-8
-10
8.7
5.2
-8.4
6.87.6
3.1
8.2
10.28.8
4.7
7.1
Allia
nz G
loba
l Wea
lth R
epor
t 201
7
15Industrialized nations catch up
Last year’s acceleration in growth mostly came
from industrialized countries. While emerging
markets more or less maintained the previous
year’s growth rate (+15.5%), growth in advanced
economies doubled to 5.2%. Two countries in
particular stood out: the US and the UK, i.e. pre-
cisely those countries at the epicenter of the po-
litical earthquake in 2016. Paradoxically, it may
have been market reactions to the political up-
heaval that boosted asset growth.
Gross financial assets in the US in-
creased by almost 6% in 2016 (following growth
of 2.3% in the previous year), driven by strong
growth in securities holdings, largely due to
the “Trump rally” on the stock markets. Having
stagnated for most of the year, the S&P 500 end-
ed up gaining almost 10% for the year as a whole
thanks to this end-of-year boost. In the UK, on
the other hand, financial assets grew by 8% last
year (following a drop of about 2% in 2015); in-
surance companies and pension funds, which
achieved strong value gains on their bond hold-
ings as a result of falling interest rates, were re-
sponsible for this. In total, these two countries
account for about 40% of global asset growth
in 2016, with the US naturally representing the
lion’s share of over 35%. Only China, which ac-
counted for around 30% of last year’s growth, has
a similarly large weighting. It is therefore main-
ly these two economic heavyweights that are
determining global growth in assets. The rest of
Asia (excluding China) and Europe (excluding
the UK) each have a share of only about 10% in
global asset growth.
Europeans are saving, Americans are investing
Along with regional growth drivers, it is also
worthwhile examining “functional” growth
drivers in more detail, i.e. looking at the ques-
tion of whether asset growth is coming primar-
ily from new savings/inflows of funds or from
changes in the value of existing portfolios.1
Inflows of funds have been relatively
stable over the last few years following the slump
caused by the financial crisis, with a slight dip
occurring only in 2013. However, larger shifts are
discernible in the composition of savings. While
around 40% of new funds went to banks during
the pre-crisis years, this figure rose to an aver-
age of about 50% in the years following the crisis.
Last year, as much as two-thirds of fresh funds
were paid into banks. Faith in bank deposits is
very high in Europe in particular (and in Japan).
1 As detailed data on inflows of funds are not available for all countries, the following analysis is essentially limited to industrialized countries.
Deve
lopm
ent i
n gl
obal
fina
ncia
l ass
ets
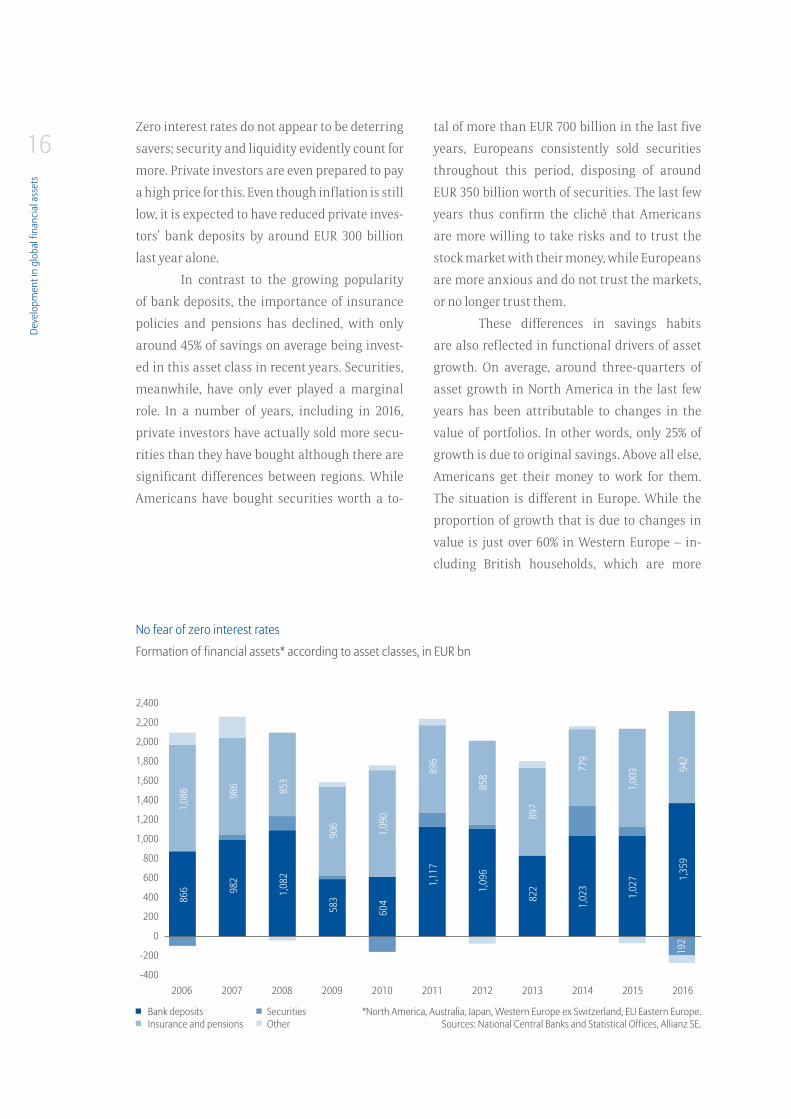
16Zero interest rates do not appear to be deterring
savers; security and liquidity evidently count for
more. Private investors are even prepared to pay
a high price for this. Even though inflation is still
low, it is expected to have reduced private inves-
tors’ bank deposits by around EUR 300 billion
last year alone.
In contrast to the growing popularity
of bank deposits, the importance of insurance
policies and pensions has declined, with only
around 45% of savings on average being invest-
ed in this asset class in recent years. Securities,
meanwhile, have only ever played a marginal
role. In a number of years, including in 2016,
private investors have actually sold more secu-
rities than they have bought although there are
significant differences between regions. While
Americans have bought securities worth a to-
tal of more than EUR 700 billion in the last five
years, Europeans consistently sold securities
throughout this period, disposing of around
EUR 350 billion worth of securities. The last few
years thus confirm the cliché that Americans
are more willing to take risks and to trust the
stock market with their money, while Europeans
are more anxious and do not trust the markets,
or no longer trust them.
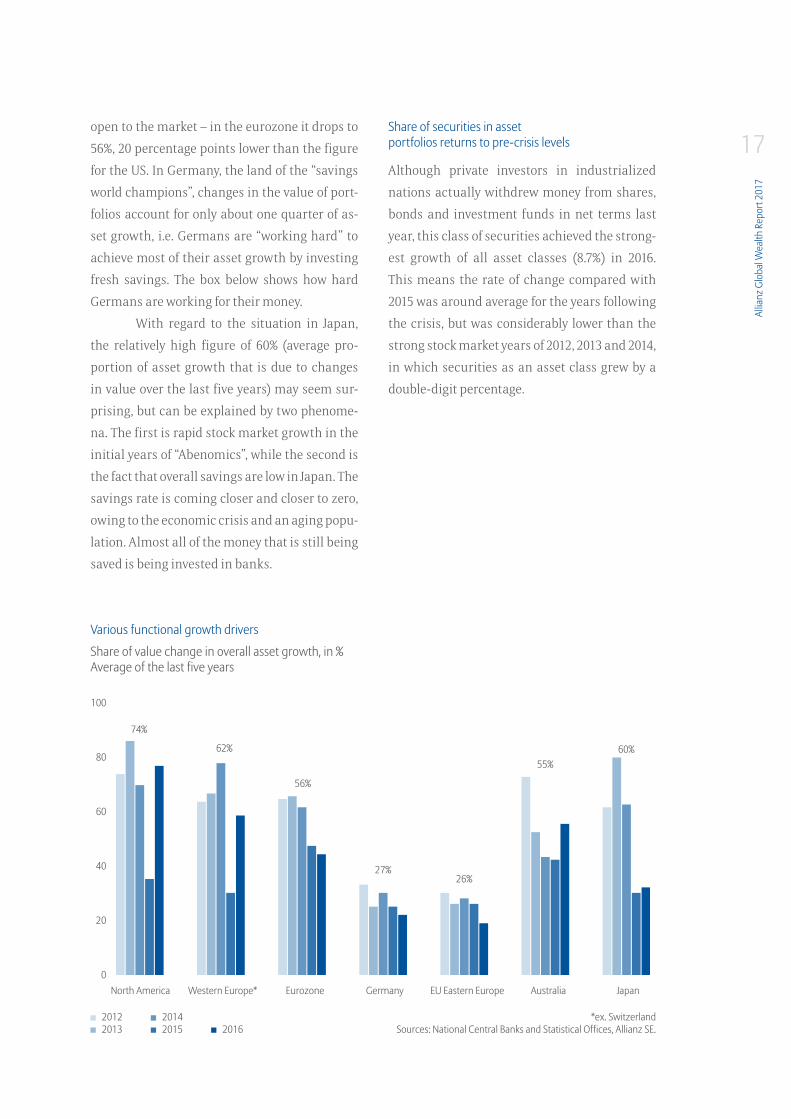
These differences in savings habits
are also reflected in functional drivers of asset
growth. On average, around three-quarters of
asset growth in North America in the last few
years has been attributable to changes in the
value of portfolios. In other words, only 25% of
growth is due to original savings. Above all else,
Americans get their money to work for them.
The situation is different in Europe. While the
proportion of growth that is due to changes in
value is just over 60% in Western Europe – in-
cluding British households, which are more
No fear of zero interest rates
Formation of financial assets* according to asset classes, in EUR bn
*North America, Australia, Japan, Western Europe ex Switzerland, EU Eastern Europe.Sources: National Central Banks and Statistical Offices, Allianz SE.
SecuritiesOther
Bank depositsInsurance and pensions
2,400
2,200
2,000
1,800
1,600
1,400
1,200
1,000
800
600
400
200
0
-200
-4002006 2007 2008 2009 2010 2011 2012 2013 2014 2015 2016
1,08
6 986 85
3
906
1,09
0
896
858
897
779
1,00
3 942
-192
866 98
2
1,08
2
583
604
1,11
7
1,09
6
822
1,02
3
1,02
7 1,35
9
Allia
nz G
loba
l Wea
lth R
epor
t 201
7
17open to the market – in the eurozone it drops to
56%, 20 percentage points lower than the figure
for the US. In Germany, the land of the “savings
world champions”, changes in the value of port-
folios account for only about one quarter of as-
set growth, i.e. Germans are “working hard” to
achieve most of their asset growth by investing
fresh savings. The box below shows how hard
Germans are working for their money.
With regard to the situation in Japan,
the relatively high figure of 60% (average pro-
portion of asset growth that is due to changes
in value over the last five years) may seem sur-
prising, but can be explained by two phenome-
na. The first is rapid stock market growth in the
initial years of “Abenomics”, while the second is
the fact that overall savings are low in Japan. The
savings rate is coming closer and closer to zero,
owing to the economic crisis and an aging popu-
lation. Almost all of the money that is still being
saved is being invested in banks.
Share of securities in asset portfolios returns to pre-crisis levels
Although private investors in industrialized
nations actually withdrew money from shares,
bonds and investment funds in net terms last
year, this class of securities achieved the strong-
est growth of all asset classes (8.7%) in 2016.
This means the rate of change compared with
2015 was around average for the years following
the crisis, but was considerably lower than the
strong stock market years of 2012, 2013 and 2014,
in which securities as an asset class grew by a
double-digit percentage.
Various functional growth drivers
Share of value change in overall asset growth, in % Average of the last five years
*ex. SwitzerlandSources: National Central Banks and Statistical Offices, Allianz SE.
20122013
20142015 2016
100
80
60
40
20
0 North America Western Europe* Eurozone Germany EU Eastern Europe Australia Japan
74%
62%
56%
27%26%
55%60%
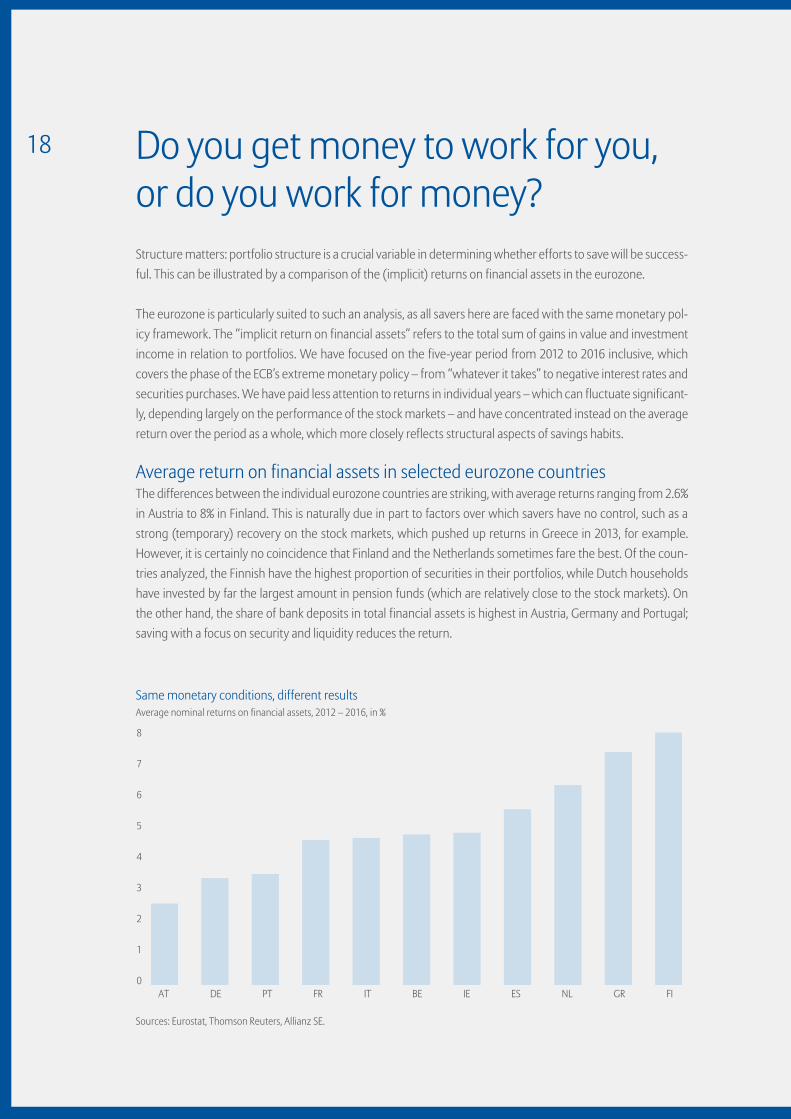
18 Do you get money to work for you, or do you work for money?Structure matters: portfolio structure is a crucial variable in determining whether efforts to save will be success-ful. This can be illustrated by a comparison of the (implicit) returns on financial assets in the eurozone.
The eurozone is particularly suited to such an analysis, as all savers here are faced with the same monetary pol-icy framework. The “implicit return on financial assets” refers to the total sum of gains in value and investment income in relation to portfolios. We have focused on the five-year period from 2012 to 2016 inclusive, which covers the phase of the ECB’s extreme monetary policy – from “whatever it takes” to negative interest rates and securities purchases. We have paid less attention to returns in individual years – which can fluctuate significant-ly, depending largely on the performance of the stock markets – and have concentrated instead on the average return over the period as a whole, which more closely reflects structural aspects of savings habits.
Average return on financial assets in selected eurozone countriesThe differences between the individual eurozone countries are striking, with average returns ranging from 2.6% in Austria to 8% in Finland. This is naturally due in part to factors over which savers have no control, such as a strong (temporary) recovery on the stock markets, which pushed up returns in Greece in 2013, for example. However, it is certainly no coincidence that Finland and the Netherlands sometimes fare the best. Of the coun-tries analyzed, the Finnish have the highest proportion of securities in their portfolios, while Dutch households have invested by far the largest amount in pension funds (which are relatively close to the stock markets). On the other hand, the share of bank deposits in total financial assets is highest in Austria, Germany and Portugal; saving with a focus on security and liquidity reduces the return.
Same monetary conditions, different resultsAverage nominal returns on financial assets, 2012 – 2016, in %
Sources: Eurostat, Thomson Reuters, Allianz SE.
8
7
6
5
4
3
2
1
0AT DE PT FR IT BE IE ES NL GR FI
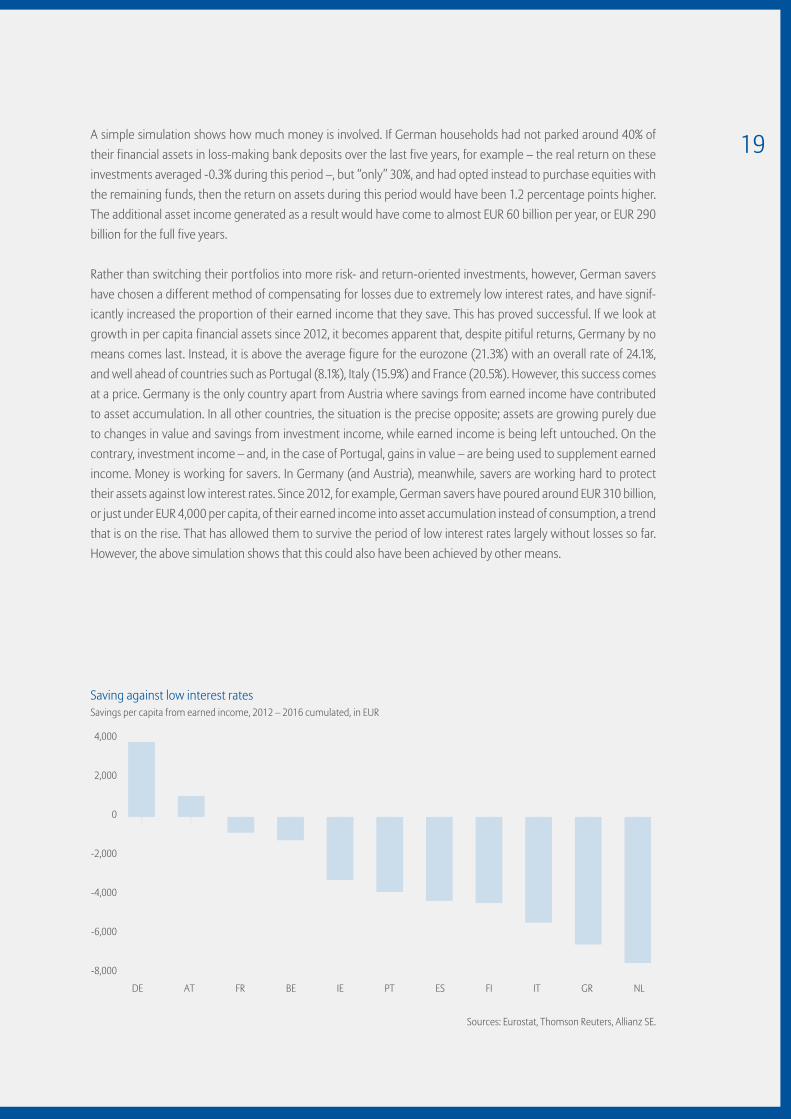
19A simple simulation shows how much money is involved. If German households had not parked around 40% of their financial assets in loss-making bank deposits over the last five years, for example – the real return on these investments averaged -0.3% during this period –, but “only” 30%, and had opted instead to purchase equities with the remaining funds, then the return on assets during this period would have been 1.2 percentage points higher. The additional asset income generated as a result would have come to almost EUR 60 billion per year, or EUR 290 billion for the full five years.
Rather than switching their portfolios into more risk- and return-oriented investments, however, German savers have chosen a different method of compensating for losses due to extremely low interest rates, and have signif-icantly increased the proportion of their earned income that they save. This has proved successful. If we look at growth in per capita financial assets since 2012, it becomes apparent that, despite pitiful returns, Germany by no means comes last. Instead, it is above the average figure for the eurozone (21.3%) with an overall rate of 24.1%, and well ahead of countries such as Portugal (8.1%), Italy (15.9%) and France (20.5%). However, this success comes at a price. Germany is the only country apart from Austria where savings from earned income have contributed to asset accumulation. In all other countries, the situation is the precise opposite; assets are growing purely due to changes in value and savings from investment income, while earned income is being left untouched. On the contrary, investment income – and, in the case of Portugal, gains in value – are being used to supplement earned income. Money is working for savers. In Germany (and Austria), meanwhile, savers are working hard to protect their assets against low interest rates. Since 2012, for example, German savers have poured around EUR 310 billion, or just under EUR 4,000 per capita, of their earned income into asset accumulation instead of consumption, a trend that is on the rise. That has allowed them to survive the period of low interest rates largely without losses so far. However, the above simulation shows that this could also have been achieved by other means.
Saving against low interest ratesSavings per capita from earned income, 2012 – 2016 cumulated, in EUR
Sources: Eurostat, Thomson Reuters, Allianz SE.
4,000
2,000
0
-2,000
-4,000
-6,000
-8,000
DE AT FR BE IE PT ES FI IT GR NL
Deve
lopm
ent i
n gl
obal
fina
ncia
l ass
ets
20Two factors are chiefly responsible for
this positive development. One is the rally on the
stock markets towards the end of the year fol-
lowing the US presidential election. Securities
holdings grew strongly as a result of this, par-
ticularly in North America (+7%). A more posi-
tive end to the year in Europe prevented securi-
ties as an asset class from suffering a loss for the
year and ultimately allowed them to break even.
Secondly, equities and other securities achieved
high growth rates in Asia (excluding Japan). Se-
curities as an asset class grew by almost 23%
in this region. However, this was driven not so
much by the performance of the stock markets
(the Shanghai stock exchange lost around 12% in
2016, for example) as by high inflows. Products
that are similar to funds remain extremely pop-
ular, particularly in China, where interest on de-
posits is strictly regulated. Securities as an asset
class also grew strongly (by almost 12%) in Latin
America, although this must be viewed in the
context of inflation of over 10%.
Securities held by private households
around the globe totaled EUR 68.7 trillion at
the end of 2016, meaning that this asset class
accounts for just under 41% of total savings and
has returned to the same level as before the cri-
sis.
Insurance policies and pensions increase in value thanks to falling interest rates
The second major asset class in the portfolio,
private household receivables from insurance
companies and pension institutions, grew by a
total of 6% at global level in the course of 2016.
Although this was the weakest growth of all as-
set classes, it was almost double the growth rate
for 2015.
All regions reported higher growth rates
last year, with the exception of Latin America
where growth nevertheless remained in double
figures owing to inflation. There was a particu-
larly noticeable jump in Western Europe, where
growth shot up from 1.8% in 2015 to 8%. However,
this was not due to a rise in inflows, which re-
mained more or less stable year-on-year, but to
changes in the value of existing portfolios, par-
ticularly bond holdings which benefited from
falling interest rates. In addition to the UK, this
particularly affected France (+13.1%) and the
Netherlands (+9.5%). France highlights how lit-
tle this growth reflects actual savings habits.
Private investors in France reduced their invest-
ment in insurance policies and pensions by al-
most 17% last year. The impending interest rate
reversal could therefore quickly wipe out last
year’s value gains. While insurance policies and
pensions enjoyed a solid year in North Ameri-
ca (+4.5%), growth was much more dynamic in
Asia (excluding Japan) and Eastern Europe, each
of which achieved growth rates of over 10%. This
asset class still plays only a subordinate role in
these two regions, however.
Allia
nz G
loba
l Wea
lth R
epor
t 201
7
21The total global portfolio of insurance
policies and pensions exceeded the EUR 50 tril-
lion mark for the first time, at EUR 50.5 trillion.
This is up 56% on the peak reached before the
financial crisis. Growth in this asset class has
nevertheless been weaker than in securities and
bank deposits over the last decade. Its share in
the overall asset portfolio has therefore declined
slightly, by half a percentage point to just under
30%.
Bank deposits: No fear of zero interest rates
The popularity of bank deposits as a “safe haven”
and a source of guaranteed liquidity remains
undiminished. Demand, term and savings de-
posits again grew strongly in 2016, by 6.3%. Not
only did this exceed average growth for the
years since the crisis, it was also a full percent-
age point above the previous year’s growth. Total
assets held in the form of bank deposits came to
EUR 45.8 trillion at the end of 2016, an increase of
70% compared with 2007. These assets account-
ed for about 27% of the overall asset portfolio,
which was still two percentage points higher
than in the pre-crisis years.
When interest rates are at zero, growth
in bank deposits usually comes from inflows
of fresh savings. Households2 increased these
savings by almost 30% last year. The amount of
money invested in banks in the eurozone soared
by more than 50%, pushing up bank deposits in
the eurozone by 4%, their highest growth since
2008. This trend can be interpreted in two ways.
On the one hand, stronger inflows of savings
reflect Europe’s economic recovery, with rising
wages and more jobs giving households greater
financial scope. At the same time, the fact that
two-thirds of savings are being put into banks
– which are not offering any interest on them
– suggests that investors remain highly mis-
trustful of the situation on Europe’s financial
markets. The European Central Bank has so far
been unable to change much about this, despite
its extremely expansive and unconventional
monetary policy. On the contrary, many people
are likely to view the fact that monetary policy
remains in crisis mode as confirmation of their
doubts.
As well as Western Europe, North Amer-
ica was another region in which growth in bank
deposits gained momentum in 2016 (to 6.6%).
This was also driven by higher inflows, which
grew by 30%. It looks as though many private
investors in the US wanted to play it safe in the
run-up to the presidential election, which would
determine the course ahead. Additional funds
2 These figures relate to house-holds in North America, Western Europe (excluding Switzerland), the eastern European EU member states, Australia and Japan.
Deve
lopm
ent i
n gl
obal
fina
ncia
l ass
ets
22paid into banks corresponded more or less ex-
actly to the reduction in the amount invested in
shares, bonds and funds. Growth in bank depos-
its also accelerated slightly in Asia (excluding
Japan), although at 9.6% it remained below the
average double-digit rates in the years following
the crisis. In contrast, growth slowed in the oth-
er two emerging regions of Latin America and
Eastern Europe – in Latin America, this was the
fifth consecutive year that this had happened.
This is likely to be due less to wider diversifica-
tion of savings across different asset classes, and
more to weaker economic growth. This applies
in particular to the situation in Latin America,
where growth in bank deposits came to around
8% but remained well below the inflation rate.
Asset growth in Asia continues unabated
Asian households had total savings of
EUR 47.6 trillion at the end of 2016. Private finan-
cial assets in the region have more than doubled
since 2006, with average annual growth of 8.0%.
Asia overtook Western Europe, which was previ-
ously the world’s second-richest region, in 2012.
If financial assets of Japanese households are ex-
cluded, which grew by an average of only 1.1% per
year in the same period and represent almost
one-third of all savings in Asia, then average an-
nual growth nearly doubles to about 15%. Asset
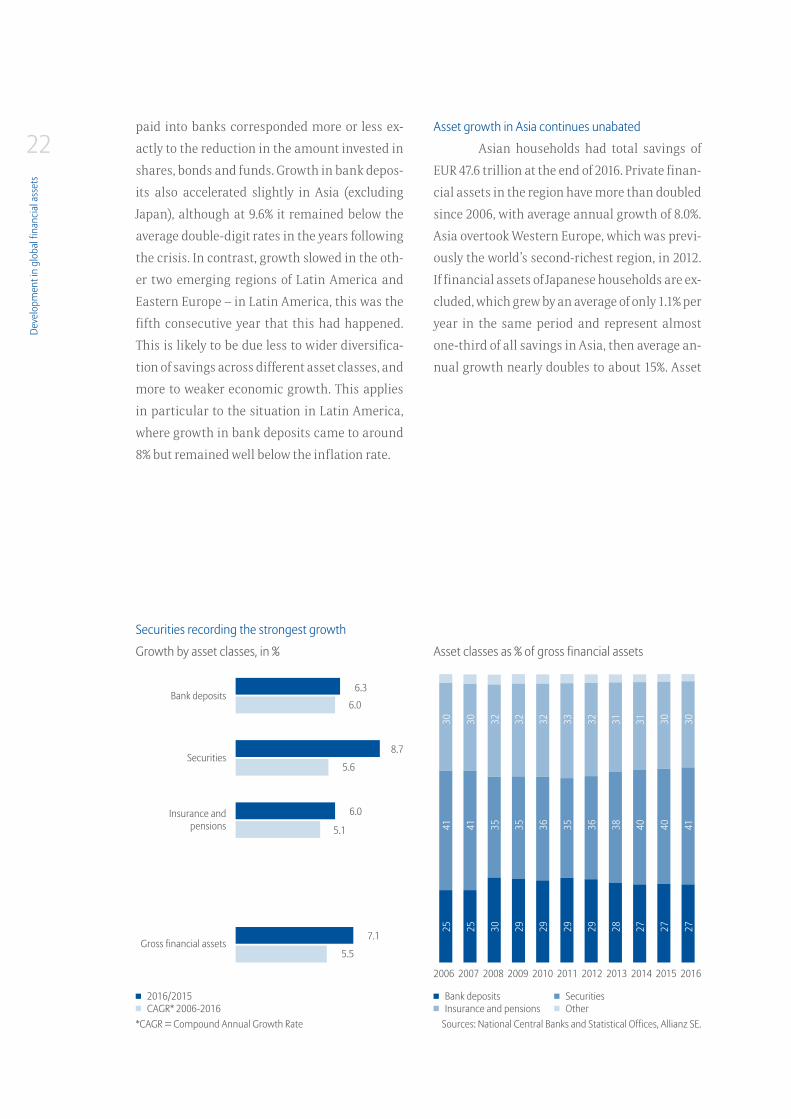
Growth by asset classes, in %
Asset classes as % of gross financial assets
Securities recording the strongest growth
Sources: National Central Banks and Statistical Offices, Allianz SE.*CAGR = Compound Annual Growth Rate
Bank deposits6.3
8.7
6.0
7.1
6.0
5.6
5.1
5.5
Securities
Insurance and pensions
Gross financial assets
2006 2007 2008 2009 2010 2011 2012 2013 2014 2015 2016
2541
30
2541
30
3035
32
2935
32
2936
32
2935
33
2936
32
2838
31
2740
31
2740
30
2741
30
Bank depositsInsurance and pensions
2016/2015CAGR* 2006-2016
SecuritiesOther
Allia
nz G
loba
l Wea
lth R
epor
t 201
7
23growth in this group of countries even accelerat-
ed by about another half a percentage point year-
on-year in 2016, to 15%. No other region grew as
rapidly as Asia (excluding Japan), either last year
or in a long-term comparison. The main driving
force behind this is the increasing importance
of China, where household financial assets have
risen at an average rate of almost 21% per year
over the last decade. The share of the world’s
second-biggest economy in financial assets in
Asia (excluding Japan) climbed by 28 percentage
points in this period to around 69%. In terms of
absolute financial assets, China overtook Japan
in 2014. At the beginning of the decade, total
savings of Chinese households came to just one
quarter of private financial assets in Japan. At
the end of last year, however, they were almost
50% higher. The share of the entire region of Asia
(excluding Japan) in global assets more than
doubled in this period to around 19%.
China’s economic rise and its insatia-
ble appetite for raw materials also contributed
indirectly to the upturn in Latin America. High
world market prices for crude oil, copper and
other raw materials led to rising export revenue
and capital inflows in the region, which is rich
in natural resources. The subcontinent’s eco-
nomic output almost trebled during the 2000s,
Latin America’s “golden decade”. Along with ris-
ing incomes, generous social welfare programs
allowed many households to build up a finan-
cial buffer. Private financial assets in the region
grew at an average annual rate of 12% between
2006 and 2016, although growth has slackened
considerably since 2011. A slowdown in growth
in China and falling prices on the commodities
markets have plunged the region into a crisis
that has left its mark on private asset accumu-
lation. While growth in household savings aver-
aged just under 15% per year in the first half of
the last decade, this dropped to just under 10%
in the second half. Moreover, most of this is be-
ing eaten up by rising inflation. Financial assets
in the region grew by almost 11% last year, but
after deduction of the average inflation rate of
about 10%, households were left with very little
growth. Despite the slowdown in the last few
years, household assets in Latin America have
more than trebled since 2006 and totaled nearly
EUR 3.5 trillion at the end of 2016. The region’s
share of global gross financial assets increased
from 1.1% to 2.1% during this period.
Deve
lopm
ent i
n gl
obal
fina
ncia
l ass
ets
24Asset growth noticeably slackened in
Eastern Europe as well. Although household
savings grew slightly faster than the global av-
erage last year, at 7.9%, the rate of growth has
slowed continuously over the last three years.
That means asset growth slowed to an average
annual rate of 10.4% in the second half of the
last decade, compared with average growth of
13.7% per year in savings between 2006 and 2010.
This trend was much more noticeable in the
countries outside the European Union than it
was in the EU member states of Eastern Europe,
which is hardly surprising given that the Rus-
sia-Ukraine conflict was still smoldering and
that the Russian economy is heavily dependent
on oil prices.
In the wealthier parts of the world,
where households already have substantial as-
sets, private savings naturally grew more slowly
than in emerging countries. A classic exam-
ple of this is Japan, which is one of the world’s
10 richest countries in per capita terms, with
gross financial assets of EUR 118,950. However,
private assets have grown at an average rate of
just 1.1% per year since 2006, much more slowly
even than in Western Europe or North America
(+3.4% and +4.8% respectively in the same peri-
od). This meager growth is principally a result
of very conservative, liquidity-oriented invest-
ment behavior. The Japanese have traditionally
held more than half of their financial assets in
the form of bank deposits, which are generating
barely any income for savers owing to decades of
low interest rates. For many years, it was also vir-
tually impossible to achieve any value gains on
the domestic stock market. At some points dur-
ing the 2000s, the Nikkei fell back to the same
levels it was at in the early 1980s. The situation
*CAGR = Compound Annual Growth RateSources: National Central Banks and Statistical Offices, Allianz SE.
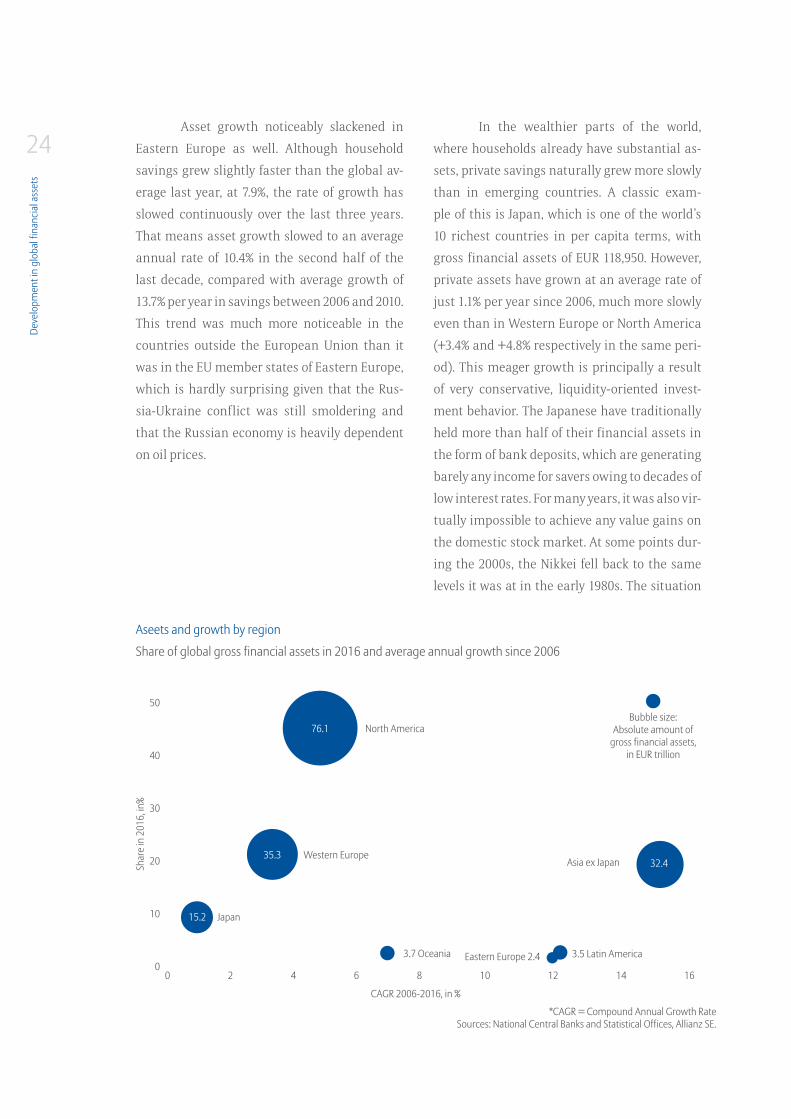
Share of global gross financial assets in 2016 and average annual growth since 2006
Aseets and growth by region
76.1
35.332.4
15.2
Asia ex JapanWestern Europe
North America
3.7 Oceania 3.5 Latin America
Bubble size:Absolute amount of
gross financial assets,in EUR trillion
Eastern Europe 2.4
Japan
50
40
30
20
10
0
Shar
e in
201
6, in
%
CAGR 2006-2016, in %
0 2 4 6 8 10 12 14 16
Allia
nz G
loba
l Wea
lth R
epor
t 201
7
25did not start to change until 2013, with the be-
ginning of “Abenomics”. While Japan’s leading
index was still down by almost one-third on its
2007 level at the end of 2012, it had exceeded this
level by more than 24% three years later. Private
household assets held in the form of equities
and fixed-income securities shot up by almost
40% to nearly EUR 2.7 trillion in this period alone.
However, this asset class accounts for only 18% of
the portfolio and therefore plays a relatively mi-
nor role, so the overall effect remained a modest
one. The Nikkei more or less stagnated in 2016
(+0.4%), although securities holdings grew by
2.4%. Growth in total financial assets in Japan
came to 1.8% last year, marginally higher than
the previous year’s growth (+1.7%). Japanese sav-
ings totaled EUR 15.2 trillion at the end of 2016.
The country’s share of global financial assets
has fallen from 13.4% to 9.0% in the course of the
last decade.
The financial assets of households in
Western Europe grew more than twice as fast
as those in Japan last year, with the growth rate
increasing by two percentage points year-on-
year to 4.7%. This was more dynamic growth
than the long-term average (+3.4% a year). The
weak performance of securities as an asset class
(+0.6%) was more than offset by strong gains
in the value of assets held in the form of insur-
ance policies and pensions, and by stable, high
inflows of funds. The preference for investments
that can be liquidated quickly is less obvious in
Western Europe than in Japan. However, more
savings were held in savings accounts (30.0% of
the portfolio) at the end of 2016 than the average
for industrialized countries (23.9%). Riskier in-
vestments such as equities and other securities
made up 26.5% of the portfolio. Insurance poli-
cies and pensions remained the most popular
savings products, accounting for 40.9% of the
portfolio in total. All in all, savings of western
European households came to EUR 35.3 trillion,
or just under 21% of global assets.
Households in North America have more
of a risk appetite in their investment strategy.
Securities accounted for more than half (51.4%)
of the asset portfolio there at the end of last year.
By contrast, bank deposits, which are so popu-
lar in Japan and Western Europe, made up only
14.0%. North American households saved almost
32% of their financial assets in the form of insur-
ance policies and pensions, although these are
often linked to the performance of the capital
markets, particularly in the US. In a long-term
analysis, this savings behavior has paid off. Av-
erage annual growth since 2006 has been 4.8%
in North America, above both the western Euro-
pean average (+3.4%) and the Japanese average
(+1.1%). Last year’s performance was above-av-
erage owing to the “Trump effect” on the stock
markets, with the total volume of assets growing
strongly by 6.0% to EUR 76.1 trillion. With a share
of around 45% in global financial assets, North
America is the richest region on the planet.
However, Oceania recorded by far the
strongest asset growth among the world’s
wealthier regions in 2016. Household savings
in Australia and New Zealand grew by a total of
7.6% – 2.3 percentage points more than the aver-
age for advanced economies. This good perfor-
mance was particularly due to strong growth in
assets held in the form of insurance policies and
Deve
lopm
ent i
n gl
obal
fina
ncia
l ass
ets
26pensions (+10.2%) and in bank deposits (+7.3%).
This positive asset development down under also
stands out in a long-term comparison. Not least
thanks to the past commodities boom, average
annual growth over the last decade was also
relatively high, at 6.9%. By way of comparison,
the average figure for industrialized countries
was “only” 4.1%. Total private savings in Oceania
have more than doubled since 2006, coming in
at EUR 3.7 trillion at the end of 2016. Households
invest just over half of their assets in insurance
policies and pensions. Bank deposits and secu-
rities are roughly neck-and-neck, accounting for
22.1% and 24.5% of the portfolio respectively.
Poorer regions are catching up
Although asset growth in emerging markets has
been more than four times as high on average
as in industrialized countries over the last dec-
ade, the weightings on the world wealth map are
shifting only slowly. The share of North America
and Western Europe in global gross financial as-
sets has declined by almost 9 percentage points
since the end of 2006. However, the two regions
together still held two-thirds of the world’s as-
sets at the end of last year. With a “global share”
of around 45%, North America was the richest
region on the planet. In Asia-Pacific, Japan ac-
counted for a further 9.0% of assets and Australia
and New Zealand for 2.2%. That means that over
three-quarters of global financial assets were
still in the hands of private households in the
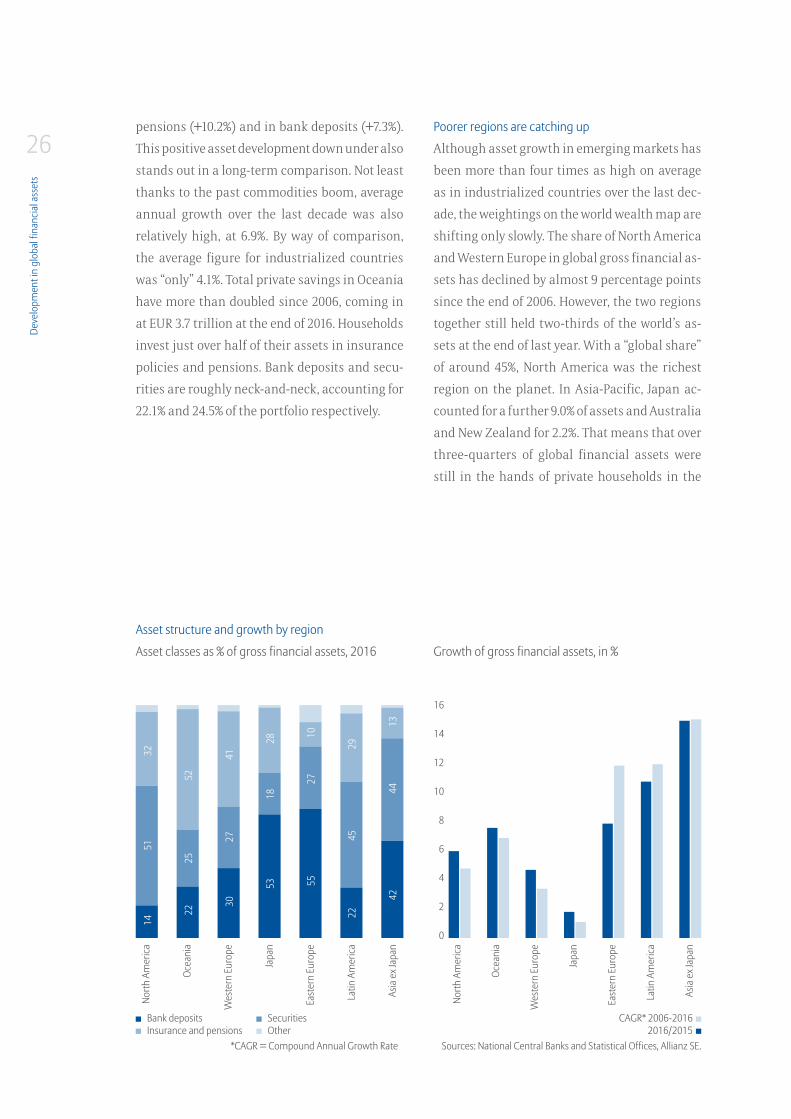
Asset classes as % of gross financial assets, 2016 Growth of gross financial assets, in %
Asset structure and growth by region
16
14
12
10
8
6
4
2
0
*CAGR = Compound Annual Growth Rate Sources: National Central Banks and Statistical Offices, Allianz SE.
1451
32
2225
30
53
52
55
27
18
41
22
28
2710
4529
4244
13
Bank depositsInsurance and pensions
SecuritiesOther
CAGR* 2006-20162016/2015
North
Am
erica
Ocea
nia
Wes
tern
Eur
ope
Japa
n
East
ern
Euro
pe
Latin
Am
erica
Asia
ex J
apan
North
Am
erica
Ocea
nia
Wes
tern
Eur
ope
Japa
n
East
ern
Euro
pe
Latin
Am
erica
Asia
ex J
apan
Allia
nz G
loba
l Wea
lth R
epor
t 201
7
27world’s richer areas, even though these house-
holds make up less than one-fifth (just under
19%) of the earth’s population. The remainder of
the world’s financial assets (just under 23%) are
distributed among Latin America (2.1%), Eastern
Europe (1.4%) and other Asian countries (19.2%),
i.e. among a total of about 4 billion people. Their
share of global financial assets rose by 1.4 per-
centage points last year alone and has more
than doubled over the last decade.
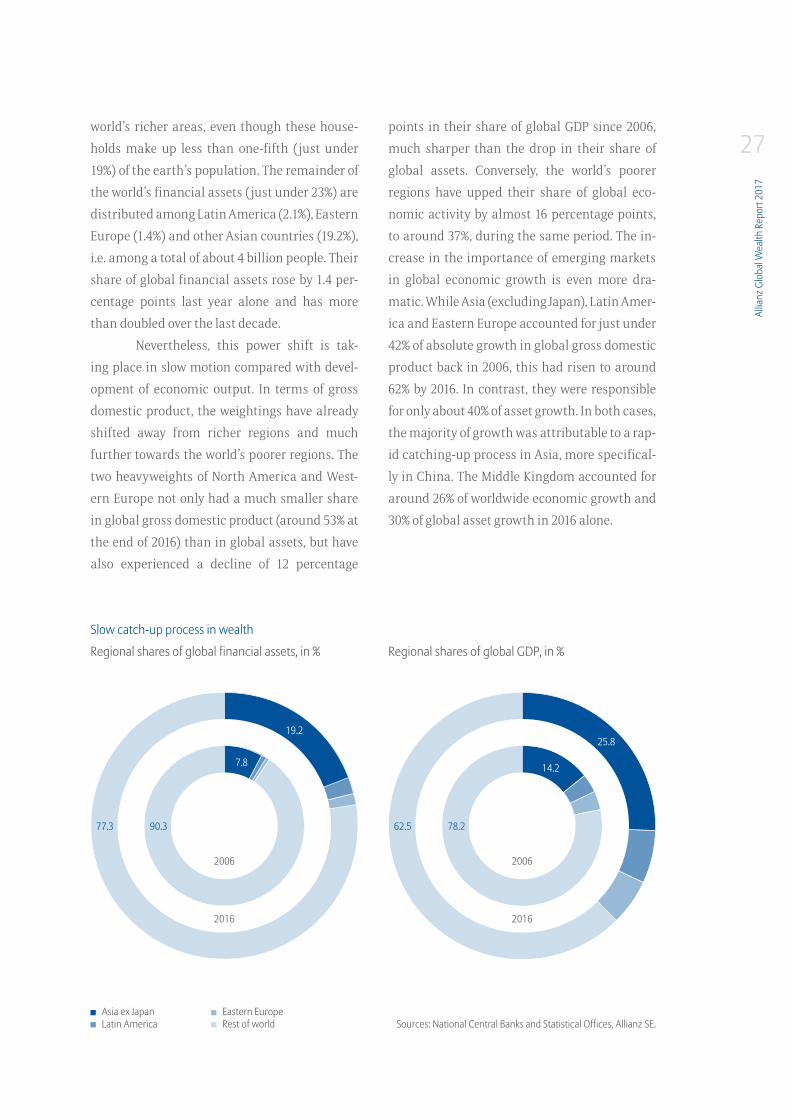
Nevertheless, this power shift is tak-
ing place in slow motion compared with devel-
opment of economic output. In terms of gross
domestic product, the weightings have already
shifted away from richer regions and much
further towards the world’s poorer regions. The
two heavyweights of North America and West-
ern Europe not only had a much smaller share
in global gross domestic product (around 53% at
the end of 2016) than in global assets, but have
also experienced a decline of 12 percentage
points in their share of global GDP since 2006,
much sharper than the drop in their share of
global assets. Conversely, the world’s poorer
regions have upped their share of global eco-
nomic activity by almost 16 percentage points,
to around 37%, during the same period. The in-
crease in the importance of emerging markets
in global economic growth is even more dra-
matic. While Asia (excluding Japan), Latin Amer-
ica and Eastern Europe accounted for just under
42% of absolute growth in global gross domestic
product back in 2006, this had risen to around
62% by 2016. In contrast, they were responsible
for only about 40% of asset growth. In both cases,
the majority of growth was attributable to a rap-
id catching-up process in Asia, more specifical-
ly in China. The Middle Kingdom accounted for
around 26% of worldwide economic growth and
30% of global asset growth in 2016 alone.
Regional shares of global financial assets, in % Regional shares of global GDP, in %
Slow catch-up process in wealth
Sources: National Central Banks and Statistical Offices, Allianz SE.Asia ex JapanLatin America
Eastern EuropeRest of world
77.3 62.5
19.225.8
7.8 14.2
90.3 78.2
2006 2006
2016 2016
Deve
lopm
ent i
n gl
obal
fina
ncia
l ass
ets
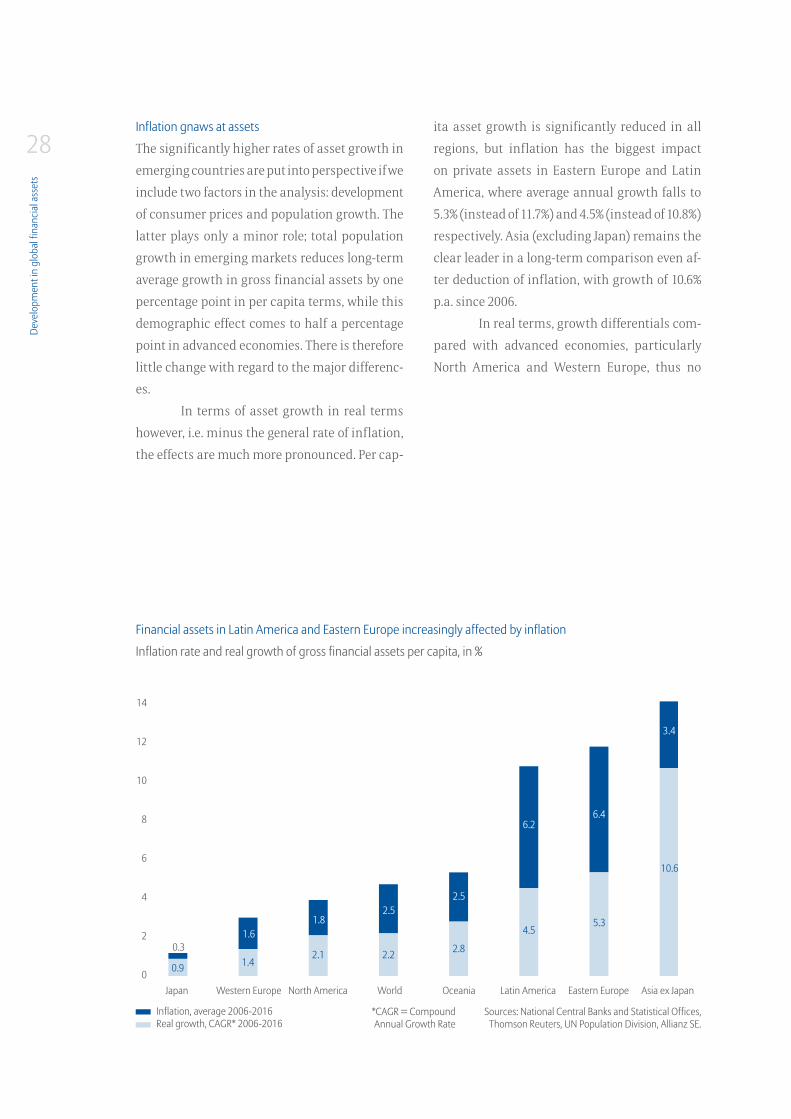
28Inflation gnaws at assets
The significantly higher rates of asset growth in
emerging countries are put into perspective if we
include two factors in the analysis: development
of consumer prices and population growth. The
latter plays only a minor role; total population
growth in emerging markets reduces long-term
average growth in gross financial assets by one
percentage point in per capita terms, while this
demographic effect comes to half a percentage
point in advanced economies. There is therefore
little change with regard to the major differenc-
es.
In terms of asset growth in real terms
however, i.e. minus the general rate of inflation,
the effects are much more pronounced. Per cap-
ita asset growth is significantly reduced in all
regions, but inflation has the biggest impact
on private assets in Eastern Europe and Latin
America, where average annual growth falls to
5.3% (instead of 11.7%) and 4.5% (instead of 10.8%)
respectively. Asia (excluding Japan) remains the
clear leader in a long-term comparison even af-
ter deduction of inflation, with growth of 10.6%
p.a. since 2006.
In real terms, growth differentials com-
pared with advanced economies, particularly
North America and Western Europe, thus no
Inflation rate and real growth of gross financial assets per capita, in %
Financial assets in Latin America and Eastern Europe increasingly affected by inflation
*CAGR = Compound Annual Growth Rate
Sources: National Central Banks and Statistical Offices, Thomson Reuters, UN Population Division, Allianz SE.
Inflation, average 2006-2016 Real growth, CAGR* 2006-2016
14
12
10
8
6
4
2
0 Japan Western Europe North America World Oceania Latin America Eastern Europe Asia ex Japan
0.9 1.42.1 2.2 2.8
4.55.3
10.6
0.31.6
1.82.5
2.5
6.26.4
3.4
Allia
nz G
loba
l Wea
lth R
epor
t 201
7
29longer appear quite so pronounced, even if in-
flation is naturally also curbing asset accumu-
lation in these regions. North America is now
clocking up growth of 2.1% a year (real gross per
capita financial assets since 2006), compared
with only 1.4% in Western Europe, which is thus
just ahead of Japan (0.9%) after adjustments
for inflation. In a long-term analysis the wedge
that inflation drives between nominal and real
value growth is much smaller than if we only
look at developments last year. Savers in North
America, Western Europe and Japan benefited
from the fact that prices hardly increased at all,
meaning that their assets barely lost purchasing
power in net terms. This highlights once again
that central banks’ persistent fight for higher
inflation rates is not necessarily in the best in-
terests of savers.


Development in global liabilities
A return to debt growth
Deve
lopm
ent i
n gl
obal
liab
ilitie
s
3220
06
2007
2008
2009
2010
2011
2012
2013
2014
2015
2016
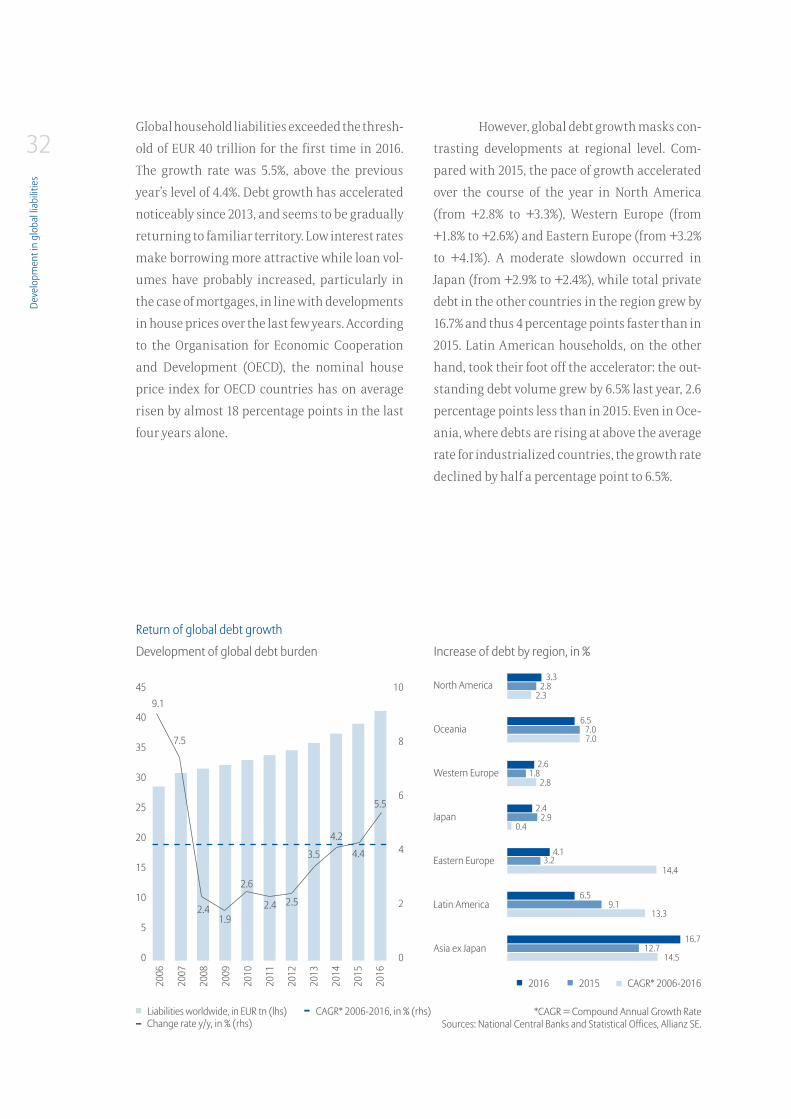
Global household liabilities exceeded the thresh-
old of EUR 40 trillion for the first time in 2016.
The growth rate was 5.5%, above the previous
year’s level of 4.4%. Debt growth has accelerated
noticeably since 2013, and seems to be gradually
returning to familiar territory. Low interest rates
make borrowing more attractive while loan vol-
umes have probably increased, particularly in
the case of mortgages, in line with developments
in house prices over the last few years. According
to the Organisation for Economic Cooperation
and Development (OECD), the nominal house
price index for OECD countries has on average
risen by almost 18 percentage points in the last
four years alone.
However, global debt growth masks con-
trasting developments at regional level. Com-
pared with 2015, the pace of growth accelerated
over the course of the year in North America
(from +2.8% to +3.3%), Western Europe (from
+1.8% to +2.6%) and Eastern Europe (from +3.2%
to +4.1%). A moderate slowdown occurred in
Japan (from +2.9% to +2.4%), while total private
debt in the other countries in the region grew by
16.7% and thus 4 percentage points faster than in
2015. Latin American households, on the other
hand, took their foot off the accelerator: the out-
standing debt volume grew by 6.5% last year, 2.6
percentage points less than in 2015. Even in Oce-
ania, where debts are rising at above the average
rate for industrialized countries, the growth rate
declined by half a percentage point to 6.5%.
Development of global debt burden
Return of global debt growth
*CAGR = Compound Annual Growth RateSources: National Central Banks and Statistical Offices, Allianz SE.
45
40
35
30
25
20
15
10
5
0
10
8
6
4
2
0
Change rate y/y, in % (rhs)Liabilities worldwide, in EUR tn (lhs) CAGR* 2006-2016, in % (rhs)
CAGR* 2006-201620152016
Increase of debt by region, in %
North America
Oceania
Western Europe
Japan
Eastern Europe
Latin America
Asia ex Japan
9.1
7.5
2.41.9
2.6
2.4 2.5
3.5
4.2
4.4
5.5
3.3
6.5
2.6
2.4
4.1
6.5
16.7
2.8
7.0
1.8
2.9
3.2
9.1
12.7
2.3
7.0
2.8
0.4
14.4
13.3
14.5
Allia
nz G
loba
l Wea
lth R
epor
t 201
7
33Based on the long-term average, East-
ern Europe and Asia (excluding Japan) come
joint first in terms of debt growth, averaging
around 14% annually between 2006 and 2016.
That means household liabilities in these re-
gions have more than quadrupled over the last
decade. In Eastern Europe in particular, which is
heavily dependent on the economic situation in
the eurozone, the outbreak of the financial cri-
sis forced households to drastically reduce their
borrowing. Annual growth rates of over 30% had
been the norm in the years prior to the crisis.
Within Eastern Europe, however, a long-
term comparison between EU member states
and countries outside the European Union re-
veals significant differences in growth. While
debts grew at an average rate of about 10% in
EU member states between 2006 and 2016, lia-
bilities in the other countries in the region rose
by an average of around 22% per year. Neverthe-
less, it is important to put the rapid growth in
Kazakhstan, Russia, Serbia, Turkey and Ukraine
into perspective by bearing in mind that house-
holds there started from a very low level. Average
per capita debt in these countries was just EUR
250 in 2006; in the EU member states at that time
it was already almost seven times as high.
In the last few years, however, the two
have moved closer together, both in terms of
growth and in absolute terms. This reflects
firstly the eurozone recovery, and secondly the
Russia/Ukraine conflict and slow growth in the
Russian economy, which depends heavily on oil
prices. Eastern European household debt actual-
ly grew at the same pace inside and outside the
EU last year (around 4%). Despite this, per cap-
ita debt in the EU member states averaged EUR
3,730 at the end of 2016, “only” just under three
times as high as in the rest of the region.
Asia (excluding Japan), which was barely
affected by the financial crisis, experienced only
a marginal slowdown in the second half of the
last decade. Although outstanding debt volumes
rose at an average rate of more than 15% per year
from 2006 to 2010, average annual growth since
then has been just under 14%. Average per capita
debt was EUR 2,350, slightly higher than in East-
ern Europe (EUR 1,910). In Latin America, where
liabilities have risen by an average of about 13%
per year since 2006, a noticeable slowdown in
the growth rate has occurred only in the last
three years. Since 2014, private debt has been ris-
ing at a single-digit percentage rate – and thus
more slowly than inflation. The economic crisis
is forcing households to reduce their consump-
tion and therefore to cut back on borrowing as
well.
In North America, Western Europe and
Japan, where debt levels are of course much
higher than in emerging regions, the long-term
average growth rate has been a low single-digit
percentage. Japan came bottom of the league,
with private debt having risen by an average
annual rate of just 0.4% since 2006. Households
there actually reduced their liabilities in the
years preceding the crisis, unlike in North Amer-
ica and Western Europe. However, the rate of
growth in private debt in Japan has again risen
in the last few years. A huge increase in the Japa-
nese central bank’s already extremely expansive
monetary policy appears to be bearing fruit by
Deve
lopm
ent i
n gl
obal
liab
ilitie
s
34boosting private household borrowing. Further-
more, property market trends have reversed in
the last few years, with house prices rising again
for the first time since the early 1990s. Accord-
ing to the OECD, the nominal house price index
climbed by 8 percentage points between 2013
and 2016, having previously slumped by more
than 80%.
North American household liabilities
grew at an average rate of 2.3% per year in the pe-
riod from 2006 to 2016, slightly more slowly than
in Western Europe (average growth of +2.8% per
year). This is due in particular to developments
between 2008 and 2011, when the subprime cri-
sis forced US citizens to restructure their asset
balance sheets. Private debt in the US fell by
about 5% or around EUR 690 billion during these
four years, partly owing to payment defaults.
The trend changed in 2012 and debt growth
has since risen continuously, reaching 3.2% last
year. This was primarily due to student and car
loans, each of which have since grown at a rate
of around 8% per year, reaching a total volume of
EUR 2.4 trillion, or just under 17% of the total vol-
ume of loans, at the end of 2016. Before the prop-
erty bubble burst, their share of the total was
just under 10%. On one hand, low interest rates
are stimulating demand for credit; on the other,
lending conditions – particularly for car loans
– have been relaxed again, meaning that loans
are increasingly being granted to lower-income
households. If interest rates were to rise again,
financially weak households in particular could
find it difficult to repay their debts. Total pri-
vate debt in the US reached a new record level of
around EUR 14.3 trillion. Per capita debt in North
America was EUR 44,120 at the end of 2016.
A phase of more modest credit demand
also began in Western Europe with the outbreak
of the financial crisis. Households in the euro cri-
sis countries in particular have since made sig-
nificant progress in reducing their debts. Since
the end of 2008, private liabilities in Greece,
Ireland, Portugal and Spain have contracted by
a total of EUR 283 billion, or an average rate of
2.6% per year. In the other countries in the re-
gion, however, debts rose by an average of 2.2%
per year in the same period. After debts stag-
nated in Western Europe in 2012 and 2013, they
are starting to increase again slightly, albeit at a
low rate. Per capita debt averaged EUR 25,960 at
the end of 2016, although it varied enormously,
ranging from EUR 10,220 in Greece to EUR 93,120
in Switzerland.
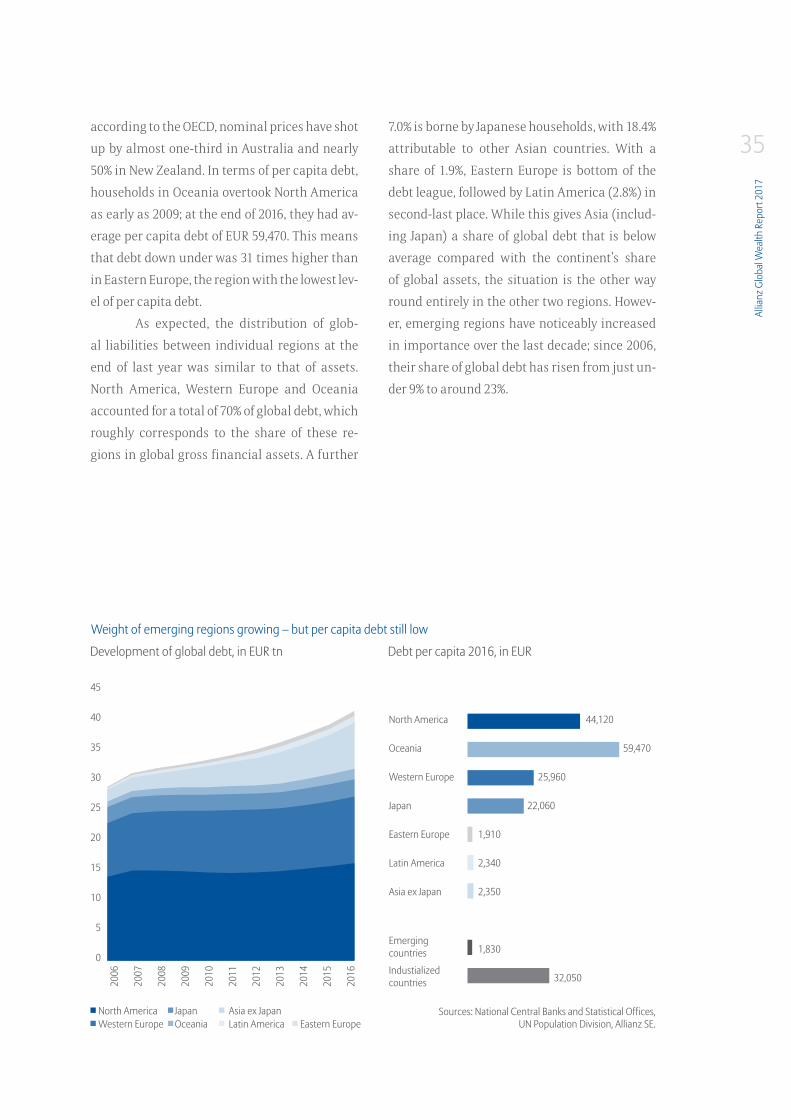
Private liabilities “down under” grew at
around three times the rate of those in Western
Europe, reaching an average annual growth rate
of 7.0% over the last decade. Although the pace
of growth slowed by half a percentage point last
year, it was still almost twice as high as in North
America. House prices in Australia and New Zea-
land have, with only brief interruptions, soared
since the early 2000s. In the last four years alone,
Allia
nz G
loba
l Wea
lth R
epor
t 201
7
35according to the OECD, nominal prices have shot
up by almost one-third in Australia and nearly
50% in New Zealand. In terms of per capita debt,
households in Oceania overtook North America
as early as 2009; at the end of 2016, they had av-
erage per capita debt of EUR 59,470. This means
that debt down under was 31 times higher than
in Eastern Europe, the region with the lowest lev-
el of per capita debt.
As expected, the distribution of glob-
al liabilities between individual regions at the
end of last year was similar to that of assets.
North America, Western Europe and Oceania
accounted for a total of 70% of global debt, which
roughly corresponds to the share of these re-
gions in global gross financial assets. A further
7.0% is borne by Japanese households, with 18.4%
attributable to other Asian countries. With a
share of 1.9%, Eastern Europe is bottom of the
debt league, followed by Latin America (2.8%) in
second-last place. While this gives Asia (includ-
ing Japan) a share of global debt that is below
average compared with the continent’s share
of global assets, the situation is the other way
round entirely in the other two regions. Howev-
er, emerging regions have noticeably increased
in importance over the last decade; since 2006,
their share of global debt has risen from just un-
der 9% to around 23%.
Weight of emerging regions growing – but per capita debt still low
Development of global debt, in EUR tn Debt per capita 2016, in EUR
Sources: National Central Banks and Statistical Offices, UN Population Division, Allianz SE.
North America
Oceania
Western Europe
Japan
Eastern Europe
Latin America
Asia ex Japan
Emerging countries
Industialized countries
44,120
59,470
25,960
22,060
1,910
2,340
2,350
1,830
32,0502006
2007
2008
2009
2010
2011
2012
2013
2014
2015
2016
45
40
35
30
25
20
15
10
5
0
Western Europe Latin America Eastern EuropeOceaniaNorth America Asia ex JapanJapan
Deve
lopm
ent i
n gl
obal
liab
ilitie
s
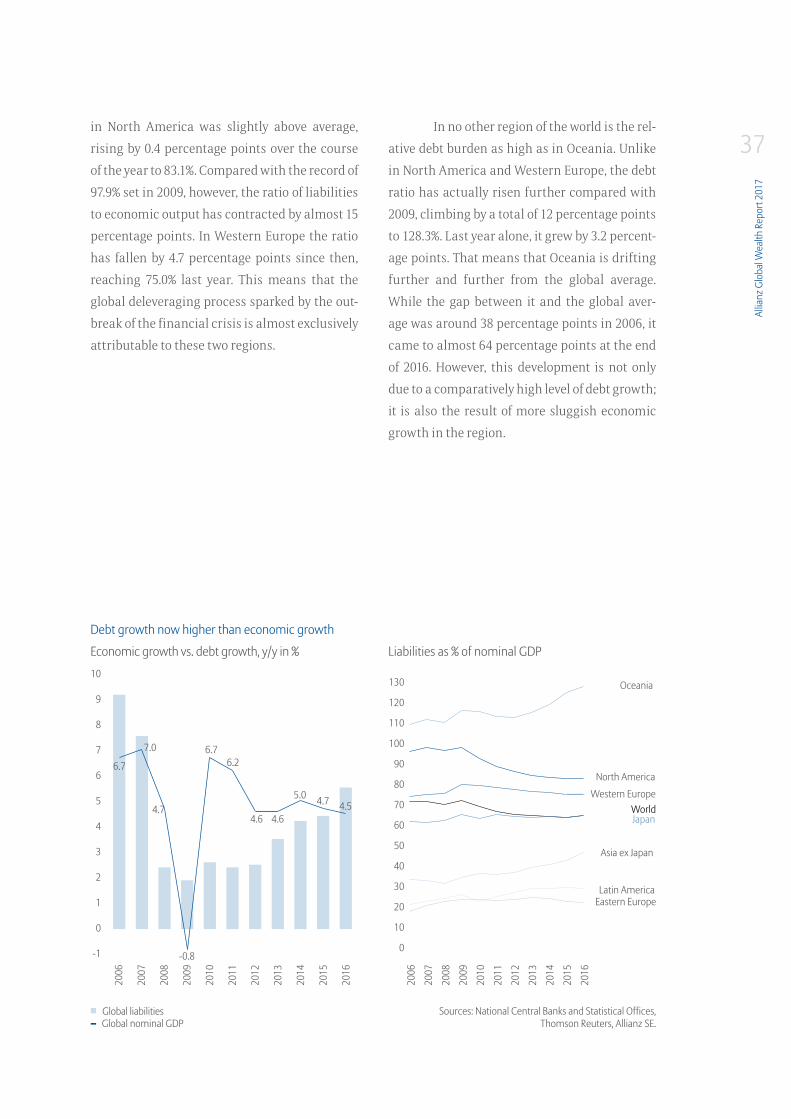
36Global deleveraging comes to an end
In 2016, global debt grew faster than nominal
economic output (+4.5%) for the first time since
2009. The global debt ratio, i.e. liabilities meas-
ured as a percentage of GDP, thus increased
from 63.9% in the previous year to 64.6%. This ra-
tio has fallen by more than 7 percentage points
since reaching a historic high in 2009. However,
economic growth’s lead over debt growth was
already shrinking in the years leading up to
2016. The global deleveraging process has come
to an end.
Despite rapid credit growth in the past,
the ratio of liabilities to general economic activ-
ity is lower in Eastern Europe than in any other
region. After debt growth slowed considerably
in the last few years, falling well below the pace
of economic growth, the ratio dropped to 22.1%
last year, compared with 22.6% in the previous
year. The ratio in the region’s EU member states,
which was just under 33% on average, was un-
surprisingly much higher than in the rest of
the region (almost 17%), although all countries
were still below the 50% mark. The ratio in Latin
America was almost 7 percentage points higher
than in Eastern Europe at just under 29%, with
liabilities growing at a noticeably faster rate
(around 13% a year on average) than economic
output (almost 10% a year on average) in the pe-
riod from 2006 to 2016. Nevertheless, no country
has overshot the 50% mark to date in this region
either. There is more cause for concern when it
comes to Asia (excluding Japan). Of all emerging
markets, this region has the highest debt ratio,
which climbed by another 3.6 percentage points
to around 46% in 2016. The ratio of liabilities to
GDP is already dangerously high in some Asian
countries. At the end of 2016, the ratios in Thai-
land (80.4%), Malaysia (88.5%) and South Korea
(95.8%) were at a similar level to those reached in
Spain (86.6%), Ireland (100.7%) and the US (99.7%)
at the end of 2007, shortly before the credit bub-
ble burst. Although the ratio in China is still be-
low the 50% mark, at 45.1%, it has almost trebled
in the last decade.
The ratio for Japanese households was
64.6% at the end of 2016, up by 0.7 percentage
points year-on-year and well below the average
for advanced economies (79.6%). The debt ratio
Allia
nz G
loba
l Wea
lth R
epor
t 201
7
37in North America was slightly above average,
rising by 0.4 percentage points over the course
of the year to 83.1%. Compared with the record of
97.9% set in 2009, however, the ratio of liabilities
to economic output has contracted by almost 15
percentage points. In Western Europe the ratio
has fallen by 4.7 percentage points since then,
reaching 75.0% last year. This means that the
global deleveraging process sparked by the out-
break of the financial crisis is almost exclusively
attributable to these two regions.
In no other region of the world is the rel-
ative debt burden as high as in Oceania. Unlike
in North America and Western Europe, the debt
ratio has actually risen further compared with
2009, climbing by a total of 12 percentage points
to 128.3%. Last year alone, it grew by 3.2 percent-
age points. That means that Oceania is drifting
further and further from the global average.
While the gap between it and the global aver-
age was around 38 percentage points in 2006, it
came to almost 64 percentage points at the end
of 2016. However, this development is not only
due to a comparatively high level of debt growth;
it is also the result of more sluggish economic
growth in the region.
Economic growth vs. debt growth, y/y in % Liabilities as % of nominal GDP
Debt growth now higher than economic growth
Sources: National Central Banks and Statistical Offices, Thomson Reuters, Allianz SE.
130
120
110
100
90
80
70
60
50
40
30
20
10
0
North America
Oceania
WorldWestern Europe
Eastern EuropeLatin America
Asia ex Japan
Japan
2006
2007
2008
2009
2010
2011
2012
2013
2014
2015
2016
10
9
8
7
6
5
4
3
2
1
0
-1
Global nominal GDPGlobal liabilities
6.7
7.0
4.7
6.76.2
4.6 4.6
5.0 4.7 4.5
-0.8
2006
2007
2008
2009
2010
2011
2012
2013
2014
2015
2016
Deve
lopm
ent i
n gl
obal
liab
ilitie
s
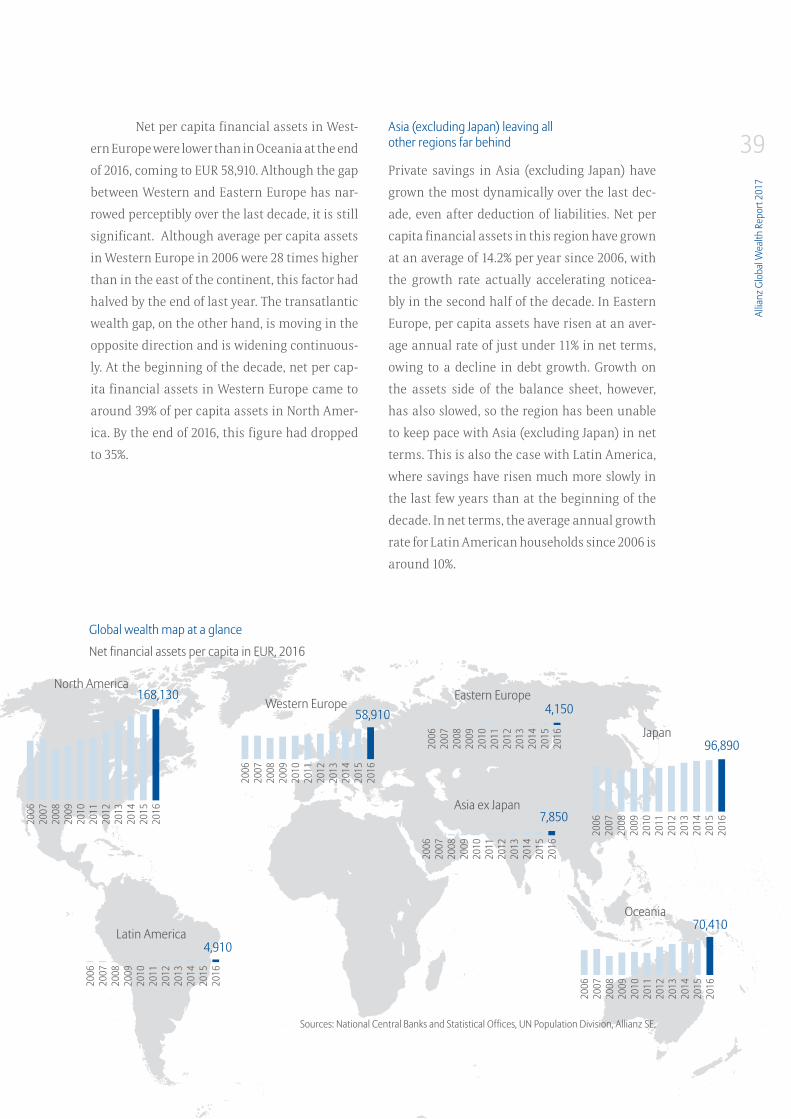
38A large wealth gap between the regions
If we subtract debt from gross financial assets,
we are left with net financial assets, which
reached a new global record high of EUR 128.5
trillion at the close of 2016. Since growth in total
savings was 7.1% last year, 1.6 percentage points
above the rate of debt growth, the growth rate in
net terms was 7.6% – slightly below average for
the years since the crisis.
A look at the world wealth map tells a
predictable story. Discrepancies between house-
hold assets in the world’s richer regions and
those in poorer regions remain huge. The wealth
gap becomes particularly clear if we compare
North America and Eastern Europe. North
America remains the richest region in the world,
with average per capita assets of EUR 168,130 last
year. By contrast, Eastern Europe was the region
with the lowest net financial assets. At the end
of 2016, after deductions for liabilities, house-
holds had an average of EUR 4,150 per capita.
This means that North Americans had 41 times
the assets of eastern Europeans. Nevertheless,
this factor was as high as 71 back in 2006, so the
trend is, at least, moving in the “right” direction.
On the other side of the globe, in
Asia-Pacific, Japanese households led the field
with average per capita assets of EUR 96,890.
However, their lead over Taiwan (EUR 92,360)
and Singapore (EUR 89,570) is now very narrow;
Taiwan, at least, could overtake Japan as early as
next year. At the beginning of the decade, net per
capita financial assets in Japan were still more
than 60% higher than in these two countries. In
Asia (excluding Japan) as a whole, per capita fi-
nancial assets averaged EUR 7,850 – largely due
to the fact that assets in India and Indonesia
are still very low. The level of assets in Oceania
was significantly lower than in Japan. Due to
high debt levels, average net financial assets of
households in Australia and New Zealand came
to EUR 70,410 per capita, well below the average
for Japan. Leaving liabilities out of the equation,
households in Oceania had average gross finan-
cial assets of EUR 129,880 per capita, putting
them ahead of their Japanese counterparts (EUR
118,950).
Allia
nz G
loba
l Wea
lth R
epor
t 201
7
39Net per capita financial assets in West-
ern Europe were lower than in Oceania at the end
of 2016, coming to EUR 58,910. Although the gap
between Western and Eastern Europe has nar-
rowed perceptibly over the last decade, it is still
significant. Although average per capita assets
in Western Europe in 2006 were 28 times higher
than in the east of the continent, this factor had
halved by the end of last year. The transatlantic
wealth gap, on the other hand, is moving in the
opposite direction and is widening continuous-
ly. At the beginning of the decade, net per cap-
ita financial assets in Western Europe came to
around 39% of per capita assets in North Amer-
ica. By the end of 2016, this figure had dropped
to 35%.
Asia (excluding Japan) leaving all other regions far behind
Private savings in Asia (excluding Japan) have
grown the most dynamically over the last dec-
ade, even after deduction of liabilities. Net per
capita financial assets in this region have grown
at an average of 14.2% per year since 2006, with
the growth rate actually accelerating noticea-
bly in the second half of the decade. In Eastern
Europe, per capita assets have risen at an aver-
age annual rate of just under 11% in net terms,
owing to a decline in debt growth. Growth on
the assets side of the balance sheet, however,
has also slowed, so the region has been unable
to keep pace with Asia (excluding Japan) in net
terms. This is also the case with Latin America,
where savings have risen much more slowly in
the last few years than at the beginning of the
decade. In net terms, the average annual growth
rate for Latin American households since 2006 is
around 10%.
Net financial assets per capita in EUR, 2016
Global wealth map at a glance
Sources: National Central Banks and Statistical Offices, UN Population Division, Allianz SE.
168,130
4,910
North America
Latin America
2006
2007
2008
2009
2010
2011
2012
2013
2014
2015
2016
2006
2007
2008
2009
2010
2011
2012
2013
2014
2015
2016
2006
2007
2008
2009
2010
2011
2012
2013
2014
2015
2016
2006
2007
2008
2009
2010
2011
2012
2013
2014
2015
2016
58,910 4,150Western EuropeEastern Europe
2006
2007
2008
2009
2010
2011
2012
2013
2014
2015
2016
2006
2007
2008
2009
2010
2011
2012
2013
2014
2015
2016
70,410
96,890
Oceania
Japan
7,850Asia ex Japan
2006
2007
2008
2009
2010
2011
2012
2013
2014
2015
2016
Deve
lopm
ent i
n gl
obal
liab
ilitie
s
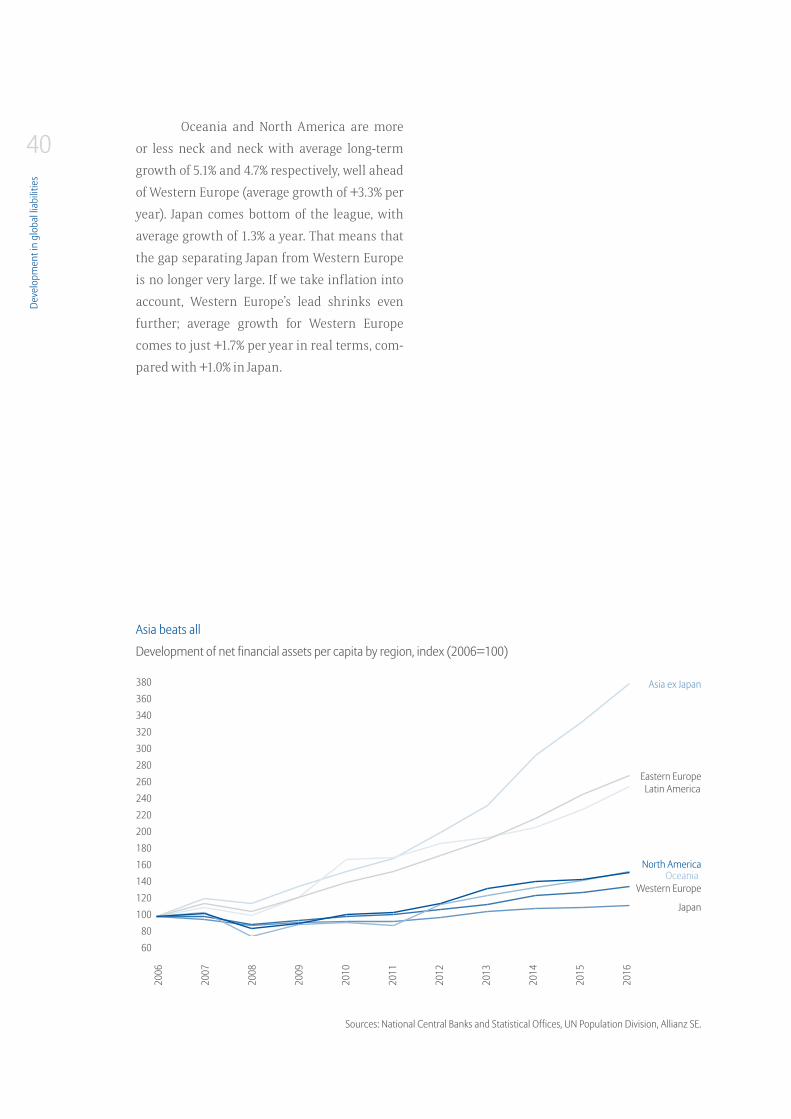
40Oceania and North America are more
or less neck and neck with average long-term
growth of 5.1% and 4.7% respectively, well ahead
of Western Europe (average growth of +3.3% per
year). Japan comes bottom of the league, with
average growth of 1.3% a year. That means that
the gap separating Japan from Western Europe
is no longer very large. If we take inflation into
account, Western Europe’s lead shrinks even
further; average growth for Western Europe
comes to just +1.7% per year in real terms, com-
pared with +1.0% in Japan.
Development of net financial assets per capita by region, index (2006=100)
Asia beats all
Sources: National Central Banks and Statistical Offices, UN Population Division, Allianz SE.
380360340320300280260240220200180160140120100
8060
North AmericaOceania
Western Europe
Eastern EuropeLatin America
Japan
Asia ex Japan
2006
2007
2008
2009
2010
2011
2012
2013
2014
2015
2016
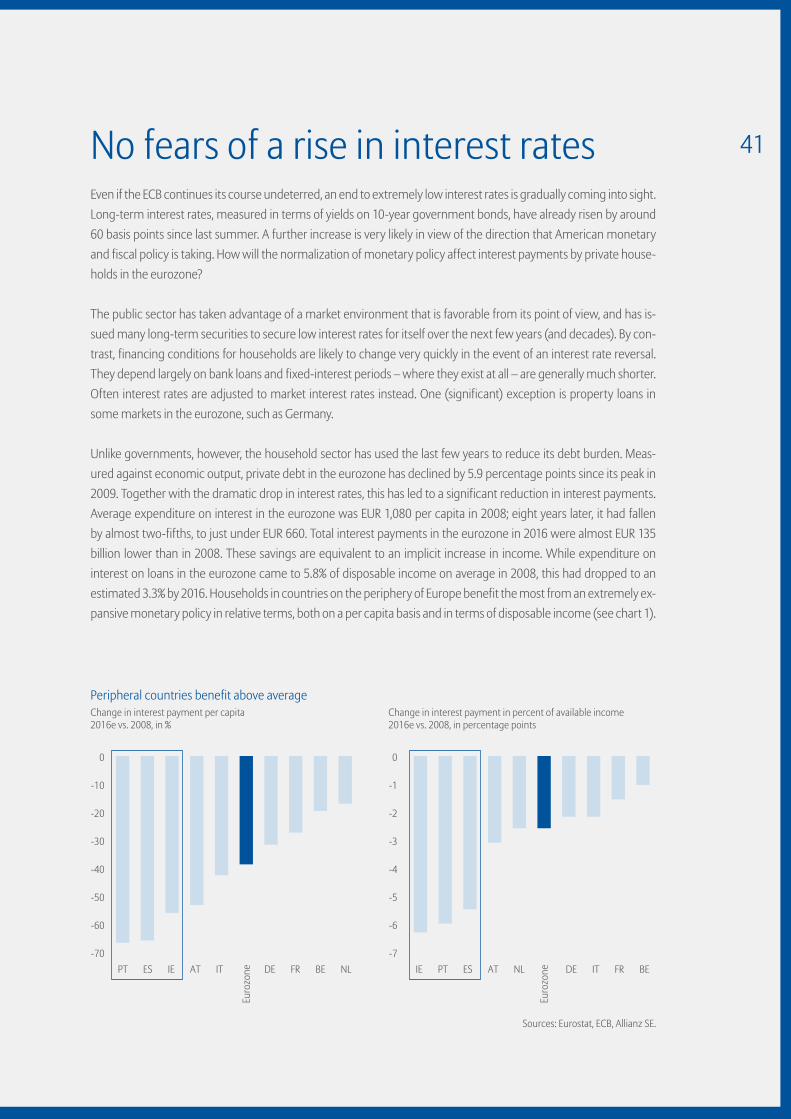
41No fears of a rise in interest rates Even if the ECB continues its course undeterred, an end to extremely low interest rates is gradually coming into sight. Long-term interest rates, measured in terms of yields on 10-year government bonds, have already risen by around 60 basis points since last summer. A further increase is very likely in view of the direction that American monetary and fiscal policy is taking. How will the normalization of monetary policy affect interest payments by private house-holds in the eurozone?
The public sector has taken advantage of a market environment that is favorable from its point of view, and has is-sued many long-term securities to secure low interest rates for itself over the next few years (and decades). By con-trast, financing conditions for households are likely to change very quickly in the event of an interest rate reversal. They depend largely on bank loans and fixed-interest periods – where they exist at all – are generally much shorter. Often interest rates are adjusted to market interest rates instead. One (significant) exception is property loans in some markets in the eurozone, such as Germany.
Unlike governments, however, the household sector has used the last few years to reduce its debt burden. Meas-ured against economic output, private debt in the eurozone has declined by 5.9 percentage points since its peak in 2009. Together with the dramatic drop in interest rates, this has led to a significant reduction in interest payments. Average expenditure on interest in the eurozone was EUR 1,080 per capita in 2008; eight years later, it had fallen by almost two-fifths, to just under EUR 660. Total interest payments in the eurozone in 2016 were almost EUR 135 billion lower than in 2008. These savings are equivalent to an implicit increase in income. While expenditure on interest on loans in the eurozone came to 5.8% of disposable income on average in 2008, this had dropped to an estimated 3.3% by 2016. Households in countries on the periphery of Europe benefit the most from an extremely ex-pansive monetary policy in relative terms, both on a per capita basis and in terms of disposable income (see chart 1).
Peripheral countries benefit above averageChange in interest payment per capita2016e vs. 2008, in %
Change in interest payment in percent of available income 2016e vs. 2008, in percentage points
Sources: Eurostat, ECB, Allianz SE.
Euro
zone
0
-10
-20
-30
-40
-50
-60
-70PT ES IE AT IT DE FR BE NL
Euro
zone
0
-1
-2
-3
-4
-5
-6
-7IE PT ES AT NL DE IT FR BE
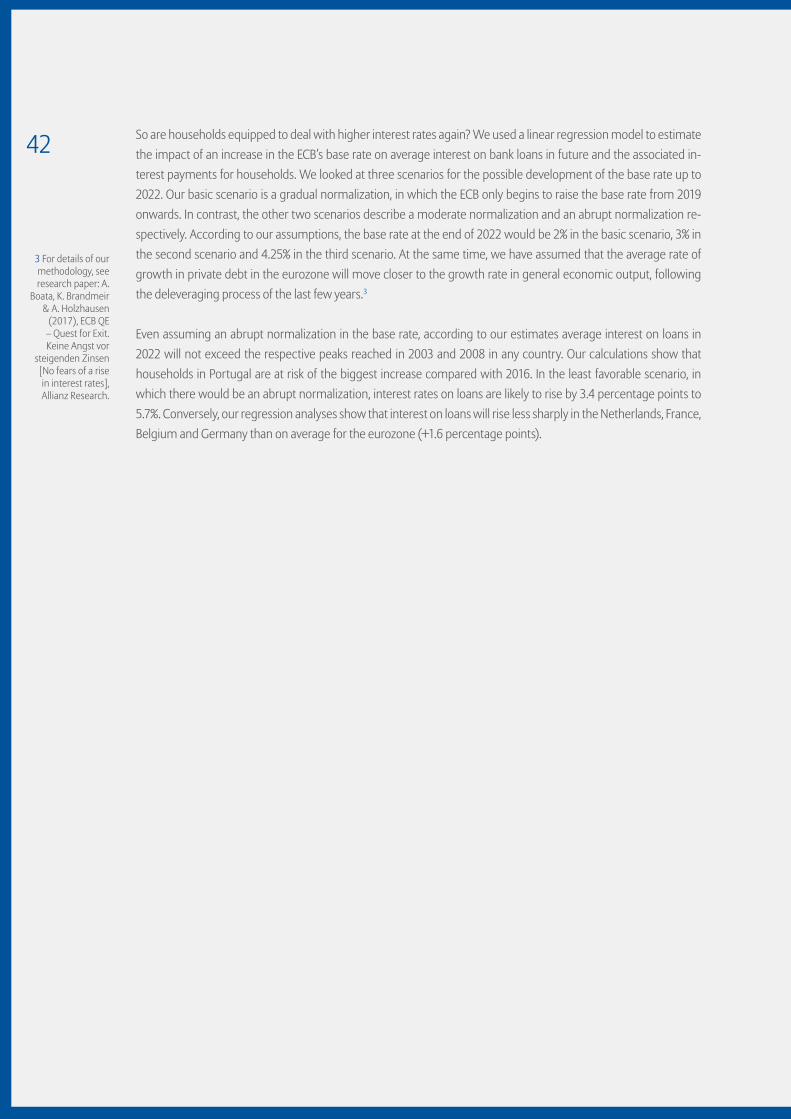
42 So are households equipped to deal with higher interest rates again? We used a linear regression model to estimate the impact of an increase in the ECB’s base rate on average interest on bank loans in future and the associated in-terest payments for households. We looked at three scenarios for the possible development of the base rate up to 2022. Our basic scenario is a gradual normalization, in which the ECB only begins to raise the base rate from 2019 onwards. In contrast, the other two scenarios describe a moderate normalization and an abrupt normalization re-spectively. According to our assumptions, the base rate at the end of 2022 would be 2% in the basic scenario, 3% in the second scenario and 4.25% in the third scenario. At the same time, we have assumed that the average rate of growth in private debt in the eurozone will move closer to the growth rate in general economic output, following the deleveraging process of the last few years.3
Even assuming an abrupt normalization in the base rate, according to our estimates average interest on loans in 2022 will not exceed the respective peaks reached in 2003 and 2008 in any country. Our calculations show that households in Portugal are at risk of the biggest increase compared with 2016. In the least favorable scenario, in which there would be an abrupt normalization, interest rates on loans are likely to rise by 3.4 percentage points to 5.7%. Conversely, our regression analyses show that interest on loans will rise less sharply in the Netherlands, France, Belgium and Germany than on average for the eurozone (+1.6 percentage points).
3 For details of our methodology, see research paper: A.
Boata, K. Brandmeir & A. Holzhausen
(2017), ECB QE – Quest for Exit. Keine Angst vor
steigenden Zinsen [No fears of a rise in interest rates], Allianz Research.
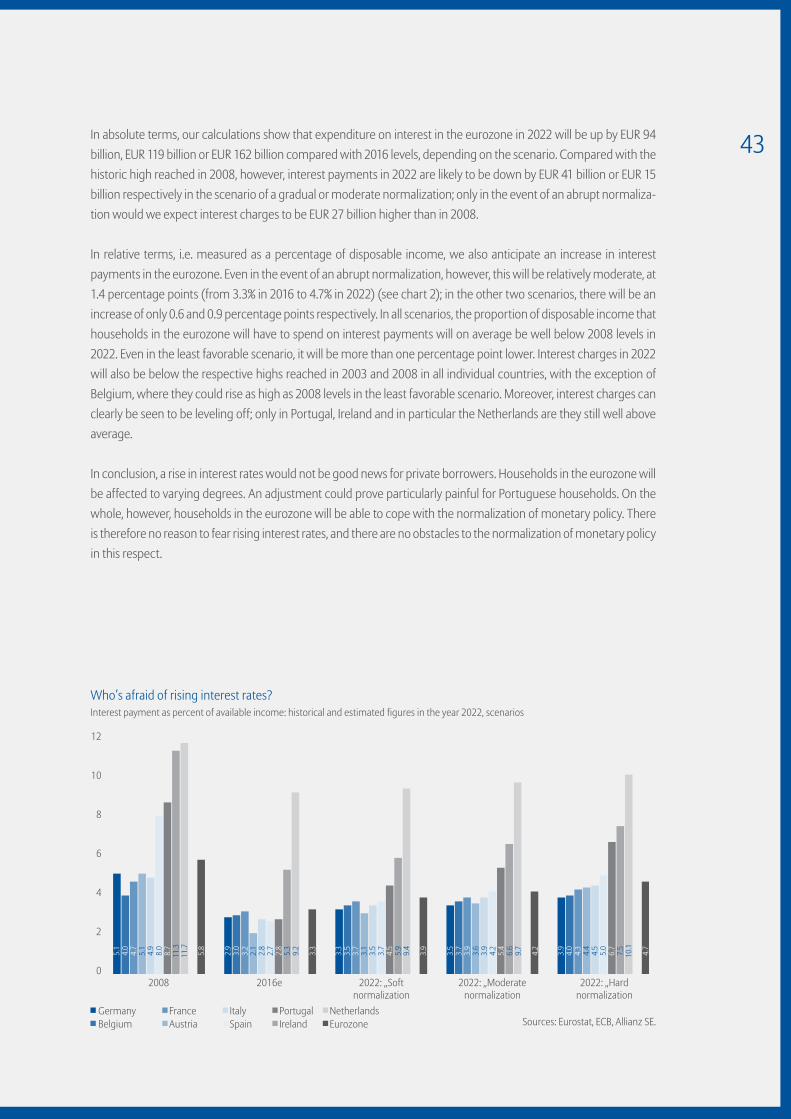
43In absolute terms, our calculations show that expenditure on interest in the eurozone in 2022 will be up by EUR 94 billion, EUR 119 billion or EUR 162 billion compared with 2016 levels, depending on the scenario. Compared with the historic high reached in 2008, however, interest payments in 2022 are likely to be down by EUR 41 billion or EUR 15 billion respectively in the scenario of a gradual or moderate normalization; only in the event of an abrupt normaliza-tion would we expect interest charges to be EUR 27 billion higher than in 2008.
In relative terms, i.e. measured as a percentage of disposable income, we also anticipate an increase in interest payments in the eurozone. Even in the event of an abrupt normalization, however, this will be relatively moderate, at 1.4 percentage points (from 3.3% in 2016 to 4.7% in 2022) (see chart 2); in the other two scenarios, there will be an increase of only 0.6 and 0.9 percentage points respectively. In all scenarios, the proportion of disposable income that households in the eurozone will have to spend on interest payments will on average be well below 2008 levels in 2022. Even in the least favorable scenario, it will be more than one percentage point lower. Interest charges in 2022 will also be below the respective highs reached in 2003 and 2008 in all individual countries, with the exception of Belgium, where they could rise as high as 2008 levels in the least favorable scenario. Moreover, interest charges can clearly be seen to be leveling off; only in Portugal, Ireland and in particular the Netherlands are they still well above average.
In conclusion, a rise in interest rates would not be good news for private borrowers. Households in the eurozone will be affected to varying degrees. An adjustment could prove particularly painful for Portuguese households. On the whole, however, households in the eurozone will be able to cope with the normalization of monetary policy. There is therefore no reason to fear rising interest rates, and there are no obstacles to the normalization of monetary policy in this respect.
Who’s afraid of rising interest rates?Interest payment as percent of available income: historical and estimated figures in the year 2022, scenarios
Sources: Eurostat, ECB, Allianz SE.
12
10
8
6
4
2
02008 2016e 2022: „Soft
normalization2022: „Moderate
normalization2022: „Hard
normalization
5.1
4.0
4.7
5.1
4.9
8.0
8.7
11.3
11.7
5.8
2.9
3.0
3.2
2.1
2.8
2.7
2.8
5.3
9.2
3.3
3.3
3.5
3.7
3.1
3.5
3.7
4.5
5.9
9.4
3.9
3.5
3.7
3.9
3.6
3.9
4.2
5.4
6.6
9.7
4.2
3.9
4.0
4.3
4.4
4.5
5.0
6.7
7.5
10.1
4.7
Belgium Spain Ireland EurozoneAustriaGermany Italy Portugal NetherlandsFrance


Wealth distribution
Light and shade
Wea
lth d
istrib
utio
n
46The two previous sections dealt with changes
in financial assets and debt, and naturally fo-
cused on annual growth rates and the factors
that drive them. This section will look at the dis-
tribution of wealth, i.e. structural issues, where
changes tend to take place slowly. The focus here
will therefore be on a long-term comparison. In
addition, we have further refined our methods
of measuring the distribution of wealth and
translating it into suitable indicators. This year
we have calculated global wealth deciles as well
as national wealth deciles for the first time. One
thing this has enabled us to do is to recreate the
famous “elephant chart” of global development
in incomes4 for financial assets. Moreover, we
have calculated not only average per capita fi-
nancial assets, but also median values. The dif-
ferences between these two variables can pro-
vide particularly useful information about the
distribution of wealth.
As in reports in previous years, we have
divided our analysis into two parts. Firstly, we
shall look at the situation in a global context,
and then we shall examine national wealth dis-
tribution.
At global level, China is in the ascendant
In order to analyze how wealth is distributed at
global level, we have divided all households/in-
dividuals into three global wealth classes: high
wealth, middle wealth and low wealth individ-
uals. This classification is based on global aver-
age net per capita financial assets. In 2016, these
came to EUR 25,510, more than twice as high as
in 2000. The global wealth middle class (“middle
wealth”, MW) includes all individuals with as-
sets of between 30% and 180% of the global av-
erage. This means that for 2016, asset thresholds
for the global wealth middle class are EUR 7,700
and EUR 45,900. The “low wealth” (LW) catego-
ry, on the other hand, includes those individuals
with net financial assets that are below a EUR
7,700 threshold, while the term “high wealth”
(HW) applies to those with net financial assets
of more than EUR 45,900 (for details on how the
asset thresholds are set, see Appendix A).
Development of wealth distribution
since the turn of the millennium has been de-
fined by one phenomenon in particular: ram-
pant growth in the global wealth middle class.
The number of people belonging to this category
has more than doubled during this period, from
444 million in 2000 to over 1 billion today. This
jump is particularly remarkable given that the
threshold for entry to the middle class moved
significantly during this time. While someone
with net financial assets of over EUR 3,600 could
consider themselves to belong to this class in
2000, the threshold today is more than twice as
high.
4 See, for example, Lakner & Milanovic
(2013), Global income distribution:
From the fall of the Berlin Wall to the Great Recession,
Policy research working paper 6719,
The World Bank.
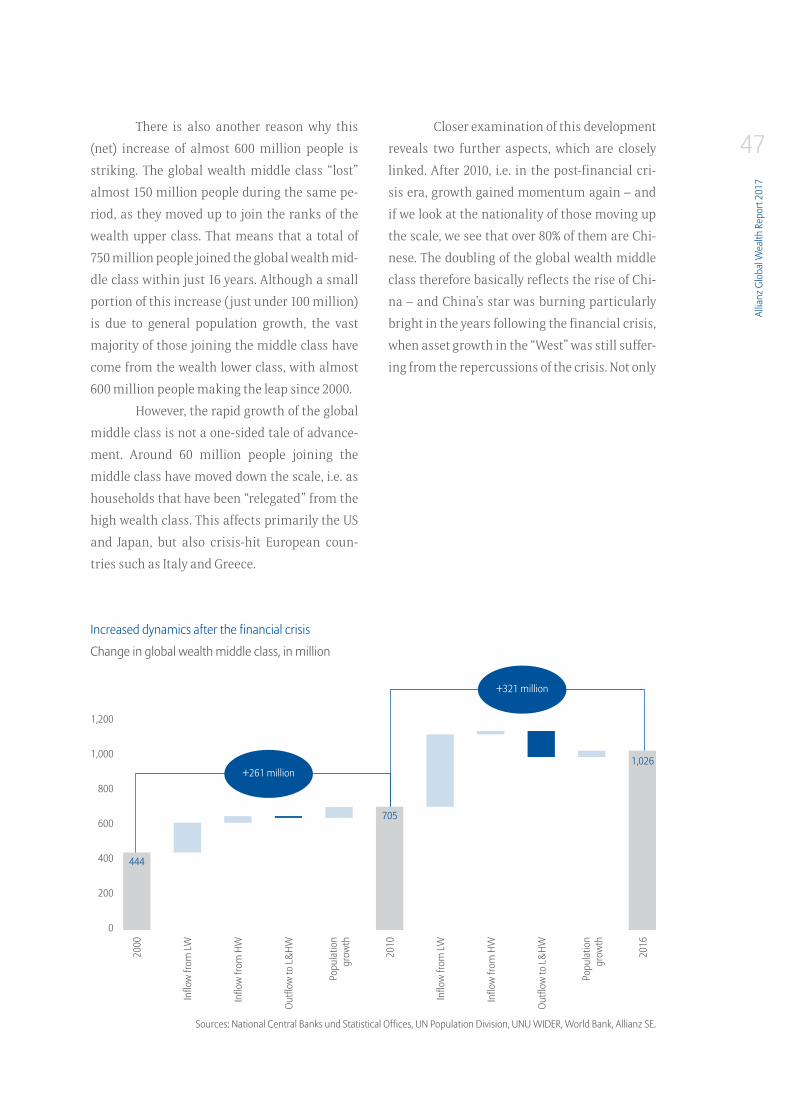
Allia
nz G
loba
l Wea
lth R
epor
t 201
7
47There is also another reason why this
(net) increase of almost 600 million people is
striking. The global wealth middle class “lost”
almost 150 million people during the same pe-
riod, as they moved up to join the ranks of the
wealth upper class. That means that a total of
750 million people joined the global wealth mid-
dle class within just 16 years. Although a small
portion of this increase (just under 100 million)
is due to general population growth, the vast
majority of those joining the middle class have
come from the wealth lower class, with almost
600 million people making the leap since 2000.
However, the rapid growth of the global
middle class is not a one-sided tale of advance-
ment. Around 60 million people joining the
middle class have moved down the scale, i.e. as
households that have been “relegated” from the
high wealth class. This affects primarily the US
and Japan, but also crisis-hit European coun-
tries such as Italy and Greece.
Closer examination of this development
reveals two further aspects, which are closely
linked. After 2010, i.e. in the post-financial cri-
sis era, growth gained momentum again – and
if we look at the nationality of those moving up
the scale, we see that over 80% of them are Chi-
nese. The doubling of the global wealth middle
class therefore basically reflects the rise of Chi-
na – and China’s star was burning particularly
bright in the years following the financial crisis,
when asset growth in the “West” was still suffer-
ing from the repercussions of the crisis. Not only
Change in global wealth middle class, in million
Increased dynamics after the financial crisis
Sources: National Central Banks und Statistical Offices, UN Population Division, UNU WIDER, World Bank, Allianz SE.
1,200
1,000
800
600
400
200
0
1,026
705
444
2000
Inflo
w fr
om LW
Inflo
w fr
om H
W
Outfl
ow to
L&HW
Popu
latio
n gr
owth
2010
Inflo
w fr
om LW
Inflo
w fr
om H
W
Outfl
ow to
L&HW
Popu
latio
n gr
owth
2016
+261 million
+321 million
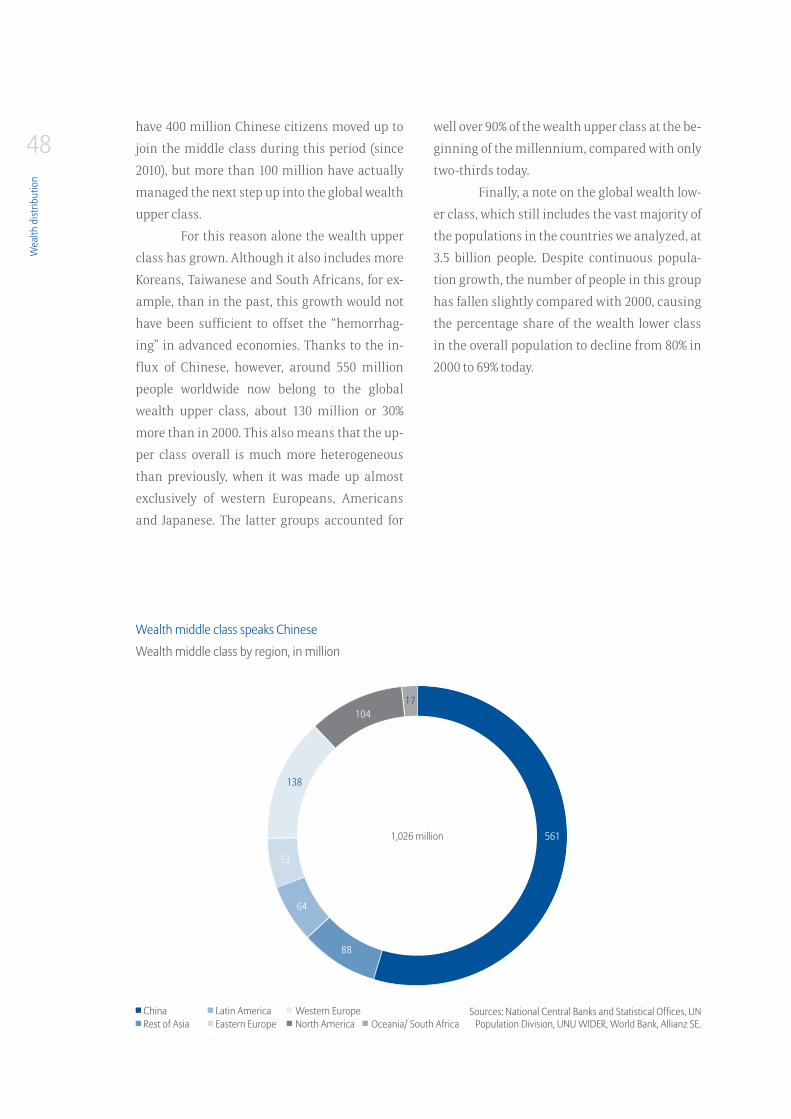
Wea
lth d
istrib
utio
n
48have 400 million Chinese citizens moved up to
join the middle class during this period (since
2010), but more than 100 million have actually
managed the next step up into the global wealth
upper class.
For this reason alone the wealth upper
class has grown. Although it also includes more
Koreans, Taiwanese and South Africans, for ex-
ample, than in the past, this growth would not
have been sufficient to offset the “hemorrhag-
ing” in advanced economies. Thanks to the in-
flux of Chinese, however, around 550 million
people worldwide now belong to the global
wealth upper class, about 130 million or 30%
more than in 2000. This also means that the up-
per class overall is much more heterogeneous
than previously, when it was made up almost
exclusively of western Europeans, Americans
and Japanese. The latter groups accounted for
well over 90% of the wealth upper class at the be-
ginning of the millennium, compared with only
two-thirds today.
Finally, a note on the global wealth low-
er class, which still includes the vast majority of
the populations in the countries we analyzed, at
3.5 billion people. Despite continuous popula-
tion growth, the number of people in this group
has fallen slightly compared with 2000, causing
the percentage share of the wealth lower class
in the overall population to decline from 80% in
2000 to 69% today.
Wealth middle class by region, in million
Wealth middle class speaks Chinese
Sources: National Central Banks and Statistical Offices, UN Population Division, UNU WIDER, World Bank, Allianz SE.Rest of Asia North America Oceania/ South Africa
China Western Europe
1,026 million 561
88
64
53
17104
138
Eastern EuropeLatin America
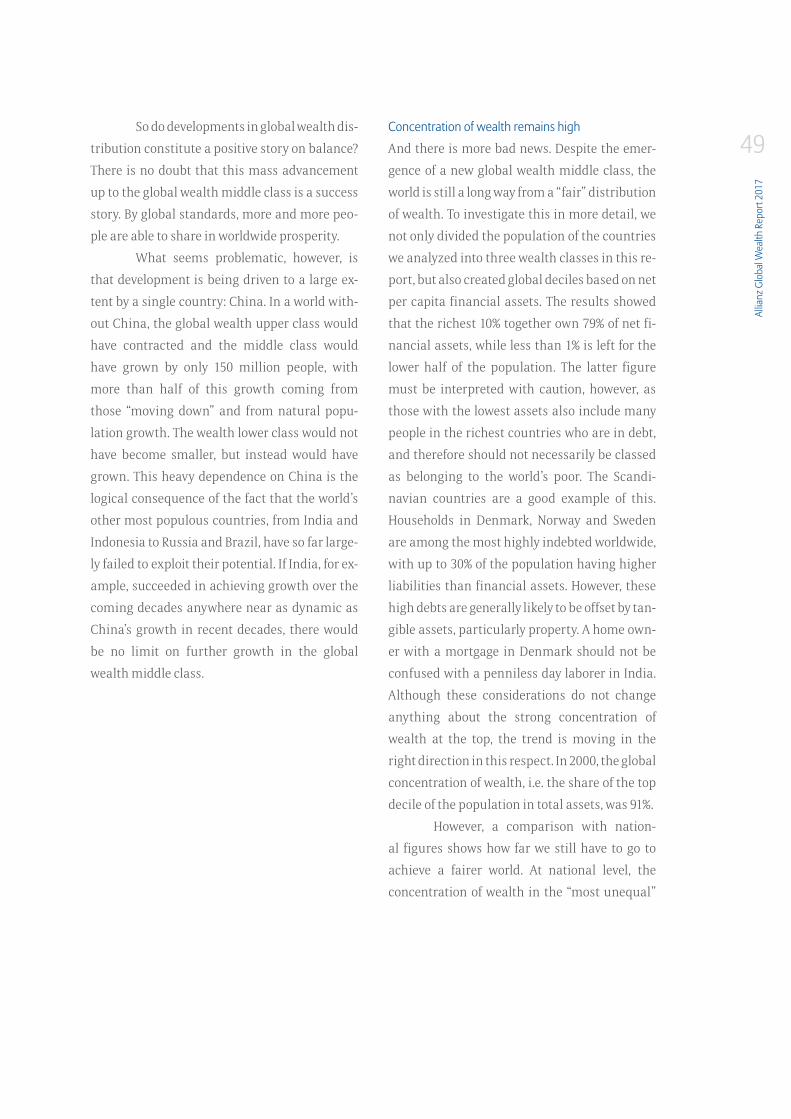
Allia
nz G
loba
l Wea
lth R
epor
t 201
7
49So do developments in global wealth dis-
tribution constitute a positive story on balance?
There is no doubt that this mass advancement
up to the global wealth middle class is a success
story. By global standards, more and more peo-
ple are able to share in worldwide prosperity.
What seems problematic, however, is
that development is being driven to a large ex-
tent by a single country: China. In a world with-
out China, the global wealth upper class would
have contracted and the middle class would
have grown by only 150 million people, with
more than half of this growth coming from
those “moving down” and from natural popu-
lation growth. The wealth lower class would not
have become smaller, but instead would have
grown. This heavy dependence on China is the
logical consequence of the fact that the world’s
other most populous countries, from India and
Indonesia to Russia and Brazil, have so far large-
ly failed to exploit their potential. If India, for ex-
ample, succeeded in achieving growth over the
coming decades anywhere near as dynamic as
China’s growth in recent decades, there would
be no limit on further growth in the global
wealth middle class.
Concentration of wealth remains high
And there is more bad news. Despite the emer-
gence of a new global wealth middle class, the
world is still a long way from a “fair” distribution
of wealth. To investigate this in more detail, we
not only divided the population of the countries
we analyzed into three wealth classes in this re-
port, but also created global deciles based on net
per capita financial assets. The results showed
that the richest 10% together own 79% of net fi-
nancial assets, while less than 1% is left for the
lower half of the population. The latter figure
must be interpreted with caution, however, as
those with the lowest assets also include many
people in the richest countries who are in debt,
and therefore should not necessarily be classed
as belonging to the world’s poor. The Scandi-
navian countries are a good example of this.
Households in Denmark, Norway and Sweden
are among the most highly indebted worldwide,
with up to 30% of the population having higher
liabilities than financial assets. However, these
high debts are generally likely to be offset by tan-
gible assets, particularly property. A home own-
er with a mortgage in Denmark should not be
confused with a penniless day laborer in India.
Although these considerations do not change
anything about the strong concentration of
wealth at the top, the trend is moving in the
right direction in this respect. In 2000, the global
concentration of wealth, i.e. the share of the top
decile of the population in total assets, was 91%.
However, a comparison with nation-
al figures shows how far we still have to go to
achieve a fairer world. At national level, the
concentration of wealth in the “most unequal”
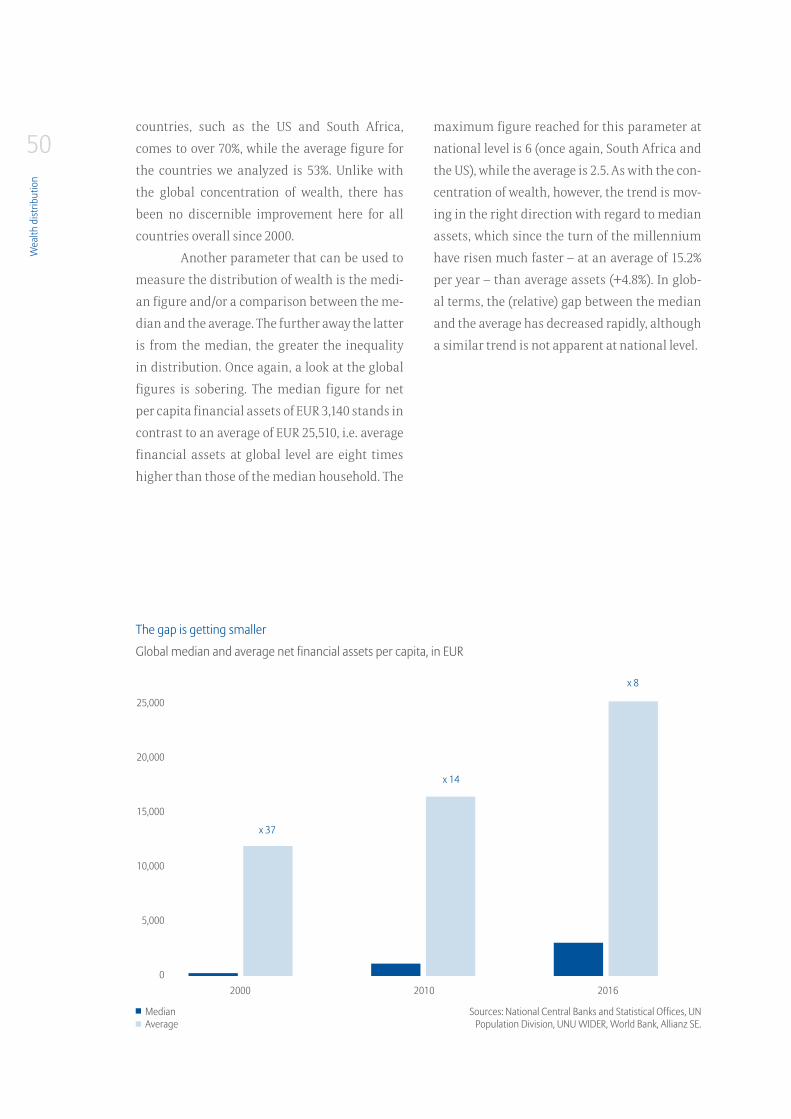
Wea
lth d
istrib
utio
n
50countries, such as the US and South Africa,
comes to over 70%, while the average figure for
the countries we analyzed is 53%. Unlike with
the global concentration of wealth, there has
been no discernible improvement here for all
countries overall since 2000.
Another parameter that can be used to
measure the distribution of wealth is the medi-
an figure and/or a comparison between the me-
dian and the average. The further away the latter
is from the median, the greater the inequality
in distribution. Once again, a look at the global
figures is sobering. The median figure for net
per capita financial assets of EUR 3,140 stands in
contrast to an average of EUR 25,510, i.e. average
financial assets at global level are eight times
higher than those of the median household. The
maximum figure reached for this parameter at
national level is 6 (once again, South Africa and
the US), while the average is 2.5. As with the con-
centration of wealth, however, the trend is mov-
ing in the right direction with regard to median
assets, which since the turn of the millennium
have risen much faster – at an average of 15.2%
per year – than average assets (+4.8%). In glob-
al terms, the (relative) gap between the median
and the average has decreased rapidly, although
a similar trend is not apparent at national level.
Global median and average net financial assets per capita, in EUR
The gap is getting smaller
Sources: National Central Banks and Statistical Offices, UN Population Division, UNU WIDER, World Bank, Allianz SE.
MedianAverage
25,000
20,000
15,000
10,000
5,000
02000 2010 2016
x 37
x 14
x 8
Allia
nz G
loba
l Wea
lth R
epor
t 201
7
51 An elephant without its trunk
These global wealth deciles can also be used to
recreate the infamous “elephant chart”, which
maps income growth for each percentile of the
global population between 1988 and 2008, for
asset growth. In line with the data available to
us, we limited ourselves to the period between
2000 and 2016.
There are clear similarities to the orig-
inal. As with incomes, there was no improve-
ment in the situation of the lowest wealth decile
during these years. Even worse, net financial
assets here actually declined. This is not least a
reflection of one anomaly that our investigation
of assets revealed. Unlike incomes, net financial
assets can also be negative, i.e. in the case of
over-indebted households. The negative growth
rate for this decile thus indicates a faster rise in
debts than in assets, as data relating to devel-
opment of debt (see the previous section) would
lead us to expect. Before the financial crisis in
particular, liabilities in many countries grew at
a breathtaking speed.
The other wealth deciles, on the oth-
er hand, all had positive growth rates, with the
highest growth in the sixth and the seventh de-
cile. As with incomes, it is therefore households
in the upper middle part of the global wealth
distribution in particular – those joining the
middle class in emerging countries – that have
benefited the most from asset growth in recent
years.
Yet the most striking difference com-
pared to the income situation can be seen at
the top end of the distribution pyramid. Growth
slows not only in the eighth, and principally in
the ninth, decile (as with incomes) but also in
the tenth, the decile with the highest net per
capita financial assets. Asset growth is actually
by far the weakest in this group, if we disregard
over-indebted households at the other end of the
distribution spectrum. The elephant thus has no
trunk. Moreover, these findings do not change if
we look at the richest percentile – the top 1% of
the distribution pyramid – instead of the richest
decile. Although the average annual growth rate
here is slightly higher than for the richest 10%
(4.4% vs. 3.9%), it is nowhere near the rates of al-
most 15% reached in the fifth and sixth deciles.
Unlike income, growth in assets there-
fore slows as the level of assets increases. Why is
this the case? The explanation may actually lie
mainly in the level of assets itself. Even in the top
decile, average net per capita financial assets
are now above the EUR 200,000 threshold (2016),
making them around nine times higher than the
average – and more than 50 times higher than
the corresponding figure for the sixth wealth de-
cile. The richest wealth percentile is even further
away from these figures. Net per capita financial
assets here averaged just over EUR 900,000 in
2016. For financial assets of this scale, growth no
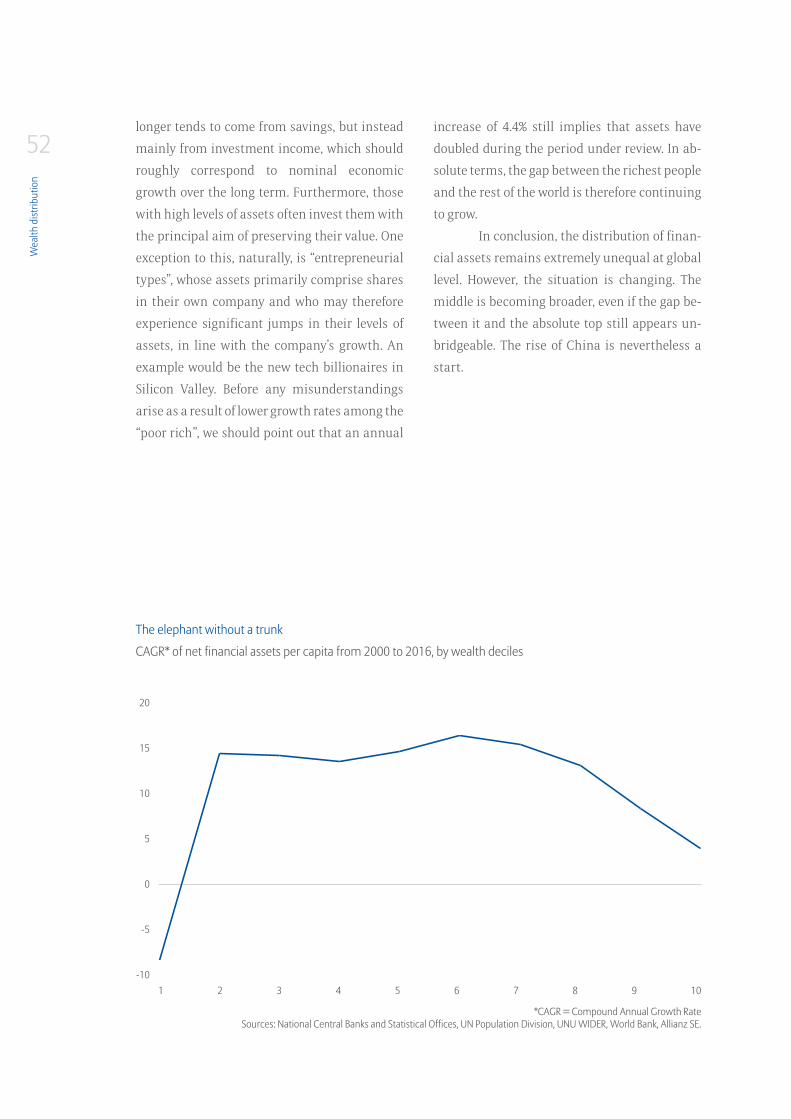
Wea
lth d
istrib
utio
n
52longer tends to come from savings, but instead
mainly from investment income, which should
roughly correspond to nominal economic
growth over the long term. Furthermore, those
with high levels of assets often invest them with
the principal aim of preserving their value. One
exception to this, naturally, is “entrepreneurial
types”, whose assets primarily comprise shares
in their own company and who may therefore
experience significant jumps in their levels of
assets, in line with the company’s growth. An
example would be the new tech billionaires in
Silicon Valley. Before any misunderstandings
arise as a result of lower growth rates among the
“poor rich”, we should point out that an annual
increase of 4.4% still implies that assets have
doubled during the period under review. In ab-
solute terms, the gap between the richest people
and the rest of the world is therefore continuing
to grow.
In conclusion, the distribution of finan-
cial assets remains extremely unequal at global
level. However, the situation is changing. The
middle is becoming broader, even if the gap be-
tween it and the absolute top still appears un-
bridgeable. The rise of China is nevertheless a
start.
CAGR* of net financial assets per capita from 2000 to 2016, by wealth deciles
The elephant without a trunk
*CAGR = Compound Annual Growth RateSources: National Central Banks and Statistical Offices, UN Population Division, UNU WIDER, World Bank, Allianz SE.
20
15
10
5
0
-5
-101 2 3 4 5 6 7 8 9 10
Allia
nz G
loba
l Wea
lth R
epor
t 201
7
53The US slips down the rankings in a coun-try-by-country analysis
Although this division into global wealth class-
es is revealing when it comes to analyzing how
global weightings are shifting, it is likely to re-
main rather abstract for most of the people con-
cerned. This is because the benchmark for most
households is not the global average, but rather
their national average – people are interested
first and foremost in how much their neighbor
has.
There are various ways of measuring
wealth inequality at national level. One option,
as in the previous section on global wealth dis-
tribution, is to analyze the proportion of assets
held by the richest population decile. In a na-
tional context, however, it is often not so much
the absolute level of assets, which is determined
by a large number of social and historical devel-
opment factors, but rather the change in distri-
bution over time that determines whether the
situation in a particular country is seen as being
“fair” or “unfair”. One example is Latin America,
where the level of wealth concentration is still
very high, at well over 50% – or is even above 60%
in some cases (Brazil) – but the trend in all coun-
tries is moving in the “right” direction.
At first glance, the 53 countries we ana-
lyzed present a very mixed picture. The concen-
tration of wealth has declined since 2000 in just
over half of the countries, while in the others it
has increased. If we look more closely, howev-
er, some patterns emerge. The concentration of
wealth has decreased over the last few decades
in emerging countries in particular, with sev-
eral important exceptions (India and Indone-
sia in Asia, Russia in Eastern Europe and South
Africa). This must be qualified further. Since
the financial crisis, a tendency towards a more
egalitarian distribution of wealth in emerging
markets seems to have weakened. This particu-
larly applies to many Latin American countries.
The trend has even reversed completely in some
emerging countries, i.e. the proportion of assets
held by the top population decile has increased
again since 2010. These countries, tellingly, in-
clude China and Turkey.
The situation is different in industrial-
ized nations. The proportion of assets held by
the richest 10% has risen in most of the countries
we analyzed, with particularly large increases in
countries such as Denmark, Switzerland, the US
and France. Even among industrialized coun-
tries, however, there are prominent exceptions
that confirm the rule of growing inequality. In
Canada, Austria and Belgium, the concentration
of wealth has decreased since the turn of the
millennium. Moreover, as with emerging coun-
tries, the trend towards less equal distribution
appears to have slowed significantly since the fi-
nancial crisis. That applies to countries such as
Wea
lth d
istrib
utio
n
54Switzerland and Germany, where the proportion
of assets held by the top population decile has
risen only minimally, the US, where the trend
has stopped, and Italy, where the trend actual-
ly reversed. Even in industrialized countries,
development of wealth distribution is therefore
more differentiated than it appears at a first
brief glance.
Other parameters that are frequently
used to measure national distribution of wealth
are the share of the middle class in total assets
or – as a comprehensive indicator – the Gini
coefficient. In last year’s report, we analyzed
in detail the situation of the middle class and
its supposed erosion. Our conclusion then was
that, although it is mainly advanced economies
that are experiencing a negative trend, overall
developments are too complex to be reduced to
one simple factor. At any rate, there was no ev-
idence of a general decline in the middle class
as a worldwide phenomenon. For the last two
years we have also calculated a Gini coefficient
for each country, based on average net financial
assets for each population decile. However, as
the Gini coefficient is an overall indicator that
measures changes in all wealth deciles simulta-
neously, the shifts from one year to the next are
only slight. The conclusions reached in recent
years therefore still apply. It is predominantly in
emerging countries that the Gini coefficient has
improved over the long term, whereas a particu-
lar deterioration has occurred in industrialized
countries.5
This year we are taking a different ap-
proach to the issue of national distribution. We
have calculated median assets and analyzed
how they have developed over the last few years,
particularly compared with changes in average
assets.
Even a direct comparison between me-
dian and average net per capita financial assets
is very revealing. If we drew up our rankings of
the world’s richest countries based on median
values, they would look completely different.
The shift at the top from the US to Switzerland
would actually be the smallest. Only three coun-
tries – Japan, Austria and Finland – would stay in
the same place, while the rest would be shaken
up, in some cases significantly. One example of
this is the US, which would fall from first place
to 13th place. Another is Sweden, which would
drop from 4th to 12th place. The other losers
include Denmark (-11 places), the UK (-5 places)
and Germany (-3 places), with the latter thus
also dropping out of the top 20. Median assets
are significantly lower than average assets in
all of these countries, an indication of relative-
ly unequal distribution of wealth. In Scandina-
vian countries, this is mainly due to high levels
5 The current wealth distribution Gini-coefficients of all analyzed coun-
tries can be found in the appendix.
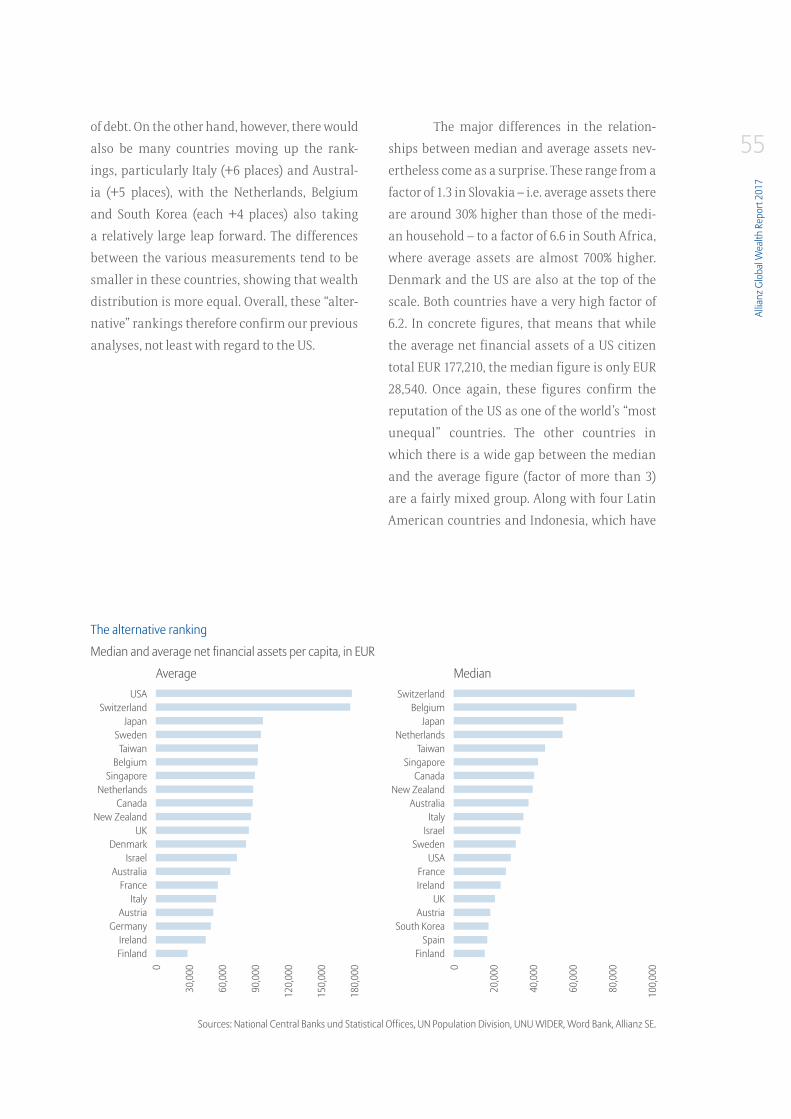
Allia
nz G
loba
l Wea
lth R
epor
t 201
7
55of debt. On the other hand, however, there would
also be many countries moving up the rank-
ings, particularly Italy (+6 places) and Austral-
ia (+5 places), with the Netherlands, Belgium
and South Korea (each +4 places) also taking
a relatively large leap forward. The differences
between the various measurements tend to be
smaller in these countries, showing that wealth
distribution is more equal. Overall, these “alter-
native” rankings therefore confirm our previous
analyses, not least with regard to the US.
The major differences in the relation-
ships between median and average assets nev-
ertheless come as a surprise. These range from a
factor of 1.3 in Slovakia – i.e. average assets there
are around 30% higher than those of the medi-
an household – to a factor of 6.6 in South Africa,
where average assets are almost 700% higher.
Denmark and the US are also at the top of the
scale. Both countries have a very high factor of
6.2. In concrete figures, that means that while
the average net financial assets of a US citizen
total EUR 177,210, the median figure is only EUR
28,540. Once again, these figures confirm the
reputation of the US as one of the world’s “most
unequal” countries. The other countries in
which there is a wide gap between the median
and the average figure (factor of more than 3)
are a fairly mixed group. Along with four Latin
American countries and Indonesia, which have
Median and average net financial assets per capita, in EUR
Average Median
The alternative ranking
Sources: National Central Banks und Statistical Offices, UN Population Division, UNU WIDER, Word Bank, Allianz SE.
0
30,0
00
60,0
00
90,0
00
120,
000
150,
000
180,
000 0
20,0
00
40,0
00
60,0
00
80,0
00
100,
000
USASwitzerland
JapanSweden
TaiwanBelgium
SingaporeNetherlands
CanadaNew Zealand
UKDenmark
IsraelAustralia
FranceItaly
AustriaGermany
IrelandFinland
SwitzerlandBelgium
JapanNetherlands
TaiwanSingapore
CanadaNew Zealand
AustraliaItaly
IsraelSweden
USAFranceIreland
UKAustria
South KoreaSpain
Finland
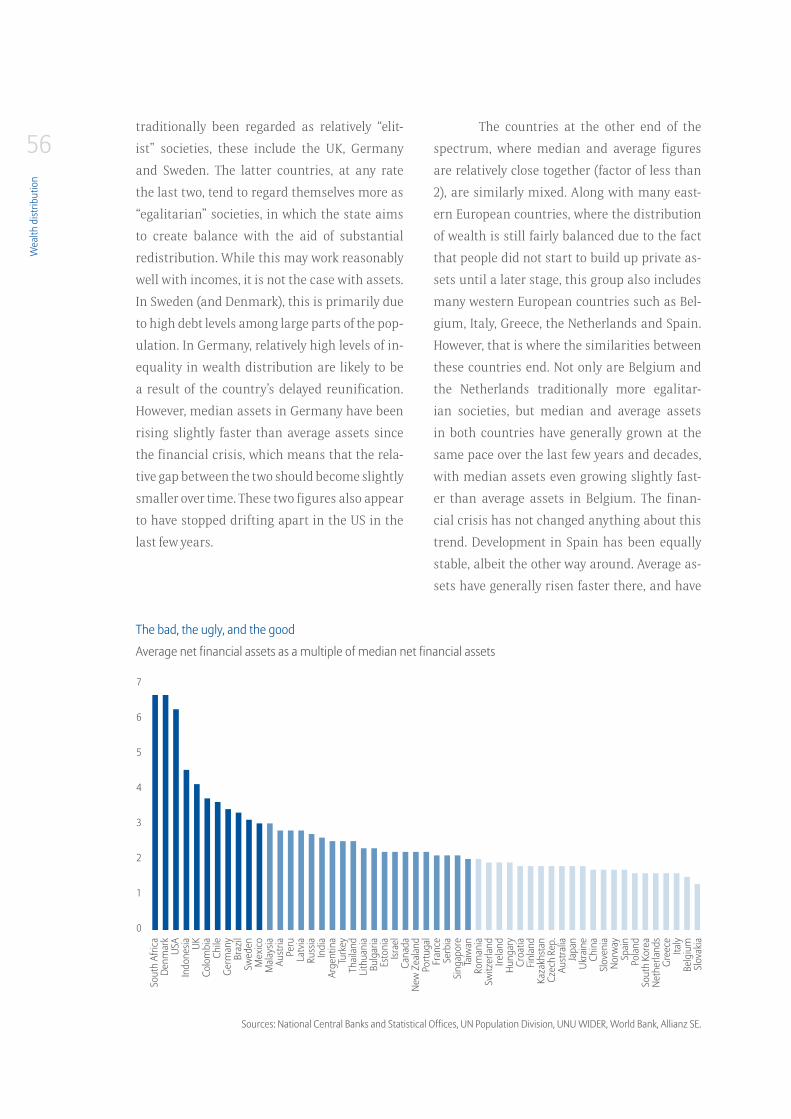
Wea
lth d
istrib
utio
n
56traditionally been regarded as relatively “elit-
ist” societies, these include the UK, Germany
and Sweden. The latter countries, at any rate
the last two, tend to regard themselves more as
“egalitarian” societies, in which the state aims
to create balance with the aid of substantial
redistribution. While this may work reasonably
well with incomes, it is not the case with assets.
In Sweden (and Denmark), this is primarily due
to high debt levels among large parts of the pop-
ulation. In Germany, relatively high levels of in-
equality in wealth distribution are likely to be
a result of the country’s delayed reunification.
However, median assets in Germany have been
rising slightly faster than average assets since
the financial crisis, which means that the rela-
tive gap between the two should become slightly
smaller over time. These two figures also appear
to have stopped drifting apart in the US in the
last few years.
The countries at the other end of the
spectrum, where median and average figures
are relatively close together (factor of less than
2), are similarly mixed. Along with many east-
ern European countries, where the distribution
of wealth is still fairly balanced due to the fact
that people did not start to build up private as-
sets until a later stage, this group also includes
many western European countries such as Bel-
gium, Italy, Greece, the Netherlands and Spain.
However, that is where the similarities between
these countries end. Not only are Belgium and
the Netherlands traditionally more egalitar-
ian societies, but median and average assets
in both countries have generally grown at the
same pace over the last few years and decades,
with median assets even growing slightly fast-
er than average assets in Belgium. The finan-
cial crisis has not changed anything about this
trend. Development in Spain has been equally
stable, albeit the other way around. Average as-
sets have generally risen faster there, and have
Average net financial assets as a multiple of median net financial assets
The bad, the ugly, and the good
Sources: National Central Banks and Statistical Offices, UN Population Division, UNU WIDER, World Bank, Allianz SE.
Sout
h Af
rica
Denm
ark
USA
Indo
nesia UK
Colo
mbi
aCh
ileGe
rman
yBr
azil
Swed
enM
exico
Mal
aysia
Aust
riaPe
ruLa
tvia
Russ
iaIn
dia
Arge
ntin
aTu
rkey
Thai
land
Lithu
ania
Bulg
aria
Esto
nia
Israe
lCa
nada
New
Zea
land
Portu
gal
Fran
ceSe
rbia
Sing
apor
eTa
iwan
Rom
ania
Switz
erla
ndIre
land
Hung
ary
Croa
tiaFin
land
Kaza
khst
anCz
ech
Rep.
Aust
ralia
Japa
nUk
rain
eCh
ina
Slov
enia
Norw
aySp
ain
Pola
ndSo
uth
Kore
aNe
ther
land
sGr
eece
Italy
Belg
ium
Slov
akia
7
6
5
4
3
2
1
0
Allia
nz G
loba
l Wea
lth R
epor
t 201
7
57actually increased their lead over median assets
since the financial crisis. The situation in Greece
is similar, but more pronounced. Growth in av-
erage assets has been about 50% higher since
the crisis. The severe crisis has thus apparently
contributed to wider distribution of wealth in
both countries. Greece has at any rate recently
begun to grow again. This is an achievement, as
Greece is the only country in our group in which
median and average assets have actually fallen
over the longer term since 2000, contracting by
about one-third in each case. Finally, the finan-
cial crisis also represented a turning point for
Italy, with its median assets growing slightly
faster since the crisis. The crisis thus appears
to have brought about a positive trend reversal
in Italy with regard to the distribution of wealth
(although not asset growth).
An analysis of median assets also shows
that the asset situation has varied widely in re-
cent years, even in countries with such similar
overall conditions as the eurozone countries.
We would therefore strongly warn against gen-
eralizations. The issue of distribution is more
complex, at both global and national level, than
the catchy headlines reporting constant growth
in inequality would suggest. Apart from the
US – which unquestionably has a problem with
wealth distribution – the picture is becoming
increasingly unclear. Light and shade are bal-
ancing each other out, with shades of gray tend-
ing to predominate. Moreover, unconventional
monetary policy in recent years has made the
situation more confusing (see box below).
58 The impact of unconventional monetary policy on distributionThe ECB’s extreme monetary policy is increasingly likely to reach its limits the longer it continues.
This can be illustrated by an analysis of the direct impact on income of monetary policy in the
eurozone. The term “direct impact on income” refers to interest rate gains/losses for private house-
holds as a result of changes in the interest rates for bank deposits and loans. In contrast to the ef-
fects of monetary policy on the prices of assets such as shares, bonds or receivables from insurance
companies and pension funds, which initially represent “only” book profits or losses, households
feel these changes directly in their wallets (or in their bank accounts).
Private households in the eurozone are still benefiting substantially from the ECB’s policy. Since
2012, the year in which the ECB vowed to do “whatever it takes” to save the euro, cumulative interest
rate gains have come to EUR 145 billion, or EUR 430 per capita. Moreover, the extremely expansive
monetary policy continues to be a blessing for households in the south of the continent in par-
ticular, as it significantly reduces their debt service payments. However, interest rate gains have
declined noticeably in the last few years. Spain is an example of this trend: interest rate gains per
capita there have dropped to less than half the levels they were at in 2012 and 2013. Two factors
are responsible for this. Firstly, interest rates on loans in Spain responded very quickly to meas-
ures taken by the ECB, as e.g. mortgages have traditionally had variable interest rates or only short
fixed-interest periods. However, interest on loans has barely fallen in recent years, and the scope
for interest rate cuts has largely been exhausted. In addition, Spanish households have used the
last few years to reduce their debts. Private debt has fallen by almost 20% since the outbreak of
the crisis, while bank deposits have increased by about 9% over the same period. Just as Spanish
households have got their finances back under control, however, the impact of extreme monetary
policy on their income situation has diminished. This year it is therefore likely to be France that
will benefit the most from ECB policy, rather than one of the southern European countries.
The trend in Germany is the reverse, which appears encouraging at first glance. Interest rate losses
have become much smaller in recent years, and this year are expected to reach only one-third of
the levels they were at in the period from 2013 to 2015. This reflects a rise in debt and a slower but
steady decline in interest on loans. In contrast to Spain, the German mortgage market is character-
ized by long fixed-interest periods, which means that it takes some time for falls in market interest
rates to be passed on to borrowers.
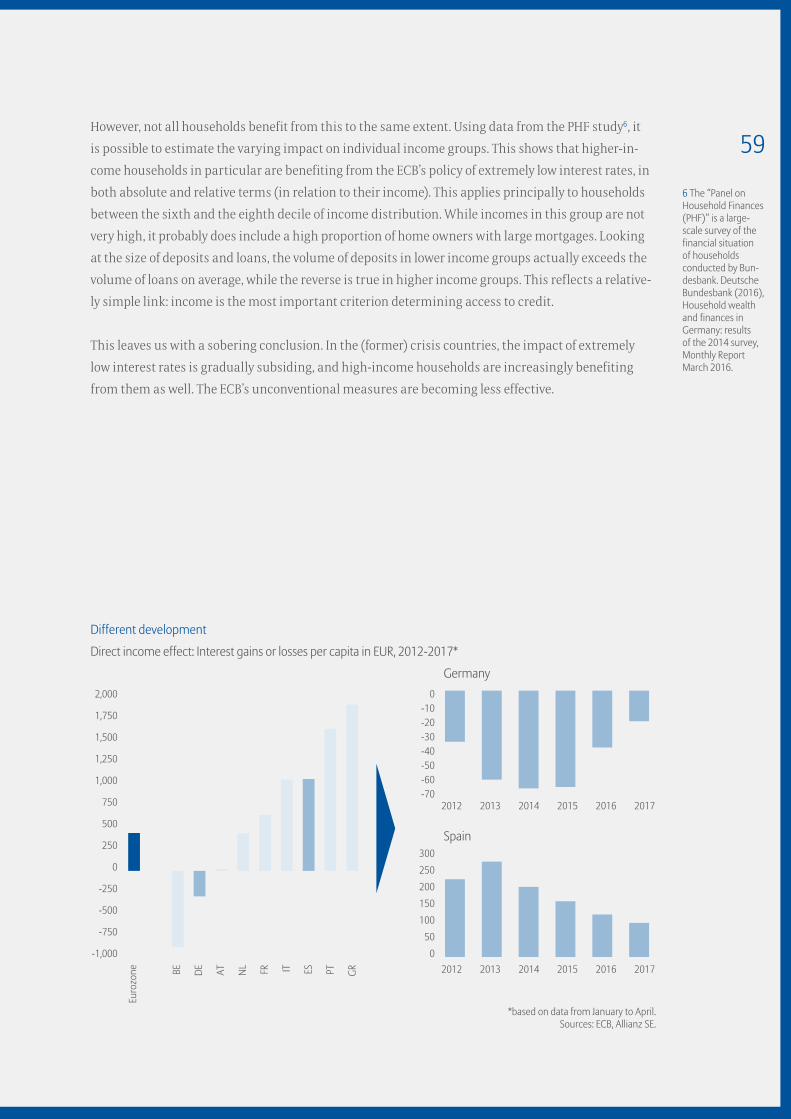
59However, not all households benefit from this to the same extent. Using data from the PHF study6, it
is possible to estimate the varying impact on individual income groups. This shows that higher-in-
come households in particular are benefiting from the ECB’s policy of extremely low interest rates, in
both absolute and relative terms (in relation to their income). This applies principally to households
between the sixth and the eighth decile of income distribution. While incomes in this group are not
very high, it probably does include a high proportion of home owners with large mortgages. Looking
at the size of deposits and loans, the volume of deposits in lower income groups actually exceeds the
volume of loans on average, while the reverse is true in higher income groups. This reflects a relative-
ly simple link: income is the most important criterion determining access to credit.
This leaves us with a sobering conclusion. In the (former) crisis countries, the impact of extremely
low interest rates is gradually subsiding, and high-income households are increasingly benefiting
from them as well. The ECB’s unconventional measures are becoming less effective.
6 The “Panel on Household Finances (PHF)” is a large-scale survey of the financial situation of households conducted by Bun-desbank. Deutsche Bundesbank (2016), Household wealth and finances in Germany: results of the 2014 survey, Monthly Report March 2016.
Direct income effect: Interest gains or losses per capita in EUR, 2012-2017*
Different development
*based on data from January to April.Sources: ECB, Allianz SE.
2,000
1,750
1,500
1,250
1,000
750
500
250
0
-250
-500
-750
-1,000
0-10-20-30-40-50-60-70
300250200150100
500
Germany
Spain
2012 2013 2014 2015 2016 2017
2012 2013 2014 2015 2016 2017
Euro
zone BE DE AT NL FR IT ES PT GR

62 Latin America 72 North America 82 Western Europe 92 Box: Rich Germany, poor Germany? 96 Eastern Europe 108 Asia 124 Australia and New Zealand
Regional differences
Financial assets in individual regions
62
Vorwort . Zusammenfassung . Entwicklung des globalen Geldvermögens . Verteilung des globalen Geldvermögens . Regionale Unterschiede . Literatur . Appendix
62
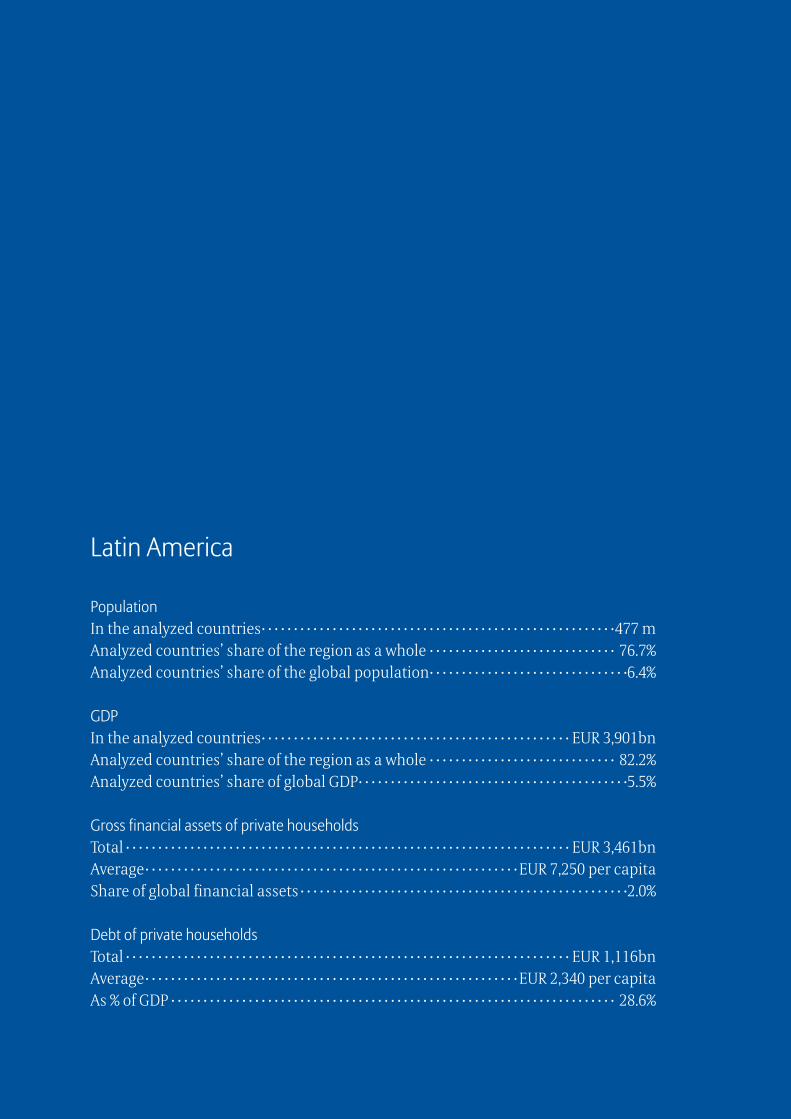
Latin America
PopulationIn the analyzed countries · · · · · · · · · · · · · · · · · · · · · · · · · · · · · · · · · · · · · · · · · · · · · · · · · · · · · · ·477 mAnalyzed countries’ share of the region as a whole · · · · · · · · · · · · · · · · · · · · · · · · · · · · · 76.7%Analyzed countries’ share of the global population · · · · · · · · · · · · · · · · · · · · · · · · · · · · · · ·6.4%
GDPIn the analyzed countries · · · · · · · · · · · · · · · · · · · · · · · · · · · · · · · · · · · · · · · · · · · · · · · · EUR 3,901bnAnalyzed countries’ share of the region as a whole · · · · · · · · · · · · · · · · · · · · · · · · · · · · · 82.2%Analyzed countries’ share of global GDP · · · · · · · · · · · · · · · · · · · · · · · · · · · · · · · · · · · · · · · · · ·5.5%
Gross financial assets of private householdsTotal · · · · · · · · · · · · · · · · · · · · · · · · · · · · · · · · · · · · · · · · · · · · · · · · · · · · · · · · · · · · · · · · · · · · · EUR 3,461bnAverage · · · · · · · · · · · · · · · · · · · · · · · · · · · · · · · · · · · · · · · · · · · · · · · · · · · · · · · · · · EUR 7,250 per capitaShare of global financial assets · · · · · · · · · · · · · · · · · · · · · · · · · · · · · · · · · · · · · · · · · · · · · · · · · · ·2.0%
Debt of private householdsTotal · · · · · · · · · · · · · · · · · · · · · · · · · · · · · · · · · · · · · · · · · · · · · · · · · · · · · · · · · · · · · · · · · · · · · EUR 1,116bnAverage · · · · · · · · · · · · · · · · · · · · · · · · · · · · · · · · · · · · · · · · · · · · · · · · · · · · · · · · · · EUR 2,340 per capitaAs % of GDP · · · · · · · · · · · · · · · · · · · · · · · · · · · · · · · · · · · · · · · · · · · · · · · · · · · · · · · · · · · · · · · · · · · · · 28.6%
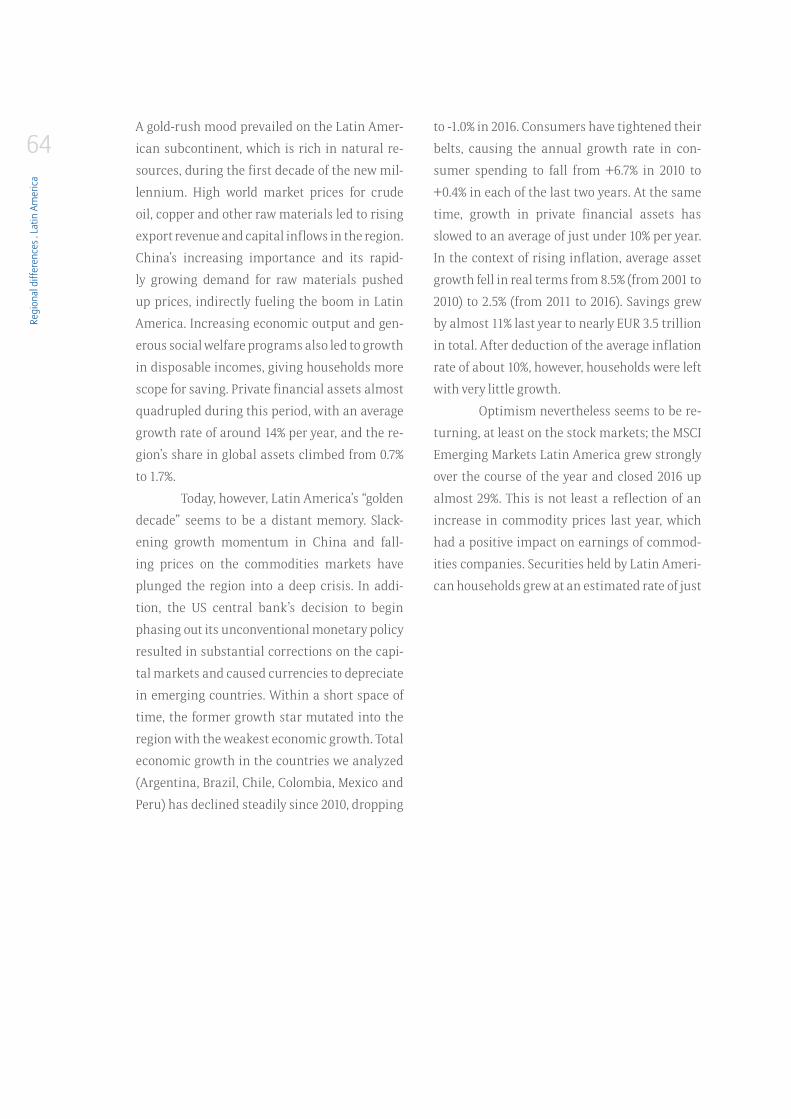
Regi
onal
diff
eren
ces .
Latin
Am
eric
a
64A gold-rush mood prevailed on the Latin Amer-
ican subcontinent, which is rich in natural re-
sources, during the first decade of the new mil-
lennium. High world market prices for crude
oil, copper and other raw materials led to rising
export revenue and capital inflows in the region.
China’s increasing importance and its rapid-
ly growing demand for raw materials pushed
up prices, indirectly fueling the boom in Latin
America. Increasing economic output and gen-
erous social welfare programs also led to growth
in disposable incomes, giving households more
scope for saving. Private financial assets almost
quadrupled during this period, with an average
growth rate of around 14% per year, and the re-
gion’s share in global assets climbed from 0.7%
to 1.7%.
Today, however, Latin America’s “golden
decade” seems to be a distant memory. Slack-
ening growth momentum in China and fall-
ing prices on the commodities markets have
plunged the region into a deep crisis. In addi-
tion, the US central bank’s decision to begin
phasing out its unconventional monetary policy
resulted in substantial corrections on the capi-
tal markets and caused currencies to depreciate
in emerging countries. Within a short space of
time, the former growth star mutated into the
region with the weakest economic growth. Total
economic growth in the countries we analyzed
(Argentina, Brazil, Chile, Colombia, Mexico and
Peru) has declined steadily since 2010, dropping
to -1.0% in 2016. Consumers have tightened their
belts, causing the annual growth rate in con-
sumer spending to fall from +6.7% in 2010 to
+0.4% in each of the last two years. At the same
time, growth in private financial assets has
slowed to an average of just under 10% per year.
In the context of rising inflation, average asset
growth fell in real terms from 8.5% (from 2001 to
2010) to 2.5% (from 2011 to 2016). Savings grew
by almost 11% last year to nearly EUR 3.5 trillion
in total. After deduction of the average inflation
rate of about 10%, however, households were left
with very little growth.
Optimism nevertheless seems to be re-
turning, at least on the stock markets; the MSCI
Emerging Markets Latin America grew strongly
over the course of the year and closed 2016 up
almost 29%. This is not least a reflection of an
increase in commodity prices last year, which
had a positive impact on earnings of commod-
ities companies. Securities held by Latin Ameri-
can households grew at an estimated rate of just
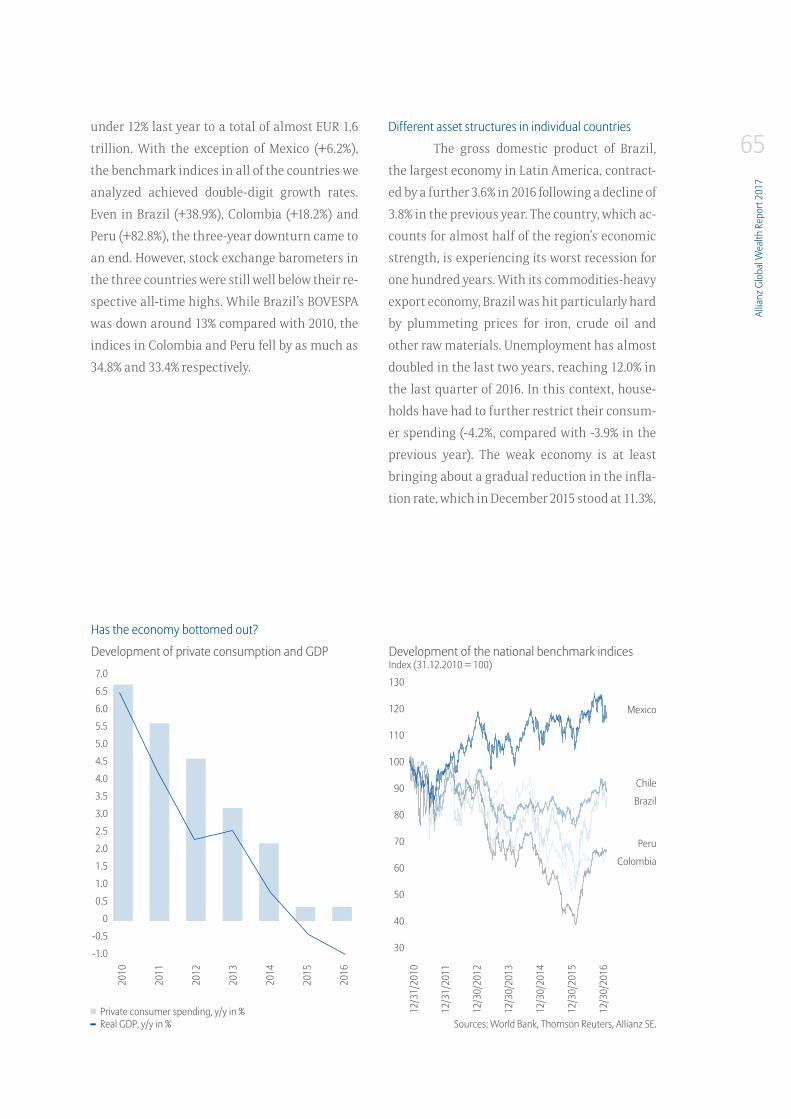
Allia
nz G
loba
l Wea
lth R
epor
t 201
7
65under 12% last year to a total of almost EUR 1.6
trillion. With the exception of Mexico (+6.2%),
the benchmark indices in all of the countries we
analyzed achieved double-digit growth rates.
Even in Brazil (+38.9%), Colombia (+18.2%) and
Peru (+82.8%), the three-year downturn came to
an end. However, stock exchange barometers in
the three countries were still well below their re-
spective all-time highs. While Brazil’s BOVESPA
was down around 13% compared with 2010, the
indices in Colombia and Peru fell by as much as
34.8% and 33.4% respectively.
Different asset structures in individual countries
The gross domestic product of Brazil,
the largest economy in Latin America, contract-
ed by a further 3.6% in 2016 following a decline of
3.8% in the previous year. The country, which ac-
counts for almost half of the region’s economic
strength, is experiencing its worst recession for
one hundred years. With its commodities-heavy
export economy, Brazil was hit particularly hard
by plummeting prices for iron, crude oil and
other raw materials. Unemployment has almost
doubled in the last two years, reaching 12.0% in
the last quarter of 2016. In this context, house-
holds have had to further restrict their consum-
er spending (-4.2%, compared with -3.9% in the
previous year). The weak economy is at least
bringing about a gradual reduction in the infla-
tion rate, which in December 2015 stood at 11.3%,
Development of private consumption and GDP Development of the national benchmark indices Index (31.12.2010 = 100)
Has the economy bottomed out?
Sources: World Bank, Thomson Reuters, Allianz SE.
Mexico
Chile
Colombia
Peru
Brazil
Private consumer spending, y/y in %Real GDP, y/y in %
130
120
110
100
90
80
70
60
50
40
30
2010
2011
2012
2013
2014
2015
2016
7.0
6.5
6.0
5.5
5.0
4.5
4.0
3.5
3.0
2.5
2.0
1.5
1.0
0.5
0
-0.5
-1.0
12/3
1/20
10
12/3
1/20
11
12/3
0/20
12
12/3
0/20
13
12/3
0/20
14
12/3
0/20
15
12/3
0/20
16
Regi
onal
diff
eren
ces .
Latin
Am
eric
a
66its highest level since 2003; the annual average
for 2016 came to 9.4%, although the rate dropped
as low as 6.6% during the course of the year.
The reaction on the stock markets to
the removal from office of President Rousseff
last year and to her successor Michael Temer’s
announcement of an agreement on reforms
was euphoric. Right at the top of the new gov-
ernment’s agenda was a reform of the generous
state pension system, with the aim of curbing
growing national debt. Private households,
which hold almost half their assets in the form
of shares, funds and other equity interests, have
also benefited from strong growth on the stock
markets. Securities holdings grew strongly by
an estimated 17%, while receivables from insur-
ance companies and pension funds also enjoyed
double-digit growth in the stock markets’ wake.
In contrast, bank deposits more or less stagnat-
ed for the second consecutive year, reflecting
the ongoing economic crisis. Brazilians’ total
savings nevertheless rose by about 12% to ap-
proximately EUR 1.7 trillion, representing about
half of all assets in the region.
Mexico, the region’s second-largest
country in terms of economic power, accounted
for a quarter of private financial assets in Latin
America at the end of 2016. Mexican households
are actually investing over 60% of their savings
in securities, holdings of which grew by 5.6% last
year. However, there has been a shift in the port-
folio towards secure investments such as bank
deposits and insurance policies and pensions
in the last few years. Before the outbreak of the
global financial crisis, securities accounted for
about 73% of the portfolio. Growth in bank de-
posits was the strongest of all the various asset
classes in 2016, increasing by about 13%. Total
assets of Mexican households rose by 7.6% year-
on-year.
Households in Argentina, Chile, Colom-
bia and Peru shared the remaining quarter of
the region’s financial assets and accounted for
just under 30% of the population of the countries
we analyzed. Asset growth in these countries in
2016 ranged from 5.9% in Chile to over 50% in Ar-
gentina. Although Argentina’s President Macri,
who was elected in 2015, has already implement-
ed market reforms, the economy is suffering due
to the weakness of Brazil, the country’s most im-
portant trading partner. Moreover, the removal
of exchange rate restrictions on the peso led to
massive losses in value, making imports more
expensive and driving already soaring inflation
rates up even further. The average inflation rate
for 2016 was 38%, which is gnawing at incomes
and private savings. Many households are seek-
ing refuge in safe foreign currencies in a bid to
preserve the value of their assets. Bank deposits
and cash are estimated to represent four-fifths
of the portfolio. In contrast, private retirement
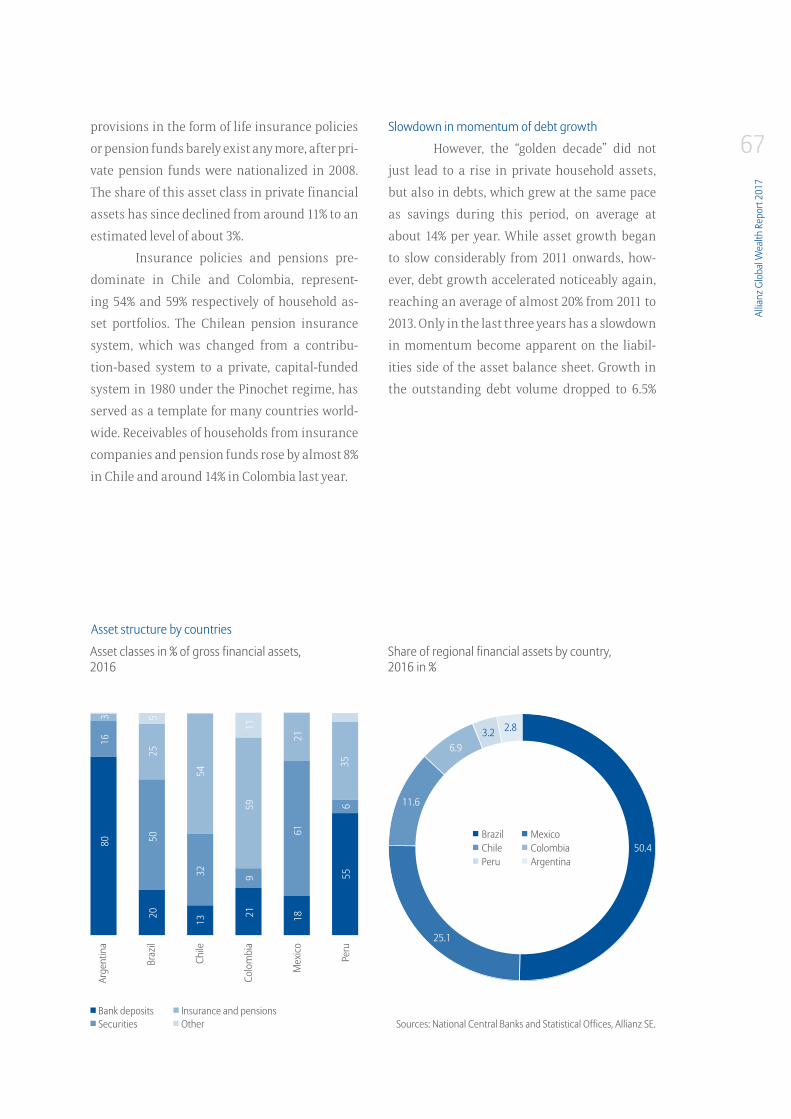
Allia
nz G
loba
l Wea
lth R
epor
t 201
7
67provisions in the form of life insurance policies
or pension funds barely exist any more, after pri-
vate pension funds were nationalized in 2008.
The share of this asset class in private financial
assets has since declined from around 11% to an
estimated level of about 3%.
Insurance policies and pensions pre-
dominate in Chile and Colombia, represent-
ing 54% and 59% respectively of household as-
set portfolios. The Chilean pension insurance
system, which was changed from a contribu-
tion-based system to a private, capital-funded
system in 1980 under the Pinochet regime, has
served as a template for many countries world-
wide. Receivables of households from insurance
companies and pension funds rose by almost 8%
in Chile and around 14% in Colombia last year.
Slowdown in momentum of debt growth
However, the “golden decade” did not
just lead to a rise in private household assets,
but also in debts, which grew at the same pace
as savings during this period, on average at
about 14% per year. While asset growth began
to slow considerably from 2011 onwards, how-
ever, debt growth accelerated noticeably again,
reaching an average of almost 20% from 2011 to
2013. Only in the last three years has a slowdown
in momentum become apparent on the liabil-
ities side of the asset balance sheet. Growth in
the outstanding debt volume dropped to 6.5%
Asset structure by countries
Asset classes in % of gross financial assets, 2016
Share of regional financial assets by country, 2016 in %
Sources: National Central Banks and Statistical Offices, Allianz SE.
Arge
ntin
a
Braz
il
Chile
Colo
mbi
a
Mex
ico
Peru
8016
3
2050
255
1332
54
219
5911
1861
21
556
35
50.4
25.1
11.6
6.93.2 2.8
Insurance and pensionsOther
Bank depositsSecurities
ChileBrazil Mexico
ColombiaPeru Argentina
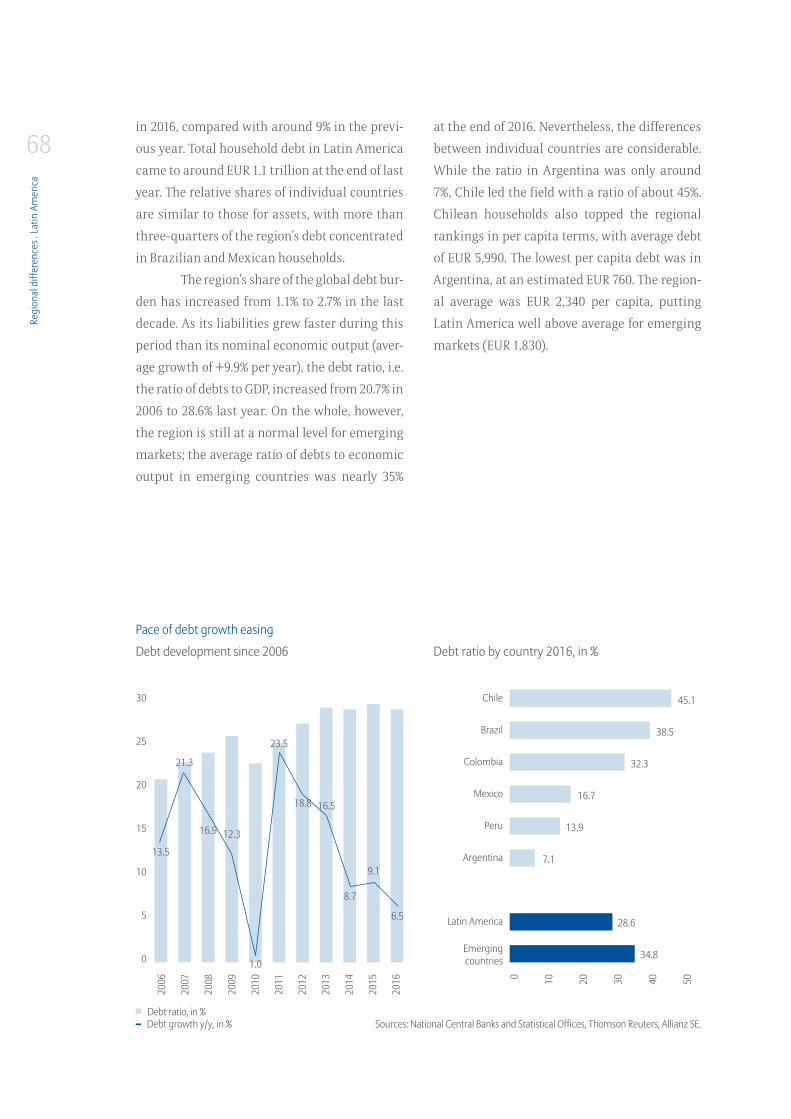
Regi
onal
diff
eren
ces .
Latin
Am
eric
a
68in 2016, compared with around 9% in the previ-
ous year. Total household debt in Latin America
came to around EUR 1.1 trillion at the end of last
year. The relative shares of individual countries
are similar to those for assets, with more than
three-quarters of the region’s debt concentrated
in Brazilian and Mexican households.
The region’s share of the global debt bur-
den has increased from 1.1% to 2.7% in the last
decade. As its liabilities grew faster during this
period than its nominal economic output (aver-
age growth of +9.9% per year), the debt ratio, i.e.
the ratio of debts to GDP, increased from 20.7% in
2006 to 28.6% last year. On the whole, however,
the region is still at a normal level for emerging
markets; the average ratio of debts to economic
output in emerging countries was nearly 35%
at the end of 2016. Nevertheless, the differences
between individual countries are considerable.
While the ratio in Argentina was only around
7%, Chile led the field with a ratio of about 45%.
Chilean households also topped the regional
rankings in per capita terms, with average debt
of EUR 5,990. The lowest per capita debt was in
Argentina, at an estimated EUR 760. The region-
al average was EUR 2,340 per capita, putting
Latin America well above average for emerging
markets (EUR 1,830).
Pace of debt growth easing
Debt development since 2006
Sources: National Central Banks and Statistical Offices, Thomson Reuters, Allianz SE.
Debt ratio by country 2016, in %
30
25
20
15
10
5
0
Debt growth y/y, in %Debt ratio, in %
2006
2007
2008
2009
2010
2011
2012
2013
2014
2015
2016
Chile
Brazil
Colombia
Mexico
Peru
Argentina
Latin America
0 10 20 30 40 50
13.5
21.3
12.3
1.0
23.5
8.7
9.1
45.1
38.5
32.3
7.1
28.6
34.8
16.7
13.9
6.5
Emerging countries
16.9
18.8 16.5
Allia
nz G
loba
l Wea
lth R
epor
t 201
7
69A growing wealth middle class – inequality remains a problem
Net per capita financial assets, i.e. all savings
minus debt, came to a regional average of EUR
4,910 last year. Chile is the only country in Lat-
in America in which average per capita house-
hold assets surpassed the middle wealth coun-
try (MWC) threshold of EUR 7,700. With average
assets of EUR 16,460 per capita, Chilean house-
holds were only one place behind Portugal and
25th in the global rankings. Even Mexico and
Brazil, where households had average per capita
assets of EUR 5,650 and EUR 4,980 respectively
at the end of 2016, are likely to take some years
to join the ranks of the MWCs. If net per capita
financial assets continue to grow on average as
they have done for the last decade (around 7% in
Mexico and about 12% in Brazil annually), Mex-
ico will not exceed the current threshold un-
til 2021, while Brazil will not pass it until 2020.
However, this threshold will have risen further
by then, in line with global asset development.
These two countries came 40th and 41st in an
international comparison and, together with
the rest of the countries in Latin America, they
were in the bottom quarter of the country rank-
ings.
The proportion of the region’s popula-
tion that belongs to the “middle wealth catego-
ry” in a global comparison (net per capita finan-
cial assets of between EUR 7,700 and EUR 45,900)
was around 13% at the end of 2016. That means
that approximately 64 million Latin Americans
belong to the global wealth middle class, com-
pared with an estimated total of about 29 million
at the start of the millennium. Just under 2 mil-
lion people had high net financial assets (more
than EUR 45,900 per capita) by global standards,
although these individuals accounted for only a
fraction of the overall population (0.4%) in 2016.
More than 86% of the population, and
thus the majority, still belongs to the lower
wealth class. This means that almost 412 mil-
lion Latin Americans had average assets of less
than EUR 7,700. It is also important to remember,
however, that currency losses make it more dif-
ficult for these countries to exceed the threshold
values, which are calculated in euros.
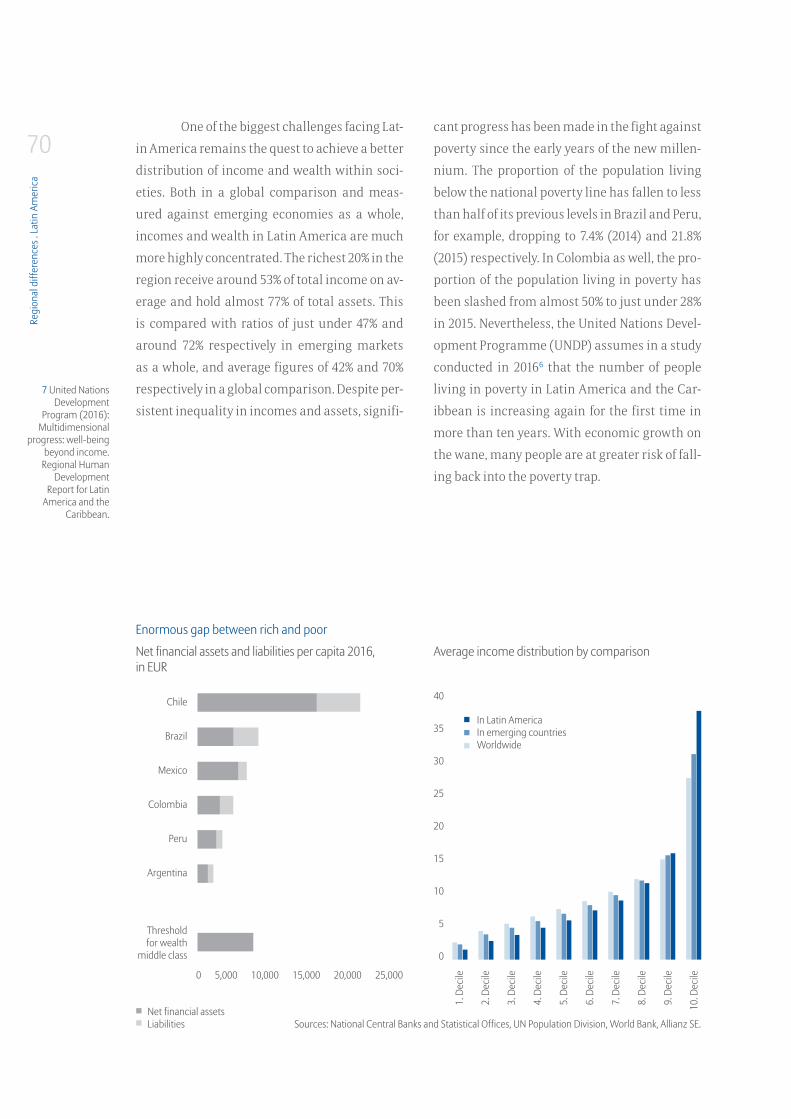
Regi
onal
diff
eren
ces .
Latin
Am
eric
a
70One of the biggest challenges facing Lat-
in America remains the quest to achieve a better
distribution of income and wealth within soci-
eties. Both in a global comparison and meas-
ured against emerging economies as a whole,
incomes and wealth in Latin America are much
more highly concentrated. The richest 20% in the
region receive around 53% of total income on av-
erage and hold almost 77% of total assets. This
is compared with ratios of just under 47% and
around 72% respectively in emerging markets
as a whole, and average figures of 42% and 70%
respectively in a global comparison. Despite per-
sistent inequality in incomes and assets, signifi-
cant progress has been made in the fight against
poverty since the early years of the new millen-
nium. The proportion of the population living
below the national poverty line has fallen to less
than half of its previous levels in Brazil and Peru,
for example, dropping to 7.4% (2014) and 21.8%
(2015) respectively. In Colombia as well, the pro-
portion of the population living in poverty has
been slashed from almost 50% to just under 28%
in 2015. Nevertheless, the United Nations Devel-
opment Programme (UNDP) assumes in a study
conducted in 20166 that the number of people
living in poverty in Latin America and the Car-
ibbean is increasing again for the first time in
more than ten years. With economic growth on
the wane, many people are at greater risk of fall-
ing back into the poverty trap.
7 United Nations Development
Program (2016): Multidimensional
progress: well-being beyond income.
Regional Human Development
Report for Latin America and the
Caribbean.
Net financial assets and liabilities per capita 2016, in EUR
Average income distribution by comparison
Enormous gap between rich and poor
Sources: National Central Banks and Statistical Offices, UN Population Division, World Bank, Allianz SE.
In Latin AmericaIn emerging countriesWorldwide
40
35
30
25
20
15
10
5
0
1. D
ecile
2. D
ecile
3. D
ecile
4. D
ecile
5. D
ecile
6. D
ecile
7. D
ecile
8. D
ecile
9. D
ecile
10. D
ecile
Net financial assetsLiabilities
Chile
Brazil
Mexico
Colombia
Peru
Argentina
Threshold for wealth
middle class
0 5,000 10,000 15,000 20,000 25,000

Allia
nz G
loba
l Wea
lth R
epor
t 201
7
71
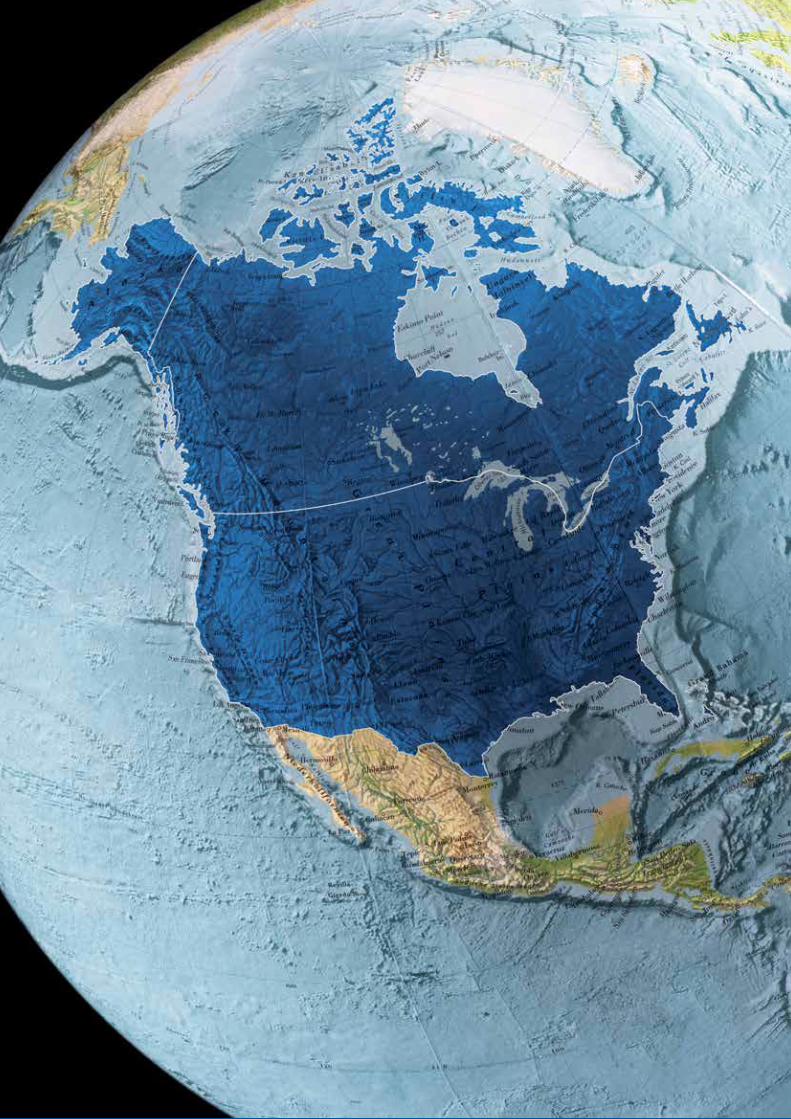
72
Vorwort . Zusammenfassung . Entwicklung des globalen Geldvermögens . Verteilung des globalen Geldvermögens . Regionale Unterschiede . Literatur . Appendix
72
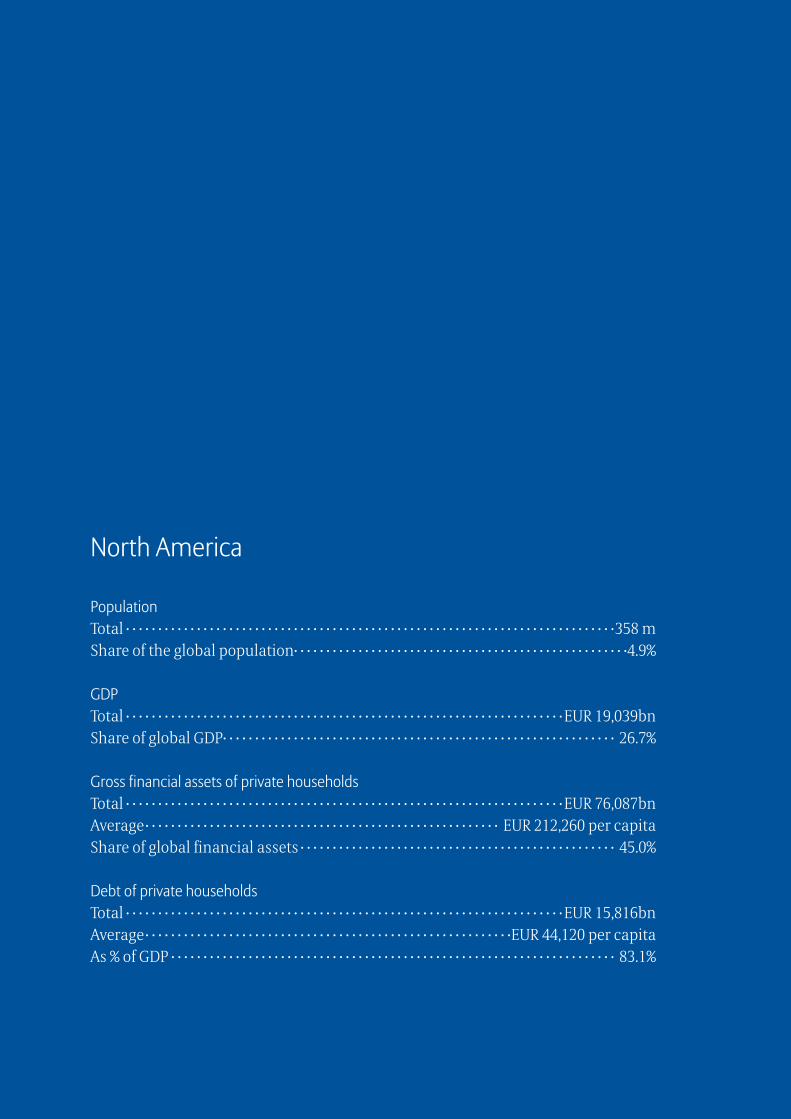
North America
PopulationTotal · · · · · · · · · · · · · · · · · · · · · · · · · · · · · · · · · · · · · · · · · · · · · · · · · · · · · · · · · · · · · · · · · · · · · · · · · · · ·358 mShare of the global population · · · · · · · · · · · · · · · · · · · · · · · · · · · · · · · · · · · · · · · · · · · · · · · · · · · ·4.9%
GDPTotal · · · · · · · · · · · · · · · · · · · · · · · · · · · · · · · · · · · · · · · · · · · · · · · · · · · · · · · · · · · · · · · · · · · · EUR 19,039bnShare of global GDP · · · · · · · · · · · · · · · · · · · · · · · · · · · · · · · · · · · · · · · · · · · · · · · · · · · · · · · · · · · · · 26.7%
Gross financial assets of private householdsTotal · · · · · · · · · · · · · · · · · · · · · · · · · · · · · · · · · · · · · · · · · · · · · · · · · · · · · · · · · · · · · · · · · · · · EUR 76,087bnAverage · · · · · · · · · · · · · · · · · · · · · · · · · · · · · · · · · · · · · · · · · · · · · · · · · · · · · · · EUR 212,260 per capitaShare of global financial assets · · · · · · · · · · · · · · · · · · · · · · · · · · · · · · · · · · · · · · · · · · · · · · · · · 45.0%
Debt of private householdsTotal · · · · · · · · · · · · · · · · · · · · · · · · · · · · · · · · · · · · · · · · · · · · · · · · · · · · · · · · · · · · · · · · · · · · EUR 15,816bnAverage · · · · · · · · · · · · · · · · · · · · · · · · · · · · · · · · · · · · · · · · · · · · · · · · · · · · · · · · ·EUR 44,120 per capitaAs % of GDP · · · · · · · · · · · · · · · · · · · · · · · · · · · · · · · · · · · · · · · · · · · · · · · · · · · · · · · · · · · · · · · · · · · · · 83.1%
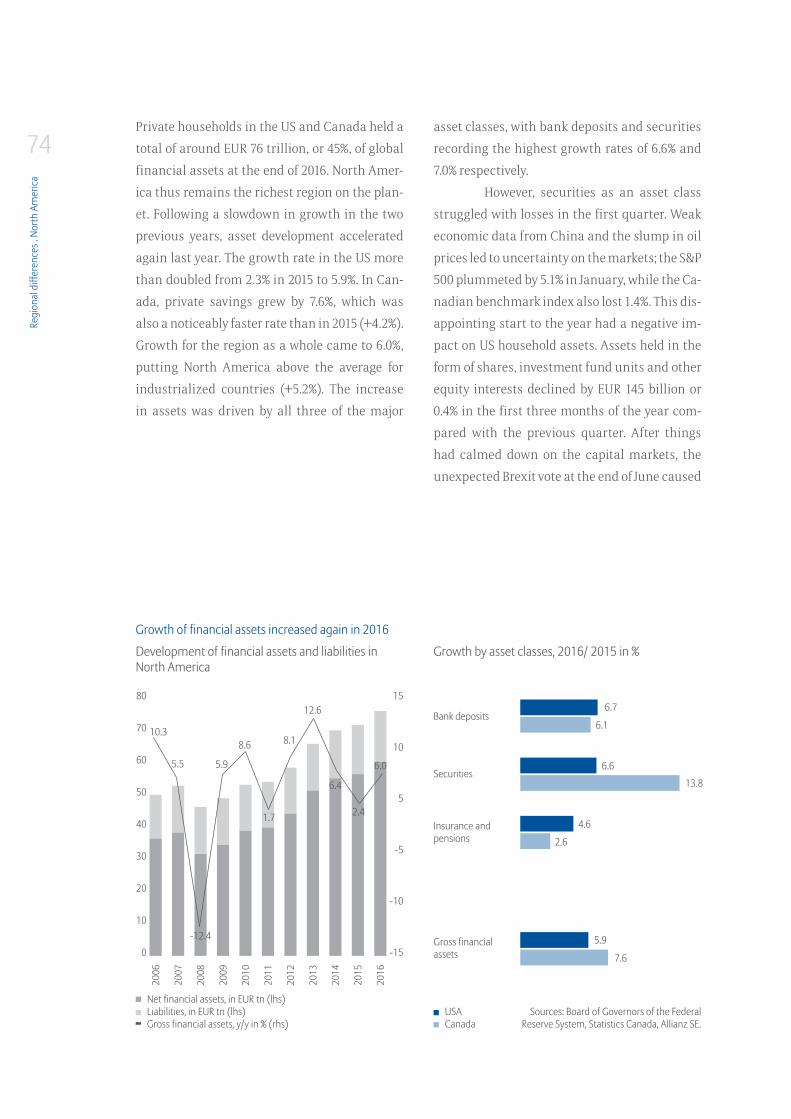
Regi
onal
diff
eren
ces .
Nor
th A
mer
ica
74Private households in the US and Canada held a
total of around EUR 76 trillion, or 45%, of global
financial assets at the end of 2016. North Amer-
ica thus remains the richest region on the plan-
et. Following a slowdown in growth in the two
previous years, asset development accelerated
again last year. The growth rate in the US more
than doubled from 2.3% in 2015 to 5.9%. In Can-
ada, private savings grew by 7.6%, which was
also a noticeably faster rate than in 2015 (+4.2%).
Growth for the region as a whole came to 6.0%,
putting North America above the average for
industrialized countries (+5.2%). The increase
in assets was driven by all three of the major
asset classes, with bank deposits and securities
recording the highest growth rates of 6.6% and
7.0% respectively.
However, securities as an asset class
struggled with losses in the first quarter. Weak
economic data from China and the slump in oil
prices led to uncertainty on the markets; the S&P
500 plummeted by 5.1% in January, while the Ca-
nadian benchmark index also lost 1.4%. This dis-
appointing start to the year had a negative im-
pact on US household assets. Assets held in the
form of shares, investment fund units and other
equity interests declined by EUR 145 billion or
0.4% in the first three months of the year com-
pared with the previous quarter. After things
had calmed down on the capital markets, the
unexpected Brexit vote at the end of June caused
80
70
60
50
40
30
20
10
0
15
10
5
-5
-10
-15
Growth of financial assets increased again in 2016
2006
2007
2008
2009
2010
2011
2012
2013
2014
2015
2016
Sources: Board of Governors of the Federal Reserve System, Statistics Canada, Allianz SE.
Net financial assets, in EUR tn (lhs)Liabilities, in EUR tn (lhs)Gross financial assets, y/y in % (rhs)
USACanada
Development of financial assets and liabilities in North America
Growth by asset classes, 2016/ 2015 in %
Securities
Gross financial assets
6.7
6.1
6.6
13.8
4.6
2.6
5.9
7.6
Insurance and pensions
Bank deposits10.3
5.5 5.9
8.6
1.7
8.1
12.6
6.4
2.4
6.0
-12.4
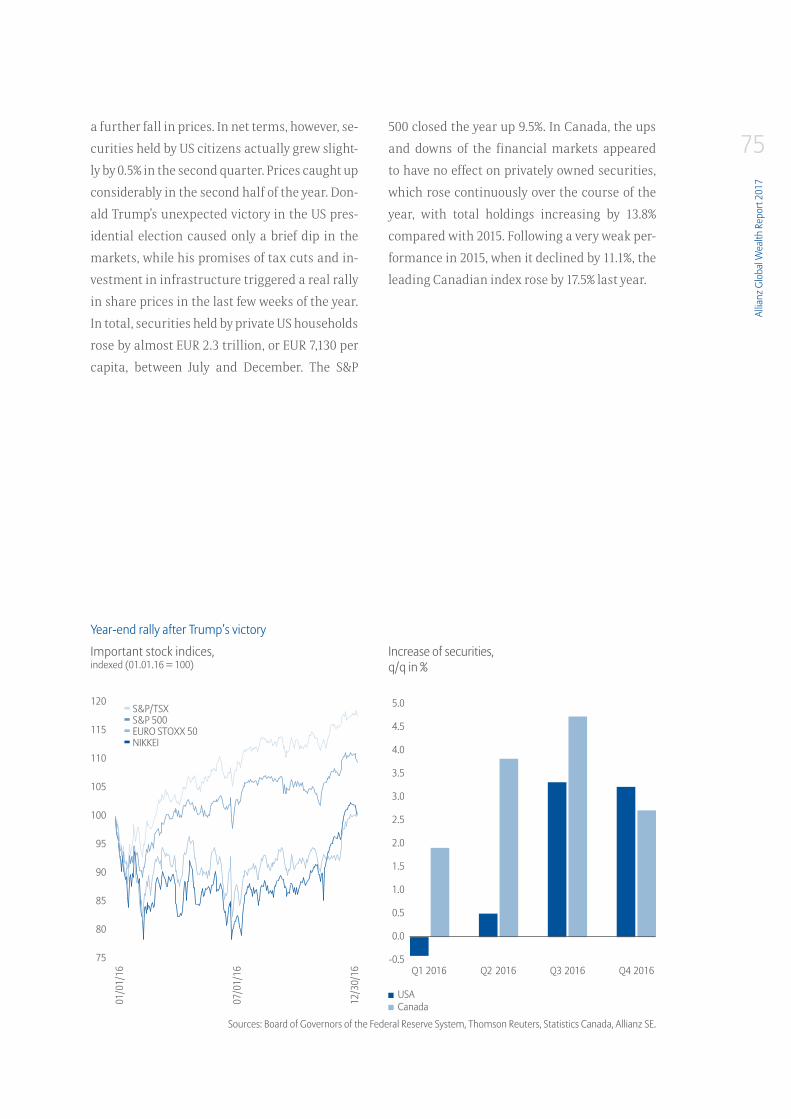
Allia
nz G
loba
l Wea
lth R
epor
t 201
7
75a further fall in prices. In net terms, however, se-
curities held by US citizens actually grew slight-
ly by 0.5% in the second quarter. Prices caught up
considerably in the second half of the year. Don-
ald Trump’s unexpected victory in the US pres-
idential election caused only a brief dip in the
markets, while his promises of tax cuts and in-
vestment in infrastructure triggered a real rally
in share prices in the last few weeks of the year.
In total, securities held by private US households
rose by almost EUR 2.3 trillion, or EUR 7,130 per
capita, between July and December. The S&P
500 closed the year up 9.5%. In Canada, the ups
and downs of the financial markets appeared
to have no effect on privately owned securities,
which rose continuously over the course of the
year, with total holdings increasing by 13.8%
compared with 2015. Following a very weak per-
formance in 2015, when it declined by 11.1%, the
leading Canadian index rose by 17.5% last year.
USACanada
Important stock indices, indexed (01.01.16 = 100)
Increase of securities, q/q in %
Year-end rally after Trump’s victory
Sources: Board of Governors of the Federal Reserve System, Thomson Reuters, Statistics Canada, Allianz SE.
01/0
1/16
07/0
1/16
12/3
0/16
120
115
110
105
100
95
90
85
80
75
5.0
4.5
4.0
3.5
3.0
2.5
2.0
1.5
1.0
0.5
0.0
-0.5Q1 2016 Q2 2016 Q3 2016 Q4 2016
S&P 500
NIKKEI
S&P/TSX
EURO STOXX 50
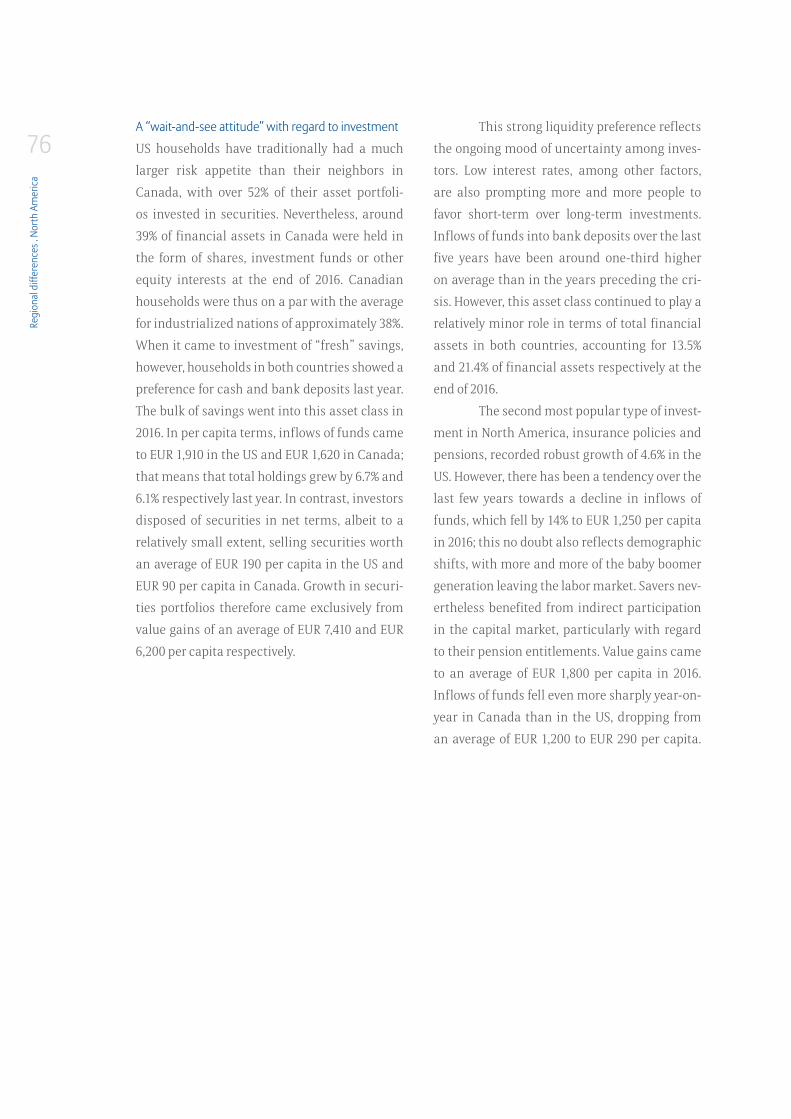
Regi
onal
diff
eren
ces .
Nor
th A
mer
ica
76A “wait-and-see attitude” with regard to investment
US households have traditionally had a much
larger risk appetite than their neighbors in
Canada, with over 52% of their asset portfoli-
os invested in securities. Nevertheless, around
39% of financial assets in Canada were held in
the form of shares, investment funds or other
equity interests at the end of 2016. Canadian
households were thus on a par with the average
for industrialized nations of approximately 38%.
When it came to investment of “fresh” savings,
however, households in both countries showed a
preference for cash and bank deposits last year.
The bulk of savings went into this asset class in
2016. In per capita terms, inflows of funds came
to EUR 1,910 in the US and EUR 1,620 in Canada;
that means that total holdings grew by 6.7% and
6.1% respectively last year. In contrast, investors
disposed of securities in net terms, albeit to a
relatively small extent, selling securities worth
an average of EUR 190 per capita in the US and
EUR 90 per capita in Canada. Growth in securi-
ties portfolios therefore came exclusively from
value gains of an average of EUR 7,410 and EUR
6,200 per capita respectively.
This strong liquidity preference reflects
the ongoing mood of uncertainty among inves-
tors. Low interest rates, among other factors,
are also prompting more and more people to
favor short-term over long-term investments.
Inflows of funds into bank deposits over the last
five years have been around one-third higher
on average than in the years preceding the cri-
sis. However, this asset class continued to play a
relatively minor role in terms of total financial
assets in both countries, accounting for 13.5%
and 21.4% of financial assets respectively at the
end of 2016.
The second most popular type of invest-
ment in North America, insurance policies and
pensions, recorded robust growth of 4.6% in the
US. However, there has been a tendency over the
last few years towards a decline in inflows of
funds, which fell by 14% to EUR 1,250 per capita
in 2016; this no doubt also reflects demographic
shifts, with more and more of the baby boomer
generation leaving the labor market. Savers nev-
ertheless benefited from indirect participation
in the capital market, particularly with regard
to their pension entitlements. Value gains came
to an average of EUR 1,800 per capita in 2016.
Inflows of funds fell even more sharply year-on-
year in Canada than in the US, dropping from
an average of EUR 1,200 to EUR 290 per capita.
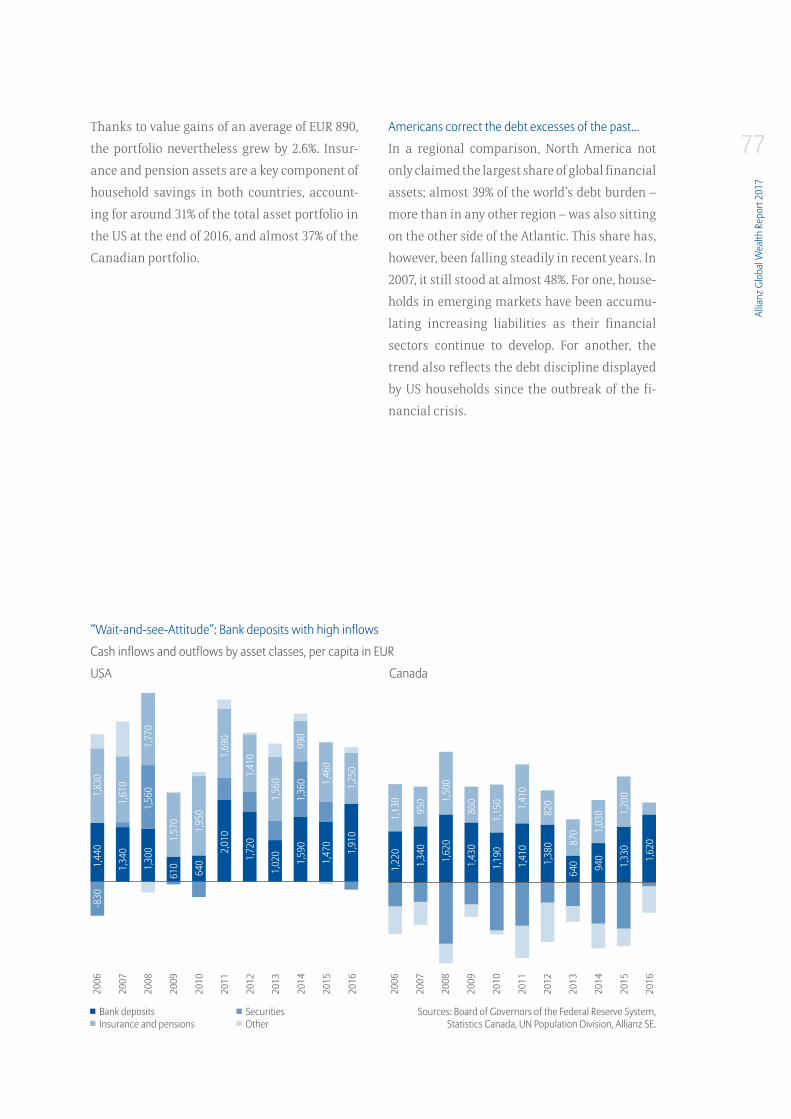
Allia
nz G
loba
l Wea
lth R
epor
t 201
7
77Thanks to value gains of an average of EUR 890,
the portfolio nevertheless grew by 2.6%. Insur-
ance and pension assets are a key component of
household savings in both countries, account-
ing for around 31% of the total asset portfolio in
the US at the end of 2016, and almost 37% of the
Canadian portfolio.
Americans correct the debt excesses of the past...
In a regional comparison, North America not
only claimed the largest share of global financial
assets; almost 39% of the world’s debt burden –
more than in any other region – was also sitting
on the other side of the Atlantic. This share has,
however, been falling steadily in recent years. In
2007, it still stood at almost 48%. For one, house-
holds in emerging markets have been accumu-
lating increasing liabilities as their financial
sectors continue to develop. For another, the
trend also reflects the debt discipline displayed
by US households since the outbreak of the fi-
nancial crisis. 20
06
2007
2008
2009
2010
2011
2012
2013
2014
2015
2016
2006
2007
2008
2009
2010
2011
2012
2013
2014
2015
2016
Cash inflows and outflows by asset classes, per capita in EUR
“Wait-and-see-Attitude”: Bank deposits with high inflows
Sources: Board of Governors of the Federal Reserve System, Statistics Canada, UN Population Division, Allianz SE.
USA Canada
1,22
0
1,34
0
860
1,15
0 1,41
0
820
870
1,20
01,
330
1,62
0
1,03
094
01,38
0
6401,
410
1,43
0
1,19
0
1,50
01,
620
1,13
0
950
SecuritiesOther
Bank depositsInsurance and pensions
-830
1,44
0
1,34
0
1,77
0
1,57
0
1,95
0
1,69
0
1,41
0
1,56
0
990
1,46
01,
470
1,25
01,
910
1,36
01,
590
1,72
0
1,02
02,01
0
610
640
1,56
01,
300
1,83
0
1,61
0
Regi
onal
diff
eren
ces .
Nor
th A
mer
ica
78The years before the crisis erupted were
characterized by what was, at times, double-dig-
it growth in the US personal debt burden, push-
ing the ratio of liabilities to disposable incomes
up from 99.4% in 2000 to a historic high of 137.3%
seven years later. In 2008, households started to
borrow less in an attempt to tidy up their asset
balance sheets. In the period leading up to 2011
they reduced their liabilities, shaving about 21
percentage points off the debt ratio in the space
of these four years alone, which was whittled
down to 116.4% of disposable income. Although
debt growth has moved back into positive terri-
tory since 2012, it has remained below the level
of growth in disposable incomes (+3.5% per year
on average) at an average of 2.0% per year, thanks
to the improved situation on the labor market.
This means that the ratio of liabilities to dispos-
able incomes has fallen by a further 8.3 percent-
age points to 107.8%. In per capita terms, liabil-
ities edged up by 2.4% last year to an average of
EUR 44,480, putting them at about the same lev-
el as in 2006 (average of EUR 44,820 per capita).
A combination of historically low interest rates
and a moderate increase in both employment
and incomes has so far made it easier for many
households to pay back their debt. The debt ser-
vice ratio, i.e. the ratio of capital and interest
repayments to disposable income, has fallen
to an all-time low in recent years, coming in at
10.0% at the end of 2016; the all-time high over
the past 30 years (13.2%) was reached at the end
of 2007. The delinquency rate is also on the way
down and fell to 4.8% in the last quarter of 2016,
less than half the peak of 11.9% that it reached at
the end of 2009. This means that it has almost re-
turned to its pre-crisis level of 4.7% (end of 2006).
All in all, the household sector has corrected the
excessive debt behavior it displayed in the boom
years and pushed its liabilities back down to the
historical average.
... while debts in Canada are reaching dangerous levels
The debt situation in Canada is much more
precarious than in the US. The outbreak of the
financial crisis at least helped to curb the coun-
try’s debt growth, bringing the average annual
growth rate down to just under 6%, compared
with around 9% in the years prior to the crisis.
However, liabilities in Canada rose by 5.1% last
year compared with 2015, which was not only
much faster growth than in the US (+3.2%), but
also faster than growth in disposable incomes
(+3.7%). In relation to disposable incomes, the
debt ratio has been constantly on the rise, climb-
ing from 107.4% in 2000 to 168.3% last year – put-
ting it about 60 percentage points ahead of the
Allia
nz G
loba
l Wea
lth R
epor
t 201
7
79US level. Per capita debt is climbing to new re-
cord highs year in, year out, and came to an aver-
age of EUR 40,920 at the end of 2016. This means
that the risk of the Canadian financial system
running into difficulties due to the growing debt
burden in the household sector has increased
significantly over the last few years. This is due
not only to the absolute debt level, but also to the
way in which debt is distributed: liabilities are
becoming increasingly concentrated on high-
ly-indebted households whose ability to service
their loans in the event of an economic slump
could be at particular risk. The situation is only
exacerbated further by the surge in house prices
in the greater Vancouver and Toronto regions.
Mortgage loan growth is rising in tandem with
house prices, once again increasing the propor-
tion of highly-indebted households. In addition,
more and more investors from emerging coun-
tries, especially China, are discovering this mar-
ket in their search for safe investment oppor-
tunities for their savings. The city of Vancouver
has responded by introducing a tax of 15% on
the price of houses purchased by foreign inves-
tors. Although the property market in Vancouver
has cooled down slightly, demand has shifted to
other cities such as Victoria and Toronto, where
house price inflation is over 30%. In its latest
report on the stability of the financial system,
the Bank of Canada describes the phenomenon
of “extrapolative expectations”. It says that the
recent particularly strong growth in house pric-
es in the greater Toronto area can no longer be
explained by fundamental data alone; instead
buyers are acquiring property partly because
they are expecting – or fearing – a further rise
in prices. One indication of this, according to
the central bank, is that prices have risen much
faster than rents in recent years and that rental
returns have actually been negative after deduc-
tion of costs.
The Canadian central bank has for a
long time been observing the growing debt bur-
den of the household sector with great concern,
and has described it as one of the biggest risks
to the financial system. The regulator has there-
fore been attempting for some time to counter-
act this with macroprudential measures. In Feb-
ruary 2016, the financial supervisory authority
set out more stringent capital requirements for
loans backed by a residential property, the aim
being to restrict lending to households with
high credit ratings. Furthermore, the federal
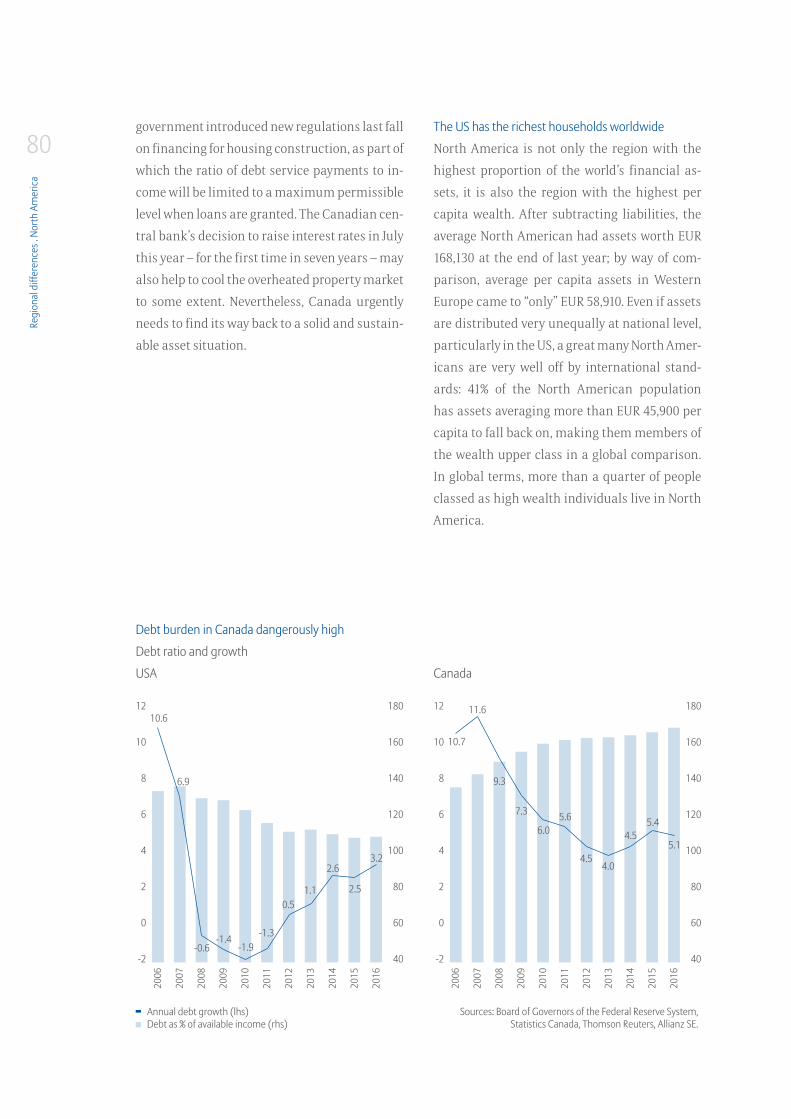
Regi
onal
diff
eren
ces .
Nor
th A
mer
ica
80government introduced new regulations last fall
on financing for housing construction, as part of
which the ratio of debt service payments to in-
come will be limited to a maximum permissible
level when loans are granted. The Canadian cen-
tral bank’s decision to raise interest rates in July
this year – for the first time in seven years – may
also help to cool the overheated property market
to some extent. Nevertheless, Canada urgently
needs to find its way back to a solid and sustain-
able asset situation.
The US has the richest households worldwide
North America is not only the region with the
highest proportion of the world’s financial as-
sets, it is also the region with the highest per
capita wealth. After subtracting liabilities, the
average North American had assets worth EUR
168,130 at the end of last year; by way of com-
parison, average per capita assets in Western
Europe came to “only” EUR 58,910. Even if assets
are distributed very unequally at national level,
particularly in the US, a great many North Amer-
icans are very well off by international stand-
ards: 41% of the North American population
has assets averaging more than EUR 45,900 per
capita to fall back on, making them members of
the wealth upper class in a global comparison.
In global terms, more than a quarter of people
classed as high wealth individuals live in North
America.
Debt burden in Canada dangerously high
Debt ratio and growth
Sources: Board of Governors of the Federal Reserve System, Statistics Canada, Thomson Reuters, Allianz SE.
USA Canada
2006
2007
2008
2009
2010
2011
2012
2013
2014
2015
2016
2006
2007
2008
2009
2010
2011
2012
2013
2014
2015
2016
12
10
8
6
4
2
0
-2
12
10
8
6
4
2
0
-2
180
160
140
120
100
80
60
40
180
160
140
120
100
80
60
40
Annual debt growth (lhs)Debt as % of available income (rhs)
10.6
10.7
6.9
11.6
-0.6
9.3
-1.4
7.3
-1.9
6.0
-1.3
5.6
0.5
4.5
1.1
4.02.6
4.5
2.5
5.4
3.25.1
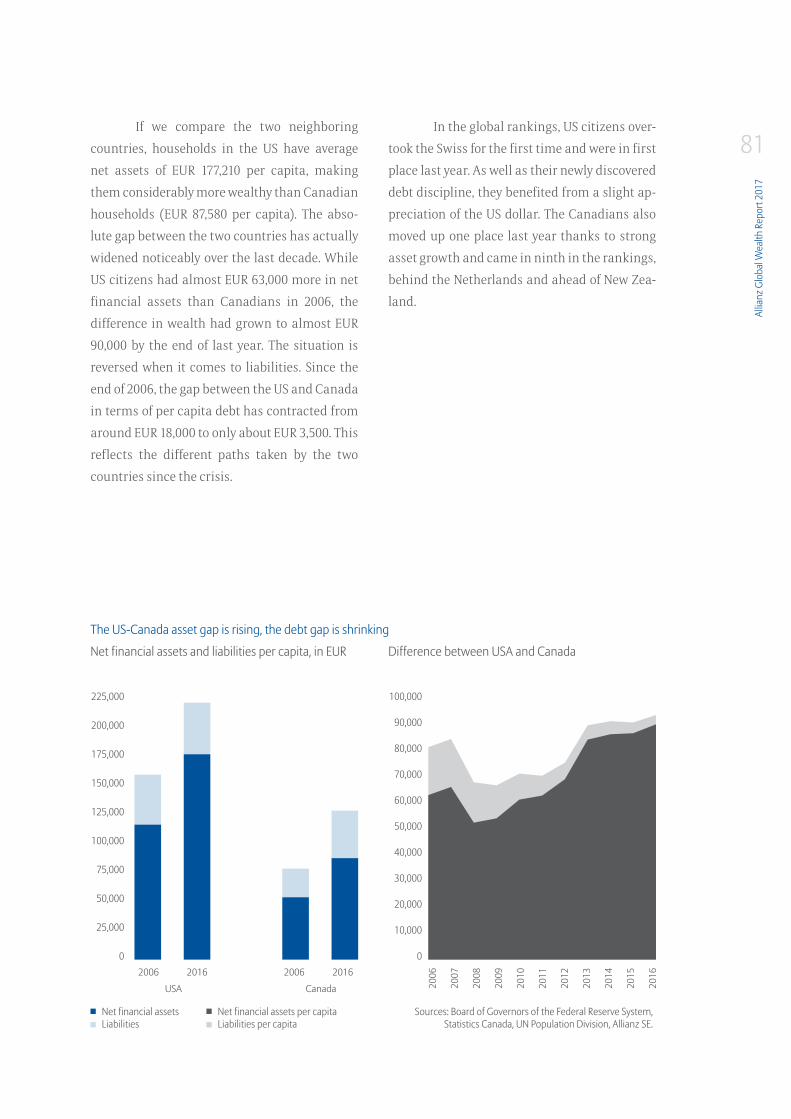
Allia
nz G
loba
l Wea
lth R
epor
t 201
7
81If we compare the two neighboring
countries, households in the US have average
net assets of EUR 177,210 per capita, making
them considerably more wealthy than Canadian
households (EUR 87,580 per capita). The abso-
lute gap between the two countries has actually
widened noticeably over the last decade. While
US citizens had almost EUR 63,000 more in net
financial assets than Canadians in 2006, the
difference in wealth had grown to almost EUR
90,000 by the end of last year. The situation is
reversed when it comes to liabilities. Since the
end of 2006, the gap between the US and Canada
in terms of per capita debt has contracted from
around EUR 18,000 to only about EUR 3,500. This
reflects the different paths taken by the two
countries since the crisis.
In the global rankings, US citizens over-
took the Swiss for the first time and were in first
place last year. As well as their newly discovered
debt discipline, they benefited from a slight ap-
preciation of the US dollar. The Canadians also
moved up one place last year thanks to strong
asset growth and came in ninth in the rankings,
behind the Netherlands and ahead of New Zea-
land.
The US-Canada asset gap is rising, the debt gap is shrinking
Sources: Board of Governors of the Federal Reserve System, Statistics Canada, UN Population Division, Allianz SE.
Net financial assets and liabilities per capita, in EUR Difference between USA and Canada
2006 2016 2006 2016
USA Canada 2006
2007
2008
2009
2010
2011
2012
2013
2014
2015
2016
Net financial assetsLiabilities
Net financial assets per capitaLiabilities per capita
225,000
200,000
175,000
150,000
125,000
100,000
75,000
50,000
25,000
0
100,000
90,000
80,000
70,000
60,000
50,000
40,000
30,000
20,000
10,000
0
82
Vorwort . Zusammenfassung . Entwicklung des globalen Geldvermögens . Verteilung des globalen Geldvermögens . Regionale Unterschiede . Literatur . Appendix
82
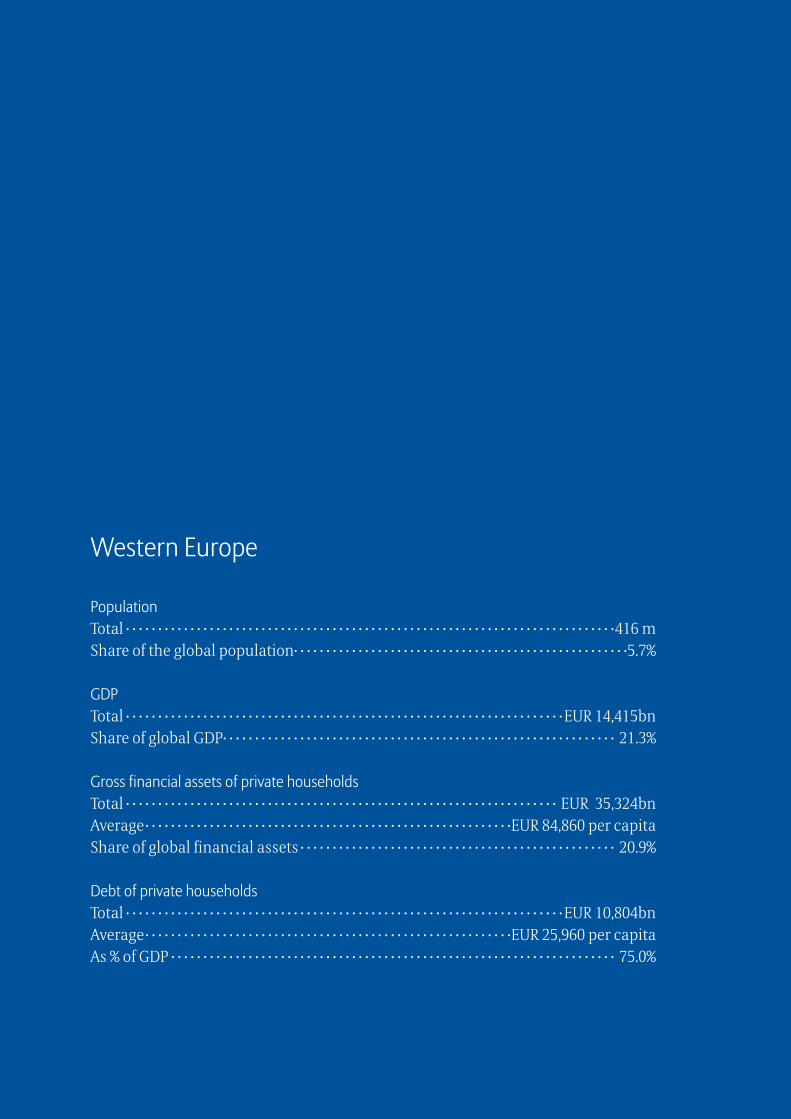
Western Europe
PopulationTotal · · · · · · · · · · · · · · · · · · · · · · · · · · · · · · · · · · · · · · · · · · · · · · · · · · · · · · · · · · · · · · · · · · · · · · · · · · · ·416 mShare of the global population · · · · · · · · · · · · · · · · · · · · · · · · · · · · · · · · · · · · · · · · · · · · · · · · · · · ·5.7%
GDPTotal · · · · · · · · · · · · · · · · · · · · · · · · · · · · · · · · · · · · · · · · · · · · · · · · · · · · · · · · · · · · · · · · · · · · EUR 14,415bnShare of global GDP · · · · · · · · · · · · · · · · · · · · · · · · · · · · · · · · · · · · · · · · · · · · · · · · · · · · · · · · · · · · · 21.3%
Gross financial assets of private householdsTotal · · · · · · · · · · · · · · · · · · · · · · · · · · · · · · · · · · · · · · · · · · · · · · · · · · · · · · · · · · · · · · · · · · · EUR 35,324bnAverage · · · · · · · · · · · · · · · · · · · · · · · · · · · · · · · · · · · · · · · · · · · · · · · · · · · · · · · · ·EUR 84,860 per capitaShare of global financial assets · · · · · · · · · · · · · · · · · · · · · · · · · · · · · · · · · · · · · · · · · · · · · · · · · 20.9%
Debt of private householdsTotal · · · · · · · · · · · · · · · · · · · · · · · · · · · · · · · · · · · · · · · · · · · · · · · · · · · · · · · · · · · · · · · · · · · · EUR 10,804bnAverage · · · · · · · · · · · · · · · · · · · · · · · · · · · · · · · · · · · · · · · · · · · · · · · · · · · · · · · · ·EUR 25,960 per capitaAs % of GDP · · · · · · · · · · · · · · · · · · · · · · · · · · · · · · · · · · · · · · · · · · · · · · · · · · · · · · · · · · · · · · · · · · · · · 75.0%
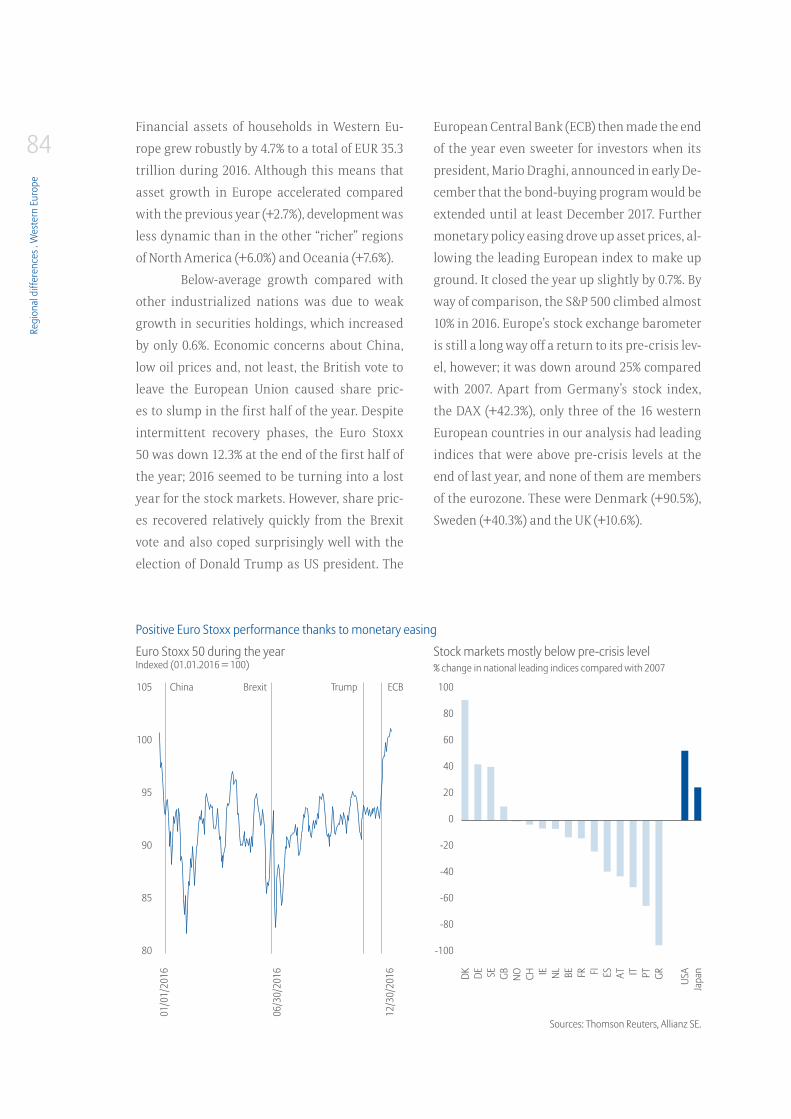
Regi
onal
diff
eren
ces .
Wes
tern
Eur
ope
84Financial assets of households in Western Eu-
rope grew robustly by 4.7% to a total of EUR 35.3
trillion during 2016. Although this means that
asset growth in Europe accelerated compared
with the previous year (+2.7%), development was
less dynamic than in the other “richer” regions
of North America (+6.0%) and Oceania (+7.6%).
Below-average growth compared with
other industrialized nations was due to weak
growth in securities holdings, which increased
by only 0.6%. Economic concerns about China,
low oil prices and, not least, the British vote to
leave the European Union caused share pric-
es to slump in the first half of the year. Despite
intermittent recovery phases, the Euro Stoxx
50 was down 12.3% at the end of the first half of
the year; 2016 seemed to be turning into a lost
year for the stock markets. However, share pric-
es recovered relatively quickly from the Brexit
vote and also coped surprisingly well with the
election of Donald Trump as US president. The
European Central Bank (ECB) then made the end
of the year even sweeter for investors when its
president, Mario Draghi, announced in early De-
cember that the bond-buying program would be
extended until at least December 2017. Further
monetary policy easing drove up asset prices, al-
lowing the leading European index to make up
ground. It closed the year up slightly by 0.7%. By
way of comparison, the S&P 500 climbed almost
10% in 2016. Europe’s stock exchange barometer
is still a long way off a return to its pre-crisis lev-
el, however; it was down around 25% compared
with 2007. Apart from Germany’s stock index,
the DAX (+42.3%), only three of the 16 western
European countries in our analysis had leading
indices that were above pre-crisis levels at the
end of last year, and none of them are members
of the eurozone. These were Denmark (+90.5%),
Sweden (+40.3%) and the UK (+10.6%).
Euro Stoxx 50 during the year Indexed (01.01.2016 = 100)
Stock markets mostly below pre-crisis level % change in national leading indices compared with 2007
Positive Euro Stoxx performance thanks to monetary easing
Sources: Thomson Reuters, Allianz SE.
100
80
60
40
20
0
-20
-40
-60
-80
-100
105
100
95
90
85
80
01/0
1/20
16
06/3
0/20
16
12/3
0/20
16
China Brexit Trump ECB
DK DE SE GB NO CH IE NL BE FR FI ES AT IT PT GR USA
Japa
n
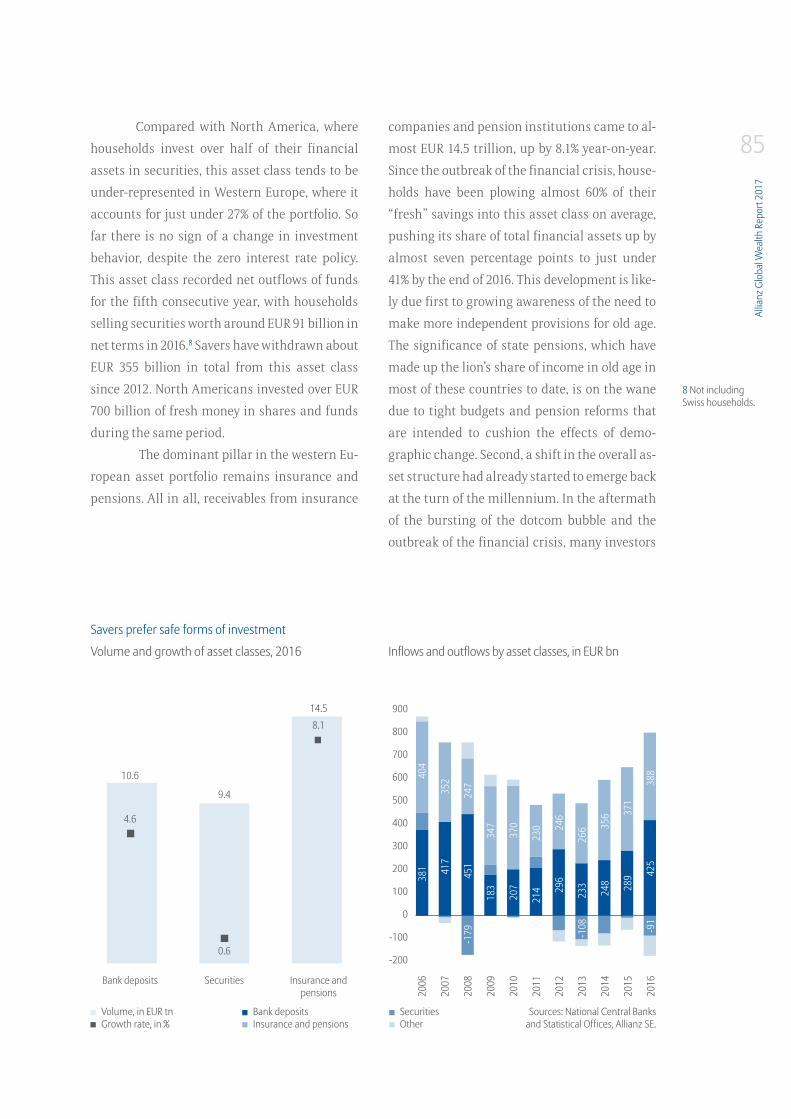
Allia
nz G
loba
l Wea
lth R
epor
t 201
7
85Compared with North America, where
households invest over half of their financial
assets in securities, this asset class tends to be
under-represented in Western Europe, where it
accounts for just under 27% of the portfolio. So
far there is no sign of a change in investment
behavior, despite the zero interest rate policy.
This asset class recorded net outflows of funds
for the fifth consecutive year, with households
selling securities worth around EUR 91 billion in
net terms in 2016.8 Savers have withdrawn about
EUR 355 billion in total from this asset class
since 2012. North Americans invested over EUR
700 billion of fresh money in shares and funds
during the same period.
The dominant pillar in the western Eu-
ropean asset portfolio remains insurance and
pensions. All in all, receivables from insurance
companies and pension institutions came to al-
most EUR 14.5 trillion, up by 8.1% year-on-year.
Since the outbreak of the financial crisis, house-
holds have been plowing almost 60% of their
“fresh” savings into this asset class on average,
pushing its share of total financial assets up by
almost seven percentage points to just under
41% by the end of 2016. This development is like-
ly due first to growing awareness of the need to
make more independent provisions for old age.
The significance of state pensions, which have
made up the lion’s share of income in old age in
most of these countries to date, is on the wane
due to tight budgets and pension reforms that
are intended to cushion the effects of demo-
graphic change. Second, a shift in the overall as-
set structure had already started to emerge back
at the turn of the millennium. In the aftermath
of the bursting of the dotcom bubble and the
outbreak of the financial crisis, many investors
Inflows and outflows by asset classes, in EUR bn
Sources: National Central Banks and Statistical Offices, Allianz SE.
Volume and growth of asset classes, 2016
Savers prefer safe forms of investment
900
800
700
600
500
400
300
200
100
0
-100
-200
Bank deposits
10.6
4.6
Securities
9.4
0.6
Insurance and pensions
14.5
8.1
2006
2007
2008
2009
2010
2011
2012
2013
2014
2015
2016
381
404
352
417
247
451
-179
347
183
370
207
230
214
246
296
266
233
-108
356
248
371
289
388
425
-91
SecuritiesOther
Bank depositsInsurance and pensions
Volume, in EUR tnGrowth rate, in %
8 Not including Swiss households.
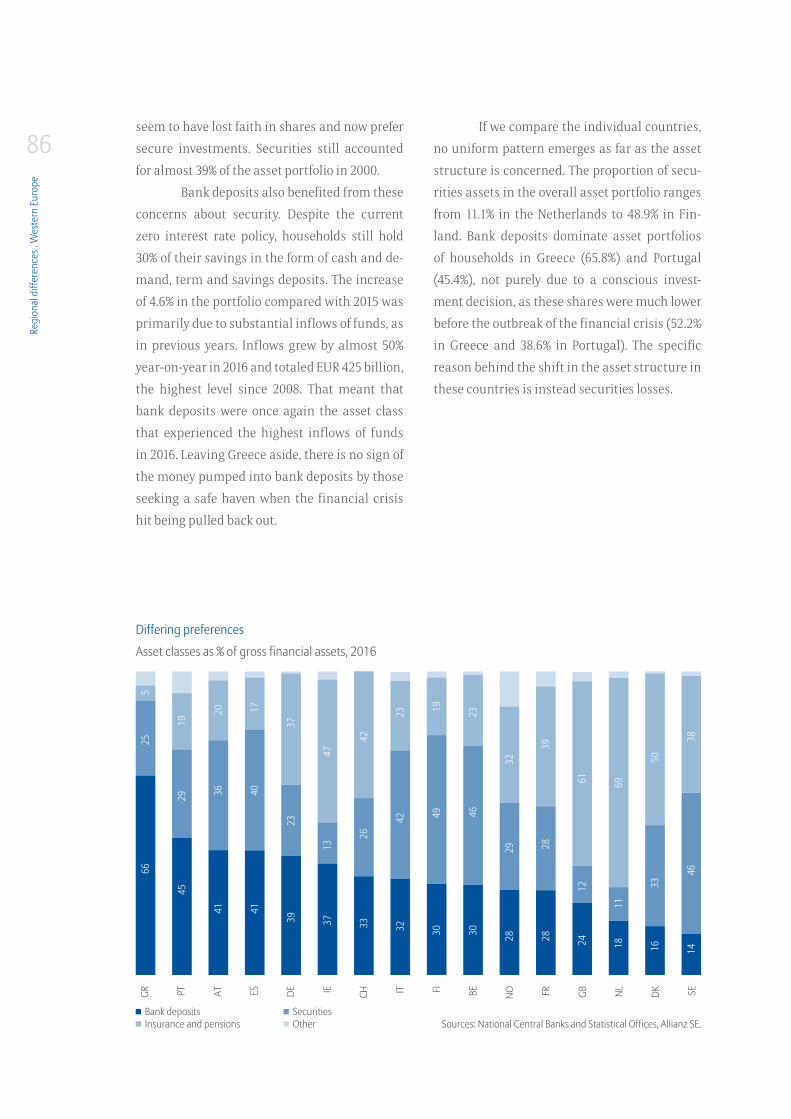
Regi
onal
diff
eren
ces .
Wes
tern
Eur
ope
86seem to have lost faith in shares and now prefer
secure investments. Securities still accounted
for almost 39% of the asset portfolio in 2000.
Bank deposits also benefited from these
concerns about security. Despite the current
zero interest rate policy, households still hold
30% of their savings in the form of cash and de-
mand, term and savings deposits. The increase
of 4.6% in the portfolio compared with 2015 was
primarily due to substantial inflows of funds, as
in previous years. Inflows grew by almost 50%
year-on-year in 2016 and totaled EUR 425 billion,
the highest level since 2008. That meant that
bank deposits were once again the asset class
that experienced the highest inflows of funds
in 2016. Leaving Greece aside, there is no sign of
the money pumped into bank deposits by those
seeking a safe haven when the financial crisis
hit being pulled back out.
If we compare the individual countries,
no uniform pattern emerges as far as the asset
structure is concerned. The proportion of secu-
rities assets in the overall asset portfolio ranges
from 11.1% in the Netherlands to 48.9% in Fin-
land. Bank deposits dominate asset portfolios
of households in Greece (65.8%) and Portugal
(45.4%), not purely due to a conscious invest-
ment decision, as these shares were much lower
before the outbreak of the financial crisis (52.2%
in Greece and 38.6% in Portugal). The specific
reason behind the shift in the asset structure in
these countries is instead securities losses.
Asset classes as % of gross financial assets, 2016
Differing preferences
Sources: National Central Banks and Statistical Offices, Allianz SE.
GR PT AT ES DE IE CH IT FI BE NO FR GB NL DK SE
4519
4120
3937
4117
3747
3342
3223
3019
3023
2832
2839
2461
1869
1650
1438
665
25
29 36 40
23
13
26
42 49 46
29 28
12
11
33
46
SecuritiesOther
Bank depositsInsurance and pensions
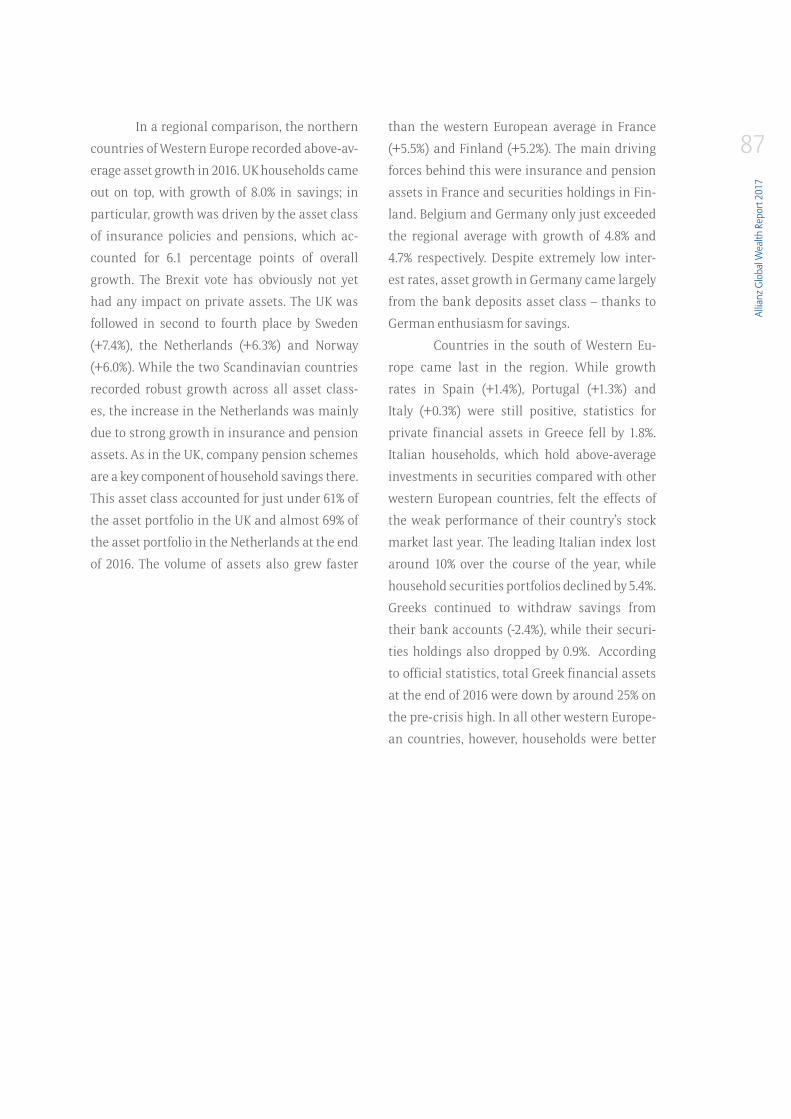
Allia
nz G
loba
l Wea
lth R
epor
t 201
7
87In a regional comparison, the northern
countries of Western Europe recorded above-av-
erage asset growth in 2016. UK households came
out on top, with growth of 8.0% in savings; in
particular, growth was driven by the asset class
of insurance policies and pensions, which ac-
counted for 6.1 percentage points of overall
growth. The Brexit vote has obviously not yet
had any impact on private assets. The UK was
followed in second to fourth place by Sweden
(+7.4%), the Netherlands (+6.3%) and Norway
(+6.0%). While the two Scandinavian countries
recorded robust growth across all asset class-
es, the increase in the Netherlands was mainly
due to strong growth in insurance and pension
assets. As in the UK, company pension schemes
are a key component of household savings there.
This asset class accounted for just under 61% of
the asset portfolio in the UK and almost 69% of
the asset portfolio in the Netherlands at the end
of 2016. The volume of assets also grew faster
than the western European average in France
(+5.5%) and Finland (+5.2%). The main driving
forces behind this were insurance and pension
assets in France and securities holdings in Fin-
land. Belgium and Germany only just exceeded
the regional average with growth of 4.8% and
4.7% respectively. Despite extremely low inter-
est rates, asset growth in Germany came largely
from the bank deposits asset class – thanks to
German enthusiasm for savings.
Countries in the south of Western Eu-
rope came last in the region. While growth
rates in Spain (+1.4%), Portugal (+1.3%) and
Italy (+0.3%) were still positive, statistics for
private financial assets in Greece fell by 1.8%.
Italian households, which hold above-average
investments in securities compared with other
western European countries, felt the effects of
the weak performance of their country’s stock
market last year. The leading Italian index lost
around 10% over the course of the year, while
household securities portfolios declined by 5.4%.
Greeks continued to withdraw savings from
their bank accounts (-2.4%), while their securi-
ties holdings also dropped by 0.9%. According
to official statistics, total Greek financial assets
at the end of 2016 were down by around 25% on
the pre-crisis high. In all other western Europe-
an countries, however, households were better
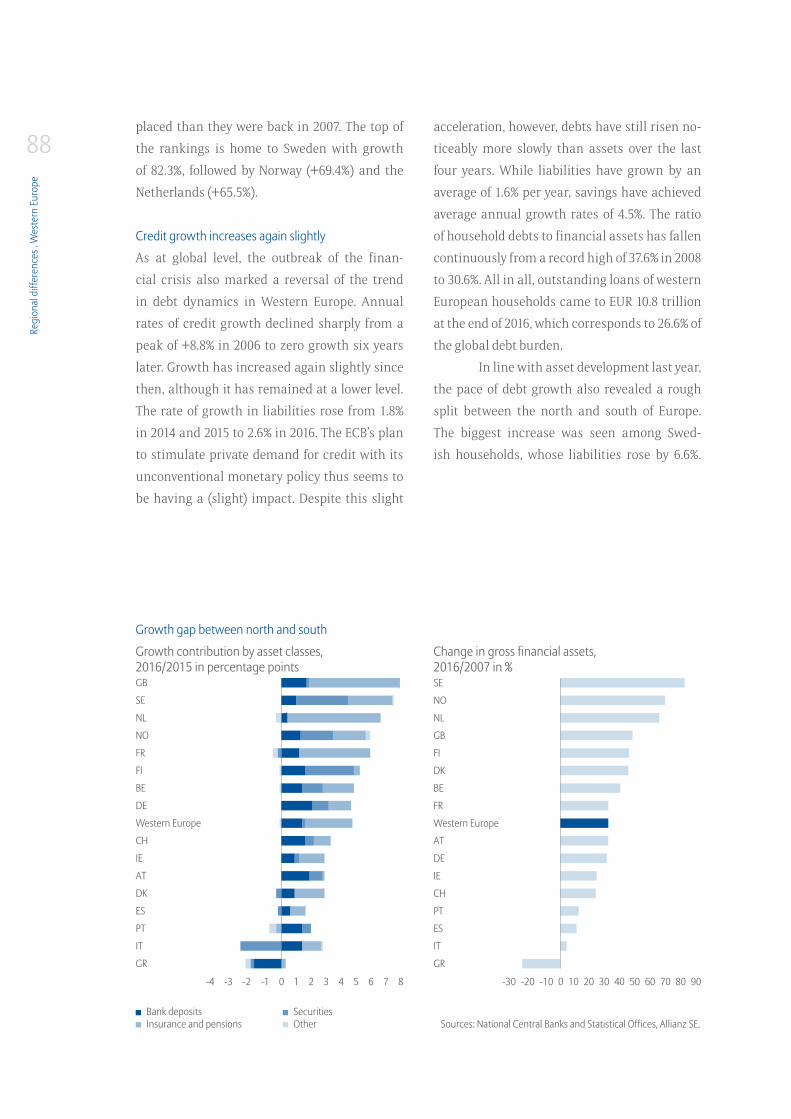
Regi
onal
diff
eren
ces .
Wes
tern
Eur
ope
88placed than they were back in 2007. The top of
the rankings is home to Sweden with growth
of 82.3%, followed by Norway (+69.4%) and the
Netherlands (+65.5%).
Credit growth increases again slightly
As at global level, the outbreak of the finan-
cial crisis also marked a reversal of the trend
in debt dynamics in Western Europe. Annual
rates of credit growth declined sharply from a
peak of +8.8% in 2006 to zero growth six years
later. Growth has increased again slightly since
then, although it has remained at a lower level.
The rate of growth in liabilities rose from 1.8%
in 2014 and 2015 to 2.6% in 2016. The ECB’s plan
to stimulate private demand for credit with its
unconventional monetary policy thus seems to
be having a (slight) impact. Despite this slight
acceleration, however, debts have still risen no-
ticeably more slowly than assets over the last
four years. While liabilities have grown by an
average of 1.6% per year, savings have achieved
average annual growth rates of 4.5%. The ratio
of household debts to financial assets has fallen
continuously from a record high of 37.6% in 2008
to 30.6%. All in all, outstanding loans of western
European households came to EUR 10.8 trillion
at the end of 2016, which corresponds to 26.6% of
the global debt burden.
In line with asset development last year,
the pace of debt growth also revealed a rough
split between the north and south of Europe.
The biggest increase was seen among Swed-
ish households, whose liabilities rose by 6.6%.
Growth contribution by asset classes, 2016/2015 in percentage points
Change in gross financial assets, 2016/2007 in %
Growth gap between north and south
Sources: National Central Banks and Statistical Offices, Allianz SE.
GB
SE
NL
NO
FR
FI
BE
DE
Western Europe
CH
IE
AT
DK
ES
PT
IT
GR
SE
NO
NL
GB
FI
DK
BE
FR
Western Europe
AT
DE
IE
CH
PT
ES
IT
GR
-30 -20 -10 0 10 20 30 40 50 60 70 80 90-4 -3 -2 -1 0 1 2 3 4 5 6 7 8
SecuritiesOther
Bank depositsInsurance and pensions
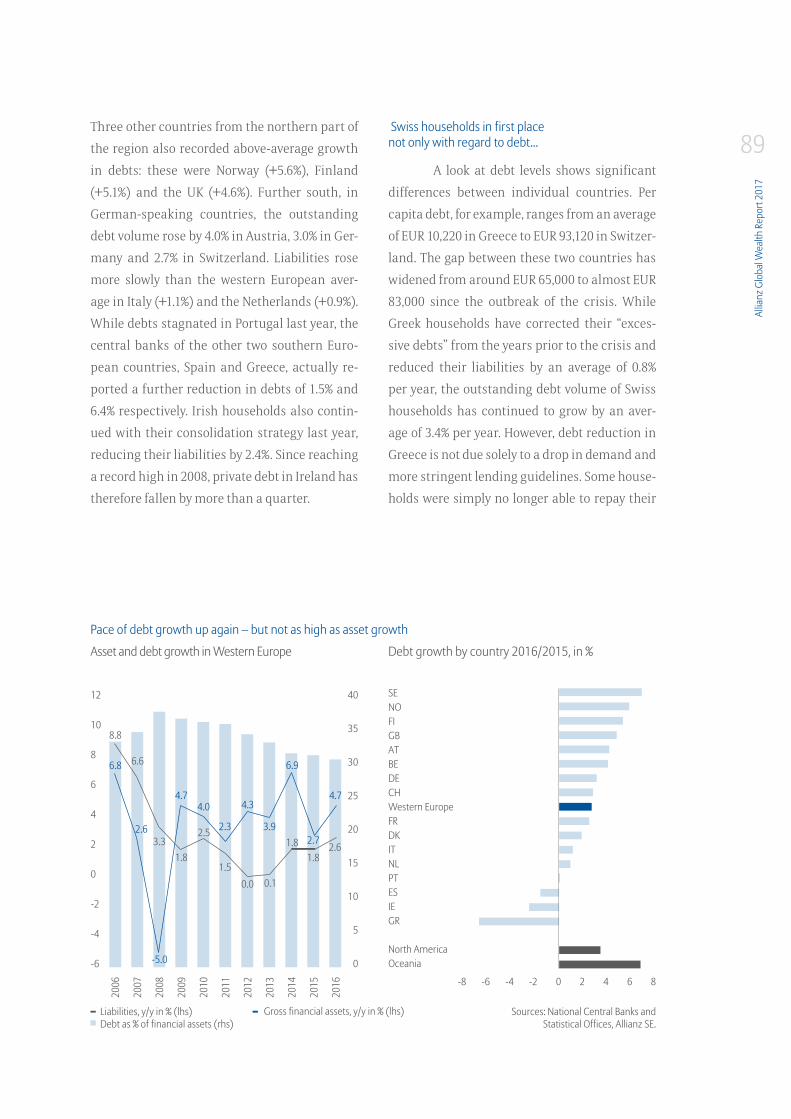
Allia
nz G
loba
l Wea
lth R
epor
t 201
7
89Three other countries from the northern part of
the region also recorded above-average growth
in debts: these were Norway (+5.6%), Finland
(+5.1%) and the UK (+4.6%). Further south, in
German-speaking countries, the outstanding
debt volume rose by 4.0% in Austria, 3.0% in Ger-
many and 2.7% in Switzerland. Liabilities rose
more slowly than the western European aver-
age in Italy (+1.1%) and the Netherlands (+0.9%).
While debts stagnated in Portugal last year, the
central banks of the other two southern Euro-
pean countries, Spain and Greece, actually re-
ported a further reduction in debts of 1.5% and
6.4% respectively. Irish households also contin-
ued with their consolidation strategy last year,
reducing their liabilities by 2.4%. Since reaching
a record high in 2008, private debt in Ireland has
therefore fallen by more than a quarter.
Swiss households in first place not only with regard to debt...
A look at debt levels shows significant
differences between individual countries. Per
capita debt, for example, ranges from an average
of EUR 10,220 in Greece to EUR 93,120 in Switzer-
land. The gap between these two countries has
widened from around EUR 65,000 to almost EUR
83,000 since the outbreak of the crisis. While
Greek households have corrected their “exces-
sive debts” from the years prior to the crisis and
reduced their liabilities by an average of 0.8%
per year, the outstanding debt volume of Swiss
households has continued to grow by an aver-
age of 3.4% per year. However, debt reduction in
Greece is not due solely to a drop in demand and
more stringent lending guidelines. Some house-
holds were simply no longer able to repay their
Asset and debt growth in Western Europe
Pace of debt growth up again – but not as high as asset growth
Sources: National Central Banks and Statistical Offices, Allianz SE.
Liabilities, y/y in % (lhs)Debt as % of financial assets (rhs)
12
10
8
6
4
2
0
-2
-4
-6
40
35
30
25
20
15
10
5
0
Debt growth by country 2016/2015, in %
SENO FI GB AT BE DE CH Western EuropeFR DK IT NL PT ES IE GR
North AmericaOceania
-8 -6 -4 -2 0 2 4 6 8
2006
2007
2008
2009
2010
2011
2012
2013
2014
2015
2016
8.8
6.6
3.31.8
2.5
1.50.0 0.1
1.81.8
2.6
6.8
2.6
-5.0
4.74.0 4.3
3.9
6.9
2.7
4.7
2.3
Gross financial assets, y/y in % (lhs)
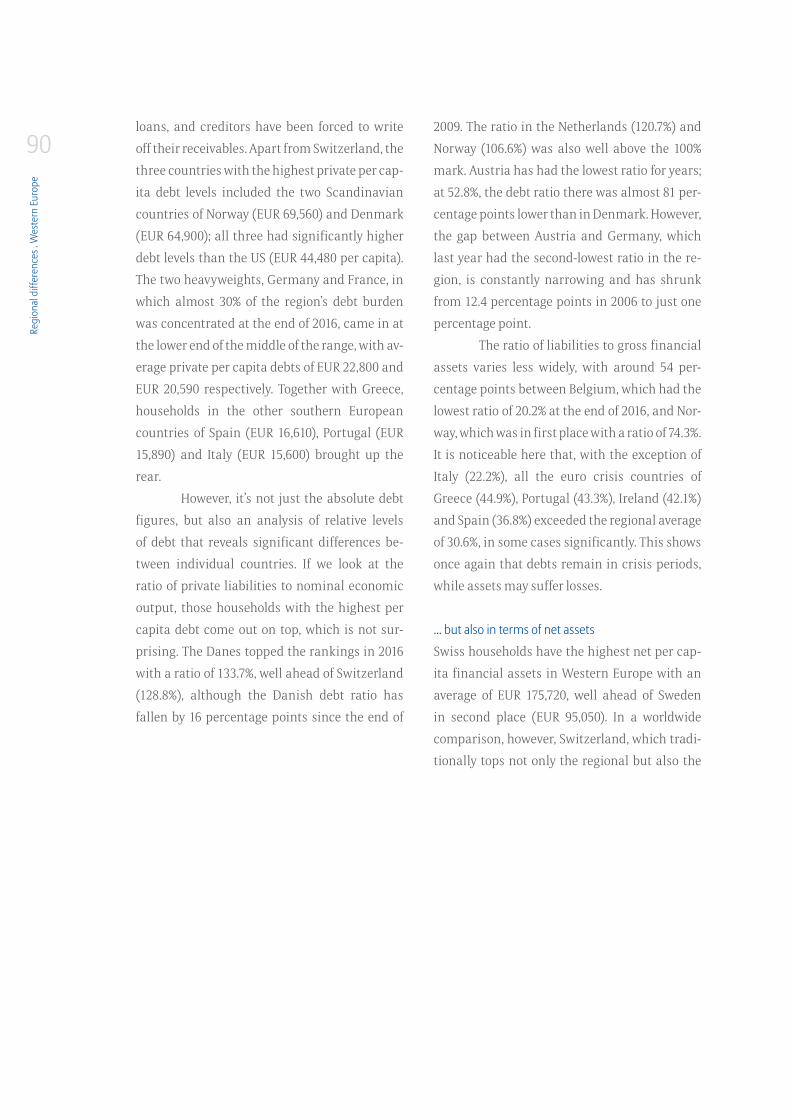
Regi
onal
diff
eren
ces .
Wes
tern
Eur
ope
90loans, and creditors have been forced to write
off their receivables. Apart from Switzerland, the
three countries with the highest private per cap-
ita debt levels included the two Scandinavian
countries of Norway (EUR 69,560) and Denmark
(EUR 64,900); all three had significantly higher
debt levels than the US (EUR 44,480 per capita).
The two heavyweights, Germany and France, in
which almost 30% of the region’s debt burden
was concentrated at the end of 2016, came in at
the lower end of the middle of the range, with av-
erage private per capita debts of EUR 22,800 and
EUR 20,590 respectively. Together with Greece,
households in the other southern European
countries of Spain (EUR 16,610), Portugal (EUR
15,890) and Italy (EUR 15,600) brought up the
rear.
However, it’s not just the absolute debt
figures, but also an analysis of relative levels
of debt that reveals significant differences be-
tween individual countries. If we look at the
ratio of private liabilities to nominal economic
output, those households with the highest per
capita debt come out on top, which is not sur-
prising. The Danes topped the rankings in 2016
with a ratio of 133.7%, well ahead of Switzerland
(128.8%), although the Danish debt ratio has
fallen by 16 percentage points since the end of
2009. The ratio in the Netherlands (120.7%) and
Norway (106.6%) was also well above the 100%
mark. Austria has had the lowest ratio for years;
at 52.8%, the debt ratio there was almost 81 per-
centage points lower than in Denmark. However,
the gap between Austria and Germany, which
last year had the second-lowest ratio in the re-
gion, is constantly narrowing and has shrunk
from 12.4 percentage points in 2006 to just one
percentage point.
The ratio of liabilities to gross financial
assets varies less widely, with around 54 per-
centage points between Belgium, which had the
lowest ratio of 20.2% at the end of 2016, and Nor-
way, which was in first place with a ratio of 74.3%.
It is noticeable here that, with the exception of
Italy (22.2%), all the euro crisis countries of
Greece (44.9%), Portugal (43.3%), Ireland (42.1%)
and Spain (36.8%) exceeded the regional average
of 30.6%, in some cases significantly. This shows
once again that debts remain in crisis periods,
while assets may suffer losses.
... but also in terms of net assets
Swiss households have the highest net per cap-
ita financial assets in Western Europe with an
average of EUR 175,720, well ahead of Sweden
in second place (EUR 95,050). In a worldwide
comparison, however, Switzerland, which tradi-
tionally tops not only the regional but also the
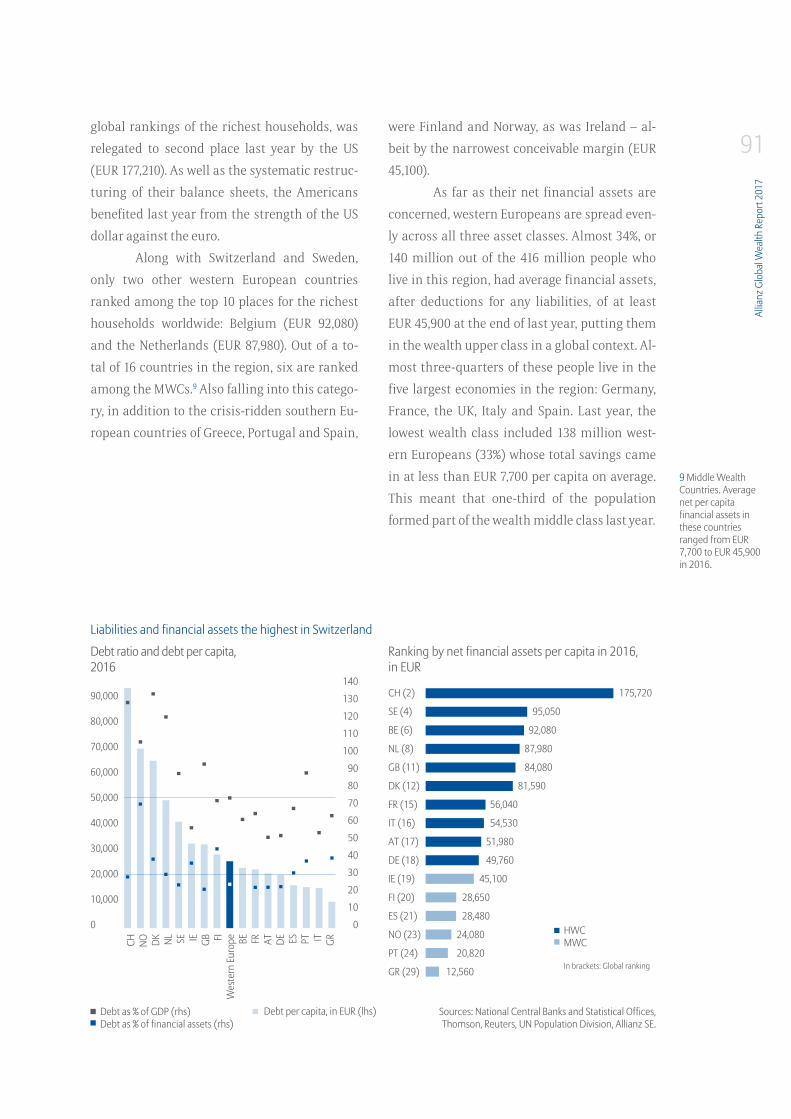
Allia
nz G
loba
l Wea
lth R
epor
t 201
7
91global rankings of the richest households, was
relegated to second place last year by the US
(EUR 177,210). As well as the systematic restruc-
turing of their balance sheets, the Americans
benefited last year from the strength of the US
dollar against the euro.
Along with Switzerland and Sweden,
only two other western European countries
ranked among the top 10 places for the richest
households worldwide: Belgium (EUR 92,080)
and the Netherlands (EUR 87,980). Out of a to-
tal of 16 countries in the region, six are ranked
among the MWCs.9 Also falling into this catego-
ry, in addition to the crisis-ridden southern Eu-
ropean countries of Greece, Portugal and Spain,
were Finland and Norway, as was Ireland – al-
beit by the narrowest conceivable margin (EUR
45,100).
As far as their net financial assets are
concerned, western Europeans are spread even-
ly across all three asset classes. Almost 34%, or
140 million out of the 416 million people who
live in this region, had average financial assets,
after deductions for any liabilities, of at least
EUR 45,900 at the end of last year, putting them
in the wealth upper class in a global context. Al-
most three-quarters of these people live in the
five largest economies in the region: Germany,
France, the UK, Italy and Spain. Last year, the
lowest wealth class included 138 million west-
ern Europeans (33%) whose total savings came
in at less than EUR 7,700 per capita on average.
This meant that one-third of the population
formed part of the wealth middle class last year.
9 Middle Wealth Countries. Average net per capita financial assets in these countries ranged from EUR 7,700 to EUR 45,900 in 2016.
Debt ratio and debt per capita, 2016
Liabilities and financial assets the highest in Switzerland
Sources: National Central Banks and Statistical Offices, Thomson, Reuters, UN Population Division, Allianz SE.
Debt as % of GDP (rhs)Debt as % of financial assets (rhs)
Ranking by net financial assets per capita in 2016, in EUR
CH (2)
SE (4)
BE (6)
NL (8)
GB (11)
DK (12)
FR (15)
IT (16)
AT (17)
DE (18)
IE (19)
FI (20)
ES (21)
NO (23)
PT (24)
GR (29)
Debt per capita, in EUR (lhs)
90,000
80,000
70,000
60,000
50,000
40,000
30,000
20,000
10,000
0
140
130
120
110
100
90
80
70
60
50
40
30
20
10
0
CH NO DK NL SE IE GB FIW
este
rn E
urop
e BE FR AT DE ES PT IT GR
175,720
95,050
92,080
87,980
84,080
81,590
56,040
54,530
51,980
49,760
45,100
28,650
28,480
24,080
20,820
12,560
HWCMWC In brackets: Global ranking
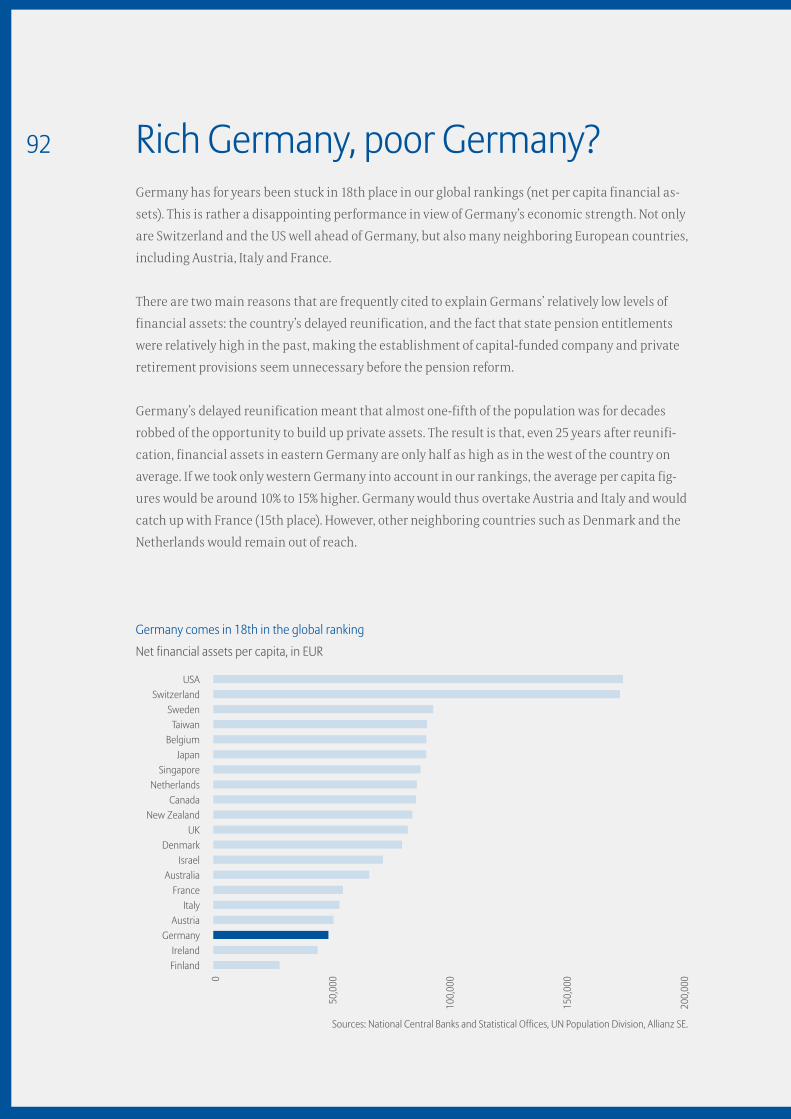
92 Rich Germany, poor Germany?Germany has for years been stuck in 18th place in our global rankings (net per capita financial as-
sets). This is rather a disappointing performance in view of Germany’s economic strength. Not only
are Switzerland and the US well ahead of Germany, but also many neighboring European countries,
including Austria, Italy and France.
There are two main reasons that are frequently cited to explain Germans’ relatively low levels of
financial assets: the country’s delayed reunification, and the fact that state pension entitlements
were relatively high in the past, making the establishment of capital-funded company and private
retirement provisions seem unnecessary before the pension reform.
Germany’s delayed reunification meant that almost one-fifth of the population was for decades
robbed of the opportunity to build up private assets. The result is that, even 25 years after reunifi-
cation, financial assets in eastern Germany are only half as high as in the west of the country on
average. If we took only western Germany into account in our rankings, the average per capita fig-
ures would be around 10% to 15% higher. Germany would thus overtake Austria and Italy and would
catch up with France (15th place). However, other neighboring countries such as Denmark and the
Netherlands would remain out of reach.
Net financial assets per capita, in EUR
Germany comes in 18th in the global ranking
Sources: National Central Banks and Statistical Offices, UN Population Division, Allianz SE.
USASwitzerland
SwedenTaiwan
BelgiumJapan
SingaporeNetherlands
CanadaNew Zealand
UKDenmark
IsraelAustralia
FranceItaly
AustriaGermany
IrelandFinland
0
50,0
00
100,
000
150,
000
200,
000
93
Does this change if state pension entitlements are included in calculations of private financial as-
sets? Pension rights do not of course constitute assets in the traditional sense, as they are not capital
protected under private law – which could, for example, be sold at any time. Nevertheless, many
savers (at least in the past) may have been less ambitious in building up their assets, in the assump-
tion that they could later rely on a state pension. There would thus be a correlation between high state
pension entitlements and lower financial assets.
State pension rights do not just exist in Germany, of course. We have therefore roughly calculated the
current cash value of future pension payments in various European countries. We limited our calcu-
lations to a typical saver aged 40, with average income, who will draw a pension for 20 years from the
age of 65. These assumptions were identical for all the countries we analyzed. We made no further
distinctions in terms of future developments in growth and inflation (and set both these variables
to zero, for the sake of simplicity); the interest rate (2%) was also the same for all countries. The only
variables included in the calculation were therefore the current level of income and the current struc-
ture of the pension system, which determines pension levels.
0
50,0
00
100,
000
150,
000
200,
000
250,
000
Average present value of public pensions, in EUR
Germany average on a European scale
Sources: EU Commission, Allianz SE.
Austria
Norway
Finland
Denmark
Belgium
Italy
Germany
Spain
France
Netherlands
Ireland
Sweden
Portugal
Greece
94
Two aspects in particular stand out in this simple calculation. The cash values of pension en-
titlements are generally considerably higher than actual financial assets, and there are huge
differences between the countries we analyzed here, even between countries with similar income
levels, such as Austria and Sweden. This reflects significant differences in the structure of pension
systems.
Germany is mid-table in Europe with regard to state pension entitlements. The explanation that fi-
nancial assets are relatively low because entitlements under the state pension system are assumed
to be very high is therefore only partly true. The “wealth gap” compared with the Netherlands and
Sweden, for example, becomes much smaller if we include the notional pension entitlements.
Germany would also catch up with France; average German savers would actually be “richer”
than their French counterparts. On the other hand, however, there are countries such as Austria,
Denmark and Belgium, where financial assets are already higher and state pension systems are
simultaneously more generous. If the cash values of state pensions were simply added to net finan-
cial assets, Austrians would top the rankings in Europe.
Such calculations on the basis of “standard” savers must of course be interpreted with a certain
amount of skepticism. However, they do clearly highlight one thing: the explanations that are usu-
ally given for Germany’s relatively low financial assets are only partly convincing. We are therefore
left with a conclusion that is not particularly positive from a German viewpoint, which is that
German savers are not making enough of their excellent starting position with high incomes and
high savings.

Allia
nz G
loba
l Wea
lth R
epor
t 201
7
95
96
Vorwort . Zusammenfassung . Entwicklung des globalen Geldvermögens . Verteilung des globalen Geldvermögens . Regionale Unterschiede . Literatur . Appendix
96
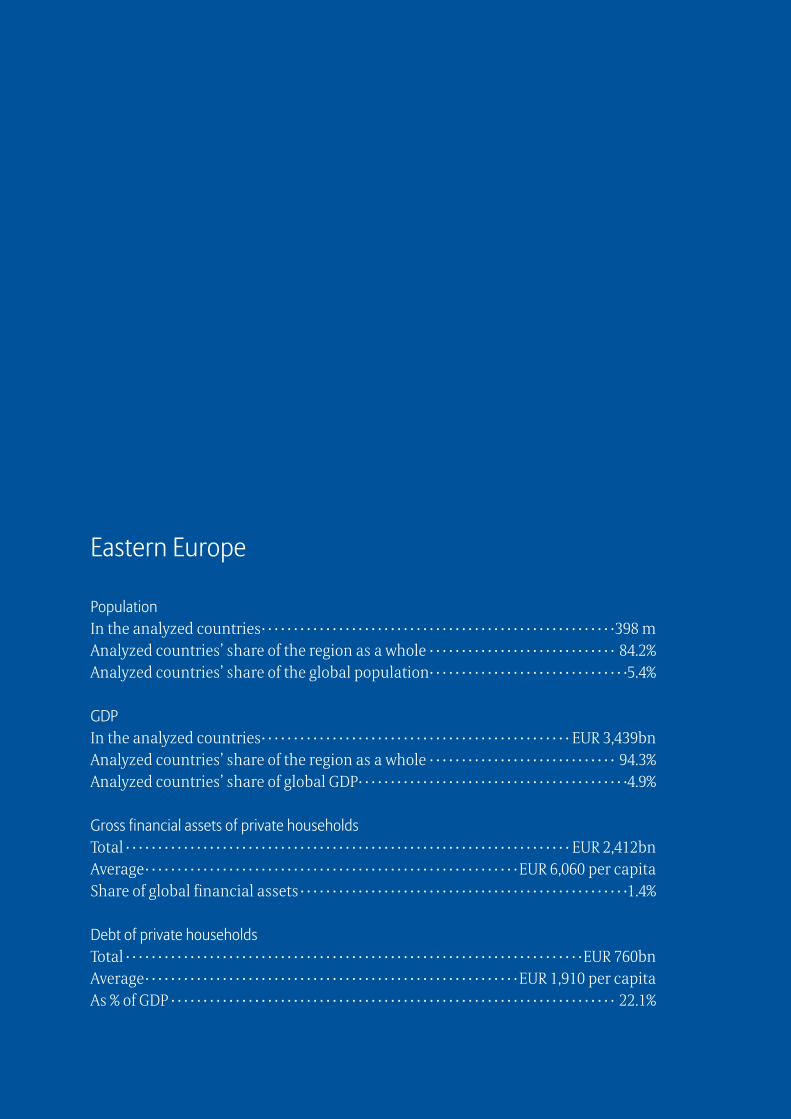
Eastern Europe
PopulationIn the analyzed countries · · · · · · · · · · · · · · · · · · · · · · · · · · · · · · · · · · · · · · · · · · · · · · · · · · · · · · ·398 mAnalyzed countries’ share of the region as a whole · · · · · · · · · · · · · · · · · · · · · · · · · · · · · 84.2%Analyzed countries’ share of the global population · · · · · · · · · · · · · · · · · · · · · · · · · · · · · · ·5.4%
GDPIn the analyzed countries · · · · · · · · · · · · · · · · · · · · · · · · · · · · · · · · · · · · · · · · · · · · · · · · EUR 3,439bnAnalyzed countries’ share of the region as a whole · · · · · · · · · · · · · · · · · · · · · · · · · · · · · 94.3%Analyzed countries’ share of global GDP · · · · · · · · · · · · · · · · · · · · · · · · · · · · · · · · · · · · · · · · · ·4.9%
Gross financial assets of private householdsTotal · · · · · · · · · · · · · · · · · · · · · · · · · · · · · · · · · · · · · · · · · · · · · · · · · · · · · · · · · · · · · · · · · · · · · EUR 2,412bnAverage · · · · · · · · · · · · · · · · · · · · · · · · · · · · · · · · · · · · · · · · · · · · · · · · · · · · · · · · · · EUR 6,060 per capitaShare of global financial assets · · · · · · · · · · · · · · · · · · · · · · · · · · · · · · · · · · · · · · · · · · · · · · · · · · ·1.4%
Debt of private householdsTotal · · · · · · · · · · · · · · · · · · · · · · · · · · · · · · · · · · · · · · · · · · · · · · · · · · · · · · · · · · · · · · · · · · · · · · · EUR 760bnAverage · · · · · · · · · · · · · · · · · · · · · · · · · · · · · · · · · · · · · · · · · · · · · · · · · · · · · · · · · · EUR 1,910 per capitaAs % of GDP · · · · · · · · · · · · · · · · · · · · · · · · · · · · · · · · · · · · · · · · · · · · · · · · · · · · · · · · · · · · · · · · · · · · · 22.1%
Regi
onal
diff
eren
ces .
Eas
tern
Eur
ope
98Eastern European EU members
Private financial assets grew by 6.7% in eastern
European EU member states in 2016, slightly
above the previous year’s growth of 6.3%. Growth
rates were positive in each of these 11 countries10.
Overall, household savings came to EUR 1.2 tril-
lion at the end of last year. Despite this robust
development, the 2007 economic and financial
crisis certainly took considerable wind out of the
sails of asset growth. While double-digit growth
rates had been the norm in the years preceding
the crisis, average growth has since fallen to just
under 6%.
Private households still held the biggest
chunk of their financial assets (approximate-
ly 45%) in bank deposits. Although the world’s
major central banks have effectively abolished
interest rates with their expansive monetary
policy, inflows of funds into this asset class have
risen continuously over the last three years, rep-
resenting about two-thirds of annual savings
on average. Private households paid almost EUR
42 billion into banks in net terms last year, 20%
more than in 2015. Bank deposits grew strongly
by 8.5% as a result.
Growth in securities holdings in the
region slowed year-on-year from 7.0% to 5.1%.
However, developments varied widely between
individual countries. While Hungary and Latvia
reported growth of 10.5% and 23.9% respectively,
Romanian and Slovenian households suffered
losses to the tune of 4.7% and 0.6% respectively.
After inflows of funds into this asset class across
all countries fell from a record figure of EUR
19.9 billion in 2012 to EUR 2.7 billion three years
later, they increased again to EUR 6.0 billion in
2016. The respective leading index in almost all
eastern European EU member states recorded
double-digit growth over the course of the year.
The exceptions were Romania (+1.2%), Slovakia
(+9.0%), Slovenia (+3.1%) and the Czech Repub-
lic, where the benchmark index actually fell by
3.6% year-on-year. If we compare the figures at
the end of last year with their pre-crisis levels,
however, the leading indices in more than half of
the 11 countries were still down. Estonia, Latvia,
Lithuania and Hungary were the only countries
where the stock markets rose compared with
2007. All in all, the proportion of gross financial
assets held in securities came in at almost 30%,
a fall of 9.6 percentage points from this asset
class’s peak in 2007.
Household receivables from insurance
companies and pension funds grew by 9.0%
last year, the highest level of growth among the
three major asset classes. Romania achieved the
strongest growth of 23.4%, although this was
from a very low initial level. Assets of EUR 470 per
capita were invested there in insurance policies
and pensions, against a regional average of EUR
1,590. The ratio of this asset class to gross finan-
cial assets varies from country to country. In Ro-
mania, for example, it accounted for only 7.8% of
gross financial assets, compared with 25% and
20% respectively in Croatia and Slovakia. Since
the beginning of the millennium, the average
ratio for the eastern European EU countries rose
from 6.3% to 13.6% last year as private retirement
10 Bulgaria, Estonia, Croatia,
Latvia, Lithuania, Poland, Romania,
Slovakia, Slovenia, the Czech Republic
and Hungary.
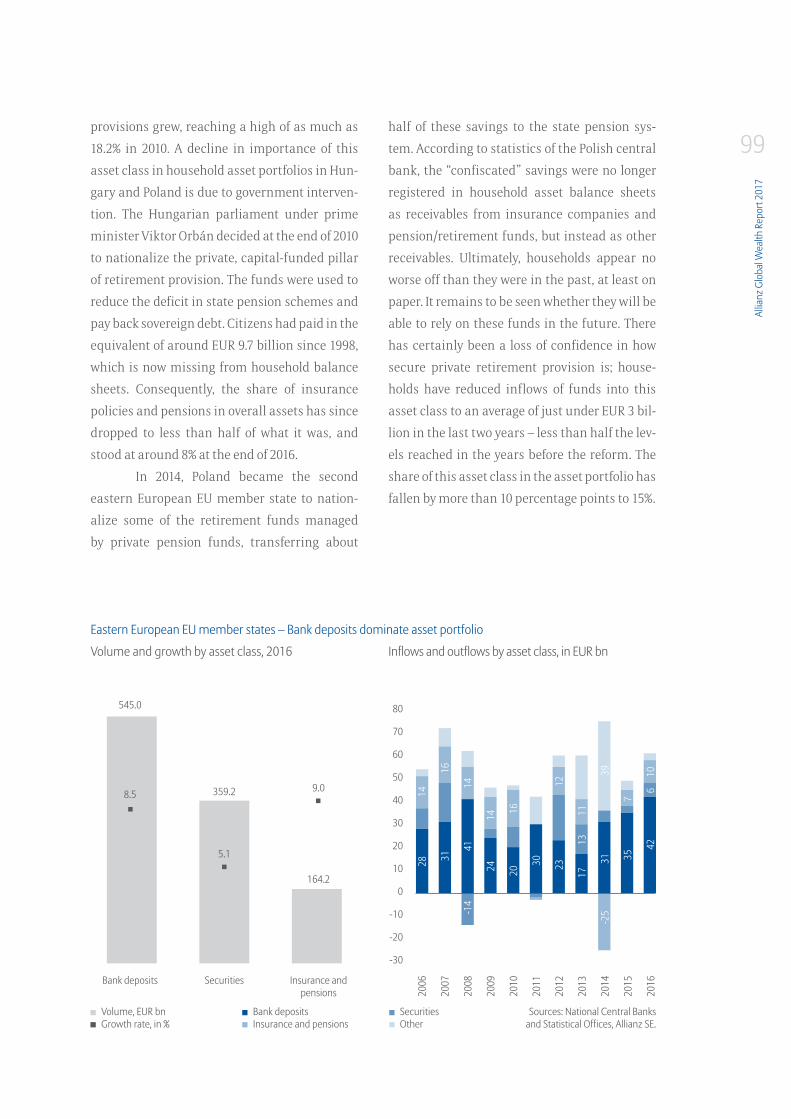
Allia
nz G
loba
l Wea
lth R
epor
t 201
7
99provisions grew, reaching a high of as much as
18.2% in 2010. A decline in importance of this
asset class in household asset portfolios in Hun-
gary and Poland is due to government interven-
tion. The Hungarian parliament under prime
minister Viktor Orbán decided at the end of 2010
to nationalize the private, capital-funded pillar
of retirement provision. The funds were used to
reduce the deficit in state pension schemes and
pay back sovereign debt. Citizens had paid in the
equivalent of around EUR 9.7 billion since 1998,
which is now missing from household balance
sheets. Consequently, the share of insurance
policies and pensions in overall assets has since
dropped to less than half of what it was, and
stood at around 8% at the end of 2016.
In 2014, Poland became the second
eastern European EU member state to nation-
alize some of the retirement funds managed
by private pension funds, transferring about
half of these savings to the state pension sys-
tem. According to statistics of the Polish central
bank, the “confiscated” savings were no longer
registered in household asset balance sheets
as receivables from insurance companies and
pension/retirement funds, but instead as other
receivables. Ultimately, households appear no
worse off than they were in the past, at least on
paper. It remains to be seen whether they will be
able to rely on these funds in the future. There
has certainly been a loss of confidence in how
secure private retirement provision is; house-
holds have reduced inflows of funds into this
asset class to an average of just under EUR 3 bil-
lion in the last two years – less than half the lev-
els reached in the years before the reform. The
share of this asset class in the asset portfolio has
fallen by more than 10 percentage points to 15%.
Inflows and outflows by asset class, in EUR bn
Sources: National Central Banks and Statistical Offices, Allianz SE.
Volume and growth by asset class, 2016
Eastern European EU member states – Bank deposits dominate asset portfolio
80
70
60
50
40
30
20
10
0
-10
-20
-30
Bank deposits
545.0
8.5
Securities
359.2
5.1
Insurance and pensions
164.2
9.0
2006
2007
2008
2009
2010
2011
2012
2013
2014
2015
2016
2814
1631
1441
-14
-179
1424
1620
30
1223
1117
13-1
08
3931
-25
735
106
42-9
1
SecuritiesOther
Bank depositsInsurance and pensions
Volume, EUR bnGrowth rate, in %
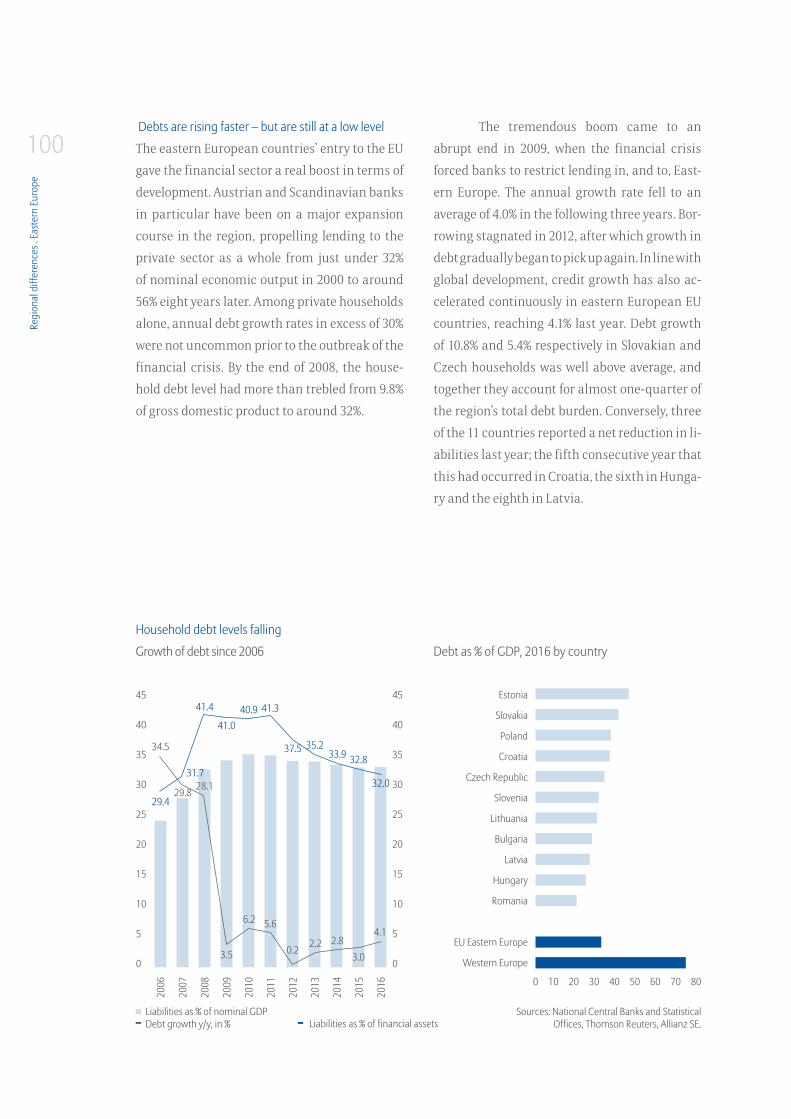
Regi
onal
diff
eren
ces .
Eas
tern
Eur
ope
100 Debts are rising faster – but are still at a low level
The eastern European countries’ entry to the EU
gave the financial sector a real boost in terms of
development. Austrian and Scandinavian banks
in particular have been on a major expansion
course in the region, propelling lending to the
private sector as a whole from just under 32%
of nominal economic output in 2000 to around
56% eight years later. Among private households
alone, annual debt growth rates in excess of 30%
were not uncommon prior to the outbreak of the
financial crisis. By the end of 2008, the house-
hold debt level had more than trebled from 9.8%
of gross domestic product to around 32%.
The tremendous boom came to an
abrupt end in 2009, when the financial crisis
forced banks to restrict lending in, and to, East-
ern Europe. The annual growth rate fell to an
average of 4.0% in the following three years. Bor-
rowing stagnated in 2012, after which growth in
debt gradually began to pick up again. In line with
global development, credit growth has also ac-
celerated continuously in eastern European EU
countries, reaching 4.1% last year. Debt growth
of 10.8% and 5.4% respectively in Slovakian and
Czech households was well above average, and
together they account for almost one-quarter of
the region’s total debt burden. Conversely, three
of the 11 countries reported a net reduction in li-
abilities last year; the fifth consecutive year that
this had occurred in Croatia, the sixth in Hunga-
ry and the eighth in Latvia.
Growth of debt since 2006
Household debt levels falling
Sources: National Central Banks and Statistical Offices, Thomson Reuters, Allianz SE.
Liabilities as % of nominal GDPDebt growth y/y, in %
45
40
35
30
25
20
15
10
5
0
45
40
35
30
25
20
15
10
5
0
Debt as % of GDP, 2016 by country
Estonia
Slovakia
Poland
Croatia
Czech Republic
Slovenia
Lithuania
Bulgaria
Latvia
Hungary
Romania
EU Eastern Europe
Western Europe
0 10 20 30 40 50 60 70 80
2006
2007
2008
2009
2010
2011
2012
2013
2014
2015
2016
34.5
29.8 28.1
3.5
6.2 5.6
0.2 2.2 2.83.0
4.1
29.4
41.4
41.040.9
37.5 35.233.9 32.8
32.0
41.3
Liabilities as % of financial assets
31.7
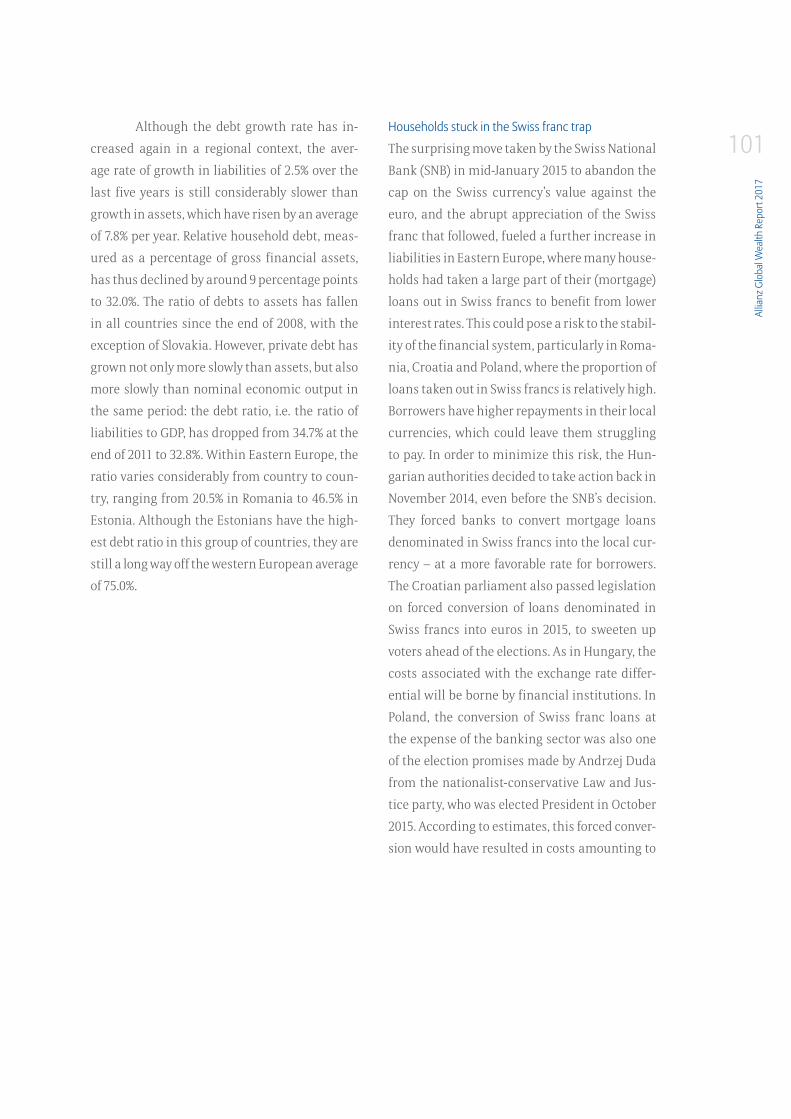
Allia
nz G
loba
l Wea
lth R
epor
t 201
7
101Although the debt growth rate has in-
creased again in a regional context, the aver-
age rate of growth in liabilities of 2.5% over the
last five years is still considerably slower than
growth in assets, which have risen by an average
of 7.8% per year. Relative household debt, meas-
ured as a percentage of gross financial assets,
has thus declined by around 9 percentage points
to 32.0%. The ratio of debts to assets has fallen
in all countries since the end of 2008, with the
exception of Slovakia. However, private debt has
grown not only more slowly than assets, but also
more slowly than nominal economic output in
the same period: the debt ratio, i.e. the ratio of
liabilities to GDP, has dropped from 34.7% at the
end of 2011 to 32.8%. Within Eastern Europe, the
ratio varies considerably from country to coun-
try, ranging from 20.5% in Romania to 46.5% in
Estonia. Although the Estonians have the high-
est debt ratio in this group of countries, they are
still a long way off the western European average
of 75.0%.
Households stuck in the Swiss franc trap
The surprising move taken by the Swiss National
Bank (SNB) in mid-January 2015 to abandon the
cap on the Swiss currency’s value against the
euro, and the abrupt appreciation of the Swiss
franc that followed, fueled a further increase in
liabilities in Eastern Europe, where many house-
holds had taken a large part of their (mortgage)
loans out in Swiss francs to benefit from lower
interest rates. This could pose a risk to the stabil-
ity of the financial system, particularly in Roma-
nia, Croatia and Poland, where the proportion of
loans taken out in Swiss francs is relatively high.
Borrowers have higher repayments in their local
currencies, which could leave them struggling
to pay. In order to minimize this risk, the Hun-
garian authorities decided to take action back in
November 2014, even before the SNB’s decision.
They forced banks to convert mortgage loans
denominated in Swiss francs into the local cur-
rency – at a more favorable rate for borrowers.
The Croatian parliament also passed legislation
on forced conversion of loans denominated in
Swiss francs into euros in 2015, to sweeten up
voters ahead of the elections. As in Hungary, the
costs associated with the exchange rate differ-
ential will be borne by financial institutions. In
Poland, the conversion of Swiss franc loans at
the expense of the banking sector was also one
of the election promises made by Andrzej Duda
from the nationalist-conservative Law and Jus-
tice party, who was elected President in October
2015. According to estimates, this forced conver-
sion would have resulted in costs amounting to
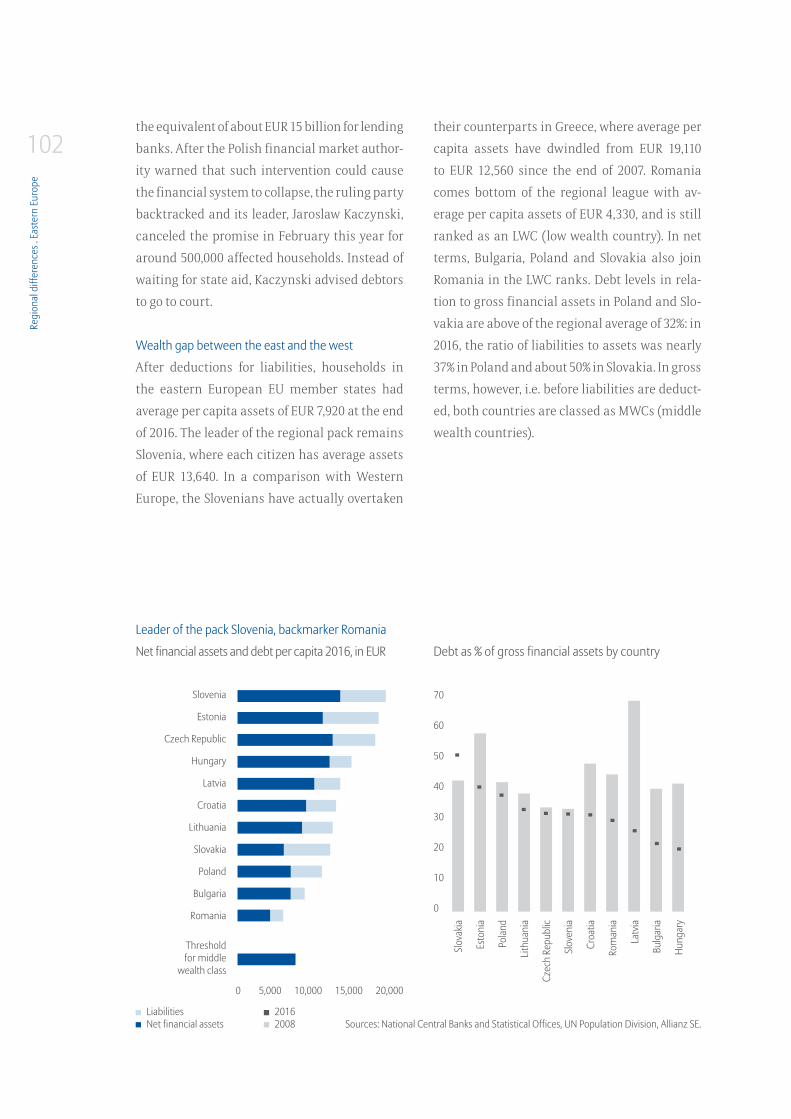
Regi
onal
diff
eren
ces .
Eas
tern
Eur
ope
102the equivalent of about EUR 15 billion for lending
banks. After the Polish financial market author-
ity warned that such intervention could cause
the financial system to collapse, the ruling party
backtracked and its leader, Jaroslaw Kaczynski,
canceled the promise in February this year for
around 500,000 affected households. Instead of
waiting for state aid, Kaczynski advised debtors
to go to court.
Wealth gap between the east and the west
After deductions for liabilities, households in
the eastern European EU member states had
average per capita assets of EUR 7,920 at the end
of 2016. The leader of the regional pack remains
Slovenia, where each citizen has average assets
of EUR 13,640. In a comparison with Western
Europe, the Slovenians have actually overtaken
their counterparts in Greece, where average per
capita assets have dwindled from EUR 19,110
to EUR 12,560 since the end of 2007. Romania
comes bottom of the regional league with av-
erage per capita assets of EUR 4,330, and is still
ranked as an LWC (low wealth country). In net
terms, Bulgaria, Poland and Slovakia also join
Romania in the LWC ranks. Debt levels in rela-
tion to gross financial assets in Poland and Slo-
vakia are above of the regional average of 32%: in
2016, the ratio of liabilities to assets was nearly
37% in Poland and about 50% in Slovakia. In gross
terms, however, i.e. before liabilities are deduct-
ed, both countries are classed as MWCs (middle
wealth countries).
Net financial assets and debt per capita 2016, in EUR
Leader of the pack Slovenia, backmarker Romania
Sources: National Central Banks and Statistical Offices, UN Population Division, Allianz SE.
Debt as % of gross financial assets by country
0 5,000 10,000 15,000 20,000
Slovenia
Estonia
Czech Republic
Hungary
Latvia
Croatia
Lithuania
Slovakia
Poland
Bulgaria
Romania
Threshold for middle
wealth class
Slov
akia
Esto
nia
Pola
nd
Lit
huan
ia
Czec
h Re
publ
ic
Slov
enia
Croa
tia
Rom
ania
Latv
ia
Bu
lgar
ia
Hung
ary
70
60
50
40
30
20
10
0
LiabilitiesNet financial assets
20162008
Allia
nz G
loba
l Wea
lth R
epor
t 201
7
103To date, not a single eastern European
EU member has managed to propel itself into
the ranks of the HWCs (high wealth countries),
which would require average net per capita fi-
nancial assets to surpass a threshold of EUR
45,900 in 2016. Although average per capita
assets have nearly quadrupled in the region
since the end of 2000, almost 68% of the popu-
lation still has less than EUR 7,700 per capita.
Admittedly, however, this proportion has fallen
by more than 17 percentage points during this
period. On the other hand, the number of people
joining the global wealth middle class has more
than doubled to 31 million (30% of the overall
population), and almost three million eastern
Europeans are now in the global wealth upper
class. All in all, however, there is still a huge gap
separating the eastern EU member states from
their western counterparts. Whereas eastern
European households, which represent 2.1% of
the population of the 53 countries included in
our analysis in 2016, accounted for only 0.6% of
global net financial assets, Western Europe’s
EU citizens, which represent 8.0% of the popula-
tion, accounted for almost 18% of global assets.
At EUR 56,920, average per capita assets in the
EU countries in Western Europe were about sev-
en times higher than in the eastern European
member states.
Eastern European countries outside of the EU
Growth rates for household savings in Kazakh-
stan, Russia, Serbia, Turkey and Ukraine have
been consistently impressive, averaging 18% a
year over the past decade. Despite this dynam-
ic development, only 0.7% of global assets, or
around EUR 1.2 trillion, were attributable to this
group of countries at the end of 2016 – although
these countries are home to no less than 5.8% of
the total population of the countries included
in our analysis. Assets are correspondingly low
in per capita terms, too: people living in these
countries had average gross financial assets
of EUR 4,100, while savings in the EU member
states were almost three times this amount.
Last year, asset growth in these five countries
came to 9% in total, considerably lower than the
historical average.
However, based on the long-term av-
erage, liabilities have been growing at an even
faster rate than savings. In the period between
2006 and 2016, the liabilities side of the asset
balance sheet was growing at an average rate of
around 22% a year. Nevertheless, debt measured
as a percentage of economic output was still
at a relatively low level. The debt ratio of 16.5%
at the end of 2016 was still much lower than in
Regi
onal
diff
eren
ces .
Eas
tern
Eur
ope
104Latin America (just under 29%) or Asia (around
50%). Average per capita debt of EUR 1,270 was
also lower in this group of countries than the
average for all emerging markets (EUR 1,830).
The pace of debt growth has slowed drastically
over the last few years from almost 28% in 2011
to around 3% in 2015 and about 4% last year.
Households had net average assets of EUR 2,830
per capita. The lion’s share of total net financial
assets was owned by Russian (72%) and Turkish
(21%) households, two countries that are home
to more than three-quarters of the population of
this group of countries.
As a net commodities exporter, Russia
has been hit particularly hard by the slump in
oil prices, but is slowly emerging from recession.
Economic output fell by “only” 0.2% in real terms
in 2016, following a drop of 2.8% in the previous
year. A sharp plunge in the country’s currency
caused consumer prices to explode. Inflation
doubled to almost 16% during 2015, causing real
wages to fall and leaving households with less
scope to save. Macroeconomic developments
have ultimately left their mark on household
assets, with growth in financial assets slowing
from 16.7% in 2014 to 13.7% in 2015 and to an
estimated 6% last year. At least inflation also
dropped to an annual average of 7.1% in 2016,
although this was still higher than growth in
assets, meaning that Russian households suf-
fered a further loss of assets in real terms. Af-
ter deduction of liabilities of EUR 1,480 – which
have more or less stagnated in the last two years
– Russians’ savings came to an average of EUR
4,180 per capita.
In Ukraine, on the other hand, asset de-
velopment recovered last year. Gross financial
assets grew at an estimated rate of just under
9%, making up for the losses sustained in 2014
and 2015 – at least on paper. After deduction of
inflation of almost 15% last year, all asset growth
was lost. Average net financial assets per capita
came to just EUR 680 at the end of 2016, the low-
est figure among the countries analyzed.
Asset growth in Turkey remained stable
in 2016 at 15.8%, the same high level as in pre-
vious years. The country’s economic develop-
ment since the financial crisis of 2001 has been
impressive. Turkish GDP has grown by an aver-
age of 5.7% per year in real terms and nominal
economic output per capita has increased more
than eight-fold during this period, to an average
Allia
nz G
loba
l Wea
lth R
epor
t 201
7
105of EUR 8,640. Even the global economic and fi-
nancial crisis curbed development only briefly,
as the country had set about implementing im-
portant reforms, such as the stabilization of the
banking sector, after the 2001 crisis. The coun-
try’s economic upturn also allowed the popu-
lation to achieve a certain level of prosperity,
and private household savings have increased
almost five-fold over the last decade. A growing
middle class has emerged, with 8 million of the
country’s almost 80 million inhabitants joining
the ranks of the global wealth middle class. Pri-
vate savings, which totaled EUR 315 billion at the
end of 2016, are still invested very conservatively,
with around three-quarters of financial assets
held in the form of bank deposits, well above the
average for emerging countries (just under 41%).
More than one-third of this sum was denomi-
nated in foreign currencies, reflecting a lack of
trust in the domestic currency. The weak lira,
which lost around 17% against the euro last year
alone, is making imports more expensive and
driving up inflation. The inflation rate peaked at
11.9% in April this year, its highest level for nine
years and a long way off the target of 5%. After
deduction of liabilities, which came to an aver-
age of EUR 1,720 per capita at the end of last year
(+8.8%), Turkish households were left with aver-
age net financial assets of EUR 2,240 per capita.
However, Turkey still has a long way to go before
catching up with eastern European EU member
states. If average net per capita financial assets
continued to rise in line with the average annual
growth rate over the past decade of about 10%,
Turkey would not reach the level that eastern Eu-
ropean EU countries are currently at until 2029.
In the context of the current developments in
domestic and foreign policy, however, there is a
large question mark over this assumption. The
repressive policy adopted by Erdogan’s govern-
ment, particularly since the foiled coup attempt
in July 2016, could jeopardize past achievements.
For the Turkish economy in particular, which is
heavily dependent on inflows of foreign capital,
it is vital to have the trust of international inves-
tors in a functioning constitutional state with
independent institutions.
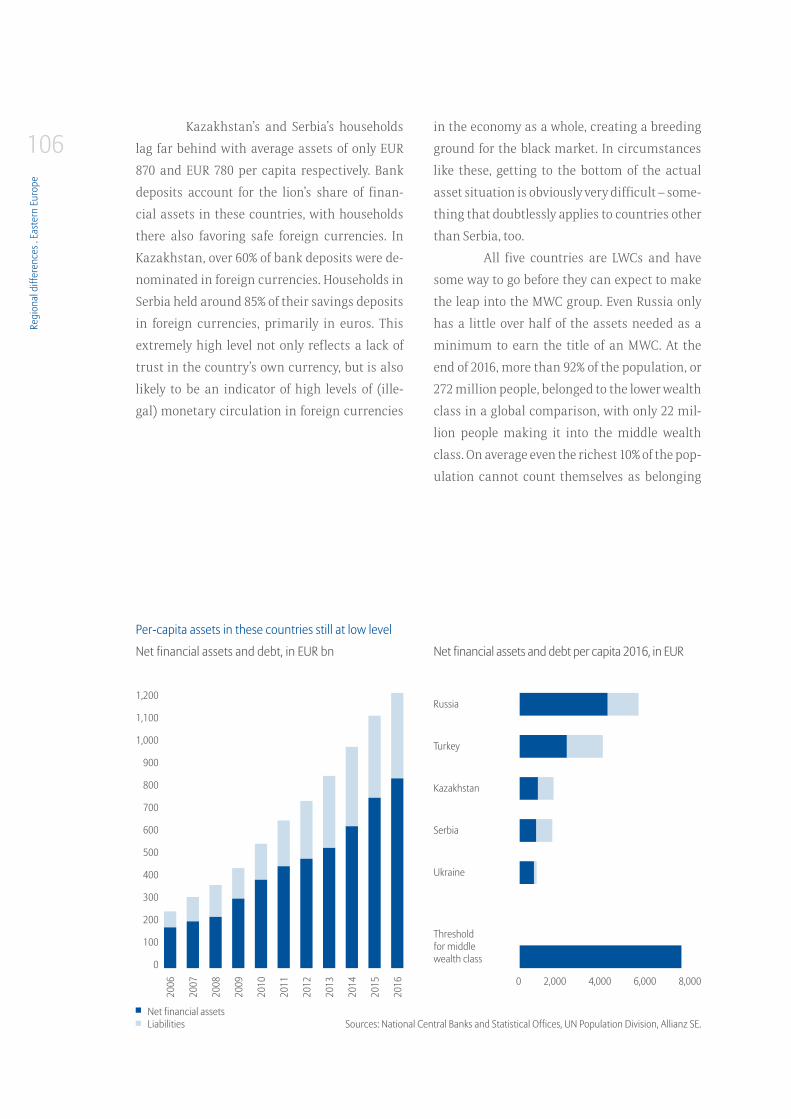
Regi
onal
diff
eren
ces .
Eas
tern
Eur
ope
106
Per-capita assets in these countries still at low level
Net financial assets and debt, in EUR bn Net financial assets and debt per capita 2016, in EUR
Sources: National Central Banks and Statistical Offices, UN Population Division, Allianz SE.Net financial assetsLiabilities
1,200
1,100
1,000
900
800
700
600
500
400
300
200
100
0
2006
2007
2008
2009
2010
2011
2012
2013
2014
2015
2016
Russia
Turkey
Kazakhstan
Serbia
Ukraine
Threshold for middle wealth class
Kazakhstan’s and Serbia’s households
lag far behind with average assets of only EUR
870 and EUR 780 per capita respectively. Bank
deposits account for the lion’s share of finan-
cial assets in these countries, with households
there also favoring safe foreign currencies. In
Kazakhstan, over 60% of bank deposits were de-
nominated in foreign currencies. Households in
Serbia held around 85% of their savings deposits
in foreign currencies, primarily in euros. This
extremely high level not only reflects a lack of
trust in the country’s own currency, but is also
likely to be an indicator of high levels of (ille-
gal) monetary circulation in foreign currencies
in the economy as a whole, creating a breeding
ground for the black market. In circumstances
like these, getting to the bottom of the actual
asset situation is obviously very difficult – some-
thing that doubtlessly applies to countries other
than Serbia, too.
All five countries are LWCs and have
some way to go before they can expect to make
the leap into the MWC group. Even Russia only
has a little over half of the assets needed as a
minimum to earn the title of an MWC. At the
end of 2016, more than 92% of the population, or
272 million people, belonged to the lower wealth
class in a global comparison, with only 22 mil-
lion people making it into the middle wealth
class. On average even the richest 10% of the pop-
ulation cannot count themselves as belonging
0 2,000 4,000 6,000 8,000
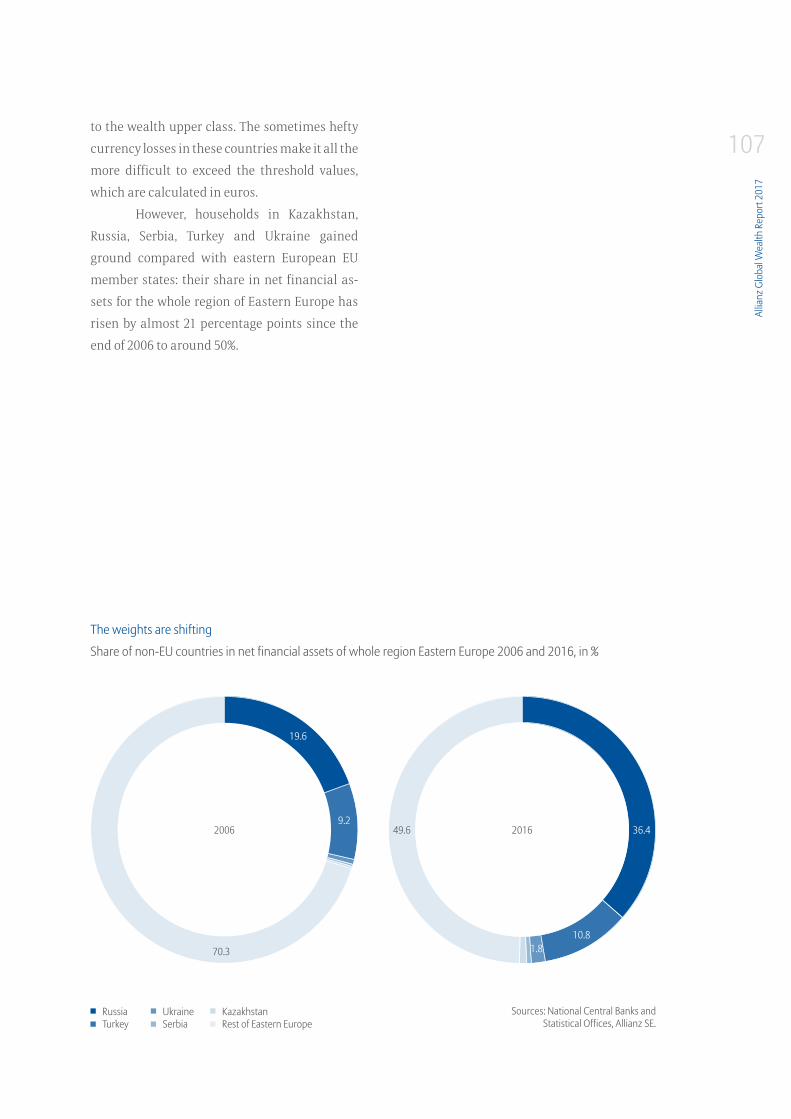
Allia
nz G
loba
l Wea
lth R
epor
t 201
7
107
The weights are shifting
Share of non-EU countries in net financial assets of whole region Eastern Europe 2006 and 2016, in %
Sources: National Central Banks and Statistical Offices, Allianz SE.
RussiaTurkey
UkraineSerbia
KazakhstanRest of Eastern Europe
to the wealth upper class. The sometimes hefty
currency losses in these countries make it all the
more difficult to exceed the threshold values,
which are calculated in euros.
However, households in Kazakhstan,
Russia, Serbia, Turkey and Ukraine gained
ground compared with eastern European EU
member states: their share in net financial as-
sets for the whole region of Eastern Europe has
risen by almost 21 percentage points since the
end of 2006 to around 50%.
70.3
49.69.2
10.81.8
2006 2016
19.6
36.4

108
Vorwort . Zusammenfassung . Entwicklung des globalen Geldvermögens . Verteilung des globalen Geldvermögens . Regionale Unterschiede . Literatur . Appendix
108

Asia
PopulationIn the analyzed countries · · · · · · · · · · · · · · · · · · · · · · · · · · · · · · · · · · · · · · · · · · · · · · · · · · · · · 3,305 m Analyzed countries’ share of the region as a whole · · · · · · · · · · · · · · · · · · · · · · · · · · · · · 86.6% Analyzed countries’ share of the global population · · · · · · · · · · · · · · · · · · · · · · · · · · · · · 44.8%
GDPIn the analyzed countries · · · · · · · · · · · · · · · · · · · · · · · · · · · · · · · · · · · · · · · · · · · · · · · EUR 20,510bnAnalyzed countries’ share of the region as a whole · · · · · · · · · · · · · · · · · · · · · · · · · · · · · 94.5% Analyzed countries’ share of global GDP · · · · · · · · · · · · · · · · · · · · · · · · · · · · · · · · · · · · · · · · 30.0%
Gross financial assets of private householdsTotal · · · · · · · · · · · · · · · · · · · · · · · · · · · · · · · · · · · · · · · · · · · · · · · · · · · · · · · · · · · · · · · · · · · · EUR 47,620bnAverage · · · · · · · · · · · · · · · · · · · · · · · · · · · · · · · · · · · · · · · · · · · · · · · · · · · · · · · · ·EUR 14,410 per capitaShare of global financial assets · · · · · · · · · · · · · · · · · · · · · · · · · · · · · · · · · · · · · · · · · · · · · · · · · 28.1%
Debt of private householdsTotal · · · · · · · · · · · · · · · · · · · · · · · · · · · · · · · · · · · · · · · · · · · · · · · · · · · · · · · · · · · · · · · · · · · · EUR 10,287bnAverage · · · · · · · · · · · · · · · · · · · · · · · · · · · · · · · · · · · · · · · · · · · · · · · · · · · · · · · · · · EUR 3,110 per capitaAs % of GDP · · · · · · · · · · · · · · · · · · · · · · · · · · · · · · · · · · · · · · · · · · · · · · · · · · · · · · · · · · · · · · · · · · · · · 50.2%
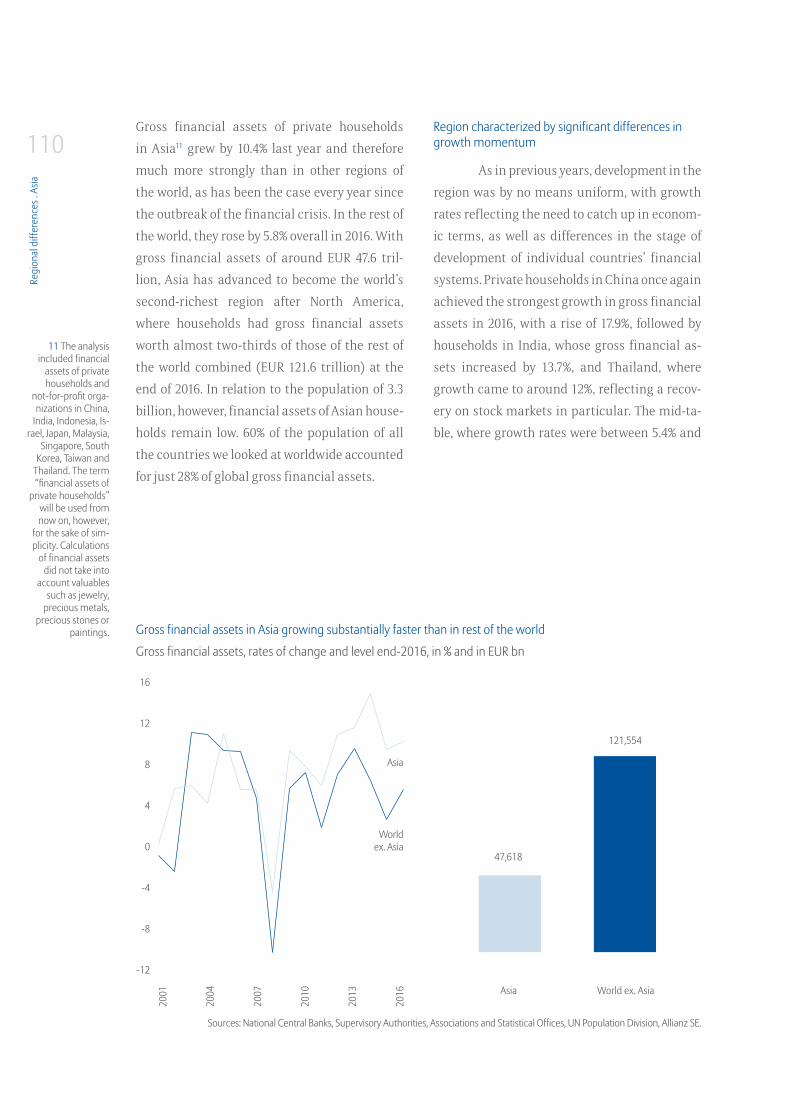
Regi
onal
diff
eren
ces .
Asia
110Gross financial assets of private households
in Asia11 grew by 10.4% last year and therefore
much more strongly than in other regions of
the world, as has been the case every year since
the outbreak of the financial crisis. In the rest of
the world, they rose by 5.8% overall in 2016. With
gross financial assets of around EUR 47.6 tril-
lion, Asia has advanced to become the world’s
second-richest region after North America,
where households had gross financial assets
worth almost two-thirds of those of the rest of
the world combined (EUR 121.6 trillion) at the
end of 2016. In relation to the population of 3.3
billion, however, financial assets of Asian house-
holds remain low. 60% of the population of all
the countries we looked at worldwide accounted
for just 28% of global gross financial assets.
Region characterized by significant differences in growth momentum
As in previous years, development in the
region was by no means uniform, with growth
rates reflecting the need to catch up in econom-
ic terms, as well as differences in the stage of
development of individual countries’ financial
systems. Private households in China once again
achieved the strongest growth in gross financial
assets in 2016, with a rise of 17.9%, followed by
households in India, whose gross financial as-
sets increased by 13.7%, and Thailand, where
growth came to around 12%, reflecting a recov-
ery on stock markets in particular. The mid-ta-
ble, where growth rates were between 5.4% and
Gross financial assets in Asia growing substantially faster than in rest of the world
Gross financial assets, rates of change and level end-2016, in % and in EUR bn
Sources: National Central Banks, Supervisory Authorities, Associations and Statistical Offices, UN Population Division, Allianz SE.
Asia
World ex. Asia
11 The analysis included financial
assets of private households and
not-for-profit orga-nizations in China,
India, Indonesia, Is-rael, Japan, Malaysia,
Singapore, South Korea, Taiwan and
Thailand. The term “financial assets of
private households” will be used from now on, however,
for the sake of sim-plicity. Calculations
of financial assets did not take into
account valuables such as jewelry,
precious metals, precious stones or
paintings.
16
12
8
4
0
-4
-8
-12
2001
2004
2007
2010
2013
2016 Asia World ex. Asia
47,618
121,554
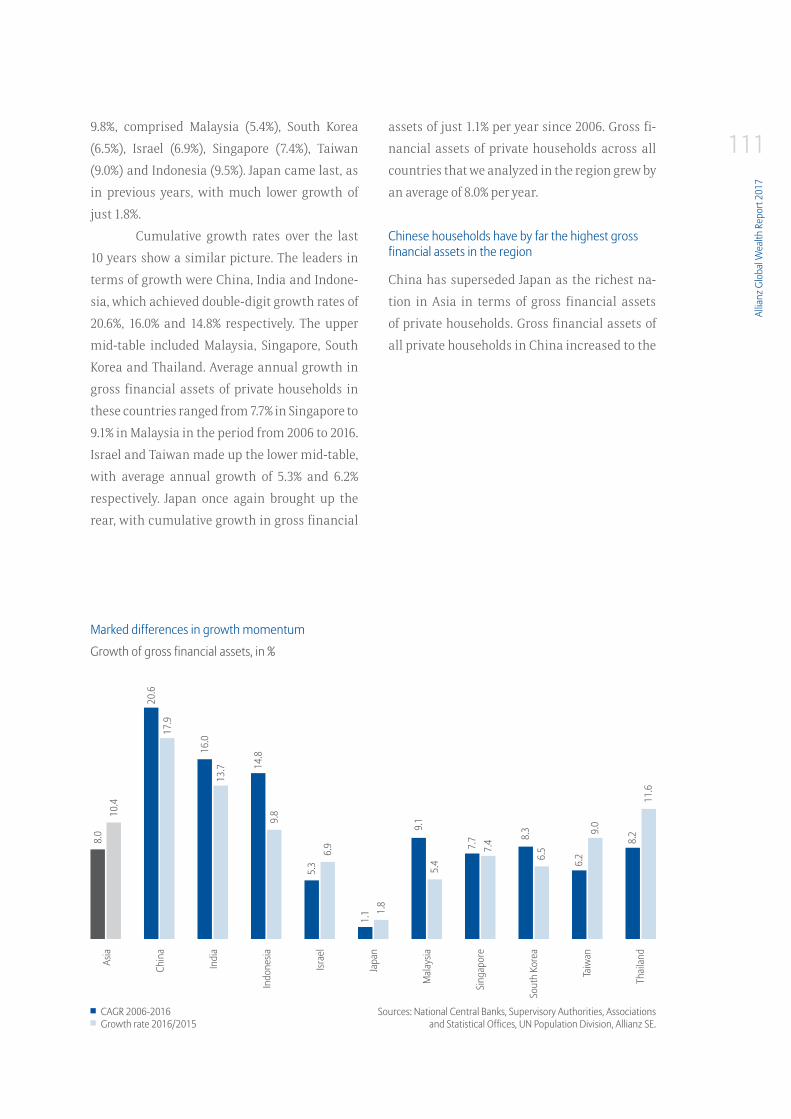
Allia
nz G
loba
l Wea
lth R
epor
t 201
7
1119.8%, comprised Malaysia (5.4%), South Korea
(6.5%), Israel (6.9%), Singapore (7.4%), Taiwan
(9.0%) and Indonesia (9.5%). Japan came last, as
in previous years, with much lower growth of
just 1.8%.
Cumulative growth rates over the last
10 years show a similar picture. The leaders in
terms of growth were China, India and Indone-
sia, which achieved double-digit growth rates of
20.6%, 16.0% and 14.8% respectively. The upper
mid-table included Malaysia, Singapore, South
Korea and Thailand. Average annual growth in
gross financial assets of private households in
these countries ranged from 7.7% in Singapore to
9.1% in Malaysia in the period from 2006 to 2016.
Israel and Taiwan made up the lower mid-table,
with average annual growth of 5.3% and 6.2%
respectively. Japan once again brought up the
rear, with cumulative growth in gross financial
assets of just 1.1% per year since 2006. Gross fi-
nancial assets of private households across all
countries that we analyzed in the region grew by
an average of 8.0% per year.
Chinese households have by far the highest gross financial assets in the region
China has superseded Japan as the richest na-
tion in Asia in terms of gross financial assets
of private households. Gross financial assets of
all private households in China increased to the
Growth of gross financial assets, in %
Marked differences in growth momentum
Sources: National Central Banks, Supervisory Authorities, Associations and Statistical Offices, UN Population Division, Allianz SE.
CAGR 2006-2016Growth rate 2016/2015
Asia
Chin
a
Indi
a
Indo
nesia
Israe
l
Japa
n
Mal
aysia
Sing
apor
e
Sout
h Ko
rea
Taiw
an
Thai
land
8.0
20.6
16.0
14.8
5.3
1.1
9.1
7.7 8.
3
8.2
6.2
10.4
17.9
13.7
9.8
6.9
1.8
5.4
7.4
6.5
11.6
9.0
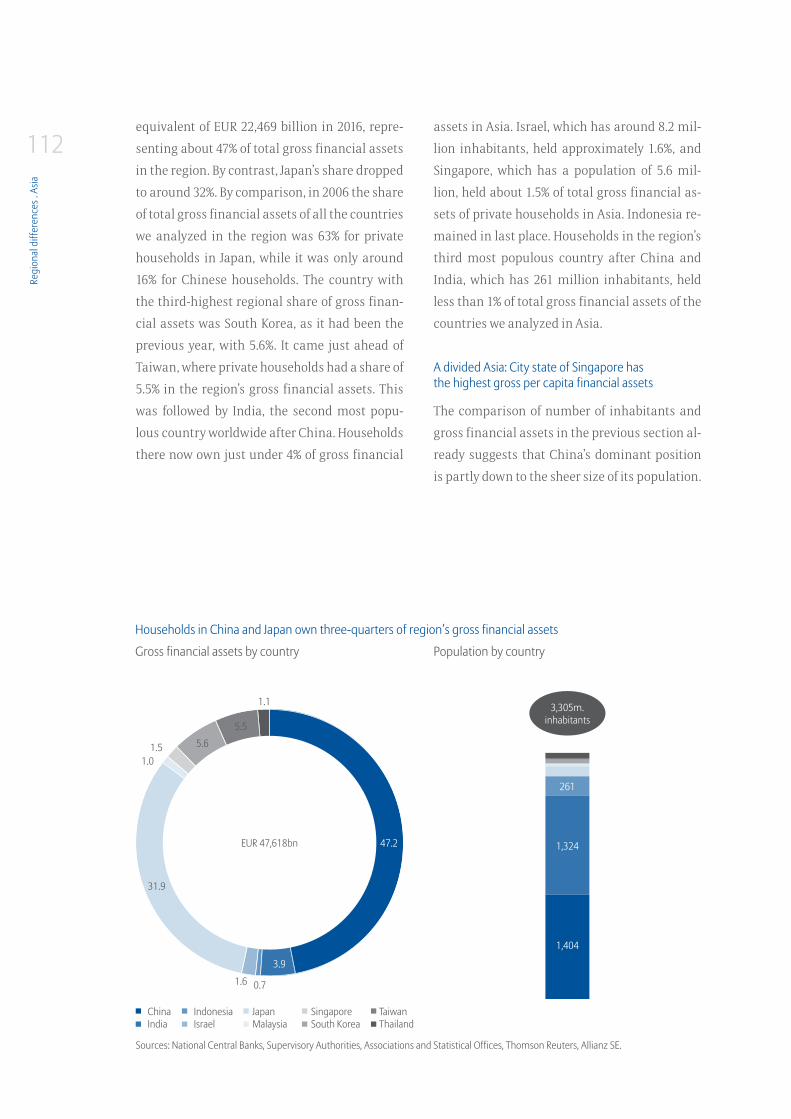
Regi
onal
diff
eren
ces .
Asia
112equivalent of EUR 22,469 billion in 2016, repre-
senting about 47% of total gross financial assets
in the region. By contrast, Japan’s share dropped
to around 32%. By comparison, in 2006 the share
of total gross financial assets of all the countries
we analyzed in the region was 63% for private
households in Japan, while it was only around
16% for Chinese households. The country with
the third-highest regional share of gross finan-
cial assets was South Korea, as it had been the
previous year, with 5.6%. It came just ahead of
Taiwan, where private households had a share of
5.5% in the region’s gross financial assets. This
was followed by India, the second most popu-
lous country worldwide after China. Households
there now own just under 4% of gross financial
assets in Asia. Israel, which has around 8.2 mil-
lion inhabitants, held approximately 1.6%, and
Singapore, which has a population of 5.6 mil-
lion, held about 1.5% of total gross financial as-
sets of private households in Asia. Indonesia re-
mained in last place. Households in the region’s
third most populous country after China and
India, which has 261 million inhabitants, held
less than 1% of total gross financial assets of the
countries we analyzed in Asia.
A divided Asia: City state of Singapore has the highest gross per capita financial assets
The comparison of number of inhabitants and
gross financial assets in the previous section al-
ready suggests that China’s dominant position
is partly down to the sheer size of its population.
Households in China and Japan own three-quarters of region’s gross financial assets
Gross financial assets by country Population by country
Sources: National Central Banks, Supervisory Authorities, Associations and Statistical Offices, Thomson Reuters, Allianz SE.
1,404
1,324
261
3,305m.inhabitants
ChinaIndia
IndonesiaIsrael
JapanMalaysia
SingaporeSouth Korea
TaiwanThailand
47.2EUR 47,618bn
3.9
0.71.6
31.9
1.01.5 5.6
5.5
1.1
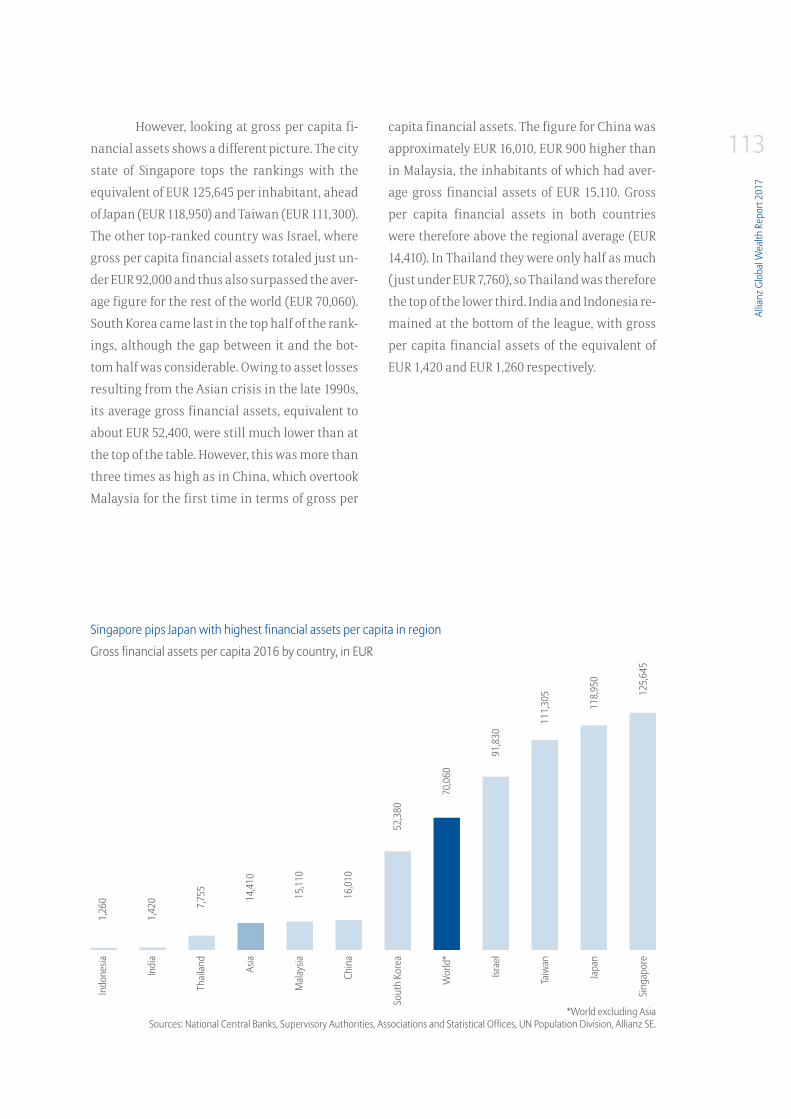
Allia
nz G
loba
l Wea
lth R
epor
t 201
7
113However, looking at gross per capita fi-
nancial assets shows a different picture. The city
state of Singapore tops the rankings with the
equivalent of EUR 125,645 per inhabitant, ahead
of Japan (EUR 118,950) and Taiwan (EUR 111,300).
The other top-ranked country was Israel, where
gross per capita financial assets totaled just un-
der EUR 92,000 and thus also surpassed the aver-
age figure for the rest of the world (EUR 70,060).
South Korea came last in the top half of the rank-
ings, although the gap between it and the bot-
tom half was considerable. Owing to asset losses
resulting from the Asian crisis in the late 1990s,
its average gross financial assets, equivalent to
about EUR 52,400, were still much lower than at
the top of the table. However, this was more than
three times as high as in China, which overtook
Malaysia for the first time in terms of gross per
capita financial assets. The figure for China was
approximately EUR 16,010, EUR 900 higher than
in Malaysia, the inhabitants of which had aver-
age gross financial assets of EUR 15,110. Gross
per capita financial assets in both countries
were therefore above the regional average (EUR
14,410). In Thailand they were only half as much
(just under EUR 7,760), so Thailand was therefore
the top of the lower third. India and Indonesia re-
mained at the bottom of the league, with gross
per capita financial assets of the equivalent of
EUR 1,420 and EUR 1,260 respectively.
Gross financial assets per capita 2016 by country, in EUR
Singapore pips Japan with highest financial assets per capita in region
*World excluding AsiaSources: National Central Banks, Supervisory Authorities, Associations and Statistical Offices, UN Population Division, Allianz SE.
Indo
nesia
Indi
a
Thai
land Asia
Mal
aysia
Chin
a
Sout
h Ko
rea
Wor
ld*
Israe
l
Taiw
an
Japa
n
Sing
apor
e
1,26
0
1,42
0 7,75
5
14,4
10
15,1
10
16,0
10
52,3
80
70,0
60
91,8
30
111,
305
118,
950
125,
645
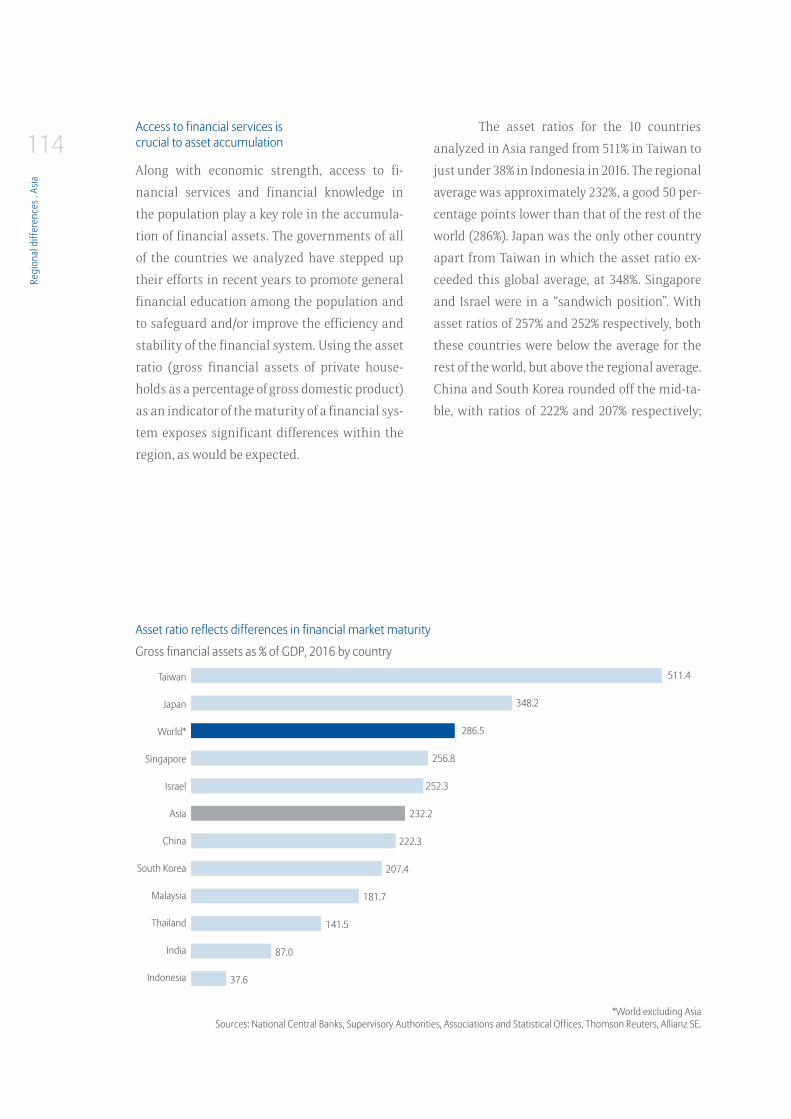
Regi
onal
diff
eren
ces .
Asia
114Access to financial services is crucial to asset accumulation
Along with economic strength, access to fi-
nancial services and financial knowledge in
the population play a key role in the accumula-
tion of financial assets. The governments of all
of the countries we analyzed have stepped up
their efforts in recent years to promote general
financial education among the population and
to safeguard and/or improve the efficiency and
stability of the financial system. Using the asset
ratio (gross financial assets of private house-
holds as a percentage of gross domestic product)
as an indicator of the maturity of a financial sys-
tem exposes significant differences within the
region, as would be expected.
The asset ratios for the 10 countries
analyzed in Asia ranged from 511% in Taiwan to
just under 38% in Indonesia in 2016. The regional
average was approximately 232%, a good 50 per-
centage points lower than that of the rest of the
world (286%). Japan was the only other country
apart from Taiwan in which the asset ratio ex-
ceeded this global average, at 348%. Singapore
and Israel were in a “sandwich position”. With
asset ratios of 257% and 252% respectively, both
these countries were below the average for the
rest of the world, but above the regional average.
China and South Korea rounded off the mid-ta-
ble, with ratios of 222% and 207% respectively;
Asset ratio reflects differences in financial market maturity
Gross financial assets as % of GDP, 2016 by country
*World excluding AsiaSources: National Central Banks, Supervisory Authorities, Associations and Statistical Offices, Thomson Reuters, Allianz SE.
Taiwan
Japan
World*
Singapore
Israel
Asia
China
South Korea
Malaysia
Thailand
India
Indonesia
511.4
348.2
286.5
256.8
252.3
232.2
222.3
207.4
181.7
141.5
87.0
37.6
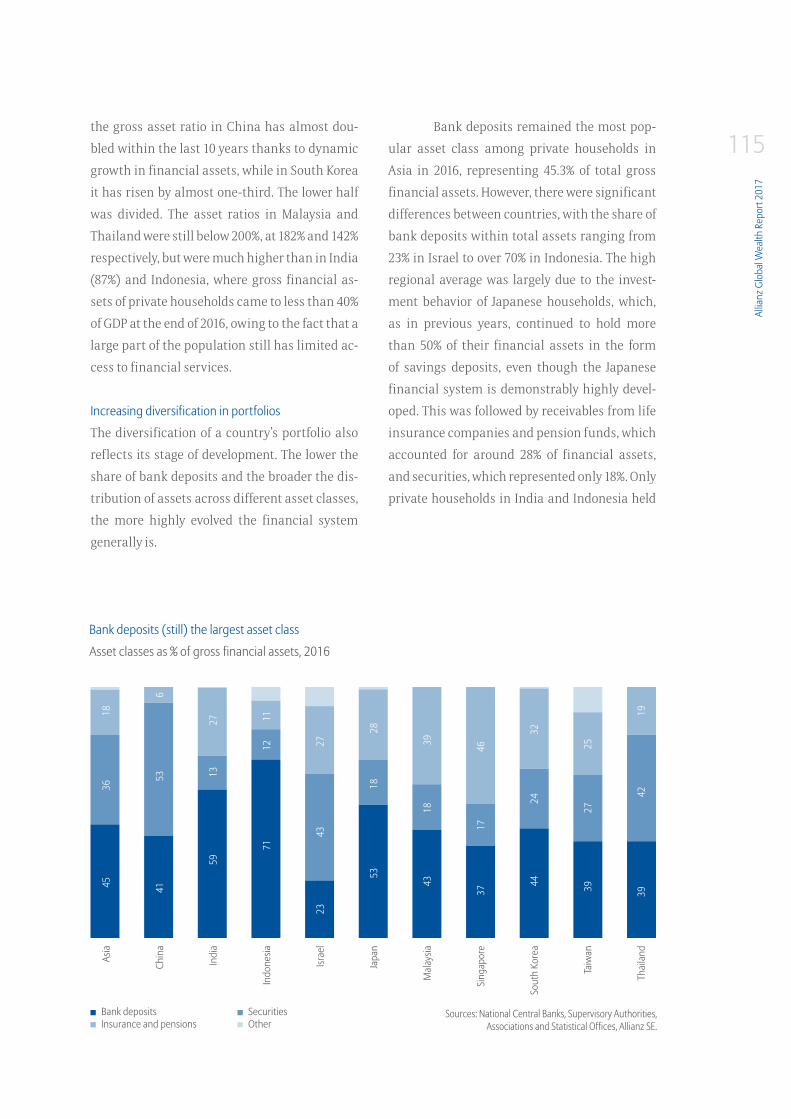
Allia
nz G
loba
l Wea
lth R
epor
t 201
7
115the gross asset ratio in China has almost dou-
bled within the last 10 years thanks to dynamic
growth in financial assets, while in South Korea
it has risen by almost one-third. The lower half
was divided. The asset ratios in Malaysia and
Thailand were still below 200%, at 182% and 142%
respectively, but were much higher than in India
(87%) and Indonesia, where gross financial as-
sets of private households came to less than 40%
of GDP at the end of 2016, owing to the fact that a
large part of the population still has limited ac-
cess to financial services.
Increasing diversification in portfolios
The diversification of a country’s portfolio also
reflects its stage of development. The lower the
share of bank deposits and the broader the dis-
tribution of assets across different asset classes,
the more highly evolved the financial system
generally is.
Bank deposits remained the most pop-
ular asset class among private households in
Asia in 2016, representing 45.3% of total gross
financial assets. However, there were significant
differences between countries, with the share of
bank deposits within total assets ranging from
23% in Israel to over 70% in Indonesia. The high
regional average was largely due to the invest-
ment behavior of Japanese households, which,
as in previous years, continued to hold more
than 50% of their financial assets in the form
of savings deposits, even though the Japanese
financial system is demonstrably highly devel-
oped. This was followed by receivables from life
insurance companies and pension funds, which
accounted for around 28% of financial assets,
and securities, which represented only 18%. Only
private households in India and Indonesia held
Bank deposits (still) the largest asset class
Asset classes as % of gross financial assets, 2016
Sources: National Central Banks, Supervisory Authorities, Associations and Statistical Offices, Allianz SE.
SecuritiesOther
Bank depositsInsurance and pensions
Asia
Chin
a
Indi
a
Indo
nesia
Israe
l
Japa
n
Mal
aysia
Sing
apor
e
Sout
h Ko
rea
Taiw
an
Thai
land
45
36
18
41
53
6
59
13
27
71
12
11
23
43
27
53
18
28
43
18
39
37
17
46
44
24
32
39
27
25
39
42
19
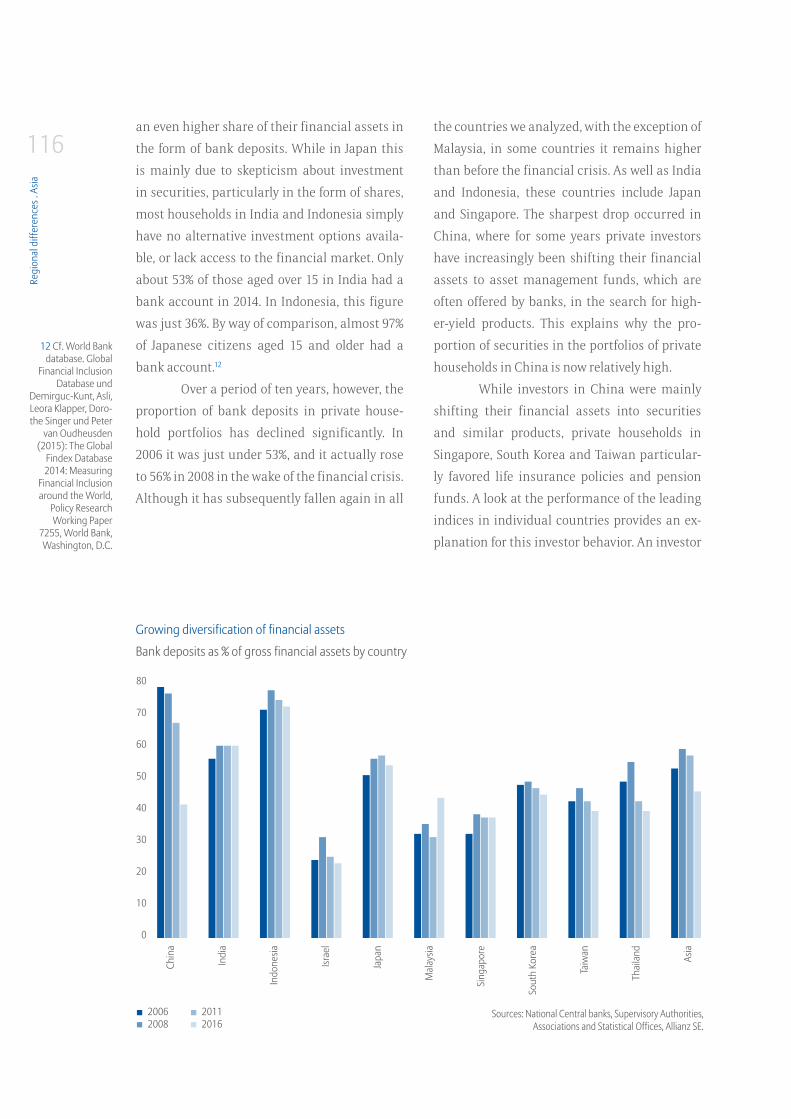
Regi
onal
diff
eren
ces .
Asia
116an even higher share of their financial assets in
the form of bank deposits. While in Japan this
is mainly due to skepticism about investment
in securities, particularly in the form of shares,
most households in India and Indonesia simply
have no alternative investment options availa-
ble, or lack access to the financial market. Only
about 53% of those aged over 15 in India had a
bank account in 2014. In Indonesia, this figure
was just 36%. By way of comparison, almost 97%
of Japanese citizens aged 15 and older had a
bank account.12
Over a period of ten years, however, the
proportion of bank deposits in private house-
hold portfolios has declined significantly. In
2006 it was just under 53%, and it actually rose
to 56% in 2008 in the wake of the financial crisis.
Although it has subsequently fallen again in all
the countries we analyzed, with the exception of
Malaysia, in some countries it remains higher
than before the financial crisis. As well as India
and Indonesia, these countries include Japan
and Singapore. The sharpest drop occurred in
China, where for some years private investors
have increasingly been shifting their financial
assets to asset management funds, which are
often offered by banks, in the search for high-
er-yield products. This explains why the pro-
portion of securities in the portfolios of private
households in China is now relatively high.
While investors in China were mainly
shifting their financial assets into securities
and similar products, private households in
Singapore, South Korea and Taiwan particular-
ly favored life insurance policies and pension
funds. A look at the performance of the leading
indices in individual countries provides an ex-
planation for this investor behavior. An investor
Growing diversification of financial assets
Bank deposits as % of gross financial assets by country
Sources: National Central banks, Supervisory Authorities, Associations and Statistical Offices, Allianz SE.
Chin
a
Indi
a
Indo
nesia
Israe
l
Japa
n
Mal
aysia
Sing
apor
e
Sout
h Ko
rea
Taiw
an
Thai
land Asia
80
70
60
50
40
30
20
10
0
12 Cf. World Bank database. Global
Financial Inclusion Database und
Demirguc-Kunt, Asli, Leora Klapper, Doro-the Singer und Peter
van Oudheusden (2015): The Global
Findex Database 2014: Measuring
Financial Inclusion around the World,
Policy Research Working Paper
7255, World Bank, Washington, D.C.
20112016
20062008
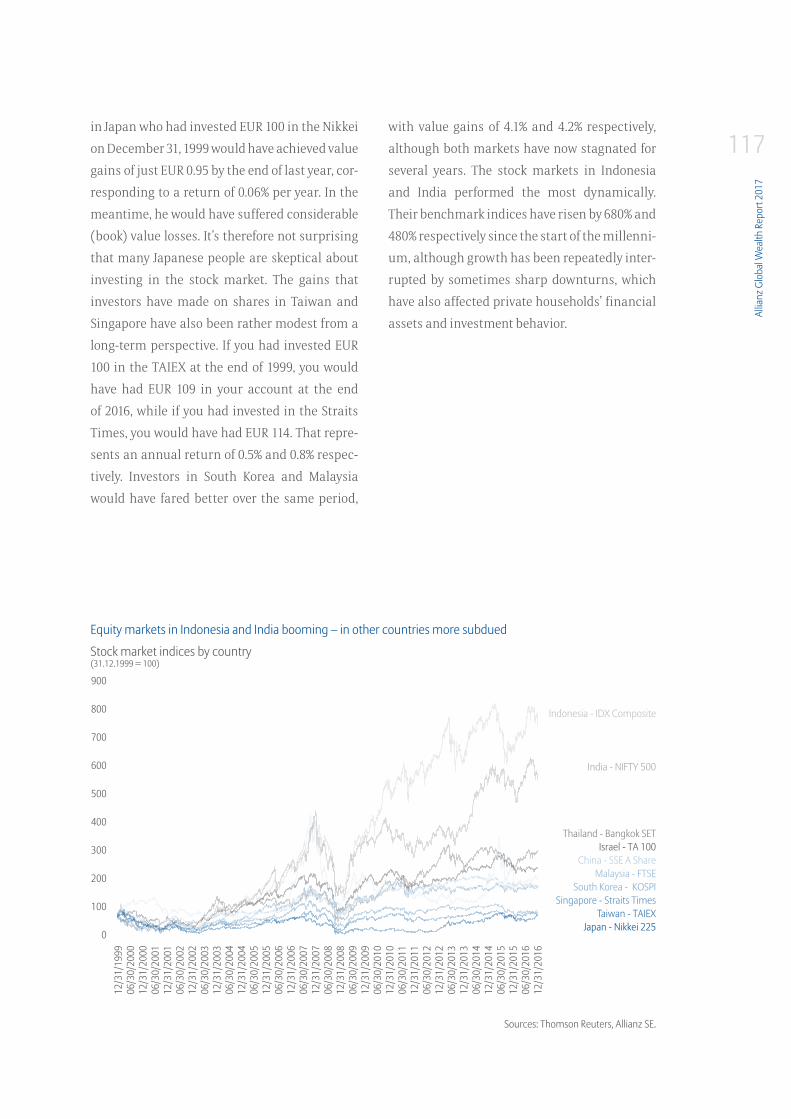
Allia
nz G
loba
l Wea
lth R
epor
t 201
7
117in Japan who had invested EUR 100 in the Nikkei
on December 31, 1999 would have achieved value
gains of just EUR 0.95 by the end of last year, cor-
responding to a return of 0.06% per year. In the
meantime, he would have suffered considerable
(book) value losses. It’s therefore not surprising
that many Japanese people are skeptical about
investing in the stock market. The gains that
investors have made on shares in Taiwan and
Singapore have also been rather modest from a
long-term perspective. If you had invested EUR
100 in the TAIEX at the end of 1999, you would
have had EUR 109 in your account at the end
of 2016, while if you had invested in the Straits
Times, you would have had EUR 114. That repre-
sents an annual return of 0.5% and 0.8% respec-
tively. Investors in South Korea and Malaysia
would have fared better over the same period,
with value gains of 4.1% and 4.2% respectively,
although both markets have now stagnated for
several years. The stock markets in Indonesia
and India performed the most dynamically.
Their benchmark indices have risen by 680% and
480% respectively since the start of the millenni-
um, although growth has been repeatedly inter-
rupted by sometimes sharp downturns, which
have also affected private households’ financial
assets and investment behavior.
Equity markets in Indonesia and India booming – in other countries more subdued
Stock market indices by country (31.12.1999 = 100)
Sources: Thomson Reuters, Allianz SE.
900
800
700
600
500
400
300
200
100
0
Indonesia - IDX Composite
India - NIFTY 500
Thailand - Bangkok SETIsrael - TA 100
China - SSE A ShareMalaysia - FTSE
South Korea - KOSPISingapore - Straits Times
Taiwan - TAIEXJapan - Nikkei 225
12/3
1/19
9906
/30/
2000
12/3
1/20
0006
/30/
2001
12/3
1/20
0106
/30/
2002
12/3
1/20
0206
/30/
2003
12/3
1/20
0306
/30/
2004
12/3
1/20
0406
/30/
2005
12/3
1/20
0506
/30/
2006
12/3
1/20
0606
/30/
2007
12/3
1/20
0706
/30/
2008
12/3
1/20
0806
/30/
2009
12/3
1/20
0906
/30/
2010
12/3
1/20
1006
/30/
2011
12/3
1/20
1106
/30/
2012
12/3
1/20
1206
/30/
2013
12/3
1/20
1306
/30/
2014
12/3
1/20
1406
/30/
2015
12/3
1/20
1506
/30/
2016
12/3
1/20
16
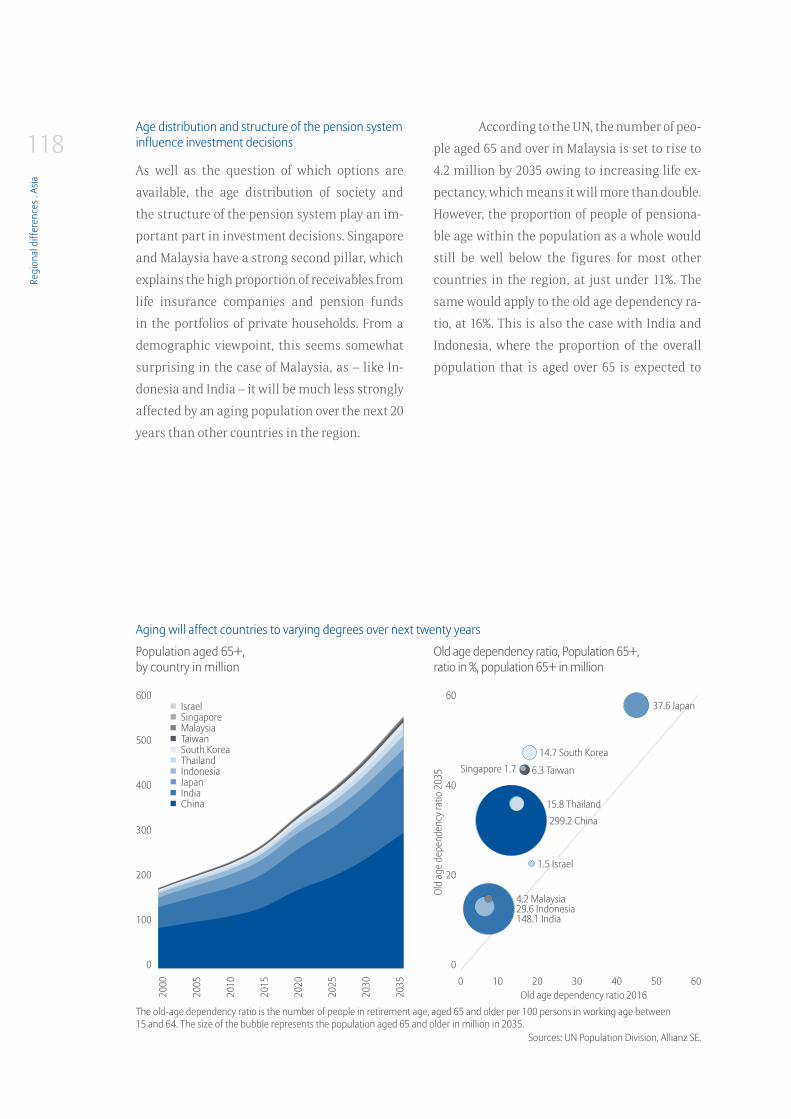
Regi
onal
diff
eren
ces .
Asia
118Age distribution and structure of the pension system influence investment decisions
As well as the question of which options are
available, the age distribution of society and
the structure of the pension system play an im-
portant part in investment decisions. Singapore
and Malaysia have a strong second pillar, which
explains the high proportion of receivables from
life insurance companies and pension funds
in the portfolios of private households. From a
demographic viewpoint, this seems somewhat
surprising in the case of Malaysia, as – like In-
donesia and India – it will be much less strongly
affected by an aging population over the next 20
years than other countries in the region.
According to the UN, the number of peo-
ple aged 65 and over in Malaysia is set to rise to
4.2 million by 2035 owing to increasing life ex-
pectancy, which means it will more than double.
However, the proportion of people of pensiona-
ble age within the population as a whole would
still be well below the figures for most other
countries in the region, at just under 11%. The
same would apply to the old age dependency ra-
tio, at 16%. This is also the case with India and
Indonesia, where the proportion of the overall
population that is aged over 65 is expected to
Aging will affect countries to varying degrees over next twenty years
Population aged 65+, by country in million
Old age dependency ratio, Population 65+, ratio in %, population 65+ in million
Sources: UN Population Division, Allianz SE.
The old-age dependency ratio is the number of people in retirement age, aged 65 and older per 100 persons in working age between 15 and 64. The size of the bubble represents the population aged 65 and older in million in 2035.
600
500
400
300
200
100
0
60
40
20
0
2000
2005
2010
2015
2020
2025
2030
2035 0 10 20 30 40 50 60
Old age dependency ratio 2016
IsraelSingaporeMalaysiaTaiwanSouth KoreaThailandIndonesiaJapanIndiaChina
14.7 South Korea
37.6 Japan
6.3 TaiwanSingapore 1.7
299.2 China
1.5 Israel
4.2 Malaysia29.6 Indonesia148.1 India
15.8 Thailand
Old
age
depe
nden
cy ra
tio 2
035
Allia
nz G
loba
l Wea
lth R
epor
t 201
7
119remain below 10% until 2035, putting the old
age dependency ratio at around 14%. In China,
the old age dependency ratio is already 14%.
The number of people aged over 65 is expected
to grow from 142 million to 299 million by 2035,
leading to an increase in the old age dependen-
cy ratio to over 32%, owing to the decline in the
number of people of working age caused by the
one-child policy. The old age dependency ratio
is expected to rise much more sharply in Sin-
gapore, South Korea, Taiwan and Thailand than
in China. Within the next 20 years, it is set to
increase from its current level of around 17% to
about 43% in Singapore and Taiwan, from 18% to
just under 47% in South Korea and from 15% to
36% in Thailand. In absolute terms, however, Ja-
pan will remain in the lead. The old age depend-
ency ratio there is expected to climb from 44% to
just under 57% by 2035.
Given that the number of people of pen-
sionable age in the countries we have analyzed
is set to increase by 272 million to 559 million
over the next 20 years (by way of comparison,
about 510 million people in total currently live
in the 28 countries of the EU), we can assume
that households will continue to restructure
their financial assets. In particular, the share of
life insurance policies and pensions in private
household portfolios will continue to rise, as in
South Korea and Taiwan. However, the question
arises of whether all households will manage to
save sufficient assets before they reach pension-
able age. This applies in particular to those on
lower incomes, who often have few opportuni-
ties to build up assets to make provision for their
retirement and whose liabilities sometimes ex-
ceed their assets.
Private household debt continues to rise
Private household liabilities increased again
last year in all the countries we analyzed in
the region. The biggest rise of 23.5% was in Chi-
na, while the smallest was in Japan at 2.4%. As
well as Japan, countries at the lower end of the
scale included Singapore (+2.5%) and Thailand,
where credit growth continued to slow and to-
taled 3.3% for 2016. Apart from China, countries
at the upper end of the range included India and
South Korea, where growth rates reached double
figures at 13.5% and 10% respectively. While this
could be classed as “catching up” in the case of
India (and in the case of China), the sustained
strong growth in liabilities in South Korea is
somewhat worrying in view of the country’s debt
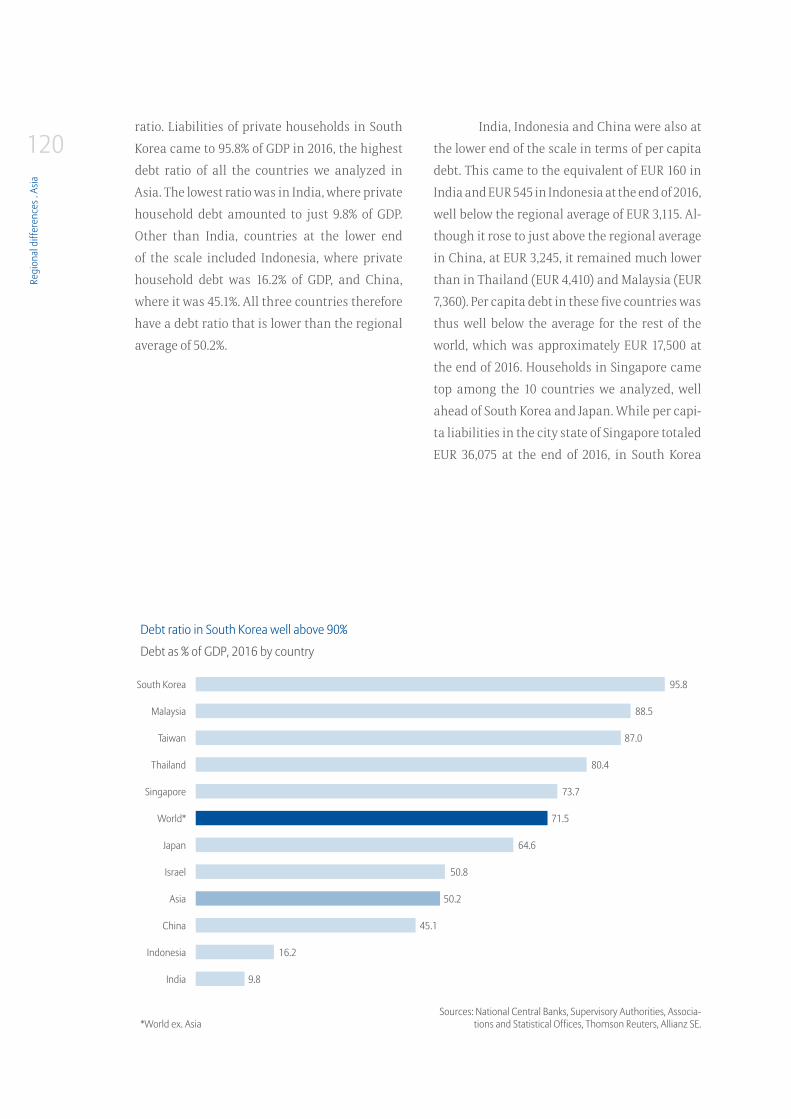
Regi
onal
diff
eren
ces .
Asia
120ratio. Liabilities of private households in South
Korea came to 95.8% of GDP in 2016, the highest
debt ratio of all the countries we analyzed in
Asia. The lowest ratio was in India, where private
household debt amounted to just 9.8% of GDP.
Other than India, countries at the lower end
of the scale included Indonesia, where private
household debt was 16.2% of GDP, and China,
where it was 45.1%. All three countries therefore
have a debt ratio that is lower than the regional
average of 50.2%.
India, Indonesia and China were also at
the lower end of the scale in terms of per capita
debt. This came to the equivalent of EUR 160 in
India and EUR 545 in Indonesia at the end of 2016,
well below the regional average of EUR 3,115. Al-
though it rose to just above the regional average
in China, at EUR 3,245, it remained much lower
than in Thailand (EUR 4,410) and Malaysia (EUR
7,360). Per capita debt in these five countries was
thus well below the average for the rest of the
world, which was approximately EUR 17,500 at
the end of 2016. Households in Singapore came
top among the 10 countries we analyzed, well
ahead of South Korea and Japan. While per capi-
ta liabilities in the city state of Singapore totaled
EUR 36,075 at the end of 2016, in South Korea
Debt ratio in South Korea well above 90%
Sources: National Central Banks, Supervisory Authorities, Associa-tions and Statistical Offices, Thomson Reuters, Allianz SE.*World ex. Asia
Debt as % of GDP, 2016 by country
South Korea
Malaysia
Taiwan
Thailand
Singapore
World*
Japan
Israel
Asia
China
Indonesia
India
95.8
88.5
87.0
80.4
73.7
71.5
64.6
50.8
50.2
45.1
16.2
9.8
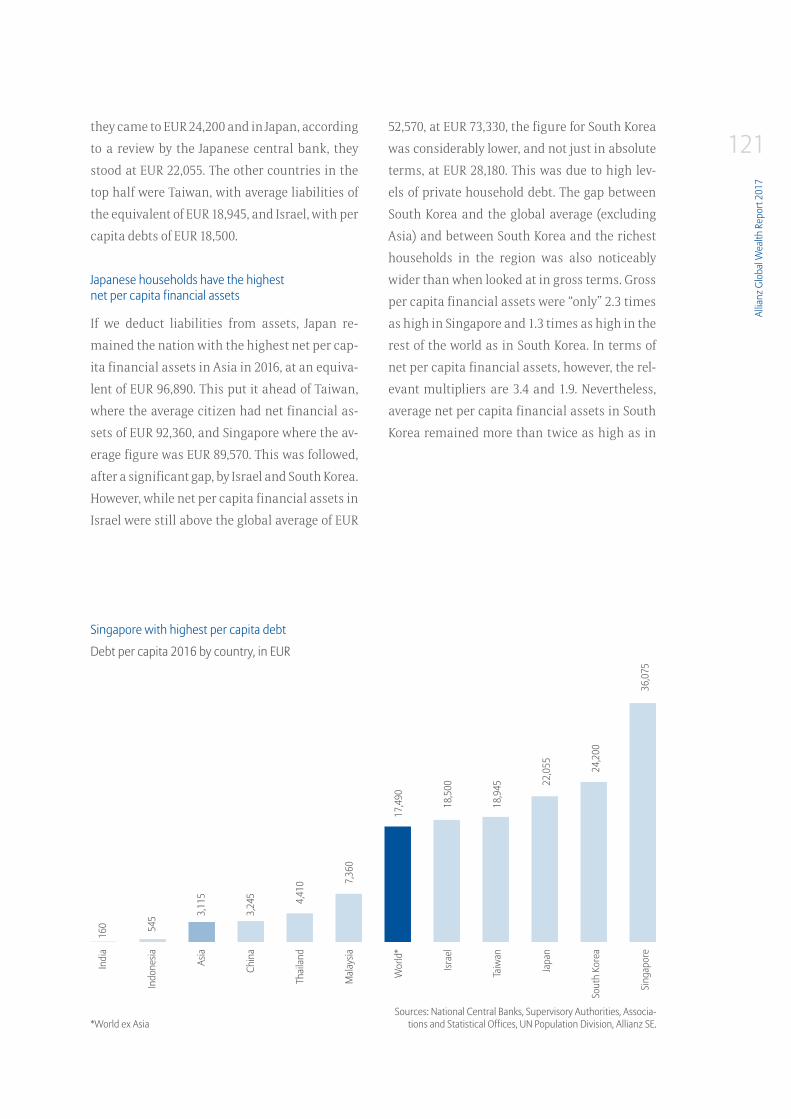
Allia
nz G
loba
l Wea
lth R
epor
t 201
7
121they came to EUR 24,200 and in Japan, according
to a review by the Japanese central bank, they
stood at EUR 22,055. The other countries in the
top half were Taiwan, with average liabilities of
the equivalent of EUR 18,945, and Israel, with per
capita debts of EUR 18,500.
Japanese households have the highest net per capita financial assets
If we deduct liabilities from assets, Japan re-
mained the nation with the highest net per cap-
ita financial assets in Asia in 2016, at an equiva-
lent of EUR 96,890. This put it ahead of Taiwan,
where the average citizen had net financial as-
sets of EUR 92,360, and Singapore where the av-
erage figure was EUR 89,570. This was followed,
after a significant gap, by Israel and South Korea.
However, while net per capita financial assets in
Israel were still above the global average of EUR
52,570, at EUR 73,330, the figure for South Korea
was considerably lower, and not just in absolute
terms, at EUR 28,180. This was due to high lev-
els of private household debt. The gap between
South Korea and the global average (excluding
Asia) and between South Korea and the richest
households in the region was also noticeably
wider than when looked at in gross terms. Gross
per capita financial assets were “only” 2.3 times
as high in Singapore and 1.3 times as high in the
rest of the world as in South Korea. In terms of
net per capita financial assets, however, the rel-
evant multipliers are 3.4 and 1.9. Nevertheless,
average net per capita financial assets in South
Korea remained more than twice as high as in
Singapore with highest per capita debt
Debt per capita 2016 by country, in EUR
*World ex AsiaSources: National Central Banks, Supervisory Authorities, Associa-
tions and Statistical Offices, UN Population Division, Allianz SE.
Indi
a
Indo
nesia Asia
Chin
a
Thai
land
Mal
aysia
Wor
ld*
Israe
l
Taiw
an
Japa
n
Sout
h Ko
rea
Sing
apor
e
160
545
3,
115
3,
245
4,41
0
7,
360
17,4
90
18
,500
18
,945
22,0
55
24
,200
36,0
75
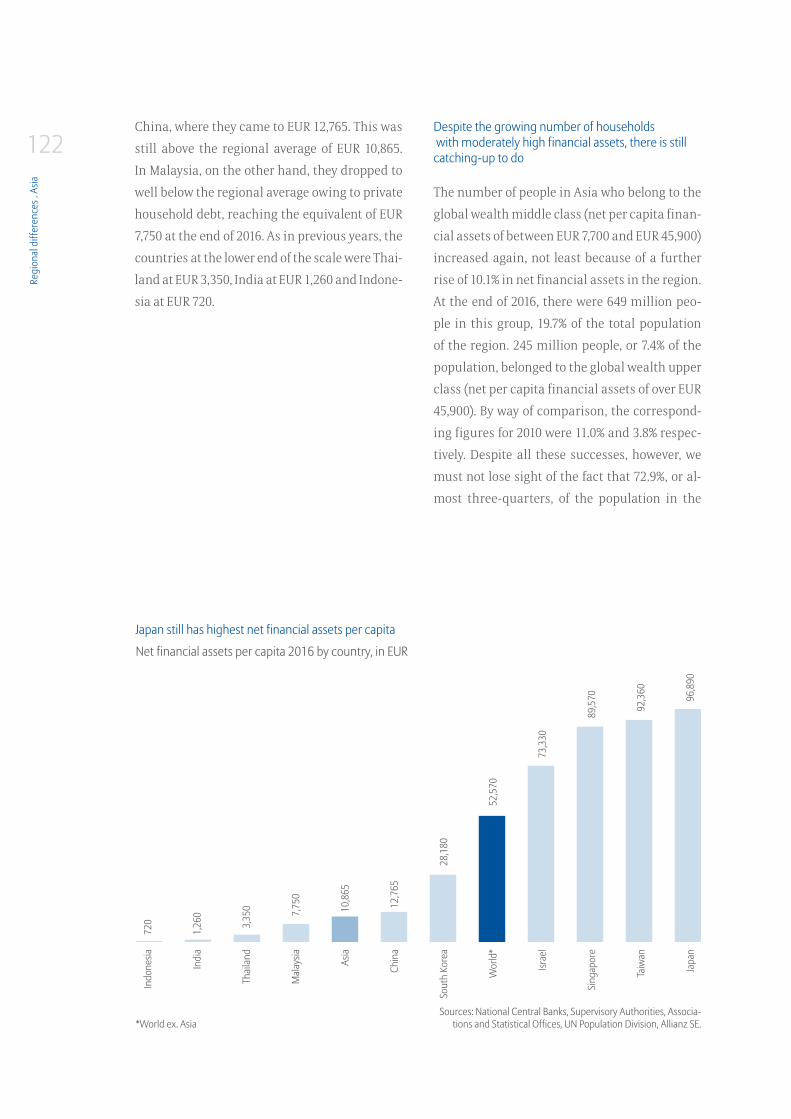
Regi
onal
diff
eren
ces .
Asia
122China, where they came to EUR 12,765. This was
still above the regional average of EUR 10,865.
In Malaysia, on the other hand, they dropped to
well below the regional average owing to private
household debt, reaching the equivalent of EUR
7,750 at the end of 2016. As in previous years, the
countries at the lower end of the scale were Thai-
land at EUR 3,350, India at EUR 1,260 and Indone-
sia at EUR 720.
Despite the growing number of households with moderately high financial assets, there is still catching-up to do
The number of people in Asia who belong to the
global wealth middle class (net per capita finan-
cial assets of between EUR 7,700 and EUR 45,900)
increased again, not least because of a further
rise of 10.1% in net financial assets in the region.
At the end of 2016, there were 649 million peo-
ple in this group, 19.7% of the total population
of the region. 245 million people, or 7.4% of the
population, belonged to the global wealth upper
class (net per capita financial assets of over EUR
45,900). By way of comparison, the correspond-
ing figures for 2010 were 11.0% and 3.8% respec-
tively. Despite all these successes, however, we
must not lose sight of the fact that 72.9%, or al-
most three-quarters, of the population in the
Japan still has highest net financial assets per capita
Net financial assets per capita 2016 by country, in EUR
*World ex. AsiaSources: National Central Banks, Supervisory Authorities, Associa-
tions and Statistical Offices, UN Population Division, Allianz SE.
Indo
nesia
Indi
a
Thai
land
Mal
aysia Asia
Chin
a
Sout
h Ko
rea
Wor
ld*
Israe
l
Sing
apor
e
Taiw
an
Japa
n
720
1,2
60
3,
350
7,75
0
10,
865
12
,765
28,1
80
52
,570
73,3
30
89
,570
9
2,36
0
96,
890

Allia
nz G
loba
l Wea
lth R
epor
t 201
7
123region still has net per capita financial assets
of less than EUR 7,700, and thus belongs to the
global wealth lower class. With populations ag-
ing and state social security systems often pro-
viding only rudimentary protection in old age,
there is therefore still an urgent need for these
countries to catch up in terms of development
of financial systems and access to appropriate
financial services, in order to further improve
opportunities to build up long-term savings.
124
Vorwort . Zusammenfassung . Entwicklung des globalen Geldvermögens . Verteilung des globalen Geldvermögens . Regionale Unterschiede . Literatur . Appendix
124
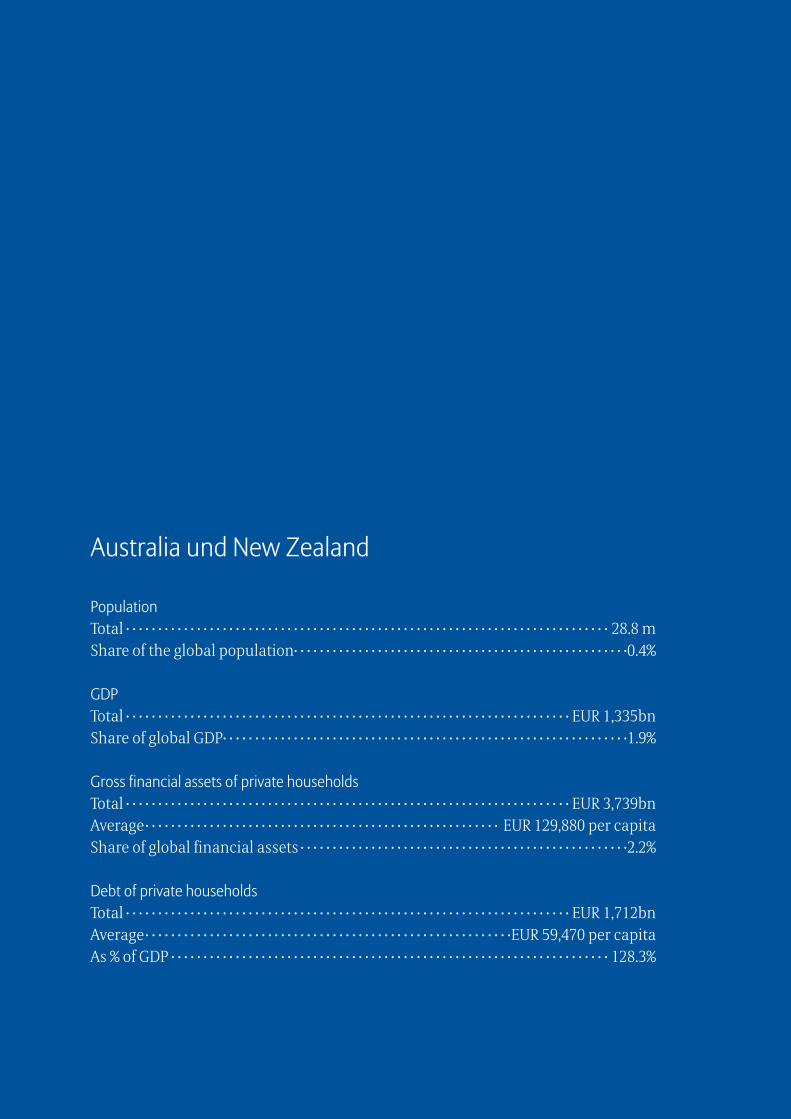
Australia und New Zealand
PopulationTotal · · · · · · · · · · · · · · · · · · · · · · · · · · · · · · · · · · · · · · · · · · · · · · · · · · · · · · · · · · · · · · · · · · · · · · · · · · · 28.8 mShare of the global population · · · · · · · · · · · · · · · · · · · · · · · · · · · · · · · · · · · · · · · · · · · · · · · · · · · ·0.4%
GDPTotal · · · · · · · · · · · · · · · · · · · · · · · · · · · · · · · · · · · · · · · · · · · · · · · · · · · · · · · · · · · · · · · · · · · · · EUR 1,335bnShare of global GDP · · · · · · · · · · · · · · · · · · · · · · · · · · · · · · · · · · · · · · · · · · · · · · · · · · · · · · · · · · · · · · ·1.9%
Gross financial assets of private householdsTotal · · · · · · · · · · · · · · · · · · · · · · · · · · · · · · · · · · · · · · · · · · · · · · · · · · · · · · · · · · · · · · · · · · · · · EUR 3,739bnAverage · · · · · · · · · · · · · · · · · · · · · · · · · · · · · · · · · · · · · · · · · · · · · · · · · · · · · · · EUR 129,880 per capitaShare of global financial assets · · · · · · · · · · · · · · · · · · · · · · · · · · · · · · · · · · · · · · · · · · · · · · · · · · ·2.2%
Debt of private householdsTotal · · · · · · · · · · · · · · · · · · · · · · · · · · · · · · · · · · · · · · · · · · · · · · · · · · · · · · · · · · · · · · · · · · · · · EUR 1,712bnAverage · · · · · · · · · · · · · · · · · · · · · · · · · · · · · · · · · · · · · · · · · · · · · · · · · · · · · · · · ·EUR 59,470 per capitaAs % of GDP · · · · · · · · · · · · · · · · · · · · · · · · · · · · · · · · · · · · · · · · · · · · · · · · · · · · · · · · · · · · · · · · · · · · 128.3%
Regi
onal
diff
eren
ces .
Aus
tralia
and
New
Zea
land
126Households in Australia ended 2016 with strong
growth of 8.3% in their financial assets. Growth
in their savings even accelerated slightly year-
on-year (+7.4% in 2015) and exceeded not only
growth in New Zealand (+3.1%), but also the
average figure for all industrialized nations
(+5.2%). Australian private financial assets came
to around EUR 3.2 trillion in total. Receivables
from insurance companies and pension funds
recorded the highest growth of 10.3% and repre-
sented over 58% of the average Australian asset
portfolio at the end of last year. As in previous
years, households once again invested the bulk
of their savings (almost EUR 69 billion, or 62%)
in this asset class in 2016. Inflows of funds into
bank deposits remained stable at the same level
as in each of the previous two years (almost EUR
50 billion), resulting in robust growth of 7.4% in
cash, demand and savings deposits even in the
context of historically low interest rates. Austral-
ians are cautious about investing in securities,
which has caused their share in total financial
assets to decline by more than 10 percentage
points to around only 17% over the last decade.
Households have now disposed of shares or in-
vestment fund units for five consecutive years in
net terms; in 2016, net sales came to around EUR
10 billion in total or EUR 420 per capita. However,
this was offset by gains in value of EUR 28.4 bil-
lion on the stock markets. After two lean years,
Australia’s leading index regained momentum
and closed the year up 7.0%, resulting in net
growth of 3.4% for securities as an asset class in
2016.
In contrast, households in neighboring
New Zealand were much more willing to take
risks when it came to investment. Securities
accounted for the lion’s share of almost 69% of
private financial assets at the end of 2016, of
which 45% comprised direct holdings of equi-
ties. However, growth in securities as an asset
class slowed again in line with a weaker perfor-
mance for the leading domestic index last year,
declining from 5.2% in 2015 to 1.6% in 2016. New
Zealand citizens held one-fifth of their savings
in the form of cash, demand and savings de-
posits, holdings of which grew by “only” 6.8% in
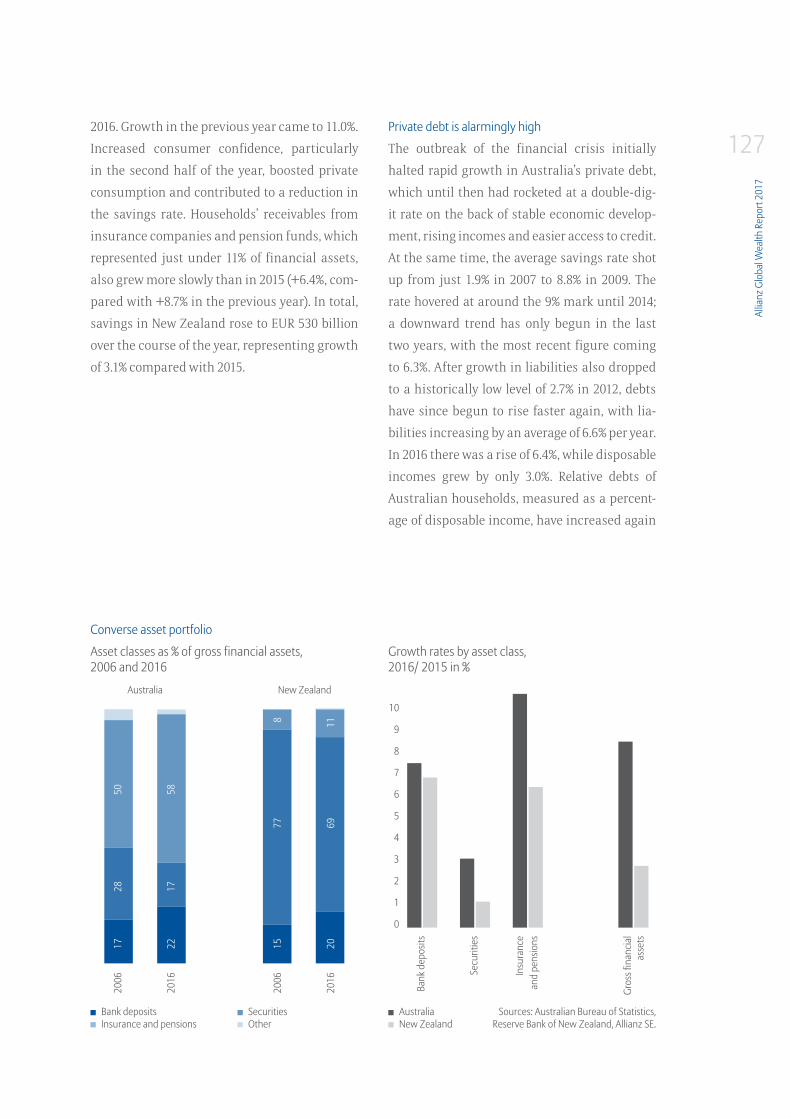
Allia
nz G
loba
l Wea
lth R
epor
t 201
7
1272016. Growth in the previous year came to 11.0%.
Increased consumer confidence, particularly
in the second half of the year, boosted private
consumption and contributed to a reduction in
the savings rate. Households’ receivables from
insurance companies and pension funds, which
represented just under 11% of financial assets,
also grew more slowly than in 2015 (+6.4%, com-
pared with +8.7% in the previous year). In total,
savings in New Zealand rose to EUR 530 billion
over the course of the year, representing growth
of 3.1% compared with 2015.
Private debt is alarmingly high
The outbreak of the financial crisis initially
halted rapid growth in Australia’s private debt,
which until then had rocketed at a double-dig-
it rate on the back of stable economic develop-
ment, rising incomes and easier access to credit.
At the same time, the average savings rate shot
up from just 1.9% in 2007 to 8.8% in 2009. The
rate hovered at around the 9% mark until 2014;
a downward trend has only begun in the last
two years, with the most recent figure coming
to 6.3%. After growth in liabilities also dropped
to a historically low level of 2.7% in 2012, debts
have since begun to rise faster again, with lia-
bilities increasing by an average of 6.6% per year.
In 2016 there was a rise of 6.4%, while disposable
incomes grew by only 3.0%. Relative debts of
Australian households, measured as a percent-
age of disposable income, have increased again
Asset classes as % of gross financial assets, 2006 and 2016
Growth rates by asset class, 2016/ 2015 in %
Converse asset portfolio
Sources: Australian Bureau of Statistics, Reserve Bank of New Zealand, Allianz SE.
SecuritiesOther
Bank depositsInsurance and pensions
2006
2016
2006
2016
17 22 15 20
28 17
50 58
77 69
8 11
Australia New Zealand
Bank
dep
osits
Secu
ritie
s
Insu
ranc
e an
d pe
nsio
ns
Gros
s fin
ancia
l as
sets
AustraliaNew Zealand
10
9
8
7
6
5
4
3
2
1
0
Regi
onal
diff
eren
ces .
Aus
tralia
and
New
Zea
land
128significantly in the last three years in particu-
lar – primarily owing to a rise in mortgage debt,
although modest growth in incomes has also
played a part. In 2016 alone, the ratio of debts to
incomes climbed from 183.0% to 188.8%. Average
liabilities per capita came to EUR 65,620 in Aus-
tralia, twice the average for industrialized coun-
tries; worldwide, only Switzerland and Norway
exceed this figure.
Low interest rates continue to help
households to offset rising costs for ever larger
loans. The ratio of interest payments to dispos-
able income remained stable in the final quarter
at 8.6%, in line with the relatively low level of the
previous three years (average of 8.7%); the high-
est level to date was 13.2%, which was recorded
in the third quarter of 2008. On the whole, how-
ever, the household sector has become more vul-
nerable, given that debts have risen again while
growth in incomes has been only very moder-
ate. Potential reductions in income or higher
interest rates could become a risk, particularly
for households with high levels of debt. This is
compounded by growing risks on the proper-
ty market, with house prices rising rapidly in
Sydney and Melbourne. At the same time, how-
ever, there are concerns about an oversupply of
apartments in parts of Melbourne and Brisbane,
where prices have recently fallen, while rents
have risen only moderately and there has been
an upward trend in vacancy rates. The rating
agency Moody’s downgraded the country’s four
major banks in mid-2017, shortly after Standard
& Poor’s did the same for almost all Australia’s
financial institutions. The property boom down
under appears to represent an increasing threat.
Developments in New Zealand tell a
very similar “debt story”. Households there were
also forced to massively reduce their borrowing
as a result of the financial crisis. The ratio of
debts to incomes, which had peaked at 158.6%
in mid-2008, noticeably declined in subsequent
years. Only in 2012, when credit growth accel-
erated significantly, did the ratio begin to rise
again, climbing from 146.4% to 166.8% at the end
of 2016. Debt grew by 8.2% last year, the highest
level of growth since 2007. Despite this, New Zea-
land still had a much lower debt ratio than Aus-
tralia, both in relative terms and as an absolute
figure. Liabilities per capita came to an average
of EUR 27,630, less than half the figure for Aus-
tralia.
A property boom has also occurred in
some regions of New Zealand over the last few
years. In particular, growth in net immigration
has fueled demand for home ownership, push-
ing up house prices. If the market were to be-
come overheated, this could harbor the risk of a
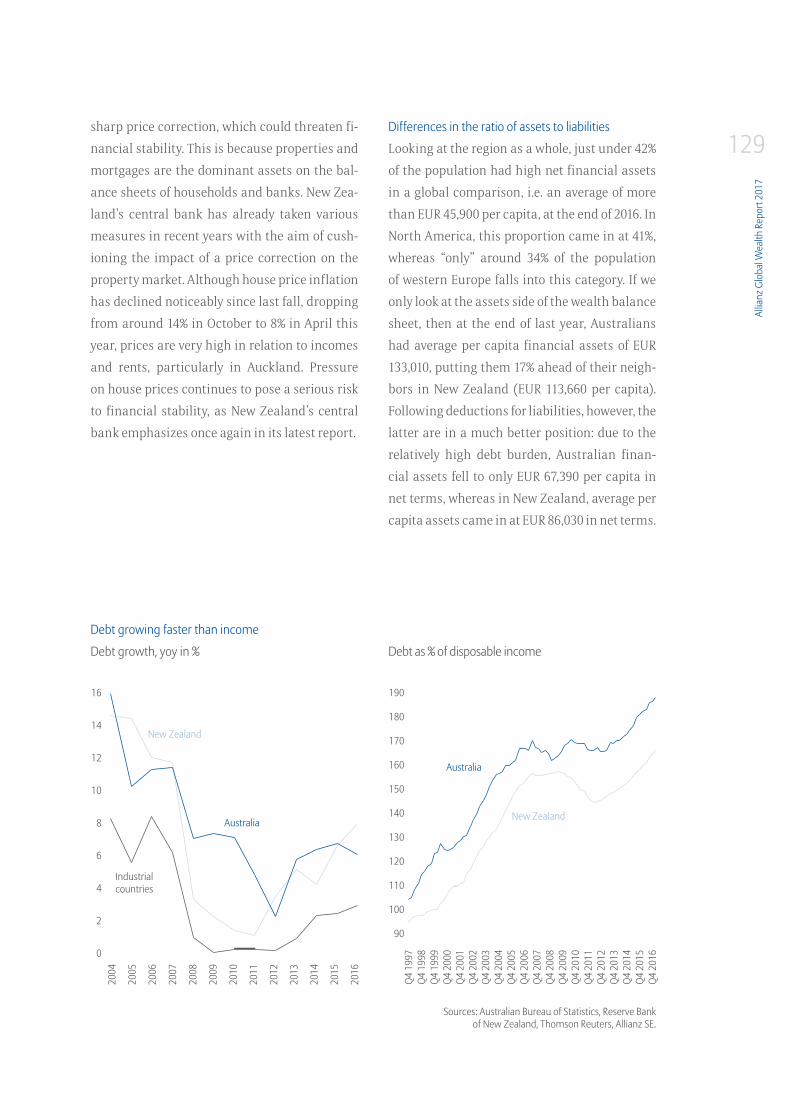
Allia
nz G
loba
l Wea
lth R
epor
t 201
7
129sharp price correction, which could threaten fi-
nancial stability. This is because properties and
mortgages are the dominant assets on the bal-
ance sheets of households and banks. New Zea-
land’s central bank has already taken various
measures in recent years with the aim of cush-
ioning the impact of a price correction on the
property market. Although house price inflation
has declined noticeably since last fall, dropping
from around 14% in October to 8% in April this
year, prices are very high in relation to incomes
and rents, particularly in Auckland. Pressure
on house prices continues to pose a serious risk
to financial stability, as New Zealand’s central
bank emphasizes once again in its latest report.
Differences in the ratio of assets to liabilities
Looking at the region as a whole, just under 42%
of the population had high net financial assets
in a global comparison, i.e. an average of more
than EUR 45,900 per capita, at the end of 2016. In
North America, this proportion came in at 41%,
whereas “only” around 34% of the population
of western Europe falls into this category. If we
only look at the assets side of the wealth balance
sheet, then at the end of last year, Australians
had average per capita financial assets of EUR
133,010, putting them 17% ahead of their neigh-
bors in New Zealand (EUR 113,660 per capita).
Following deductions for liabilities, however, the
latter are in a much better position: due to the
relatively high debt burden, Australian finan-
cial assets fell to only EUR 67,390 per capita in
net terms, whereas in New Zealand, average per
capita assets came in at EUR 86,030 in net terms.
Industrial countries
Australia
Australia
New Zealand
New Zealand
Debt growth, yoy in % Debt as % of disposable income
Debt growing faster than income
Sources: Australian Bureau of Statistics, Reserve Bank of New Zealand, Thomson Reuters, Allianz SE.
16
14
12
10
8
6
4
2
0
190
180
170
160
150
140
130
120
110
100
90
2004
2005
2006
2007
2008
2009
2010
2011
2012
2013
2014
2015
2016
Q4 1
997
Q4 1
998
Q4 1
999
Q4 2
000
Q4 2
001
Q4 2
002
Q4 2
003
Q4 2
004
Q4 2
005
Q4 2
006
Q4 2
007
Q4 2
008
Q4 2
009
Q4 2
010
Q4 2
011
Q4 2
012
Q4 2
013
Q4 2
014
Q4 2
015
Q4 2
016
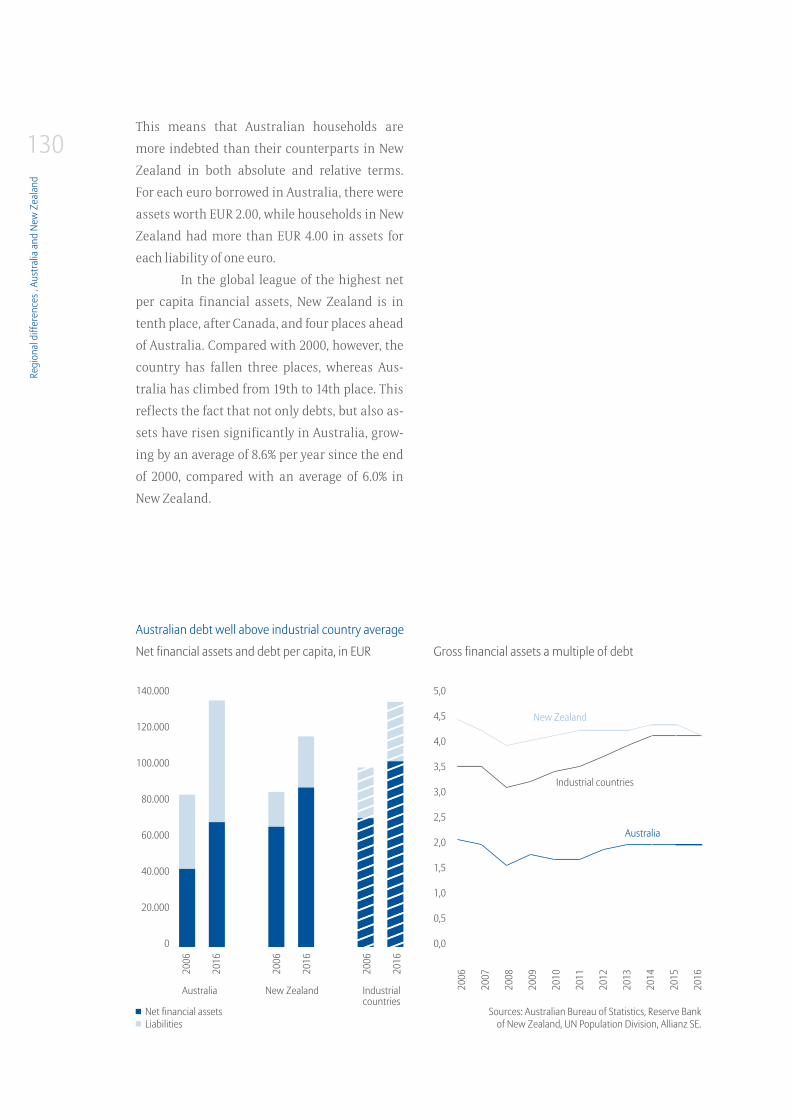
Regi
onal
diff
eren
ces .
Aus
tralia
and
New
Zea
land
130This means that Australian households are
more indebted than their counterparts in New
Zealand in both absolute and relative terms.
For each euro borrowed in Australia, there were
assets worth EUR 2.00, while households in New
Zealand had more than EUR 4.00 in assets for
each liability of one euro.
In the global league of the highest net
per capita financial assets, New Zealand is in
tenth place, after Canada, and four places ahead
of Australia. Compared with 2000, however, the
country has fallen three places, whereas Aus-
tralia has climbed from 19th to 14th place. This
reflects the fact that not only debts, but also as-
sets have risen significantly in Australia, grow-
ing by an average of 8.6% per year since the end
of 2000, compared with an average of 6.0% in
New Zealand.
Australian debt well above industrial country average
Net financial assets and debt per capita, in EUR Gross financial assets a multiple of debt
Sources: Australian Bureau of Statistics, Reserve Bank of New Zealand, UN Population Division, Allianz SE.
2006
2016
2006
2016
2006
2016
2006
2007
2008
2009
2010
2011
2012
2013
2014
2015
2016
Net financial assetsLiabilities
140.000
120.000
100.000
80.000
60.000
40.000
20.000
0
5,0
4,5
4,0
3,5
3,0
2,5
2,0
1,5
1,0
0,5
0,0
Australia New Zealand Industrial countries
Industrial countries
Australia
New Zealand

Allia
nz G
loba
l Wea
lth R
epor
t 201
7
131

Allia
nz G
loba
l Wea
lth R
epor
t 201
7
133
LiteratureAriyapruchaya, Kiatipong: “Thailand’s household sector balance sheet dynamics: evidence from microeco-nomic and macroeconomic data”, IFC Bulletin, No. 25, S. 91-100, 2007.
Aron, Janine; Muellbauer, John; Prinsloo, Johan: “Estimating the Balance Sheet of the Personal Sector in an Emerging Market Country. South Africa 1975 – 2003”, United Nations University, UN-Wider, Research Paper No. 2006/99, 2006.
Attanasio, Orazio and Székely, Miguel: “Household Saving in Developing Countries – Inequality, Demograph-ics and All That: How Different are Latin America and South East Asia?”, Inter-American Development Bank, Working Paper No. 427, 2000.
Board of Governors of the Federal Reserve System: “Changes in U.S. Family Finances from 2010 to 2013: „Evi-dence from the Survey of Consumer Finances”, September 2014.
Bonnet, Odran et al: “Does housing capital contribute to inequality? A comment on Thomas Piketty’s Capital in the 21st Century”, Sciences Po Economics Discussion Papers, Discussion paper 2014-07.
Davies, James B.; Sandstrom, Susanna; Shorrocks, Anthony; Wolff, Edward N.: “The Level and Distribution of Global Household Wealth”, November 2009.
Deutsche Bundesbank: “Household Wealth and Finances in Germany: Results of the 2014 Survey”, in: Monthly Report March 2016, p. 57-82.
Demirguc-Kunt, Asli, Leora Klapper, Dorothe Singer and Peter Van Oudheusden: “The Global Findex Database 2014: Measuring Financial Inclusion around the World”, Policy Research Working Paper 7255, World Bank, Washington, D. C., 2015.
European Central Bank: “Annual Report 2016”, 2017.
European Central Bank: “Eurosystem Household Finance and Consumption Survey”, 2014.
European Central Bank: “Eurosystem Household Finance and Consumption Survey”, 2016.
Lakner, Christoph und Branko Milanovich: Global Income Distribution. From the Fall of the Berlin Wall to the Great Recession, The World Bank, Policy Research Working Paper No. 6719, Washington, D.C., 2013.
Piketty, Thomas: “Capital in the Twenty-First Century”, Harvard University Press, 2014.
Tiongson, Erwin R.; Sugawara, Naotaka; Sulla, Victor; Taylor, Ashley; Gueorguieva, Anna I.; Levin, Victoria; Sub-barao, Kalanidhi: “The Crisis hits Home: Stress-Testing Households in Europe and Central Asia”, The Interna-tional Bank for Reconstruction and Development / The World Bank, 2010.
United Nations Development Programme: “Multidimensional progress: well-being beyond income. Regional Human Development Report for Latin America and the Caribbean”, 2016.
Appe
ndix
134
Appendix A: Methodological comments
General assumptions
The Allianz Global Wealth Report is based on data from 53 countries. This group of countries covers
around 90% of global GDP and 69% of the global population. In 43 countries, we had access to statistics
from the macroeconomic financial accounts. In the other countries, we were able to estimate the vol-
ume of total financial assets based on information from household surveys, bank statistics, statistics
on assets held in equities and bonds, and technical reserves.
In some countries, it is still extremely difficult to find data on the financial assets of private house-
holds. Let’s take the Latin American countries as an example. For many countries, the only information
that can be found relates to the entire private sector or the economy as a whole, which is often of only
limited use as far as the situation of private households is concerned. In addition to Chile, Columbia
has fairly good data that can be used to analyze the financial structure of private household assets. In
Argentina, for example, we were able to estimate financial assets with the help of data on bank depos-
its and insurance reserves.
In order to rule out exchange rate distortions over time, the financial assets were converted into the
national currency based on the fixed exchange rate at the end of 2016.
Statistical distinctions
The process associated with the introduction of the European System of Accounts 2010 (ESA 2010)
in September 2014 involved updating and harmonizing the guidelines governing the preparation of
many macroeconomic statistics. The new requirements also apply to the macroeconomic financial
accounts. One change relates to private households: under the ESVG 2010 regulations, the two sectors
“Private households” and “Private organizations without pecuniary reward” are no longer grouped, but
are now reported separately. This also has implications for the Allianz Global Wealth Report, which
takes data from the macroeconomic financial accounts as a basis where available. For many coun-
tries, however - particularly those outside of the European Union - there is no separate data available
for these sectors in general, or at least not at present. So in order to ensure global comparability, this
publication analyzes both sectors together under the heading “private households”.
Determination of wealth bands for global wealth classes
Lower wealth threshold: there is a close link between financial assets and the incomes of private house-
holds. According to Davies et al. (2009), private individuals with below-average income tend to have no
assets at all, or only very few. It is only when individuals move into middle and higher income groups
that they start to accumulate any assets to speak of.
We have applied this link to our analysis. Countries in the upper-middle income bracket (based on the
World Bank’s country classification system) therefore form the group in which the average assets of
private households has reached a relevant volume for the first time. This value marks the lower thresh-
old for the global wealth middle class. How high should this value be?
Allia
nz G
loba
l Wea
lth R
epor
t 201
7
135
*2016 asset balance sheet **Extrapolation based on 2015 asset balance sheet ***Approximated based on other statistics
In terms of income, households with incomes that correspond to between 75% and 150% of average net
income are generally considered to constitute the middle class. According to Davies et al., households
with income corresponding to 75% of the average income have assets that correspond to 30% of the
average assets. As far as the upper threshold is concerned, 150% of average income corresponds to 180%
of average assets. Consequently, we have set the threshold values for the middle wealth class at 30%
and 180% of average per capital assets. If we use net financial assets to calculate the two thresholds, we
arrive at an asset range of between EUR 7,700 and EUR 45,900 for the global middle wealth class in 2016.
The gross thresholds lie at EUR 10,100 and EUR 60,400.
Individuals with higher per capita financial assets then belong to the global high wealth class, whereas
those with lower per capita financial assets belong to the “low wealth” class.
These asset bands can, of course, also be used for the purposes of country classification. Countries
in which the average net per capita financial assets are less than EUR 7,700 can be referred to as “low
wealth countries” (LWCs). “Middle wealth countries” (MWCs) are all countries with average net per
capita financial assets of between EUR 7,700 and EUR 45,900; finally, all countries with even higher
average net per capita financial assets are described as “high wealth countries” (HWCs).
Country classification based on net per capita financial assets:
HWC
Australia*
Belgium*
Denmark*
Germany*
France*
United Kingdom*
Israel**
Italy*
Japan*
Canada*
New Zealand*
Netherlands*
Austria*
Sweden*
Switzerland**
Singapore*
Taiwan**
USA*
MWC
Chile*
China***
Estonia*
Finland*
Greece*
Ireland*
Croatia*
Latvia*
Lithuania*
Malaysia**
Norway*
Portugal*
Slovenia*
Spain*
South Korea*
Czech Republic*
Hungary*
LWC
Argentina***
Brazil***
Bulgaria*
India***
Indonesia***
Kazakhstan*
Colombia**
Mexico***
Peru***
Poland*
Romania*
Russia**
Serbia***
Slovakia*
South Africa*
Thailand***
Turkey*
Ukraine***

Appe
ndix
136
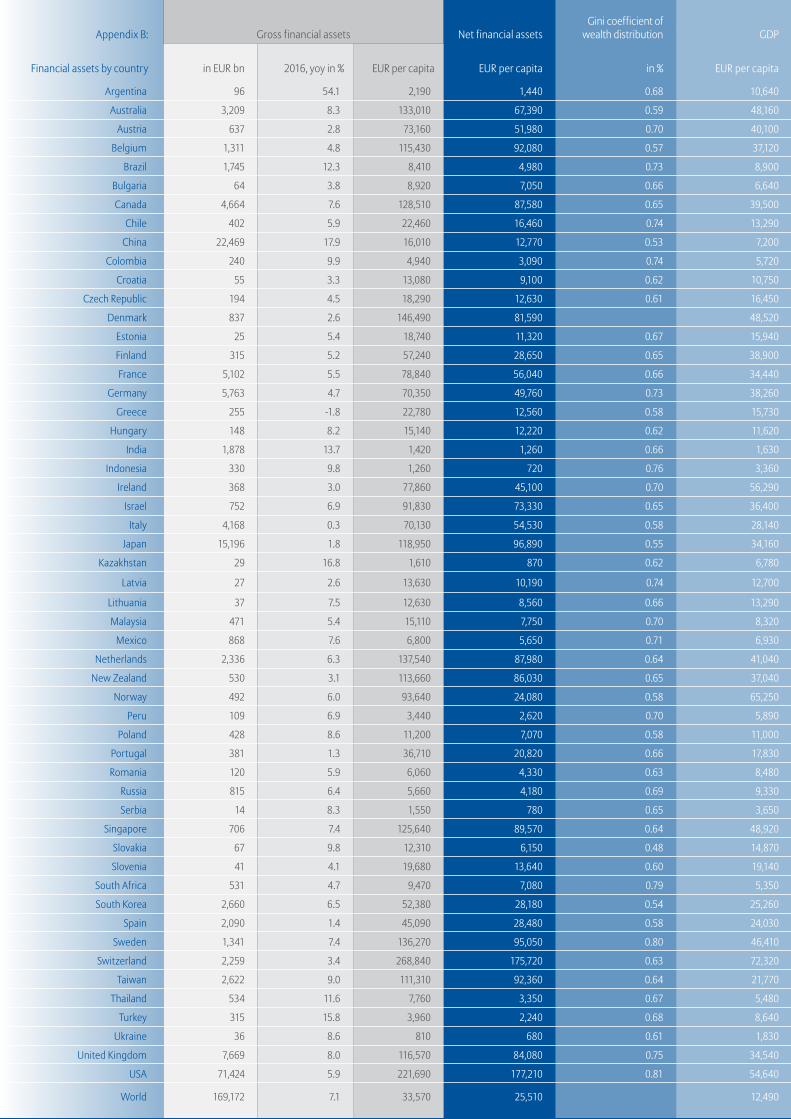
137
Allianz Global Wealth Report 2016
137
Appendix B: Gross financial assets Net financial assetsGini coefficient of
wealth distribution GDP
Financial assets by country in EUR bn 2016, yoy in % EUR per capita EUR per capita in % EUR per capita
Argentina 96 54.1 2,190 1,440 0.68 10,640
Australia 3,209 8.3 133,010 67,390 0.59 48,160
Austria 637 2.8 73,160 51,980 0.70 40,100
Belgium 1,311 4.8 115,430 92,080 0.57 37,120
Brazil 1,745 12.3 8,410 4,980 0.73 8,900
Bulgaria 64 3.8 8,920 7,050 0.66 6,640
Canada 4,664 7.6 128,510 87,580 0.65 39,500
Chile 402 5.9 22,460 16,460 0.74 13,290
China 22,469 17.9 16,010 12,770 0.53 7,200
Colombia 240 9.9 4,940 3,090 0.74 5,720
Croatia 55 3.3 13,080 9,100 0.62 10,750
Czech Republic 194 4.5 18,290 12,630 0.61 16,450
Denmark 837 2.6 146,490 81,590 48,520
Estonia 25 5.4 18,740 11,320 0.67 15,940
Finland 315 5.2 57,240 28,650 0.65 38,900
France 5,102 5.5 78,840 56,040 0.66 34,440
Germany 5,763 4.7 70,350 49,760 0.73 38,260
Greece 255 -1.8 22,780 12,560 0.58 15,730
Hungary 148 8.2 15,140 12,220 0.62 11,620
India 1,878 13.7 1,420 1,260 0.66 1,630
Indonesia 330 9.8 1,260 720 0.76 3,360
Ireland 368 3.0 77,860 45,100 0.70 56,290
Israel 752 6.9 91,830 73,330 0.65 36,400
Italy 4,168 0.3 70,130 54,530 0.58 28,140
Japan 15,196 1.8 118,950 96,890 0.55 34,160
Kazakhstan 29 16.8 1,610 870 0.62 6,780
Latvia 27 2.6 13,630 10,190 0.74 12,700
Lithuania 37 7.5 12,630 8,560 0.66 13,290
Malaysia 471 5.4 15,110 7,750 0.70 8,320
Mexico 868 7.6 6,800 5,650 0.71 6,930
Netherlands 2,336 6.3 137,540 87,980 0.64 41,040
New Zealand 530 3.1 113,660 86,030 0.65 37,040
Norway 492 6.0 93,640 24,080 0.58 65,250
Peru 109 6.9 3,440 2,620 0.70 5,890
Poland 428 8.6 11,200 7,070 0.58 11,000
Portugal 381 1.3 36,710 20,820 0.66 17,830
Romania 120 5.9 6,060 4,330 0.63 8,480
Russia 815 6.4 5,660 4,180 0.69 9,330
Serbia 14 8.3 1,550 780 0.65 3,650
Singapore 706 7.4 125,640 89,570 0.64 48,920
Slovakia 67 9.8 12,310 6,150 0.48 14,870
Slovenia 41 4.1 19,680 13,640 0.60 19,140
South Africa 531 4.7 9,470 7,080 0.79 5,350
South Korea 2,660 6.5 52,380 28,180 0.54 25,260
Spain 2,090 1.4 45,090 28,480 0.58 24,030
Sweden 1,341 7.4 136,270 95,050 0.80 46,410
Switzerland 2,259 3.4 268,840 175,720 0.63 72,320
Taiwan 2,622 9.0 111,310 92,360 0.64 21,770
Thailand 534 11.6 7,760 3,350 0.67 5,480
Turkey 315 15.8 3,960 2,240 0.68 8,640
Ukraine 36 8.6 810 680 0.61 1,830
United Kingdom 7,669 8.0 116,570 84,080 0.75 34,540
USA 71,424 5.9 221,690 177,210 0.81 54,640
World 169,172 7.1 33,570 25,510 12,490

Appe
ndix
138
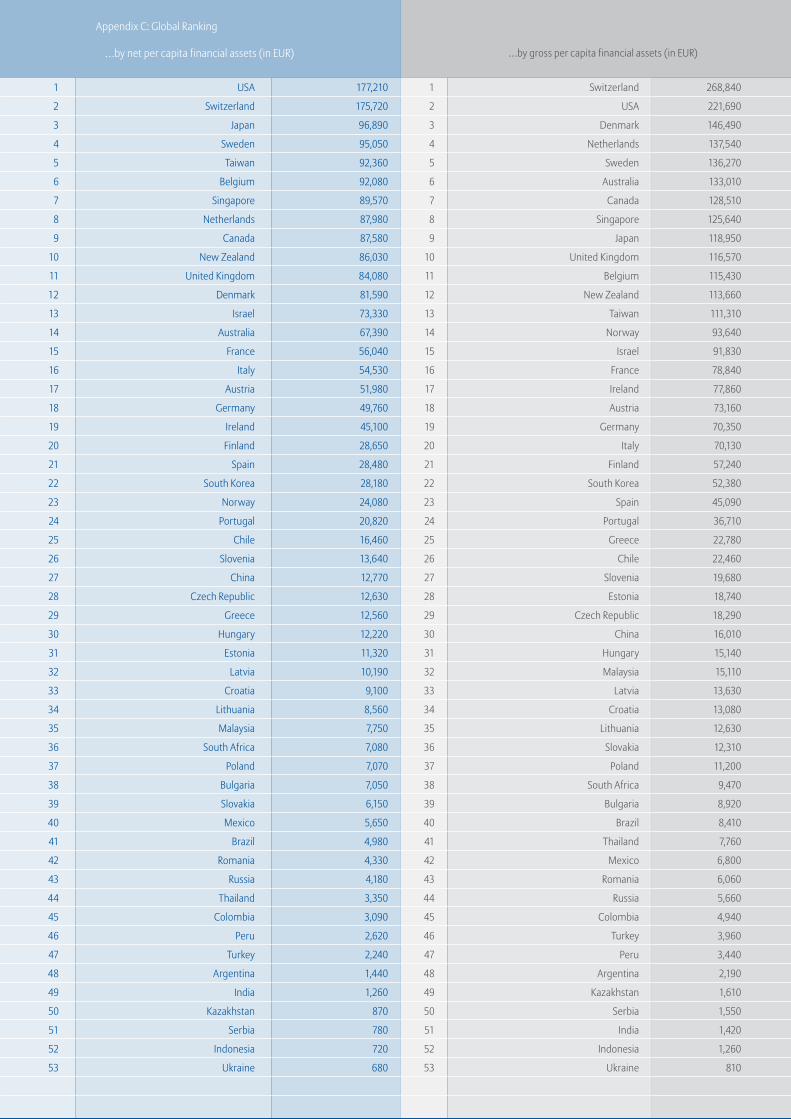
139
Allianz Global Wealth Report 2016
139
1 USA 177,210 1 Switzerland 268,840
2 Switzerland 175,720 2 USA 221,690
3 Japan 96,890 3 Denmark 146,490
4 Sweden 95,050 4 Netherlands 137,540
5 Taiwan 92,360 5 Sweden 136,270
6 Belgium 92,080 6 Australia 133,010
7 Singapore 89,570 7 Canada 128,510
8 Netherlands 87,980 8 Singapore 125,640
9 Canada 87,580 9 Japan 118,950
10 New Zealand 86,030 10 United Kingdom 116,570
11 United Kingdom 84,080 11 Belgium 115,430
12 Denmark 81,590 12 New Zealand 113,660
13 Israel 73,330 13 Taiwan 111,310
14 Australia 67,390 14 Norway 93,640
15 France 56,040 15 Israel 91,830
16 Italy 54,530 16 France 78,840
17 Austria 51,980 17 Ireland 77,860
18 Germany 49,760 18 Austria 73,160
19 Ireland 45,100 19 Germany 70,350
20 Finland 28,650 20 Italy 70,130
21 Spain 28,480 21 Finland 57,240
22 South Korea 28,180 22 South Korea 52,380
23 Norway 24,080 23 Spain 45,090
24 Portugal 20,820 24 Portugal 36,710
25 Chile 16,460 25 Greece 22,780
26 Slovenia 13,640 26 Chile 22,460
27 China 12,770 27 Slovenia 19,680
28 Czech Republic 12,630 28 Estonia 18,740
29 Greece 12,560 29 Czech Republic 18,290
30 Hungary 12,220 30 China 16,010
31 Estonia 11,320 31 Hungary 15,140
32 Latvia 10,190 32 Malaysia 15,110
33 Croatia 9,100 33 Latvia 13,630
34 Lithuania 8,560 34 Croatia 13,080
35 Malaysia 7,750 35 Lithuania 12,630
36 South Africa 7,080 36 Slovakia 12,310
37 Poland 7,070 37 Poland 11,200
38 Bulgaria 7,050 38 South Africa 9,470
39 Slovakia 6,150 39 Bulgaria 8,920
40 Mexico 5,650 40 Brazil 8,410
41 Brazil 4,980 41 Thailand 7,760
42 Romania 4,330 42 Mexico 6,800
43 Russia 4,180 43 Romania 6,060
44 Thailand 3,350 44 Russia 5,660
45 Colombia 3,090 45 Colombia 4,940
46 Peru 2,620 46 Turkey 3,960
47 Turkey 2,240 47 Peru 3,440
48 Argentina 1,440 48 Argentina 2,190
49 India 1,260 49 Kazakhstan 1,610
50 Kazakhstan 870 50 Serbia 1,550
51 Serbia 780 51 India 1,420
52 Indonesia 720 52 Indonesia 1,260
53 Ukraine 680 53 Ukraine 810
Appendix C: Global Ranking
…by net per capita financial assets (in EUR) …by gross per capita financial assets (in EUR)

Imprint
PublisherAllianz SEEconomic ResearchKoeniginstrasse 2880802 Munichwww.allianz.com
Chief EconomistDr. Michael Heise
AuthorsKathrin BrandmeirDr. Michaela GrimmDr. Arne Holzhausen
EditorsHeike BährAlexander MaisnerDr. Lorenz Weimann
PhotosGetty Images
DesignSchmitt. GmbH, Hamburg
Closing date01. August 2017
Legal disclaimerThe information contained in this publication hasbeen carefully researched and checked by AllianzSE or reliable third parties. However, Allianz Groupand any third party do not assume liability for theaccuracy, completeness and up-to-dateness of thecontents. The authors’ opinions are not necessarilythose of Allianz SE. Statements do not constitute anyoffer or recommendation of certain investments, evenif individual issuers and securities are mentioned.Information given in this issue is no substitute forspecific investment advice based on the situation ofthe individual investor. For personalized investmentadvice please contact Allianz SE.

Sum
mar
y
142