Embed Size (px)
Citation preview
SEM
I-AN
NU
ALR
EPO
RT
AllianceBernsteinGlobal Thematic Growth Fund
January 31, 2013
Semi-Annual Report
Investment Products Offered
• Are Not FDIC Insured• May Lose Value• Are Not Bank Guaranteed
Investors should consider the investment objectives, risks, charges and expenses of theFund carefully before investing. For copies of our prospectus or summary prospectus, whichcontain this and other information, visit us online at www.alliancebernstein.com or contact yourAllianceBernstein Investments representative. Please read the prospectus and/or summaryprospectus carefully before investing.
This shareholder report must be preceded or accompanied by the Fund’s prospectus for individualswho are not current shareholders of the Fund.
You may obtain a description of the Fund’s proxy voting policies and procedures, and informationregarding how the Fund voted proxies relating to portfolio securities during the most recent 12-monthperiod ended June 30, without charge. Simply visit AllianceBernstein’s website atwww.alliancebernstein.com, or go to the Securities and Exchange Commission’s (the “Commission”)website at www.sec.gov, or call AllianceBernstein at (800) 227-4618.
The Fund files its complete schedule of portfolio holdings with the Commission for the first and thirdquarters of each fiscal year on Form N-Q. The Fund’s Forms N-Q are available on the Commission’swebsite at www.sec.gov. The Fund’s Forms N-Q may also be reviewed and copied at theCommission’s Public Reference Room in Washington, DC; information on the operation of the PublicReference Room may be obtained by calling (800) SEC-0330. AllianceBernstein publishes full portfolioholdings for the Fund monthly at www.alliancebernstein.com.
AllianceBernstein Investments, Inc. (ABI) is the distributor of the AllianceBernstein family ofmutual funds. ABI is a member of FINRA and is an affiliate of AllianceBernstein L.P., the manager ofthe funds.
AllianceBernstein® and the AB Logo are registered trademarks and service marks used by permissionof the owner, AllianceBernstein L.P.
March 20, 2013
Semi-Annual ReportThis report provides management’sdiscussion of fund performance forAllianceBernstein Global ThematicGrowth Fund (the “Fund”) for thesemi-annual reporting period endedJanuary 31, 2013.
Investment Objective and PoliciesThe Fund’s investment objective islong-term growth of capital. TheFund pursues opportunistic growth byinvesting in a global universe ofcompanies in multiple industries thatmay benefit from innovation.
AllianceBernstein L.P. (the “Adviser”)employs a combination of “top-down”and “bottom-up” investment processeswith the goal of identifying the mostattractive securities worldwide, fittinginto broader themes, which aredevelopments that have broad effectsacross industries and companies. Draw-ing on the global fundamental andquantitative research capabilities of theAdviser, and its economists’ macro-economic insights, the Adviser seeks toidentify long-term economic or businesstrends that will affect multiple industries.The Adviser will assess the effects ofthese trends, in the context of the busi-ness cycle, on entire industries and onindividual companies. Through thisprocess, the Adviser intends to identifykey investment themes, which will bethe focus of the Fund’s investments andwhich are expected to change over timebased on the Adviser’s research.
In addition to this “top-down”thematic approach, the Adviser will alsouse a “bottom-up” analysis of individualcompanies that focuses on prospective
earnings growth, valuation and qualityof company management. The Advisernormally considers a universe ofapproximately 2,600 mid- to large-capitalization companies worldwide forinvestment.
The Fund invests in securities issued byU.S. and non-U.S. companies frommultiple industry sectors in an attemptto maximize opportunity, which shouldalso tend to reduce risk. The Fundinvests in both developed and emergingmarket countries. Under normal marketconditions, the Fund invests sig-nificantly (at least 40%—unless marketconditions are not deemed favorable bythe Adviser) in securities of non-U.S.companies. In addition, the Fundinvests, under normal circumstances, inthe equity securities of companieslocated in at least three countries. Thepercentage of the Fund’s assets investedin securities of companies in a particularcountry or denominated in a particularcurrency varies in accordance with theAdviser’s assessment of the appreciationpotential of such securities. The Fundmay invest in any company and industryand in any type of security, listed andunlisted, with potential for capitalappreciation. It invests in well-known,established companies as well as new,smaller or less-seasoned companies.Investments in new, smaller or less-seasoned companies may offer morereward but may also entail more riskthan is generally true of larger, estab-lished companies. The Fund may alsoinvest in synthetic foreign equity secu-rities, real estate investment trusts andzero coupon bonds. Normally, theFund invests in about 60-80 companies.
ALLIANCEBERNSTEIN GLOBAL THEMATIC GROWTH FUND • 1
The Fund may, at times, invest inshares of exchange-traded funds(“ETFs”) in lieu of making directinvestments in securities. ETFs mayprovide more efficient and economicalexposure to the types of companiesand geographic locations in which theFund seeks to invest than directinvestments.
Currencies can have a dramatic impacton equity returns, significantly addingto returns in some years and greatlydiminishing them in others. Currencyand equity positions are evaluatedseparately. The Adviser may seek tohedge the currency exposure resultingfrom securities positions when it findsthe currency exposure unattractive. Tohedge a portion of its currency risk,the Fund may from time to time investin currency-related derivatives, includ-ing forward currency exchange con-tracts, futures, options on futures,swaps and options. The Adviser mayalso seek investment opportunities bytaking long or short positions in cur-rencies through the use of currency-related derivatives.
The Fund may enter into otherderivatives transactions, such asoptions, futures contracts, forwards,and swaps. The Fund may use optionsstrategies involving the purchase and/or writing of various combinations ofcall and/or put options, including onindividual securities and stock indexes,futures contracts (including futurescontracts on individual securities andstock indexes) or shares of ETFs.These transactions may be used, forexample, in an effort to earn extraincome, to adjust exposure to
individual securities or markets, or toprotect all or a portion of the Fund’sportfolio from a decline in value,sometimes within certain ranges.
Investment ResultsThe table on page 6 shows the Fund’sperformance compared to its bench-mark, the Morgan Stanley CapitalInternational All Country (“MSCIAC”) World Index (net), for the six-and 12-month periods endedJanuary 31, 2013.
For the six-month period, the Fundoutperformed its benchmark before salescharges, with security selection drivingthe premium. Sector positioning wasnegative. Stock selection in several ofthe Web 3.0 and (re)Emerging MiddleClass-themed holdings, including thetechnology and consumer discretionarysectors, boosted relative performance.Stock selection in some ZIRPonomics-themed holdings, especially from thematerials sector, detracted. In the12-month period, the Fund under-performed its benchmark before salescharges, with security selection andsector positioning combining to drivethe deficit. Stock selection inseveral ZIRPonomics-themed and(re)Emerging Middle Class-themedholdings, especially from the materialsand consumer discretionary sectors,undercut relative performance. Stockselection in several Web 3.0-themedholdings, including the technology sec-tor, mitigated some of the losses. TheFund utilized derivatives including cur-rencies and purchased and writtenoptions for hedging and investmentpurposes, which had an immaterialimpact during both periods.
2 • ALLIANCEBERNSTEIN GLOBAL THEMATIC GROWTH FUND
Market Review and InvestmentStrategyThe behavior of the global financialmarkets during the 12-month periodended January 31, 2013, was largelydriven by the actions of key policymakers and central bankers. The will-ingness of political leaders to addressthe structural flaws of the euro zone—along with the anticipation of acoordinated, global monetary easingcycle led by the U.S. Federal Reserveand the European Central Bank—lifted market confidence for much ofthe period. Market sentiment wasfurther buoyed in the latter half of theperiod by data suggesting that China’smoribund economy was regainingmomentum. Financial markets in theU.S. found themselves under pressurein the last three months of 2012 as a
weak corporate earnings season for thethird quarter and protracted “fiscalcliff” negotiations brought about bypolitical dysfunction took its toll.However, a partial resolution to theU.S. budget stalemate and a strongstart to the fourth quarter U.S. corpo-rate earnings season in January igniteda rally in world equity markets.
The Global Thematic Growth Invest-ment Team (the “Team”) continues toidentify companies involved in dis-ruptive themes and offering valuationsthat, in the Team’s view, do notadequately capture their upside poten-tial. The Team continues to focus ontrends that persist regardless of theeconomic cycle, possessing what itsanalysis suggests to be longer-termgrowth fundamentals.
ALLIANCEBERNSTEIN GLOBAL THEMATIC GROWTH FUND • 3
DISCLOSURES AND RISKS
Benchmark DisclosureThe unmanaged MSCI AC World Index (net) does not reflect fees and expensesassociated with the active management of a mutual fund portfolio. The MSCIAC World Index (net; free float-adjusted, market capitalization weighted) representsthe equity market performance of developed and emerging markets. Net returnsinclude the reinvestment of dividends after deduction of non-U.S. withholding tax.MSCI makes no express or implied warranties or representations, and shall have noliability whatsoever with respect to any MSCI data contained herein. The MSCI datamay not be further redistributed or used as a basis for other indices, any securities orfinancial products. This report is not approved, reviewed or produced by MSCI. Aninvestor cannot invest directly in an index, and its results are not indicative of theperformance for any specific investment, including the Fund.
A Word About RiskMarket Risk: The value of the Fund’s assets will fluctuate as the stock or bondmarket fluctuates. The value of its investments may decline, sometimes rapidly andunpredictably, simply because of economic changes or other events that affect largeportions of the market. It includes the risk that a particular style of investing, such asgrowth, may underperform the market generally.Foreign (Non-U.S.) Risk: Investments in securities of non-U.S. issuers may involvemore risk than those of U.S. issuers. These securities may fluctuate more widely inprice and may be less liquid due to adverse market, economic, political, regulatory orother factors.Emerging Market Risk: Investments in emerging market countries may have morerisk because the markets are less developed and less liquid as well as being subject toincreased economic, political, regulatory, or other uncertainties.Currency Risk: Fluctuations in currency exchange rates may negatively affect thevalue of the Fund’s investments or reduce its returns.Capitalization Risk: Investments in small- and mid-capitalization companies may bemore volatile than investments in large-capitalization companies. Investments insmall-capitalization companies may have additional risks because these companieshave limited product lines, markets or financial resources.Derivatives Risk: Investments in derivatives may be illiquid, difficult to price, andleveraged so that small changes may produce disproportionate losses for the Fund,and may be subject to counterparty risk to a greater degree than more traditionalinvestments.Management Risk: The Fund is subject to management risk because it is an activelymanaged investment fund. The Adviser will apply its investment techniques and riskanalyses in making investment decisions for the Fund, but there is no guarantee thatits techniques will produce the intended results.These risks are fully discussed in the Fund’s prospectus.An Important Note About Historical PerformanceThe investment return and principal value of an investment in the Fund willfluctuate, so that shares, when redeemed, may be worth more or less than theiroriginal cost. Performance shown on the following pages represents past per-formance and does not guarantee future results. Current performance may belower or higher than the performance information shown. You may obtainperformance information current to the most recent month-end by visitingwww.alliancebernstein.com.All fees and expenses related to the operation of the Fund have been deducted.Net asset value (“NAV”) returns do not reflect sales charges; if sales charges(Disclosures, Risks and Note about Historical Performance continued on next page)
4 • ALLIANCEBERNSTEIN GLOBAL THEMATIC GROWTH FUND
Dis
clos
ures
and
Ris
ks
DISCLOSURES AND RISKS(continued from previous page)
were reflected, the Fund’s quoted performance would be lower. SEC returnsreflect the applicable sales charges for each share class: a 4.25% maximum front-end sales charge for Class A shares; the applicable contingent deferred salescharge for Class B shares (4% year 1, 3% year 2, 2% year 3, 1% year 4); a 1% 1-year contingent deferred sales charge for Class C shares. Returns for the differ-ent share classes will vary due to different expenses associated with each class.Performance assumes reinvestment of distributions and does not account fortaxes.
ALLIANCEBERNSTEIN GLOBAL THEMATIC GROWTH FUND • 5
Disclosures
andR
isks
HISTORICAL PERFORMANCE
THE FUND VS. ITS BENCHMARKPERIODS ENDED JANUARY 31, 2013
NAV Returns
6 Months 12 Months
AllianceBernstein Global Thematic Growth Fund*Class A 18.57% 5.58%
Class B† 18.11% 4.71%
Class C 18.14% 4.81%
Advisor Class‡ 18.76% 5.91%
Class R‡ 18.54% 5.50%
Class K‡ 18.74% 5.85%
Class I‡ 19.01% 6.30%
MSCI AC World Index (net) 13.43% 14.80%
* Includes the impact of proceeds received and credited to the Fund resulting from classaction settlements, which enhanced the performance of all share classes of the Fund for thesix- and 12-month periods ended January 31, 2013 by 0.04% and 0.10%, respectively.
† Effective January 31, 2009, Class B shares are no longer available for purchase to newinvestors. Please see Note A for additional information.
‡ Please note that these share classes are for investors purchasing shares through accountsestablished under certain fee-based programs sponsored and maintained by certainbroker-dealers and financial intermediaries, institutional pension plans and/orinvestment advisory clients of, and certain other persons associated with, the Adviserand its affiliates or the Fund.Please keep in mind that high, double-digit returns are highly unusual andcannot be sustained. Investors should also be aware that these returns wereprimarily achieved during favorable market conditions.
See Disclosures, Risks and Note about Historical Performance on pages 4-5.
(Historical Performance continued on next page)
6 • ALLIANCEBERNSTEIN GLOBAL THEMATIC GROWTH FUND
His
tori
calP
erfo
rman
ce
HISTORICAL PERFORMANCE(continued from previous page)
AVERAGE ANNUAL RETURNS AS OF JANUARY 31, 2013
NAV Returns SEC ReturnsClass A Shares1 Year 5.58% 1.09%5 Years 0.96% 0.09%10 Years 6.28% 5.82%
Class B Shares1 Year 4.71% 0.71%5 Years 0.15% 0.15%10 Years(a) 5.61% 5.61%
Class C Shares1 Year 4.81% 3.81%5 Years 0.22% 0.22%10 Years 5.50% 5.50%
Advisor Class Shares†
1 Year 5.91% 5.91%5 Years 1.27% 1.27%10 Years 6.61% 6.61%
Class R Shares†
1 Year 5.50% 5.50%5 Years 0.94% 0.94%Since Inception* 2.73% 2.73%
Class K Shares†
1 Year 5.85% 5.85%5 Years 1.25% 1.25%Since Inception* 3.56% 3.56%
Class I Shares†
1 Year 6.30% 6.30%5 Years 1.62% 1.62%Since Inception* 3.91% 3.91%
The Fund’s current prospectus fee table shows the Fund’s total annual operat-ing expense ratios as 1.57%, 2.41%, 2.32%, 1.27%, 1.62%, 1.31% and 0.91% forClass A, Class B, Class C, Advisor Class, Class R, Class K and Class I shares,respectively. The Financial Highlights section of this report sets forth expenseratio data for the current reporting period; the expense ratios shown above maydiffer from the expense ratios in the Financial Highlights section since they arebased on different time periods.(a) Assumes conversion of Class B shares into Class A shares after eight years.† These share classes are offered at NAV to eligible investors and their SEC returns are the same as
the NAV returns. Please note that these share classes are for investors purchasing shares throughaccounts established under certain fee-based programs sponsored and maintained by certainbroker-dealers and financial intermediaries, institutional pension plans and/or investmentadvisory clients of, and certain other persons associated with, the Adviser and its affiliates or theFund. The inception dates for Class R, Class K and Class I shares are listed below.
* Inception dates: 11/3/03 for Class R shares; 3/1/05 for Class K and Class I shares.
See Disclosures, Risks and Note about Historical Performance on pages 4-5.
(Historical Performance continued on next page)
ALLIANCEBERNSTEIN GLOBAL THEMATIC GROWTH FUND • 7
HistoricalPerform
ance
HISTORICAL PERFORMANCE(continued from previous page)
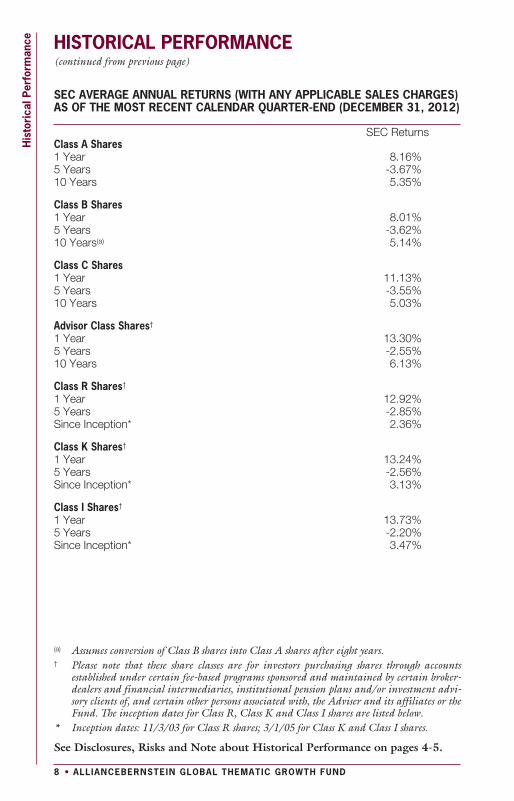
SEC AVERAGE ANNUAL RETURNS (WITH ANY APPLICABLE SALES CHARGES)AS OF THE MOST RECENT CALENDAR QUARTER-END (DECEMBER 31, 2012)
SEC ReturnsClass A Shares1 Year 8.16%5 Years -3.67%10 Years 5.35%
Class B Shares1 Year 8.01%5 Years -3.62%10 Years(a) 5.14%
Class C Shares1 Year 11.13%5 Years -3.55%10 Years 5.03%
Advisor Class Shares†
1 Year 13.30%5 Years -2.55%10 Years 6.13%
Class R Shares†
1 Year 12.92%5 Years -2.85%Since Inception* 2.36%
Class K Shares†
1 Year 13.24%5 Years -2.56%Since Inception* 3.13%
Class I Shares†
1 Year 13.73%5 Years -2.20%Since Inception* 3.47%
(a) Assumes conversion of Class B shares into Class A shares after eight years.† Please note that these share classes are for investors purchasing shares through accounts
established under certain fee-based programs sponsored and maintained by certain broker-dealers and financial intermediaries, institutional pension plans and/or investment advi-sory clients of, and certain other persons associated with, the Adviser and its affiliates or theFund. The inception dates for Class R, Class K and Class I shares are listed below.
* Inception dates: 11/3/03 for Class R shares; 3/1/05 for Class K and Class I shares.
See Disclosures, Risks and Note about Historical Performance on pages 4-5.
8 • ALLIANCEBERNSTEIN GLOBAL THEMATIC GROWTH FUND
His
tori
calP
erfo
rman
ce
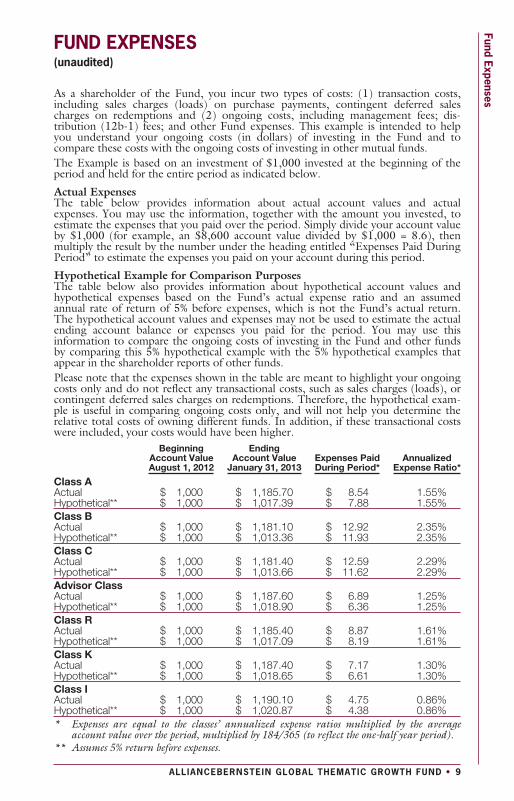
FUND EXPENSES(unaudited)
As a shareholder of the Fund, you incur two types of costs: (1) transaction costs,including sales charges (loads) on purchase payments, contingent deferred salescharges on redemptions and (2) ongoing costs, including management fees; dis-tribution (12b-1) fees; and other Fund expenses. This example is intended to helpyou understand your ongoing costs (in dollars) of investing in the Fund and tocompare these costs with the ongoing costs of investing in other mutual funds.The Example is based on an investment of $1,000 invested at the beginning of theperiod and held for the entire period as indicated below.
Actual ExpensesThe table below provides information about actual account values and actualexpenses. You may use the information, together with the amount you invested, toestimate the expenses that you paid over the period. Simply divide your account valueby $1,000 (for example, an $8,600 account value divided by $1,000 = 8.6), thenmultiply the result by the number under the heading entitled “Expenses Paid DuringPeriod” to estimate the expenses you paid on your account during this period.
Hypothetical Example for Comparison PurposesThe table below also provides information about hypothetical account values andhypothetical expenses based on the Fund’s actual expense ratio and an assumedannual rate of return of 5% before expenses, which is not the Fund’s actual return.The hypothetical account values and expenses may not be used to estimate the actualending account balance or expenses you paid for the period. You may use thisinformation to compare the ongoing costs of investing in the Fund and other fundsby comparing this 5% hypothetical example with the 5% hypothetical examples thatappear in the shareholder reports of other funds.Please note that the expenses shown in the table are meant to highlight your ongoingcosts only and do not reflect any transactional costs, such as sales charges (loads), orcontingent deferred sales charges on redemptions. Therefore, the hypothetical exam-ple is useful in comparing ongoing costs only, and will not help you determine therelative total costs of owning different funds. In addition, if these transactional costswere included, your costs would have been higher.
BeginningAccount ValueAugust 1, 2012
EndingAccount Value
January 31, 2013Expenses PaidDuring Period*
AnnualizedExpense Ratio*
Class AActual $ 1,000 $ 1,185.70 $ 8.54 1.55%Hypothetical** $ 1,000 $ 1,017.39 $ 7.88 1.55%Class BActual $ 1,000 $ 1,181.10 $ 12.92 2.35%Hypothetical** $ 1,000 $ 1,013.36 $ 11.93 2.35%Class CActual $ 1,000 $ 1,181.40 $ 12.59 2.29%Hypothetical** $ 1,000 $ 1,013.66 $ 11.62 2.29%Advisor ClassActual $ 1,000 $ 1,187.60 $ 6.89 1.25%Hypothetical** $ 1,000 $ 1,018.90 $ 6.36 1.25%Class RActual $ 1,000 $ 1,185.40 $ 8.87 1.61%Hypothetical** $ 1,000 $ 1,017.09 $ 8.19 1.61%Class KActual $ 1,000 $ 1,187.40 $ 7.17 1.30%Hypothetical** $ 1,000 $ 1,018.65 $ 6.61 1.30%Class IActual $ 1,000 $ 1,190.10 $ 4.75 0.86%Hypothetical** $ 1,000 $ 1,020.87 $ 4.38 0.86%* Expenses are equal to the classes’ annualized expense ratios multiplied by the average
account value over the period, multiplied by 184/365 (to reflect the one-half year period).** Assumes 5% return before expenses.
ALLIANCEBERNSTEIN GLOBAL THEMATIC GROWTH FUND • 9
FundExpenses
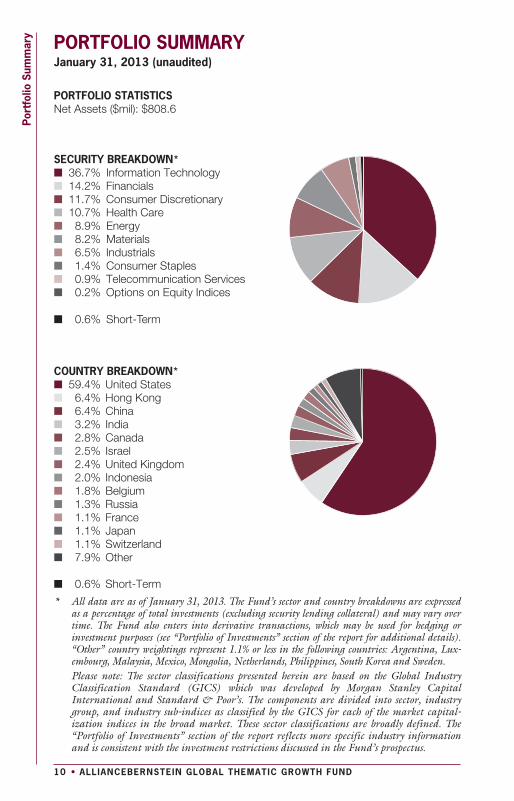
PORTFOLIO SUMMARYJanuary 31, 2013 (unaudited)
PORTFOLIO STATISTICSNet Assets ($mil): $808.6
SECURITY BREAKDOWN*36.7% Information Technology14.2% Financials11.7% Consumer Discretionary10.7% Health Care8.9% Energy8.2% Materials6.5% Industrials1.4% Consumer Staples
0.2% Options on Equity Indices0.9% Telecommunication Services
0.6% Short-Term
COUNTRY BREAKDOWN*
0.6% Short-Term
59.4% United States6.4% Hong Kong6.4% China3.2% India2.8% Canada2.5% Israel2.4% United Kingdom2.0% Indonesia1.8% Belgium1.3% Russia1.1% France1.1% Japan1.1% Switzerland7.9% Other
* All data are as of January 31, 2013. The Fund’s sector and country breakdowns are expressedas a percentage of total investments (excluding security lending collateral) and may vary overtime. The Fund also enters into derivative transactions, which may be used for hedging orinvestment purposes (see “Portfolio of Investments” section of the report for additional details).“Other” country weightings represent 1.1% or less in the following countries: Argentina, Lux-embourg, Malaysia, Mexico, Mongolia, Netherlands, Philippines, South Korea and Sweden.Please note: The sector classifications presented herein are based on the Global IndustryClassification Standard (GICS) which was developed by Morgan Stanley CapitalInternational and Standard & Poor’s. The components are divided into sector, industrygroup, and industry sub-indices as classified by the GICS for each of the market capital-ization indices in the broad market. These sector classifications are broadly defined. The“Portfolio of Investments” section of the report reflects more specific industry informationand is consistent with the investment restrictions discussed in the Fund’s prospectus.
10 • ALLIANCEBERNSTEIN GLOBAL THEMATIC GROWTH FUND
Port
folio
Sum
mar
y
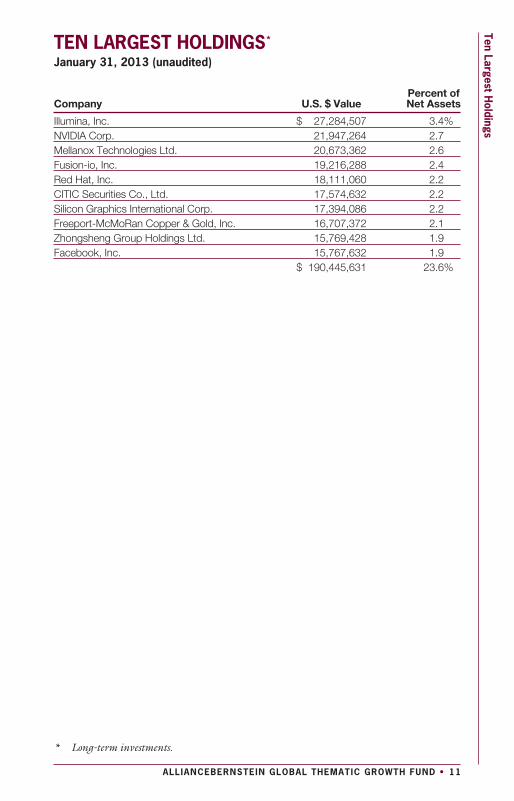
TEN LARGEST HOLDINGS*
January 31, 2013 (unaudited)
Company U.S. $ ValuePercent ofNet Assets
Illumina, Inc. $ 27,284,507 3.4%NVIDIA Corp. 21,947,264 2.7Mellanox Technologies Ltd. 20,673,362 2.6Fusion-io, Inc. 19,216,288 2.4Red Hat, Inc. 18,111,060 2.2CITIC Securities Co., Ltd. 17,574,632 2.2Silicon Graphics International Corp. 17,394,086 2.2Freeport-McMoRan Copper & Gold, Inc. 16,707,372 2.1Zhongsheng Group Holdings Ltd. 15,769,428 1.9Facebook, Inc. 15,767,632 1.9
$ 190,445,631 23.6%
* Long-term investments.
ALLIANCEBERNSTEIN GLOBAL THEMATIC GROWTH FUND • 11
TenLargest
Holdings
PORTFOLIO OF INVESTMENTSJanuary 31, 2013 (unaudited)
Company Shares U.S. $ Value
COMMON STOCKS – 100.1%Information Technology – 37.0%Communications Equipment – 1.2%QUALCOMM, Inc. ........................................ 144,570 $ 9,545,957
Computers & Peripherals – 6.8%Apple, Inc. .................................................. 19,120 8,705,527Fusion-io, Inc.(a)(b) .......................................... 1,099,330 19,216,288Silicon Graphics International Corp.(a)(b) .............. 1,196,292 17,394,086Stratasys Ltd.(a)(b) .......................................... 125,840 9,875,923
55,191,824Electronic Equipment, Instruments &
Components – 0.8%Hexagon AB................................................ 236,770 6,358,782
Internet Software & Services – 10.8%Cornerstone OnDemand, Inc.(a)(b) ...................... 258,233 8,439,055eBay, Inc.(b) ................................................. 149,400 8,355,942Facebook, Inc.(b) ........................................... 509,126 15,767,632Google, Inc. – Class A(b) ................................. 19,998 15,112,289LinkedIn Corp.(b) ........................................... 70,842 8,769,531MercadoLibre, Inc.(a) ...................................... 94,240 8,330,816Rackspace Hosting, Inc.(b) .............................. 124,635 9,391,247Yelp, Inc.(a)(b) ................................................ 622,434 13,220,498
87,387,010Semiconductors & Semiconductor
Equipment – 8.1%ARM Holdings PLC ....................................... 595,425 8,156,160ASML Holding NV(a)....................................... 81,020 6,083,792Mellanox Technologies Ltd.(a)(b) ........................ 388,451 20,673,362NVIDIA Corp. ............................................... 1,790,152 21,947,264Samsung Electronics Co., Ltd. ........................ 6,400 8,514,777
65,375,355Software – 9.3%Intuit, Inc..................................................... 129,110 8,053,882NetSuite, Inc.(b) ............................................. 119,808 8,414,116Red Hat, Inc.(b) ............................................. 325,973 18,111,060Salesforce.com, Inc.(b) ................................... 71,420 12,293,525ServiceNow, Inc.(a)(b) ...................................... 302,348 8,381,086Splunk, Inc.(b) ............................................... 367,607 12,116,327Workday, Inc.(a)(b) .......................................... 148,684 7,942,699
75,312,695299,171,623
Financials – 14.4%Capital Markets – 3.3%CITIC Securities Co., Ltd.(a) ............................. 6,582,800 17,574,632UBS AG(b) ................................................... 505,990 8,789,046
26,363,678
12 • ALLIANCEBERNSTEIN GLOBAL THEMATIC GROWTH FUND
Port
folio
ofIn
vest
men
ts
Company Shares U.S. $ Value
Commercial Banks – 3.4%BOC Hong Kong Holdings Ltd. ...................... 3,185,500 $ 10,930,565Grupo Financiero Banorte SAB de CV –
Class O ................................................. 876,070 6,029,673Sberbank of Russia (Sponsored ADR) ............. 710,494 10,465,577
27,425,815Insurance – 1.7%AIA Group Ltd. ........................................... 3,395,400 13,507,295
Real Estate Investment Trusts(REITs) – 1.0%
Weyerhaeuser Co. ...................................... 267,744 8,064,449
Real Estate Management &Development – 3.9%
Ciputra Development Tbk PT......................... 95,665,008 9,042,246Guangzhou R&F Properties Co., Ltd.(a) ............ 4,647,200 8,458,753Hang Lung Group Ltd. ................................. 2,274,000 13,784,966
31,285,965Thrifts & Mortgage Finance – 1.1%Housing Development Finance Corp. .............. 632,910 9,368,750
116,015,952Consumer Discretionary – 11.8%Automobiles – 1.0%Tesla Motors, Inc.(a)(b) ................................... 221,781 8,319,005
Hotels, Restaurants & Leisure – 2.8%Bloomberry Resorts Corp.(b) .......................... 24,243,300 7,770,250Ctrip.com International Ltd. (ADR)(a)(b)............... 515,900 10,219,979Galaxy Entertainment Group Ltd.(a)(b) ............... 1,060,000 4,776,557
22,766,786Household Durables – 0.5%iRobot Corp.(b) ............................................ 187,330 4,286,111
Internet & Catalog Retail – 1.9%Amazon.com, Inc.(b) ..................................... 57,548 15,278,994
Specialty Retail – 3.0%L’Occitane International SA ........................... 2,821,250 8,469,587Zhongsheng Group Holdings Ltd.(a) ................. 10,541,000 15,769,428
24,239,015Textiles, Apparel & Luxury Goods – 2.6%Burberry Group PLC.................................... 546,770 11,746,237Samsonite International SA ........................... 4,160,300 9,038,665
20,784,90295,674,813
Health Care – 10.8%Biotechnology – 2.2%Cepheid, Inc.(b) ........................................... 387,832 14,047,275Genomic Health, Inc.(a)(b) ............................... 146,428 4,107,305
18,154,580
ALLIANCEBERNSTEIN GLOBAL THEMATIC GROWTH FUND • 13
PortfolioofInvestm
ents
Company Shares U.S. $ Value
Health Care Equipment & Supplies – 2.7%Given Imaging Ltd.(b) .................................... 492,609 $ 8,103,418IDEXX Laboratories, Inc.(b) ............................. 12,208 1,162,324Intuitive Surgical, Inc.(b) ................................. 21,796 12,519,186
21,784,928Health Care Providers & Services – 0.5%IHH Healthcare Bhd(b) .................................. 3,578,100 3,791,537
Health Care Technology – 1.7%athenahealth, Inc.(a)(b) ................................... 154,942 13,397,835
Life Sciences Tools & Services – 3.7%Illumina, Inc.(a)(b) .......................................... 538,900 27,284,507PerkinElmer, Inc.......................................... 79,008 2,784,242
30,068,74987,197,629
Energy – 9.0%Energy Equipment & Services – 4.9%National Oilwell Varco, Inc. ............................ 153,970 11,415,336Oceaneering International, Inc. ....................... 150,690 9,525,115Schlumberger Ltd. ...................................... 120,430 9,399,561Technip SA ............................................... 83,600 9,052,136
39,392,148Oil, Gas & Consumable Fuels – 4.1%Cameco Corp. ........................................... 201,205 4,337,184Concho Resources, Inc.(b) ............................. 91,980 8,390,416Denbury Resources, Inc.(b) ............................ 682,246 12,710,243Noble Energy, Inc. ...................................... 76,250 8,218,987
33,656,83073,048,978
Materials – 8.3%Chemicals – 1.0%Monsanto Co. ............................................ 78,761 7,982,427
Metals & Mining – 7.3%Freeport-McMoRan Copper & Gold, Inc. .......... 473,968 16,707,372Goldcorp, Inc. ............................................ 237,270 8,373,259Mongolian Mining Corp.(a)(b) ........................... 17,435,500 8,637,645Turquoise Hill Resources Ltd.(b) ...................... 1,313,369 10,112,968Umicore SA ............................................... 288,070 14,988,029
58,819,27366,801,700
Industrials – 6.5%Construction & Engineering – 2.1%Bharti Infratel Ltd.(b) ..................................... 2,224,840 8,459,746Larsen & Toubro Ltd. ................................... 287,110 8,339,135
16,798,881
14 • ALLIANCEBERNSTEIN GLOBAL THEMATIC GROWTH FUND
Port
folio
ofIn
vest
men
ts
Company Shares U.S. $ Value
Electrical Equipment – 1.0%Babcock & Wilcox Co. (The) ........................ 304,085 $ 8,100,824
Machinery – 3.4%Cummins, Inc. .......................................... 95,570 10,974,303FANUC Corp............................................ 57,200 8,926,087Proto Labs, Inc.(a)(b) .................................... 191,303 7,868,293
27,768,68352,668,388
Consumer Staples – 1.4%Beverages – 1.4%Heckmann Corp.(a)(b) .................................. 2,878,493 11,053,413
Telecommunication Services – 0.9%Wireless Telecommunication
Services – 0.9%Tower Bersama Infrastructure Tbk PT(b).......... 12,340,000 7,473,924
Total Common Stocks(cost $721,014,184) ............................... 809,106,420
ContractsOPTIONS PURCHASED – CALLS – 0.2%Options on Equity Indices – 0.2%Russian Depositary Index Expiration: Mar
2013, Exercise Price: $ 1,700.00(b)(c)
(cost $794,305) ..................................... 11,495 1,639,762
SharesSHORT-TERM INVESTMENTS – 0.6%Investment Companies – 0.6%AllianceBernstein Fixed-Income Shares, Inc. –
Government STIF Portfolio, 0.13%(d)
(cost $5,066,072)................................... 5,066,072 5,066,072
Total Investments Before Security LendingCollateral for Securities Loaned – 100.9%(cost $726,874,561) ................................ 815,812,254
INVESTMENTS OF CASH COLLATERALFOR SECURITIES LOANED – 25.4%
Investment Companies – 25.4%AllianceBernstein Exchange Reserves –
Class I, 0.10%(d)
(cost $205,089,071) ............................... 205,089,071 205,089,071Total Investments – 126.3%
(cost $931,963,632) ............................... 1,020,901,325Other assets less liabilities – (26.3)%.............. (212,318,583)Net Assets – 100.0% ............................... $ 808,582,742
ALLIANCEBERNSTEIN GLOBAL THEMATIC GROWTH FUND • 15
PortfolioofInvestm
ents
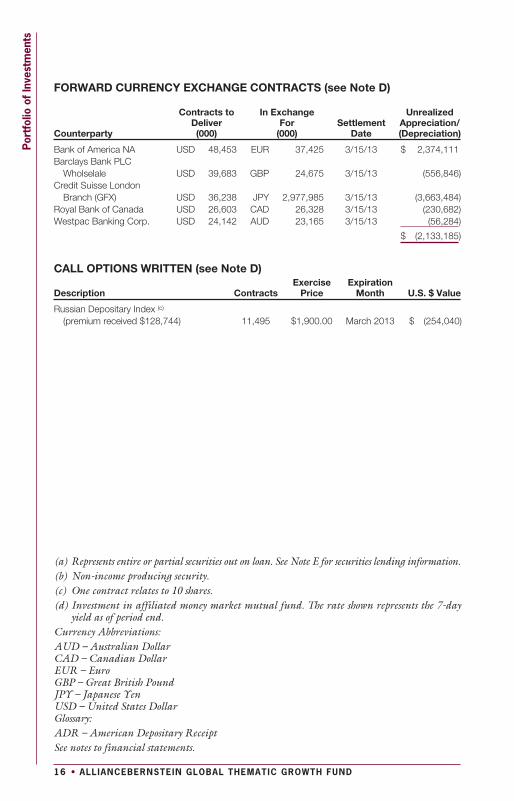
FORWARD CURRENCY EXCHANGE CONTRACTS (see Note D)
Counterparty
Contracts toDeliver(000)
In ExchangeFor
(000)Settlement
Date
UnrealizedAppreciation/(Depreciation)
Bank of America NA USD 48,453 EUR 37,425 3/15/13 $ 2,374,111Barclays Bank PLC
Wholselale USD 39,683 GBP 24,675 3/15/13 (556,846)Credit Suisse London
Branch (GFX) USD 36,238 JPY 2,977,985 3/15/13 (3,663,484)Royal Bank of Canada USD 26,603 CAD 26,328 3/15/13 (230,682)Westpac Banking Corp. USD 24,142 AUD 23,165 3/15/13 (56,284)
$ (2,133,185)
CALL OPTIONS WRITTEN (see Note D)
Description ContractsExercise
PriceExpiration
Month U.S. $ Value
Russian Depositary Index (c)
(premium received $128,744) 11,495 $1,900.00 March 2013 $ (254,040)
(a) Represents entire or partial securities out on loan. See Note E for securities lending information.(b) Non-income producing security.(c) One contract relates to 10 shares.(d) Investment in affiliated money market mutual fund. The rate shown represents the 7-day
yield as of period end.Currency Abbreviations:AUD – Australian DollarCAD – Canadian DollarEUR – EuroGBP – Great British PoundJPY – Japanese YenUSD – United States DollarGlossary:ADR – American Depositary ReceiptSee notes to financial statements.
16 • ALLIANCEBERNSTEIN GLOBAL THEMATIC GROWTH FUND
Port
folio
ofIn
vest
men
ts
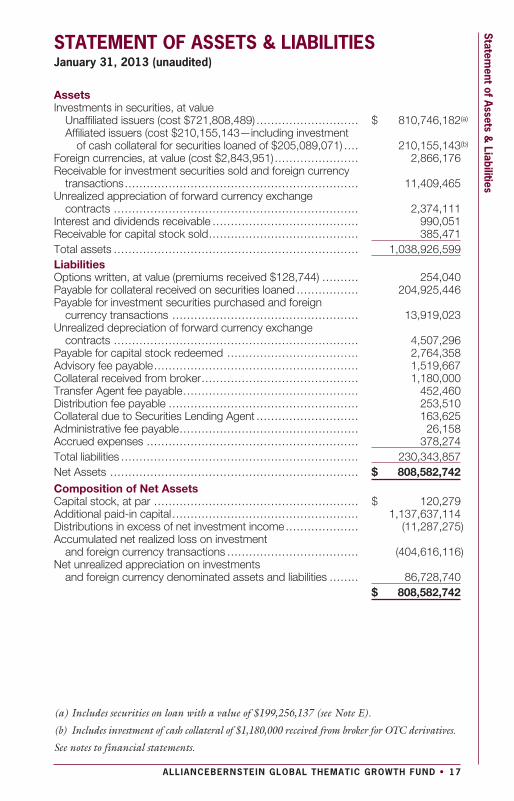
STATEMENT OF ASSETS & LIABILITIESJanuary 31, 2013 (unaudited)
AssetsInvestments in securities, at value
Unaffiliated issuers (cost $721,808,489) ............................ $ 810,746,182(a)
Affiliated issuers (cost $210,155,143—including investmentof cash collateral for securities loaned of $205,089,071) .... 210,155,143(b)
Foreign currencies, at value (cost $2,843,951) ....................... 2,866,176Receivable for investment securities sold and foreign currency
transactions................................................................ 11,409,465Unrealized appreciation of forward currency exchange
contracts ................................................................... 2,374,111Interest and dividends receivable ........................................ 990,051Receivable for capital stock sold......................................... 385,471Total assets ................................................................... 1,038,926,599LiabilitiesOptions written, at value (premiums received $128,744) .......... 254,040Payable for collateral received on securities loaned ................. 204,925,446Payable for investment securities purchased and foreign
currency transactions ................................................... 13,919,023Unrealized depreciation of forward currency exchange
contracts ................................................................... 4,507,296Payable for capital stock redeemed .................................... 2,764,358Advisory fee payable........................................................ 1,519,667Collateral received from broker........................................... 1,180,000Transfer Agent fee payable................................................ 452,460Distribution fee payable .................................................... 253,510Collateral due to Securities Lending Agent ............................ 163,625Administrative fee payable................................................. 26,158Accrued expenses .......................................................... 378,274Total liabilities ................................................................. 230,343,857Net Assets .................................................................... $ 808,582,742Composition of Net AssetsCapital stock, at par ........................................................ $ 120,279Additional paid-in capital ................................................... 1,137,637,114Distributions in excess of net investment income.................... (11,287,275)Accumulated net realized loss on investment
and foreign currency transactions .................................... (404,616,116)Net unrealized appreciation on investments
and foreign currency denominated assets and liabilities ........ 86,728,740$ 808,582,742
(a) Includes securities on loan with a value of $199,256,137 (see Note E).
(b) Includes investment of cash collateral of $1,180,000 received from broker for OTC derivatives.
See notes to financial statements.
ALLIANCEBERNSTEIN GLOBAL THEMATIC GROWTH FUND • 17
Statement
ofAssets&
Liabilities
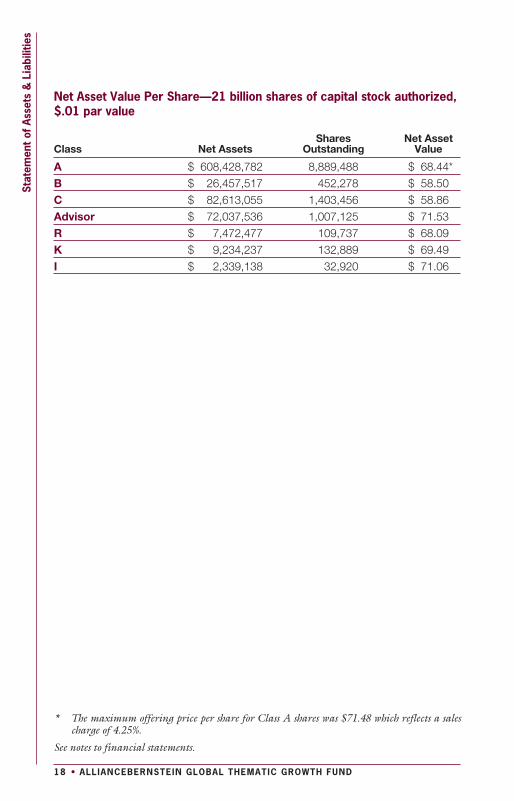
Net Asset Value Per Share—21 billion shares of capital stock authorized,$.01 par value
Class Net AssetsShares
OutstandingNet Asset
Value
A $ 608,428,782 8,889,488 $ 68.44*B $ 26,457,517 452,278 $ 58.50C $ 82,613,055 1,403,456 $ 58.86Advisor $ 72,037,536 1,007,125 $ 71.53R $ 7,472,477 109,737 $ 68.09K $ 9,234,237 132,889 $ 69.49I $ 2,339,138 32,920 $ 71.06
* The maximum offering price per share for Class A shares was $71.48 which reflects a salescharge of 4.25%.
See notes to financial statements.
18 • ALLIANCEBERNSTEIN GLOBAL THEMATIC GROWTH FUND
Stat
emen
tof
Asse
ts&
Liab
ilitie
s
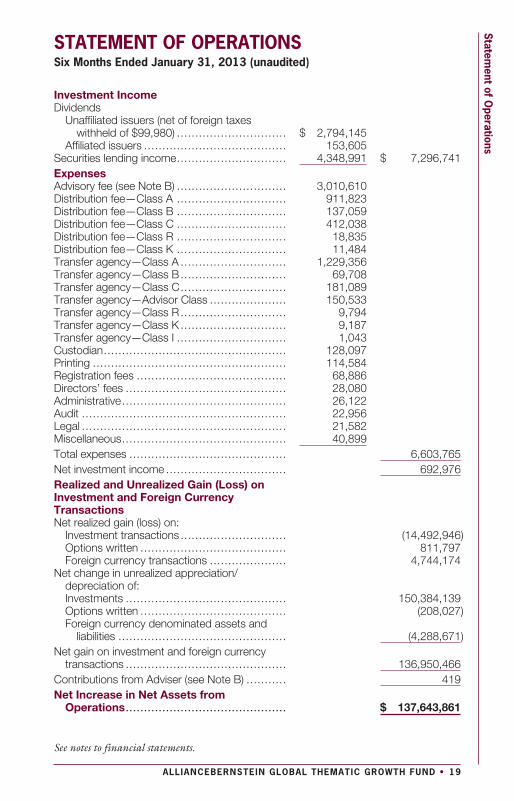
STATEMENT OF OPERATIONSSix Months Ended January 31, 2013 (unaudited)
Investment IncomeDividends
Unaffiliated issuers (net of foreign taxeswithheld of $99,980) .............................. $ 2,794,145
Affiliated issuers ....................................... 153,605Securities lending income.............................. 4,348,991 $ 7,296,741ExpensesAdvisory fee (see Note B) .............................. 3,010,610Distribution fee—Class A .............................. 911,823Distribution fee—Class B .............................. 137,059Distribution fee—Class C .............................. 412,038Distribution fee—Class R .............................. 18,835Distribution fee—Class K .............................. 11,484Transfer agency—Class A ............................. 1,229,356Transfer agency—Class B............................. 69,708Transfer agency—Class C............................. 181,089Transfer agency—Advisor Class ..................... 150,533Transfer agency—Class R............................. 9,794Transfer agency—Class K ............................. 9,187Transfer agency—Class I .............................. 1,043Custodian.................................................. 128,097Printing ..................................................... 114,584Registration fees ......................................... 68,886Directors’ fees ............................................ 28,080Administrative............................................. 26,122Audit ........................................................ 22,956Legal ........................................................ 21,582Miscellaneous............................................. 40,899Total expenses ........................................... 6,603,765Net investment income ................................. 692,976Realized and Unrealized Gain (Loss) onInvestment and Foreign CurrencyTransactionsNet realized gain (loss) on:
Investment transactions ............................. (14,492,946)Options written ........................................ 811,797Foreign currency transactions ..................... 4,744,174
Net change in unrealized appreciation/depreciation of:Investments ............................................ 150,384,139Options written ........................................ (208,027)Foreign currency denominated assets and
liabilities .............................................. (4,288,671)Net gain on investment and foreign currency
transactions ............................................ 136,950,466Contributions from Adviser (see Note B) ........... 419Net Increase in Net Assets from
Operations............................................ $ 137,643,861
See notes to financial statements.
ALLIANCEBERNSTEIN GLOBAL THEMATIC GROWTH FUND • 19
Statement
ofOperations
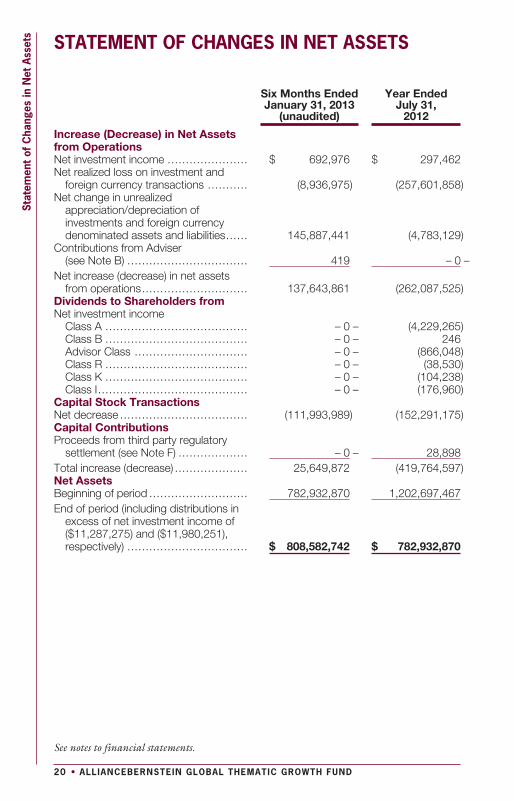
STATEMENT OF CHANGES IN NET ASSETS
Six Months EndedJanuary 31, 2013
(unaudited)
Year EndedJuly 31,
2012
Increase (Decrease) in Net Assetsfrom OperationsNet investment income ...................... $ 692,976 $ 297,462Net realized loss on investment and
foreign currency transactions ........... (8,936,975) (257,601,858)Net change in unrealized
appreciation/depreciation ofinvestments and foreign currencydenominated assets and liabilities...... 145,887,441 (4,783,129)
Contributions from Adviser(see Note B) ................................. 419 – 0 –
Net increase (decrease) in net assetsfrom operations............................. 137,643,861 (262,087,525)
Dividends to Shareholders fromNet investment income
Class A ....................................... – 0 – (4,229,265)Class B ....................................... – 0 – 246Advisor Class ............................... – 0 – (866,048)Class R ....................................... – 0 – (38,530)Class K ....................................... – 0 – (104,238)Class I......................................... – 0 – (176,960)
Capital Stock TransactionsNet decrease ................................... (111,993,989) (152,291,175)Capital ContributionsProceeds from third party regulatory
settlement (see Note F) ................... – 0 – 28,898Total increase (decrease) .................... 25,649,872 (419,764,597)Net AssetsBeginning of period ........................... 782,932,870 1,202,697,467End of period (including distributions in
excess of net investment income of($11,287,275) and ($11,980,251),respectively) ................................. $ 808,582,742 $ 782,932,870
See notes to financial statements.
20 • ALLIANCEBERNSTEIN GLOBAL THEMATIC GROWTH FUND
Stat
emen
tof
Cha
nges
inN
etAs
sets
NOTES TO FINANCIAL STATEMENTSJanuary 31, 2013 (unaudited)
NOTE ASignificant Accounting PoliciesAllianceBernstein Global Thematic Growth Fund, Inc. (the “Fund”), organizedas a Maryland corporation on December 24, 1980, is registered under theInvestment Company Act of 1940 as a diversified, open-end managementinvestment company. The Fund offers Class A, Class B, Class C, Advisor Class,Class R, Class K and Class I shares. Class A shares are sold with a front-end salescharge of up to 4.25% for purchases not exceeding $1,000,000. With respect topurchases of $1,000,000 or more, Class A shares redeemed within one year ofpurchase may be subject to a contingent deferred sales charge of 1%. Class Bshares are currently sold with a contingent deferred sales charge which declinesfrom 4% to zero depending on the period of time the shares are held. EffectiveJanuary 31, 2009, sales of Class B shares of the Fund to new investors weresuspended. Class B shares will only be issued (i) upon the exchange of Class Bshares from another AllianceBernstein Mutual Fund, (ii) for purposes of divi-dend reinvestment, (iii) through the Fund’s Automatic Investment Program (the“Program”) for accounts that established the Program prior to January 31,2009, and (iv) for purchases of additional shares by Class B shareholders as ofJanuary 31, 2009. The ability to establish a new Program for accounts contain-ing Class B shares was suspended as of January 31, 2009. Class B shares willautomatically convert to Class A shares eight years after the end of the calendarmonth of purchase. Class C shares are subject to a contingent deferred salescharge of 1% on redemptions made within the first year after purchase. Class Rand Class K shares are sold without an initial or contingent deferred sales charge.Advisor Class and Class I shares are sold without an initial or contingentdeferred sales charge and are not subject to ongoing distribution expenses. Allseven classes of shares have identical voting, dividend, liquidation and otherrights, except that the classes bear different distribution and transfer agencyexpenses. Each class has exclusive voting rights with respect to its distributionplan. The financial statements have been prepared in conformity with U.S. gen-erally accepted accounting principles (“U.S. GAAP”) which require managementto make certain estimates and assumptions that affect the reported amounts ofassets and liabilities in the financial statements and amounts of income andexpenses during the reporting period. Actual results could differ from thoseestimates. The following is a summary of significant accounting policies followedby the Fund.
1. Security ValuationPortfolio securities are valued at their current market value determined on thebasis of market quotations or, if market quotations are not readily available orare deemed unreliable, at “fair value” as determined in accordance with proce-dures established by and under the general supervision of the Fund’s Board ofDirectors (the “Board”).
In general, the market value of securities which are readily available and deemedreliable are determined as follows: Securities listed on a national securities
ALLIANCEBERNSTEIN GLOBAL THEMATIC GROWTH FUND • 21
Notes
toFinancialStatem
ents
exchange (other than securities listed on the NASDAQ Stock Market, Inc.(“NASDAQ”)) or on a foreign securities exchange are valued at the last sale priceat the close of the exchange or foreign securities exchange. If there has been nosale on such day, the securities are valued at the last traded price from the previousday. Securities listed on more than one exchange are valued by reference to theprincipal exchange on which the securities are traded; securities listed only onNASDAQ are valued in accordance with the NASDAQ Official Closing Price;listed or over the counter (“OTC”) market put or call options are valued at themid level between the current bid and ask prices. If either a current bid or currentask price is unavailable, AllianceBernstein L.P. (the “Adviser”) will have discretionto determine the best valuation (e.g. last trade price in the case of listed options);open futures contracts are valued using the closing settlement price or, in theabsence of such a price, the most recent quoted bid price. If there are no quota-tions available for the day of valuation, the last available closing settlement price isused; U.S. government securities and other debt instruments having 60 days orless remaining until maturity are valued at amortized cost if their original maturitywas 60 days or less; or by amortizing their fair value as of the 61st day prior tomaturity if their original term to maturity exceeded 60 days; fixed-income secu-rities, including mortgage backed and asset backed securities, may be valued on thebasis of prices provided by a pricing service or at a price obtained from one ormore of the major broker/dealers. In cases where broker/dealer quotes areobtained, the Adviser may establish procedures whereby changes in market yieldsor spreads are used to adjust, on a daily basis, a recently obtained quoted price on asecurity. Swaps and other derivatives are valued daily, primarily using independentpricing services, independent pricing models using market inputs, as well as thirdparty broker-dealers or counterparties. Investments in money market funds arevalued at their net asset value each day.
Securities for which market quotations are not readily available (includingrestricted securities) or are deemed unreliable are valued at fair value. Factorsconsidered in making this determination may include, but are not limited to,information obtained by contacting the issuer, analysts, analysis of the issuer’sfinancial statements or other available documents. In addition, the Fund may usefair value pricing for securities primarily traded in non-U.S. markets becausemost foreign markets close well before the Fund values its securities at 4:00p.m., Eastern Time. The earlier close of foreign markets gives rise to the possi-bility that significant events, including broad market moves, may have occurredbetween the close of the foreign markets and the time at which the Fund valuesits securities which may materially affect the value of securities trading in suchmarkets. To account for this, the Fund may frequently value many of its foreignequity securities using fair value prices based on third party vendor modelingtools to the extent available.
2. Fair Value MeasurementsIn accordance with U.S. GAAP regarding fair value measurements, fair value isdefined as the price that the Fund would receive to sell an asset or pay to transfer
22 • ALLIANCEBERNSTEIN GLOBAL THEMATIC GROWTH FUND
Not
esto
Fina
ncia
lSta
tem
ents
a liability in an orderly transaction between market participants at the measure-ment date. U.S. GAAP establishes a framework for measuring fair value, and athree-level hierarchy for fair value measurements based upon the transparency ofinputs to the valuation of an asset (including those valued based on their marketvalues as described in Note 1 above) or liability. Inputs may be observable orunobservable and refer broadly to the assumptions that market participantswould use in pricing the asset or liability. Observable inputs reflect the assump-tions market participants would use in pricing the asset or liability based onmarket data obtained from sources independent of the Fund. Unobservableinputs reflect the Fund’s own assumptions about the assumptions that marketparticipants would use in pricing the asset or liability based on the bestinformation available in the circumstances. Each investment is assigned a levelbased upon the observability of the inputs which are significant to the overallvaluation. The three-tier hierarchy of inputs is summarized below.
• Level 1—quoted prices in active markets for identical investments• Level 2—other significant observable inputs (including quoted prices for
similar investments, interest rates, prepayment speeds, credit risk, etc.)• Level 3—significant unobservable inputs (including the Fund’s own
assumptions in determining the fair value of investments)
Where readily available market prices or relevant bid prices are not available forcertain equity investments, such investments may be valued based on similarpublicly traded investments, movements in relevant indices since last availableprices or based upon underlying company fundamentals and comparable com-pany data (such as multiples to earnings or other multiples to equity). Where aninvestment is valued using an observable input, by pricing vendors, such asanother publicly traded security, the investment will be classified as Level 2. Ifmanagement determines that an adjustment is appropriate based on restrictionson resale, illiquidity or uncertainty, and such adjustment is a significant compo-nent of the valuation, the investment will be classified as Level 3. An investmentwill also be classified as Level 3 where management uses company fundamentalsand other significant inputs to determine the valuation.
Options and warrants are valued using market-based inputs to models, broker ordealer quotations, or alternative pricing sources with reasonable levels of pricetransparency, where such inputs and models are available. Alternatively the valuesmay be obtained through unobservable management determined inputs and/ormanagement’s proprietary models. Where models are used, the selection of aparticular model to value an option or a warrant depends upon the contractualterms of, and specific risks inherent in, the option or warrant as well as the avail-ability of pricing information in the market. Valuation models require a variety ofinputs, including contractual terms, market prices, measures of volatility and corre-lations of such inputs. Exchange traded options will be classified as Level 2. Foroptions or warrants that do not trade on exchange but trade in liquid markets,inputs can generally be verified and model selection does not involve significant
ALLIANCEBERNSTEIN GLOBAL THEMATIC GROWTH FUND • 23
Notes
toFinancialStatem
ents
management judgment. Options and warrants are classified within Level 2 on thefair value hierarchy when all of the significant inputs can be corroborated to marketevidence. Otherwise such instruments are classified as Level 3.
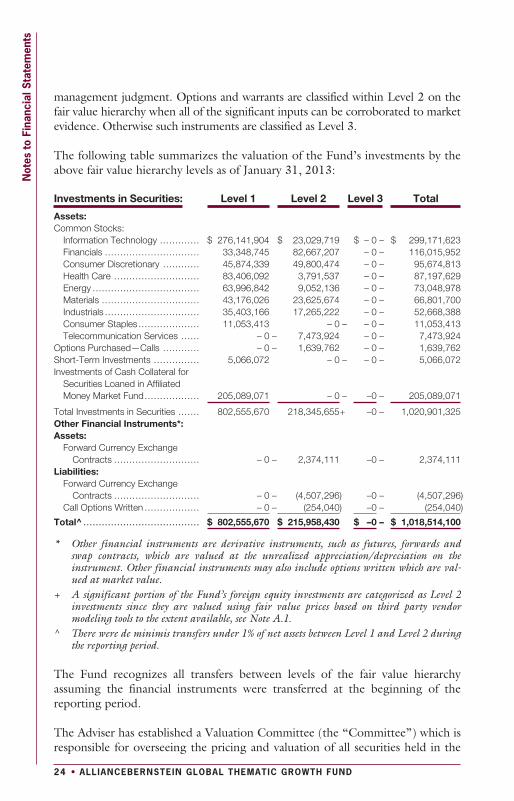
The following table summarizes the valuation of the Fund’s investments by theabove fair value hierarchy levels as of January 31, 2013:
Investments in Securities: Level 1 Level 2 Level 3 Total
Assets:Common Stocks:
Information Technology ............. $ 276,141,904 $ 23,029,719 $ – 0 – $ 299,171,623Financials ............................... 33,348,745 82,667,207 – 0 – 116,015,952Consumer Discretionary ............ 45,874,339 49,800,474 – 0 – 95,674,813Health Care ............................ 83,406,092 3,791,537 – 0 – 87,197,629Energy ................................... 63,996,842 9,052,136 – 0 – 73,048,978Materials ................................ 43,176,026 23,625,674 – 0 – 66,801,700Industrials ............................... 35,403,166 17,265,222 – 0 – 52,668,388Consumer Staples .................... 11,053,413 – 0 – – 0 – 11,053,413Telecommunication Services ...... – 0 – 7,473,924 – 0 – 7,473,924
Options Purchased—Calls ............ – 0 – 1,639,762 – 0 – 1,639,762Short-Term Investments ............... 5,066,072 – 0 – – 0 – 5,066,072Investments of Cash Collateral for
Securities Loaned in AffiliatedMoney Market Fund.................. 205,089,071 – 0 – –0 – 205,089,071
Total Investments in Securities ....... 802,555,670 218,345,655+ –0 – 1,020,901,325Other Financial Instruments*:Assets:
Forward Currency ExchangeContracts ............................ – 0 – 2,374,111 –0 – 2,374,111
Liabilities:Forward Currency Exchange
Contracts ............................ – 0 – (4,507,296) –0 – (4,507,296)Call Options Written .................. – 0 – (254,040) –0 – (254,040)
Total^ ...................................... $ 802,555,670 $ 215,958,430 $ –0 – $ 1,018,514,100
* Other financial instruments are derivative instruments, such as futures, forwards andswap contracts, which are valued at the unrealized appreciation/depreciation on theinstrument. Other financial instruments may also include options written which are val-ued at market value.
+ A significant portion of the Fund’s foreign equity investments are categorized as Level 2investments since they are valued using fair value prices based on third party vendormodeling tools to the extent available, see Note A.1.
^ There were de minimis transfers under 1% of net assets between Level 1 and Level 2 duringthe reporting period.
The Fund recognizes all transfers between levels of the fair value hierarchyassuming the financial instruments were transferred at the beginning of thereporting period.
The Adviser has established a Valuation Committee (the “Committee”) which isresponsible for overseeing the pricing and valuation of all securities held in the
24 • ALLIANCEBERNSTEIN GLOBAL THEMATIC GROWTH FUND
Not
esto
Fina
ncia
lSta
tem
ents
Fund. The Committee operates under pricing and valuation policies and proce-dures established by the Adviser and approved by the Board, including pricingpolicies which set forth the mechanisms and processes to be employed on a dailybasis to implement these policies and procedures. In particular, the pricing poli-cies describe how to determine market quotations for securities and otherinstruments. The Committee’s responsibilities include: 1) fair value and liquiditydeterminations (and oversight of any third parties to whom any responsibility forfair value and liquidity determinations is delegated), and 2) regular monitoring ofthe Adviser’s pricing and valuation policies and procedures and modification orenhancement of these policies and procedures (or recommendation of the mod-ification of these policies and procedures) as the Committee believes appropriate.
The Committee is also responsible for monitoring the implementation of thepricing policies by the Adviser’s Pricing Group (the “Pricing Group”) and athird party which performs certain pricing functions in accordance with the pric-ing policies. The Pricing Group is responsible for the oversight of the third partyon a day-to-day basis. The Committee and the Pricing Group perform a series ofactivities to provide reasonable assurance of the accuracy of prices including: 1)periodic vendor due diligence meetings, review of methodologies, newdevelopments and process at vendors, 2) daily compare of security valuationversus prior day for all securities that exceeded established thresholds, and 3)daily review of unpriced, stale, and variance reports with exceptions reviewed bysenior management and the Committee.
In addition, several processes outside of the pricing process are used to monitorvaluation issues including: 1) performance and performance attribution reportsare monitored for anomalous impacts based upon benchmark performance, and2) portfolio managers review all portfolios for performance and analytics (whichare generated using the Adviser’s prices).
3. Currency TranslationAssets and liabilities denominated in foreign currencies and commitments underforward currency exchange contracts are translated into U.S. dollars at the meanof the quoted bid and ask prices of such currencies against the U.S. dollar. Pur-chases and sales of portfolio securities are translated into U.S. dollars at the ratesof exchange prevailing when such securities were acquired or sold. Income andexpenses are translated into U.S. dollars at rates of exchange prevailing whenaccrued.
Net realized gain or loss on foreign currency transactions represents foreignexchange gains and losses from sales and maturities of foreign fixed incomeinvestments, foreign currency exchange contracts, holding of foreign currencies,currency gains or losses realized between the trade and settlement dates on for-eign investment transactions, and the difference between the amounts of divi-dends, interest and foreign withholding taxes recorded on the Fund’s books andthe U.S. dollar equivalent amounts actually received or paid. Net unrealized
ALLIANCEBERNSTEIN GLOBAL THEMATIC GROWTH FUND • 25
Notes
toFinancialStatem
ents
currency gains and losses from valuing foreign currency denominated assets andliabilities at period end exchange rates are reflected as a component of netunrealized appreciation or depreciation of foreign currency denominated assetsand liabilities.
4. TaxesIt is the Fund’s policy to meet the requirements of the Internal Revenue Codeapplicable to regulated investment companies and to distribute all of its invest-ment company taxable income and net realized gains, if any, to shareholders.Therefore, no provisions for federal income or excise taxes are required. TheFund may be subject to taxes imposed by countries in which it invests. Suchtaxes are generally based on income and/or capital gains earned or repatriated.Taxes are accrued and applied to net investment income, net realized gains andnet unrealized appreciation/depreciation as such income and/or gains areearned.
In accordance with U.S. GAAP requirements regarding accounting for uncertaintiesin income taxes, management has analyzed the Fund’s tax positions taken or expectedto be taken on federal and state income tax returns for all open tax years (the currentand the prior three tax years) and has concluded that no provision for income tax isrequired in the Fund’s financial statements.
5. Investment Income and Investment TransactionsDividend income is recorded on the ex-dividend date or as soon as the Fund isinformed of the dividend. Interest income is accrued daily. Investment trans-actions are accounted for on the date the securities are purchased or sold.Investment gains or losses are determined on the identified cost basis. The Fundamortizes premiums and accretes discounts as adjustments to interest income.
6. Class AllocationsAll income earned and expenses incurred by the Fund are borne on a pro-ratabasis by each outstanding class of shares, based on the proportionate interest inthe Fund represented by the net assets of such class, except for class specificexpenses which are allocated to the respective class. Realized and unrealizedgains and losses are allocated among the various share classes based on respectivenet assets.
7. Dividends and DistributionsDividends and distributions to shareholders, if any, are recorded on the ex-dividend date. Income dividends and capital gains distributions are determinedin accordance with federal tax regulations and may differ from those determinedin accordance with U.S. GAAP. To the extent these differences are permanent,such amounts are reclassified within the capital accounts based on their federaltax basis treatment; temporary differences do not require such reclassification.
26 • ALLIANCEBERNSTEIN GLOBAL THEMATIC GROWTH FUND
Not
esto
Fina
ncia
lSta
tem
ents
NOTE BAdvisory Fee and Other Transactions with AffiliatesUnder the terms of the investment advisory agreement, the Fund pays theAdviser a quarterly advisory fee equal to the following percentages of the valueof the Fund’s aggregate net assets at the close of business on the last businessday of the previous quarter: .25 of .75% of the first $2.5 billion, .25 of .65% ofthe next $2.5 billion, and .25 of .60% of the net assets in excess of $5 billion.The fee is accrued daily and paid quarterly.
During the six months ended January 31, 2013, the Adviser reimbursed theFund $419 for trading losses incurred due to a trade entry error.
Pursuant to the investment advisory agreement, the Fund may reimburse theAdviser for certain legal and accounting services provided to the Fund by theAdviser. For the six months ended January 31, 2013, the reimbursement forsuch services amounted to $26,122.
The Fund compensates AllianceBernstein Investor Services, Inc. (“ABIS”), awholly-owned subsidiary of the Adviser, under a Transfer Agency Agreement forproviding personnel and facilities to perform transfer agency services for the Fund.ABIS may make payments to intermediaries that provide omnibus account services,sub-accounting services and/or networking services. Such compensation retainedby ABIS amounted to $759,498 for the six months ended January 31, 2013.
AllianceBernstein Investments, Inc. (the “Distributor”), a wholly-owned subsidiaryof the Adviser, serves as the distributor of the Fund’s shares. The Distributor hasadvised the Fund that it has retained front-end sales charges of $3,635 from the saleof Class A shares and received $4,302, $10,788 and $1,231 in contingent deferredsales charges imposed upon redemptions by shareholders of Class A, Class B andClass C shares, respectively, for the six months ended January 31, 2013.
The Fund may invest in the AllianceBernstein Fixed-Income Shares, Inc.—Government STIF Portfolio (“Government STIF Portfolio”), an open-endmanagement investment company managed by the Adviser. The GovernmentSTIF Portfolio is offered as a cash management option to mutual funds andother institutional accounts of the Adviser, and is not available for direct pur-chase by members of the public. The Government STIF Portfolio pays noinvestment management fees but does bear its own expenses. A summary of theFund’s transactions in shares of the Government STIF Portfolio for the sixmonths ended January 31, 2013 is as follows:
Market ValueJuly 31, 2012
(000)
Purchasesat Cost
(000)
SalesProceeds
(000)
Market ValueJanuary 31, 2013
(000)
DividendIncome
(000)
$ 683 $ 91,152 $ 86,769 $ 5,066 $ 2
ALLIANCEBERNSTEIN GLOBAL THEMATIC GROWTH FUND • 27
Notes
toFinancialStatem
ents
Brokerage commissions paid on investment transactions for the six monthsended January 31, 2013 amounted to $1,128,249, of which $3,810 and$4,214, respectively, was paid to Sanford C. Bernstein & Co. LLC and SanfordC. Bernstein Limited, affiliates of the Adviser.
NOTE CDistribution Services AgreementThe Fund has adopted a Distribution Services Agreement (the “Agreement”)pursuant to Rule 12b-1 under the Investment Company Act of 1940. Under theAgreement, the Fund pays distribution and servicing fees to the Distributor at anannual rate of up to .30% of the Fund’s average daily net assets attributable toClass A shares, 1% of the Fund’s average daily net assets attributable to both ClassB and Class C shares, .50% of the Fund’s average daily net assets attributable toClass R shares and .25% of the Fund’s average daily net assets attributable to ClassK shares. There are no distribution and servicing fees on the Advisor Class andClass I shares. The fees are accrued daily and paid monthly. The Agreement pro-vides that the Distributor will use such payments in their entirety for distributionassistance and promotional activities. Since the commencement of the Fund’soperations, the Distributor has incurred expenses in excess of the distribution costsreimbursed by the Fund in the amounts of $64,780,985, $7,917,837, $259,595and $63,889 for Class B, Class C, Class R and Class K shares, respectively. Whilesuch costs may be recovered from the Fund in future periods so long as theAgreement is in effect, the rate of the distribution and servicing fees payable underthe Agreement may not be increased without a shareholder vote. In accordancewith the Agreement, there is no provision for recovery of unreimbursed dis-tribution costs incurred by the Distributor beyond the current fiscal year forClass A shares. The Agreement also provides that the Adviser may use its ownresources to finance the distribution of the Fund’s shares.
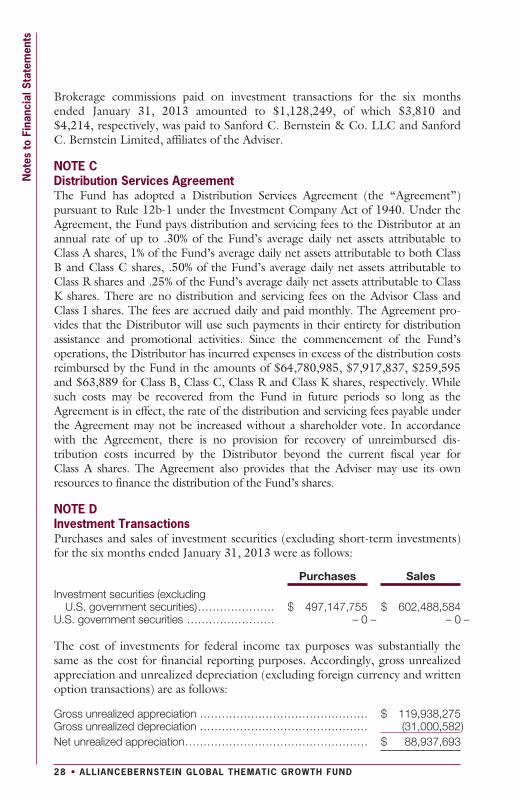
NOTE DInvestment TransactionsPurchases and sales of investment securities (excluding short-term investments)for the six months ended January 31, 2013 were as follows:
Purchases Sales
Investment securities (excludingU.S. government securities)..................... $ 497,147,755 $ 602,488,584
U.S. government securities ........................ – 0 – – 0 –
The cost of investments for federal income tax purposes was substantially thesame as the cost for financial reporting purposes. Accordingly, gross unrealizedappreciation and unrealized depreciation (excluding foreign currency and writtenoption transactions) are as follows:
Gross unrealized appreciation .............................................. $ 119,938,275Gross unrealized depreciation .............................................. (31,000,582)Net unrealized appreciation.................................................. $ 88,937,693
28 • ALLIANCEBERNSTEIN GLOBAL THEMATIC GROWTH FUND
Not
esto
Fina
ncia
lSta
tem
ents
1. Derivative Financial InstrumentsThe Fund may use derivatives in an effort to earn income and enhance returns,to replace more traditional direct investments, to obtain exposure to otherwiseinaccessible markets (collectively, “investment purposes”), or to hedge or adjustthe risk profile of its portfolio.
The principal types of derivatives utilized by the Fund, as well as the methods inwhich they may be used are:
• Forward Currency Exchange ContractsThe Fund may enter into forward currency exchange contracts in order tohedge its exposure to changes in foreign currency exchange rates on itsforeign portfolio holdings, to hedge certain firm purchase and salecommitments denominated in foreign currencies and for non-hedgingpurposes as a means of making direct investments in foreign currencies, asdescribed below under “Currency Transactions”.
A forward currency exchange contract is a commitment to purchase or sella foreign currency at a future date at a negotiated forward rate. The gain orloss arising from the difference between the original contract and theclosing of such contract would be included in net realized gain or loss onforeign currency transactions. Fluctuations in the value of open forwardcurrency exchange contracts are recorded for financial reporting purposesas unrealized appreciation and/or depreciation by the Fund. Risks mayarise from the potential inability of a counterparty to meet the terms of acontract and from unanticipated movements in the value of a foreigncurrency relative to the U.S. dollar.
During the six months ended January 31, 2013, the Fund held forwardcurrency exchange contracts for hedging and non-hedging purposes.
• Option TransactionsFor hedging and investment purposes, the Fund may purchase and write(sell) put and call options on U.S. and foreign securities, includinggovernment securities, and foreign currencies that are traded on U.S. andforeign securities exchanges and over-the-counter markets. Among otherthings, the Fund may use options transactions for non-hedging purposes asa means of making direct investments in foreign currencies, as describedbelow under “Currency Transactions” and may use options strategiesinvolving the purchase and/or writing of various combinations of calland/or put options, for hedging and investment purposes.
The risk associated with purchasing an option is that the Fund pays apremium whether or not the option is exercised. Additionally, the Fundbears the risk of loss of the premium and change in market value shouldthe counterparty not perform under the contract. Put and call optionspurchased are accounted for in the same manner as portfolio securities.The cost of securities acquired through the exercise of call options is
ALLIANCEBERNSTEIN GLOBAL THEMATIC GROWTH FUND • 29
Notes
toFinancialStatem
ents
increased by premiums paid. The proceeds from securities sold through theexercise of put options are decreased by the premiums paid.
When the Fund writes an option, the premium received by the Fund isrecorded as a liability and is subsequently adjusted to the current marketvalue of the option written. Premiums received from written options whichexpire unexercised are recorded by the Fund on the expiration date asrealized gains from options written. The difference between the premiumreceived and the amount paid on effecting a closing purchase transaction,including brokerage commissions, is also treated as a realized gain, or if thepremium received is less than the amount paid for the closing purchasetransaction, as a realized loss. If a call option is exercised, the premiumreceived is added to the proceeds from the sale of the underlying securityor currency in determining whether the Fund has realized a gain or loss. Ifa put option is exercised, the premium received reduces the cost basis ofthe security or currency purchased by the Fund. In writing an option, theFund bears the market risk of an unfavorable change in the price of thesecurity or currency underlying the written option. Exercise of an optionwritten by the Fund could result in the Fund selling or buying a security orcurrency at a price different from the current market value.
During the six months ended January 31, 2013, the Fund held purchasedoptions for hedging and non-hedging purposes. During the six monthsended January 31, 2013, the Fund held written options for hedging andnon-hedging purposes.
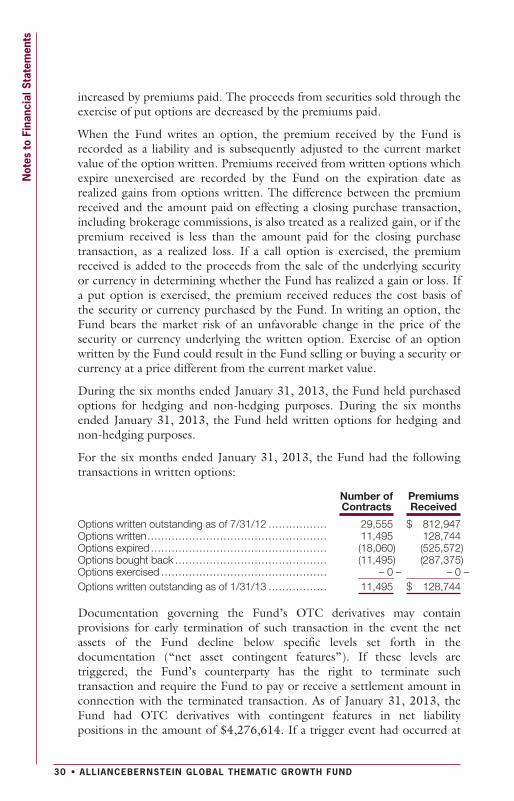
For the six months ended January 31, 2013, the Fund had the followingtransactions in written options:
Number ofContracts
PremiumsReceived
Options written outstanding as of 7/31/12 ................. 29,555 $ 812,947Options written.................................................... 11,495 128,744Options expired ................................................... (18,060) (525,572)Options bought back ............................................ (11,495) (287,375)Options exercised ................................................ – 0 – – 0 –Options written outstanding as of 1/31/13 ................. 11,495 $ 128,744
Documentation governing the Fund’s OTC derivatives may containprovisions for early termination of such transaction in the event the netassets of the Fund decline below specific levels set forth in thedocumentation (“net asset contingent features”). If these levels aretriggered, the Fund’s counterparty has the right to terminate suchtransaction and require the Fund to pay or receive a settlement amount inconnection with the terminated transaction. As of January 31, 2013, theFund had OTC derivatives with contingent features in net liabilitypositions in the amount of $4,276,614. If a trigger event had occurred at
30 • ALLIANCEBERNSTEIN GLOBAL THEMATIC GROWTH FUND
Not
esto
Fina
ncia
lSta
tem
ents
January 31, 2013, for those derivatives in a net liability position, anamount of $4,276,614 would be required to be posted by the Fund.
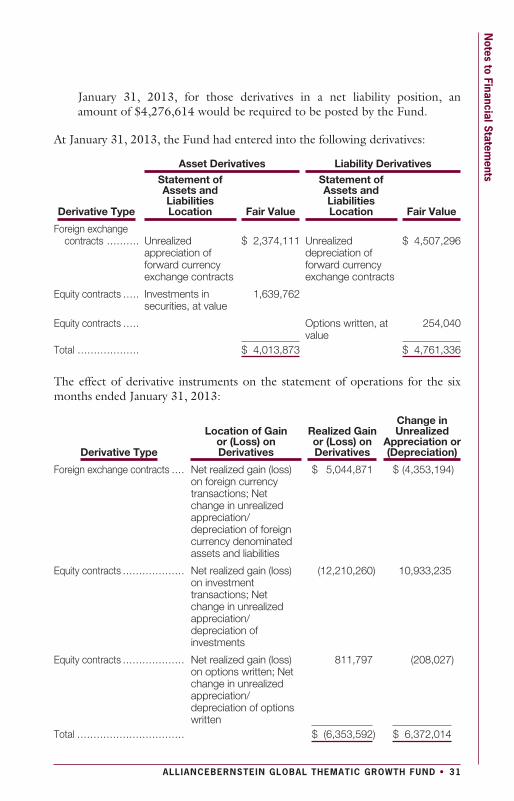
At January 31, 2013, the Fund had entered into the following derivatives:
Asset Derivatives Liability Derivatives
Derivative Type
Statement ofAssets andLiabilitiesLocation Fair Value
Statement ofAssets andLiabilitiesLocation Fair Value
Foreign exchangecontracts .......... Unrealized
appreciation offorward currencyexchange contracts
$ 2,374,111 Unrealizeddepreciation offorward currencyexchange contracts
$ 4,507,296
Equity contracts ..... Investments insecurities, at value
1,639,762
Equity contracts ..... Options written, atvalue
254,040
Total ................... $ 4,013,873 $ 4,761,336
The effect of derivative instruments on the statement of operations for the sixmonths ended January 31, 2013:
Derivative Type
Location of Gainor (Loss) onDerivatives
Realized Gainor (Loss) onDerivatives
Change inUnrealized
Appreciation or(Depreciation)
Foreign exchange contracts .... Net realized gain (loss)on foreign currencytransactions; Netchange in unrealizedappreciation/depreciation of foreigncurrency denominatedassets and liabilities
$ 5,044,871 $ (4,353,194)
Equity contracts ................... Net realized gain (loss)on investmenttransactions; Netchange in unrealizedappreciation/depreciation ofinvestments
(12,210,260) 10,933,235
Equity contracts ................... Net realized gain (loss)on options written; Netchange in unrealizedappreciation/depreciation of optionswritten
811,797 (208,027)
Total ................................. $ (6,353,592) $ 6,372,014
ALLIANCEBERNSTEIN GLOBAL THEMATIC GROWTH FUND • 31
Notes
toFinancialStatem
ents
The following table represents the volume of the Fund’s derivative transactionsduring the six months ended January 31, 2013:
Forward Currency Exchange Contracts:Average principal amount of buy contracts........................... $ 197,715,887Average principal amount of sale contracts .......................... $ 4,716,504
Purchased Options:Average Monthly Cost ..................................................... $ 10,957,294
2. Currency TransactionsThe Fund may invest in non-U.S. Dollar securities on a currency hedged orunhedged basis. The Fund may seek investment opportunities by taking long orshort positions in currencies through the use of currency-related derivatives,including forward currency exchange contracts, futures and options on futures,swaps, and other options. The Fund may enter into transactions for investmentopportunities when it anticipates that a foreign currency will appreciate or depreci-ate in value but securities denominated in that currency are not held by the Fundand do not present attractive investment opportunities. Such transactions may alsobe used when the Adviser believes that it may be more efficient than a directinvestment in a foreign currency-denominated security. The Fund may also con-duct currency exchange contracts on a spot basis (i.e., for cash at the spot rateprevailing in the currency exchange market for buying or selling currencies).
NOTE ESecurities LendingThe Fund may enter into securities lending transactions. Under the Fund’s securitieslending program, all loans of securities will be collateralized continually by cash. TheFund will be compensated for the loan from a portion of the net return from theincome earned on cash collateral after a rebate is paid to the borrower (in some cas-es, this rebate may be a “negative rebate” or fee paid by the borrower to the Fund inconnection with the loan), and payments are made for fees of the securities lendingagent and for certain other administrative expenses. It is the policy of the Fund toreceive collateral consisting of cash in an amount exceeding the value of the secu-rities loaned. The Fund will have the right to call a loan and obtain the securitiesloaned at any time on notice to the borrower within the normal and customarysettlement time for the securities. While the securities are on loan, the borrower isobligated to pay the Fund amounts equal to any income or other distributions fromthe securities. The Fund will not have the right to vote any securities during theexistence of a loan, but will have the right to regain ownership of loaned securities inorder to exercise voting or other ownership rights. The lending agent has agreed toindemnify the Fund in the case of default of any securities borrower. Collateralreceived and securities loaned are marked to market daily to ensure that the secu-rities loaned are secured by collateral. The lending agent will invest the cashcollateral received in AllianceBernstein Exchange Reserves, an eligible money marketvehicle, in accordance with the investment restrictions of the Fund, and as approvedby the Fund’s Board of Directors. The collateral received on securities loaned is
32 • ALLIANCEBERNSTEIN GLOBAL THEMATIC GROWTH FUND
Not
esto
Fina
ncia
lSta
tem
ents
recorded as an asset as well as a corresponding liability in the statement of assets andliabilities. When the Fund lends securities, its investment performance will continueto reflect changes in the value of the securities loaned. At January 31, 2013, theFund had securities on loan with a value of $199,256,137 and had received cashcollateral which has been invested into AllianceBernstein Exchange Reserves of$205,089,071. The cash collateral will be adjusted on the next business day tomaintain the required collateral amount. The Fund earned securities lending incomeof $4,348,991 and $152,043 from the borrowers and AllianceBernstein ExchangeReserves, respectively, for the six months ended January 31, 2013; these amountsare reflected in the statement of operations. A principal risk of lending portfoliosecurities is that the borrower will fail to return the loaned securities upon termi-nation of the loan and that the collateral will not be sufficient to replace the loanedsecurities. A summary of the Fund’s transactions in shares of AllianceBernsteinExchange Reserves for the six months ended January 31, 2013 is as follows:
Market ValueJuly 31, 2012
(000)
Purchasesat Cost
(000)
SalesProceeds
(000)
Market ValueJanuary 31, 2013
(000)
DividendIncome
(000)
$ 211,991 $ 410,160 $ 417,062 $ 205,089 $ 152
NOTE FCapital StockEach class consists of 3,000,000,000 authorized shares. Transactions in capitalshares for each class were as follows:
Shares AmountSix Months EndedJanuary 31, 2013
(unaudited)
Year EndedJuly 31,
2012
Six Months EndedJanuary 31, 2013
(unaudited)
Year EndedJuly 31,
2012
Class AShares sold 161,766 626,061 $ 10,373,737 $ 39,580,769Shares issued in
reinvestment ofdividends – 0 – 69,049 – 0 – 3,880,628
Shares convertedfrom Class B 56,520 187,612 3,632,493 11,979,038
Shares redeemed (1,314,883) (2,636,916) (84,363,292) (165,535,315)Net decrease (1,096,597) (1,754,194) $ (70,357,062) $ (110,094,880)
Class BShares sold 16,500 43,177 $ 903,633 $ 2,342,906Shares issued in
reinvestment ofdividends – 0 – (4) – 0 – (245)
Shares convertedto Class A (66,020) (218,151) (3,632,493) (11,979,038)
Shares redeemed (42,556) (138,703) (2,282,446) (7,557,132)Net decrease (92,076) (313,681) $ (5,011,306) $ (17,193,509)
ALLIANCEBERNSTEIN GLOBAL THEMATIC GROWTH FUND • 33
Notes
toFinancialStatem
ents
Shares AmountSix Months EndedJanuary 31, 2013
(unaudited)
Year EndedJuly 31,
2012
Six Months EndedJanuary 31, 2013
(unaudited)
Year EndedJuly 31,
2012
Class CShares sold 16,988 56,419 $ 935,152 $ 3,098,551Shares issued in
reinvestment ofdividends – 0 – – 0 – – 0 – (13)
Shares redeemed (187,315) (473,871) (10,310,515) (25,714,024)Net decrease (170,327) (417,452) $ (9,375,363) $ (22,615,486)
Advisor ClassShares sold 74,574 621,495 $ 4,995,969 $ 40,337,890Shares issued in
reinvestment ofdividends – 0 – 11,877 – 0 – 695,166
Shares redeemed (304,021) (745,876) (20,247,625) (48,307,310)Net decrease (229,447) (112,504) $ (15,251,656) $ (7,274,254)
Class RShares sold 15,191 86,341 $ 952,278 $ 5,277,164Shares issued in
reinvestment ofdividends – 0 – 688 – 0 – 38,481
Shares redeemed (36,865) (58,857) (2,323,042) (3,652,954)Net increase
(decrease) (21,674) 28,172 $ (1,370,764) $ 1,662,691
Class KShares sold 7,260 103,576 $ 472,736 $ 6,585,214Shares issued in
reinvestment ofdividends – 0 – 1,832 – 0 – 104,237
Shares redeemed (19,895) (31,924) (1,303,804) (2,036,586)Net increase
(decrease) (12,635) 73,484 $ (831,068) $ 4,652,865
Class IShares sold 3,075 33,021 $ 206,096 $ 2,163,714Shares issued in
reinvestment ofdividends – 0 – 2,499 – 0 – 144,691
Shares redeemed (148,709) (57,869) (10,002,866) (3,737,007)Net decrease (145,634) (22,349) $ (9,796,770) $ (1,428,602)
For the year ended July 31, 2012, the Fund received $28,898 related to a third-party’s settlement of regulatory proceedings involving allegations of impropertrading. This amount is presented in the Fund’s statement of changes in netassets. Neither the Fund nor its affiliates were involved in the proceedings or thecalculation of the payment.
34 • ALLIANCEBERNSTEIN GLOBAL THEMATIC GROWTH FUND
Not
esto
Fina
ncia
lSta
tem
ents
NOTE GRisks Involved in Investing in the FundForeign Securities Risk—Investing in securities of foreign companies or foreigngovernments involves special risks which include changes in foreign currencyexchange rates and the possibility of future political and economicdevelopments which could adversely affect the value of such securities.Moreover, securities of many foreign companies or foreign governments andtheir markets may be less liquid and their prices more volatile than those ofcomparable U.S. companies or of the U.S. government.
Emerging Market Risk—Investments in emerging market countries may havemore risk because the markets are less developed and less liquid, and becausethese investments may be subject to increased economic, political, regulatoryand other uncertainties.
Currency Risk—This is the risk that changes in foreign currency exchange ratesmay negatively affect the value of the Fund’s investments or reduce the returnsof the Fund. For example, the value of the Fund’s investments in foreigncurrency-denominated securities or currencies may decrease if the U.S. Dollar isstrong (i.e., gaining value relative to other currencies) and other currencies areweak (i.e., losing value relative to the U.S. Dollar). Currency markets aregenerally not as regulated as securities markets. Independent of the Fund’sinvestments denominated in foreign currencies, the Fund’s positions in variousforeign currencies may cause the Fund to experience investment losses due tothe changes in exchange rates and interest rates.
Capitalization Risk—Investments in small- and mid-capitalization companiesmay be more volatile than investments in large-capitalization companies.Investments in small-capitalization companies may have additional risks becausethese companies have limited product lines, markets or financial resources.
Derivatives Risk—The Fund may enter into derivative transactions such asforwards, options, futures and swaps. Derivatives may be illiquid, difficult toprice, and leveraged so that small changes may produce disproportionate lossesfor the Fund, and subject to counterparty risk to a greater degree than moretraditional investments. Derivatives may result in significant losses, includinglosses that are far greater than the value of the derivatives reflected in thestatement of assets and liabilities.
Indemnification Risk—In the ordinary course of business, the Fund enters intocontracts that contain a variety of indemnifications. The Fund’s maximumexposure under these arrangements is unknown. However, the Fund has nothad prior claims or losses pursuant to these indemnification provisions andexpects the risk of loss thereunder to be remote. Therefore, the Fund has notaccrued any liability in connection with these indemnification provisions.
ALLIANCEBERNSTEIN GLOBAL THEMATIC GROWTH FUND • 35
Notes
toFinancialStatem
ents
NOTE HJoint Credit FacilityA number of open-end mutual funds managed by the Adviser, including theFund, participate in a $140 million revolving credit facility (the “Facility”)intended to provide short-term financing, if necessary, subject to certainrestrictions in connection with abnormal redemption activity. Commitment feesrelated to the Facility are paid by the participating funds and are included inmiscellaneous expenses in the statement of operations. The Fund did not utilizethe Facility during the six months ended January 31, 2013.
NOTE IDistributions to ShareholdersThe tax character of distributions to be paid for the year ending July 31, 2013will be determined at the end of the current fiscal year. The tax character of dis-tributions paid during the fiscal years ended July 31, 2012 and July 31, 2011were as follows:
2012 2011
Distributions paid from:Ordinary income .......................................... $ 5,414,795 $ 1,278,061
Total distributions paid ..................................... $ 5,414,795 $ 1,278,061
As of July 31, 2012, the components of accumulated earnings/(deficit) on a taxbasis were as follows:
Accumulated capital and other losses ............................... $ (370,294,198)(a)
Unrealized appreciation/(depreciation) ............................... (96,523,895)(b)
Total accumulated earnings/(deficit) .................................. $ (466,818,093)
(a) On July 31, 2012, the Fund had a net capital loss carryforward of $361,026,145. AtJuly 31, 2012, the Fund had a qualified late-year ordinary loss deferral of $9,268,053,which is deemed to arise on August 1, 2012.
(b) The differences between book-basis and tax-basis unrealized appreciation/(depreciation)are attributable primarily to the tax deferral of losses on wash sales, the realization for taxpurposes of gains/losses on certain derivative instruments, and the tax treatment of part-nerships and passive foreign investment companies (PFICs).
For tax purposes, net capital losses may be carried over to offset future capitalgains, if any. Under the Regulated Investment Company Modernization Act of2010, funds are permitted to carry forward capital losses incurred in taxable yearsbeginning after December 22, 2010 for an indefinite period. These post-enactment capital losses must be utilized prior to the pre-enactment capital loss-es, which are subject to expiration. Post-enactment capital loss carryforwards willretain their character as either short-term or long-term capital losses rather thanbeing considered short-term as under previous regulation.
36 • ALLIANCEBERNSTEIN GLOBAL THEMATIC GROWTH FUND
Not
esto
Fina
ncia
lSta
tem
ents
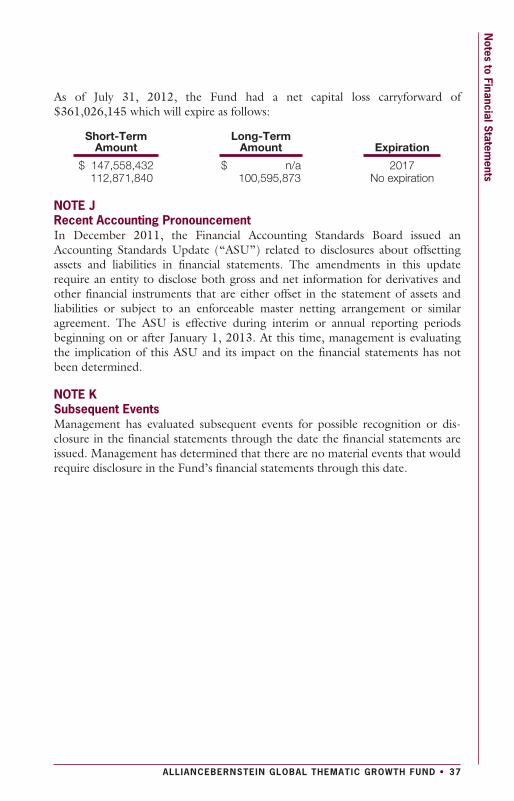
As of July 31, 2012, the Fund had a net capital loss carryforward of$361,026,145 which will expire as follows:
Short-TermAmount
Long-TermAmount Expiration
$ 147,558,432 $ n/a 2017112,871,840 100,595,873 No expiration
NOTE JRecent Accounting PronouncementIn December 2011, the Financial Accounting Standards Board issued anAccounting Standards Update (“ASU”) related to disclosures about offsettingassets and liabilities in financial statements. The amendments in this updaterequire an entity to disclose both gross and net information for derivatives andother financial instruments that are either offset in the statement of assets andliabilities or subject to an enforceable master netting arrangement or similaragreement. The ASU is effective during interim or annual reporting periodsbeginning on or after January 1, 2013. At this time, management is evaluatingthe implication of this ASU and its impact on the financial statements has notbeen determined.
NOTE KSubsequent EventsManagement has evaluated subsequent events for possible recognition or dis-closure in the financial statements through the date the financial statements areissued. Management has determined that there are no material events that wouldrequire disclosure in the Fund’s financial statements through this date.
ALLIANCEBERNSTEIN GLOBAL THEMATIC GROWTH FUND • 37
Notes
toFinancialStatem
ents
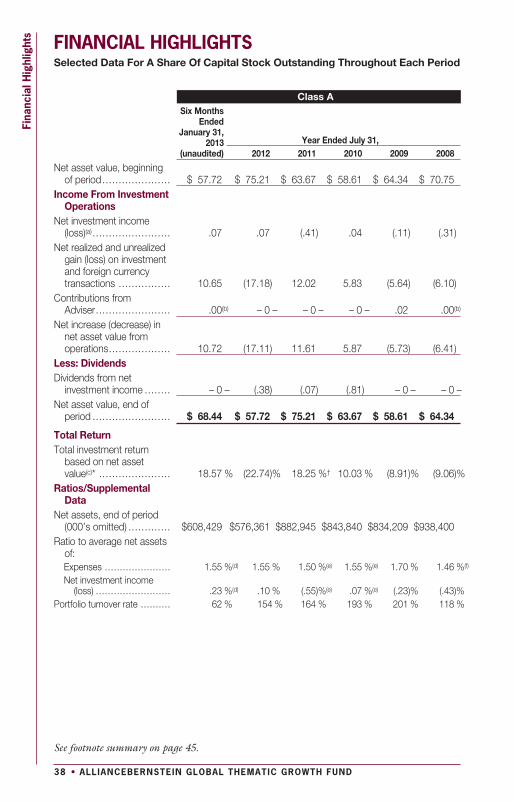
FINANCIAL HIGHLIGHTSSelected Data For A Share Of Capital Stock Outstanding Throughout Each Period
Class ASix Months
EndedJanuary 31,
2013(unaudited)
Year Ended July 31,2012 2011 2010 2009 2008
Net asset value, beginningof period..................... $ 57.72 $ 75.21 $ 63.67 $ 58.61 $ 64.34 $ 70.75
Income From InvestmentOperations
Net investment income(loss)(a) ........................ .07 .07 (.41) .04 (.11) (.31)
Net realized and unrealizedgain (loss) on investmentand foreign currencytransactions ................ 10.65 (17.18) 12.02 5.83 (5.64) (6.10)
Contributions fromAdviser....................... .00(b) – 0 – – 0 – – 0 – .02 .00(b)
Net increase (decrease) innet asset value fromoperations................... 10.72 (17.11) 11.61 5.87 (5.73) (6.41)
Less: DividendsDividends from net
investment income ........ – 0 – (.38) (.07) (.81) – 0 – – 0 –Net asset value, end of
period ........................ $ 68.44 $ 57.72 $ 75.21 $ 63.67 $ 58.61 $ 64.34
Total ReturnTotal investment return
based on net assetvalue(c)* ...................... 18.57 % (22.74)% 18.25 %† 10.03 % (8.91)% (9.06)%
Ratios/SupplementalData
Net assets, end of period(000’s omitted) ............. $608,429 $576,361 $882,945 $843,840 $834,209 $938,400
Ratio to average net assetsof:Expenses ...................... 1.55 %(d) 1.55 % 1.50 %(e) 1.55 %(e) 1.70 % 1.46 %(f)
Net investment income(loss) ......................... .23 %(d) .10 % (.55)%(e) .07 %(e) (.23)% (.43)%
Portfolio turnover rate .......... 62 % 154 % 164 % 193 % 201 % 118 %
See footnote summary on page 45.
38 • ALLIANCEBERNSTEIN GLOBAL THEMATIC GROWTH FUND
Fina
ncia
lHig
hlig
hts
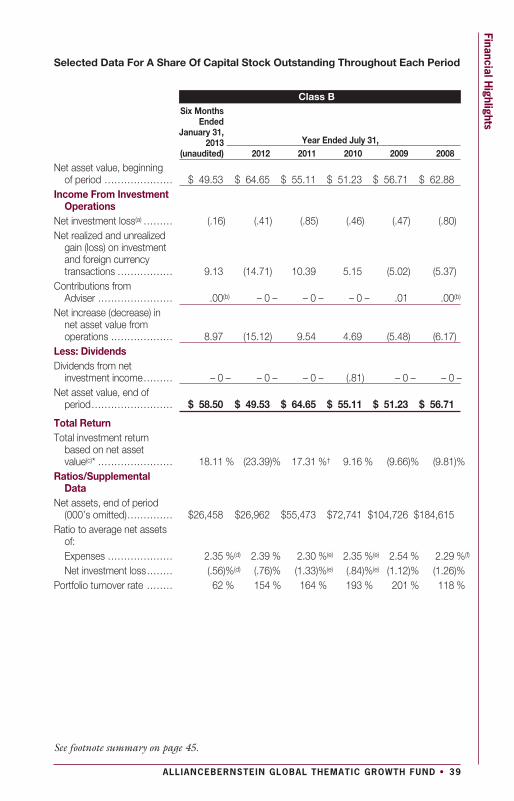
Selected Data For A Share Of Capital Stock Outstanding Throughout Each Period
Class BSix Months
EndedJanuary 31,
2013(unaudited)
Year Ended July 31,2012 2011 2010 2009 2008
Net asset value, beginningof period ..................... $ 49.53 $ 64.65 $ 55.11 $ 51.23 $ 56.71 $ 62.88
Income From InvestmentOperations
Net investment loss(a) ......... (.16) (.41) (.85) (.46) (.47) (.80)Net realized and unrealized
gain (loss) on investmentand foreign currencytransactions ................. 9.13 (14.71) 10.39 5.15 (5.02) (5.37)
Contributions fromAdviser ....................... .00(b) – 0 – – 0 – – 0 – .01 .00(b)
Net increase (decrease) innet asset value fromoperations ................... 8.97 (15.12) 9.54 4.69 (5.48) (6.17)
Less: DividendsDividends from net
investment income......... – 0 – – 0 – – 0 – (.81) – 0 – – 0 –Net asset value, end of
period......................... $ 58.50 $ 49.53 $ 64.65 $ 55.11 $ 51.23 $ 56.71
Total ReturnTotal investment return
based on net assetvalue(c)* ....................... 18.11 % (23.39)% 17.31 %† 9.16 % (9.66)% (9.81)%
Ratios/SupplementalData
Net assets, end of period(000’s omitted).............. $26,458 $26,962 $55,473 $72,741 $104,726 $184,615
Ratio to average net assetsof:Expenses .................... 2.35 %(d) 2.39 % 2.30 %(e) 2.35 %(e) 2.54 % 2.29 %(f)
Net investment loss........ (.56)%(d) (.76)% (1.33)%(e) (.84)%(e) (1.12)% (1.26)%Portfolio turnover rate ........ 62 % 154 % 164 % 193 % 201 % 118 %
See footnote summary on page 45.
ALLIANCEBERNSTEIN GLOBAL THEMATIC GROWTH FUND • 39
FinancialHighlights
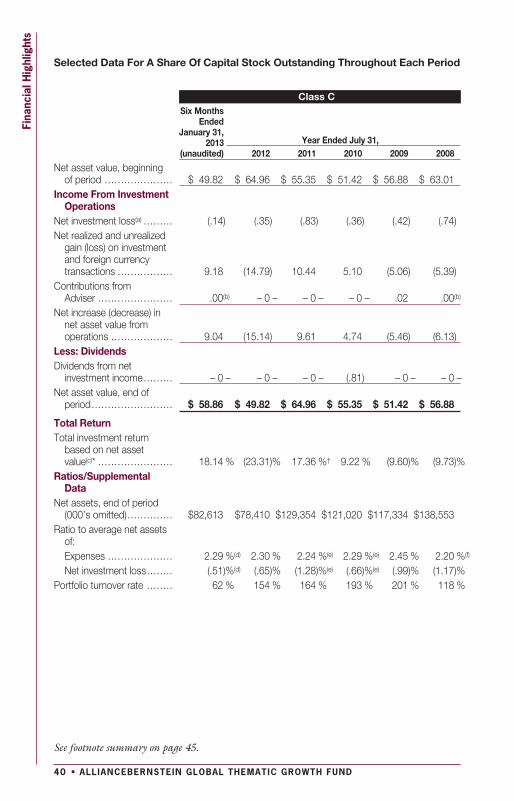
Selected Data For A Share Of Capital Stock Outstanding Throughout Each Period
Class CSix Months
EndedJanuary 31,
2013(unaudited)
Year Ended July 31,2012 2011 2010 2009 2008
Net asset value, beginningof period ..................... $ 49.82 $ 64.96 $ 55.35 $ 51.42 $ 56.88 $ 63.01
Income From InvestmentOperations
Net investment loss(a) ......... (.14) (.35) (.83) (.36) (.42) (.74)Net realized and unrealized
gain (loss) on investmentand foreign currencytransactions ................. 9.18 (14.79) 10.44 5.10 (5.06) (5.39)
Contributions fromAdviser ....................... .00(b) – 0 – – 0 – – 0 – .02 .00(b)
Net increase (decrease) innet asset value fromoperations ................... 9.04 (15.14) 9.61 4.74 (5.46) (6.13)
Less: DividendsDividends from net
investment income......... – 0 – – 0 – – 0 – (.81) – 0 – – 0 –Net asset value, end of
period......................... $ 58.86 $ 49.82 $ 64.96 $ 55.35 $ 51.42 $ 56.88
Total ReturnTotal investment return
based on net assetvalue(c)* ....................... 18.14 % (23.31)% 17.36 %† 9.22 % (9.60)% (9.73)%
Ratios/SupplementalData
Net assets, end of period(000’s omitted).............. $82,613 $78,410 $129,354 $121,020 $117,334 $138,553
Ratio to average net assetsof:Expenses .................... 2.29 %(d) 2.30 % 2.24 %(e) 2.29 %(e) 2.45 % 2.20 %(f)
Net investment loss........ (.51)%(d) (.65)% (1.28)%(e) (.66)%(e) (.99)% (1.17)%Portfolio turnover rate ........ 62 % 154 % 164 % 193 % 201 % 118 %
See footnote summary on page 45.
40 • ALLIANCEBERNSTEIN GLOBAL THEMATIC GROWTH FUND
Fina
ncia
lHig
hlig
hts

Selected Data For A Share Of Capital Stock Outstanding Throughout Each Period
Advisor ClassSix Months
EndedJanuary 31,
2013(unaudited)
Year Ended July 31,2012 2011 2010 2009 2008
Net asset value, beginningof period ..................... $ 60.23 $ 78.60 $ 66.53 $ 61.03 $ 66.80 $ 73.24
Income From InvestmentOperations
Net investment income(loss)(a) ........................ .18 .27 (.19) .35 .05 (.10)
Net realized and unrealizedgain (loss) on investmentand foreign currencytransactions ................. 11.12 (17.98) 12.54 5.96 (5.84) (6.34)
Contributions fromAdviser ....................... .00(b) – 0 – – 0 – – 0 – .02 .00(b)
Net increase (decrease) innet asset value fromoperations ................... 11.30 (17.71) 12.35 6.31 (5.77) (6.44)
Less: DividendsDividends from net
investment income......... – 0 – (.66) (.28) (.81) – 0 – – 0 –Net asset value, end of
period......................... $ 71.53 $ 60.23 $ 78.60 $ 66.53 $ 61.03 $ 66.80
Total ReturnTotal investment return
based on net assetvalue(c)* ....................... 18.76 % (22.50)% 18.58 %† 10.35 % (8.64)% (8.79)%
Ratios/SupplementalData
Net assets, end of period(000’s omitted).............. $72,038 $74,474 $106,042 $63,376 $40,770 $31,546
Ratio to average net assetsof:Expenses .................... 1.25 %(d) 1.25 % 1.19 %(e) 1.25 %(e) 1.40 % 1.17 %(f)
Net investment income(loss) ....................... .55 %(d) .41 % (.25)%(e) .54 %(e) .11 % (.14)%
Portfolio turnover rate ........ 62 % 154 % 164 % 193 % 201 % 118 %
See footnote summary on page 45.
ALLIANCEBERNSTEIN GLOBAL THEMATIC GROWTH FUND • 41
FinancialHighlights
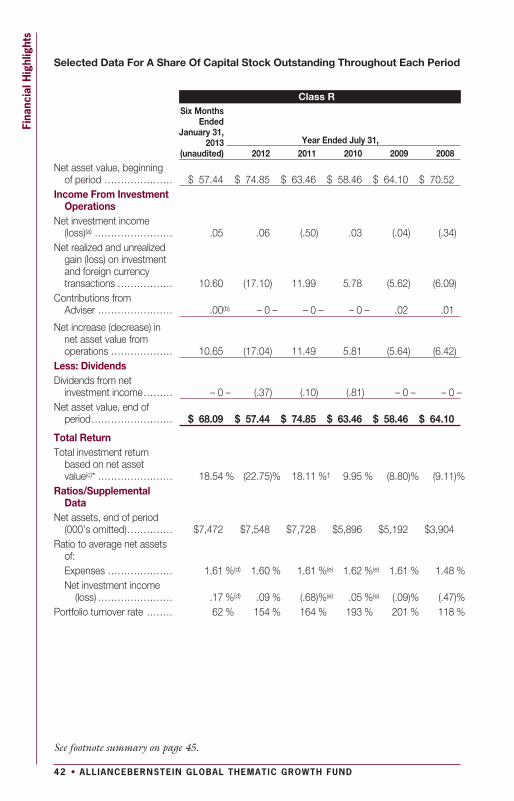
Selected Data For A Share Of Capital Stock Outstanding Throughout Each Period
Class RSix Months
EndedJanuary 31,
2013(unaudited)
Year Ended July 31,2012 2011 2010 2009 2008
Net asset value, beginningof period ..................... $ 57.44 $ 74.85 $ 63.46 $ 58.46 $ 64.10 $ 70.52
Income From InvestmentOperations
Net investment income(loss)(a) ........................ .05 .06 (.50) .03 (.04) (.34)
Net realized and unrealizedgain (loss) on investmentand foreign currencytransactions ................. 10.60 (17.10) 11.99 5.78 (5.62) (6.09)
Contributions fromAdviser ....................... .00(b) – 0 – – 0 – – 0 – .02 .01
Net increase (decrease) innet asset value fromoperations ................... 10.65 (17.04) 11.49 5.81 (5.64) (6.42)
Less: DividendsDividends from net
investment income......... – 0 – (.37) (.10) (.81) – 0 – – 0 –Net asset value, end of
period......................... $ 68.09 $ 57.44 $ 74.85 $ 63.46 $ 58.46 $ 64.10
Total ReturnTotal investment return
based on net assetvalue(c)* ....................... 18.54 % (22.75)% 18.11 %† 9.95 % (8.80)% (9.11)%
Ratios/SupplementalData
Net assets, end of period(000’s omitted).............. $7,472 $7,548 $7,728 $5,896 $5,192 $3,904
Ratio to average net assetsof:Expenses .................... 1.61 %(d) 1.60 % 1.61 %(e) 1.62 %(e) 1.61 % 1.48 %Net investment income
(loss) ....................... .17 %(d) .09 % (.68)%(e) .05 %(e) (.09)% (.47)%Portfolio turnover rate ........ 62 % 154 % 164 % 193 % 201 % 118 %
See footnote summary on page 45.
42 • ALLIANCEBERNSTEIN GLOBAL THEMATIC GROWTH FUND
Fina
ncia
lHig
hlig
hts
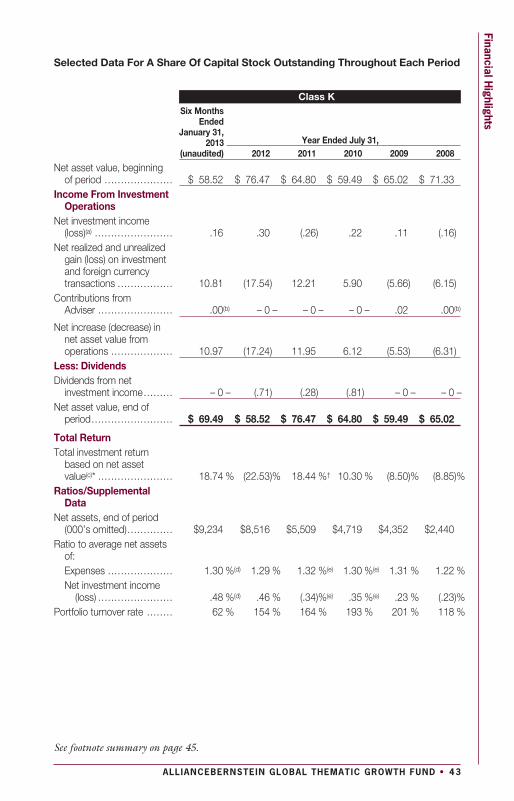
Selected Data For A Share Of Capital Stock Outstanding Throughout Each Period
Class KSix Months
EndedJanuary 31,
2013(unaudited)
Year Ended July 31,2012 2011 2010 2009 2008
Net asset value, beginningof period ..................... $ 58.52 $ 76.47 $ 64.80 $ 59.49 $ 65.02 $ 71.33
Income From InvestmentOperations
Net investment income(loss)(a) ........................ .16 .30 (.26) .22 .11 (.16)
Net realized and unrealizedgain (loss) on investmentand foreign currencytransactions ................. 10.81 (17.54) 12.21 5.90 (5.66) (6.15)
Contributions fromAdviser ....................... .00(b) – 0 – – 0 – – 0 – .02 .00(b)
Net increase (decrease) innet asset value fromoperations ................... 10.97 (17.24) 11.95 6.12 (5.53) (6.31)
Less: DividendsDividends from net
investment income......... – 0 – (.71) (.28) (.81) – 0 – – 0 –Net asset value, end of
period......................... $ 69.49 $ 58.52 $ 76.47 $ 64.80 $ 59.49 $ 65.02
Total ReturnTotal investment return
based on net assetvalue(c)* ....................... 18.74 % (22.53)% 18.44 %† 10.30 % (8.50)% (8.85)%
Ratios/SupplementalData
Net assets, end of period(000’s omitted).............. $9,234 $8,516 $5,509 $4,719 $4,352 $2,440
Ratio to average net assetsof:Expenses .................... 1.30 %(d) 1.29 % 1.32 %(e) 1.30 %(e) 1.31 % 1.22 %Net investment income
(loss) ....................... .48 %(d) .46 % (.34)%(e) .35 %(e) .23 % (.23)%Portfolio turnover rate ........ 62 % 154 % 164 % 193 % 201 % 118 %
See footnote summary on page 45.
ALLIANCEBERNSTEIN GLOBAL THEMATIC GROWTH FUND • 43
FinancialHighlights
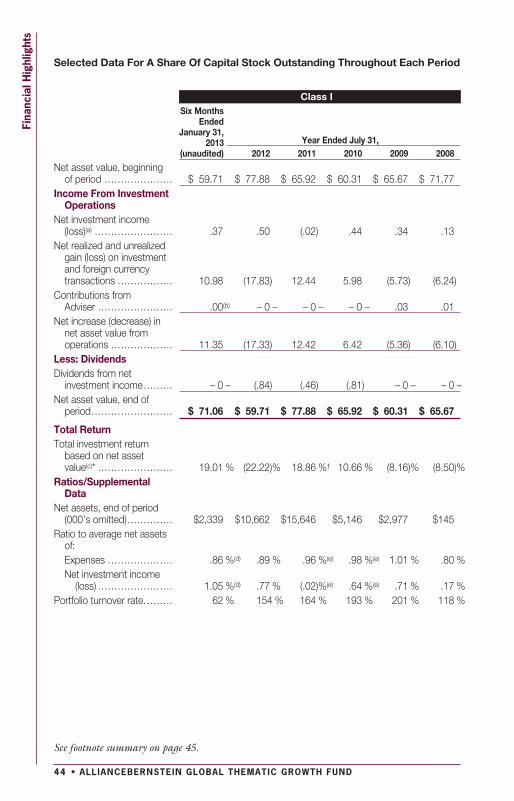
Selected Data For A Share Of Capital Stock Outstanding Throughout Each Period
Class ISix Months
EndedJanuary 31,
2013(unaudited)
Year Ended July 31,2012 2011 2010 2009 2008
Net asset value, beginningof period ..................... $ 59.71 $ 77.88 $ 65.92 $ 60.31 $ 65.67 $ 71.77
Income From InvestmentOperations
Net investment income(loss)(a) ........................ .37 .50 (.02) .44 .34 .13
Net realized and unrealizedgain (loss) on investmentand foreign currencytransactions ................. 10.98 (17.83) 12.44 5.98 (5.73) (6.24)
Contributions fromAdviser ....................... .00(b) – 0 – – 0 – – 0 – .03 .01
Net increase (decrease) innet asset value fromoperations ................... 11.35 (17.33) 12.42 6.42 (5.36) (6.10)
Less: DividendsDividends from net
investment income......... – 0 – (.84) (.46) (.81) – 0 – – 0 –Net asset value, end of
period......................... $ 71.06 $ 59.71 $ 77.88 $ 65.92 $ 60.31 $ 65.67
Total ReturnTotal investment return
based on net assetvalue(c)* ....................... 19.01 % (22.22)% 18.86 %† 10.66 % (8.16)% (8.50)%
Ratios/SupplementalData
Net assets, end of period(000’s omitted).............. $2,339 $10,662 $15,646 $5,146 $2,977 $145
Ratio to average net assetsof:Expenses .................... .86 %(d) .89 % .96 %(e) .98 %(e) 1.01 % .80 %Net investment income
(loss) ....................... 1.05 %(d) .77 % (.02)%(e) .64 %(e) .71 % .17 %Portfolio turnover rate. ........ 62 % 154 % 164 % 193 % 201 % 118 %
See footnote summary on page 45.
44 • ALLIANCEBERNSTEIN GLOBAL THEMATIC GROWTH FUND
Fina
ncia
lHig
hlig
hts
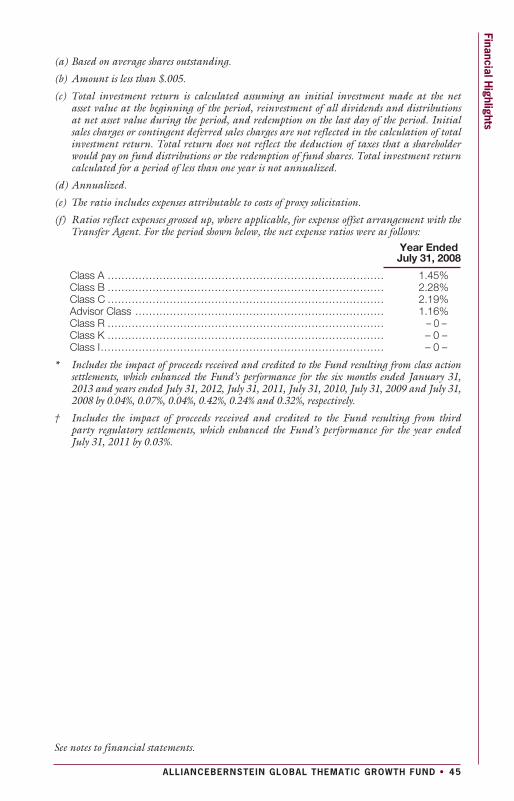
(a) Based on average shares outstanding.
(b) Amount is less than $.005.
(c) Total investment return is calculated assuming an initial investment made at the netasset value at the beginning of the period, reinvestment of all dividends and distributionsat net asset value during the period, and redemption on the last day of the period. Initialsales charges or contingent deferred sales charges are not reflected in the calculation of totalinvestment return. Total return does not reflect the deduction of taxes that a shareholderwould pay on fund distributions or the redemption of fund shares. Total investment returncalculated for a period of less than one year is not annualized.
(d) Annualized.
(e) The ratio includes expenses attributable to costs of proxy solicitation.
(f) Ratios reflect expenses grossed up, where applicable, for expense offset arrangement with theTransfer Agent. For the period shown below, the net expense ratios were as follows:
Year EndedJuly 31, 2008
Class A ................................................................................ 1.45%Class B ................................................................................ 2.28%Class C ................................................................................ 2.19%Advisor Class ........................................................................ 1.16%Class R ................................................................................ – 0 –Class K ................................................................................ – 0 –Class I.................................................................................. – 0 –
* Includes the impact of proceeds received and credited to the Fund resulting from class actionsettlements, which enhanced the Fund’s performance for the six months ended January 31,2013 and years ended July 31, 2012, July 31, 2011, July 31, 2010, July 31, 2009 and July 31,2008 by 0.04%, 0.07%, 0.04%, 0.42%, 0.24% and 0.32%, respectively.
† Includes the impact of proceeds received and credited to the Fund resulting from thirdparty regulatory settlements, which enhanced the Fund’s performance for the year endedJuly 31, 2011 by 0.03%.
See notes to financial statements.
ALLIANCEBERNSTEIN GLOBAL THEMATIC GROWTH FUND • 45
FinancialHighlights
BOARD OF DIRECTORS
William H. Foulk, Jr.(1), Chairman
John H. Dobkin(1)
Michael J. Downey(1)
D. James Guzy(1)
Nancy P. Jacklin(1)
Robert M. Keith, President and
Chief Executive Officer
Garry L. Moody(1)
Marshall C. Turner, Jr.(1)
Earl D. Weiner(1)
OFFICERSPhilip L. Kirstein,Senior Vice President and IndependentCompliance OfficerJoseph G. Carson(2), Vice PresidentAmy P. Raskin(2), Vice PresidentCatherine D. Wood(2), Vice President
Vadim Zlotnikov(2), Vice PresidentEmilie D. Wrapp, SecretaryJoseph J. Mantineo, Treasurer andChief Financial OfficerPhyllis J. Clarke, Controller
Custodian and Accounting AgentState Street Bank and Trust CompanyOne Lincoln StreetBoston, MA 02111
Principal UnderwriterAllianceBernstein Investments, Inc.1345 Avenue of the AmericasNew York, NY 10105
Legal CounselSeward & Kissel LLPOne Battery Park PlazaNew York, NY 10004
Transfer AgentAllianceBernstein InvestorServices, Inc.P.O. Box 786003San Antonio, TX 78278-6003Toll-Free (800) 221-5672
Independent Registered PublicAccounting FirmErnst & Young LLP5 Times SquareNew York, NY 10036
(1) Member of the Audit Committee, the Governance and Nominating Committee and theIndependent Directors Committee. Mr. Foulk is the sole member of the Fair Value PricingCommittee.
(2) The day-to-day management of, and investment decisions for, the Fund are made by theAdviser’s Global Thematic Growth Investment Team. Mses. Catherine D. Wood and AmyP. Raskin and Messrs. Joseph G. Carson and Vadim Zlotnikov, are the investment pro-fessionals with the most significant responsibility for the day-to-day management of theFund.
46 • ALLIANCEBERNSTEIN GLOBAL THEMATIC GROWTH FUND
Boa
rdof
Dir
ecto
rs
THE FOLLOWING IS NOT PART OF THE SHAREHOLDER REPORT OR THEFINANCIAL STATEMENTS
SUMMARY OF SENIOR OFFICER’S EVALUATION OF INVESTMENTADVISORY AGREEMENT1
The following is a summary of the evaluation of the Investment Advisory Agree-ment between AllianceBernstein L.P. (the “Adviser”) and the AllianceBernsteinGlobal Thematic Growth Fund, Inc. (the “Fund”).2,3 The evaluation of theInvestment Advisory Agreement was prepared by Philip L. Kirstein, the SeniorOfficer of the Fund, for the Directors of the Fund, as required by a September2004 agreement between the Adviser and the New York State Attorney General(the “NYAG”). The Senior Officer’s evaluation of the Investment AdvisoryAgreement is not meant to diminish the responsibility or authority of the Boardof Directors of the Fund to perform its duties pursuant to Section 15 of theInvestment Company Act of 1940 (the “40 Act”) and applicable state law. Thepurpose of the summary is to provide shareholders with a synopsis of theindependent evaluation of the reasonableness of the advisory fees proposed to bepaid by the Fund which was provided to the Directors in connection with theirreview of the proposed approval of the continuance of the Investment AdvisoryAgreement. The Senior Officer’s evaluation considered the following factors:
1. Advisory fees charged to institutional and other clients of the Adviserfor like services;
2. Advisory fees charged by other mutual fund companies for like services;3. Costs to the Adviser and its affiliates of supplying services pursuant to
the advisory agreement, excluding any intra-corporate profit;4. Profit margins of the Adviser and its affiliates from supplying such
services;5. Possible economies of scale as the Fund grows larger; and6. Nature and quality of the Adviser’s services including the performance
of the Fund.
These factors, with the exception of the first factor, are generally referred to as the“Gartenberg factors,” which were articulated by the United States Court ofAppeals for the Second Circuit in 1982. Gartenberg v. Merrill Lynch AssetManagement, Inc., 694 F. 2d 923 (2d Cir. 1982). The first factor is an additional
1 The information in the fee summary was completed on April 19, 2012 and discussed withthe Board of Directors on May 1-3, 2012.
2 Future references to the Fund do not include “AllianceBernstein.” References in the feesummary pertaining to performance and expense ratio rankings refer to the Class A sharesof the Fund.
3 On November 3, 2008, Global Technology Fund, Inc. merged with Global Health CareFund, Inc. and was renamed Global Thematic Growth Fund, Inc. Also at this time, theFund’s non-fundamental investment policy was changed to allow the Fund to pursue abroader mandate across multiple industry sectors worldwide. In connection with thechange in investment strategy, the Fund’s portfolio management team was changed.
ALLIANCEBERNSTEIN GLOBAL THEMATIC GROWTH FUND • 47
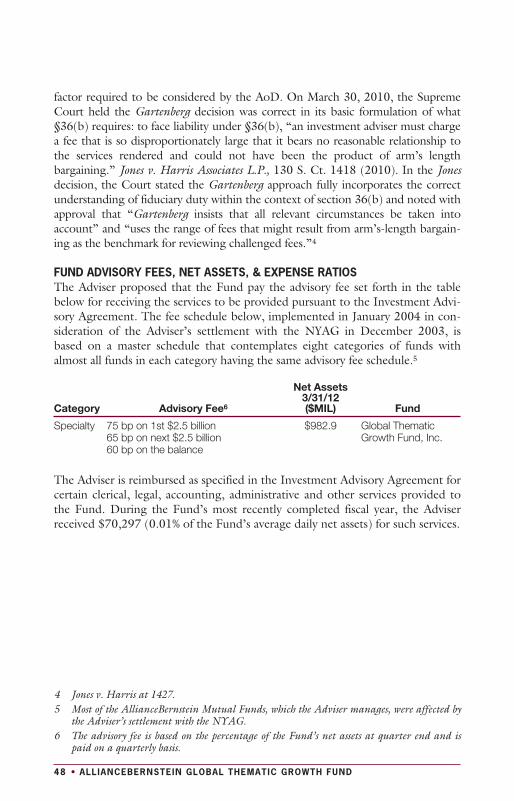
factor required to be considered by the AoD. On March 30, 2010, the SupremeCourt held the Gartenberg decision was correct in its basic formulation of what§36(b) requires: to face liability under §36(b), “an investment adviser must chargea fee that is so disproportionately large that it bears no reasonable relationship tothe services rendered and could not have been the product of arm’s lengthbargaining.” Jones v. Harris Associates L.P., 130 S. Ct. 1418 (2010). In the Jonesdecision, the Court stated the Gartenberg approach fully incorporates the correctunderstanding of fiduciary duty within the context of section 36(b) and noted withapproval that “Gartenberg insists that all relevant circumstances be taken intoaccount” and “uses the range of fees that might result from arm’s-length bargain-ing as the benchmark for reviewing challenged fees.”4
FUND ADVISORY FEES, NET ASSETS, & EXPENSE RATIOSThe Adviser proposed that the Fund pay the advisory fee set forth in the tablebelow for receiving the services to be provided pursuant to the Investment Advi-sory Agreement. The fee schedule below, implemented in January 2004 in con-sideration of the Adviser’s settlement with the NYAG in December 2003, isbased on a master schedule that contemplates eight categories of funds withalmost all funds in each category having the same advisory fee schedule.5
Category Advisory Fee6
Net Assets3/31/12($MIL) Fund
Specialty 75 bp on 1st $2.5 billion65 bp on next $2.5 billion60 bp on the balance
$982.9 Global ThematicGrowth Fund, Inc.
The Adviser is reimbursed as specified in the Investment Advisory Agreement forcertain clerical, legal, accounting, administrative and other services provided tothe Fund. During the Fund’s most recently completed fiscal year, the Adviserreceived $70,297 (0.01% of the Fund’s average daily net assets) for such services.
4 Jones v. Harris at 1427.5 Most of the AllianceBernstein Mutual Funds, which the Adviser manages, were affected by
the Adviser’s settlement with the NYAG.6 The advisory fee is based on the percentage of the Fund’s net assets at quarter end and is
paid on a quarterly basis.
48 • ALLIANCEBERNSTEIN GLOBAL THEMATIC GROWTH FUND
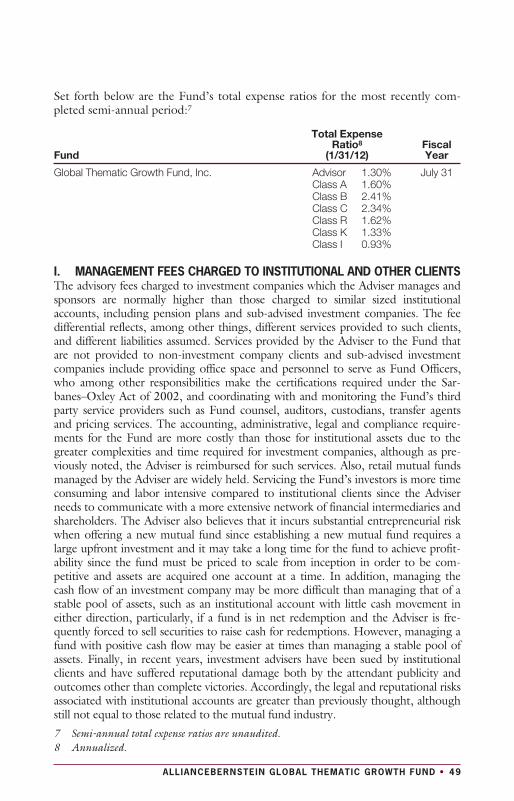
Set forth below are the Fund’s total expense ratios for the most recently com-pleted semi-annual period:7
Fund
Total ExpenseRatio8
(1/31/12)FiscalYear
Global Thematic Growth Fund, Inc. AdvisorClass AClass BClass CClass RClass KClass I
1.30%1.60%2.41%2.34%1.62%1.33%0.93%
July 31
I. MANAGEMENT FEES CHARGED TO INSTITUTIONAL AND OTHER CLIENTSThe advisory fees charged to investment companies which the Adviser manages andsponsors are normally higher than those charged to similar sized institutionalaccounts, including pension plans and sub-advised investment companies. The feedifferential reflects, among other things, different services provided to such clients,and different liabilities assumed. Services provided by the Adviser to the Fund thatare not provided to non-investment company clients and sub-advised investmentcompanies include providing office space and personnel to serve as Fund Officers,who among other responsibilities make the certifications required under the Sar-banes–Oxley Act of 2002, and coordinating with and monitoring the Fund’s thirdparty service providers such as Fund counsel, auditors, custodians, transfer agentsand pricing services. The accounting, administrative, legal and compliance require-ments for the Fund are more costly than those for institutional assets due to thegreater complexities and time required for investment companies, although as pre-viously noted, the Adviser is reimbursed for such services. Also, retail mutual fundsmanaged by the Adviser are widely held. Servicing the Fund’s investors is more timeconsuming and labor intensive compared to institutional clients since the Adviserneeds to communicate with a more extensive network of financial intermediaries andshareholders. The Adviser also believes that it incurs substantial entrepreneurial riskwhen offering a new mutual fund since establishing a new mutual fund requires alarge upfront investment and it may take a long time for the fund to achieve profit-ability since the fund must be priced to scale from inception in order to be com-petitive and assets are acquired one account at a time. In addition, managing thecash flow of an investment company may be more difficult than managing that of astable pool of assets, such as an institutional account with little cash movement ineither direction, particularly, if a fund is in net redemption and the Adviser is fre-quently forced to sell securities to raise cash for redemptions. However, managing afund with positive cash flow may be easier at times than managing a stable pool ofassets. Finally, in recent years, investment advisers have been sued by institutionalclients and have suffered reputational damage both by the attendant publicity andoutcomes other than complete victories. Accordingly, the legal and reputational risksassociated with institutional accounts are greater than previously thought, althoughstill not equal to those related to the mutual fund industry.
7 Semi-annual total expense ratios are unaudited.8 Annualized.
ALLIANCEBERNSTEIN GLOBAL THEMATIC GROWTH FUND • 49
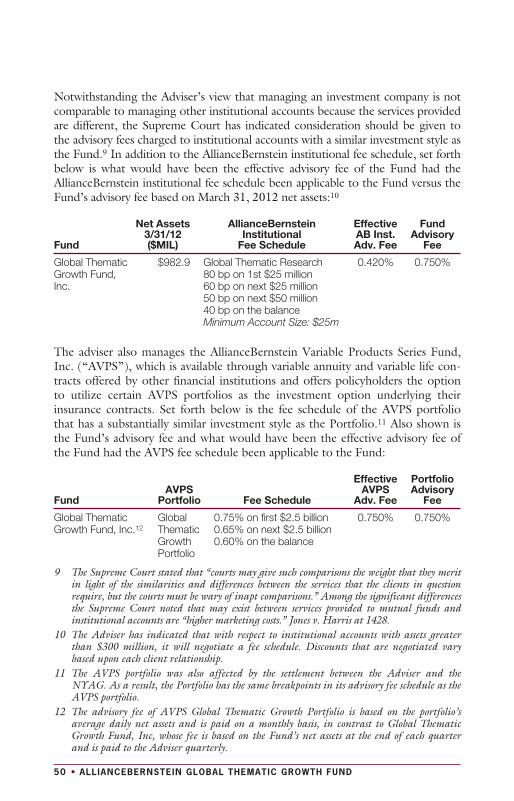
Notwithstanding the Adviser’s view that managing an investment company is notcomparable to managing other institutional accounts because the services providedare different, the Supreme Court has indicated consideration should be given tothe advisory fees charged to institutional accounts with a similar investment style asthe Fund.9 In addition to the AllianceBernstein institutional fee schedule, set forthbelow is what would have been the effective advisory fee of the Fund had theAllianceBernstein institutional fee schedule been applicable to the Fund versus theFund’s advisory fee based on March 31, 2012 net assets:10
Fund
Net Assets3/31/12($MIL)
AllianceBernsteinInstitutional
Fee Schedule
EffectiveAB Inst.Adv. Fee
FundAdvisory
Fee
Global ThematicGrowth Fund,Inc.
$982.9 Global Thematic Research80 bp on 1st $25 million60 bp on next $25 million50 bp on next $50 million40 bp on the balanceMinimum Account Size: $25m
0.420% 0.750%
The adviser also manages the AllianceBernstein Variable Products Series Fund,Inc. (“AVPS”), which is available through variable annuity and variable life con-tracts offered by other financial institutions and offers policyholders the optionto utilize certain AVPS portfolios as the investment option underlying theirinsurance contracts. Set forth below is the fee schedule of the AVPS portfoliothat has a substantially similar investment style as the Portfolio.11 Also shown isthe Fund’s advisory fee and what would have been the effective advisory fee ofthe Fund had the AVPS fee schedule been applicable to the Fund:
FundAVPS
Portfolio Fee Schedule
EffectiveAVPS
Adv. Fee
PortfolioAdvisory
Fee
Global ThematicGrowth Fund, Inc.12
GlobalThematicGrowthPortfolio
0.75% on first $2.5 billion0.65% on next $2.5 billion0.60% on the balance
0.750% 0.750%
9 The Supreme Court stated that “courts may give such comparisons the weight that they meritin light of the similarities and differences between the services that the clients in questionrequire, but the courts must be wary of inapt comparisons.” Among the significant differencesthe Supreme Court noted that may exist between services provided to mutual funds andinstitutional accounts are “higher marketing costs.” Jones v. Harris at 1428.
10 The Adviser has indicated that with respect to institutional accounts with assets greaterthan $300 million, it will negotiate a fee schedule. Discounts that are negotiated varybased upon each client relationship.
11 The AVPS portfolio was also affected by the settlement between the Adviser and theNYAG. As a result, the Portfolio has the same breakpoints in its advisory fee schedule as theAVPS portfolio.
12 The advisory fee of AVPS Global Thematic Growth Portfolio is based on the portfolio’saverage daily net assets and is paid on a monthly basis, in contrast to Global ThematicGrowth Fund, Inc, whose fee is based on the Fund’s net assets at the end of each quarterand is paid to the Adviser quarterly.
50 • ALLIANCEBERNSTEIN GLOBAL THEMATIC GROWTH FUND
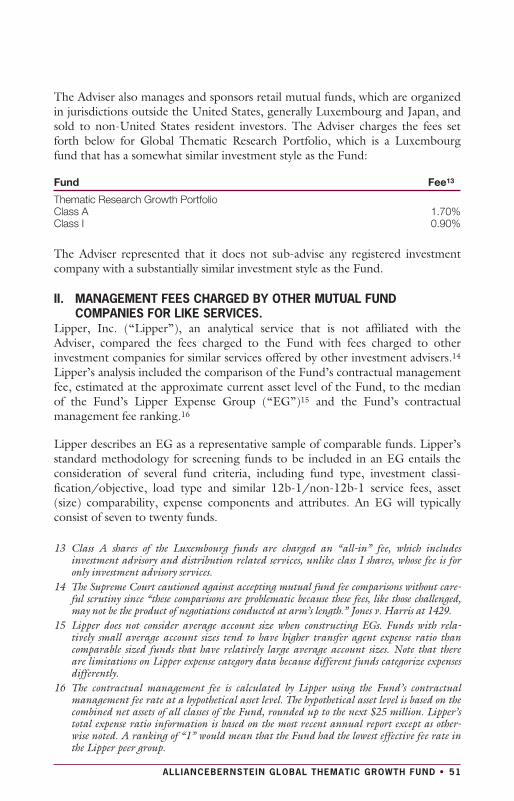
The Adviser also manages and sponsors retail mutual funds, which are organizedin jurisdictions outside the United States, generally Luxembourg and Japan, andsold to non-United States resident investors. The Adviser charges the fees setforth below for Global Thematic Research Portfolio, which is a Luxembourgfund that has a somewhat similar investment style as the Fund:
Fund Fee13
Thematic Research Growth PortfolioClass AClass I
1.70%0.90%
The Adviser represented that it does not sub-advise any registered investmentcompany with a substantially similar investment style as the Fund.
II. MANAGEMENT FEES CHARGED BY OTHER MUTUAL FUNDCOMPANIES FOR LIKE SERVICES.
Lipper, Inc. (“Lipper”), an analytical service that is not affiliated with theAdviser, compared the fees charged to the Fund with fees charged to otherinvestment companies for similar services offered by other investment advisers.14
Lipper’s analysis included the comparison of the Fund’s contractual managementfee, estimated at the approximate current asset level of the Fund, to the medianof the Fund’s Lipper Expense Group (“EG”)15 and the Fund’s contractualmanagement fee ranking.16
Lipper describes an EG as a representative sample of comparable funds. Lipper’sstandard methodology for screening funds to be included in an EG entails theconsideration of several fund criteria, including fund type, investment classi-fication/objective, load type and similar 12b-1/non-12b-1 service fees, asset(size) comparability, expense components and attributes. An EG will typicallyconsist of seven to twenty funds.
13 Class A shares of the Luxembourg funds are charged an “all-in” fee, which includesinvestment advisory and distribution related services, unlike class I shares, whose fee is foronly investment advisory services.
14 The Supreme Court cautioned against accepting mutual fund fee comparisons without care-ful scrutiny since “these comparisons are problematic because these fees, like those challenged,may not be the product of negotiations conducted at arm’s length.” Jones v. Harris at 1429.
15 Lipper does not consider average account size when constructing EGs. Funds with rela-tively small average account sizes tend to have higher transfer agent expense ratio thancomparable sized funds that have relatively large average account sizes. Note that thereare limitations on Lipper expense category data because different funds categorize expensesdifferently.
16 The contractual management fee is calculated by Lipper using the Fund’s contractualmanagement fee rate at a hypothetical asset level. The hypothetical asset level is based on thecombined net assets of all classes of the Fund, rounded up to the next $25 million. Lipper’stotal expense ratio information is based on the most recent annual report except as other-wise noted. A ranking of “1” would mean that the Fund had the lowest effective fee rate inthe Lipper peer group.
ALLIANCEBERNSTEIN GLOBAL THEMATIC GROWTH FUND • 51
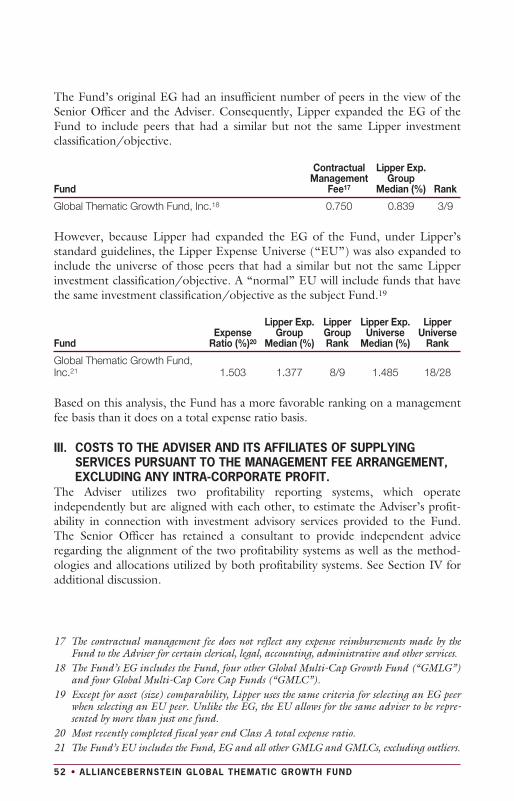
The Fund’s original EG had an insufficient number of peers in the view of theSenior Officer and the Adviser. Consequently, Lipper expanded the EG of theFund to include peers that had a similar but not the same Lipper investmentclassification/objective.
Fund
ContractualManagement
Fee17
Lipper Exp.Group
Median (%) Rank
Global Thematic Growth Fund, Inc.18 0.750 0.839 3/9
However, because Lipper had expanded the EG of the Fund, under Lipper’sstandard guidelines, the Lipper Expense Universe (“EU”) was also expanded toinclude the universe of those peers that had a similar but not the same Lipperinvestment classification/objective. A “normal” EU will include funds that havethe same investment classification/objective as the subject Fund.19
FundExpense
Ratio (%)20
Lipper Exp.Group
Median (%)
LipperGroupRank
Lipper Exp.Universe
Median (%)
LipperUniverse
Rank
Global Thematic Growth Fund,Inc.21 1.503 1.377 8/9 1.485 18/28
Based on this analysis, the Fund has a more favorable ranking on a managementfee basis than it does on a total expense ratio basis.
III. COSTS TO THE ADVISER AND ITS AFFILIATES OF SUPPLYINGSERVICES PURSUANT TO THE MANAGEMENT FEE ARRANGEMENT,EXCLUDING ANY INTRA-CORPORATE PROFIT.
The Adviser utilizes two profitability reporting systems, which operateindependently but are aligned with each other, to estimate the Adviser’s profit-ability in connection with investment advisory services provided to the Fund.The Senior Officer has retained a consultant to provide independent adviceregarding the alignment of the two profitability systems as well as the method-ologies and allocations utilized by both profitability systems. See Section IV foradditional discussion.
17 The contractual management fee does not reflect any expense reimbursements made by theFund to the Adviser for certain clerical, legal, accounting, administrative and other services.
18 The Fund’s EG includes the Fund, four other Global Multi-Cap Growth Fund (“GMLG”)and four Global Multi-Cap Core Cap Funds (“GMLC”).
19 Except for asset (size) comparability, Lipper uses the same criteria for selecting an EG peerwhen selecting an EU peer. Unlike the EG, the EU allows for the same adviser to be repre-sented by more than just one fund.
20 Most recently completed fiscal year end Class A total expense ratio.21 The Fund’s EU includes the Fund, EG and all other GMLG and GMLCs, excluding outliers.
52 • ALLIANCEBERNSTEIN GLOBAL THEMATIC GROWTH FUND
IV. PROFIT MARGINS OF THE ADVISER AND ITS AFFILIATES FORSUPPLYING SUCH SERVICES.
The Fund’s profitability information, prepared by the Adviser for the Board ofDirectors, was reviewed by the Senior Officer and the consultant. The Adviser’sprofitability from providing investment advisory services to the Fund decreasedduring calendar year 2011, relative to 2010.
In addition to the Adviser’s direct profits from managing the Fund, certain of theAdviser’s affiliates have business relationships with the Fund and may earn a profitfrom providing other services to the Fund. The courts have referred to this type ofbusiness opportunity as “fall-out benefits” to the Adviser and indicated that suchbenefits should be factored into the evaluation of the total relationship between theFund and the Adviser. Neither case law nor common business practice precludes theAdviser’s affiliates from earning a reasonable profit on this type of relationship pro-vided the affiliates’ charges and services are competitive and the relationship other-wise complies with the 40 Act restrictions. These affiliates provide transfer agent,distribution and brokerage related services to the Fund and receive transfer agentfees, Rule 12b-1 payments, front-end sales loads, contingent deferred sales charges(“CDSC”) and brokerage commissions. In addition, the Adviser benefits from softdollar arrangements which offset expenses the Adviser would otherwise incur.
AllianceBernstein Investments, Inc. (“ABI”), an affiliate of the Adviser, is theFund’s principal underwriter. ABI and the Adviser have disclosed in the Fund’sprospectus that they may make revenue sharing payments from their own resources,in addition to resources derived from sales loads and Rule 12b-1 fees, to firms thatsell shares of the Fund. In 2011, ABI paid approximately 0.04% of the averagemonthly assets of the AllianceBernstein Mutual Funds or approximately $17.0 mil-lion for distribution services and educational support (revenue sharing payments).
During the Fund’s most recently completed fiscal year, ABI received from theFund $26,047, $4,861,071 and $59,629 in front-end sales charges, Rule 12b-1and CDSC fees, respectively.
Fees and reimbursements for out of pocket expenses charged byAllianceBernstein Investor Services, Inc. (“ABIS”), the affiliated transfer agentfor the Fund, are charged on a per account basis, based on the level of serviceprovided and the class of share held by the account. ABIS also receives a fee pershareholder sub-account for each account maintained by an intermediary on anomnibus basis. During the Fund’s most recently completed fiscal year, ABISreceived $2,246,849 in fees from the Fund.22
22 The fees disclosed are net of any expense offsets with ABIS. An expense offset is created bythe interest earned on the positive cash balance that occurs within the transfer agentaccount as there is a one day lag with regards to money movement from the shareholder’saccount to the transfer agent’s account and then the transfer agent’s account to the Fund’saccount. Due to lower average balances and interest rates during the Fund’s most recentlycompleted fiscal year, monthly fees exceeded interest credits, resulting in zero expense offsetsfor the period.
ALLIANCEBERNSTEIN GLOBAL THEMATIC GROWTH FUND • 53
The Fund effected brokerage transactions through the Adviser’s affiliate, SanfordC. Bernstein & Co., LLC (“SCB & Co.”) and/or its U.K. affiliate, Sanford C.Bernstein Limited (“SCB Ltd.”), collectively “SCB,” and paid commissionsduring the Fund’s most recently completed fiscal year. The Adviser representedthat SCB’s profitability from business conducted with the Fund is comparable tothe profitability of SCB’s dealings with other similar third party clients. In theordinary course of business, SCB receives and pays liquidity rebates from elec-tronic communications networks (“ECNs”) derived from trading for its clients,including the Fund. These credits and charges are not being passed onto anySCB client. The Adviser also receives certain soft dollar benefits from brokersthat execute agency trades for the Fund and other clients. These soft dollarbenefits reduce the Adviser’s cost of doing business and increase its profitability.
V. POSSIBLE ECONOMIES OF SCALEThe Adviser has indicated that economies of scale are being shared with share-holders through fee structures,23 subsidies and enhancement to services. Basedon some of the professional literature that has considered economies of scale inthe mutual fund industry, it is thought that to the extent economies of scaleexist, they may more often exist across a fund family as opposed to a specificfund. This is because the costs incurred by the Adviser, such as investmentresearch or technology for trading or compliance systems can be spread across agreater asset base as the fund family increases in size. It is also possible that as thelevel of services required to operate a successful investment company hasincreased over time, and advisory firms make such investments in their businessto provide services, there may be a sharing of economies of scale without areduction in advisory fees.
An independent consultant, retained by the Senior Officer, provided the Boardof Directors information on the Adviser’s firm-wide average costs from 2005through 2011 and potential economies of scale. The independent consultantnoted that from 2005 through 2007 the Adviser experienced significant growthin assets under management (“AUM”). During this period, operating expensesincreased, in part to keep up with growth, and in part reflecting marketreturns. However, from 2008 through the first quarter of 2009, AUM rapidlyand significantly decreased. Some operating expenses, including base compensa-tion and office space, adjusted more slowly during this period, resulting in anincrease in average costs. Since 2009, AUM has moved within a range of $400to $500 million ending 2011 with an average of $411 million in the fourthquarter. The independent consultant noted that changes in operating expensesreflect changes in business composition and business practices in response tochanges in financial markets. Finally, the independent consultant concluded thatthe increase in average cost and the decline in net operating margin across thecompany since 2008 are inconsistent with the view that there are currently“economies of scale” to be shared with clients through lower fees.
23 Fee structures include fee reductions, pricing at scale and breakpoints in advisory fee schedules.
54 • ALLIANCEBERNSTEIN GLOBAL THEMATIC GROWTH FUND
In February 2008, the independent consultant provided the Board of Directorsan update of the Deli24 study on advisory fees and various fund characteristics.25
The independent consultant first reiterated the results of his previous twodimensional comparison analysis (fund size and family size) with the Board ofDirectors.26 The independent consultant then discussed the results of theregression model that was utilized to study the effects of various factors onadvisory fees. The regression model output indicated that the bulk of thevariation in fees predicted were explained by various factors, but substantially byfund AUM, family AUM, index fund indicator and investment style. Theindependent consultant also compared the advisory fees of theAllianceBernstein Mutual Funds to similar funds managed by 19 other largeasset managers, regardless of the fund size and each Adviser’s proportion ofmutual fund assets to non-mutual fund assets.
VI. NATURE AND QUALITY OF THE ADVISER’S SERVICES, INCLUDINGTHE PERFORMANCE OF THE FUND
With assets under management of approximately $419 billion as of March 31,2012, the Adviser has the investment experience to manage and provide non-investment services (described in Section I) to the Fund.
The information prepared by Lipper shows the 1, 3, 5 and 10 year performancereturns and rankings of the Fund27 relative to its Lipper Performance Group(“PG”) and Lipper Performance Universe (“PU”)28 for the periods endedFebruary 29, 2012.29
24 The Deli study, originally published in 2002 based on 1997 data and updated for theFebruary 2008 Presentation, may be of diminished value due to the age of the data used inthe presentation and the changes experienced in the industry over the last four years.
25 As mentioned previously, the Supreme Court cautioned against accepting mutual fund feecomparisons without careful scrutiny since the fees may not be the product of negotiationsconducted at arm’s length. See Jones V. Harris at 1429.
26 The two dimensional analysis showed patterns of lower advisory fees for funds with largerasset sizes and funds from larger family sizes compared to funds with smaller asset sizesand funds from smaller family sizes, which according to the independent consultant isindicative of a sharing of economies of scale and scope. However, in less liquid and activemarkets, such is not the case, as the empirical analysis showed potential for diseconomies ofscale in those markets. The empirical analysis also showed diminishing economies of scaleand scope as funds surpassed a certain high level of assets.
27 The performance rankings are for the Class A shares of the Fund. The Fund’s performancereturns shown were provided by Lipper.
28 The Fund’s PG/PU is not identical to the Fund’s EG/EU as the criteria for including/excluding a fund in/from a PG/PU is somewhat different from that of an FG/EU.
29 Note that the current Lipper investment classification/objective dictates the PG and PUthroughout the life of the fund even if a fund had a different investment classification/objective at a different point in time.
ALLIANCEBERNSTEIN GLOBAL THEMATIC GROWTH FUND • 55
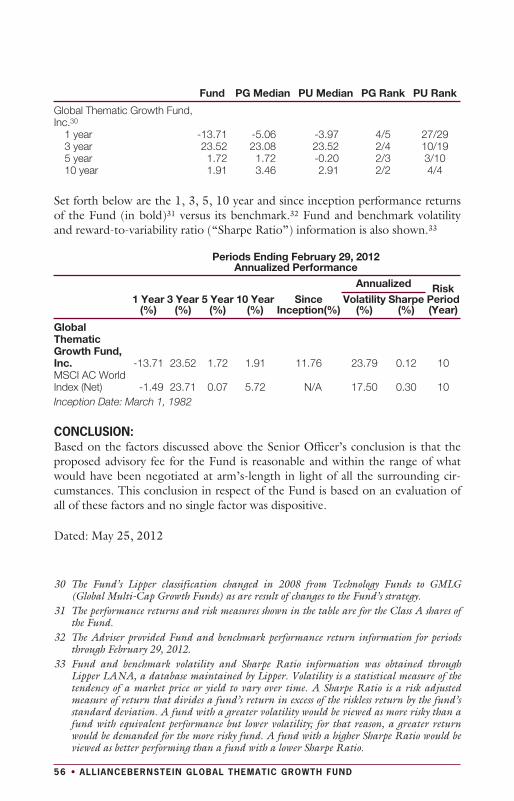
Fund PG Median PU Median PG Rank PU Rank
Global Thematic Growth Fund,Inc.30
1 year -13.71 -5.06 -3.97 4/5 27/293 year 23.52 23.08 23.52 2/4 10/195 year 1.72 1.72 -0.20 2/3 3/1010 year 1.91 3.46 2.91 2/2 4/4
Set forth below are the 1, 3, 5, 10 year and since inception performance returnsof the Fund (in bold)31 versus its benchmark.32 Fund and benchmark volatilityand reward-to-variability ratio (“Sharpe Ratio”) information is also shown.33
Periods Ending February 29, 2012Annualized Performance
Annualized RiskPeriod(Year)
1 Year(%)
3 Year(%)
5 Year(%)
10 Year(%)
SinceInception(%)
Volatility(%)
Sharpe(%)
GlobalThematicGrowth Fund,Inc. -13.71 23.52 1.72 1.91 11.76 23.79 0.12 10MSCI AC WorldIndex (Net) -1.49 23.71 0.07 5.72 N/A 17.50 0.30 10Inception Date: March 1, 1982
CONCLUSION:Based on the factors discussed above the Senior Officer’s conclusion is that theproposed advisory fee for the Fund is reasonable and within the range of whatwould have been negotiated at arm’s-length in light of all the surrounding cir-cumstances. This conclusion in respect of the Fund is based on an evaluation ofall of these factors and no single factor was dispositive.
Dated: May 25, 2012
30 The Fund’s Lipper classification changed in 2008 from Technology Funds to GMLG(Global Multi-Cap Growth Funds) as are result of changes to the Fund’s strategy.
31 The performance returns and risk measures shown in the table are for the Class A shares ofthe Fund.
32 The Adviser provided Fund and benchmark performance return information for periodsthrough February 29, 2012.
33 Fund and benchmark volatility and Sharpe Ratio information was obtained throughLipper LANA, a database maintained by Lipper. Volatility is a statistical measure of thetendency of a market price or yield to vary over time. A Sharpe Ratio is a risk adjustedmeasure of return that divides a fund’s return in excess of the riskless return by the fund’sstandard deviation. A fund with a greater volatility would be viewed as more risky than afund with equivalent performance but lower volatility; for that reason, a greater returnwould be demanded for the more risky fund. A fund with a higher Sharpe Ratio would beviewed as better performing than a fund with a lower Sharpe Ratio.
56 • ALLIANCEBERNSTEIN GLOBAL THEMATIC GROWTH FUND
THIS PAGE IS NOT PART OF THE SHAREHOLDER REPORT OR THEFINANCIAL STATEMENTS
ALLIANCEBERNSTEIN FAMILY OF FUNDSWealth StrategiesBalanced Wealth StrategyConservative Wealth StrategyWealth Appreciation StrategyTax-Managed Balanced Wealth StrategyTax-Managed Conservative Wealth StrategyTax-Managed Wealth Appreciation Strategy
Asset Allocation/Multi-Asset FundsEmerging Markets Multi-Asset PortfolioInternational PortfolioTax-Managed International Portfolio
Growth FundsDomesticDiscovery Growth Fund**Growth FundLarge Cap Growth FundSelect US Equity PortfolioSmall Cap Growth PortfolioU.S. Strategic Research PortfolioGlobal & InternationalGlobal Thematic Growth FundInternational Discovery Equity PortfolioInternational Focus 40 PortfolioInternational Growth Fund
Value FundsDomesticCore Opportunities FundDiscovery Value Fund**Equity Income FundGrowth & Income FundValue FundGlobal & InternationalEmerging Markets Equity PortfolioGlobal Real Estate Investment FundGlobal Value FundInternational Value Fund
Taxable Bond FundsBond Inflation StrategyGlobal Bond FundHigh Income FundIntermediate Bond PortfolioLimited Duration High Income PortfolioShort Duration Portfolio
Municipal Bond FundsArizona PortfolioCalifornia PortfolioHigh Income PortfolioMassachusetts PortfolioMichigan PortfolioMinnesota PortfolioMunicipal Bond
Inflation Strategy
National PortfolioNew Jersey PortfolioNew York PortfolioOhio PortfolioPennsylvania PortfolioVirginia Portfolio
Intermediate Municipal Bond FundsIntermediate California PortfolioIntermediate Diversified PortfolioIntermediate New York Portfolio
Closed-End FundsAlliance California Municipal Income FundAlliance New York Municipal Income FundAllianceBernstein Global High Income FundAllianceBernstein Income FundAllianceBernstein National Municipal Income
Fund
AlternativesDynamic All Market FundGlobal Risk Allocation Fund**Market Neutral Strategy-GlobalMarket Neutral Strategy-U.S.Real Asset StrategySelect US Long/Short PortfolioUnconstrained Bond Fund
Retirement Strategies2000 Retirement Strategy 2020 Retirement Strategy 2040 Retirement Strategy2005 Retirement Strategy 2025 Retirement Strategy 2045 Retirement Strategy2010 Retirement Strategy 2030 Retirement Strategy 2050 Retirement Strategy2015 Retirement Strategy 2035 Retirement Strategy 2055 Retirement Strategy
We also offer Exchange Reserves,* which serves as the money market fund exchange vehicle for theAllianceBernstein mutual funds.Investors should consider the investment objectives, risks, charges and expenses of the Fund carefully beforeinvesting. For copies of our prospectus or summary prospectus, which contain this and other information, visitus online at www.alliancebernstein.com or contact your AllianceBernstein investments representative. Pleaseread the prospectus and/or summary prospectus carefully before investing.* An investment in Exchange Reserves is not a deposit in a bank and is not insured or guaranteed by the Federal Deposit
Insurance Corporation or any other government agency. Although the Fund seeks to preserve the value of your invest-ment at $1.00 per share, it is possible to lose money by investing in the Fund.
**Prior to October 8, 2012, Global Risk Allocation Fund was named Balanced Shares. Prior to November 1,2012, Discovery Growth Fund was named Small/Mid Cap Growth Fund and Discovery Value Fund wasnamed Small/Mid Cap Value Fund.
ALLIANCEBERNSTEIN GLOBAL THEMATIC GROWTH FUND • 57
AllianceBernstein
Family
ofFunds

NOTES
58 • ALLIANCEBERNSTEIN GLOBAL THEMATIC GROWTH FUND

NOTES
ALLIANCEBERNSTEIN GLOBAL THEMATIC GROWTH FUND • 59

NOTES
60 • ALLIANCEBERNSTEIN GLOBAL THEMATIC GROWTH FUND


ALLI
ANC
EBER
NST
EIN
GLO
BAL
THEM
ATIC
GR
OW
THFU
ND
1345
Aven
ueof
the
Amer
icas
New
York
,NY
1010
580
0.22
1.56
72
GTG
-015
2-01
13Pr
inte
d on
rec
ycle
dpa
per
cont
aini
ng p
ost
cons
umer
was
te.