Embed Size (px)
Citation preview
Alliance Stat Class
Understanding Measures of Center and Spread
06/28/10
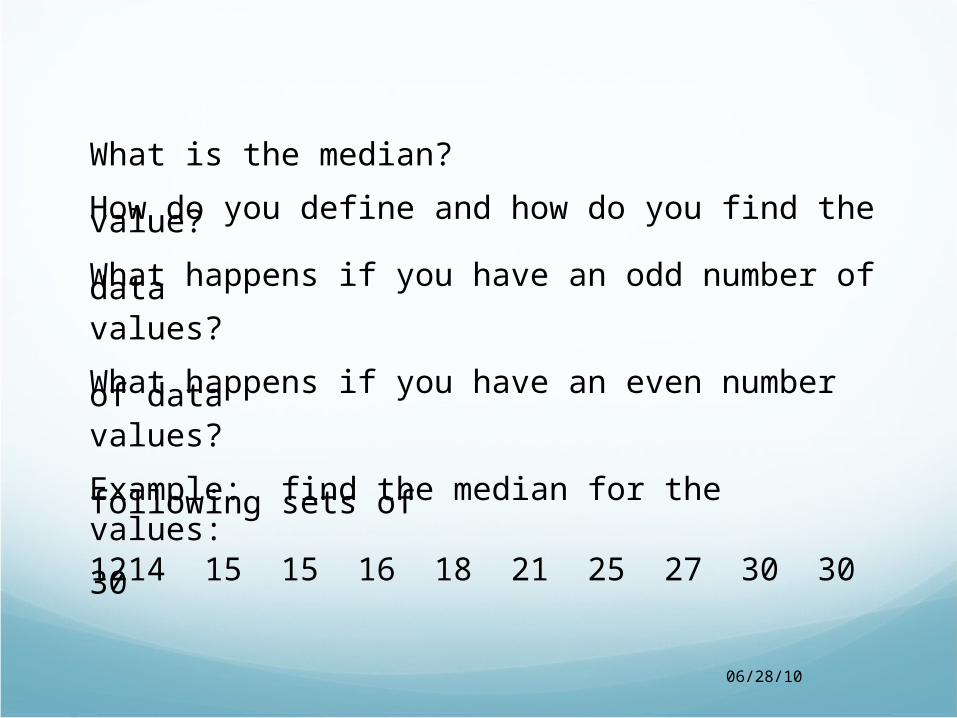
What is the median?
How do you define and how do you find the value?
What happens if you have an odd number of data values?
What happens if you have an even number of data values?
Example: find the median for the following sets ofvalues:1214 15 15 16 18 21 25 27 30 30 30
30 30 26 12 15 9 27 9 13 13 13 18
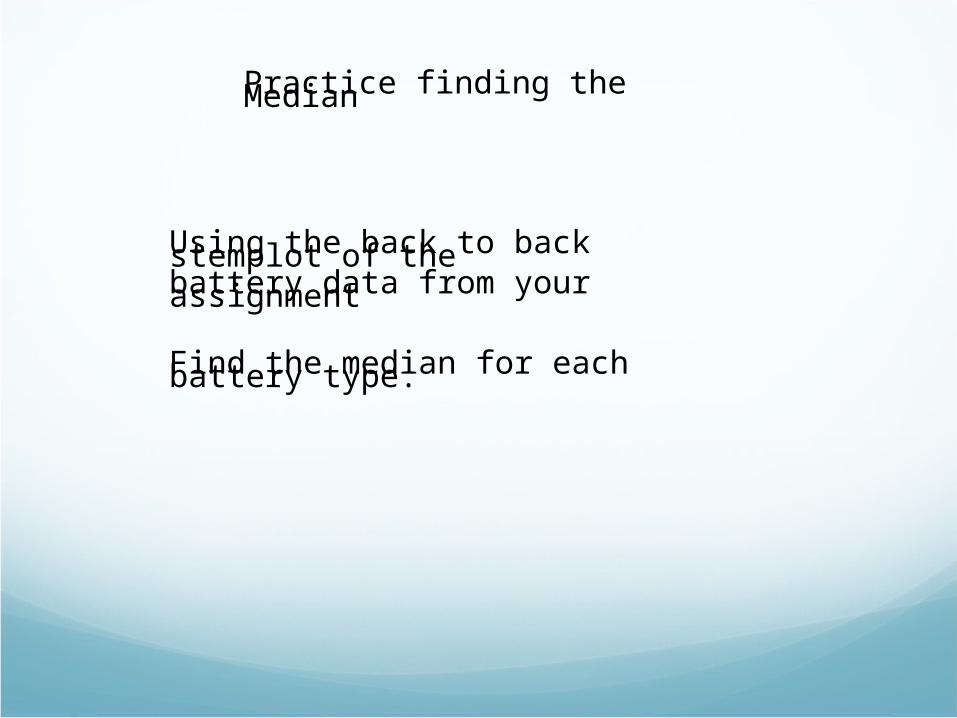
Using the back to back stemplot of the battery data from your assignment
Find the median for each battery type.
Practice finding the Median
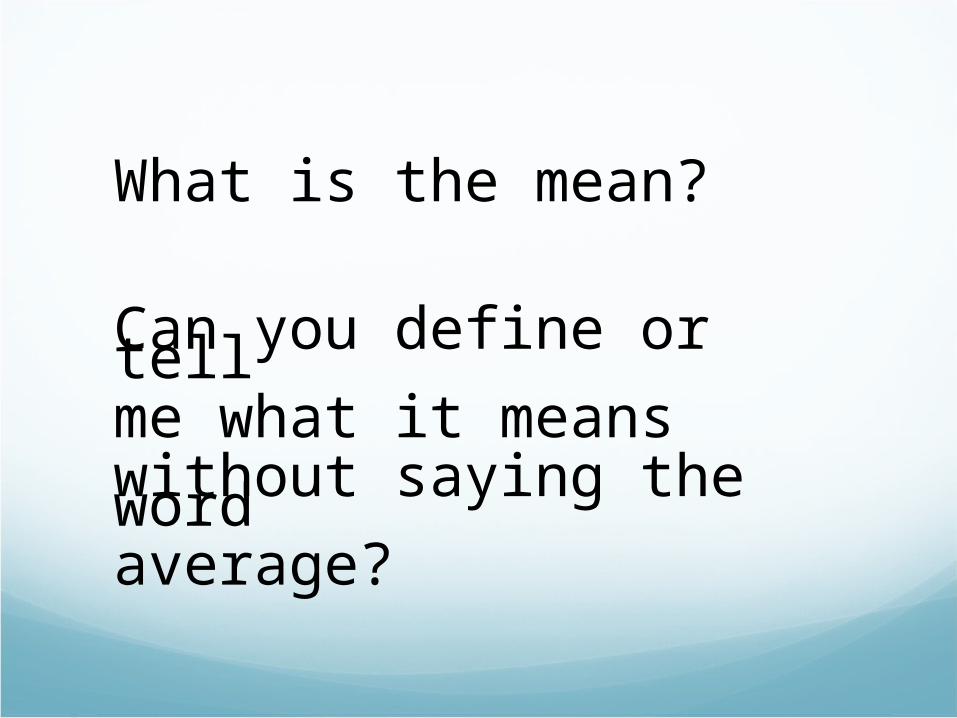
What is the mean?
Can you define or tell me what it means without saying the word average?
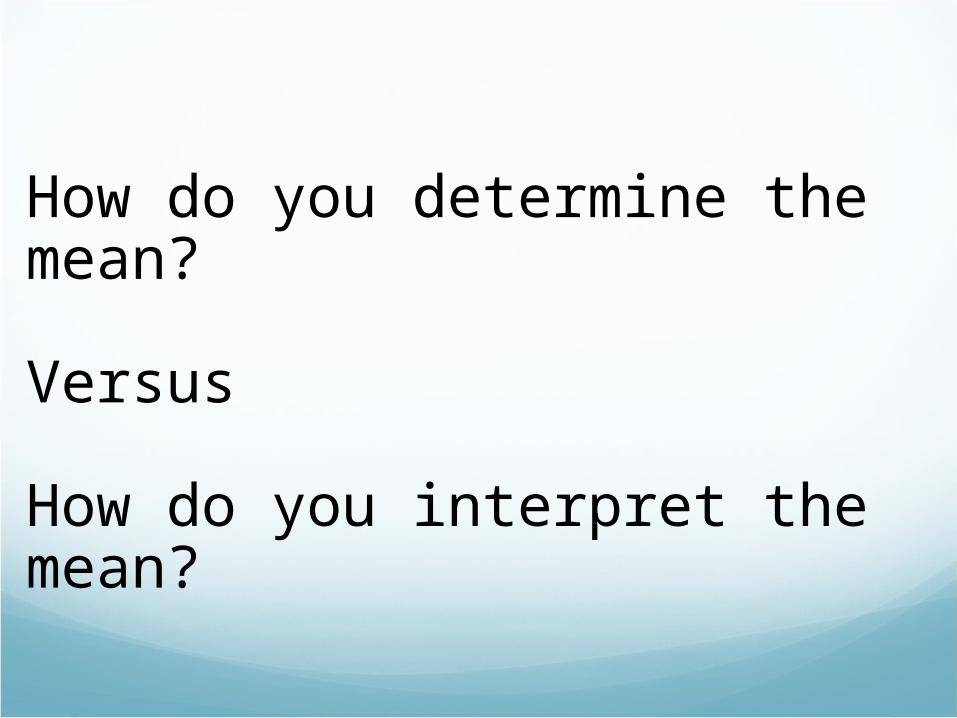
How do you determine the mean?
Versus
How do you interpret the mean?

Level A Activity
Length of First Name
A Conceptual Activity for:
• Developing an Understanding of the Mean as the “Fair Share” value
• Developing a Measure of Variation from “Fair Share”
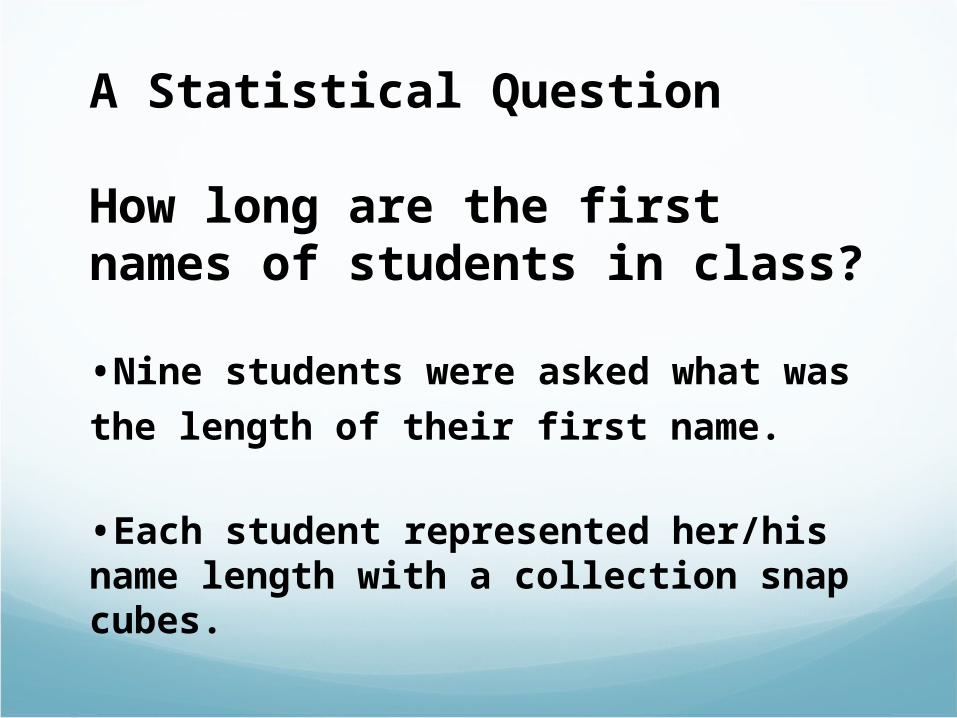
A Statistical Question
How long are the first names of students in class?
• Nine students were asked what was the
length of their first name.
• Each student represented her/his name length with a collection snap cubes.
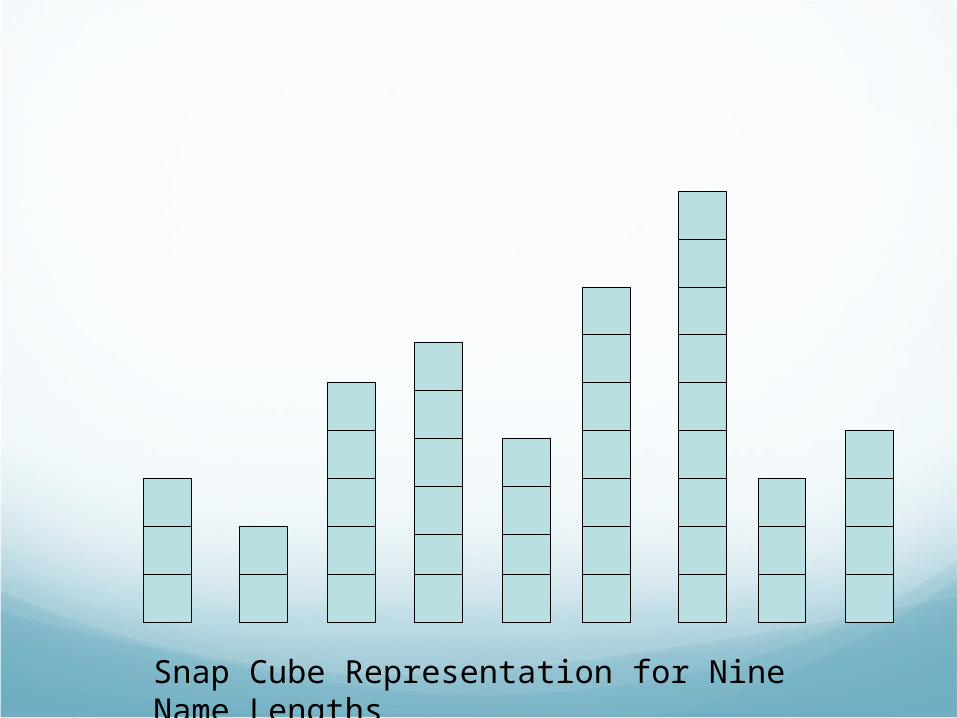
Snap Cube Representation for Nine Name Lengths
How might we examine the data on the name length for these nine children?
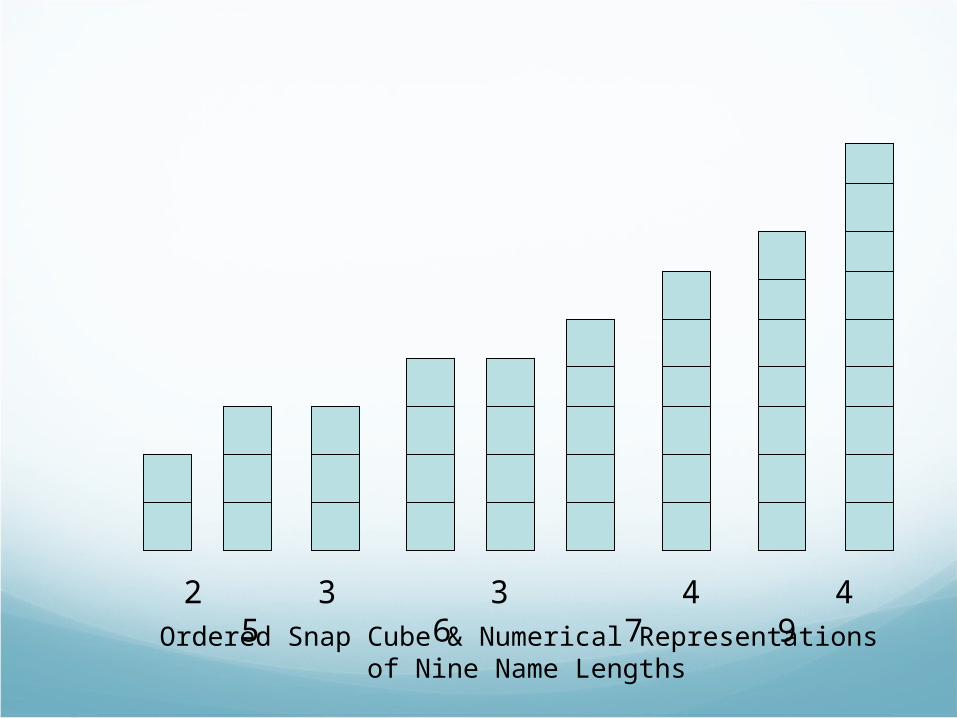
Ordered Snap Cube & Numerical Representations of Nine Name Lengths
2 3 3 4 4 5 6 7 9
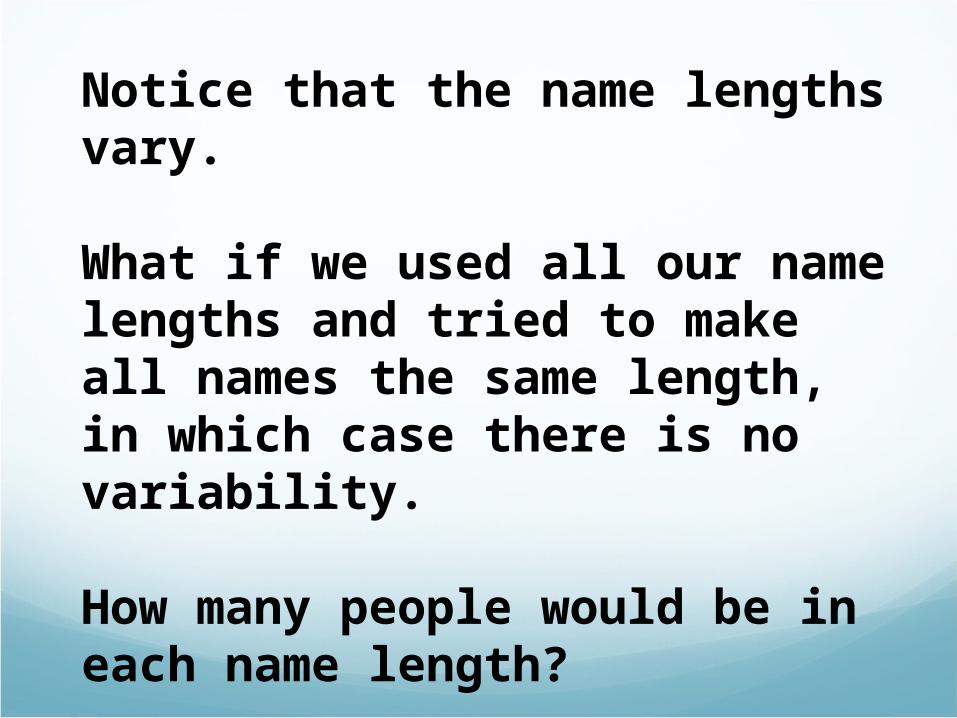
Notice that the name lengths vary.
What if we used all our name lengths and tried to make all names the same length, in which case there is no variability.
How many people would be in each name length?

How can we go about creating these new groups?
We might start by separating all the names into one large group.
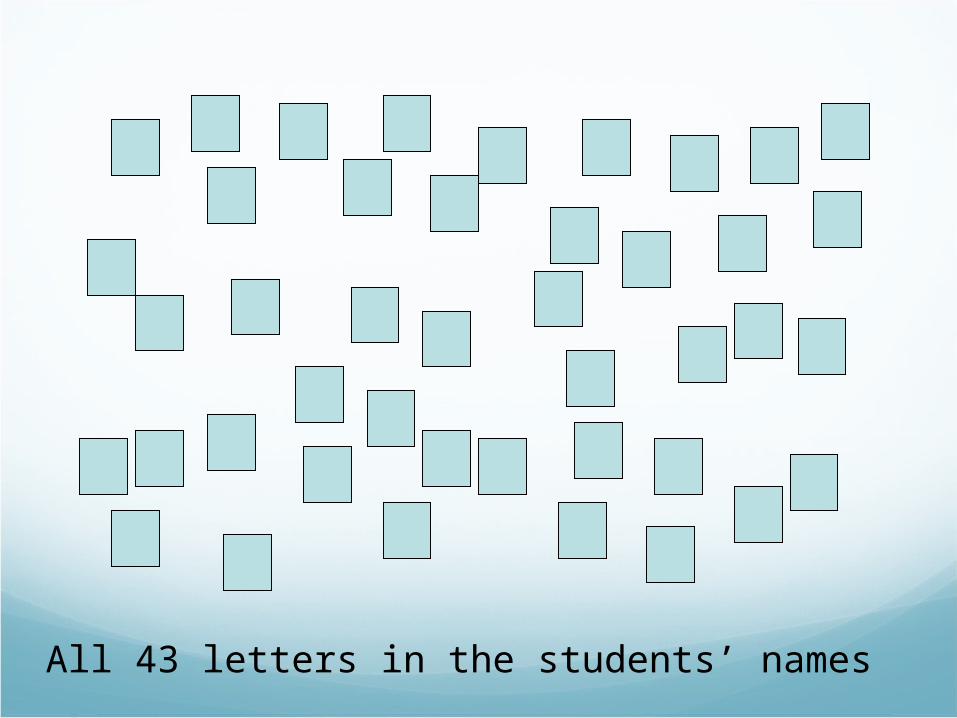
All 43 letters in the students’ names
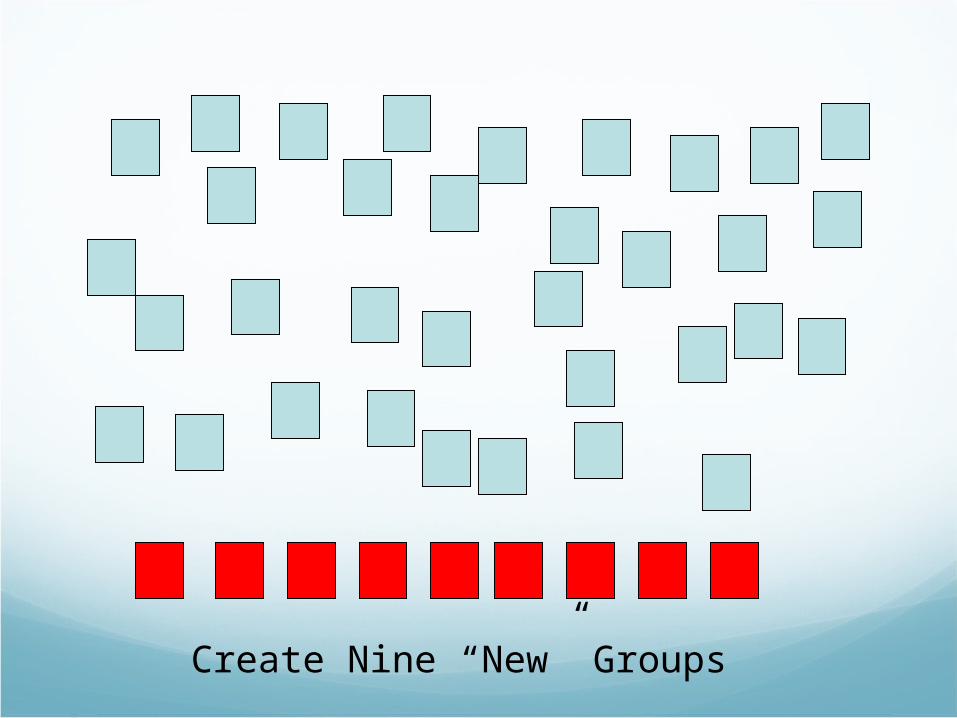
Create Nine “New” Groups
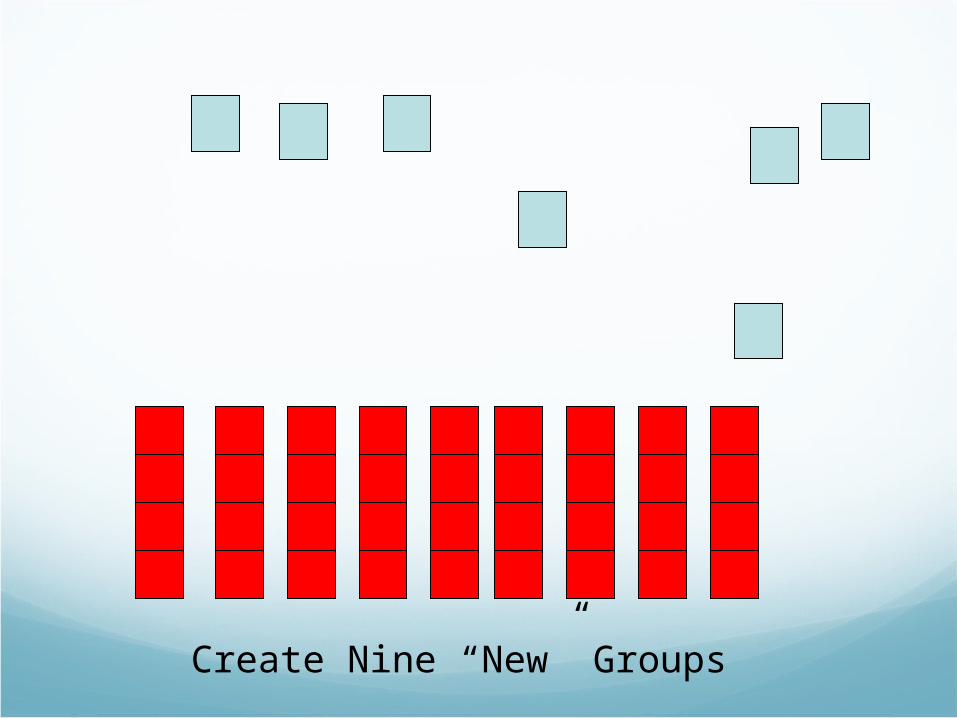
Create Nine “New” Groups
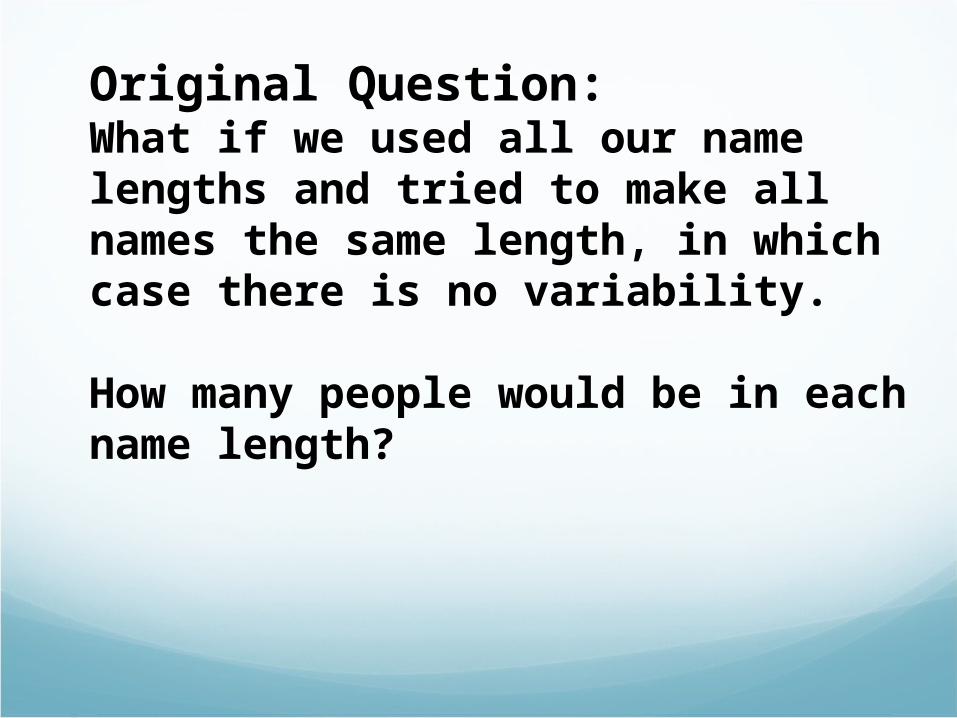
Original Question:What if we used all our name lengths and tried to make all names the same length, in which case there is no variability.
How many people would be in each name length?
06/28/10
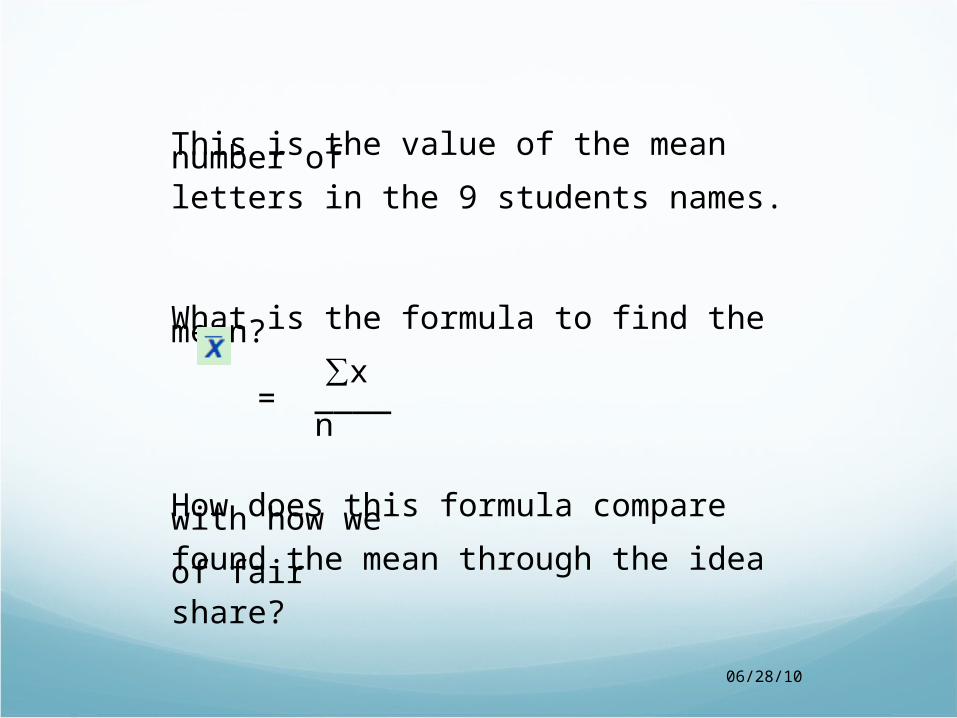
This is the value of the mean number of letters in the 9 students names.
What is the formula to find the mean? ∑x
= ____ n
How does this formula compare with how we found the mean through the idea of fair share?
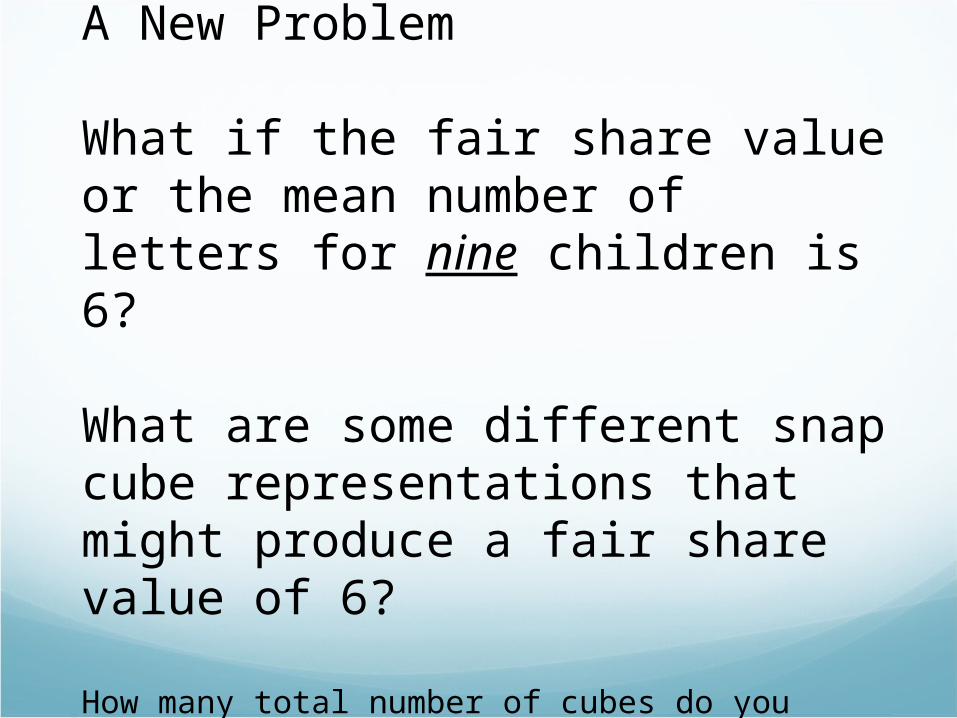
A New Problem
What if the fair share value or the mean number of letters for nine children is 6?
What are some different snap cube representations that might produce a fair share value of 6?
How many total number of cubes do you need?
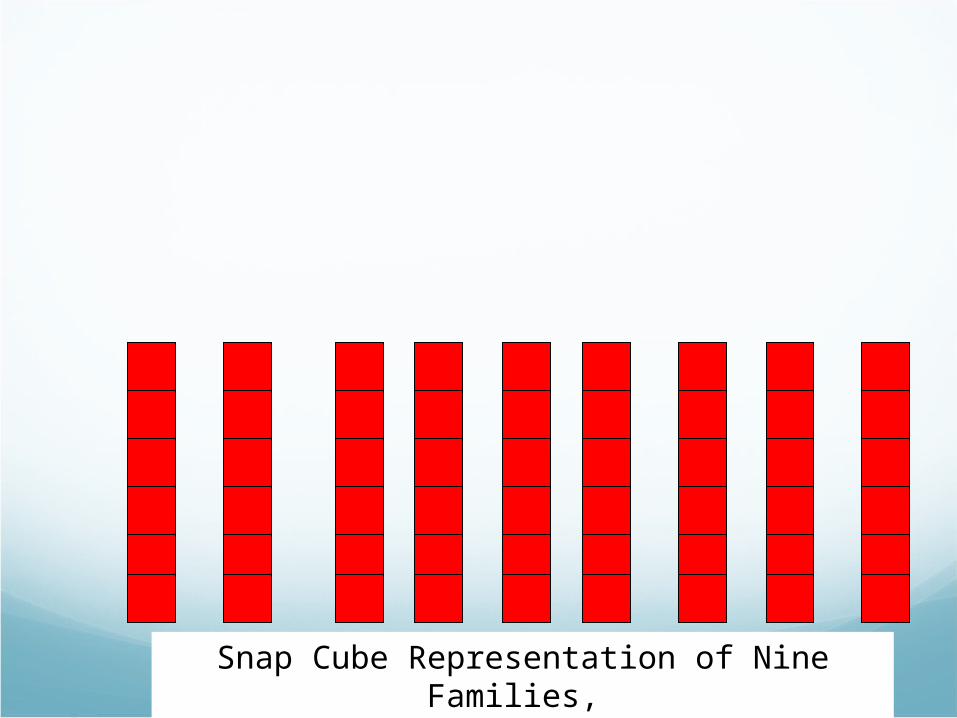
Snap Cube Representation of Nine Families, Each of Size 6
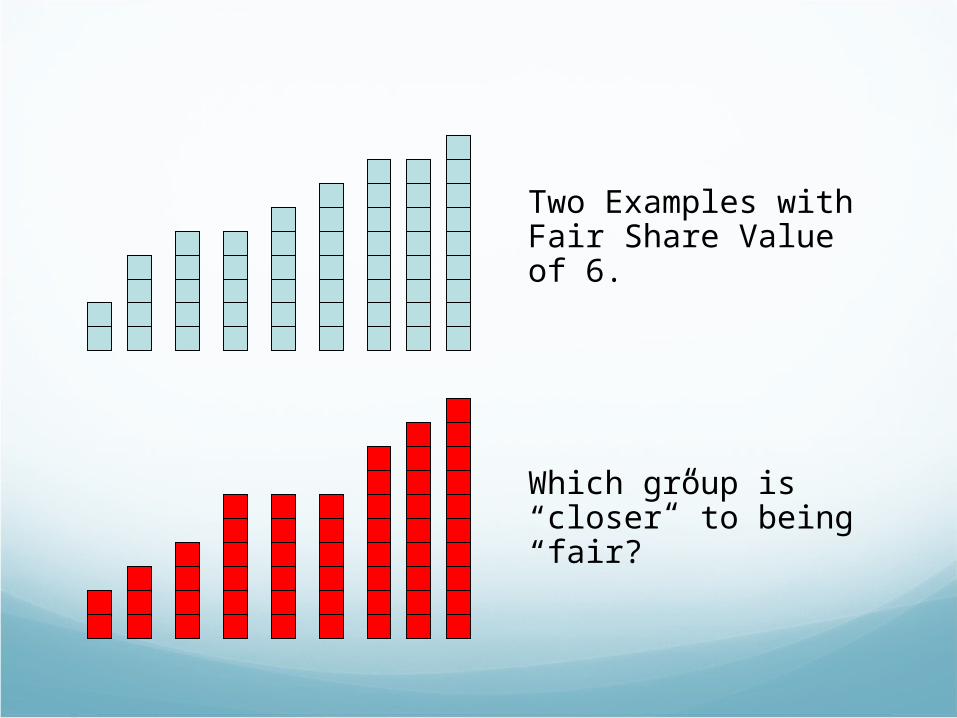
Two Examples with Fair Share Value of 6.
Which group is “closer” to being “fair?”
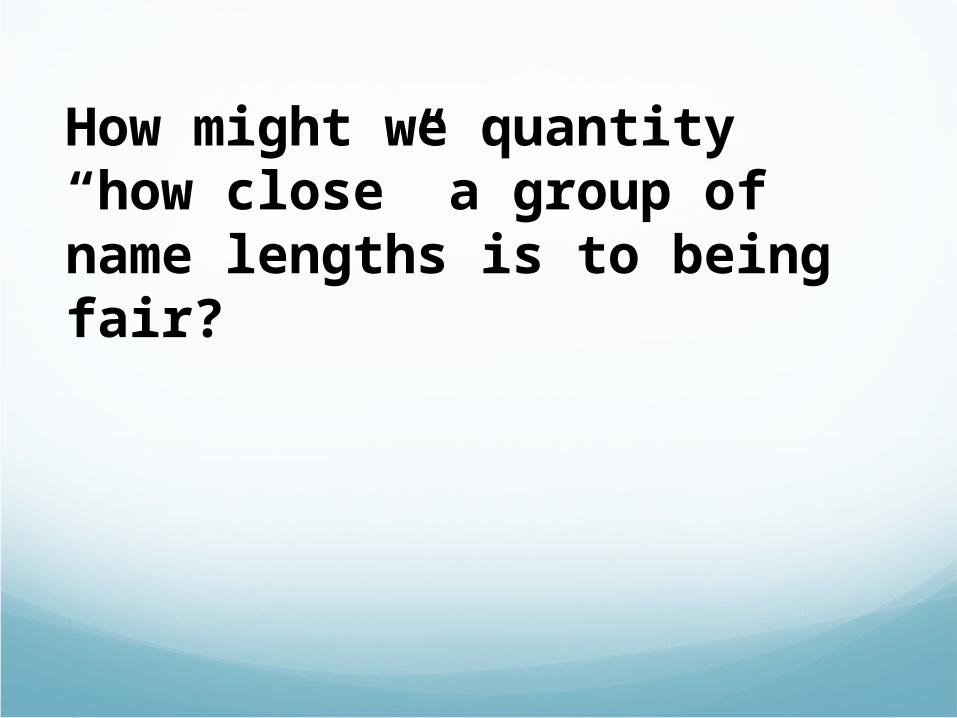
How might we quantity “how close” a group of name lengths is to being fair?
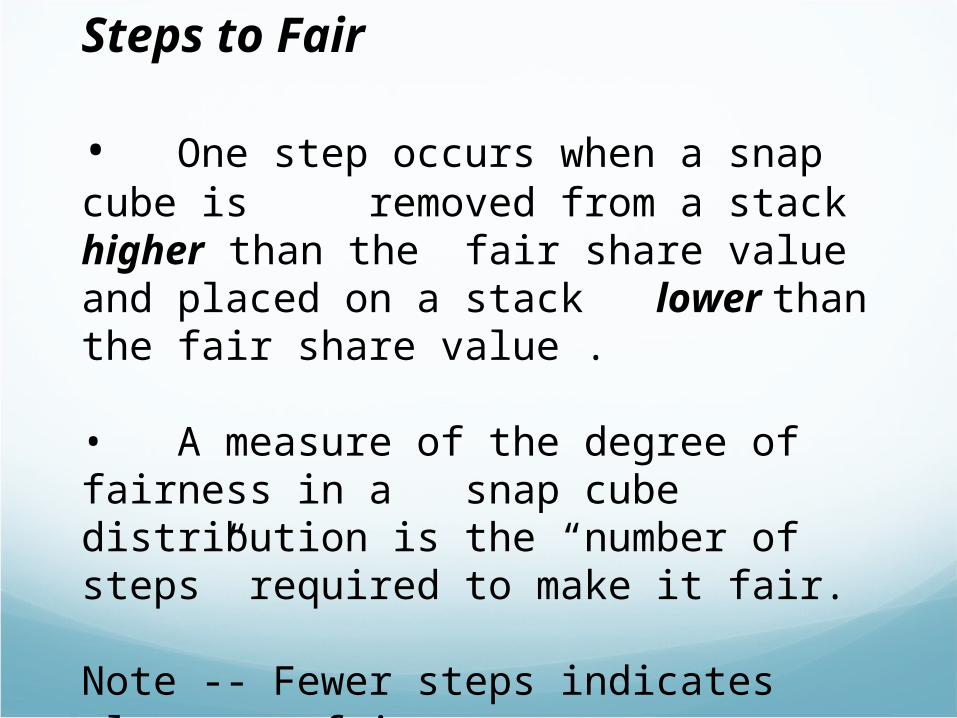
Steps to Fair
• One step occurs when a snap cube is removed from a stack higher than the fair share value and placed on a stack lower than the fair share value .
• A measure of the degree of fairness in a snap cube distribution is the “number of steps” required to make it fair.
Note -- Fewer steps indicates closer to fair
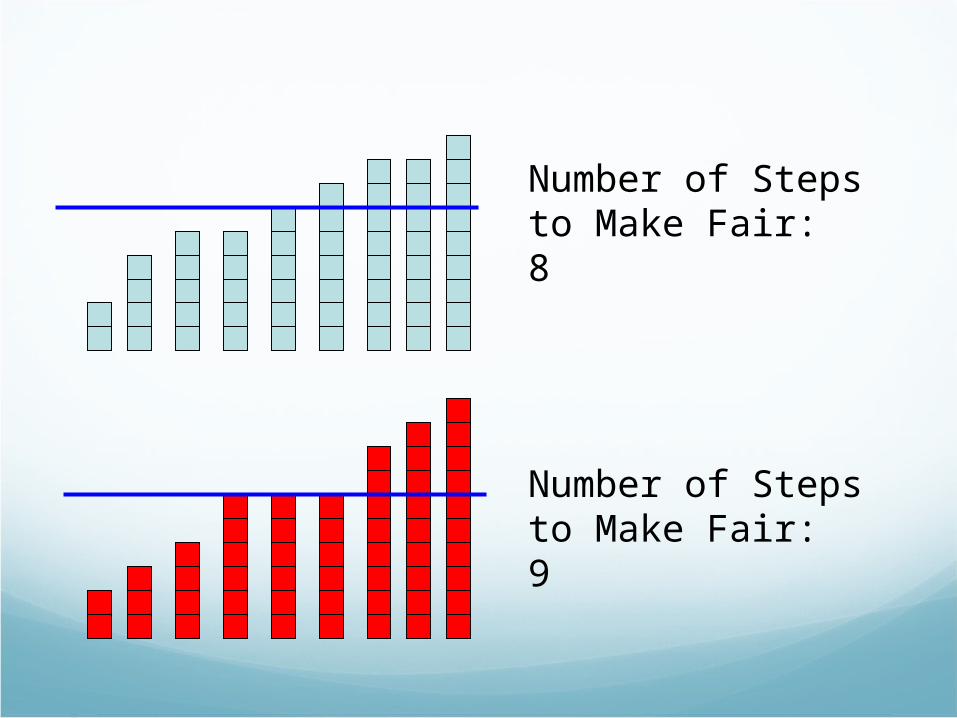
Number of Steps to Make Fair: 8
Number of Steps to Make Fair: 9
Students completing Level A understand:
• the notion of “fair share” for a set of numeric data
• the fair share value is also called the mean value
• the algorithm for finding the mean
• the notion of “number of steps” to make fair as a measure of variability about the mean
• the fair share/mean value provides a basis for comparison between two groups of numerical data with different sizes (thus can’t use total)

Level B Activity
The Name Length Problem
• How long are the first names of students in class?
A Conceptual Activity for:• Developing an Understanding of the Mean as
the “Balance Point” of a Distribution
• Developing Measures of Variation about the Mean
Level B Activity
How long is your first name?
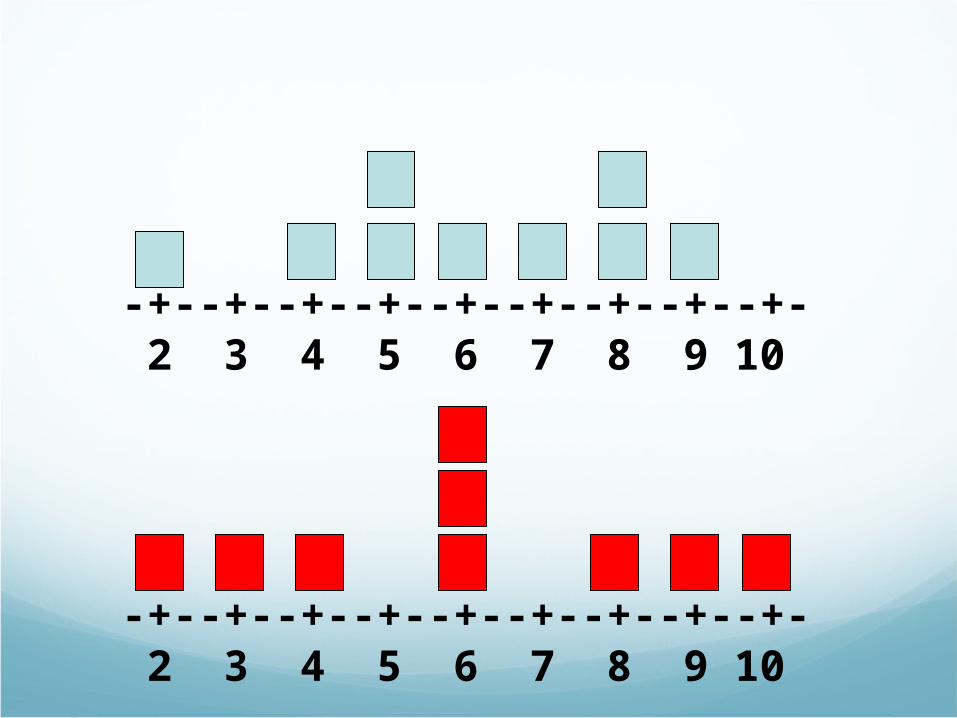
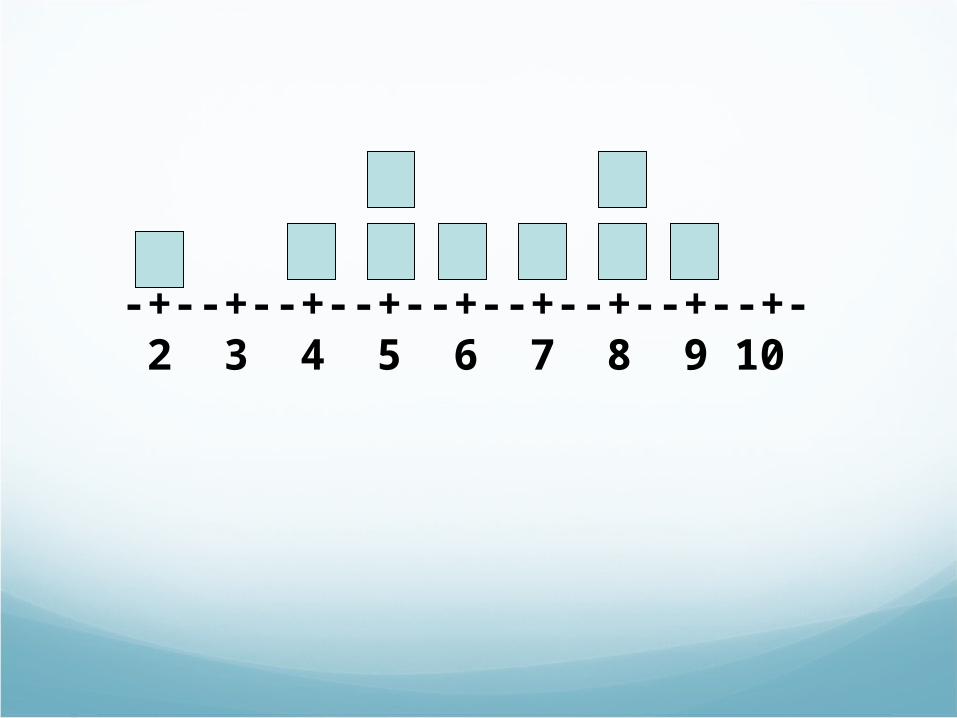
Nine children were asked this question. The following dot plot is one possible result for the nine children:
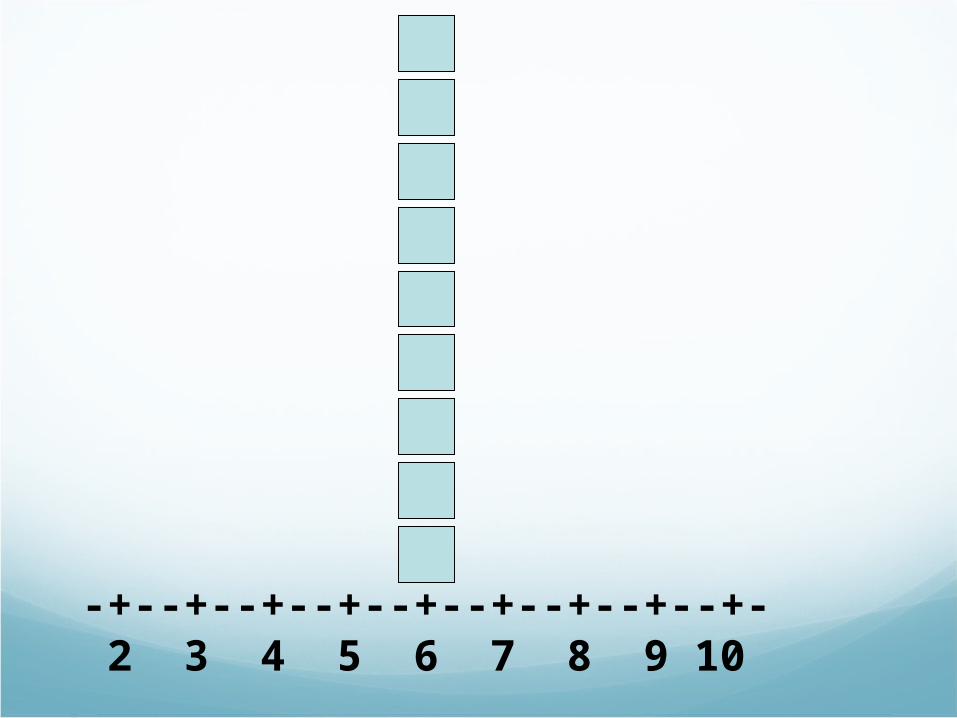
-+--+--+--+--+--+--+--+--+- 2 3 4 5 6 7 8 9 10
-+--+--+--+--+--+--+--+--+- 2 3 4 5 6 7 8 9 10
-+--+--+--+--+--+--+--+--+- 2 3 4 5 6 7 8 9 10
In which group do the data (name length) vary (differ) more from the mean value of 6?
-+--+--+--+--+--+--+--+--+- 2 3 4 5 6 7 8 9 10
-+--+--+--+--+--+--+--+--+- 2 3 4 5 6 7 8 9 10
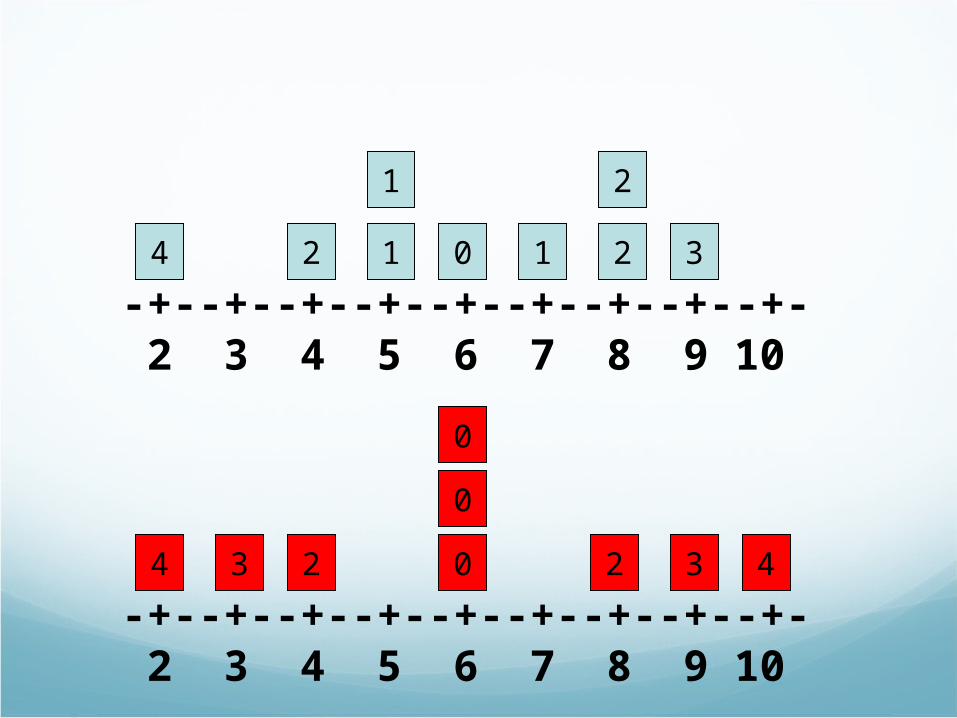
4 2 1
1
0 1 2
2
3
4 3 2 0
0
0
2 3 4
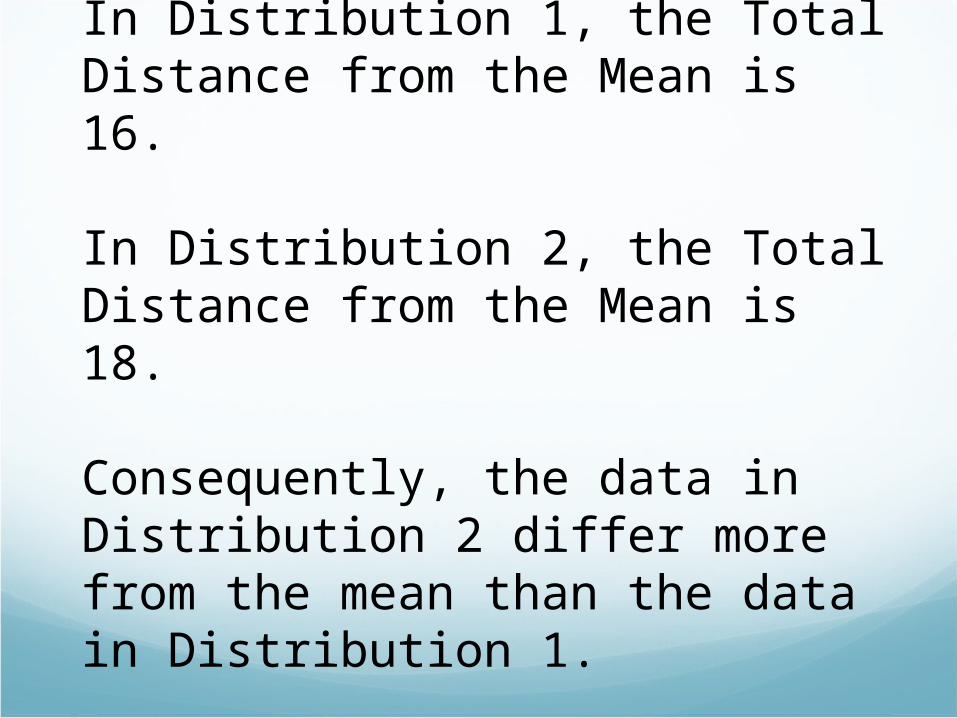
In Distribution 1, the Total Distance from the Mean is 16.
In Distribution 2, the Total Distance from the Mean is 18.
Consequently, the data in Distribution 2 differ more from the mean than the data in Distribution 1.
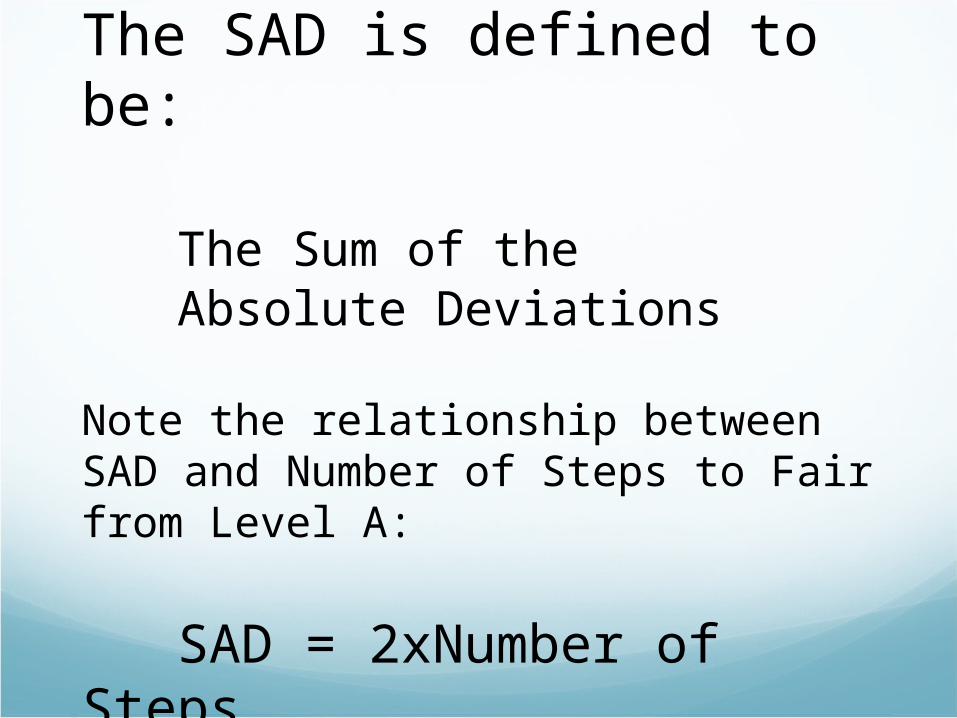
The SAD is defined to be:
The Sum of the Absolute Deviations
Note the relationship between SAD and Number of Steps to Fair from Level A:
SAD = 2xNumber of Steps
-+--+--+--+--+--+--+--+--+- 2 3 4 5 6 7 8 9 10
4 2 1
1
0 1 2
2
3
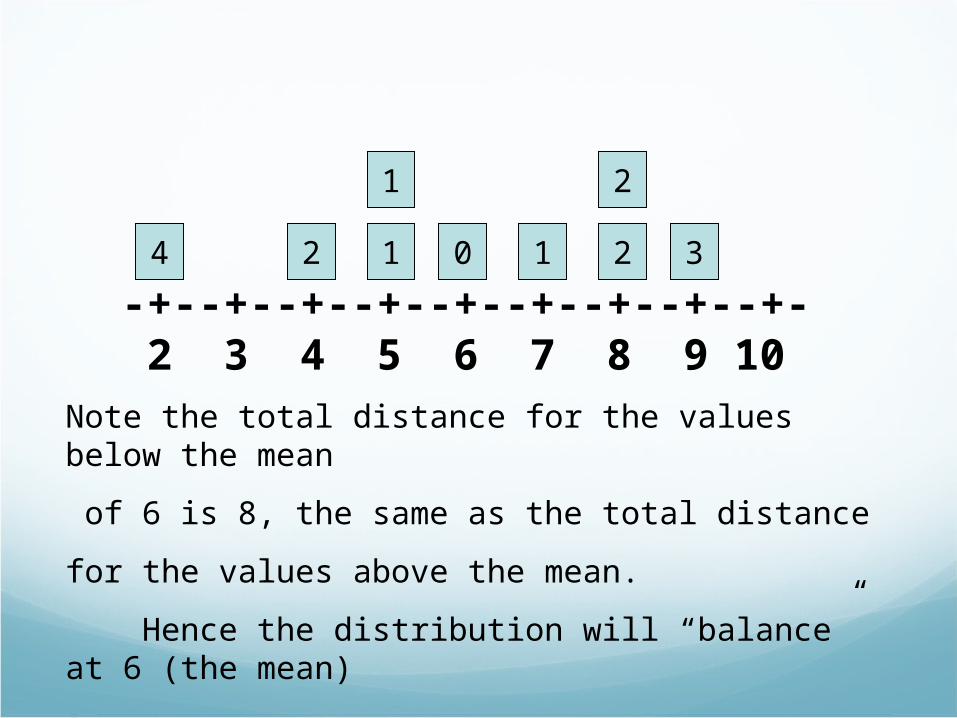
Note the total distance for the values below the mean
of 6 is 8, the same as the total distance
for the values above the mean.
Hence the distribution will “balance” at 6 (the mean)

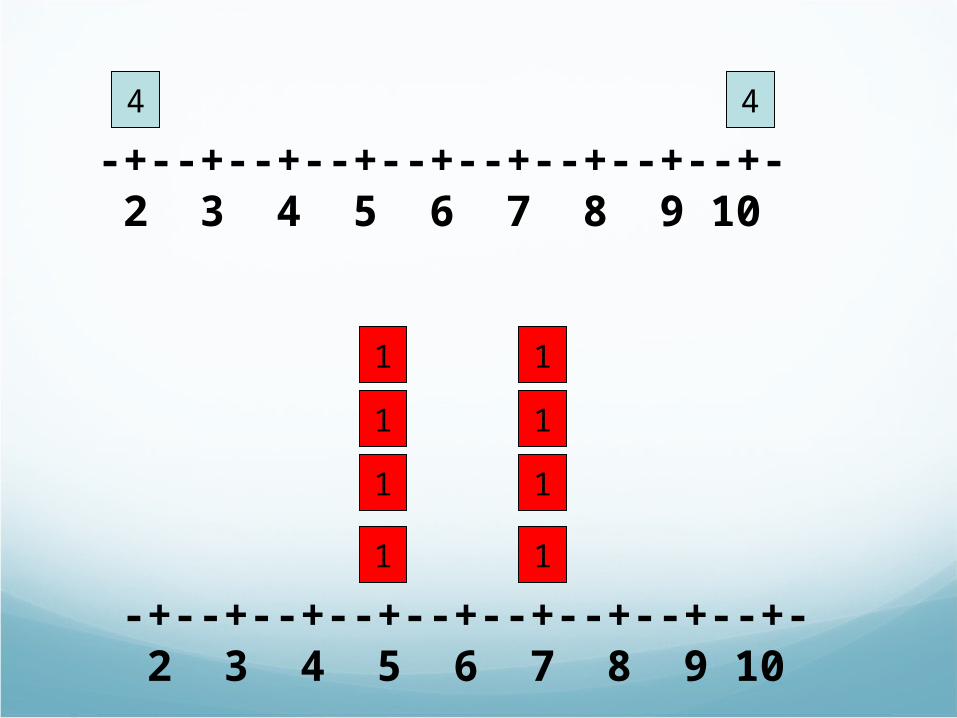
An Illustration where the SAD doesn’t work!
-+--+--+--+--+--+--+--+--+- 2 3 4 5 6 7 8 9 10
-+--+--+--+--+--+--+--+--+- 2 3 4 5 6 7 8 9 10
4 4
1
1
1 1
1
1
11
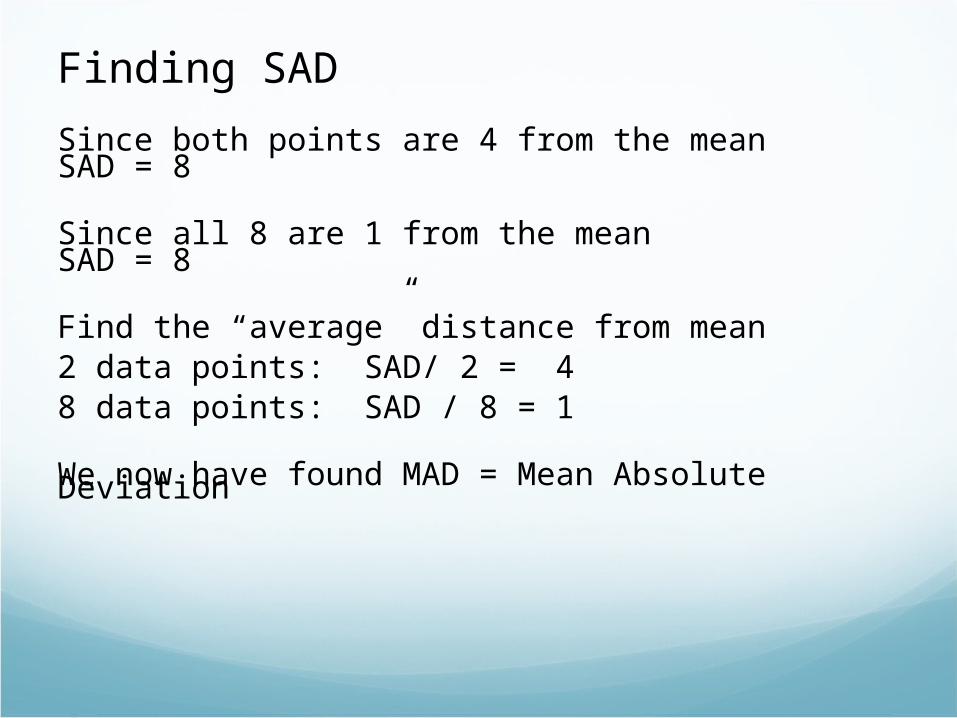
Finding SAD
Since both points are 4 from the mean SAD = 8
Since all 8 are 1 from the mean SAD = 8
Find the “average” distance from mean2 data points: SAD/ 2 = 48 data points: SAD / 8 = 1
We now have found MAD = Mean Absolute Deviation
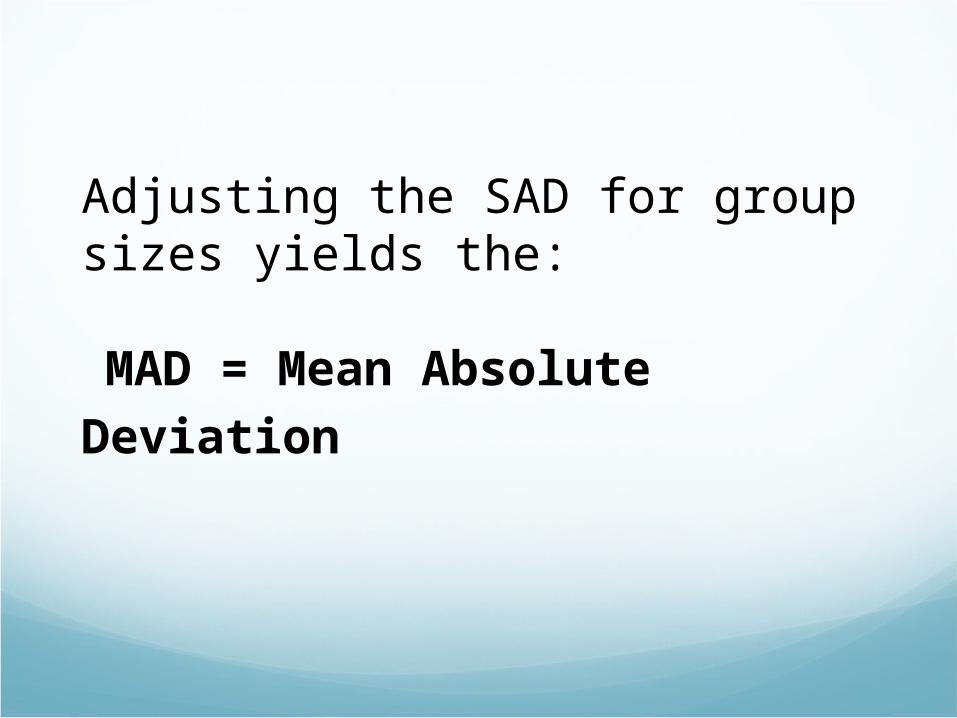
Adjusting the SAD for group sizes yields the:
MAD = Mean Absolute Deviation
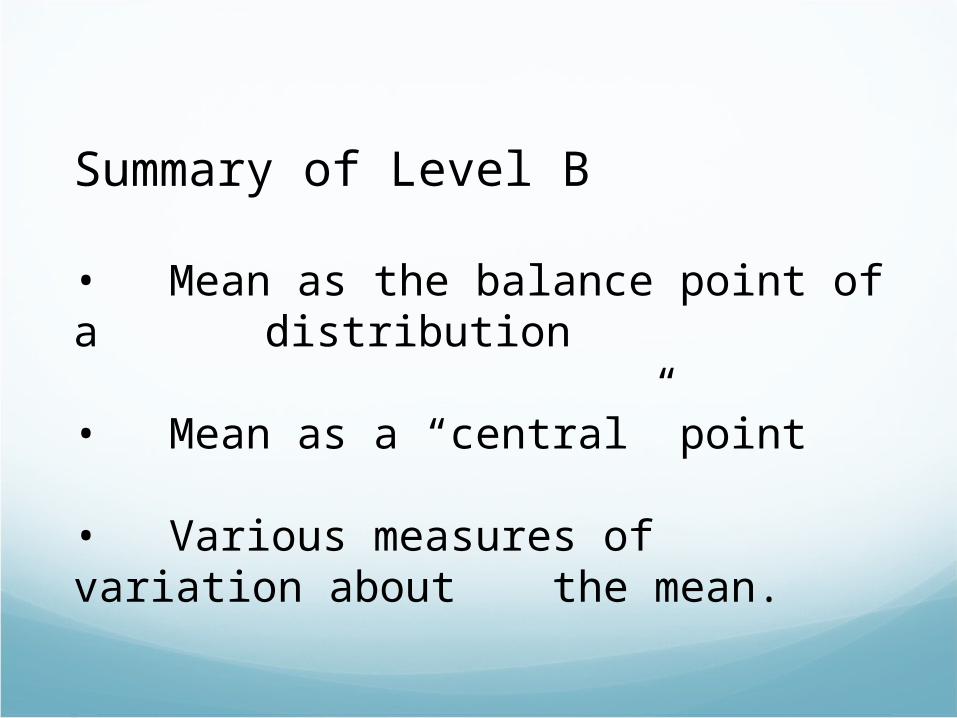
Summary of Level B
• Mean as the balance point of a distribution
• Mean as a “central” point
• Various measures of variation about the mean.

-+--+--+--+--+--+--+--+--+- 2 3 4 5 6 7 8 9 10
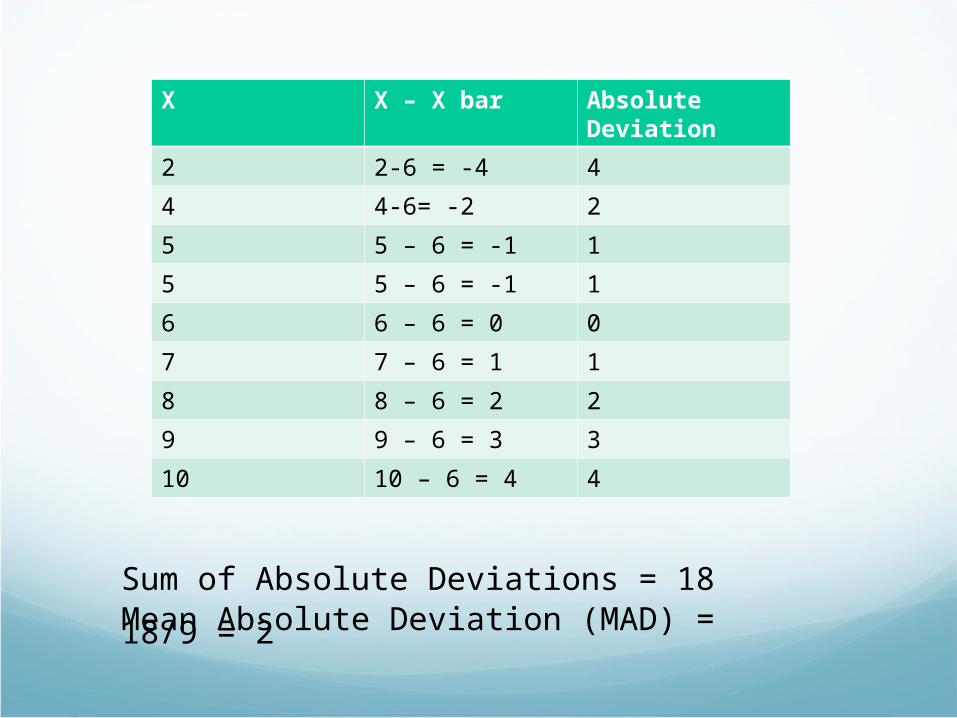
X X – X bar Absolute Deviation
2 2-6 = -4 4
4 4-6= -2 2
5 5 – 6 = -1 1
5 5 – 6 = -1 1
6 6 – 6 = 0 0
7 7 – 6 = 1 1
8 8 – 6 = 2 2
9 9 – 6 = 3 3
10 10 – 6 = 4 4
Sum of Absolute Deviations = 18Mean Absolute Deviation (MAD) = 18/9 = 2
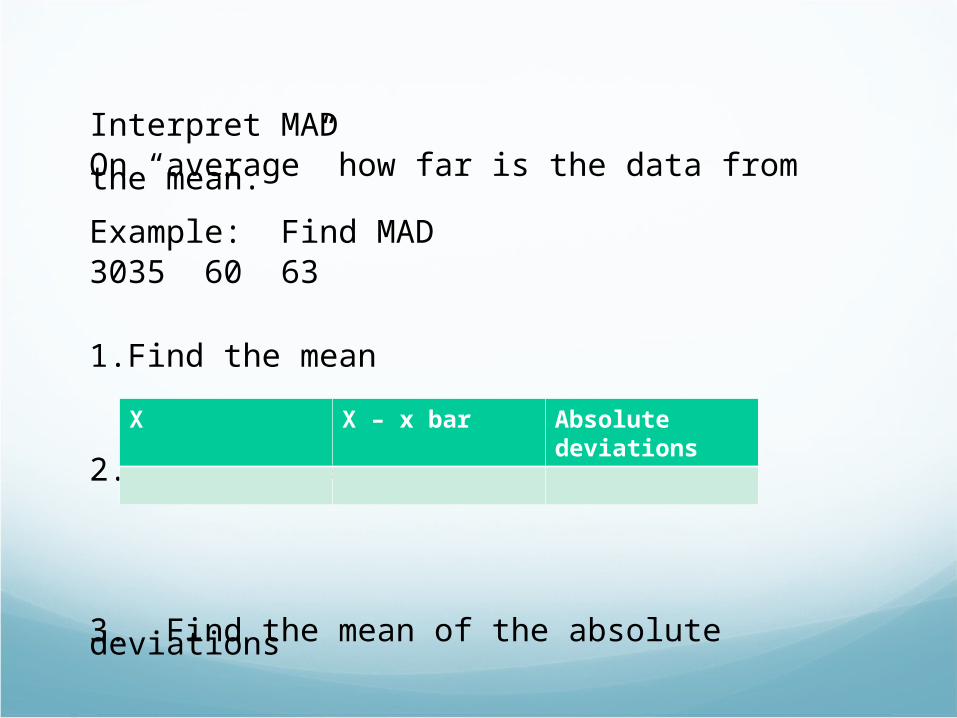
Interpret MADOn “average” how far is the data from the mean.
Example: Find MAD 3035 60 63
1.Find the mean
2.Complete table
3. Find the mean of the absolute deviations
X X – x bar Absolute deviations
06/28/10
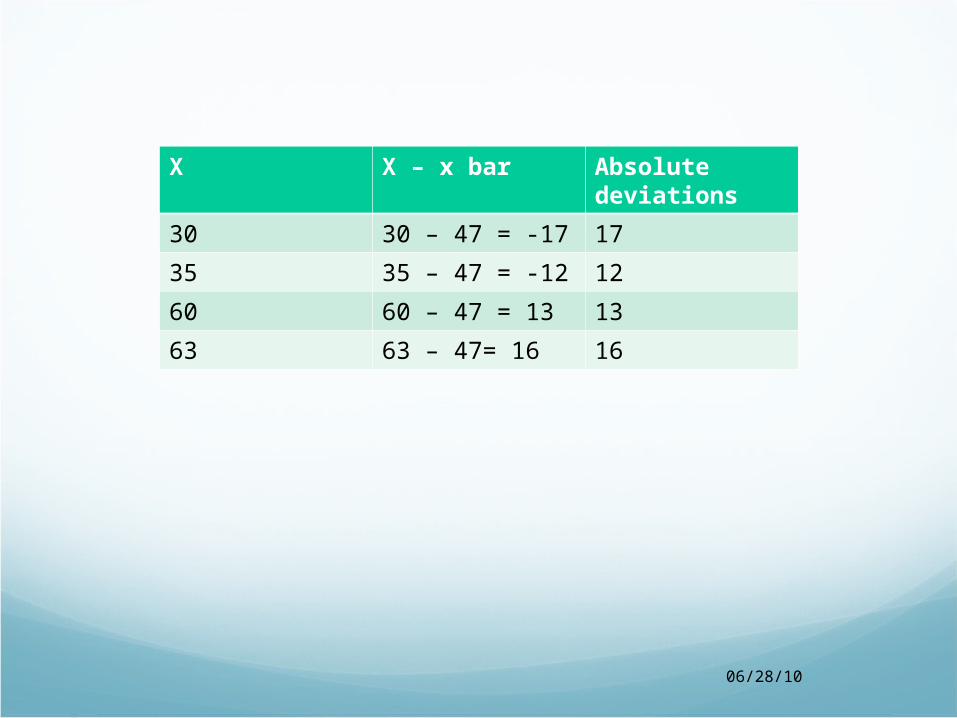
X X – x bar Absolute deviations
30 30 – 47 = -17 17
35 35 – 47 = -12 12
60 60 – 47 = 13 13
63 63 – 47= 16 16
Another Measure of Spread:
Standard Deviation
This is the most common measure ofVariability
06/28/10
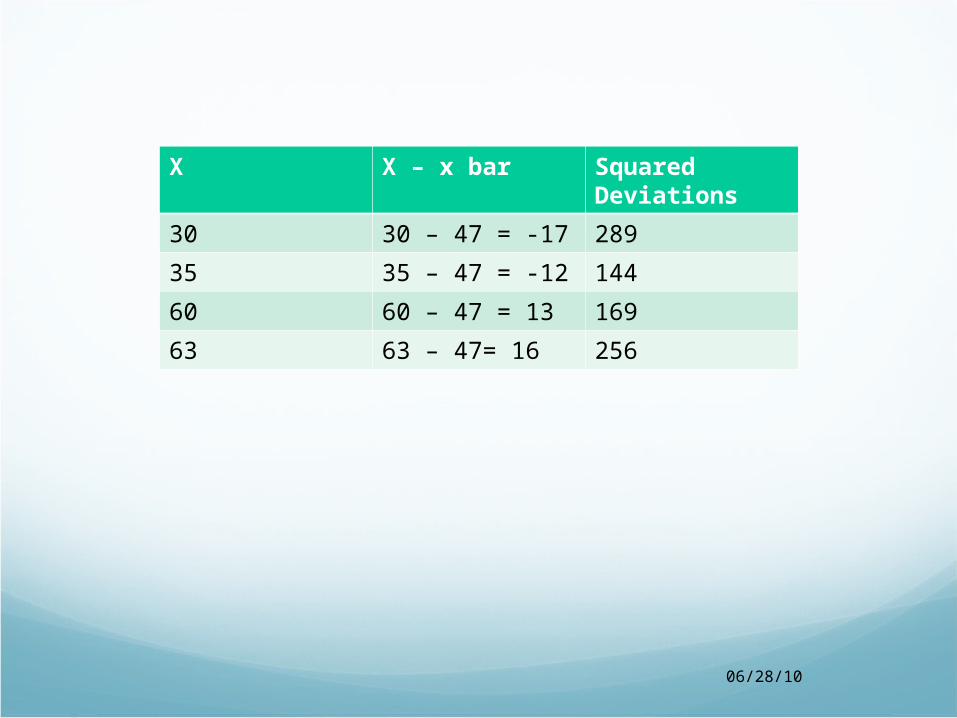
X X – x bar Squared Deviations
30 30 – 47 = -17 289
35 35 – 47 = -12 144
60 60 – 47 = 13 169
63 63 – 47= 16 256
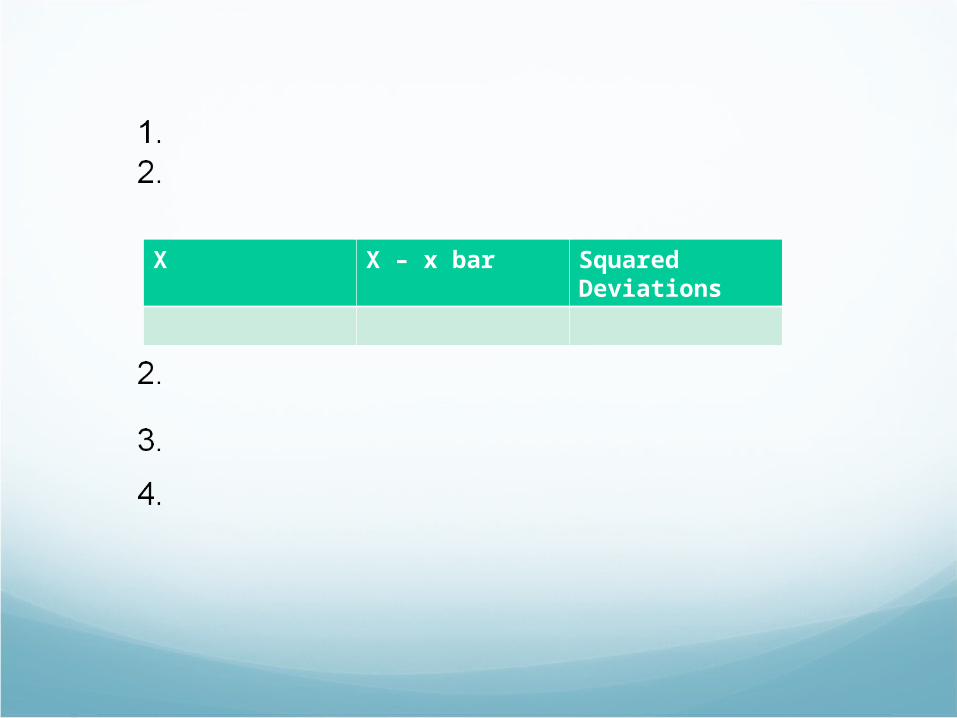
X X – x bar Squared Deviations
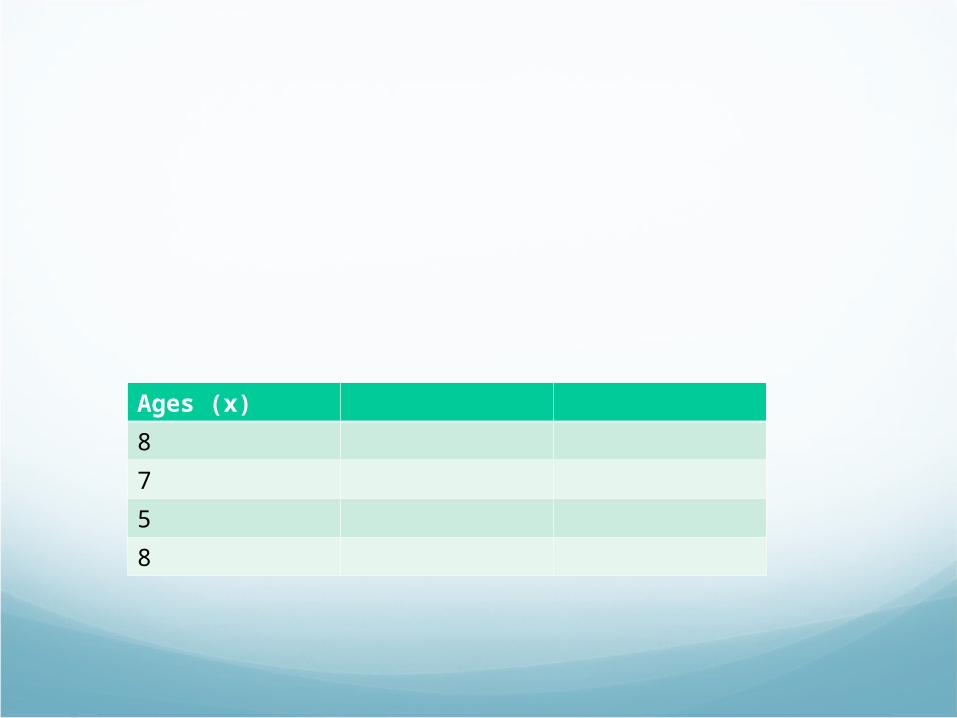
Ages (x)
8
7
5
8
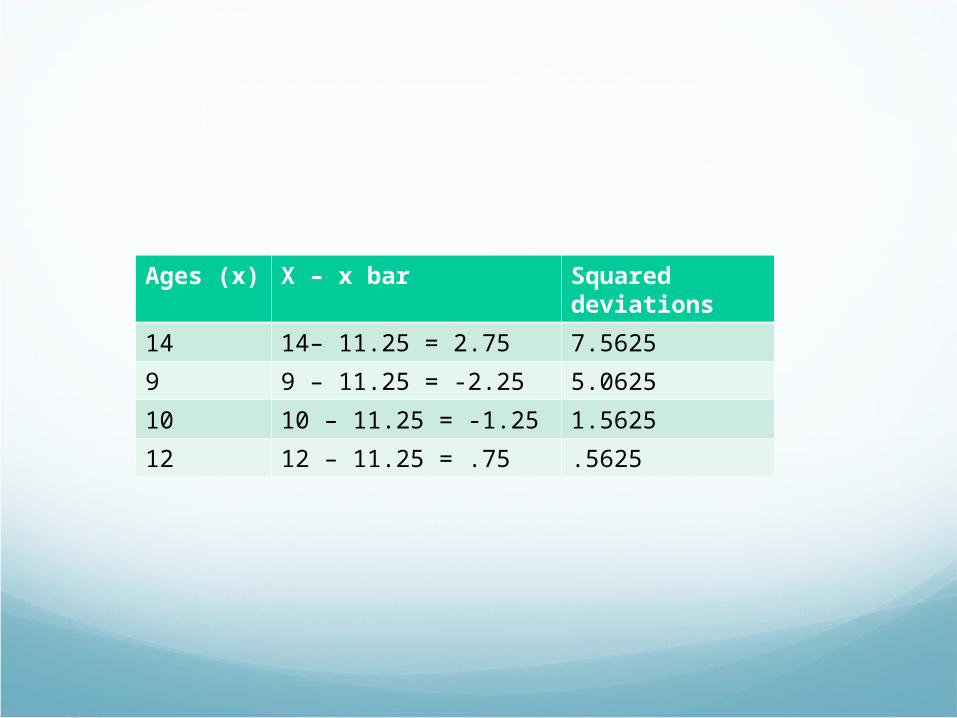
Ages (x) X – x bar Squared deviations
14 14– 11.25 = 2.75 7.5625
9 9 – 11.25 = -2.25 5.0625
10 10 – 11.25 = -1.25 1.5625
12 12 – 11.25 = .75 .5625