Embed Size (px)
DESCRIPTION
courtesy of www.alliancemagazine.orgWhat can data do for philanthropy?Data for goodLarry McGillSo, on top of everything else, foundations are supposed to compile and maintain data on their activities? And share it with other foundations? And perhaps even make it public? And do all of this willingly, because it will make philanthropy more effective? It is up to foundations to decide whether or not to do this, but it is becoming clearer every day that the answer is being thrust upon them, whether foundations ar
Citation preview
is philanthropy doing to take advantage of them?
Does philanthropy have a plan for building the kind
of knowledge base and knowledge tools that will al-
low it to identify areas of need, emerging trends, key
actors and institutions engaging in social investment
activities, patterns and gaps in the provision of aid and
other types of support, intervention strategies that
work and don’t work, and opportunities for collabora-
tion to improve on-the-ground impact?
The payoffs of having data
Collecting data on philanthropy around the world is
no small challenge. As European Foundation Centre
(EFC) chief executive Gerry Salole explains in another
article in this special feature (see p44), just trying to
count the total number of foundations in Europe is ‘an
impossible task given the level of differences that exist
between foundations within a given European coun-
try, not to mention across borders, and the constantly
mutating and changing contexts in which they oper-
ate’. Moreover, one might fairly ask, how does knowing
the total number of foundations in Europe help foun-
dations do their work anyway?
Supporting advocacy
While it may not be relevant to the work of any one
foundation, it is certainly relevant to foundations col-
lectively. A European Foundation Statute that has the
potential to facilitate the work of more than 100,000
foundations representing total annual expenditures
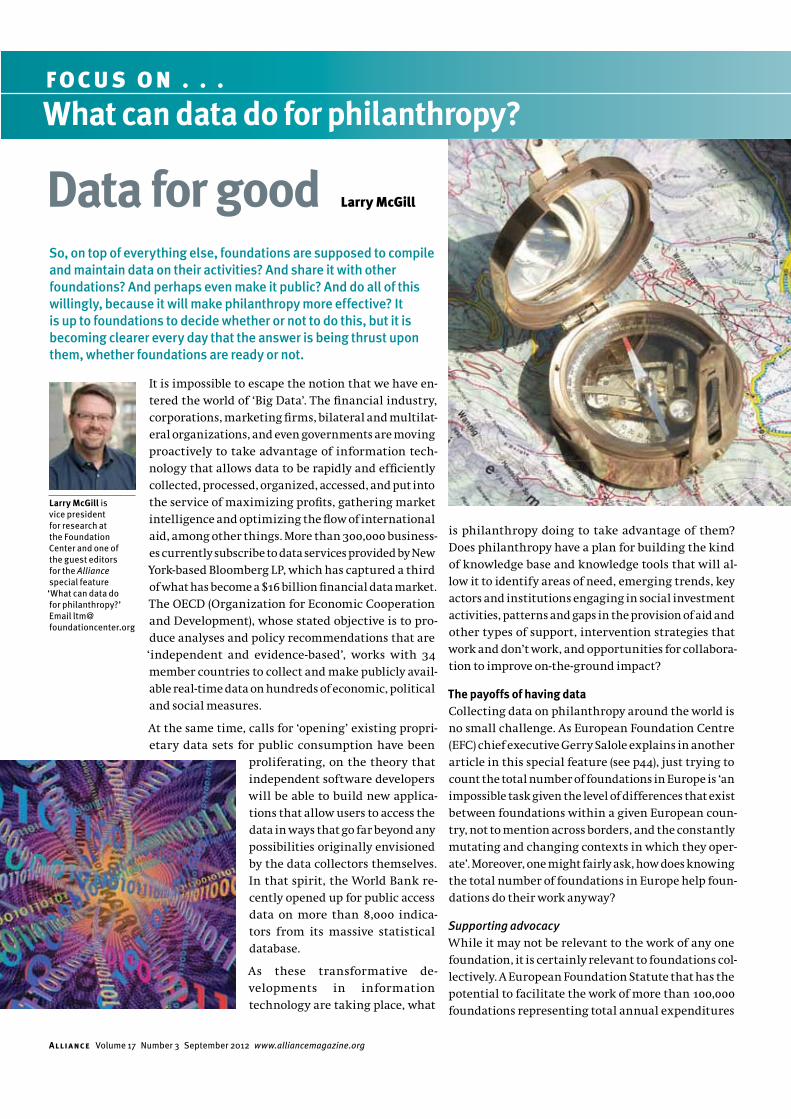
It is impossible to escape the notion that we have en-
tered the world of ‘Big Data’. The financial industry,
corporations, marketing firms, bilateral and multilat-
eral organizations, and even governments are moving
proactively to take advantage of information tech-
nology that allows data to be rapidly and efficiently
collected, processed, organized, accessed, and put into
the service of maximizing profits, gathering market
intelligence and optimizing the flow of international
aid, among other things. More than 300,000 business-
es currently subscribe to data services provided by New
York-based Bloomberg LP, which has captured a third
of what has become a $16 billion financial data market.
The OECD (Organization for Economic Cooperation
and Development), whose stated objective is to pro-
duce analyses and policy recommendations that are
‘independent and evidence-based’, works with 34
member countries to collect and make publicly avail-
able real-time data on hundreds of economic, political
and social measures.
At the same time, calls for ‘opening’ existing propri-
etary data sets for public consumption have been
proliferating, on the theory that
independent software developers
will be able to build new applica-
tions that allow users to access the
data in ways that go far beyond any
possibilities originally envisioned
by the data collectors themselves.
In that spirit, the World Bank re-
cently opened up for public access
data on more than 8,000 indica-
tors from its massive statistical
database.
As these transformative de-
velopments in information
technology are taking place, what
Data for goodSo, on top of everything else, foundations are supposed to compile and maintain data on their activities? And share it with other foundations? And perhaps even make it public? And do all of this willingly, because it will make philanthropy more effective? It is up to foundations to decide whether or not to do this, but it is becoming clearer every day that the answer is being thrust upon them, whether foundations are ready or not.
Larry McGill is vice president for research at the Foundation Center and one of the guest editors for the Alliance special feature ‘What can data do for philanthropy?’ Email [email protected]
F O C U S O N . . .
What can data do for philanthropy?
Larry McGill
Alliance Volume 17 Number 3 September 2012 www.alliancemagazine.org
business world, though, this does not guarantee im-
pact. Nor does it eliminate risk. Minimizing risk is the
only thing that foundations have any power to control.
For monitoring and learning
Once funds have been expended, there is little that
foundations can do to further influence the course
that events will take. The ‘market’ will do as it will,
as the funds catalyse events, actions and reactions
among the constituencies that are touched by the
work. But what foundations can do once funds have
been released is monitor the work and learn from the
consequences generated by it. And that, once again,
calls for the collection of data.
Just as gathering ‘market intelligence’ on what has
been tried and what works is part of the due diligence
that foundations must do before developing and im-
plementing their intervention strategies, they owe it
to the field to collect and share data on how well their
own interventions actually worked, so others can do
their due diligence as well. There must be collective
learning as well as individual learning.
In short, the two most powerful tools foundations
have for maximizing the impact of their investments
are minimizing risk and drawing lessons from conse-
quences. And both of these require data.
Who is collecting data on philanthropy and why?
To solve global problems, foundations need global data.
Organizations such as the OECD, the World Bank, the
World Health Organization and the United Nations
have developed databases that can help foundations
better understand their potential constituencies and
their needs. But what kinds of information are avail-
able on the activities of foundations themselves?
While individual foundations may share some of this
information through annual reports, websites and
other means, it is impossible to understand the net
impact of the work of foundations without engaging
in systematic efforts to collect data across foundations
in general. The need for this kind of systematic data
on foundation activities has become increasingly sali-
ent to associations of foundations that seek to develop
services to meet their members’ needs.
There are more than 100 associations of foundations
around the world, most of them organized on a na-
tional or regional basis. Most have been around for
less than 15 years and are still discovering the best
ways to serve their members. Almost all are engaged
in collecting member data on a regular basis, some-
times annually, sometimes less often. What are they
of more than !50 billion (a back-of-the-envelope esti-
mate derived from published information on the EFC
website), is more likely to pass than a statute that has
the potential to facilitate the work of an unknown
number of foundations. The work of the EFC and the
recently formed Foundation Council of Europe can
harness the persuasive power of
large numbers only if the numbers
are known.
For market intelligence
For an individual foundation,
though, what is most important is
‘market intelligence’, to borrow a
phrase from business. That means
understanding potential constitu-
encies, unmet needs among those
constituencies, mechanisms for
meeting those needs, and the work
of other organizations operating in
that market.
Understanding potential constitu-
encies means compiling data on
who they are. Where do they live?
What do they look like demographically? How do they
fit into the larger social, cultural and economic envi-
ronment in which they are situated?
Understanding unmet needs among those constitu-
encies means compiling data on the scope of the
problems or issues that disproportionately affect
them. How are specific constituencies (eg women,
people of colour, rural populations and people with
disabilities) affected by these problems or issues?
Understanding mechanisms for meeting the needs
of constituencies means understanding what types
of intervention have been tried and with what levels
of success.
Understanding the work of other organizations oper-
ating in the same ‘market’ means compiling data on
the activities of other foundations, as well as bilateral
and multilateral organizations that are working on
these problems or issues. What are their theories of
change? What types of interventions are they engaged
in? What organizations on the ground do they work
with? How does the work of your foundation fit into
this picture?
Having access to data in each of these areas minimiz-
es the risk of making poor investment decisions. Put
another way, data give foundations their best shot at
making a difference through their work. Just as in the
For an individual foundation
what is most important
is ‘market intelligence’,
to borrow a phrase from
business. That means
understanding potential
constituencies, unmet needs
among those constituencies,
mechanisms for meeting
those needs, and the work
of other organizations
operating in that market.
focus on what c an data do for phil anthropy? p33
Alliance Volume 17 Number 3 September 2012 www.alliancemagazine.org
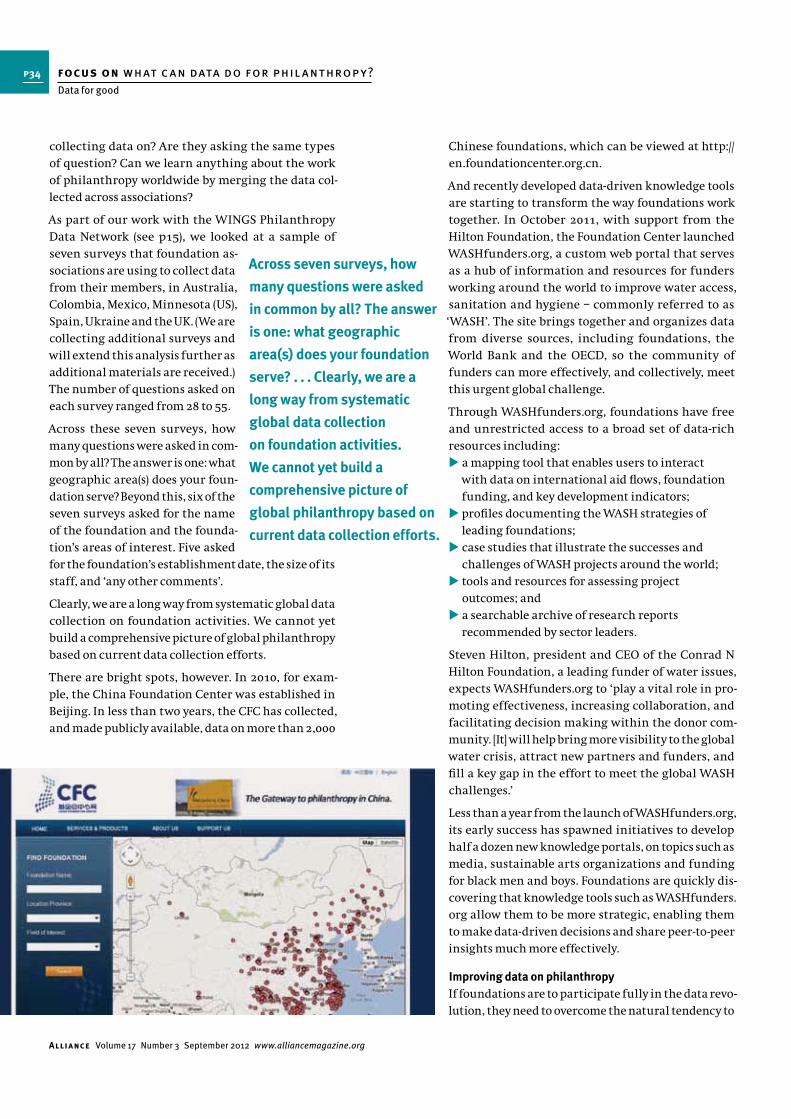
Chinese foundations, which can be viewed at http://
en.foundationcenter.org.cn.
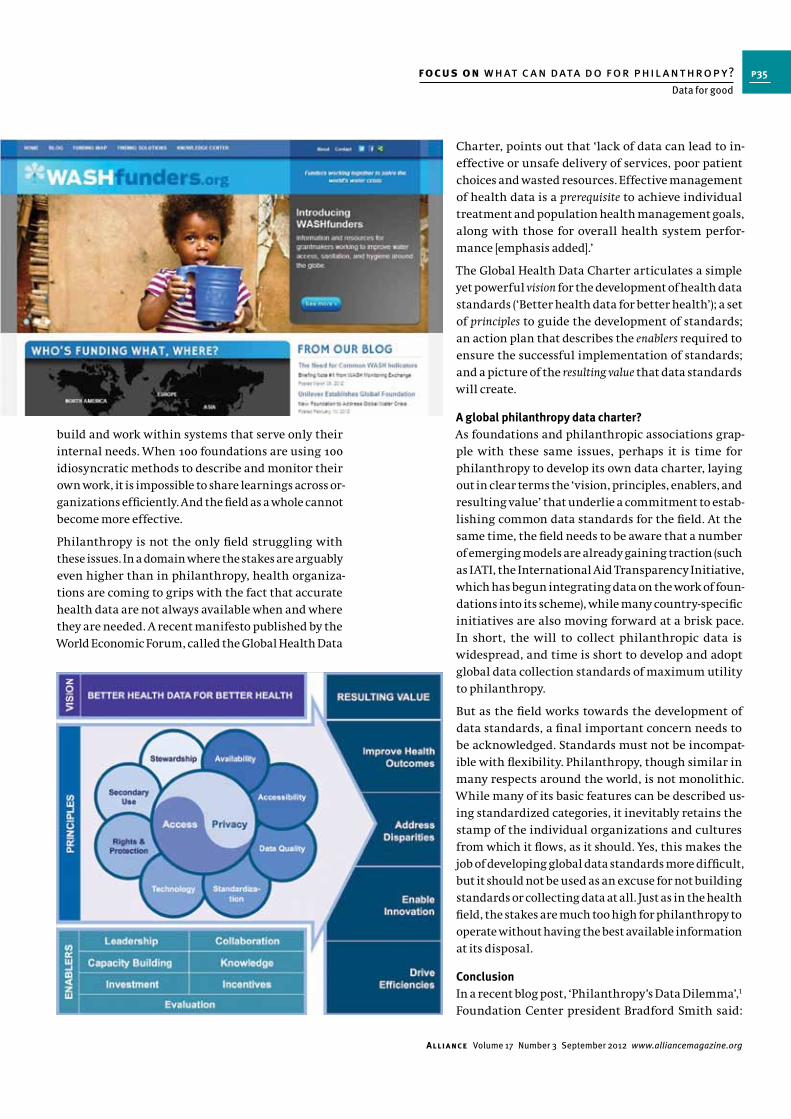
And recently developed data-driven knowledge tools
are starting to transform the way foundations work
together. In October 2011, with support from the
Hilton Foundation, the Foundation Center launched
WASHfunders.org, a custom web portal that serves
as a hub of information and resources for funders
working around the world to improve water access,
sanitation and hygiene – commonly referred to as
‘WASH’. The site brings together and organizes data
from diverse sources, including foundations, the
World Bank and the OECD, so the community of
funders can more effectively, and collectively, meet
this urgent global challenge.
Through WASHfunders.org, foundations have free
and unrestricted access to a broad set of data-rich
resources including:
a mapping tool that enables users to interact
with data on international aid flows, foundation
funding, and key development indicators;
profiles documenting the WASH strategies of
leading foundations;
case studies that illustrate the successes and
challenges of WASH projects around the world;
tools and resources for assessing project
outcomes; and
a searchable archive of research reports
recommended by sector leaders.
Steven Hilton, president and CEO of the Conrad N
Hilton Foundation, a leading funder of water issues,
expects WASHfunders.org to ‘play a vital role in pro-
moting effectiveness, increasing collaboration, and
facilitating decision making within the donor com-
munity. [It] will help bring more visibility to the global
water crisis, attract new partners and funders, and
fill a key gap in the effort to meet the global WASH
challenges.’
Less than a year from the launch of WASHfunders.org,
its early success has spawned initiatives to develop
half a dozen new knowledge portals, on topics such as
media, sustainable arts organizations and funding
for black men and boys. Foundations are quickly dis-
covering that knowledge tools such as WASHfunders.
org allow them to be more strategic, enabling them
to make data-driven decisions and share peer-to-peer
insights much more effectively.
Improving data on philanthropy
If foundations are to participate fully in the data revo-
lution, they need to overcome the natural tendency to
collecting data on? Are they asking the same types
of question? Can we learn anything about the work
of philanthropy worldwide by merging the data col-
lected across associations?
As part of our work with the WINGS Philanthropy
Data Network (see p15), we looked at a sample of
seven surveys that foundation as-
sociations are using to collect data
from their members, in Australia,
Colombia, Mexico, Minnesota (US),
Spain, Ukraine and the UK. (We are
collecting additional surveys and
will extend this analysis further as
additional materials are received.)
The number of questions asked on
each survey ranged from 28 to 55.
Across these seven surveys, how
many questions were asked in com-
mon by all? The answer is one: what
geographic area(s) does your foun-
dation serve? Beyond this, six of the
seven surveys asked for the name
of the foundation and the founda-
tion’s areas of interest. Five asked
for the foundation’s establishment date, the size of its
staff, and ‘any other comments’.
Clearly, we are a long way from systematic global data
collection on foundation activities. We cannot yet
build a comprehensive picture of global philanthropy
based on current data collection efforts.
There are bright spots, however. In 2010, for exam-
ple, the China Foundation Center was established in
Beijing. In less than two years, the CFC has collected,
and made publicly available, data on more than 2,000
Across seven surveys, how
many questions were asked
in common by all? The answer
is one: what geographic
area(s) does your foundation
serve? . . . Clearly, we are a
long way from systematic
global data collection
on foundation activities.
We cannot yet build a
comprehensive picture of
global philanthropy based on
current data collection efforts.
p34
Alliance Volume 17 Number 3 September 2012 www.alliancemagazine.org
focus on what c an data do for phil anthropy?
Data for good
Charter, points out that ‘lack of data can lead to in-
effective or unsafe delivery of services, poor patient
choices and wasted resources. Effective management
of health data is a prerequisite to achieve individual
treatment and population health management goals,
along with those for overall health system perfor-
mance [emphasis added].’
The Global Health Data Charter articulates a simple
yet powerful vision for the development of health data
standards (‘Better health data for better health’); a set
of principles to guide the development of standards;
an action plan that describes the enablers required to
ensure the successful implementation of standards;
and a picture of the resulting value that data standards
will create.
A global philanthropy data charter?
As foundations and philanthropic associations grap-
ple with these same issues, perhaps it is time for
philanthropy to develop its own data charter, laying
out in clear terms the ‘vision, principles, enablers, and
resulting value’ that underlie a commitment to estab-
lishing common data standards for the field. At the
same time, the field needs to be aware that a number
of emerging models are already gaining traction (such
as IATI, the International Aid Transparency Initiative,
which has begun integrating data on the work of foun-
dations into its scheme), while many country-specific
initiatives are also moving forward at a brisk pace.
In short, the will to collect philanthropic data is
widespread, and time is short to develop and adopt
global data collection standards of maximum utility
to philanthropy.
But as the field works towards the development of
data standards, a final important concern needs to
be acknowledged. Standards must not be incompat-
ible with flexibility. Philanthropy, though similar in
many respects around the world, is not monolithic.
While many of its basic features can be described us-
ing standardized categories, it inevitably retains the
stamp of the individual organizations and cultures
from which it flows, as it should. Yes, this makes the
job of developing global data standards more difficult,
but it should not be used as an excuse for not building
standards or collecting data at all. Just as in the health
field, the stakes are much too high for philanthropy to
operate without having the best available information
at its disposal.
Conclusion
In a recent blog post, ‘Philanthropy’s Data Dilemma’,1
Foundation Center president Bradford Smith said:
build and work within systems that serve only their
internal needs. When 100 foundations are using 100
idiosyncratic methods to describe and monitor their
own work, it is impossible to share learnings across or-
ganizations efficiently. And the field as a whole cannot
become more effective.
Philanthropy is not the only field struggling with
these issues. In a domain where the stakes are arguably
even higher than in philanthropy, health organiza-
tions are coming to grips with the fact that accurate
health data are not always available when and where
they are needed. A recent manifesto published by the
World Economic Forum, called the Global Health Data
p35
Alliance Volume 17 Number 3 September 2012 www.alliancemagazine.org
focus on what c an data do for phil anthropy?
Data for good
‘Getting foundations into the era of Big Data doesn’t
have to be a Herculean challenge. Technology is on
our side and stopping doing some things will free up
time and resources to do others.’ While he is speak-
ing primarily to an audience of US foundations, the
principles he articulates apply to all:
1 STOP trying to be unique.
2 START aligning your data with the outside world.
3 STOP developing custom grants
management systems.
4 START going beyond the minimum reporting
requirements of tax laws.
5 STOP thinking about data and communications
as two separate things.
6 START thinking about data as open.
There is a theory of change underlying the recommen-
dation that foundations join the ‘Big Data’ movement.
And like all theories of change relating to philanthro-
py, its goal is to maximize the impact of philanthropic
work. We don’t encourage the collection and use of
data for data’s sake or even as a way of improving
the efficiency of foundation practices, though these
goals are fine. At bottom, the ultimate beneficiaries of
improved data on philanthropy are, in fact, the very
people that foundations are trying to reach through
their charitable activities.
1 http://pndblog.typepad.com/pndblog/2012/07/philanthropys-data-dilemma.html
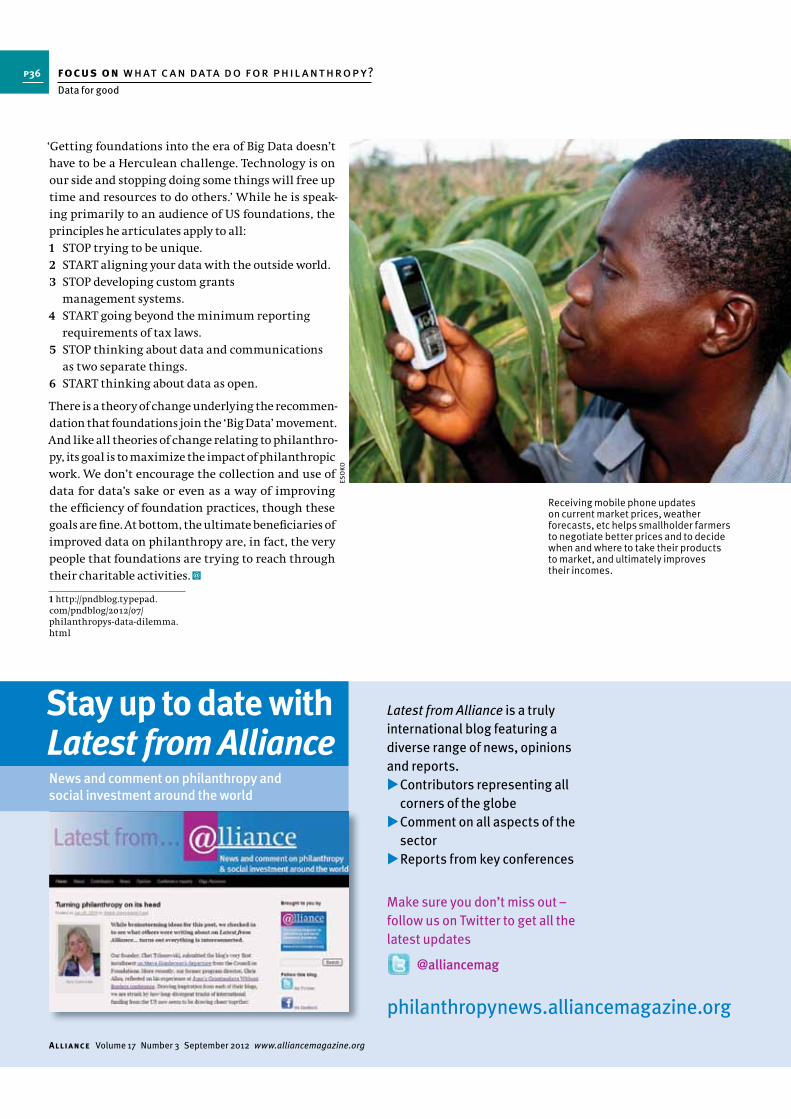
Receiving mobile phone updates on current market prices, weather forecasts, etc helps smallholder farmers to negotiate better prices and to decide when and where to take their products to market, and ultimately improves their incomes.
ES
OK
O
Latest from Alliance is a truly
international blog featuring a
diverse range of news, opinions
and reports.
Contributors representing all
corners of the globe
Comment on all aspects of the
sector
Reports from key conferences
Make sure you don’t miss out –
follow us on Twitter to get all the
latest updates
Stay up to date with Latest from Alliance News and comment on philanthropy and social investment around the world
@alliancemag
philanthropynews.alliancemagazine.org
p36
Alliance Volume 17 Number 3 September 2012 www.alliancemagazine.org
focus on what c an data do for phil anthropy?
Data for good
year. This is the kind of data that the sector needs for
policy purposes, but do you think it’s sufficient?
RG I think this first attempt shows how much we have
to do still. We need data to make society, governments
and public administrations aware of the importance
of the sector, and to give them a realistic sense of
how much we can achieve, for instance in areas from
which the state is retreating. Data are also important
for the reputation of the sector; it is important that
society knows what foundations do.
BS I often cite that study to American audiences,
and they are amazed that the assets of European
foundations are equal to or greater than the assets
of American foundations, and that the amount they
spend is roughly equivalent. It impresses on them that
philanthropy is not just something made in the USA.
RG It’s interesting that you say that because I think
it has the same effect in Europe. People are often
unaware of the strength of the sector and think that
philanthropy is much stronger in the States. One of
the areas on which we have to work – and DAFNE and
the European Foundation Centre are trying to move
towards this – is to see European philanthropy as a
whole. Most of us have been looking at philanthropy
and the foundation sector nationally. If we are to have
a European Foundation Statute, if we want a Europe of
citizens, we have to be able to prove that philanthropy
has a presence and a significance at European level.
BS People in philanthropy sometimes think ‘our data
will never be good enough, the institutions are too
individualistic, the problems are too big, it costs too
much money’, so nothing gets collected. But even
very simple data like the volume of assets collectively
of foundations and the amount spent on their
programmes can be illuminating. We are seeing this
in other parts of the world too. The China Foundation
Centre, which started two years ago, has just begun
to collect data from government sources and directly
from Chinese foundations. They have collected
data on roughly 2,500 foundations. When you tell
people that there are 2,500 foundations in China,
they’re amazed, because people don’t think of any
foundations in China. Another interesting point: over
a third of those foundations have websites, whereas a
Foundation Center survey in the US found that only
26 per cent of US foundations have websites. If you
tell American foundations that, it makes them think
about their own sector, and that they need to improve.
RG What kind of data are available about the work of
US foundations and how is it collected?
How is data on philanthropy collected and analysed
on each side of the Atlantic? What is collected,
what isn’t and why isn’t it? Bradford Smith and
Rosa Gallego of Donors and Foundations Networks
in Europe (DAFNE) compared notes and pondered
the need for collaboration between countries and
regions in an era when foundations increasingly
work across borders.
Bradford Smith What is the state of data on
philanthropy in Europe, Rosa?
Rosa Gallego It’s quite uneven, and this is one of our
big challenges. Foundations do collect data, but they
often do it very much on an individual basis and
don’t think how it could be done collaboratively and
in a way that could maximize its use for the sector
in general. I am afraid that data collection is not yet
a major topic for the majority of the sector. There
could be various reasons for this. One is that it is not
seen as the tool that will allow foundations to do
their work better, but maybe more important is that
they see it as too expensive and time-consuming.
BS When the project to create the European
Foundation Statute was first conceived, the
European Union commissioned a study2 which,
among other things, had some very interesting
estimates of the assets of European foundations and
the amount they spend on their programmes every
A conversation Rosa Gallego and Bradford SmithIn his blog ‘Philanthropy’s Data Dilemma’1 Foundation Center president Bradford Smith argues: ‘The time has come for foundations to start thinking about everything they do as data.’ He goes on to argue that: ‘most of the (increasingly digitized) concept notes, project proposals, progress reports, evaluations, research, and strategy deliberations produced by foundations are unavailable for mining within individual foundations, across the field, or by anyone else interested in understanding philanthropy’s immense contribution to making a better world . . . If, and only if, foundations are willing to create the habits and systems needed to more freely share their information with each other and with others will the industry that is philanthropy fully be able to take advantage of the era of Big Data and all that it promises.’
Rosa Gallego is chair of DAFNE and deputy director of the Spanish Association of Foundations. Email [email protected]
Bradford Smith is president of the Foundation Center. Email [email protected]
focus on what c an data do for phil anthropy? p37
Alliance Volume 17 Number 3 September 2012 www.alliancemagazine.org
BS In one way, it’s easier because the US is a single
country, not a union of countries like Europe. All US
foundations have to submit a tax document called a
990 PF (private foundation) and it has to be available for
public inspection. The Foundation Center gets these
documents in bulk from the Internal Revenue Service
and can produce data from them.
The downside is that this is a
compliance document, not a data
collection instrument, so it has its
weaknesses as a data source.
The other problem is that there’s
tremendous variation in the
way foundations complete this
document. In the US, everyone
thinks of the big professional
foundations – Ford, Rockefeller,
Mott, Gates. But in a survey we did of a representative
sample of 11,000 foundations, 76 per cent had four
staff or fewer, and, as I mentioned earlier, only
26 per cent had websites. There are thousands of
foundations that are simply a husband and wife and
an accountant. Some of these documents are filled out
in pencil, whereas the Gates Foundation is filing theirs
electronically.
Interestingly, the IRS sends these forms to us in image
form, requiring that they must all be converted into a
form which we can load into a database. Foundations
are supposed to attach a list of all the grants they make
– the organizations they made them to, the amount and
the purpose. Sometimes they don’t put the purpose, or
they misspell the name of the organization or put an
acronym instead; all this means that the data have to
be cleaned. But the fact remains that there is a basic
data source about the sector, which is a huge asset.
RG Absolutely. In Spain, one of the barriers is that,
although foundations have to submit their annual
accounts to the supervising authority, there is not yet
a standard form for providing that information – but
we are working on it and we hope there will be one
next year. However, it will not be in electronic form,
so we will have to do the same work that you do to
extract the data from the document, and we don’t have
enough resources for this. Perhaps because of that, we
only consider a small number of items, like income,
expenditure and assets. We don’t, for instance, try to
ascertain whether the source of the income is public or
private, or whether it’s regular. Another source of data
is to ask foundations directly, which we also do.
BS As you mentioned, philanthropic institutions are
all quite individualistic, and a field that is made up
of individualistic institutions often thinks of itself as
unique. People in philanthropy have this myth about
the private sector that everything is very organized
and efficient, but we’ve been talking with Bloomberg
LP and they tell us that they have similar challenges.
We have people actually sitting reading tax returns,
hand-copying information and keying in data, and
they have the same thing in the corporate sector! So
we shouldn’t let the obstacles be a reason not to do
things. The other thing is that technology is getting
better, so the problems of automatic scanning and
coding will gradually be solved, and it will become
cheaper to do this.
RG I think we as representative organizations have a
role in convincing our members about the importance
of data. How are we going to represent the sector if we
cannot tell society or governments what the sector
does and how it does it? If foundations have come
together in a platform, like the Spanish Association of
Foundations, or any other national or supranational
association, it is because they feel that working
together will make it easier to defend the interests of
the sector, but of course we can do that only if the data
are there. We can be very good at making proposals
on how to improve the legal environment or the
fiscal framework, but we will be able to achieve those
goals only if we can demonstrate the importance of
those changes.
BS It’s getting easier to show people the value of data
because of data visualization. Virtually everyone in
our sector uses some kind of mapping application on
their mobile device. They probably pick restaurants or
go to movies using software that rates and visualizes
things. There are vast amounts of data behind this,
but it is presented to them in a way that solves, very
simply, a need they have. I think we could do a lot
more with data visualization in our sector. Even
just by using an interactive map that shows where
foundations are located in a country, by province
or by city, and showing the assets, the volume of
programmes and the types of programmes. There are
ways in which we can make this data come to life so
that people will begin to see it as useful.
RG You are very much the avant garde in this respect,
and we all need to be thankful for the fact that the
Foundation Center has decided to reach out and
work in other areas of the world. And WINGS will
help to spread those advances in data collection, and
‘How are we going to
represent the sector if
we cannot tell society
or governments what
the sector does and how
it does it?’
Rosa Gallego
p38
Alliance Volume 17 Number 3 September 2012 www.alliancemagazine.org
focus on what c an data do for phil anthropy?
A conversation: Rosa Gallego and Bradford Smith
particularly in data visualization, in other countries.
We are not as advanced as you, and we never will be,
because it is not our main activity, but by cooperating
with you and WINGS, we will benefit from your work
and tools, and it will be easier to show foundations
in the different European countries the importance
of data.
BS As is often said, we live
in a networked world and
organizations need to develop
a networked style of thinking.
Basically we work across
borders and across fields, using
the comparative advantages
and strengths of different
organizations to contribute to the social good. The
relationship that the Foundation Center has with
WINGS, and the relationship that WINGS has with
DAFNE and DAFNE’s members, for example, mark
the beginning of thinking more like a network and
adding up the strengths and capabilities of our
different organizations. The Foundation Center
is not a membership organization, so we aren’t
representative in the way that you are. What we’re
good at is data collection and data visualization.
WINGS was a tremendously visionary idea, created
before anyone imagined that something like it
would be necessary. It was based on the idea that
philanthropy is global, that there are support
organizations everywhere that make it better
and defend the sector, and that these support
organizations could achieve a lot by sharing their
experience and building on each other’s strengths.
The challenge now is how to take advantage of
this wonderful organization and help it to live
up to its potential, especially in this area of data.
WINGS has the structure and the potential to
talk to organizations like the World Bank and the
International Monetary Fund and say ‘here’s what
philanthropy is doing in Asia, or globally’, because
increasingly people want to know.
RG This is a bit like what I was talking about before,
in Europe. We need to have a picture of philanthropy
at European level and in each of our countries,
because we want to be able to show the strength of
the whole continent in philanthropy.
BS You mentioned that some foundations are
collecting data in a given sector or on a given issue.
It’s important to recognize that there are groups
of foundations that have decided to work together
on issues like immigration, or disability rights,
or whatever, that have engaged in collecting and
sharing information.
RG Yes, these are good examples of the importance
of collecting data. It is interesting to look back at the
work of some of these foundations and to recognize,
for instance, the improvements in legal status for
certain groups, like disability groups, that have been
achieved over the past few decades. When you talk
to them, they always cite the data that support those
improvements. These examples also provide a way
to encourage foundations to work towards policies
beside the individual projects they might be working
on.
BS Examples of this are occurring across borders in
Europe. There is a project we have been involved in
with the International Human Rights Funders Group
and Ariadne, the European association of human
rights funders. Its aim is to collect data to understand
the level of human rights philanthropy and the trends
within it: by region, by different kinds of rights, by
sub-issues. It has been incredibly interesting. Both
European and American foundations, and some in
other parts of the world, have been very willing to
provide data because they want to be able to say ‘this
is what philanthropy is doing around the world for
human rights’ and to see the advances and changes.
I’d add one caution. When some foundations think of
data, they think of it as being provided by the people
they support rather than themselves. They need to
make sure they have the ability to use all the data
their partners collect, because collecting it is a lot of
work for them.
RG As a last word, I’d like to add that we at DAFNE
are very happy to be part of this pilot of cooperation
between the Foundation Center and WINGS. We
eagerly await some feedback on the information we
are passing on to you. We are always delighted to
see it presented it to us in a totally different form;
it makes us think in different ways. It is a very
interesting adventure!
BS Yes, the same goes for us. Transatlantic and global
collaboration is the future of our field. It’s a really
exciting time to be working in philanthropy and
research and data. When it comes to data, the glass is
half full.
1 http://pndblog.typepad.com/pndblog/2012/07/philanthropys-data-dilemma.html
2 http://ec.europa.eu/internal_market/company/eufoundation/index_en.htm
See p15 for information about the WINGS Philanthropy Data Network, a new collaboration between the Foundation Center and WINGS.
‘It’s a really exciting time to
be working in philanthropy
and research and data.
When it comes to data, the
glass is half full.’
Bradford Smith
p39
Alliance Volume 17 Number 3 September 2012 www.alliancemagazine.org
focus on what c an data do for phil anthropy?
A conversation: Rosa Gallego and Bradford Smith
what they present is a true reflection of a particular
aspect of the sector. Otherwise we run the risk of
being misunderstood or misinterpreted. I am not ad-
vocating secretiveness, but we should be conscious of
the audiences for which data are intended and frame
them accordingly.
I also think that data we produce for the public should
be simple and self-explanatory. We badly need more
of this kind of basic data for our own community too.
How many foundations are there? How much do they
give annually? How many people benefit from their
grants and programmes? Data like these can raise
public awareness and promote public debate about
philanthropy.
My experience is that the best way of collecting and
presenting data for this purpose is through indexes
and ratings. A fairly simple Charities Aid Foundation
World Giving Index produces more media referenc-
es than anything we have done in Russia in the last
18 years! I see three major benefits in such indexes:
they answer a basic framing question (how many
people give to charity in the world?), they present
very easy-to-read trends (our country is doing bet-
ter from year to year) and they are comparative (we
are doing better than our neighbours). This is attrac-
tive for the media and understandable to the public.
An additional value of indexes and ratings may be
in setting up targets for government policy. For ex-
ample, the Russian government has made strides to
improve Russia’s position in the World Bank’s Doing
Business index.
The great disadvantage of indexes is that they reduce
complex ideas to very basic figures, and their method-
ology is usually criticized by research specialists. But
they are good for giving vivid snapshots that invite
interpretation and discussion, and they provide an
opportunity to introduce details to the public that
they would otherwise not be prepared to digest.
Some philanthropy professionals badly need complex
data to facilitate professional exchange, partnerships,
learning and sharing. Many more people, including
foundations’ constituencies and regulators, need sim-
ple data that can help them to understand what our
sector is really about. If I had to choose how to deploy
my limited resources, I would go for the latter.
There is this widely known saying: ‘When you’ve seen
one foundation – you’ve seen one foundation.’ The greatest
difficulty for collecting data about foundations is that
they are all so different that generalizations hardly
work. I am part of a Russian Donors Forum working
group that is developing a framework for mapping
Russian foundations so as to have reliable data about
the philanthropic sector in Russia. To come up with
a universal questionnaire, we had to abandon a lot
of important details: either the questions were not
sufficiently widely applicable or we knew that foun-
dations would not be able to provide the information
for technical reasons or the information would not
be comparable. But details are important! So when
we collect data and present them in an aggregated
form or according to a general standard, we may end
up with ‘average temperature in a hospital’, losing
important details or losing the point altogether.
A classic example: there is no standard framework
for foundations’ financial management informa-
tion, so asking how much they spend on grants, their
own programmes and administration will produce
non-comparable data – foundations simply count dif-
ferently. And this is not just a Russian problem. I once
did a quick review of annual reports of a few large US
and European foundations with the same question
about their budgets in mind and ended up with lots
of line items and figures that were as different as ap-
ples and oranges.
We should be particularly aware of these limitations
where data are presented to the public. In many
countries, Russia included, public awareness about
philanthropy is limited and charities and founda-
tions are often not trusted. All too easily the public
may see in our data something completely different
from what we intended. Data for public use therefore
need a lot of context and interpretation to ensure that
Data for what?As I see it, the key tension when it comes to data is between the general desire to have data about everything in all possible detail and its ultimate usability. The most popular generic project idea in data development is creating a database and making it available online for everyone’s use. I come across projects like this in different philanthropy-related areas every other month. Their creators sincerely believe that a database will foster transparency and cooperation, help to avoid duplication, and generally solve pretty well all the problems of the sector. I am not so sure.
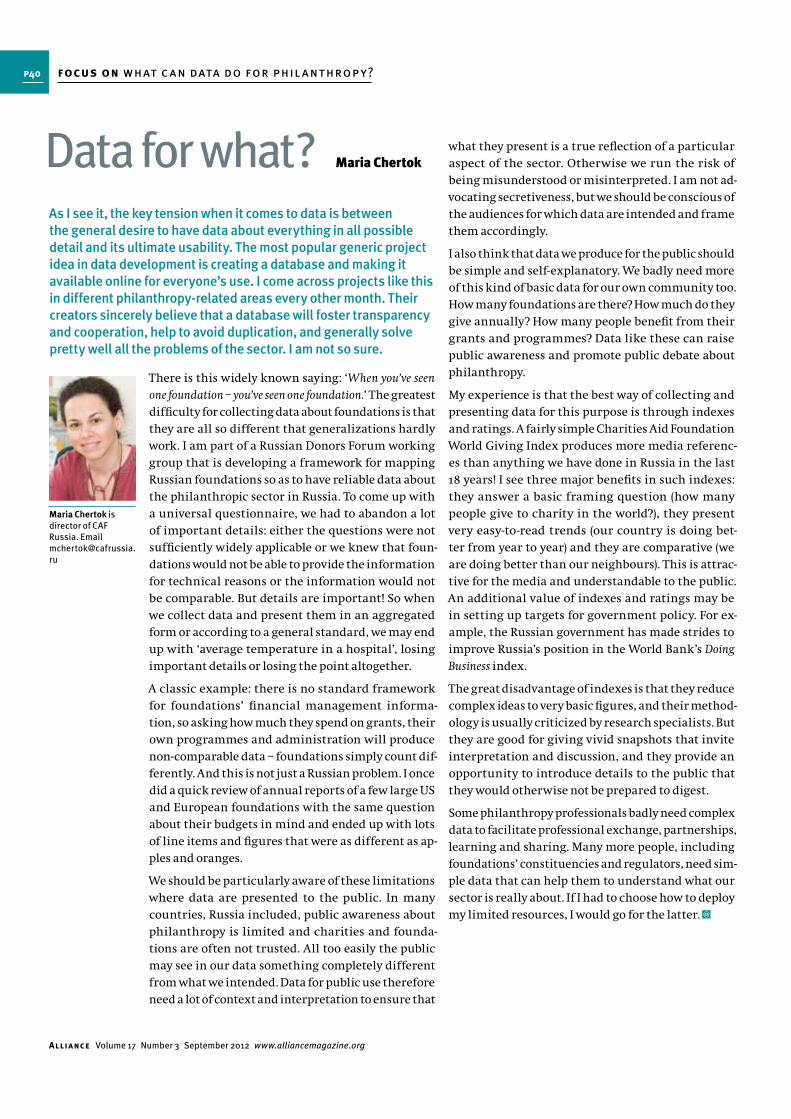
Maria Chertok is director of CAF Russia. Email [email protected]
Maria Chertok
focus on what c an data do for phil anthropy?p40
Alliance Volume 17 Number 3 September 2012 www.alliancemagazine.org
just at US grantmaking foundations and not operat-
ing foundations, whereas for European foundations
both were taken into account because there are no
legal distinctions in Europe between operating and
grantmaking foundations. This example shows that
focusing on global data can sometimes become an in-
tergalactic exercise and that the added value has to be
carefully looked at.
It is easy to talk of data-driven knowledge but knowl-
edge is not a construct of accumulated data. In systems
thinking, a distinction is made between soft and hard
approaches and both are relevant. The hard system
thinkers develop models of a part of the world. Soft
system thinkers are aware that an objective represen-
tation of reality is not possible and that the observer is
also a factor. Without making things too complicated,
it seems that pragmatically speaking one cannot rely
on only one approach.
‘Knowledge of what is does not open the door directly
to what should be’
Data gathering is a time-consuming and expensive
exercise and there is a risk that smaller charities and
foundations will be confronted with a kind of digital
divide because they do not have the staff or the budget
to compile and maintain data on their activities.
On top of that, some move too quickly from the idea of
data providing transparent information on charities
and foundations towards the idea of a tool for bench-
marking and labelling based on this data gathering.
As I’ve mentioned, reality is too complex to be based
on quantitative data only. People who want to use qual-
ity labels have of course their own value systems. To
make those quality labels and benchmarks credible,
it is essential that they are constructed involving all
the stakeholders, especially those who will be judged:
charities, foundations and associations. Foundations
and charities don’t exist in a vacuum; they are embed-
ded in a community, small or large.
In flying these warning flags, I don’t want to underplay
the importance of data gathering in the foundation
sector. Other warning flags could be added, too. This
should not stop us investing in this new ‘unnatural
resource’, but in dealing with our challenges, we have
to accept their complexity.
‘Perfection of the means and confusion of the ends
seem to characterize our age’
So that we don’t have more and more surveys dropping
into our mailbox, it is vital that we reflect in advance
on the use and added value of the data being gathered.
Data gathering is expensive in terms of both budget
and time allocation. It is important that everyone in
the sector grasps this and uses data gathering care-
fully, avoiding overdose and mindful of budgetary
trade-offs.
The danger is that surveys ask for too much data,
forgetting that in reality only a few are needed for ad-
vocacy and policy purposes. It is also easy to forget that
data are often relevant only if one can compare them
year by year. This means that data gathering needs to
be structurally embedded in an organization and that
the budget needs to be guaranteed for more than just
a one-off exercise.
Along the same lines, if one pleads for transparency
in the foundation sector, there should be an agree-
ment about what really matters in this debate. We
should avoid creating ‘transparency about trivial
matters’, as Phil Buchanan of the Center for Effective
Philanthropy has put it.
‘Information is not knowledge’
It is of course a no-brainer to say that using data can
simplify reality by looking at it through a specific lens.
This can of course be very useful as long as we remain
conscious of it. Data have to be put in a context and the
real story of foundations is in the details.
Some years ago a European Commission study stated
that European foundations were bigger in terms of
endowment and expenditure than their US counter-
parts. This made sense only because the study looked
Three cautions about dataAlliance’s making the issue of data central to this edition is very timely. Few people will doubt or question the importance of data in our professional context. I am sure this ‘new asset class’ will be in the centre of discussions in the philanthropic sector for the next few years. As is often the case, though, when a new item is put on the agenda, there is a danger of overpromising. Let me just counterbalance some of what is written here with three warning flags, each under the heading of a quote of Einstein.
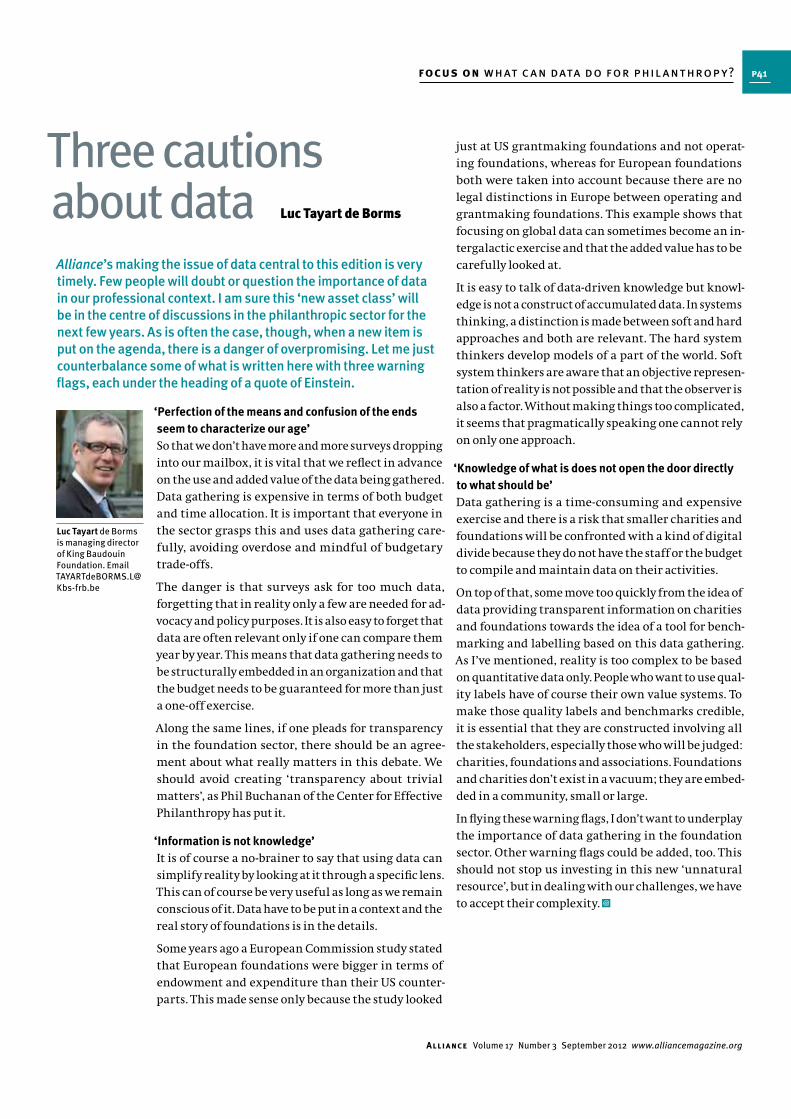
Luc Tayart de Borms is managing director of King Baudouin Foundation. Email [email protected]
Luc Tayart de Borms
focus on what c an data do for phil anthropy? p41
Alliance Volume 17 Number 3 September 2012 www.alliancemagazine.org
their ‘most emailed articles’. All of this is changing
not just business models but what gets written, what
gets read, and what gets talked about.
Medical research is another example. For centuries
we’ve relied on the ‘scientific method’ of hypothesis
– experiment – analysis – hypothesis. Now, massive
data sets of diagnostic information, chemical trials,
tissue registries and patients’ testimonies are being
combined and mined and algorithms are being used
to search for patterns before any kind of hypothesis is
generated. Drugs designed for one disease may fail dis-
mally in their original sphere but be a breakthrough
success in an otherwise unrelated field. Not only are
the resulting pharmaceutical protocols different, the
whole scientific method is changing.
Drawing from and contributing to a common store
When we try to imagine what data will mean for phi-
lanthropy, we need to switch the order of things. We’re
coming from an age in which discrete philanthropic
preferences have trumped shared action. In the age of
data, collective sets of information will come first and
individual philanthropists will tap into it. In the fu-
ture there will be treasure troves of accessible, usable
data on everything from poverty to illness, cultural
performance to environmental indicators, child wel-
fare to human rights, commodities prices to market
locations. Anyone with a mobile phone will be able
to tap into these. Individuals will be able to use this
information to find opportunities for volunteering,
giving or investing. They will contribute to these data
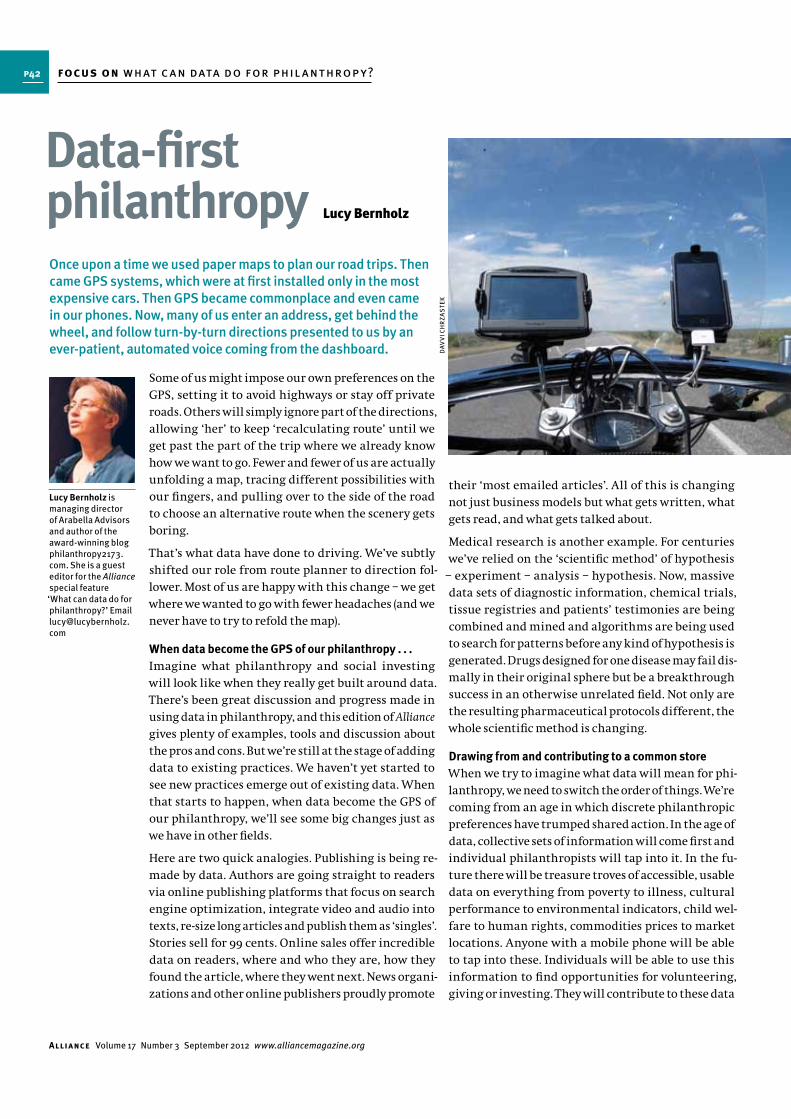
Some of us might impose our own preferences on the
GPS, setting it to avoid highways or stay off private
roads. Others will simply ignore part of the directions,
allowing ‘her’ to keep ‘recalculating route’ until we
get past the part of the trip where we already know
how we want to go. Fewer and fewer of us are actually
unfolding a map, tracing different possibilities with
our fingers, and pulling over to the side of the road
to choose an alternative route when the scenery gets
boring.
That’s what data have done to driving. We’ve subtly
shifted our role from route planner to direction fol-
lower. Most of us are happy with this change – we get
where we wanted to go with fewer headaches (and we
never have to try to refold the map).
When data become the GPS of our philanthropy . . .
Imagine what philanthropy and social investing
will look like when they really get built around data.
There’s been great discussion and progress made in
using data in philanthropy, and this edition of Alliance
gives plenty of examples, tools and discussion about
the pros and cons. But we’re still at the stage of adding
data to existing practices. We haven’t yet started to
see new practices emerge out of existing data. When
that starts to happen, when data become the GPS of
our philanthropy, we’ll see some big changes just as
we have in other fields.
Here are two quick analogies. Publishing is being re-
made by data. Authors are going straight to readers
via online publishing platforms that focus on search
engine optimization, integrate video and audio into
texts, re-size long articles and publish them as ‘singles’.
Stories sell for 99 cents. Online sales offer incredible
data on readers, where and who they are, how they
found the article, where they went next. News organi-
zations and other online publishers proudly promote
Data-first philanthropyOnce upon a time we used paper maps to plan our road trips. Then came GPS systems, which were at first installed only in the most expensive cars. Then GPS became commonplace and even came in our phones. Now, many of us enter an address, get behind the wheel, and follow turn-by-turn directions presented to us by an ever-patient, automated voice coming from the dashboard.
Lucy Bernholz is managing director of Arabella Advisors and author of the award-winning blog philanthropy2173.com. She is a guest editor for the Alliance special feature ‘What can data do for philanthropy?’ Email [email protected]
Lucy Bernholz
DA
VV
I CH
RZ
AS
TE
K
focus on what c an data do for phil anthropy?p42
Alliance Volume 17 Number 3 September 2012 www.alliancemagazine.org
sets with location-based check-ins and social network
status updates. Institutions will be able to combine
and visualize subsets of these data according to their
own stated interests, slicing, dicing, recombining and
contributing their findings back to the shared store-
houses. From within these commonly shared, curated
and cleaned, and constantly up-
dated storehouses of bits and bytes,
philanthropic institutions will
pull down what they need, query
and model according to their inter-
ests, and automatically share again
for others to consume.
Similarly, data on impact investing,
public funding, corporate social
responsibility contributions and
philanthropic giving will be avail-
able, comparable and mixable.
Mapping revenue flows by issue,
geography, intent and source will
be an easy first step before plan-
ning one’s resource allocation.
Even before this has happened we can see how readily
available data ease the creation of shared metrics and
thus make possible the comparisons and exchanges
necessary for impact investing. What will happen
when turning to data first is the natural first step in
all private resource allocation? When working from
shared data becomes as much second nature as typ-
ing an address into the GPS, we will start to see real
change in philanthropic practice.
In the world of online data
Passion and personal interests won’t disappear –
they will just operate in a different environment.
Abundant, accessible and meaningful data aren’t
going to change human nature, but they may well
change reporting requirements, expectations of suc-
cess and ease of joint action. Which may well, in time,
shift patterns of human behaviour about giving time,
money and expertise.
In the world of online data, information and money
take the same form (electronic bits) so it’s easier to im-
agine individual donors piggybacking on the research
of big funders while also crowdfunding discrete pro-
jects as a habit, not just as a special event. Flash mobs
of ‘doers’ and ‘donors’ who can find each other and
the information they need with their mobile phones
(which now outnumber people on the planet) will
come together, make something happen, and move
on to the next network. We may make institutions of
these kinds of relationships and invent new forms of
governance to demonstrate their reliability or hold
others accountable. Privacy concerns about personal
data will have already changed laws and corporate
practice so that each of us knows we own our data
in the same way we own our clothes. We might lend
the data on a one-time basis for economic research
or donate it in perpetuity to science, making data a
philanthropic asset as well as an input and output.
Finally, we may recognize the public value of philan-
thropically funded data, and change our regulations
to value the data and access to them. No longer will
we discuss philanthropy first and foremost in terms
of dollars donated but we will also consider wisdom
and knowledge generated.
The discussions philanthropy needs to have
Not everything about the digital data future is good or
even better than what we have now. Nor will data, any
more than any other technological innovation, be dis-
tributed evenly or be free from abuse. The challenges
and problems of big data are as big as the data them-
selves. And so too are the opportunities. The truth is,
we don’t know what it means to live in a world where
information about us, in ever finer particles, is stored
for ever longer periods of times by ever more distant
enterprises.
I don’t know when this future will come but I do know
this – people who have grown up with digital data –
massive, connected, searchable, mixable, always
available data – are going to shape the philanthropic
fortunes and practices of this century. The discus-
sions about ownership, privacy, governance, borders,
security and innovation that are taking place now in
industries like publishing, at multilateral organiza-
tions like the World Bank, and among governments
from Brazil to Kenya, are the very same ones that
philanthropy needs to have.
Imagine what philanthropy
and social investing will look
like when they really get built
around data. We haven’t yet
started to see new practices
emerge out of existing data.
When that starts to happen,
when data become the GPS
of our philanthropy, we’ll see
some big changes just as we
have in other fields.
focus on what c an data do for phil anthropy? p43
Alliance Volume 17 Number 3 September 2012 www.alliancemagazine.org
Gerry Salole at the European Foundation Centre
(EFC) notes a change over the last years in the kinds
of information the EFC collects. ‘In the past, our focus
was putting a figure on the size, scope and financial
footprint of the sector in Europe, while also collecting
anecdotal examples of the type of projects and pro-
grammes our members were supporting.’ Given the
state of data on the field at the time, he says, that was
entirely appropriate. Now he sees two changes which
betoken for him the European foundation sector’s
coming of age. One is a trend towards ‘a deeper un-
derstanding of foundations’ contribution in specific
thematic areas’. In this regard he cites recent studies
on supporting women’s issues, commissioned by Mama
Cash, and on the environment, commissioned by the
European Environmental Funders’ Group. The second
sign of maturity is ‘the growing interest in qualitative
data and in better understanding the practices under-
lying the work of our community’.
By contrast, Noshir Dadrawala notes that very little
data is collected in India, which means that most of the
figures produced about the sector are speculative and
often unreliable. ‘NGOs in India are believed [our italics]
to raise Rs 40,000–Rs 80,000 crores [US$7 billion–US$14
billion] per annum,’ he says. He cites the data produced
by the Central Statistical Institute of India suggesting
that the country has ‘3.3 million NGOs or almost one
NGO for every 400 Indians. Of course,’ he says, ‘this data
is quite flawed.’ The Ministry of Home Affairs collects
data on foreign contributions, the World Bank has data
on remittances sent home to India from the diaspora,
and Bain & Co has been collecting and publishing some
data on individual giving over the past couple of years,
but there is no single source of information on the in-
flows and outflows of money to the Indian non-profit
sector.
What’s missing?
In most cases, it is unclear where foundation or
non-profit money comes from and where it goes. For
Dadrawala, what’s lacking in India for both HNWIs
Who collects what and why?
On the face of it, the organizations represented by
the various respondents already collect a formidable
amount of information. WINGS, says Helena Monteiro,
collects data on grantmaker support organizations
and community foundations worldwide. The Africa
Grantmakers Affinity Group (AGAG), says Niamani
Mutima, collects ‘basic information about the Africa
funding portfolio of our members and other Africa
grantmakers’. The information is used ‘in various
ways to elevate Africa’s profile within the philanthrop-
ic community. On a broad level, it is used to paint a
snapshot of the landscape of grantmaking by private
foundations.’
The Council on Foundations in the US, says Mark
Bolgiano, ‘collects data on what connects people and
organizations in topical, local, regional, national and
global networks so that we can bring them together to
do great things collectively that would be difficult or
impossible to do individually.’ This already gives a clue
to one virtue of data which most of our respondents
cited: its use in facilitating collaboration – of which
more below.
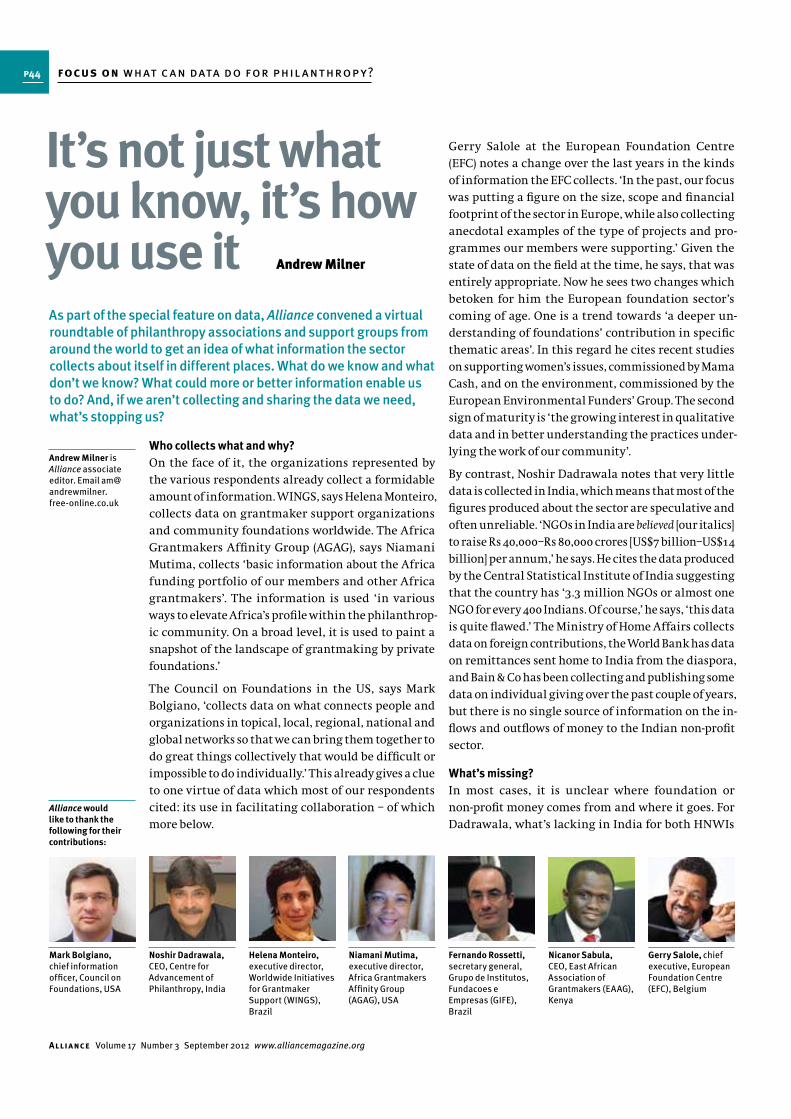
It’s not just what you know, it’s how you use it As part of the special feature on data, Alliance convened a virtual roundtable of philanthropy associations and support groups from around the world to get an idea of what information the sector collects about itself in different places. What do we know and what don’t we know? What could more or better information enable us to do? And, if we aren’t collecting and sharing the data we need, what’s stopping us?
Andrew Milner is Alliance associate editor. Email [email protected]
Mark Bolgiano, chief information officer, Council on Foundations, USA
Noshir Dadrawala, CEO, Centre for Advancement of Philanthropy, India
Helena Monteiro, executive director, Worldwide Initiatives for Grantmaker Support (WINGS), Brazil
Niamani Mutima, executive director, Africa Grantmakers Affinity Group (AGAG), USA
Fernando Rossetti, secretary general, Grupo de Institutos, Fundacoes e Empresas (GIFE), Brazil
Nicanor Sabula, CEO, East African Association of Grantmakers (EAAG), Kenya
Gerry Salole, chief executive, European Foundation Centre (EFC), Belgium
Andrew Milner
Alliance would like to thank the following for their contributions:
focus on what c an data do for phil anthropy?p44
Alliance Volume 17 Number 3 September 2012 www.alliancemagazine.org
and ordinary Indians is information on who gives,
how much and to whom. Niamani Mutima makes a
similar point. ‘While the focus is often on the amount
of money being spent,’ she says, ‘I am not so sure the
amount is as important as why and how.’ For instance,
‘when a foundation or group of foundations have put
significant investment in organiza-
tions in a country and been a part
of building the field in an area and
then decide to stop, I really do want
to know more about why they made
that decision.’ The rationale for
such changes, she feels, is often re-
stricted to ‘corridor conversations
or informal telephone calls’ and is
seldom made public.
Nicanor Sabula of the East African Association of
Grantmakers (EAAG) would also like to know the
amounts of money committed to philanthropy
annually in his region and the contribution of philan-
thropy to the GDP of the various East African countries.
Fernando Rossetti of Grupo de Institutos, Fundacoes
e Empresas (GIFE), speaking of Brazil, says that ‘the fi-
nancial information (where the money comes from and
where it goes) offered by foundations and the govern-
ment is still very “rough” and “dirty”’.
On the whole, the amounts contributed by philan-
thropy are less of an issue to those in Europe and the
US. For them perhaps a more significant question is
what effect the resources of the sector are having.
Niamani Mutima observes that
she would ‘like to know about what
philanthropy is learning’. There are
plenty of sources of information on
individual organizations, says Mark
Bolgiano, and that’s fine for looking
at them individually, but what’s
lacking for him is data ‘on the philanthropic sector in
the aggregate, which makes it difficult for those in the
sector to get data about its scope and impact’.
Gerry Salole doesn’t believe we need more information.
Instead, he argues, we need sharper thinking on ‘how
we can bring all this information together to inform
our work and provide a clearer understanding of the
sector’.
What is data needed for?
And not only for those in the sector. Good and reliable
data on philanthropy, says Noshir Dadrawala, could
help government set better policies while giving would
become better informed. ‘Our capacity to advocate and
to offer tools and services for the growth and develop-
ment of philanthropy worldwide is impaired due to
lack of data,’ believes Helena Monteiro.
Strategic planning would be enhanced with more and
better data, agrees Fernando Rossetti: ‘partnerships
would be facilitated; grantseekers would have an easier
time.’ Better information would enable East African
grantmakers to avoid duplication and mobilize their
resources more effectively, says Nicanor Sabula.
‘It would be great to have “real time” information
about the organizations currently being supported
as well as information about funding by individuals,’
says Niamani Mutima, with what she admits is opti-
mism. Back down on earth, though, better data, she
says, ‘might enable American philanthropy to be better
partners in African development’. More information
‘could help us to gain a better picture of how philan-
thropy is trying to fit into the development landscape
of Africa. In this way the story of philanthropy and
African development might not be so episodic and indi-
vidual.’ Finally, because members of AGAG often work
at a distance (many are based in the US), they want in-
formation about ‘the work being done by civil society
organizations because these are the ones really doing
the work’.
Improving transparency, facilitating collaboration
Another great virtue of data, believes Mark Bolgiano,
is that it makes organizations transparent. Fernando
Rossetti agrees that having the kinds of data that, say,
the US for-profit sector has would increase the ‘rel-
evance and social legitimacy’ of the philanthropic
sector in Brazil which, he says, has been prone to scan-
dals over corruption. Conversely, says Bolgiano, ‘lack of
data translates into lack of visibility across the sector.
This blindness results in missed opportunities to part-
ner with other people and organizations with natural
affinities.’
Most of the other participants agreed. Niamani Mutima
spoke of ‘lost opportunities for funders to complement
each other in their funding and possibly have a great
impact in a community or sector’. Likewise, Rossetti
believes that ‘some partnerships in territories or the-
matic fields do not occur due to the lack of information’.
Barriers to sharing information
The arguments in favour of better data seem over-
whelming and obvious. It seems equally obvious that
one way of getting a clearer picture of the sector overall
– whether globally, regionally or nationally – would be
through greater sharing of information by and among
‘The financial information (where the money comes from and where it goes) offered by foundations and the government is still very
“rough” and “dirty”.’ Fernando Rossetti
‘Our capacity to advocate and to offer tools and services for the growth and development of philanthropy worldwide is impaired due to lack of data.’ Helena Monteiro
focus on what c an data do for phil anthropy? p45
Alliance Volume 17 Number 3 September 2012 www.alliancemagazine.org
information will discourage potential donors, who
may shy away from supporting a foundation that al-
ready receives a lot of money; or that their ideas and
innovations may be stolen by less creative organiza-
tions. But in some instances, he suggests, it could
simply be that ‘some foundations do not honestly have
documented information to share. Their knowledge is
resident in the heads of their leaders/founders.’
Fernando Rossetti cites a reason for the lack of informa-
tion sharing among family foundations which may be
particular to Brazil – ‘the fear of their members being
kidnapped’. However, he casts doubt on the sincerity
of this motive. ‘These individuals generally do not re-
frain from appearing in celebrity magazines,’ he notes.
A better reason why Brazilian foundations don’t share
information, he thinks, is that Brazilian philanthropy
tends to be dominated by corporate foundations. Their
use of their philanthropy to raise their business profile
tends to mean ‘the overstatement of some issues and
the absence of information on others’.
Gerry Salole sees signs of change towards greater open-
ness, however, and talks of ‘vastly improved access to
information through websites, annual reports and
other media. We really get a sense that there is a greater
willingness to share experiences both within the com-
munity and also more widely with other partners and
the public at large.’ He also mentions a ‘growing ap-
petite for cross-border conversations and for learning
opportunities about these diverse experiences’.
Barriers to collecting data
It might be useful to draw a distinction between pro-
ducing data and sharing data. In the second case, as
we have seen, the barriers tend to be cultural. In the
first, they are more likely to be technical or financial.
‘I think the cost of accessing data both in terms of
time and money,’ says Niamani Mutima, ‘is probably
the major barrier for us as an organization.’ In a sec-
tor where things change quickly, she reflects, keeping
information up to date can be a demanding exercise:
‘Foundations can change priorities or approaches rath-
er quickly. After a few years they might change their
strategy, approach or focus and they are not funding
in that country, sector and approach any more. So data
can get old very fast.’
Mark Bolgiano sees two technical barriers in the US to
accessing data: the lack of ‘a true public data utility’ – a
single provider of philanthropic data that makes that
data available at a low cost or free – and the lack of open
data standards, a standardized format that everyone
in or connected to the sector agrees to use. For these
foundations. Yet, as Niamani Mutima observes, ‘foun-
dations don’t seem to know a lot about what each other
is doing outside of their areas.’ Why not?
Noshir Dadrawala tells the following illuminating
story: ‘About a year ago an attempt was made to set up
an Indian Philanthropy Network. . . . The first meet-
ing was held in the office of the
Tata Trusts. At the second meeting,
held at EdelGive Foundation, just a
few turned up. It was decided to go
for teleconferences but not many
joined. Ultimately, after a year,
things just fizzled out. And this was
for just one reason. Foundations did
not find the time . . . because they
probably did not see much value
in networking. Each was way too
caught up with their own work.’
Where foundations do share infor-
mation, he feels, it is likely to be partial. ‘Most, if not
all, foundations only report success stories,’ he sug-
gests, and that unwillingness to admit failure limits
the information foundations are willing to divulge.
Niamani Mutima agrees: ‘I think there is an incredible
fear of talking candidly about failure or not getting
it right.’ She adds: ‘the decision-making process and
rationale for both the institutional
and individual philanthropist can
be based on such a wide range of
things. Sometimes, it only makes
sense in the internal context.’
Gerry Salole points to foundations’
unwillingness to open themselves
to scrutiny when he talks about the
need ‘to demystify the apprehen-
sion felt by some foundations about
communicating more information
about their work and operations’.
This is probably less to do with reluctance to admit
failure to peers, however, than with a general defen-
siveness foundations feel in response to what they see
as a sort of latent public resentment of their position
– they often enjoy exemption from taxation, they don’t
have to obey the behests of shareholders or voters, etc.
This defensiveness might be better grounded in some
cases than in others. Nicanor Sabula notes among East
African grantmakers ‘a fear of authorities, especial-
ly when it comes to taxation laws. Since the tax laws
are not well understood, some foundations fear ex-
posing themselves.’ They may also fear that sharing
‘About a year ago an attempt was made to set up an Indian Philanthropy Network. After a year, things just fizzled out. And this was for just one reason. Foundations did not find the time . . . because they probably did not see much value in networking. Each was way too caught up with their own work.’ Noshir Dadrawala
‘I think there is an incredible fear of talking candidly about failure or not getting it right. The decision-making process and rationale for both the institutional and individual philanthropist can be based on such a wide range of things. Sometimes, it only makes sense in the internal context.’ Niamani Mutima
p46
Alliance Volume 17 Number 3 September 2012 www.alliancemagazine.org
focus on what c an data do for phil anthropy?
It’s not just what you know, it’s how you use it
And it’s not only a matter of analysing the data. Noshir
Dadrawala has already referred to the existence of
‘flawed data’. Niamani Mutima also raises the question
of the integrity of data – ‘who gathered it and to what
end?’ She cites a recent article in the UK’s Guardian
newspaper about the Failed State Index and its impact.
‘It raised the question of how useful the Foreign Policy
magazine annual index of failed states is and what it
means.’ The article she is referring to describes the
Failed States Index as ‘a high-profile attack on the coun-
tries that appear near the top of the list . . . which could
even exacerbate the instability it seeks to describe by
undermining citizens’ confidence in their country’s
ability to transform itself.’1
We need to build a common vision and shared prin-
ciples for global data on philanthropy, says Helena
Monteiro. How will the data collected be used? How
can we ensure data quality? ‘These are important ques-
tions that need to be discussed and agreed on.’
No growth without data
Gathering up the wisdom from those seated round
our virtual table, one of the first things that emerg-
es clearly is that, in terms of information, more isn’t
necessarily better. While data collection is important,
analysis is crucial. In the more developed countries, it
seems, much of the basic data that foundations and
non-profits might need already exists in one form or an-
other. The challenge is to access or to combine it in ways
that are both appropriate to needs and cheap enough
to be feasible. In developing countries, this might not
always be so. In all circumstances, though, a variety of
considerations, cultural, technical and financial, hin-
der the better collection and use of data. The technical
ones are likely to be resolved first; in many cases, they
are already on their way to solution. In some instances,
even the cultural ones are being overcome.
But whatever the state of information collection or
sharing in their respective worlds, all participants
agree that having access to the right kinds of data
would improve the sector’s efficiency, its standing with
both government and public, and ultimately its influ-
ence and impact. As Noshir Dadrawala points out, ‘all
growth is dependent on measure and if there are no
reliable data to benchmark against, measuring is dif-
ficult, if not impossible’.
two things, he’s convinced, ‘it’s not a question of if, it’s
now just a question of when. The Big Data movement
is overtaking commercial data services in all sectors
including those that sell public data to foundations.’
The need for standardization – beware the albatross!
We have seen elsewhere in this issue (see conversation
between Bradford Smith and Rosa
Gallego on p37) that data would
be easier to collect and interpret
if it were in a standardized form.
Helena Monteiro sees it as one of the
great challenges to standardize ‘in-
formation on who gives money, how
much, how, to which cause or issue,
who gets it/who benefits, what are the results’. She ad-
mits that ‘standardization is difficult because of the
complexity and diversity of philanthropy’. WINGS is
currently working in partnership with the Foundation
Center to develop a standardized way to collect data
from WINGS members (see p15).
Gerry Salole adds a caution about attempts at stand-
ardizing data. The EFC struggled for over a decade to
develop a typology for classifying
European foundations based on a
US template. ‘While serving as an
adequate starting point for a super-
ficial taxonomy of foundations,’ he
says, ‘the typology failed to take
into account new forms, trends, var-
iations and exceptions to the rule.
In truth,’ he concludes, ‘we had set
ourselves an impossible task.’ They finally decided to
abandon the attempt, ‘thus removing the albatross
from around our necks’. He concludes: ‘I think it is
important that we embrace and celebrate the diver-
sity of our sector. That is why we focus on capturing
a more situational snapshot of the foundation sector
in Europe, through documenting stories, case studies
and relationships.’
Examining the data
Having the data is one thing; using it to good effect
is another. Gerry Salole has already
suggested that what’s needed is
not more information but better
analysis of it. Niamani Mutima also
believes that it is often ‘more a mat-
ter of accurate and useful analysis
of the information than the infor-
mation itself’.
1 The Guardian, 2 July 2012, ‘Failed States Index belongs in the policy dustbin’: http://tinyurl.com/alliance78
‘There is a fear of authorities, especially when it comes to taxation laws. Since the tax laws are not well understood, some foundations fear exposing themselves.’ Nicanor Sabula
‘While serving as an adequate starting point for a superficial taxonomy of foundations, the typology failed to take into account new forms, trends, variations and exceptions to the rule. In truth, we had set ourselves an impossible task.’ Gerry Salole
‘It’s not a question of if, it’s now just a question of when. The Big Data movement is overtaking commercial data services in all sectors including those that sell public data to foundations.’ Mark Bolgiano
p47
Alliance Volume 17 Number 3 September 2012 www.alliancemagazine.org
focus on what c an data do for phil anthropy?
It’s not just what you know, it’s how you use it
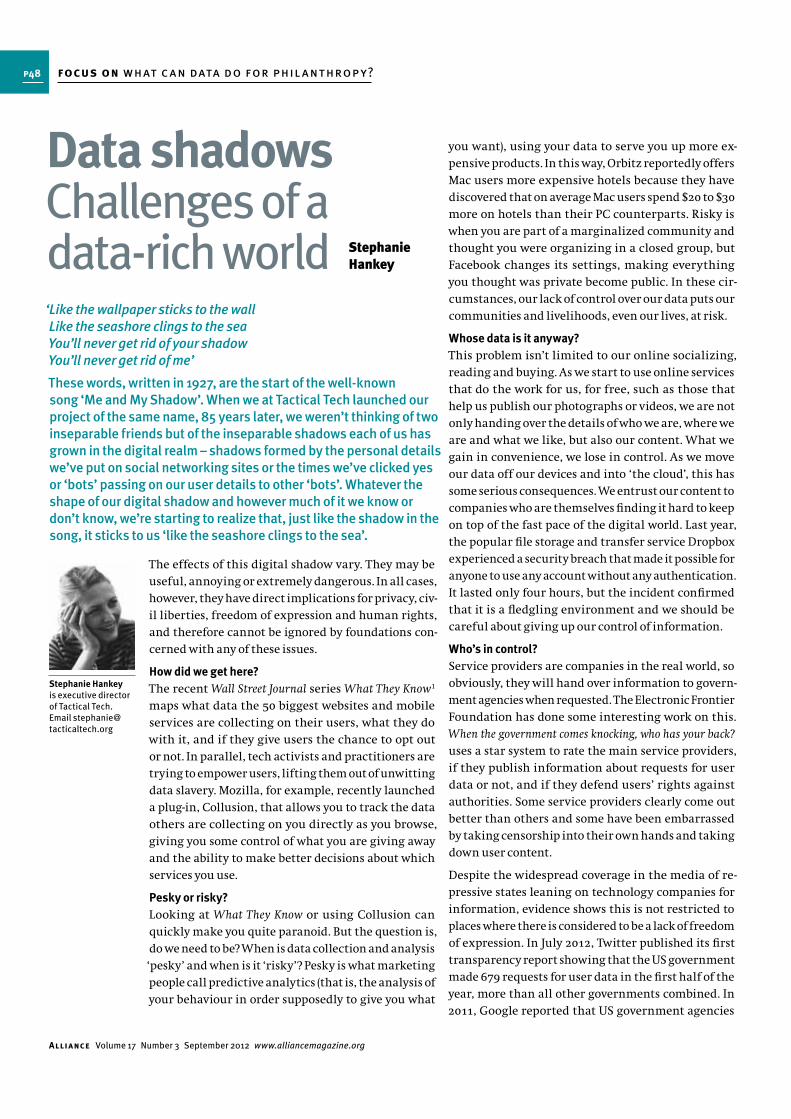
you want), using your data to serve you up more ex-
pensive products. In this way, Orbitz reportedly offers
Mac users more expensive hotels because they have
discovered that on average Mac users spend $20 to $30
more on hotels than their PC counterparts. Risky is
when you are part of a marginalized community and
thought you were organizing in a closed group, but
Facebook changes its settings, making everything
you thought was private become public. In these cir-
cumstances, our lack of control over our data puts our
communities and livelihoods, even our lives, at risk.
Whose data is it anyway?
This problem isn’t limited to our online socializing,
reading and buying. As we start to use online services
that do the work for us, for free, such as those that
help us publish our photographs or videos, we are not
only handing over the details of who we are, where we
are and what we like, but also our content. What we
gain in convenience, we lose in control. As we move
our data off our devices and into ‘the cloud’, this has
some serious consequences. We entrust our content to
companies who are themselves finding it hard to keep
on top of the fast pace of the digital world. Last year,
the popular file storage and transfer service Dropbox
experienced a security breach that made it possible for
anyone to use any account without any authentication.
It lasted only four hours, but the incident confirmed
that it is a fledgling environment and we should be
careful about giving up our control of information.
Who’s in control?
Service providers are companies in the real world, so
obviously, they will hand over information to govern-
ment agencies when requested. The Electronic Frontier
Foundation has done some interesting work on this.
When the government comes knocking, who has your back?
uses a star system to rate the main service providers,
if they publish information about requests for user
data or not, and if they defend users’ rights against
authorities. Some service providers clearly come out
better than others and some have been embarrassed
by taking censorship into their own hands and taking
down user content.
Despite the widespread coverage in the media of re-
pressive states leaning on technology companies for
information, evidence shows this is not restricted to
places where there is considered to be a lack of freedom
of expression. In July 2012, Twitter published its first
transparency report showing that the US government
made 679 requests for user data in the first half of the
year, more than all other governments combined. In
2011, Google reported that US government agencies
The effects of this digital shadow vary. They may be
useful, annoying or extremely dangerous. In all cases,
however, they have direct implications for privacy, civ-
il liberties, freedom of expression and human rights,
and therefore cannot be ignored by foundations con-
cerned with any of these issues.
How did we get here?
The recent Wall Street Journal series What They Know1
maps what data the 50 biggest websites and mobile
services are collecting on their users, what they do
with it, and if they give users the chance to opt out
or not. In parallel, tech activists and practitioners are
trying to empower users, lifting them out of unwitting
data slavery. Mozilla, for example, recently launched
a plug-in, Collusion, that allows you to track the data
others are collecting on you directly as you browse,
giving you some control of what you are giving away
and the ability to make better decisions about which
services you use.
Pesky or risky?
Looking at What They Know or using Collusion can
quickly make you quite paranoid. But the question is,
do we need to be? When is data collection and analysis
‘pesky’ and when is it ‘risky’? Pesky is what marketing
people call predictive analytics (that is, the analysis of
your behaviour in order supposedly to give you what
Data shadowsChallenges of a data-rich world‘Like the wallpaper sticks to the wall Like the seashore clings to the sea You’ll never get rid of your shadow You’ll never get rid of me’
These words, written in 1927, are the start of the well-known song ‘Me and My Shadow’. When we at Tactical Tech launched our project of the same name, 85 years later, we weren’t thinking of two inseparable friends but of the inseparable shadows each of us has grown in the digital realm – shadows formed by the personal details we’ve put on social networking sites or the times we’ve clicked yes or ‘bots’ passing on our user details to other ‘bots’. Whatever the shape of our digital shadow and however much of it we know or don’t know, we’re starting to realize that, just like the shadow in the song, it sticks to us ‘like the seashore clings to the sea’.
Stephanie Hankey is executive director of Tactical Tech. Email [email protected]
Stephanie Hankey
focus on what c an data do for phil anthropy?p48
Alliance Volume 17 Number 3 September 2012 www.alliancemagazine.org
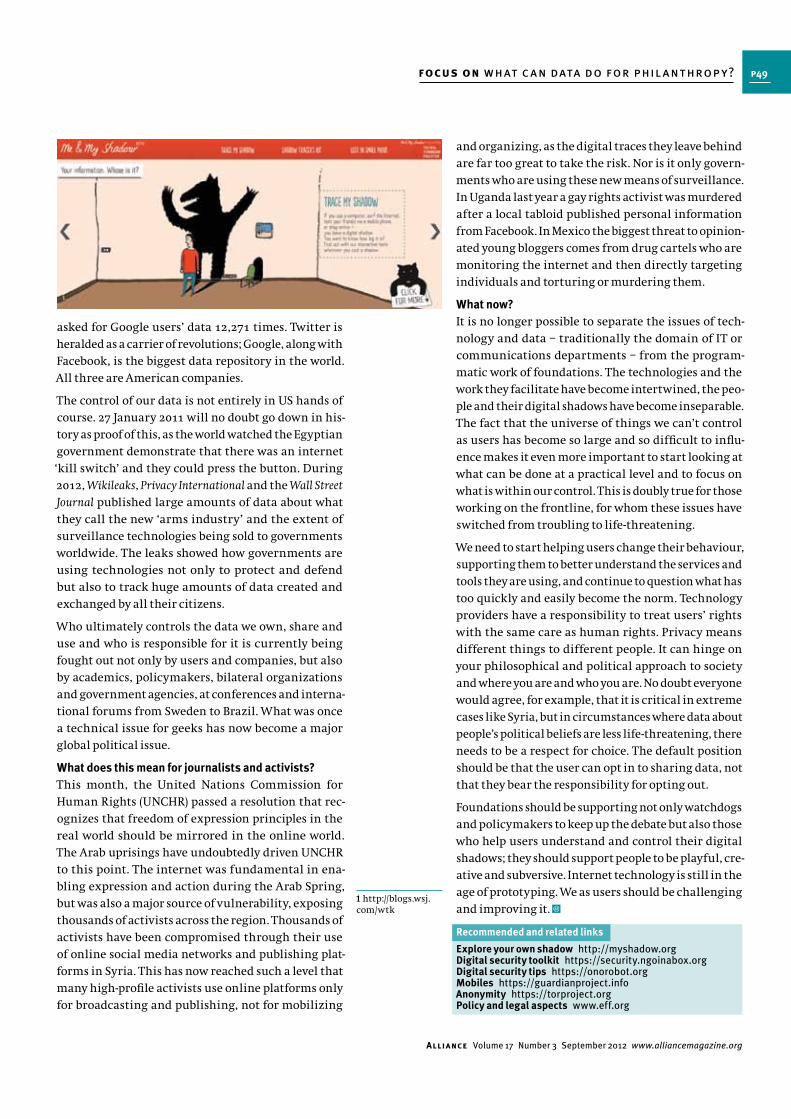
asked for Google users’ data 12,271 times. Twitter is
heralded as a carrier of revolutions; Google, along with
Facebook, is the biggest data repository in the world.
All three are American companies.
The control of our data is not entirely in US hands of
course. 27 January 2011 will no doubt go down in his-
tory as proof of this, as the world watched the Egyptian
government demonstrate that there was an internet
‘kill switch’ and they could press the button. During
2012, Wikileaks, Privacy International and the Wall Street
Journal published large amounts of data about what
they call the new ‘arms industry’ and the extent of
surveillance technologies being sold to governments
worldwide. The leaks showed how governments are
using technologies not only to protect and defend
but also to track huge amounts of data created and
exchanged by all their citizens.
Who ultimately controls the data we own, share and
use and who is responsible for it is currently being
fought out not only by users and companies, but also
by academics, policymakers, bilateral organizations
and government agencies, at conferences and interna-
tional forums from Sweden to Brazil. What was once
a technical issue for geeks has now become a major
global political issue.
What does this mean for journalists and activists?
This month, the United Nations Commission for
Human Rights (UNCHR) passed a resolution that rec-
ognizes that freedom of expression principles in the
real world should be mirrored in the online world.
The Arab uprisings have undoubtedly driven UNCHR
to this point. The internet was fundamental in ena-
bling expression and action during the Arab Spring,
but was also a major source of vulnerability, exposing
thousands of activists across the region. Thousands of
activists have been compromised through their use
of online social media networks and publishing plat-
forms in Syria. This has now reached such a level that
many high-profile activists use online platforms only
for broadcasting and publishing, not for mobilizing
and organizing, as the digital traces they leave behind
are far too great to take the risk. Nor is it only govern-
ments who are using these new means of surveillance.
In Uganda last year a gay rights activist was murdered
after a local tabloid published personal information
from Facebook. In Mexico the biggest threat to opinion-
ated young bloggers comes from drug cartels who are
monitoring the internet and then directly targeting
individuals and torturing or murdering them.
What now?
It is no longer possible to separate the issues of tech-
nology and data – traditionally the domain of IT or
communications departments – from the program-
matic work of foundations. The technologies and the
work they facilitate have become intertwined, the peo-
ple and their digital shadows have become inseparable.
The fact that the universe of things we can’t control
as users has become so large and so difficult to influ-
ence makes it even more important to start looking at
what can be done at a practical level and to focus on
what is within our control. This is doubly true for those
working on the frontline, for whom these issues have
switched from troubling to life-threatening.
We need to start helping users change their behaviour,
supporting them to better understand the services and
tools they are using, and continue to question what has
too quickly and easily become the norm. Technology
providers have a responsibility to treat users’ rights
with the same care as human rights. Privacy means
different things to different people. It can hinge on
your philosophical and political approach to society
and where you are and who you are. No doubt everyone
would agree, for example, that it is critical in extreme
cases like Syria, but in circumstances where data about
people’s political beliefs are less life-threatening, there
needs to be a respect for choice. The default position
should be that the user can opt in to sharing data, not
that they bear the responsibility for opting out.
Foundations should be supporting not only watchdogs
and policymakers to keep up the debate but also those
who help users understand and control their digital
shadows; they should support people to be playful, cre-
ative and subversive. Internet technology is still in the
age of prototyping. We as users should be challenging
and improving it.
Explore your own shadow http://myshadow.org Digital security toolkit https://security.ngoinabox.org Digital security tips https://onorobot.org Mobiles https://guardianproject.info Anonymity https://torproject.org Policy and legal aspects www.eff.org
Recommended and related links
1 http://blogs.wsj.com/wtk
focus on what c an data do for phil anthropy? p49
Alliance Volume 17 Number 3 September 2012 www.alliancemagazine.org
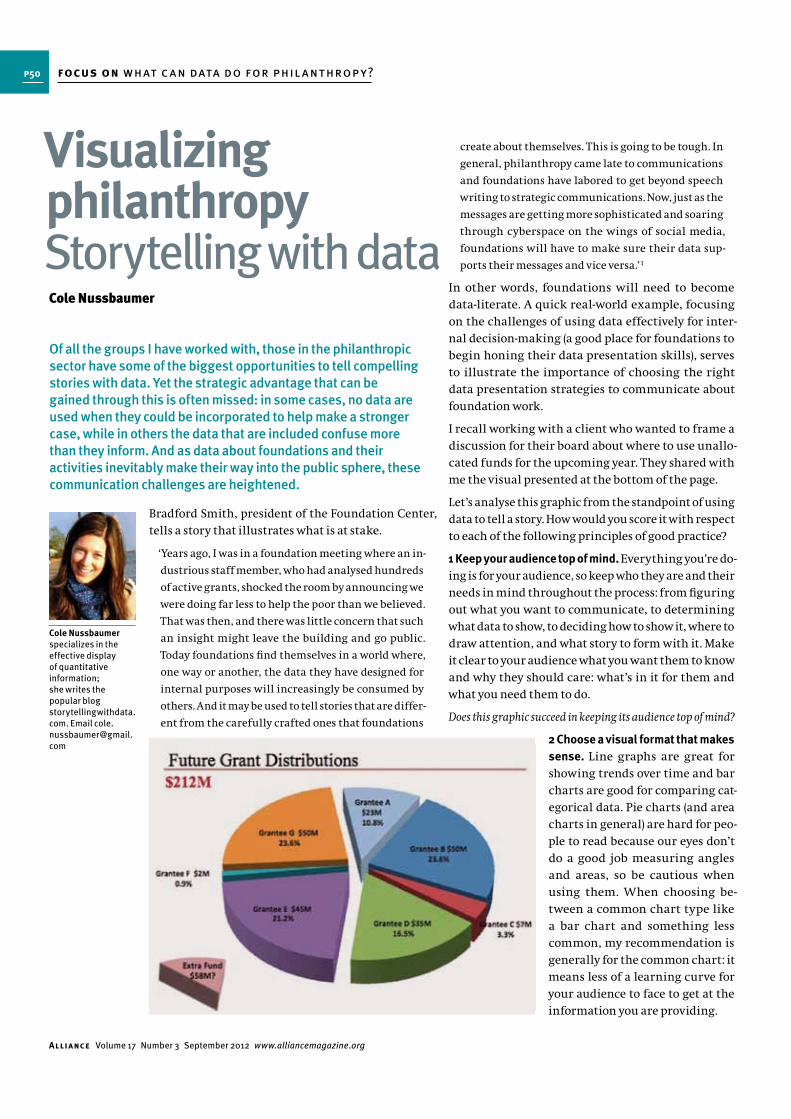
create about themselves. This is going to be tough. In
general, philanthropy came late to communications
and foundations have labored to get beyond speech
writing to strategic communications. Now, just as the
messages are getting more sophisticated and soaring
through cyberspace on the wings of social media,
foundations will have to make sure their data sup-
ports their messages and vice versa.’1
In other words, foundations will need to become
data-literate. A quick real-world example, focusing
on the challenges of using data effectively for inter-
nal decision-making (a good place for foundations to
begin honing their data presentation skills), serves
to illustrate the importance of choosing the right
data presentation strategies to communicate about
foundation work.
I recall working with a client who wanted to frame a
discussion for their board about where to use unallo-
cated funds for the upcoming year. They shared with
me the visual presented at the bottom of the page.
Let’s analyse this graphic from the standpoint of using
data to tell a story. How would you score it with respect
to each of the following principles of good practice?
1 Keep your audience top of mind. Everything you’re do-
ing is for your audience, so keep who they are and their
needs in mind throughout the process: from figuring
out what you want to communicate, to determining
what data to show, to deciding how to show it, where to
draw attention, and what story to form with it. Make
it clear to your audience what you want them to know
and why they should care: what’s in it for them and
what you need them to do.
Does this graphic succeed in keeping its audience top of mind?
2 Choose a visual format that makes
sense. Line graphs are great for
showing trends over time and bar
charts are good for comparing cat-
egorical data. Pie charts (and area
charts in general) are hard for peo-
ple to read because our eyes don’t
do a good job measuring angles
and areas, so be cautious when
using them. When choosing be-
tween a common chart type like
a bar chart and something less
common, my recommendation is
generally for the common chart: it
means less of a learning curve for
your audience to face to get at the
information you are providing.
Bradford Smith, president of the Foundation Center,
tells a story that illustrates what is at stake.
‘Years ago, I was in a foundation meeting where an in-
dustrious staff member, who had analysed hundreds
of active grants, shocked the room by announcing we
were doing far less to help the poor than we believed.
That was then, and there was little concern that such
an insight might leave the building and go public.
Today foundations find themselves in a world where,
one way or another, the data they have designed for
internal purposes will increasingly be consumed by
others. And it may be used to tell stories that are differ-
ent from the carefully crafted ones that foundations
Visualizing philanthropyStorytelling with data
Of all the groups I have worked with, those in the philanthropic sector have some of the biggest opportunities to tell compelling stories with data. Yet the strategic advantage that can be gained through this is often missed: in some cases, no data are used when they could be incorporated to help make a stronger case, while in others the data that are included confuse more than they inform. And as data about foundations and their activities inevitably make their way into the public sphere, these communication challenges are heightened.
Cole Nussbaumer specializes in the effective display of quantitative information; she writes the popular blog storytellingwithdata.com. Email [email protected]
Cole Nussbaumer
focus on what c an data do for phil anthropy?p50
Alliance Volume 17 Number 3 September 2012 www.alliancemagazine.org
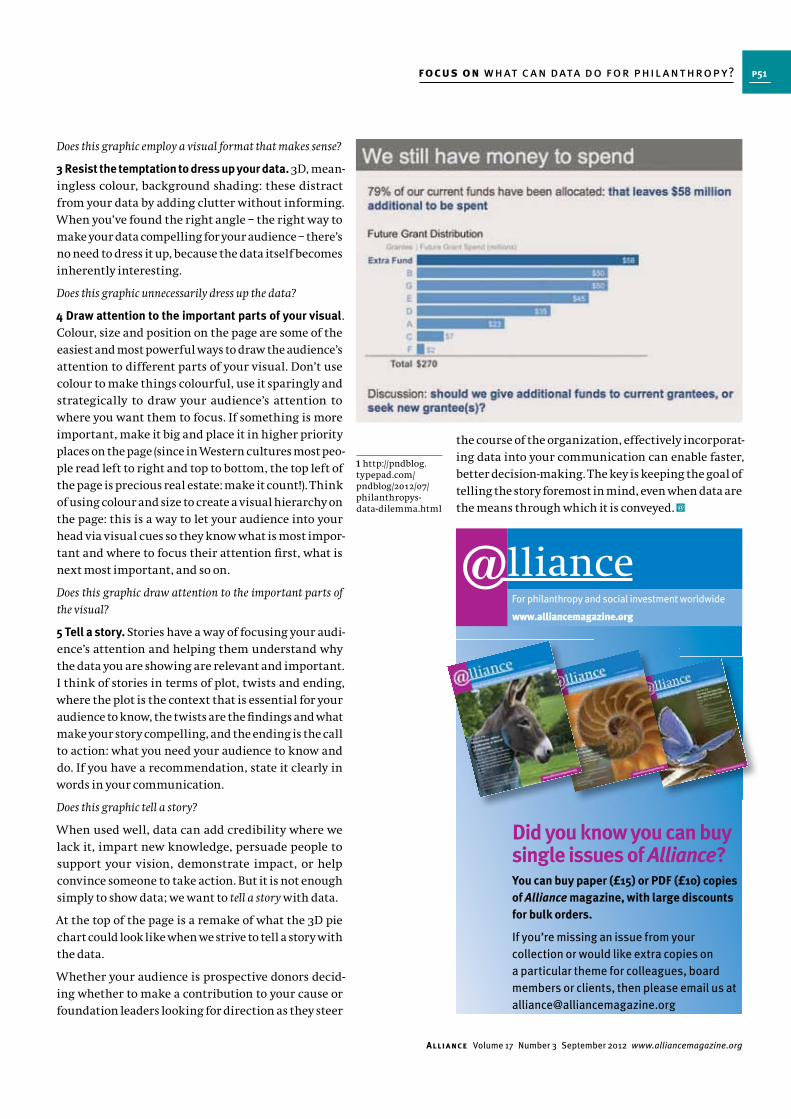
the course of the organization, effectively incorporat-
ing data into your communication can enable faster,
better decision-making. The key is keeping the goal of
telling the story foremost in mind, even when data are
the means through which it is conveyed.
Does this graphic employ a visual format that makes sense?
3 Resist the temptation to dress up your data. 3D, mean-
ingless colour, background shading: these distract
from your data by adding clutter without informing.
When you’ve found the right angle – the right way to
make your data compelling for your audience – there’s
no need to dress it up, because the data itself becomes
inherently interesting.
Does this graphic unnecessarily dress up the data?
4 Draw attention to the important parts of your visual.
Colour, size and position on the page are some of the
easiest and most powerful ways to draw the audience’s
attention to different parts of your visual. Don’t use
colour to make things colourful, use it sparingly and
strategically to draw your audience’s attention to
where you want them to focus. If something is more
important, make it big and place it in higher priority
places on the page (since in Western cultures most peo-
ple read left to right and top to bottom, the top left of
the page is precious real estate: make it count!). Think
of using colour and size to create a visual hierarchy on
the page: this is a way to let your audience into your
head via visual cues so they know what is most impor-
tant and where to focus their attention first, what is
next most important, and so on.
Does this graphic draw attention to the important parts of
the visual?
5 Tell a story. Stories have a way of focusing your audi-
ence’s attention and helping them understand why
the data you are showing are relevant and important.
I think of stories in terms of plot, twists and ending,
where the plot is the context that is essential for your
audience to know, the twists are the findings and what
make your story compelling, and the ending is the call
to action: what you need your audience to know and
do. If you have a recommendation, state it clearly in
words in your communication.
Does this graphic tell a story?
When used well, data can add credibility where we
lack it, impart new knowledge, persuade people to
support your vision, demonstrate impact, or help
convince someone to take action. But it is not enough
simply to show data; we want to tell a story with data.
At the top of the page is a remake of what the 3D pie
chart could look like when we strive to tell a story with
the data.
Whether your audience is prospective donors decid-
ing whether to make a contribution to your cause or
foundation leaders looking for direction as they steer
1 http://pndblog.typepad.com/pndblog/2012/07/philanthropys-data-dilemma.html
Did you know you can buy single issues of Alliance?You can buy paper (£15) or PDF (£10) copies
of Alliance magazine, with large discounts
for bulk orders.
If you’re missing an issue from your
collection or would like extra copies on
a particular theme for colleagues, board
members or clients, then please email us at
@lliancewww.alliancemagazine.org
For philanthropy and social investment worldwide
focus on what c an data do for phil anthropy? p51
Alliance Volume 17 Number 3 September 2012 www.alliancemagazine.org
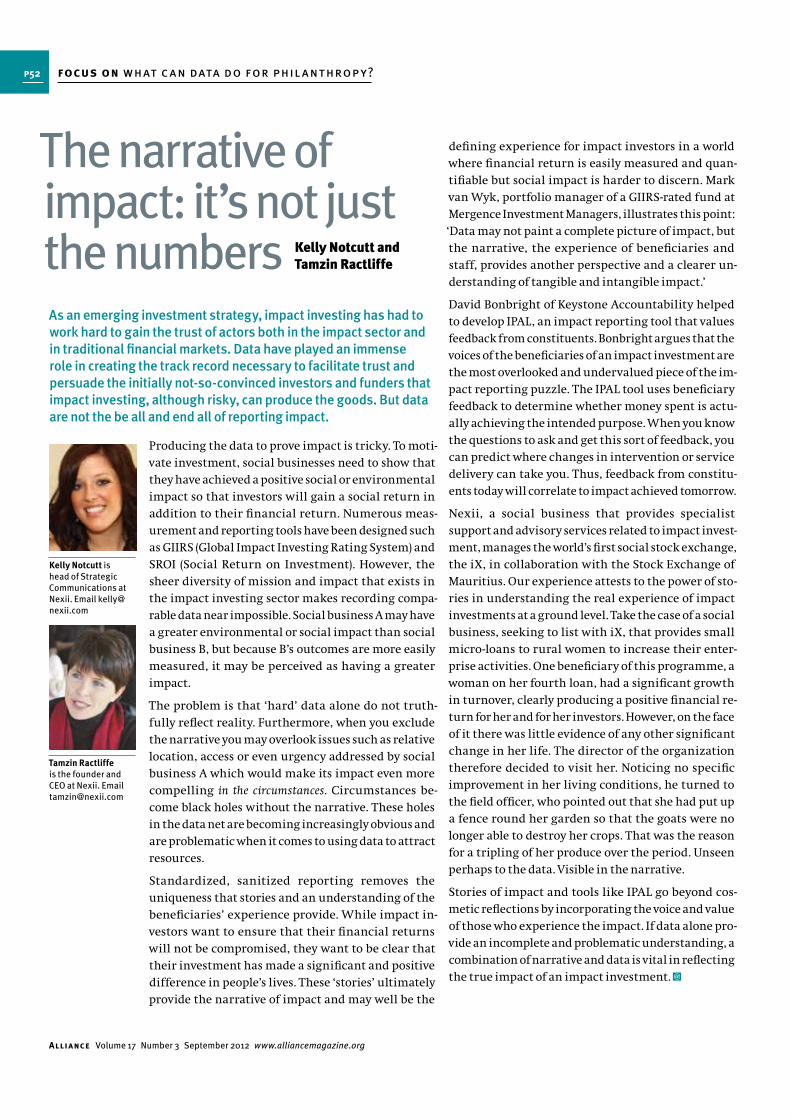
defining experience for impact investors in a world
where financial return is easily measured and quan-
tifiable but social impact is harder to discern. Mark
van Wyk, portfolio manager of a GIIRS-rated fund at
Mergence Investment Managers, illustrates this point:
‘Data may not paint a complete picture of impact, but
the narrative, the experience of beneficiaries and
staff, provides another perspective and a clearer un-
derstanding of tangible and intangible impact.’
David Bonbright of Keystone Accountability helped
to develop IPAL, an impact reporting tool that values
feedback from constituents. Bonbright argues that the
voices of the beneficiaries of an impact investment are
the most overlooked and undervalued piece of the im-
pact reporting puzzle. The IPAL tool uses beneficiary
feedback to determine whether money spent is actu-
ally achieving the intended purpose. When you know
the questions to ask and get this sort of feedback, you
can predict where changes in intervention or service
delivery can take you. Thus, feedback from constitu-
ents today will correlate to impact achieved tomorrow.
Nexii, a social business that provides specialist
support and advisory services related to impact invest-
ment, manages the world’s first social stock exchange,
the iX, in collaboration with the Stock Exchange of
Mauritius. Our experience attests to the power of sto-
ries in understanding the real experience of impact
investments at a ground level. Take the case of a social
business, seeking to list with iX, that provides small
micro-loans to rural women to increase their enter-
prise activities. One beneficiary of this programme, a
woman on her fourth loan, had a significant growth
in turnover, clearly producing a positive financial re-
turn for her and for her investors. However, on the face
of it there was little evidence of any other significant
change in her life. The director of the organization
therefore decided to visit her. Noticing no specific
improvement in her living conditions, he turned to
the field officer, who pointed out that she had put up
a fence round her garden so that the goats were no
longer able to destroy her crops. That was the reason
for a tripling of her produce over the period. Unseen
perhaps to the data. Visible in the narrative.
Stories of impact and tools like IPAL go beyond cos-
metic reflections by incorporating the voice and value
of those who experience the impact. If data alone pro-
vide an incomplete and problematic understanding, a
combination of narrative and data is vital in reflecting
the true impact of an impact investment.
Producing the data to prove impact is tricky. To moti-
vate investment, social businesses need to show that
they have achieved a positive social or environmental
impact so that investors will gain a social return in
addition to their financial return. Numerous meas-
urement and reporting tools have been designed such
as GIIRS (Global Impact Investing Rating System) and
SROI (Social Return on Investment). However, the
sheer diversity of mission and impact that exists in
the impact investing sector makes recording compa-
rable data near impossible. Social business A may have
a greater environmental or social impact than social
business B, but because B’s outcomes are more easily
measured, it may be perceived as having a greater
impact.
The problem is that ‘hard’ data alone do not truth-
fully reflect reality. Furthermore, when you exclude
the narrative you may overlook issues such as relative
location, access or even urgency addressed by social
business A which would make its impact even more
compelling in the circumstances. Circumstances be-
come black holes without the narrative. These holes
in the data net are becoming increasingly obvious and
are problematic when it comes to using data to attract
resources.
Standardized, sanitized reporting removes the
uniqueness that stories and an understanding of the
beneficiaries’ experience provide. While impact in-
vestors want to ensure that their financial returns
will not be compromised, they want to be clear that
their investment has made a significant and positive
difference in people’s lives. These ‘stories’ ultimately
provide the narrative of impact and may well be the
The narrative of impact: it’s not just the numbersAs an emerging investment strategy, impact investing has had to work hard to gain the trust of actors both in the impact sector and in traditional financial markets. Data have played an immense role in creating the track record necessary to facilitate trust and persuade the initially not-so-convinced investors and funders that impact investing, although risky, can produce the goods. But data are not the be all and end all of reporting impact.
Kelly Notcutt is head of Strategic Communications at Nexii. Email [email protected]
Tamzin Ractliffe is the founder and CEO at Nexii. Email [email protected]
Kelly Notcutt and Tamzin Ractliffe
focus on what c an data do for phil anthropy?p52
Alliance Volume 17 Number 3 September 2012 www.alliancemagazine.org
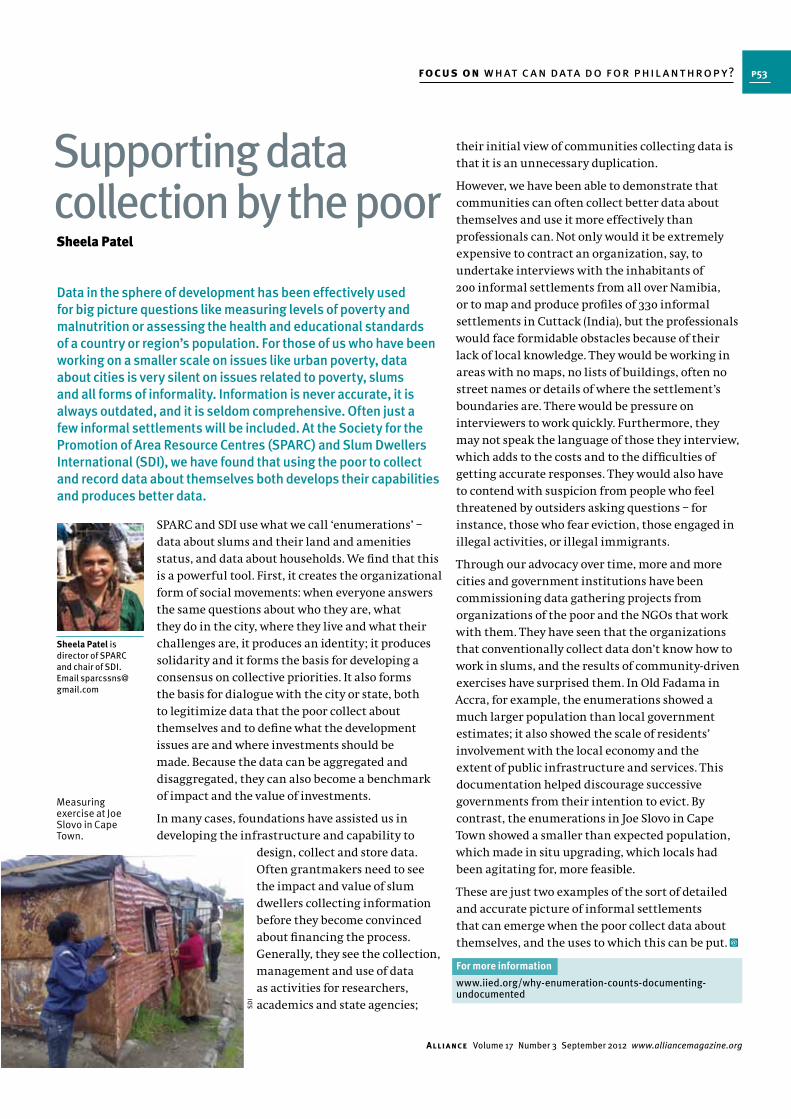
their initial view of communities collecting data is
that it is an unnecessary duplication.
However, we have been able to demonstrate that
communities can often collect better data about
themselves and use it more effectively than
professionals can. Not only would it be extremely
expensive to contract an organization, say, to
undertake interviews with the inhabitants of
200 informal settlements from all over Namibia,
or to map and produce profiles of 330 informal
settlements in Cuttack (India), but the professionals
would face formidable obstacles because of their
lack of local knowledge. They would be working in
areas with no maps, no lists of buildings, often no
street names or details of where the settlement’s
boundaries are. There would be pressure on
interviewers to work quickly. Furthermore, they
may not speak the language of those they interview,
which adds to the costs and to the difficulties of
getting accurate responses. They would also have
to contend with suspicion from people who feel
threatened by outsiders asking questions – for
instance, those who fear eviction, those engaged in
illegal activities, or illegal immigrants.
Through our advocacy over time, more and more
cities and government institutions have been
commissioning data gathering projects from
organizations of the poor and the NGOs that work
with them. They have seen that the organizations
that conventionally collect data don’t know how to
work in slums, and the results of community-driven
exercises have surprised them. In Old Fadama in
Accra, for example, the enumerations showed a
much larger population than local government
estimates; it also showed the scale of residents’
involvement with the local economy and the
extent of public infrastructure and services. This
documentation helped discourage successive
governments from their intention to evict. By
contrast, the enumerations in Joe Slovo in Cape
Town showed a smaller than expected population,
which made in situ upgrading, which locals had
been agitating for, more feasible.
These are just two examples of the sort of detailed
and accurate picture of informal settlements
that can emerge when the poor collect data about
themselves, and the uses to which this can be put.
SPARC and SDI use what we call ‘enumerations’ –
data about slums and their land and amenities
status, and data about households. We find that this
is a powerful tool. First, it creates the organizational
form of social movements: when everyone answers
the same questions about who they are, what
they do in the city, where they live and what their
challenges are, it produces an identity; it produces
solidarity and it forms the basis for developing a
consensus on collective priorities. It also forms
the basis for dialogue with the city or state, both
to legitimize data that the poor collect about
themselves and to define what the development
issues are and where investments should be
made. Because the data can be aggregated and
disaggregated, they can also become a benchmark
of impact and the value of investments.
In many cases, foundations have assisted us in
developing the infrastructure and capability to
design, collect and store data.
Often grantmakers need to see
the impact and value of slum
dwellers collecting information
before they become convinced
about financing the process.
Generally, they see the collection,
management and use of data
as activities for researchers,
academics and state agencies;
Supporting data collection by the poor
Data in the sphere of development has been effectively used for big picture questions like measuring levels of poverty and malnutrition or assessing the health and educational standards of a country or region’s population. For those of us who have been working on a smaller scale on issues like urban poverty, data about cities is very silent on issues related to poverty, slums and all forms of informality. Information is never accurate, it is always outdated, and it is seldom comprehensive. Often just a few informal settlements will be included. At the Society for the Promotion of Area Resource Centres (SPARC) and Slum Dwellers International (SDI), we have found that using the poor to collect and record data about themselves both develops their capabilities and produces better data.
Sheela Patel is director of SPARC and chair of SDI. Email [email protected]
Sheela Patel
www.iied.org/why-enumeration-counts-documenting-undocumented
For more information
SD
I
Measuring exercise at Joe Slovo in Cape Town.
focus on what c an data do for phil anthropy? p53
Alliance Volume 17 Number 3 September 2012 www.alliancemagazine.org
fossil-fuel companies have fought so hard to prevent
the regulation of carbon dioxide . . . If you told Exxon
or Lukoil that, in order to avoid wrecking the climate,
they couldn’t pump out their reserves, the value of
their companies would plummet.’2
The paradox is that fossil fuel company valuations are
counting on future revenue streams to pay debts and
dividends, but these revenue streams are dependent
on the world continuing on a pathway to 6 degrees
of warming. The market does not currently factor
this into its financial models; the data it provides are
based on a business-as-usual scenario. The Carbon
Tracker Initiative is using its findings to challenge
the assumptions underlying the current financial
data. Producing an alternative analysis based on a
carbon-constrained world is one way of influencing
the data flow that allocates capital. ‘The regular
process of economic evolution is that businesses
are left with stranded assets all the time,’ says Nick
Robins, who runs HSBC’s Climate Change Centre.
‘Think of film cameras, or typewriters. The question is
not whether this will happen. It will. Pension systems
have been hit by the dot-com and credit crunch.
They’ll be hit by this.’
Given the threats to capital markets stability as well
as to climate stability, Christiana Figueres, the UN
head of climate, has called for more active valuations
of companies which factor in climate change risk.3
The markets haven’t spotted the problem yet – but
with some 20–30 per cent of the global value of
equity markets based on an assumption that all the
fossil fuel financed will get sold, how much of your
investment portfolio is based on climate-literate data?
The next phase of work for Carbon Tracker is to
challenge the way in which regulators govern the
disclosure of the fossil fuel intensity of the capital
markets (they currently don’t); the way accountants
treat the reserves of fossil fuel companies that can’t
be burned (what ‘haircut’ to valuations is required
to get all listed companies into a 2 degrees balance?);
and the way the banks calculate the valuations of the
companies they make investment recommendations
on (should the banks be changing their financial
models?). This is the next set of questions that Carbon
Tracker hopes to find answers for.
Three years earlier a paper by Nick Robins and Mark
Campanale for the Quality of Life Commission’s
website suggested that the markets had already
financed more coal and oil than could safely be
burned. But to turn this theory into robust data
required analysis. The first task was to evaluate the
balance sheets of some 200 of the world’s largest
listed coal, gas and oil companies to look at their
reserves – and then convert this data into CO2
emissions potential. This was an obvious piece of
data analysis, but it hadn’t been done before.
Based on this, the 2011 ‘Carbon Bubble report’
exposed the misalignment between the world’s
stock exchanges and the climate change agenda.1 In
essence, the levels of coal, oil and gas reserves being
financed by the capital markets – including investors
like foundations and endowments – are taking us
to 6 degrees of warming rather than the 2 degrees
target the world’s governments have agreed. The
2,795 gigatons they hold is five times higher than the
remaining ‘carbon budget’ climate scientists say we
have left to burn to stay below 2 degrees warming.
This misalignment has been a wake-up call for the
climate change community. Rather than counting
last year’s flows of carbon emissions, which have
already gone into the atmosphere, we need to look at
the stocks of carbon being built up.
As a recent article in Rolling Stone magazine has
pointed out, though ‘this coal and gas and oil is still
technically in the soil . . . it’s already economically
above ground – it’s figured into share prices,
companies are borrowing money against it, nations
are basing their budgets on the presumed returns
from their patrimony. It explains why the big
Six degrees of capitalizationDespite tightening climate regulations, the capital markets are becoming more fossil fuel intense, not less, with large fossil fuel companies raising big money on the world’s leading stock exchanges during the decade from 2000. The amount of carbon in the world’s proven fossil fuel stocks is some 2,795 gigatons – five times more than climate scientists say we can safely burn. Yet the owners of those stocks are already borrowing money and paying dividends on the basis of the 2,795 figure. Carbon Tracker was set up in 2010 to produce the data that uncovered this situation.
James Leaton is project director at Carbon Tracker. Email [email protected]
Mark Campanale is a director of Carbon Tracker. Email [email protected]
James Leaton and Mark Campanale
www.carbontracker.org For more information
1 www.carbontracker.org/carbonbubble
2 www.rollingstone.com/politics/news/global-warmings-terrifying-new-math-20120719
3 www.guardian.co.uk/environment/2011/oct/10/climate-change-cost-companies-worth
focus on what c an data do for phil anthropy?p54
Alliance Volume 17 Number 3 September 2012 www.alliancemagazine.org
of a nexus of risks derived from competing food,
energy and water demands in different countries.
Sustainability issues, it argues, will be increasingly
key in the economic and political stability of nations;
they therefore present a set of risks for those investing
in land-related assets and projects. But scarcity and
competition could also open up a new opportunity for
investments to focus on long-term value creation. How
to influence these investment decisions?
This is where data comes in. As the next step, the ESI
is developing the Land Security Index. The index will
provide an independent analysis of country data on
five trends that are not usually analysed together:
water limits, land degradation, food security, governance
and climate change. It will suggest how these data
might provide new insights into long-term country
risk metrics. ESI will continue to involve global
investors in working out how this information can
best be included in the investment decision cycle, the
ultimate aim being to demonstrate how considering
these sustainability metrics is in the interest of both
financial markets and governments.
pupils attain national proficiency levels in English.
Based on the success of the community assistants
programme in India, IPA partnered with the Ghanaian
government to design a programme for Ghana.
With support from the Children’s Investment Fund
Foundation, it was tested against several alternative
variations in 400 schools. To everyone’s surprise, the
original programme produced the best results.
IPA frequently finds that programmes assumed to
work don’t work, or don’t work as expected, even if
they have been running for a long time. The Ghanaian
government’s positive experience has strengthened
its commitment to testing policies and rigorously
evaluating their impact before implementing them.
Other countries where policymakers seem to be open to
the findings of rigorous research include Kenya, Zambia,
Mexico and even Liberia as it recovers from conflict.
As Richard Thaler, American co-author of the
best-selling book Nudge, points out: ‘Governments can’t
make evidence-based policy decisions unless they have
some evidence.’ Philanthropic money is uniquely well
placed to provide it.
The surge in farmland and commodities investments
is causing widespread concern about ‘land-grabbing’
and the accelerated loss of biodiversity, water
depletion, soil erosion and human rights abuses.
These investments are expected to grow substantially
over the next decade, given the growing global
demand for commodities and rising commodity
prices; natural resource limitations; and farmland
being a ‘real asset’ that offers diversification to
investors’ portfolios at a time of volatility in global
financial markets. The need to increase food
production in the next decade, against a backdrop of
pressures on land and water, puts the question of land
at the centre of a new security agenda.
In March 2012, a report by the Earth Security
Initiative (ESI) involved investors and activists in
exploring how to create new economic and political
incentives for sustainable land investments. The
report portrays land assets as being at the heart
‘We are a tiny, tiny little organization,’ says Bill Gates
about the largest foundation that the world has
ever seen. He’s right: the Gates Foundation’s annual
grantmaking is only a tiny fraction of governments’
budgets. But smart philanthropic money can act
like a tug, guiding tankers much bigger than itself
such as companies or governments. It does that by
identifying what works.
In India in 2005, a third of children in one study
couldn’t read even a short paragraph. As school
enrolment grew, even more students were falling
behind. Innovations for Poverty Action (IPA) –
which uses randomized control trials to evaluate
programmes which counter extreme poverty –
worked with an Indian NGO to evaluate a programme
using assistants drawn from the community to
teach basic skills to the lowest-performing students.
The trial found that the programme significantly
increased basic competency for the lowest achievers,
and cost only $2.25 per student. The government of
Ghana had a similar problem: it spends £450 million
a year on basic education but only 20 per cent of
Encouraging sustainable land investments
Moving the tanker
Alejandro Litovsky is founder and director of the Earth Security Initiative. Email [email protected]
Caroline Fiennes is director of Giving Evidence. Email [email protected]
Jeff Mosenkis is global outreach coordinator at IPA. Email [email protected]
Caroline Fiennes and Jeff Mosenkis
Alejandro Litovsky
www.poverty-action.orgFor more information
To find out more and to download The Land Security Agenda visit www.earthsecurity.org/projects/landsecurity
For more information
focus on what c an data do for phil anthropy? p55
Alliance Volume 17 Number 3 September 2012 www.alliancemagazine.org
GLOSSARY
Big Data A term used to describe
data sets so large that they
become awkward to work
with using standard database
management tools. (Source:
Wikipedia) The 40 billion photos
handled by Facebook and the 1
million customer transactions
logged by Walmart every hour
are examples.
Cloud computing
Location-independent
computing in which shared
servers provide resources,
software and data to computers
and other devices on demand.
Typical cloud computing
providers deliver common
business applications that
are accessed from another
web service or software
like a web browser. (Source:
TheFreeDictionary.com)
Google’s online suite of office
productivity tools and webmail
(Hotmail, Yahoo Mail, Gmail) are
examples.
Data Factual information (as
measurements or statistics)
used as a basis for reasoning,
discussion or calculation;
information, typically in
numerical form, that can
be digitally transmitted or
processed. (Source: M-W.com)
Database A comprehensive
collection of related data
organized for convenient
access, generally in and
through a computer. (Source:
Dictionary.com) Amazon.com’s
recommendation system and the
Foundation Center’s Foundation
Directory Online are examples.
Data analysis The process of
studying and summarizing
data with the intent to extract
useful information and develop
conclusions. (Source: Wikipedia)
Data mining The automatic or
semi-automatic analysis of large
quantities of data to discover
and extract previously unknown
patterns. (Source: Wikipedia)
The classic, oft-cited example
involves Walmart, which
through data mining discovered
that a significant number of men
were coming into their stores in
the late afternoon and buying
just diapers and beer.1
Data visualization Any
technology that communicates
data clearly and effectively
through graphical means.
(Source: Wikipedia) See
p57 for links to sites that
offer wonderful examples
of state-of-the-art data
visualizations.
Open data The idea that
certain data should be freely
available to everyone to use and
republish as they wish, without
restrictions from copyright,
patents or other mechanisms
of control. (Source: Wikipedia.)
Data.gov, an initiative launched
by the Clinton administration
to increase the ability of the
public to find, download and
use datasets generated by the
US government, is probably the
best-known example.
1 www0.cs.ucl.ac.uk/staff/a.hunter/tradepress/dm.html
as a distinct field of philanthropy in Europe, as it is in
the US. More wealth managers and family offices are
including family foundation philanthropy in their
client advice, with examples including recent UBS
initiatives and a seminar by the Institute for Family
Business in the UK. The research has provided a
platform to bring philanthropists such as Tom Hunter,
Trevor Pears and the late Nigel Doughty together in
discussion, as happened at its 2011 launch at Cass
Business School. This has fostered donor networking
and experience sharing while also highlighting the
value of mutual learning among family donors, and
a potential role for philanthropy advisers in creating
appropriate networking opportunities. As one donor
said: ‘it was as if I had set sail without a rudder.’
All of this depended on the project’s pioneering work
in identifying family foundations and capturing data
from disparate and fragmented sources. Learning
from international comparison was limited because
few European countries have the information available
in the UK through the annual reports and accounts
submitted to the Charity Commission. An important
outcome, therefore, was highlighting the gaps in our
knowledge. More academic research on foundations
will become even more important as we move beyond
individual foundation stories to a more systematic
appreciation of the nature and impact of their work.
So what have the data revealed? That the largest
100 family foundations in the UK are responsible
for between 7 and 10 per cent of all charitable
giving; that giving through family foundations has
been relatively robust through recent economic
turbulence compared to individual and corporate
giving. Over time, the data will provide an indicator
of the response of philanthropy to a prolonged
downturn.
These findings point to one major outcome of the
project: it has helped establish family foundations
Putting family foundations on the mapTrying to change the world through philanthropy without data on what
we do is like starting a journey without compass or map. This was the
recognition that led to the collaboration between Pears Foundation
and the Centre for Charitable Giving and Philanthropy (CGAP) on Family
Foundation Giving Trends, which presents annual data on major family
foundation giving in the UK, US and Europe. Now into its fifth edition, it
has clear objectives: to provide a reliable and transparent benchmark of
family foundation giving and to arouse the interest of wealthy families in
philanthropic activities by demonstrating what many are already doing.
Cathy Pharoah is director of CGAP. Email [email protected]
Charles Keidan is director of Pears Foundation. Email [email protected]
Cathy Pharoah and Charles Keidan
focus on what c an data do for phil anthropy?p56
Alliance Volume 17 Number 3 September 2012 www.alliancemagazine.org
This list of resources and examples
was compiled by Jeff Stanger, founding
director of the Center for Digital
Information. Email [email protected]
Robert Wood Johnson Foundation: County
Health Rankings & Roadmaps
www.countyhealthrankings.org
Based on a model of population health
that emphasizes the many factors that
can help make communities healthier
places to live; ranks the health of nearly
every county in the US.
WASHfunders.org
http://washfunders.org
Interactive map that allows users to see
who is funding WASH strategies around
the world, with results filterable by
country, strategy and other indicators.
Other examplesClimate and Development Links
(World Bank)
http://climate4development.worldbank.
org
Interactive map that allows users to
explore the difference between two
climate change scenarios that assume
different development pathways and
associated greenhouse gas emissions.
Gay Rights in the United States (Guardian
newspaper)
www.guardian.co.uk/world/
interactive/2012/may/08/gay-rights-
united-states
Interactive graphic that shows how the
handling of gay rights varies by state.
OECD Better Life Index
www.oecdbetterlifeindex.org
Interactive tool that allows users to see
how OECD countries perform according
to the importance the user gives to each
of 11 factors that contribute to well-being
and a better life.
Related resourcesCenter for Digital Information Dashboard
http://digitalinfo.org/showcase
Highlights innovative examples of
the changing form of information in
the digital age, with examples drawn
from journalism, publishing, research,
government and elsewhere
Examples from the fieldData analysis and visualization
applied to a range of traditional
foundation activities.
Annie E Casey Foundation: KidsCount
Data Center
http://datacenter.kidscount.org
One of the first rich, data-driven
applications from a foundation; provides
access to hundreds of measures of child
well-being in the US, by and across states
and in a mobile format.
Bill & Melinda Gates Foundation:
Infographics
www.gatesfoundation.org/infographics/
Pages/infographics.aspx
Information graphics designed to
help explain the aims and impact of
the foundation’s work, from vaccine
delivery to supporting women farmers in
developing countries.
California HealthCare Foundation: Medical
Variation Rates
www.chcf.org/publications/2011/09/
medical-variation-rates-california
Interactive map that presents, in multiple
formats, elective surgery and other
procedure rates across California relative
to state averages.
Data resources ‘For data to be useful in philanthropy they have to be known, accessible, and compoundable (able to be mixed and combined).’ So wrote Lucy Bernholz in a post on her Philanthropy 2173 blog in July.1 The following resources and examples, from philanthropy and beyond, are intended to help you think about your data in new and more interactive ways.
DataKind
http://datakind.org
Formerly known as Data Without
Borders, DataKind brings together
leading data scientists with high-impact
social organizations.
Drawing by Numbers
http://drawingbynumbers.org
Created by the Berlin-based Tactical
Technology Collective, this site offers
open-source software tools to help
you make your own charts, maps and
mashups; advice on the tactical use
of data and visual communication for
activists; and online manuals, toolkits
and tutorials.
Gapminder
www.gapminder.org
‘Fact tank’ founded by Swedish doctor,
academic and statistician Hans Rosling to
promote a fact-based view of sustainable
global development and achievement of
the UN Millennium Development Goals.
Google Charts | Fusion Tables
https://developers.google.com/chart
http://www.google.com/fusiontables
Charting tools from search giant Google
make it easy to merge public data with
your own and display it all live on
your website.
Mapbox
http://mapbox.com
Project of Development Seed, a creative
data visualization team based in
Washington DC; allows users to create and
publish fast, interactive maps for web and
mobile devices.
Tableau Public
www.tableausoftware.com/public
Free data visualization tool that allows
users to create interactive visualizations
from their data and embed them in
a website.
Visualizing.org
http://visualizing.org
Self-billed as ‘a community of creative
people making sense of complex issues
through data and design’.
1 http://philanthropy.blogspot.com/2012/07/data-new-element.html
focus on what c an data do for phil anthropy? p57
Alliance Volume 17 Number 3 September 2012 www.alliancemagazine.org