Embed Size (px)
Citation preview

www.allgeier.com
Company Presentation January 2019

www.allgeier.com
Agenda
2
Allgeier at a glance
Leadership
Business segments
Fast-growing technologies and future trends
Performance

www.allgeier.com
Allgeier is a high-growth Group with 9,000+ highly qualified IT experts and global shoring across 27 countries
Allgeier at a glance
3
27 countries on 5 continents
140 branches
~575 EUR m sales1
3,000+ customers
9,000+ staff
High sales
growth in
recent 10 years:
CAGR +15% p.a.
1) in 2017 FY, continuing operations according to IFRS as of September 30, 2018 (unaudited), 2018E according to FC 10+2; 2017: adjusted figures according to IFRS 15
Sales1 in EUR m
0
100
200
300
400
500
600
700
2012 2010 2008 2009 2011 2014 2013 2015 2016 2017 2018
~ 574 m€
~ 163 m€
CAGR +15%

www.allgeier.com
100k professionals in IT expert pool
1,000+ SAP & Microsoft consultants
Experts Professional
Workforce
Solutions
Enterprise Services Business Process
Consulting
Allgeier at a glance
4
With a highly specialized team we are offering cutting-edge technology solutions and services to create competitive advantage for the digital future
Technology Disruptive
Technology
Services
3 business segments
5,500+ software & application developers

www.allgeier.com
Local and international presence gives Allgeier flexibility for allocation of resources
Allgeier at a glance
5
Presence in 27 countries on 5 continents
82 sites in Germany
8 sites in Austria and Switzerland
22 sites in rest of Europe and Turkey
12 sites in the USA, Canada and Mexico
13 sites in India, China, Singapore, Vietnam, Malaysia, Thailand, Japan & UAE
2 sites in Australia
1 site in South Africa
“Blended shoring“ approach with onsite presence and flexible nearshore / offshore capacities
Czech Republic (Prague), Poland (Warsaw) and Romania (Timisoara,Cluj-Napoca, Brasov, Sibiu, Craiova and Bucharest) are EU nearshore sites
India and China with more than 4,000 highly qualified developers1 are the offshore centres for high-end software & application development & management
Additional offshore development unit in Vietnam 1) as of September 30, 2018, incl. first time consolidation of Objectiva & iQuest employee figures preliminary (own estimates)
Staff Germany1: >4,400
Staff Rest of Asia & Australia1: ~500
Staff America1: ~200
Staff Rest of Europe & Africa1: ~1,700
Staff India1: ~4,000

www.allgeier.com
Sales by country2
Allgeier at a glance
6
2014
442
4% 8%
77% 79%
2015
11%
5%
3%
4%
12%
74%
2016 2017
12%
75%
372
494
574
Switzerland
UK
Rest of World
Austria
Sweden
Finland
USA
Germany
1) Compound Annual Growth Rate (average yearly growth) 2) Sales in EUR million (as not stated otherwise), continuing operations according to IFRS as of September 30, 2018 (unaudited, partly own calculation), 2017: adjusted figures according to IFRS 15
Allgeier is growing globally
USA: + 8 Mio.
+ Germany: + 65 Mio.
Rest of World: + 9 Mio.

www.allgeier.com
We report in three business segments and are broadly positioned in terms of industries and customers
Allgeier at a glance
7
1) Sales in EUR million, continuing operations according to IFRS as of September 30, 2018 (unaudited), 2017: adjusted figures according to IFRS 15
Banking & Insurance: 17%
Telecommunications: 7%
Industrial sector: 21%
Public sector: 13%
IT: 13%
Other industries: 21%
Industries1 Customers1
Rest of World: 4%
USA: 12%
Germany: 75%
Regions1
2017
Austria & CH: 4% Nordics: 5%
Other customers: 15 %
2017 2017 15
442
372
14
494
16 2017
574
Experts: 44%
Technology: 38%
Enterprise Services: 17 % TOP 10: 25%
TOP 11–100: 60% Trade & Logistics: 8 %
Business segments1

www.allgeier.com
Allgeier works for leading companies across a range of different industries – from global industry and market leaders to medium-sized businesses
Allgeier at a glance
8
Telecommunications • Complex mobile applications project mgmt • Development, testing and integration of
mobile applications • Development of multi-level service
organisations for application operations and products
Banks / Insurance • Expert leasing • IT consulting • Infrastructure projects • Service jobs • Application development • IT security and forensics
Energy, Automotive and other industries (i. e., chemical, consumer goods, aviation, metal working, construction) • Business process consulting • Adapting and implementing ERP systems • Development and implementation of indivi-
dual solutions along the entire supply chain
Information Technology • Recruiting, expert leasing & staffing • IT consulting • Project management, IT Architecture, IT
design, migration, installation, configuration • IT managed services • Application development & management
Public Sector • Expert leasing • Software development & lifecycle services • Application development & portals • E-Business & E-Government solutions • IT consulting
Other sectors (i. e., trade and logistics, services, health care, media & entertainment, publishing) • Web shops (e-commerce) and portals • Software and application development • Proprietary software and solutions • SAP and Microsoft full-service
1
2
3
4
5
6
1
2
3
4
5
6
8%
11%
17%
7%
23%
19%
2014
18%
8%
27%
8%
18%
2015
17%
22%
21%
8%
17%
18%
2016
16%
32%
7%
22%
13%
13%
2017
372
442
494
574
29%
Sales by industry1
1) All figures in EUR million, continuing operations according to IFRS as of September 30, 2018 (unaudited)

www.allgeier.com
We make Lufthansa the most digital
carrier in the world.
We create game-changing S/4HANA
retail solutions for the IoT era.
We deliver IT and engineering experts for
leading international banking companies
to create digital banking of the future.
For our clients we solve some of the most complex business challenges and we aim to leverage technology to improve the lives of billions of customers worldwide
Allgeier at a glance
9
21 out of German top 30 companies and
market-leaders from all around the
world are amongst our customers
We have
grown from 227 to >5,500 software developers in recent 10 years

www.allgeier.com
Agenda
10
Allgeier at a glance
Leadership
Business segments
Fast-growing technologies and future trends
Performance

www.allgeier.com
Manas
Fuloria, PhD
46y, Delhi
Leadership
11
Get to know the Allgeier Group Executive Board
Dr. Marcus
Goedsche
46y, Munich
Hubert
Rohrer
55y, Bremen
Carl Georg
Dürschmidt
60y, Munich

www.allgeier.com
Agenda
12
Allgeier at a glance
Leadership
Business segments
Fast-growing technologies and future trends
Performance

www.allgeier.com
We consult in change of business models supporting our customers to build up the most competitive and agile
processes for the digital era. We call this enabling game-change in digitization.
Business segment Enterprise Services is one of the most sophisticated and fastest-growing SAP & Microsoft full-service consultants
13
1,000+ software consultants
SAP S/4 Public Cloud Lighthouse Partner
Gold Microsoft Partner
#1 Leading mid-sized IT consulting & system integration companies GER1
Cloud Focus Partner
Business segments
Sales 20172:
EUR 100 m
1) 2017 2) continuing operations according to IFRS as of Sept. 30, 2018 (unaudited), incl. intercompany balances between segments, adjusted figures according to IFRS 15

www.allgeier.com
Flexible blended shoring across 5 continents
Acting globally, thinking beyond
5,500+ software developers & UX designers
Business segment Technology is a truly global specialist for digitization of mission-critical business processes and disruptive technology services
Business segments
14
66 development sites in 26 countries
We solve some of the most complex business challenges for our clients leveraging cutting-edge technology with agility and innovation. We call this approach Thinking Breakthroughs.
Sales 20171:
EUR 219 m
1) continuing operations according to IFRS as of Sept. 30, 2018 (unaudited), incl. intercompany balances between segments, adjusted figures according to IFRS 15, without consolidation of new entities iQuest and Objectiva

www.allgeier.com
100k professionals in IT expert pool
10,000+ highly qualified candidates
3,000+ IT & engineering experts
Business segment Experts is a market-leading one-stop-shop for professional workforce solutions
Business segments
15
45 sites delivering just in time expert services
We deliver the best technology experts for a successful digital transformation of businesses – fitting our customers needs with an ideal combination of personnel and project services from a single source.
Sales 20171:
EUR 256 m
1) continuing operations according to IFRS as of Sept. 30, 2018 (unaudited), incl. intercompany balances between segments, adjusted figures according to IFRS 15

www.allgeier.com
Agenda
16
Allgeier at a glance
Leadership
Business segments
Fast-growing technologies and future trends
Performance
www.allgeier.com
220 246 259 256
115
154
197 219 41
48
43
100
2014 2015 2016 2017
Experts Technology Enterprise Services
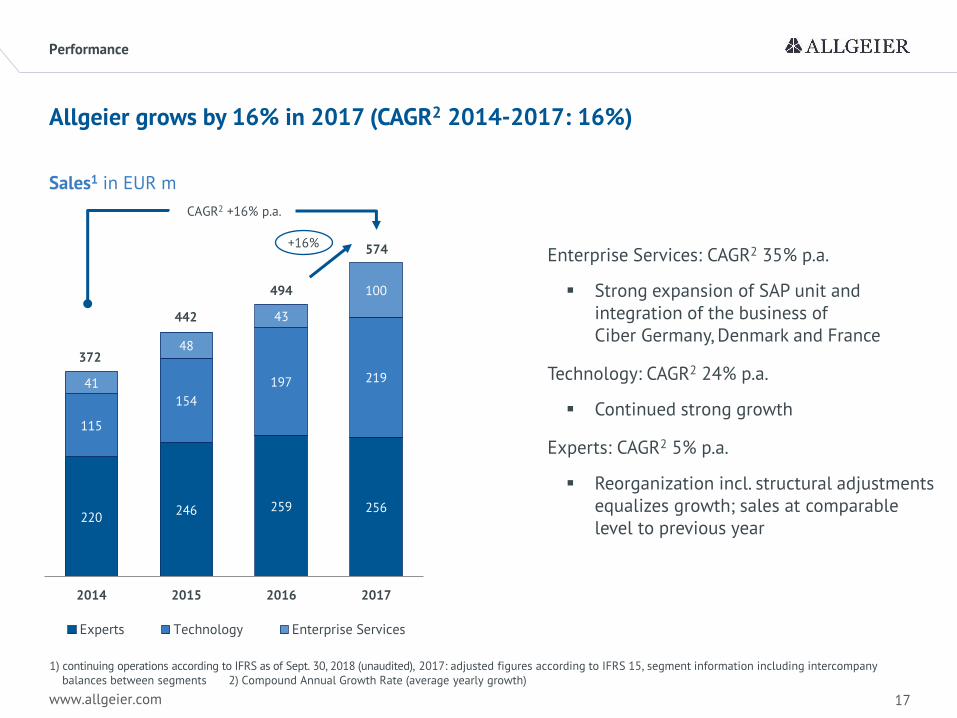
Allgeier grows by 16% in 2017 (CAGR2 2014-2017: 16%)
17
Performance
Sales1 in EUR m
1) continuing operations according to IFRS as of Sept. 30, 2018 (unaudited), 2017: adjusted figures according to IFRS 15, segment information including intercompany balances between segments 2) Compound Annual Growth Rate (average yearly growth)
CAGR2 +16% p.a.
494
442
372
574 +16%
Enterprise Services: CAGR2 35% p.a.
Strong expansion of SAP unit and integration of the business of Ciber Germany, Denmark and France
Technology: CAGR2 24% p.a.
Continued strong growth
Experts: CAGR2 5% p.a.
Reorganization incl. structural adjustments equalizes growth; sales at comparable level to previous year

www.allgeier.com
Quarterly development shows continued sales growth
18
Performance
Sales1 (on quarterly basis) in EUR m
86 91
107
133
155
88
107
128
141
172
94
115 117
146
176
104
128
142
154
196
2014 2015 2016 2017 2018
442
372
494
574
FY 2017 growth investments pay off: Significant sales growth in 2018 fiscal year
1-3Q 2018 with continued sales growth, strongest three quarters in the company's history
1-3Q 2018: 503 EUR m (+20 %, PY: 420 EUR m)
2018E1: 700 EUR m (+22 %, PY: 574 EUR m), value added (E) up by 27 %
1) continuing operations according to IFRS as of September 30, 2018 (unaudited), 4Q2018E according to FC 10+2;2017: adjusted quarterly figures according to IFRS 15
700

www.allgeier.com
10.3 10.6 10.9
4.7
13.1 16.2
27.3
27.7
1.4
1.5
-0.5
4.0
-4.4 -4.6 -6.3
-10.4
2014 2015 2016 2017
Experts Technology Enterpr. Services Holding, other segments & consolid.
2017 results impacted by growth investments
19
Performance
1) continuing operations according to IFRS as of Sept. 30, 2018 (unaudited), segment information incl. intercompany balances between segments, 2017: adjusted figures according to IFRS 15
31.4
20.4
23.7
26.0
Enterprise Services
Favourable development of existing business
No contribution to earnings from SAP unit yet
Technology
2017 year of consolidation at a high level after strong growth in the previous year
Experts
New positioning and growth investments cost earnings in 2017
Holding, other segments and consolidation
Initial investments in segment New business areas
Holding company costs
-4.4 -4.2 -5.9 -8.2
Consolidation -0.0 -0.4 -0.4 -0.3
Other segments -0.0 -1.9
EBITDA1 in EUR m

www.allgeier.com
After dip in earnings in 2017, significant earnings growth in 2018
20
1) continuing operations according to IFRS as of September 30, 2018 (unaudited), 4Q2018E according to FC 10+2;2017: adjusted quarterly figures according to IFRS 15
Performance
EBITDA1 (on quarterly basis) in EUR m
4.7
2.4
5.6 5.3
6.7
5.0
6.4
7.8
4.7
9.8
7.7
9.0 9.2
9.9 9.7
3.1
5.7
8.9
6.1
9.4
2014 2015 2016 2017 2018
23.7
20.4
31.4 26.0
FY 2017 growth investments pay off: Significant earnings growth in 2018 fiscal year
1-3Q 2018 with significant increase in earnings, strongest first three quarters in the company's history
1-3Q 2018 EBITDA: 26.1 EUR m (+32 %, PY: 19.8 EUR m)
2018E EBITDA1: 35.6 EUR m; 2018E adjusted EBITDA1: 45.4 EUR m
35.6

www.allgeier.com 21
Contact
Allgeier SE
Wehrlestraße 12
81679 Munich
Germany
Tel: +49 (0) 89 99 84 21-0
Fax: +49 (0) 89 99 84 21-11
Email: [email protected]
Web: www.allgeier.com

www.allgeier.com