Embed Size (px)
Citation preview
RSC Advances
PAPER
Ope
n A
cces
s A
rtic
le. P
ublis
hed
on 0
4 Se
ptem
ber
2020
. Dow
nloa
ded
on 3
/16/
2022
2:3
0:41
PM
. T
his
artic
le is
lice
nsed
und
er a
Cre
ativ
e C
omm
ons
Attr
ibut
ion-
Non
Com
mer
cial
3.0
Unp
orte
d L
icen
ce.
View Article OnlineView Journal | View Issue
All-organic, cond
aUniversity of Moratuwa, Bandaranayake
E-mail: [email protected] Lanka Institute of Nanotechnology (SLIN
Mahenwatte, Pitipana, Homagama 10200, S
† Electronic supplementary informationschematic diagram of test circuit for capparatus for measuring resistance vs.
degraded bers. See DOI: 10.1039/d0ra05
Cite this: RSC Adv., 2020, 10, 32875
Received 21st June 2020Accepted 24th August 2020
DOI: 10.1039/d0ra05430e
rsc.li/rsc-advances
This journal is © The Royal Society o
uctive and biodegradable yarnsfrom core–shell nanofibers throughelectrospinning†
Vishakha T. Weerasinghe,a D. G. Kanchana Dissanayake, a
W. Pamoda T. D. Perera, b Nadeeka D. Tissera,b Ruchira N. Wijesenab
and Nandula D. Wanasekara *a
Electrically conductive and biodegradable materials are desired for a range of applications in wearable
electronics to address the growing ecological problem of e-waste. Herein, we report on the design and
fabrication of all-organic, conductive and biodegradable nanofibrous core–shell yarn produced by in situ
polymerization of aniline on the surface of electrospun poly(3-caprolactone) nanofibers. The effect of
concentration of aniline monomer on the morphology and resistivity of deposited polyaniline layer was
investigated. The electrical resistance changed almost instantaneously with the strain for multiple stretch
and recovery cycles. This rapid and sensitive response to mechanical loading and unloading is promising
to validate the possibility of using the conductive yarns as strain sensors for monitoring human motion.
Increasing the number of plies of yarn to three resulted in a three-fold reduction of the resistance. The
twisted plied yarns were incorporated into fabric by stitching to demonstrate their use as a wearable
electrode for capacitive sensors. This approach presents an early step in realizing all-organic conductive
biodegradable nanofibrous yarns for biodegradable smart textiles.
Introduction
Smart textiles have attracted great interest in a range of eldssuch as healthcare, public safety, space exploration, consumertness and sport1,2 with the use of antennas,3 sensors4 andelectromagnetic interference shielding devices.5 Nowadays, themost commercial applications of smart textiles are fabricated byintegrating rigid conventional electronic hardware units intoclothes.6 However, these devices have limited the desiredproperties of textiles such as breathability, exibility and light-weight. Therefore, the eld of wearable electronics is beingrevolutionized by integrating electronic functionalities directlyinto fabric, yarn or ber.7 Conductive yarn is an importantcomponent of smart-textiles, which can be utilized as electrodesor connectors by weaving, knitting and/or stitching.8,9 Gener-ally, conductive yarns are manufactured by embedding orcoating inorganic materials such as carbon, silver, gold, nickel,and copper. Even though these composite yarns have superior
Mawatha, Moratuwa 10400, Sri Lanka.
TEC), Nanotechnology and Science Park,
ri Lanka
(ESI) available: PANI polymerization,onductivity measurement, homemadestrain, woven and sewn yarn, SEM of430e
f Chemistry 2020
conductivity, the inorganic component may lead to severaldrawbacks such as chemical corrosion, low-strength, sloughingof deposition, stiff feeling, easy decay10 and limitations ofprocessability. The use of organic conductive polymers witha range of properties offer a better alternative to impartconductivity to smart textiles.11
Conductive polymers have attracted much attention as theonly choice for organic conductors and they exhibit interestingelectronic, electrical, optical and magnetic properties.12,13
Among an array of conductive polymers, polyaniline (PANI) hasbeen popular owing to the good environmental and thermalstability, light-weight, optical properties, and high electricalconductivity.14,15 These polymers have been incorporated intowet-spun or electrospun yarns as a coating or a ller.16 Elec-trospinning is a robust process that is capable of producingnanobre mats with a range of tunable properties such as berdiameter, strength and porosity.17 Furthermore, electro-spinning provides the ability to produce ultrathin aligned ornon-aligned ber webs or continuous nanobrous yarns withexcellent mechanical properties and high surface area.18,19 Thehigh conductivity coupled with large specic surface areaprovides an excellent platform to fabricate capacitive andresistive sensors.20,21
The development of conductive yarns from PANI coated orblended polyacrylonitrile (PAN) electrospun yarns22,23 andpolyethylene terephthalate (PET) melt spun yarns have beenreported.14 However, with the increased attention to sustainable
RSC Adv., 2020, 10, 32875–32884 | 32875

Fig. 1 Schematic of the apparatus for producing continuous twistedyarns.
RSC Advances Paper
Ope
n A
cces
s A
rtic
le. P
ublis
hed
on 0
4 Se
ptem
ber
2020
. Dow
nloa
ded
on 3
/16/
2022
2:3
0:41
PM
. T
his
artic
le is
lice
nsed
und
er a
Cre
ativ
e C
omm
ons
Attr
ibut
ion-
Non
Com
mer
cial
3.0
Unp
orte
d L
icen
ce.
View Article Online
textile production routes, PAN and PET polymers do presentwith problems in disposal due to non-biodegradability. Wasteprevention in the design stage is an initial strategy than recy-cling or end of life treatments.24 Biodegradable materials suchas poly(ethylene-co-vinyl acetate), poly(lactic acid) (PLA), poly(3-caprolactone) (PCL), poly(ethylene glycol)25,26 provides a bettersolution, if applicable, to prevent adverse impact of e-waste of e-textiles at the design stage. PCL was chosen as the biodegrad-able polymer for this study due to the proven ability to producenanobres with good physical properties.27 Moreover, PCLcould be used as an insulating polymer to provide structuralstability in humid environments due to its insolubility inwater.28 Hence, the development of PANI/PCL conductive andbiodegradable nanobrous yarn (CBNY) is highly desired in thecurrent context of smart textiles.29,30
Herein, we report on the synthesis and manufacturing ofconductive polymer based biodegradable core–shell nano-brous yarns. The nanobrous core was prepared by electro-spinning PCL and subsequently, aniline was in situ polymerizedon the surface of the electrospun bers to form the shell. Theseconductive and biodegradable nanobrous yarns (CBNYs) werecomprehensively characterized for monomer concentration,morphology, electrical resistance and biodegradability. It isenvisaged that this nanobrous yarn would serve as a short life-cycle substitute for the components of smart textiles elimi-nating e-waste.
ExperimentalMaterials and reagents
All chemicals and reagents were analytical grade and usedwithout further purication. Aniline (ACS reagent, $99.5%),dimethylformamide (DMF, ACS reagent, $99.8%), chloroform(CHCl3, 99.8% purity), ethyl alcohol (200 proof, anhydrous,ZerO2®, $99.5%) and polycaprolactone (PCL, average Mn80 000) were purchased from Sigma Aldrich and used asreceived. Ammonium persulphate (ammonium perox-ydisulphate (APS)) was purchased from Research-Lab FineChem Industries. Hydrochloric acid (HCl, extrapure AR 37%)was purchased from Sisco Research Laboratories Pvt. Ltd.
Preparation of PANI/PCL nanobrous yarns
PANI/PCL yarns were prepared by a two-step method. First, anelectrospun PCL nanobrous yarn (PNY) was manufactured. Inorder to prepare the electrospinning solution, PCL was dis-solved in a solvent mixture of DMF and chloroform (volumeratio of DMF : chloroform ¼ 1 : 4) with a concentration of 10%(w/w). A customized electrospinning setup was employed tomanufacture PCL yarns (Fig. 1). Two syringes connected to thedirect current (DC) high voltage power supply (MATSUDAPrecision 0–30 kV) were placed symmetrically on two sides ofa grounded funnel. The applied voltages of two needles(diameter ¼ 1.2 mm, length ¼ 38 mm) were 25 kV and solutionow rate was maintained at 10 � 2 ml min�1 for both syringes.The distance between the needle tip and collector was main-tained 15 cm. Other reported work on conductive nanobres
32876 | RSC Adv., 2020, 10, 32875–32884
has also reported similar distances between the needle tip andthe collector.31 The rotational speed of the funnel and the take-up roller were maintained at 250 rpm and 2 mm min�1,respectively. The twist of the yarn was inserted by rotation of thefunnel. When the initial cone was formed, a yarn was drawn outtowards the take-up roller.
As the second step, PANI layer was synthesized on the surfaceof PNY by in situ chemical oxidative polymerization of aniline(Fig. 2). The oxidation of aniline monomer was achieved withthe help of ammonium persulfate (APS) as the oxidizing agent.In this method, the formed polymer precipitates in the reactionmedium and can be deposited in various non-conductivehydrophilic and hydrophobic surfaces.32 In order to synthesizePANI layer, PNY was wound on a nylon mesh to prepare a PCLyarn skein and then this was immersed in 50 ml aniline/HClsolution which was kept in a mechanical shaker at 100 rpm atroom temperature (27 �C) for 30 min. Next, 50 ml of APS/HCLmixture was added dropwise to the solution and agitated inthe same conditions for 30 min until the solution became darkgreen color (Fig. S1†). The higher conversion percentage(�90%) of aniline to polyaniline can be obtained by keeping thereaction time for 30 min.33 The monomer, unreacted initiator,and water-soluble oligomers were removed by consecutivewashing from 1 M HCl, deionized water, and ethanol. Subse-quently, the yarn was washed with 1 M HCl, deionized water,ethanol and dried in a vacuum oven at 30 �C for 4 hours. APSand aniline were mixed with HCL as shown in the Table 1 to varythe aniline concentration.
A custom-made twisting device was prepared as shown inFig. 3. This device has two sets of clamps of which one set isstationary and the other set is moveable. The device can befurther customized by installation of additional clamps asnecessary for the required number of plies. The plied yarns wereprepared based on self-twist principle to make the yarn attainthe mechanical stability to avoid instinctive untwisting. Twopieces of the twisted yarns that were obtained from continuouselectrospinning setup were clamped to stationary clamps andthe other sides were rotated to provide ‘S’ and ‘S’ twist into eachof the two strands as shown in Fig. 3(a). When moveable clampswith two twisted strands were brought closer, they immediately
This journal is © The Royal Society of Chemistry 2020

Table 1 The aniline and APS volumes used for in situ polymerization of aniline
Aniline concentration(v/v %)
HCl concentration(M)
Aniline volumeper 50 ml of HCl (ml)
APS weight per50 ml of HCl (g)
0.5% 0.5 250 0.7751.0% 1.0 500 1.5502.0% 2.0 1000 3.100
Fig. 2 Schematic illustration of fabrication of PANI decorated PNYs.
Paper RSC Advances
Ope
n A
cces
s A
rtic
le. P
ublis
hed
on 0
4 Se
ptem
ber
2020
. Dow
nloa
ded
on 3
/16/
2022
2:3
0:41
PM
. T
his
artic
le is
lice
nsed
und
er a
Cre
ativ
e C
omm
ons
Attr
ibut
ion-
Non
Com
mer
cial
3.0
Unp
orte
d L
icen
ce.
View Article Online
converged into Z self-twist as shown in Fig. 3(b) and themovable clamps were rotated around the axis of xed clamps.This process resulted in a twisted yarn of approx. 20 twists perinch. Similarly, three single-ply yarns were twisted into 3-plyyarn by giving Z twist with 10 twists per inch.
Fig. 3 Schematic diagrams showing the set-up used to further (a)twist single electrospun yarns and (b) twist to produce ply yarns.
This journal is © The Royal Society of Chemistry 2020
Characterization methods
The surface topography and morphology of nanobrous yarnswere examined using eld emission scanning electron micro-scope (FESEM), Hitachi SU6600 Analytical Pressure FESEM.
Prior to SEM imaging, the sample surface was coated witha thin gold layer (�1 nm) using a Hitachi sputter coater deviceto make the sample surface conductive. The yarn resistancealong the yarn length was measured by the two-probe methodusing (Fluke 289 True-RMS Data Logging Multimeter). Theconductive yarn was released from one end and wound fromother end as shown in the schematic arrangement in (Fig. S2†).Out of the two probes, one probe was kept stationary andmovable probe was dragged along the yarn length by increasingthe distance between two probes by 1 cm. In addition, electricalcharacteristics were measured utilizing a Keithley 2450 SMUfour-probe instrument by changing current source between�10mA to +10 mA.
Differential Scanning Calorimeter (Q2000 DSC from TAInstruments, New Castle DE) was used to determine the thermalproperties of PANI/PCL bers. Samples were heated up to 400 �Cin nitrogen atmosphere at a rate of 10 �C min�1. Thermogra-vimetric analysis (TGA) was performed in a nitrogen atmo-sphere using an STD Q600 instrument. Small pieces of yarn
RSC Adv., 2020, 10, 32875–32884 | 32877

RSC Advances Paper
Ope
n A
cces
s A
rtic
le. P
ublis
hed
on 0
4 Se
ptem
ber
2020
. Dow
nloa
ded
on 3
/16/
2022
2:3
0:41
PM
. T
his
artic
le is
lice
nsed
und
er a
Cre
ativ
e C
omm
ons
Attr
ibut
ion-
Non
Com
mer
cial
3.0
Unp
orte
d L
icen
ce.
View Article Online
samples (10–15 mg) was compressed onto an alumina pan thatwas heated from room temperature to 1000 �C at a heating rateof 20 �C min�1. The percentage of weight loss and ash contentwere derived and studied using TGA curves. The effect ofstretching on resistance was measured at variable percentagesof displacements from the initial length of the yarn. The strainwas applied from 0–400% using a homemade apparatus asshown in Fig. S3.† Then the behaviour of resistance of thedevice for eight stretch and recovery cycles at 20% strain wasstudied by measuring the resistance of the device with respectto time.
Biodegradation under controlled composting conditions
Biodegradability of PCL and PANi/PCL coated lms were testedaccording to ASTM 5338 standard. The biodegradability wascompared against the cellulose lter papers as the positivecontrol and polyethylene plastic sheets as the negative control.
The test specimens were prepared with the dimensions of 25� 25 mm2 pieces. Water was added to the soil until the overallmoisture content becomes 50%. The samples were observedweekly, and the excess liquid was added to maintain constantmoisture content. The samples were kept at a temperature of 58� 2 �C. Further, the samples were shaken weekly to maintainuniformity. The sample containers were lled up to 75% of the
Fig. 4 (a) A photograph of the 3D nanofiber cone drawn out towardsthe collector and SEM images of (b) twisted yarn (c) aligned PCLnanofibers and (d) magnified image of (c). (e) PANI/PCL core–shellnanofibers and (f) magnified image of (e).
32878 | RSC Adv., 2020, 10, 32875–32884
maximum content of specimen and soil.34 The samples wererecovered from compost soil weekly. Then the weight wasmeasured to calculate the weight loss, the change of physicalappearance was recorded and reburied. Furthermore, themorphology of degraded PANI nanober mats were observedusing SEM images.
Results and discussionYarn morphology
The SEM image analysis revealed that electrospun yarns wereconsisted of twisted bers (diameter ¼ 450 � 50 nm), whichwere aligned on the direction of the twist (Fig. 4(a–c)). This twistin bers could have been resulted from the rotation of thefunnel while the yarn was drawn out by the take-up roller. NeatPCL yarn morphology exhibited a network of bers as shown inFig. 4(d). The broken ber ends of the PANI/PCL yarns showcore–shell morphology (Fig. S4†) where PANI is the shell layer(Fig. 4(e and f)). The yarn itself exhibited an average diameter of150 � 6 mm. When the aniline concentration was increasedfrom 0.5% to 2%, the ber diameter of composite bers wasincreased from 443 � 62 nm for pure PCL to 457 � 83 nm for0.5% aniline, 468 � 63 nm for 1% aniline and 554 � 73 nm for
Fig. 5 SEM images of PANI/PCl electrospun mats with anilineconcentrations of (a) 0%, (b) 0.5%, (c) 1.0%, (d) 2.0%.
This journal is © The Royal Society of Chemistry 2020

Fig. 6 Variation of resistance per unit length as a function of anilineconcentration.
Fig. 7 (a) TGA profiles and (b) DSC profiles of pure PCL and CBNYs(polymerized from aniline 0.5%, 1% and 2%).
Paper RSC Advances
Ope
n A
cces
s A
rtic
le. P
ublis
hed
on 0
4 Se
ptem
ber
2020
. Dow
nloa
ded
on 3
/16/
2022
2:3
0:41
PM
. T
his
artic
le is
lice
nsed
und
er a
Cre
ativ
e C
omm
ons
Attr
ibut
ion-
Non
Com
mer
cial
3.0
Unp
orte
d L
icen
ce.
View Article Online
2% aniline, respectively (Fig. 5). A discontinuous thin layer ofPANI shell layer was observed on the surface of PCL bers forlow concentrations of aniline (0.5%) while small clusters ofPANI started forming on the surface of PCL bers and morePANI coverage of ber surface was noticed for 1% anilineconcentration. The size and the number of clusters increasedwith the initial monomer concentration leading to full coverageof the ber (Fig. 5(a–d)). The pores between the bers wereobserved to be occupied by PANI polymerized from the highestconcentration of aniline. The average diameter of nanobershas increased by about �100 nm with the deposition of thePANI layer with 2% aniline concentration.
Electrical resistance of yarns
The electrical resistance of CBNYs was measured. The electricalresistance of the yarns was decreased from 162� 15 kU cm�1 to6 � 10 kU cm�1 for yarns coated with initial aniline concen-trations of 0.5% and 2%, respectively (Fig. 6). Furthermore, theI–V characteristics (Fig. S5†) of the CBNYs were recorded. Thevoltage versus current shows a steady increment and when theaniline concentration was increased from 0.5% to 2%, thegradient of the graph was decreased indicating the decliningresistance. The I–V response has been shown to be vital inmeasuring the changes of current due to availability of electronsin materials.35
The electrical conductivity of PANI results from decoloniza-tion of electrons through the p-conjugated system.36 Further-more, HCl could act as a dopant to protonate PANI in theemeraldine base (EB) form to the emeraldine salt during poly-merization. It was reported that protonation decreases theHOMO–LUMO gap (band gap).37 Other factors affecting theelectrical resistance of PANI coated nanobers are themorphology of the coated polymer and the degree of doping.When considering the morphology, it is clear that at the lowestconcentrations (aniline 0.5%), the conductive path may bedisturbed by the discontinuities of PANI deposition observed onthe yarn surface. This separation of deposited particles may not
This journal is © The Royal Society of Chemistry 2020
allow the transportation of electrons between them.38 When theconcentration was doubled as aniline 1%, increased PANIcoverage was observed on the bers. This morphology of thick,uniform PANI deposition layer may have been responsible forforming continuous conductive network with a higher surfacecharge density, which allowed efficient charge transport on thesurface of the yarn enabling higher conductivity. Furtherincrease of aniline concentration (aniline 2%) lead to the lowestelectrical resistance of yarns due to thick PANI coverage asshown in SEM images in Fig. 5. However, 2% aniline presenteda higher standard deviation of the resistance values that may beattributed to several factors. First of all, the structural defects onthe ber due to short-term degradation of PCL caused by thehydrolysis of polymer backbone39,40 may have inuenced thetraffic of electrons leading to a higher variation of resistancevalues. Secondly, the uneven deposition of PANI on the surfaceof bers and islands of PANI agglomeration from sample tosample may have resulted in resistance values with highervariation.
The degree of doping is another signicant factor affectingthe resistance values of the PCL/PANI bers. Conductivity is
RSC Adv., 2020, 10, 32875–32884 | 32879

RSC Advances Paper
Ope
n A
cces
s A
rtic
le. P
ublis
hed
on 0
4 Se
ptem
ber
2020
. Dow
nloa
ded
on 3
/16/
2022
2:3
0:41
PM
. T
his
artic
le is
lice
nsed
und
er a
Cre
ativ
e C
omm
ons
Attr
ibut
ion-
Non
Com
mer
cial
3.0
Unp
orte
d L
icen
ce.
View Article Online
found to increase proportionally with the amount of dopantused.41 For low concentrations of aniline, the H+ dopantconcentration was low, resulting in polymerization of struc-tured “tail–tail”, “head–head”, adducts, which could affecta decline in the electrical conductivity of polyaniline. When theH+ concentration was high, polymerization of aniline formedthe usual “head–tail” connections leading to lower resistivityvalues as observed in this experiment.42
Thermal properties of PANI/PCL yarns
Thermal properties of PANI/PCL yarn were investigated usingthermogravimetric analysis (TGA) and Differential ScanningCalorimetric (DSC) analysis as shown in Fig. 7. TGA curvesexhibited weight loss occurring due to loss of water, HCl andother volatile solvents between 0–120 �C.43 This weight loss wasincreased with the increasing PANI content that may be attrib-uted to the increased water content due to the readily formationof hydrogen bonds with doped PANI during the polymeriza-tion.44 Therefore, the rst weight loss may be considered asa good indication for content of PANI in PANI/PCL yarns.
The next main degradation event occurred at an onsettemperature between 374–389 �C (see Table 2) which can beattributed to the degradation of PCL. The onset temperature ofPCL degradation was found to be decreasing from 386 �C forpure PCL to 374 �C for PANI/PCL yarn polymerized from 2%aniline. Thermal stability of PCL/PANI yarns was investigated bycomparing the temperatures resulting in 95% residual weight ofsample. Thermal stability was found to be decreasing with theincreasing aniline concentration. The PANI coated PCLcomposites revealed a higher amount of residue with theincrease of PANI content in the composite. This indicated thatPANI acted as a protective barrier on the surface of PCL againstthermal degradation in PANI/PCL composite membranes.45
Overall, TGA analysis indicated that PANI in PANI/PCL yarn has
Table 2 TGA data compilation including the weight loss attributed to HCand thermal stability of PANI/PCL nanofibers (polymerized from aniline 0
SampleWeight loss due toHCl (%)
Onset temp. ofPCL (�C)
PCL pure — 386Aniline 0.5% 3 389Aniline 1% 7 378Aniline 2% 16 374PANi powder 13 —
Table 3 Melting temperature, melting enthalpy and percentage crystallin
SampleMelting temperature ofPCL (Tm, �C) Me
PCL pure 61 72Aniline 0.5% 60 69Aniline 1% 61 51Aniline 2% 59 37
32880 | RSC Adv., 2020, 10, 32875–32884
a signicant inuence on thermal properties of PCL/PANIcomposite yarns and the thermal stability has decreased withthe increasing PANI content.
Melting temperature (Tm) and melting enthalpy (DHm) weredetermined from the DSC heating thermograms of PCL/PANIyarns as shown in Fig. 7(b). The endothermic peak of purepolyaniline at �126 �C could be attributed to the evaporation ofwater bound to the PANI crystal lattice.46 This can be related tothe weight loss observed in the TGA curves. A broad endo-thermic peak of CBNY (aniline 2%) at �80 �C has emerged nextto the melting peak of PCL. This peak may represent theendothermic peak of PANI itself shiing downward from theposition observed for pure PANI. This observation conrms thepresence of PANI on the surface of PCL yarn and the downwardshi of the peak may indicate the presence of smaller crystals.
The DSC thermogram of neat PCL yarn showed a peak cor-responding to 60 �C with an enthalpy of 72 J g�1 that can beattributed to themelting of PCL. This melting enthalpy (DHm) ofPCL was decreased to 51 J g�1 for CBNY (aniline 1%) and to 37 Jg�1 (aniline 2%) which could be attributed to two factors; rst,the presence of acidmay have hydrolysed the crystal structure ofPCL and secondly, deposition of PANI may have created defectsin the PCL crystal structure leading to reduced meltingenthalpy. Furthermore, the Tm of PCL decreased from 61 �C forpure PCL to 58 �C for PANI/PCL nanobrous yarns. Thereduction of thermal stability (Table 2) and the percentage ofcrystallinity (Table 3) were also observed supporting the ideathat either the size of PCL crystals has been reduced or creationof crystal defects has taken place due to the hydrolysis of PCL inpresence of PANI and HCl.47
Electromechanical behaviour of plied yarns
PCL/PANI nanobrous yarn with PANI polymerized from 1%aniline solution (CBNY-aniline 1%) was selected for further
L and water, onset and weight loss attributed to PCL, residual weight,.5%, 1% and 2%)
Weight loss ofPCL (%)
Residual weight(%)
Thermal stability(�C)
98 2 35696 1 25289 4 18854 30 96— 44 65
ity of pure PCL and CBNYs (polymerized from aniline 0.5%, 1% and 2%)
lting enthalpy PCL (DHm, J g�1)
Percentage crystallinity(%)
52493727
This journal is © The Royal Society of Chemistry 2020

Fig. 8 SEM images of the CBNYs (a) single ply, (b) 2-ply, (c) 3-ply.
Paper RSC Advances
Ope
n A
cces
s A
rtic
le. P
ublis
hed
on 0
4 Se
ptem
ber
2020
. Dow
nloa
ded
on 3
/16/
2022
2:3
0:41
PM
. T
his
artic
le is
lice
nsed
und
er a
Cre
ativ
e C
omm
ons
Attr
ibut
ion-
Non
Com
mer
cial
3.0
Unp
orte
d L
icen
ce.
View Article Online
investigation of electromechanical properties. Two sets of pliedyarns were manufactured as in two-ply yarn and three-ply yarn.The plied yarns were manufactured with the ber alignment(Fig. 8(a–c)) along the direction of the twist such that this couldfavourably contribute toward the tensile strength of the bers.The electrical resistance of the plied yarns were investigated bymeasuring the resistance per unit length. The increase innumber of plies to three has resulted in a decrease in resistanceas shown in Fig. 9. This could be explained by two approachesand rstly, the increase of cross-sectional area with the numberof plies may have resulted in lower resistance. Secondly, themechanism of conductivity of conductive polymers may holda key to this reduction of resistance. Bulk conductivity in thepolymer material depends on the need for the electrons to jumpfrom one polymer molecule to the adjacent molecule, which isalso identied as an intermolecular charge transfer reaction.Furthermore, the conductivity is determined by the macro-scopic factors like poor contacts between different crystallineregions in the material. When the number of plies of the yarn isincreased to three, it can be assumed that more number ofcontacts between regions of bers were established facilitatingintermolecular charge transfer, and thus decreasing the elec-trical resistance. The yarns are typically subjected to strain inwearable applications such as garments. The variation of elec-trical resistance as a function of applied strain was investigatedto determine the suitability of this CBNY (aniline 1%) for the
Fig. 9 Variation of resistance as a function of number of plies onresistance.
This journal is © The Royal Society of Chemistry 2020
intended wearable applications (Fig. 10(a)). The electricalresistance increased exponentially with the applied strain onyarn. This can be attributed to the inhibition of electron transferprocess from one molecule to another molecule due to lack ofcontact between crystal regions of PANI. Yarn stretching processmay break the crystal regions resulting in an increase ofdistance between those regions making it difficult for theintermolecular charge transfer to take place. Wearable appli-cations envisaged for this yarn are subjected to constant stretchand recovery cycles arising from body movements. The elec-trical resistance of PCL/PANI yarn for seven repeated stretch–
Fig. 10 (a) Variation of resistance with applied tensile strain of yarn. (b)Time dependent normalized resistance change of the yarn for multiplestretch–recovery cycles (maximum strain of 20%).
RSC Adv., 2020, 10, 32875–32884 | 32881

Fig. 12 Illustration of the electrical conductivity nature for the
RSC Advances Paper
Ope
n A
cces
s A
rtic
le. P
ublis
hed
on 0
4 Se
ptem
ber
2020
. Dow
nloa
ded
on 3
/16/
2022
2:3
0:41
PM
. T
his
artic
le is
lice
nsed
und
er a
Cre
ativ
e C
omm
ons
Attr
ibut
ion-
Non
Com
mer
cial
3.0
Unp
orte
d L
icen
ce.
View Article Online
recovery cycles was measured (Fig. 10(b)). The yarns werestretched up to 20% strain and released at a controlleddisplacement rate. The yarns exhibited an increase of resistanceduring stretch and a decrease of resistance during recovery. Therate of increase and decrease was observed to be consistent forall stretch–recovery cycles demonstrating the excellent repeat-ability of this process. This can be attributed to the continuouscoverage of the PCL ber surface by polyaniline ensuring thatthe conductive pathways were not easily disturbed at 20%strain. Interestingly, the resistance changes almost instanta-neously with the stretch for multiple stretch and recovery cycles.This rapid and sensitive response to mechanical loading andunloading is promising to validate the possibility of using theCBNYs as strain sensors for human motion monitoring.
prepared CBNYs with application of flexible capacitive sensor foroperation of LED (a) ON by touching, (b) unchanged by releasing, (c)OFF and (d) unchanged by releasing.
Weaving
To demonstrate the ability to incorporate this yarn into fabrics,weaving was successfully performed as shown in Fig. 11(a–c). Atwo-ply conventional polyamide yarns were used as we(widthwise) in the woven structure, while the PCL/PANIconductive plied yarns were being used as the warp (length-wise) yarns. Electrical resistance of a length of 1.5 cm of warpyarn in the fabric was measured to be 80.1 kU (Fig. S6(a)†).Furthermore, the plied yarn was fed into a sewing needle andwas stitched onto a polyamide fabric successfully (Fig. 11(d–f)).It was veried that the yarn was mechanically strong enough tobe sewn with a sewing needle. The PCL/PANI conductive yarnsewn into fabric with a length of 40 mm has indicated a resis-tance of 197.9 kU (Fig. S6(b)†). The calculated resistance perunit length was �50 kU cm�1 for both sewn and woven yarn.Hence, it is clear that the conductive polymeric layer remainsundamaged with mechanical deformation of material duringsewing and weaving.
Fabrication of a capacitive sensor
As a proof-of-concept, a capacitive sensing device was fabricatedby sewing the CBNY (aniline 1%) into a fabric as an electrode for
Fig. 11 (a) Optical microscopic image of a fabric woven with PCL/PANI composite and polyamide yarns, (b and c) SEM images of thewoven fabric. (d) Optical microscopic image of the sewn yarn, (e and f)SEM images of the sewn yarn.
32882 | RSC Adv., 2020, 10, 32875–32884
capacitive sensing applications (Fig. 12(g–i)). The LED bulb canbe turned ON using one touch by nger and turned OFF bya consecutive another touch. Likewise, the LED bulb can beturned ON and OFF by touching on the exible fabric electrode(see ESI†).
Biodegradability
Biodegradation potential of PCL/PANI lms were investigatedas per the ASTM 5338 standard using a laboratory compostsystem. Composite specimens were recovered from compost
Fig. 13 Physical appearance of materials with increase in number ofdays of composting.
This journal is © The Royal Society of Chemistry 2020
Paper RSC Advances
Ope
n A
cces
s A
rtic
le. P
ublis
hed
on 0
4 Se
ptem
ber
2020
. Dow
nloa
ded
on 3
/16/
2022
2:3
0:41
PM
. T
his
artic
le is
lice
nsed
und
er a
Cre
ativ
e C
omm
ons
Attr
ibut
ion-
Non
Com
mer
cial
3.0
Unp
orte
d L
icen
ce.
View Article Online
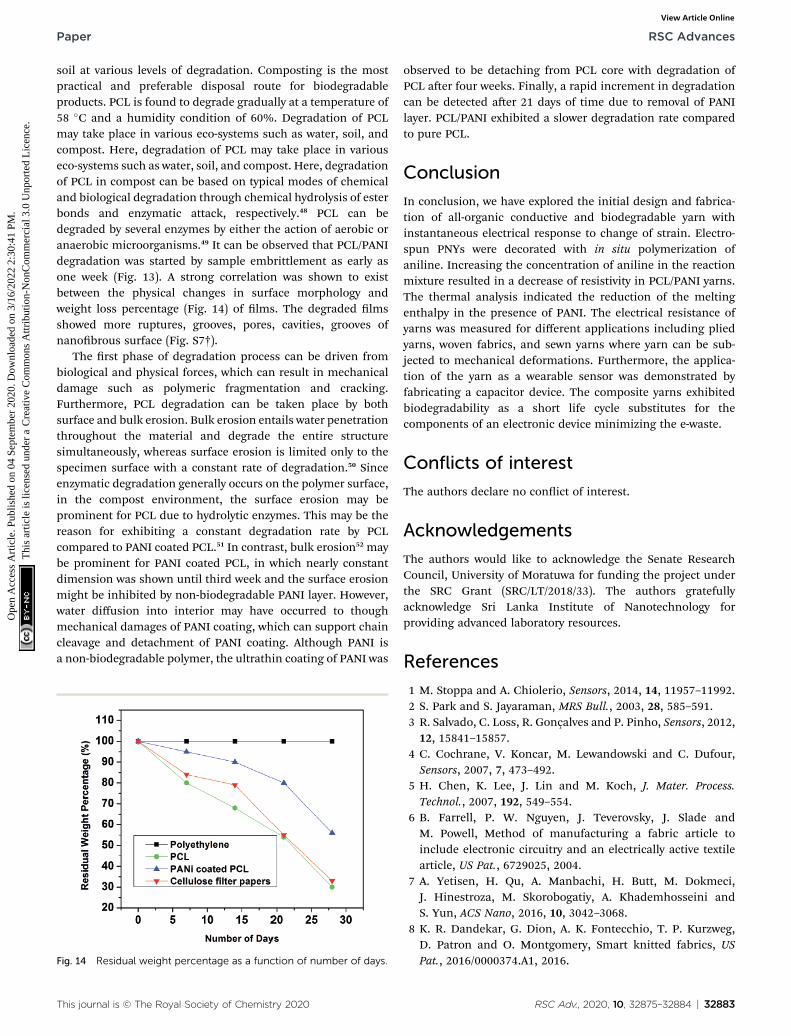
soil at various levels of degradation. Composting is the mostpractical and preferable disposal route for biodegradableproducts. PCL is found to degrade gradually at a temperature of58 �C and a humidity condition of 60%. Degradation of PCLmay take place in various eco-systems such as water, soil, andcompost. Here, degradation of PCL may take place in variouseco-systems such as water, soil, and compost. Here, degradationof PCL in compost can be based on typical modes of chemicaland biological degradation through chemical hydrolysis of esterbonds and enzymatic attack, respectively.48 PCL can bedegraded by several enzymes by either the action of aerobic oranaerobic microorganisms.49 It can be observed that PCL/PANIdegradation was started by sample embrittlement as early asone week (Fig. 13). A strong correlation was shown to existbetween the physical changes in surface morphology andweight loss percentage (Fig. 14) of lms. The degraded lmsshowed more ruptures, grooves, pores, cavities, grooves ofnanobrous surface (Fig. S7†).
The rst phase of degradation process can be driven frombiological and physical forces, which can result in mechanicaldamage such as polymeric fragmentation and cracking.Furthermore, PCL degradation can be taken place by bothsurface and bulk erosion. Bulk erosion entails water penetrationthroughout the material and degrade the entire structuresimultaneously, whereas surface erosion is limited only to thespecimen surface with a constant rate of degradation.50 Sinceenzymatic degradation generally occurs on the polymer surface,in the compost environment, the surface erosion may beprominent for PCL due to hydrolytic enzymes. This may be thereason for exhibiting a constant degradation rate by PCLcompared to PANI coated PCL.51 In contrast, bulk erosion52 maybe prominent for PANI coated PCL, in which nearly constantdimension was shown until third week and the surface erosionmight be inhibited by non-biodegradable PANI layer. However,water diffusion into interior may have occurred to thoughmechanical damages of PANI coating, which can support chaincleavage and detachment of PANI coating. Although PANI isa non-biodegradable polymer, the ultrathin coating of PANI was
Fig. 14 Residual weight percentage as a function of number of days.
This journal is © The Royal Society of Chemistry 2020
observed to be detaching from PCL core with degradation ofPCL aer four weeks. Finally, a rapid increment in degradationcan be detected aer 21 days of time due to removal of PANIlayer. PCL/PANI exhibited a slower degradation rate comparedto pure PCL.
Conclusion
In conclusion, we have explored the initial design and fabrica-tion of all-organic conductive and biodegradable yarn withinstantaneous electrical response to change of strain. Electro-spun PNYs were decorated with in situ polymerization ofaniline. Increasing the concentration of aniline in the reactionmixture resulted in a decrease of resistivity in PCL/PANI yarns.The thermal analysis indicated the reduction of the meltingenthalpy in the presence of PANI. The electrical resistance ofyarns was measured for different applications including pliedyarns, woven fabrics, and sewn yarns where yarn can be sub-jected to mechanical deformations. Furthermore, the applica-tion of the yarn as a wearable sensor was demonstrated byfabricating a capacitor device. The composite yarns exhibitedbiodegradability as a short life cycle substitutes for thecomponents of an electronic device minimizing the e-waste.
Conflicts of interest
The authors declare no conict of interest.
Acknowledgements
The authors would like to acknowledge the Senate ResearchCouncil, University of Moratuwa for funding the project underthe SRC Grant (SRC/LT/2018/33). The authors gratefullyacknowledge Sri Lanka Institute of Nanotechnology forproviding advanced laboratory resources.
References
1 M. Stoppa and A. Chiolerio, Sensors, 2014, 14, 11957–11992.2 S. Park and S. Jayaraman, MRS Bull., 2003, 28, 585–591.3 R. Salvado, C. Loss, R. Gonçalves and P. Pinho, Sensors, 2012,12, 15841–15857.
4 C. Cochrane, V. Koncar, M. Lewandowski and C. Dufour,Sensors, 2007, 7, 473–492.
5 H. Chen, K. Lee, J. Lin and M. Koch, J. Mater. Process.Technol., 2007, 192, 549–554.
6 B. Farrell, P. W. Nguyen, J. Teverovsky, J. Slade andM. Powell, Method of manufacturing a fabric article toinclude electronic circuitry and an electrically active textilearticle, US Pat., 6729025, 2004.
7 A. Yetisen, H. Qu, A. Manbachi, H. Butt, M. Dokmeci,J. Hinestroza, M. Skorobogatiy, A. Khademhosseini andS. Yun, ACS Nano, 2016, 10, 3042–3068.
8 K. R. Dandekar, G. Dion, A. K. Fontecchio, T. P. Kurzweg,D. Patron and O. Montgomery, Smart knitted fabrics, USPat., 2016/0000374.A1, 2016.
RSC Adv., 2020, 10, 32875–32884 | 32883
RSC Advances Paper
Ope
n A
cces
s A
rtic
le. P
ublis
hed
on 0
4 Se
ptem
ber
2020
. Dow
nloa
ded
on 3
/16/
2022
2:3
0:41
PM
. T
his
artic
le is
lice
nsed
und
er a
Cre
ativ
e C
omm
ons
Attr
ibut
ion-
Non
Com
mer
cial
3.0
Unp
orte
d L
icen
ce.
View Article Online
9 R. Paradiso, L. Caldani and M. Pacelli, in Wearable Sensors,Elsevier, 2014, pp. 153–174.
10 B. Wu, B. Zhang, J. Wu, Z. Wang, H. Ma, M. Yu, L. Li and J. Li,Sci. Rep., 2015, 5, 11255.
11 H. Bai and G. Shi, Sensors, 2007, 7, 267–307.12 N. K. Guimard, N. Gomez and C. E. Schmidt, Prog. Polym.
Sci., 2007, 32, 876–921.13 A. G. MacDiarmid, Angew. Chem., Int. Ed., 2001, 40, 2581–
2590.14 B. Kim, V. Koncar and C. Dufour, J. Appl. Polym. Sci., 2006,
101, 1252–1256.15 S. Palaniappan and A. John, Prog. Polym. Sci., 2008, 33, 732–
758.16 B. Zhang, F. Kang, J.-M. Tarascon and J.-K. Kim, Prog. Mater.
Sci., 2016, 76, 319–380.17 P. Gibson, H. Schreuder-Gibson and D. Rivin, Colloids Surf.,
A, 2001, 187, 469–481.18 W. E. Teo and S. Ramakrishna, Nanotechnology, 2006, 17,
R89.19 Y. Zhou, J. Fang, X. Wang and T. Lin, J. Mater. Res., 2012, 27,
537–544.20 D. Aussawasathien, J.-H. Dong and L. Dai, Synth. Met., 2005,
154, 37–40.21 X. You, J. He, N. Nan, X. Sun, K. Qi, Y. Zhou, W. Shao, F. Liu
and S. Cui, J. Mater. Chem. C, 2018, 6, 12981–12991.22 S. Wu, P. Liu, Y. Zhang, H. Zhang and X. Qin, Sens. Actuators,
B, 2017, 252, 697–705.23 P. Weerasinghe, N. D. Wanasekara, D. Dissanayake,
H. R. T. Banadara, N. Tissera, R. Wijesena, K. de Silva andA. Karalasingam, Thailand, IEEE 14th InternationalConference on Nano/Micro Engineered and Molecular Systems(NEMS), 2019, pp. 308–311.
24 P. T. Anastas and J. B. Zimmerman, Environ. Sci. Technol.,2003, 37, 94A–101A.
25 E. H. Sanders, R. Kloeorn, G. L. Bowlin, D. G. Simpson andG. E. Wnek, Macromolecules, 2003, 36, 3803–3805.
26 J. Zeng, X. Xu, X. Chen, Q. Liang, X. Bian, L. Yang and X. Jing,J. Controlled Release, 2003, 92, 227–231.
27 R. Sarvari, B. Massoumi, M. Jaymand, Y. Beygi-Khosrowshahi and M. Abdollahi, RSC Adv., 2016, 6, 19437–19451.
28 K. Low, N. Chartuprayoon, C. Echeverria, C. Li, W. Bosze,N. V. Myung and J. Nam, Nanotechnology, 2014, 25, 115501.
29 A. R. Kohler, L. M. Hilty and C. Bakker, J. Ind. Ecol., 2011, 15,496–511.
30 A. R. Kohler, Mater. Des., 2013, 51, 51–60.
32884 | RSC Adv., 2020, 10, 32875–32884
31 S. Veeralingam, A. N. K. Ravindranath and S. Badhulika, Adv.Mater. Interfaces, 2020, 2000568.
32 S. Fedorova and J. Stejskal, Langmuir, 2002, 18, 5630–5632.33 N. Y. Abu-Thabit, J. Chem. Educ., 2016, 93, 1606–1611.34 H. Y. Sintim, A. I. Bary, D. G. Hayes, L. C. Wadsworth,
M. B. Anunciado, M. E. English, S. Bandopadhyay,S. M. Schaeffer, J. M. DeBruyn and C. A. Miles, Sci. TotalEnviron., 2020, 138668.
35 S. Veeralingam and S. Badhulika, Mater. Sci. Eng., C, 2020,108, 110365.
36 S. Islam, G. Lakshmi, A. M. Siddiqui, M. Husain andM. Zulfequar, Int. J. Polym. Sci., 2013, DOI: 10.1155/2013/307525.
37 R.-X. Wang, L.-F. Huang and X.-Y. Tian, J. Phys. Chem. C,2012, 116, 13120–13126.
38 V. Anju and S. K. Narayanankutty, AIP Adv., 2016, 6, 015109.39 A. R. Hernandez, O. C. Contreras, J. C. Acevedo and
L. Moreno, Am. J. Polym. Sci., 2013, 3, 70.40 A. Harynska, J. Kucinska-Lipka, A. Sulowska, I. Gubanska,
M. Kostrzewa and H. Janik, Materials, 2019, 12, 887.41 A. Kaynak, L. Rintoul and G. A. George, Mater. Res. Bull.,
2000, 35, 813–824.42 J. Hong, Z. Pan, M. Yao and X. Zhang, Synth. Met., 2014, 193,
117–124.43 M. A. C. Mazzeu, L. K. Faria, A. d. M. Cardoso, A. M. Gama,
M. R. Baldan and E. S. Gonçalves, J. Aerosp. Technol. Manage.,2017, 9, 39–47.
44 W. Łuzny and K. Piwowarczyk, Polimery, 2011, 56, 652–656.45 L. Yue, Y. Xie, Y. Zheng, W. He, S. Guo, Y. Sun, T. Zhang and
S. Liu, Compos. Sci. Technol., 2017, 145, 122–131.46 B. Lubentsov, O. Timofeeva, S. Saratovskikh, V. Krinichnyi,
A. Pelekh, V. Dmitrenko and M. Khidekel, Synth. Met.,1992, 47, 187–192.
47 G. Kale, R. Auras and S. P. Singh, J. Polym. Environ., 2006, 14,317–334.
48 F. Lefebvre, A. Daro and C. David, J. Macromol. Sci., Part A:Pure Appl.Chem., 1995, 32, 867–873.
49 T.-K. Chua, M. Tseng and M.-K. Yang, AMB Express, 2013, 3,8.
50 J. Tamada and R. Langer, Proc. Natl. Acad. Sci. U. S. A., 1993,90, 552–556.
51 K. Krasowska, A. Heimowska and M. Morawska, 1stInternational Conference on the Sustainable Energy andEnvironment Development, (SEED 2016), Poland, 2016.
52 L. N. Woodard and M. A. Grunlan, ACS Macro Lett., 2018, 7,976–982.
This journal is © The Royal Society of Chemistry 2020