Embed Size (px)
Citation preview
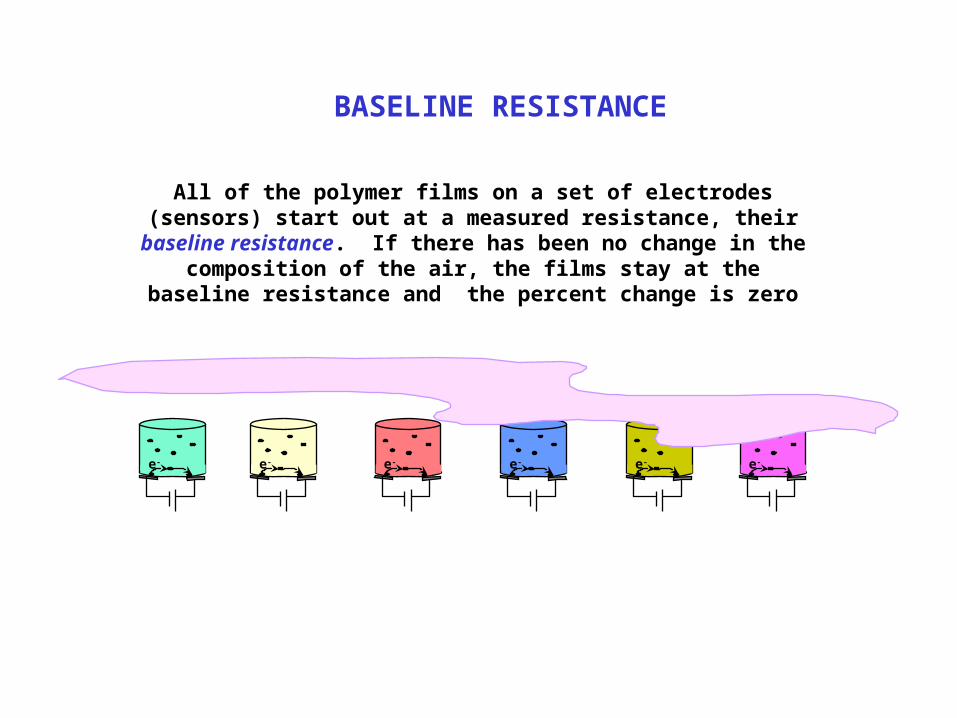
All of the polymer films on a set of electrodes (sensors) start out at a measured resistance, their baseline resistance. If there has been
no change in the composition of the air, the films stay at the baseline resistance and the percent change is zero
e- e- e- e- e- e-
BASELINE RESISTANCE
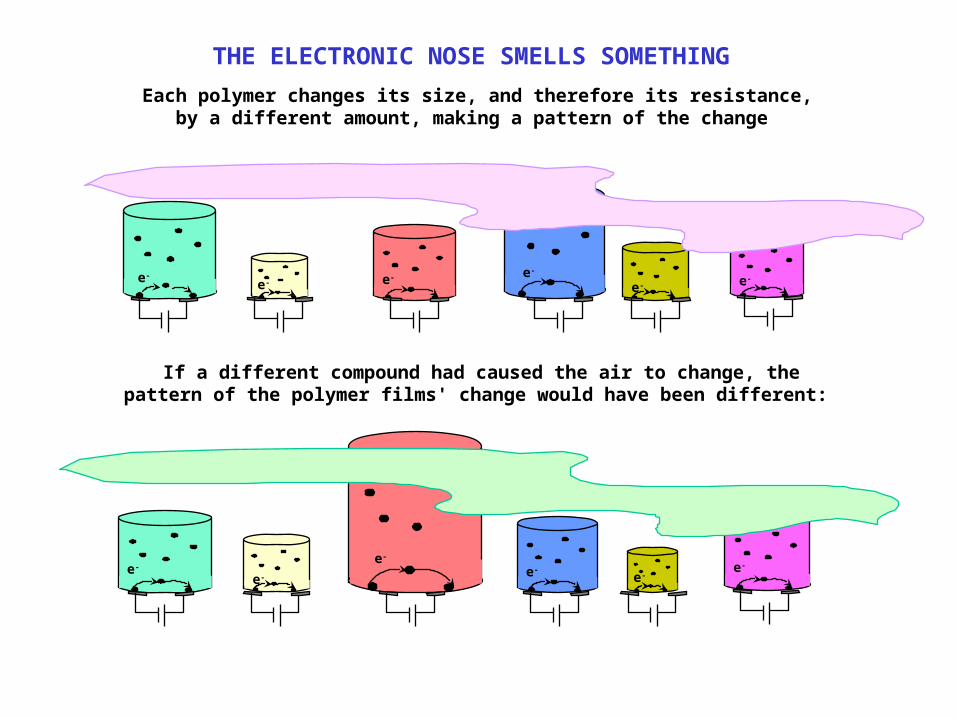
If a different compound had caused the air to change, the pattern of the polymer films' change would have been different:
Each polymer changes its size, and therefore its resistance, by a different amount, making a pattern of the change
THE ELECTRONIC NOSE SMELLS SOMETHING
e- e- e-
e- e-e-
e-
e-
e-
e-e-
e-
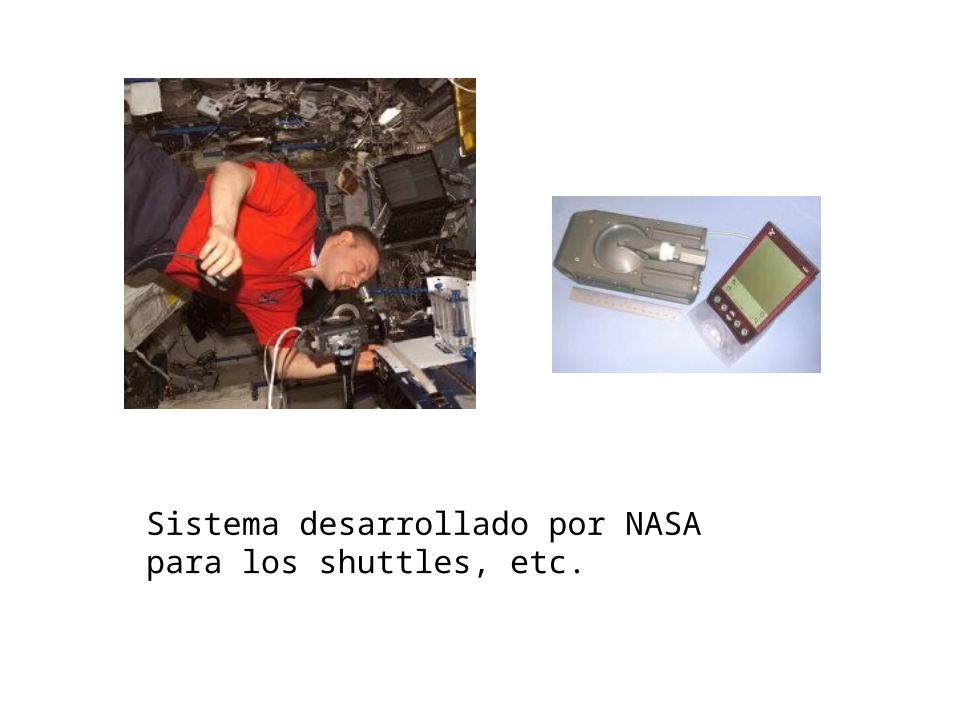
Sistema desarrollado por NASA para los shuttles, etc.
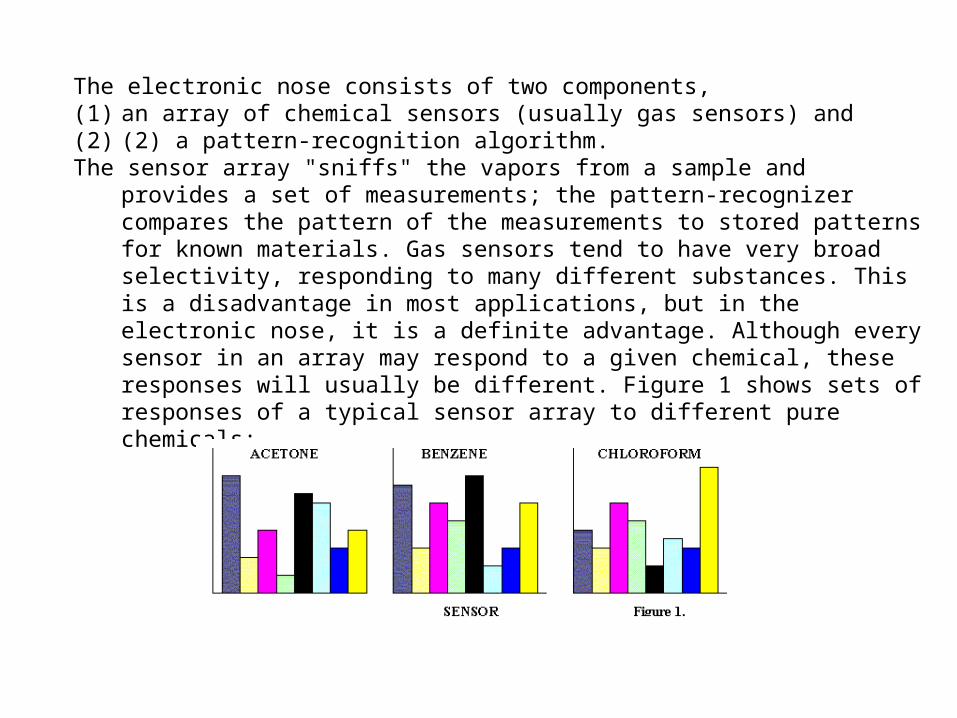
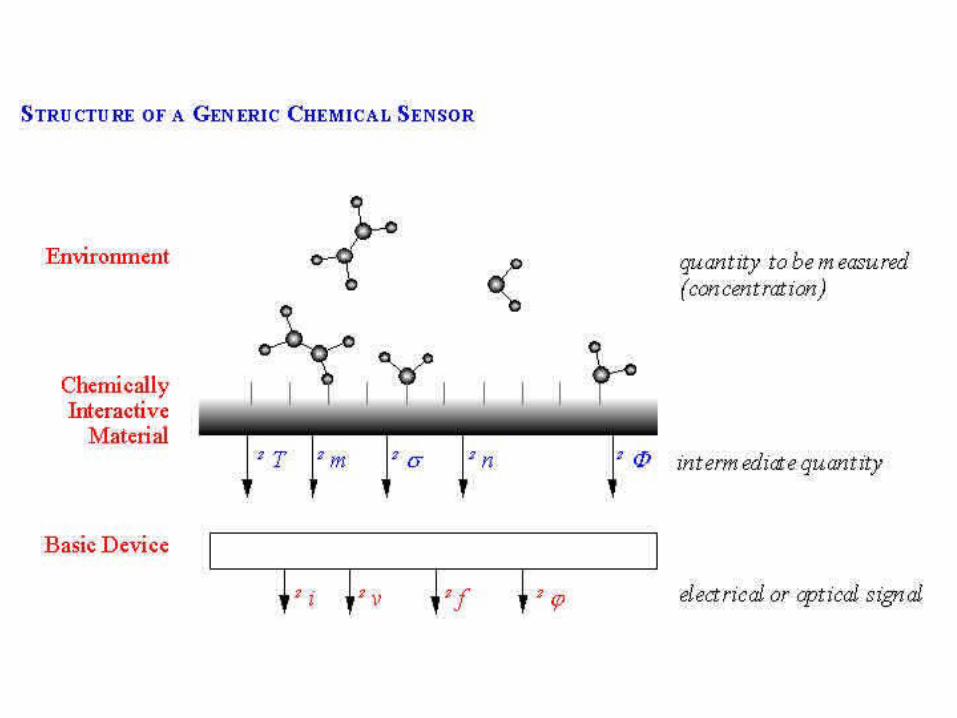
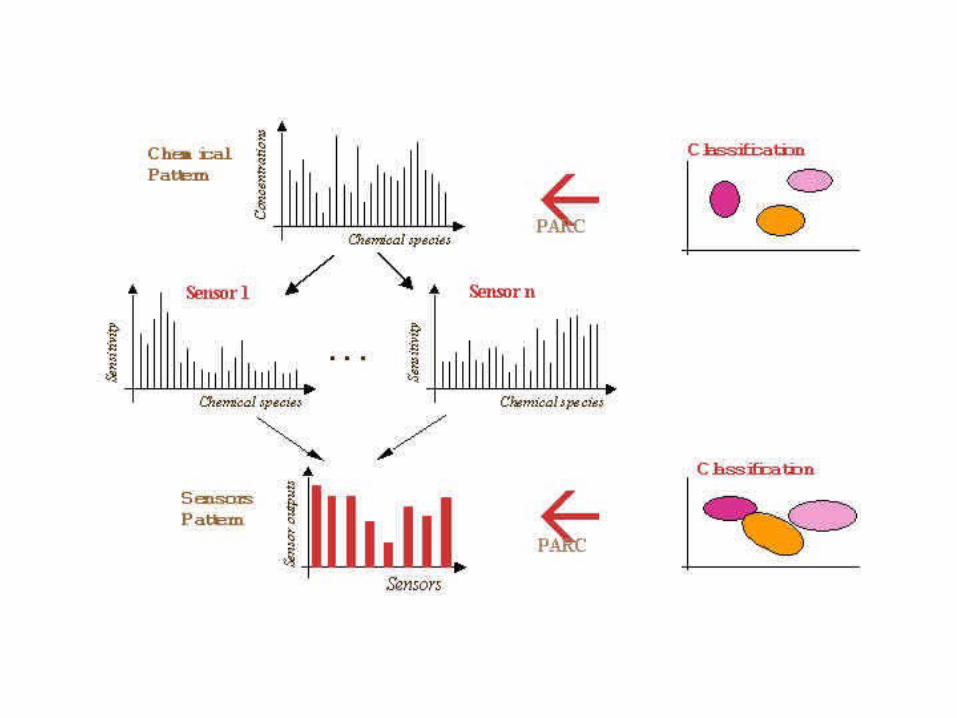
The electronic nose consists of two components, (1) an array of chemical sensors (usually gas sensors) and (2) (2) a pattern-recognition algorithm. The sensor array "sniffs" the vapors from a sample and provides a set of
measurements; the pattern-recognizer compares the pattern of the measurements to stored patterns for known materials. Gas sensors tend to have very broad selectivity, responding to many different substances. This is a disadvantage in most applications, but in the electronic nose, it is a definite advantage. Although every sensor in an array may respond to a given chemical, these responses will usually be different. Figure 1 shows sets of responses of a typical sensor array to different pure chemicals:
Problems Where the E-Nose Can Help
The E-Nose is best suited for matching complex samples with subjective endpoints such as odor or flavor. For example, when has milk turned sour? Or, when is a batch of coffee beans optimally roasted? The E-Nose can match a set of sensor responses to a calibration set produced by the human taste panel or olfactory panel routinely used in food science. The E-Nose is especially useful where consistent product quality has to be maintained over long periods of time, or where repeated exposure to a sample poses a health risk to the human olfactory panel. Although the E- Nose is also effective for pure chemicals, conventional methods are often more practical.
Project: Headspace Analysis of Cultures of E.coli
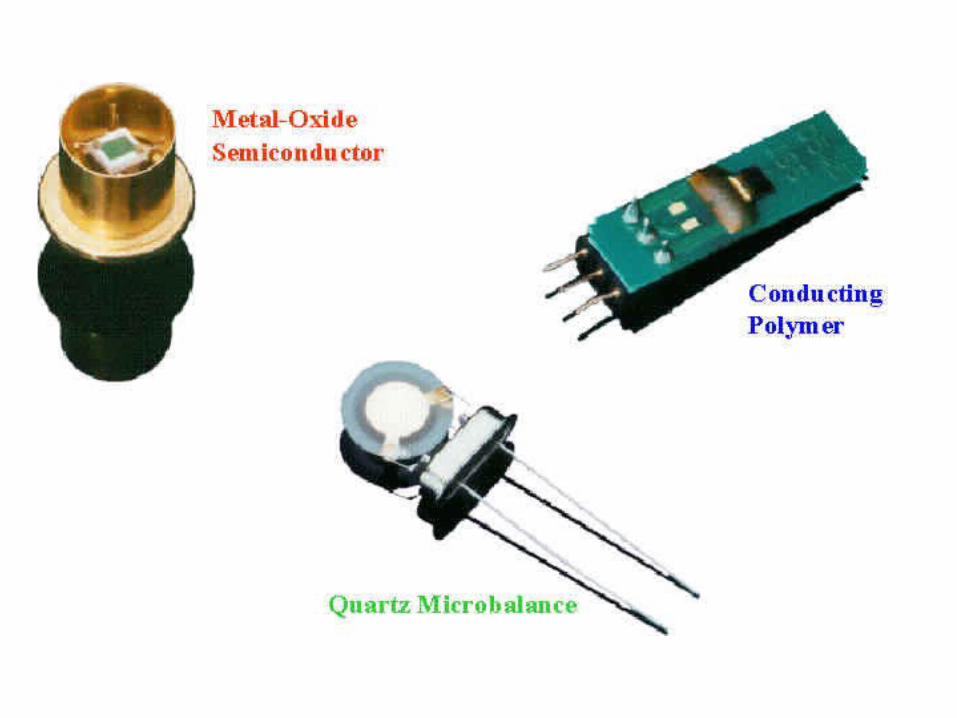
Samples were taken from a growing culture of E. coli until stationary phase was reached. Cells were filtered from the samples, and the filtrates were sealed into autosampler vials. The samples were measured on the MOSES II Electronic Nose (Lennartz Electronic GmbH) using metal-oxide and quartz-microbalance sensors. The pattern recognition algorithm was able to distinguish samples of E coli-altered growth medium after 5 hours. Continued work will emphasize sampling and sensor array improvements to increase the sensitivity of detection.
Problems That the E-Nose Does Best:Identification of spilled chemicals in commerce (for U.S. Coast Guard).Quality classification of stored grain.Water and wastewater analysis.Identification of source and quality of coffee. Monitoring of
roasting process.Rancidity measurements of olive oil (due to accumulation of
short-chain aldehydes).Detection and diagnosis of pulmonary infections (e.g., TB or
pneumonia).Diagnosis of ulcers by breath tests.Freshness of fish.Process control of cheese, sausage, beer, and bread
manufacture.Bacterial growth on foods such as meat and fresh vegetables.
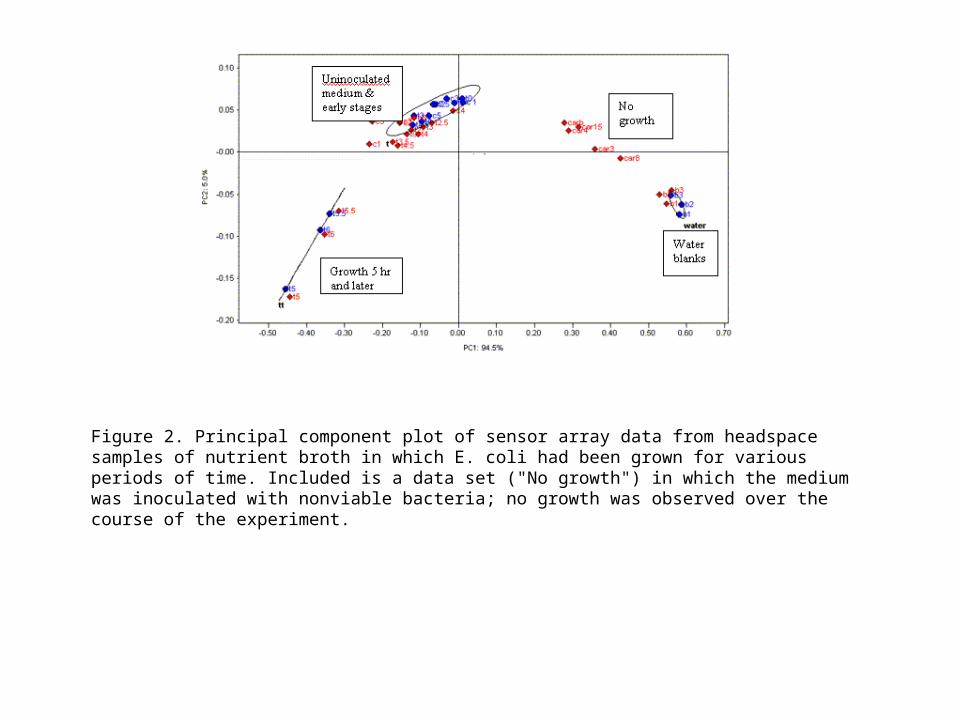
Figure 2. Principal component plot of sensor array data from headspace samples of nutrient broth in which E. coli had been grown for various periods of time. Included is a data set ("No growth") in which the medium was inoculated with nonviable bacteria; no growth was observed over the course of the experiment.
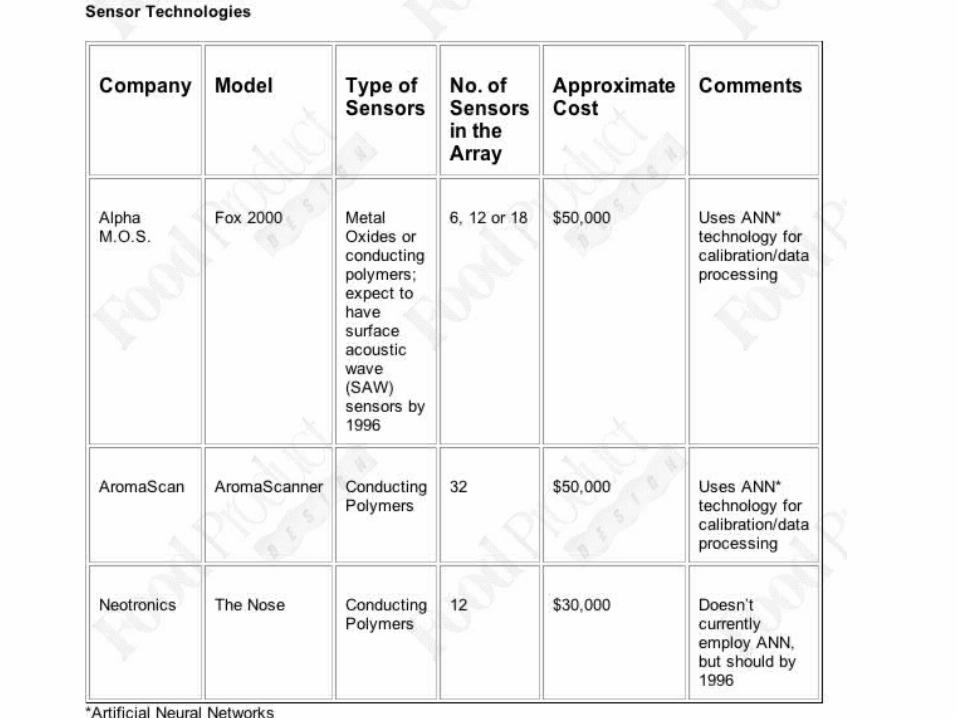
Sensors As indicated in the accompanying table, each manufacturer uses its own proprietary sensor technology. "The type of sensors and how the sensors are made and used in the instrument is what really differentiates the instruments on the market today," says Ken Weber, technical sales representative for Neotronics. "Our sensors are electrochemically grown conducting polymers made with polypyrrole resins, although polyaniline resins are also commonly used."
According to Weber, engineers electrochemically grow the resins at a defined potential across an electrode gap. By changing the solvent system or the counter ion associated with their manufacture, it is possible to modify the polymer chain and get subtle differences in the reactivity of each sensor.
While Neotronics electrochemically grows each individual sensor, AromaScan uses an "inking" or "masking" process whereby it puts 32 sensors on one computer chip or board, says Weber. Neotronics uses an array of 12 different sensors which are basically soldered onto a sensor head. Alpha M.O.S., another instrument manufacturer, uses primarily tin oxide-based sensors in its array, but it also can configure the instrument with a limited number of conducting polymer sensors.
Metal oxide sensors demonstrate good sensitivity to organic vapors (ppm or even ppb detection limits) for a very broad range of chemical compounds. Due to their poor selectivity -- i.e., all sensors can respond to a single volatile compound but in different magnitudes -- sensor arrays must be employed. Metal oxide sensors are made by depositing a thin layer (505 microns) of oxide film on a ceramic material. For proper functioning, metal oxide sensors are usually heated to between 175° and 425°C. The electrical resistance of the sensor decreases in the presence of an odor, with the magnitude of the response dependent on the nature of the detected molecule and the type of metal oxide used in preparing the sensor. Response time of metal oxide sensors is between 10 and 120 seconds.
AromaScan and Neotronics instruments use sensors made of conducting polymer resins instead of metal oxides. Michele Greaney, science and technology manager for AromaScan, explains: "They have an inherent charge or base resistance, and as volatile components are absorbed onto the surface of the conductive polymers, they change their base resistance. You get what we call an FR value, and this FR is unique across the sensor array."
By plotting the FR value for each sensor, a histogram or bar chart can be generated. The chart could for instance, represent a good-tasting coffee sample.
Graphic outputs
Sensor-array responses to organic vapors can be presented in numerous ways using a variety of statistical and pattern-recognition approaches. One form of output is a scaled polar plot. This way of visually displaying data is simple to interpret. Each vector on the polar plot represents the output from one sensor. As the relative response of each sensor changes when the sensor array is exposed to vapors from differing food samples, the overall shape and appearance of the polar plot vary.
Another type of data presentation commonly used is the difference plot. For example, the scaled plot from one test is subtracted from the scaled plot from a different test. The resulting difference plot shows how the relative sensor output varies from sample to sample. If plots vary by a pre-defined value, then the food technologist could assume the sample differs significantly from the control sample. This type of analysis could be useful in quality control "go/no go" tests.
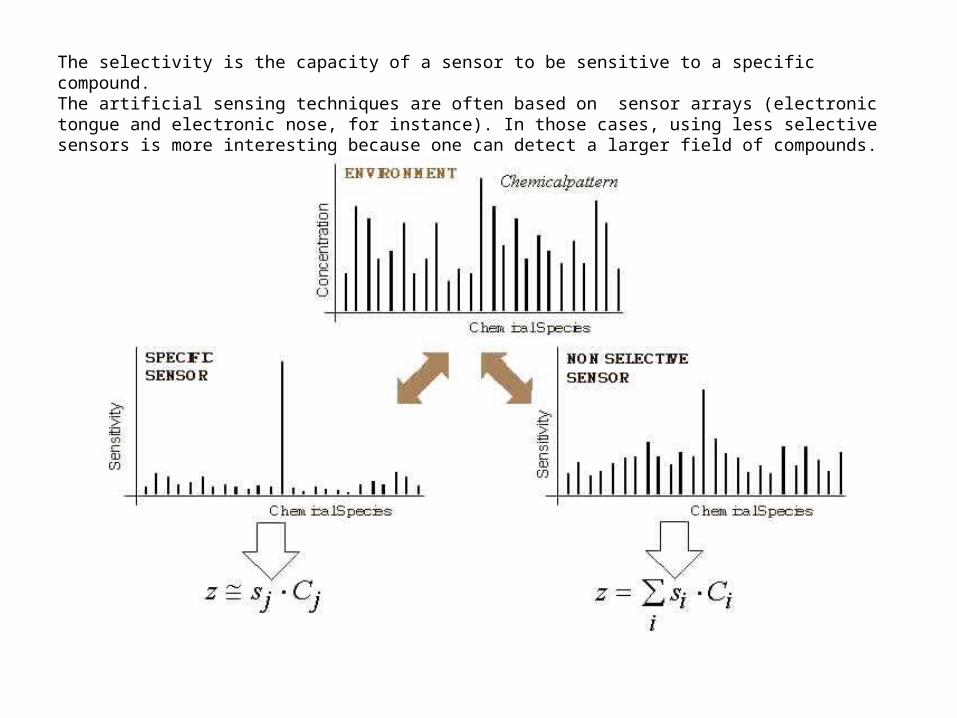
The selectivity is the capacity of a sensor to be sensitive to a specific compound.The artificial sensing techniques are often based on sensor arrays (electronic tongue and electronic nose, for instance). In those cases, using less selective sensors is more interesting because one can detect a larger field of compounds.
Para ver esta película, debedisponer de QuickTime™ y deun descompresor TIFF (LZW).
Para ver esta película, debedisponer de QuickTime™ y deun descompresor TIFF (LZW).
Para ver esta película, debedisponer de QuickTime™ y deun descompresor TIFF (LZW).