Embed Size (px)
Citation preview


All information contained herein is from sources deemed reliable, but not guaranteed. All figures and measurements are approximate. Offer subject to prior sale, price change, correction or withdrawal. 10/2018
L O C A T I O N : Located at the northeast corner of Pecos Road and Sossaman Road in the City of Mesa, Arizona. S I Z E : ±39 Acres A S S E S S O R P A R C E L N U M B E R : 304-61-005 Z O N I N G : AG | City of Mesa City of Mesa Character Areas Map shows: Employment A R I Z O N A O P P O R T U N I T Y Z O N E : Site is located in an Arizona Opportunity Zone (for more details, see page 6). M E S A E M P L O Y M E N T D I S T R I C T : Site is located in the Mesa Employment Opportunity District. For more details: https://www.mesaaz.gov/home/showdocument?id=20555 P R I C E : $6,708,000 or $3.95 per Square Foot T E R M S : Submit for Seller consideration. P R O P E R T Y T A X E S : 2018 Assessment: $487.58 C O M M E N T S : Seller may consider partial sales depending upon user interest. A D D I T I O N A L D O C U M E N T S : Please Click to View • SR 24 Williams Gateway Freeway Schedule - ADOT • Phoenix Mesa Gateway Airport Strategic Development Plan Summary – 12/2008 • Phoenix Mesa Gateway Airport Construction Update – March 2013
PECOS AND SOSSAMAN CITY OF MESA, ARIZONA


Traffic Count MapPecos Road and Sossaman Road Prepared by Nathan and Associates, Inc.7900-7998 E Pecos Rd, Mesa, Arizona, 85212 Latitude: 33.28535Rings: 1, 3, 5 mile radii Longitude: -111.66933
Source: ©2018 Kalibrate Technologies (Q1 2018).
September 17, 2018
©2018 Esri Page 1 of 1

Traffic Count ProfilePecos Road and Sossaman Road Prepared by Nathan and Associates, Inc.7900-7998 E Pecos Rd, Mesa, Arizona, 85212 Latitude: 33.28535Rings: 1, 3, 5 mile radii Longitude: -111.66933
Distance: Street: Closest Cross-street: Year of Count: Count:
0.09 Eastman Rd E Pecos Rd (0.1 miles S) 2014 9,200
0.28 Eastman Rd E Pecos Rd (0.28 miles N) 2014 9,187
0.44 S Rittenhouse Rd E Germann Rd (0.23 miles SE) 1999 7,906
0.55 E Pecos Rd S Power Rd (0.47999999 miles W) 2013 7,575
0.56 E Pecos Rd S Sossaman Rd (0.27000001 miles W) 2015 6,200
0.62 S Sossaman Rd E Germann Rd (0.07 miles N) 2015 8,716
0.64 E Germann Rd S 189th Pl (0.07 miles E) 2007 7,650
0.75 E Pecos Rd S Power Rd (0.44 miles W) 2015 9,700
0.75 E Pecos Rd S 80th St (0.27000001 miles W) 2013 5,356
0.78 S Rittenhouse Rd S Power Rd (0.27000001 miles NW) 2004 10,608
0.95 E Velocity Way S Aviation Cir (0.03 miles NE) 2012 488
0.98 S Power Rd E Rittenhouse Rd (0.17 miles S) 2015 27,247
1.06 S Power Rd E Germann Rd (0.08 miles S) 2004 20,995
1.09 S Power Rd E Pecos Rd (0.05 miles N) 2011 21,293
1.11 E Pecos Rd S Power Rd (0.1 miles E) 2007 11,621
1.11 S Rittenhouse Rd S 196th St (0.11 miles NW) 2015 23,100
1.20 Front St Williams Air Force Base (0.1 miles SW) 2015 7,868
1.26 S Rittenhouse Rd S Power Rd (0.27000001 miles SE) 2007 12,000
1.33 E Germann Rd E Cloudburst Ct (0.06 miles E) 2015 18,161
1.37 S Power Rd Power Rd (0.23 miles N) 2015 26,753
1.41 E Germann Rd S 85th St (0.11 miles W) 2015 2,723
1.43 E Queen Creek Rd S 191st St (0.1 miles E) 2007 5,366
1.45 Front St D St (0.01 miles N) 2012 10,320
1.46 S Power Rd E Haven Crest Dr (0.1 miles N) 2015 19,892
1.54 E Pecos Rd S Luiseno Blvd (0.02 miles SE) 2015 24,466
1.54 E Pecos Rd S Ellsworth Rd (0.51999998 miles E) 2015 6,200
1.58 E Queen Creek Rd Emperor Blvd (0.04 miles W) 2009 16,951
1.59 E Queen Creek Rd S Power Rd (0.07 miles W) 2010 10,045
1.69 Front St 1st St (0.06 miles NW) 2012 13,130
1.71 E Queen Creek Rd S Power Rd (0.13 miles E) 2014 15,748
Data Note:The Traffic Profile displays up to 30 of the closest available traffic counts within the largest radius around your site. The years of the counts in the database range from 2017 to 1963. Over 25% of the counts were taken between 2010 and 2017 and over 77% of the counts were taken between 2000 and 2017. Traffic counts are identified by the street on which they were recorded, along with the distance and direction to the closest cross-street. Distances displayed as 0.00 miles (due to rounding), are closest to the site. A traffic count is defined as the two-way Average Daily Traffic (ADT) that passes that location.Source: ©2018 Kalibrate Technologies (Q1 2018).
September 17, 2018
©2018 Esri Page 1 of 1

Site MapPecos Road and Sossaman Road Prepared by Nathan and Associates, Inc.7900-7998 E Pecos Rd, Mesa, Arizona, 85212 Latitude: 33.28535Rings: 1, 3, 5 mile radii Longitude: -111.66933
September 17, 2018
©2018 Esri Page 1 of 1

Executive SummaryPecos Road and Sossaman Road Prepared by Nathan and Associates, Inc.7900-7998 E Pecos Rd, Mesa, Arizona, 85212 Latitude: 33.28535Rings: 1, 3, 5 mile radii Longitude: -111.66933
1 mile 3 miles 5 milesPopulation
2000 Population 116 2,828 13,7842010 Population 2,282 44,783 100,4662018 Population 2,631 57,149 152,1682023 Population 2,839 63,714 176,1002000-2010 Annual Rate 34.71% 31.81% 21.97%2010-2018 Annual Rate 1.74% 3.00% 5.16%2018-2023 Annual Rate 1.53% 2.20% 2.96%2018 Male Population 50.2% 49.4% 49.2%2018 Female Population 49.8% 50.6% 50.8%2018 Median Age 25.9 31.5 32.0
In the identified area, the current year population is 152,168. In 2010, the Census count in the area was 100,466. The rate of change since 2010 was 5.16% annually. The five-year projection for the population in the area is 176,100 representing a change of 2.96% annually from 2018 to 2023. Currently, the population is 49.2% male and 50.8% female.
Median Age
The median age in this area is 25.9, compared to U.S. median age of 38.3.Race and Ethnicity
2018 White Alone 78.2% 78.8% 78.2%2018 Black Alone 4.4% 4.2% 4.5%2018 American Indian/Alaska Native Alone 1.6% 1.2% 1.0%2018 Asian Alone 6.2% 5.4% 5.7%2018 Pacific Islander Alone 0.3% 0.2% 0.2%2018 Other Race 4.4% 5.7% 6.0%2018 Two or More Races 4.8% 4.5% 4.4%2018 Hispanic Origin (Any Race) 17.7% 18.0% 18.5%
Persons of Hispanic origin represent 18.5% of the population in the identified area compared to 18.3% of the U.S. population. Persons of Hispanic Origin may be of any race. The Diversity Index, which measures the probability that two people from the same area will be from different race/ethnic groups, is 56.9 in the identified area, compared to 64.3 for the U.S. as a whole.
Households2000 Households 36 914 4,1162010 Households 618 14,243 32,2052018 Total Households 686 17,977 48,4842023 Total Households 734 20,038 55,8682000-2010 Annual Rate 32.88% 31.60% 22.84%2010-2018 Annual Rate 1.27% 2.86% 5.08%2018-2023 Annual Rate 1.36% 2.19% 2.88%2018 Average Household Size 3.78 3.16 3.13
The household count in this area has changed from 32,205 in 2010 to 48,484 in the current year, a change of 5.08% annually. The five-year projection of households is 55,868, a change of 2.88% annually from the current year total. Average household size is currently 3.13, compared to 3.11 in the year 2010. The number of families in the current year is 37,895 in the specified area.
Data Note: Income is expressed in current dollarsSource: U.S. Census Bureau, Census 2010 Summary File 1. Esri forecasts for 2018 and 2023. Esri converted Census 2000 data into 2010 geography.
September 17, 2018
©2018 Esri Page 1 of 2

Executive SummaryPecos Road and Sossaman Road Prepared by Nathan and Associates, Inc.7900-7998 E Pecos Rd, Mesa, Arizona, 85212 Latitude: 33.28535Rings: 1, 3, 5 mile radii Longitude: -111.66933
1 mile 3 miles 5 milesMedian Household Income
2018 Median Household Income $87,141 $87,513 $89,9302023 Median Household Income $104,471 $101,026 $101,7302018-2023 Annual Rate 3.69% 2.91% 2.50%
Average Household Income
2018 Average Household Income $110,449 $104,118 $107,2182023 Average Household Income $135,264 $124,024 $126,0702018-2023 Annual Rate 4.14% 3.56% 3.29%
Per Capita Income2018 Per Capita Income $28,082 $32,794 $34,2262023 Per Capita Income $34,016 $38,997 $40,0682018-2023 Annual Rate 3.91% 3.53% 3.20%
Households by IncomeCurrent median household income is $89,930 in the area, compared to $58,100 for all U.S. households. Median household income is projected to be $101,730 in five years, compared to $65,727 for all U.S. households
Current average household income is $107,218 in this area, compared to $83,694 for all U.S. households. Average household income is projected to be $126,070 in five years, compared to $96,109 for all U.S. households
Current per capita income is $34,226 in the area, compared to the U.S. per capita income of $31,950. The per capita income is projected to be $40,068 in five years, compared to $36,530 for all U.S. households Housing
2000 Total Housing Units 83 1,533 5,0152000 Owner Occupied Housing Units 3 520 3,3952000 Renter Occupied Housing Units 33 394 7212000 Vacant Housing Units 47 619 899
2010 Total Housing Units 676 15,797 35,7982010 Owner Occupied Housing Units 471 10,715 24,3672010 Renter Occupied Housing Units 147 3,528 7,8382010 Vacant Housing Units 58 1,554 3,593
2018 Total Housing Units 741 19,129 51,4642018 Owner Occupied Housing Units 533 14,003 38,3142018 Renter Occupied Housing Units 153 3,974 10,1692018 Vacant Housing Units 55 1,152 2,980
2023 Total Housing Units 792 21,159 58,5622023 Owner Occupied Housing Units 581 16,048 44,9862023 Renter Occupied Housing Units 152 3,989 10,8822023 Vacant Housing Units 58 1,121 2,694
Currently, 74.4% of the 51,464 housing units in the area are owner occupied; 19.8%, renter occupied; and 5.8% are vacant. Currently, in the U.S., 56.0% of the housing units in the area are owner occupied; 32.8% are renter occupied; and 11.2% are vacant. In 2010, there were 35,798 housing units in the area - 68.1% owner occupied, 21.9% renter occupied, and 10.0% vacant. The annual rate of change in housing units since 2010 is 17.51%. Median home value in the area is $278,151, compared to a median home value of $218,492 for the U.S. In five years, median value is projected to change by 2.73% annually to $318,313.
Data Note: Income is expressed in current dollarsSource: U.S. Census Bureau, Census 2010 Summary File 1. Esri forecasts for 2018 and 2023. Esri converted Census 2000 data into 2010 geography.
September 17, 2018
©2018 Esri Page 2 of 2

Market ProfilePecos Road and Sossaman Road Prepared by Nathan and Associates, Inc.7900-7998 E Pecos Rd, Mesa, Arizona, 85212 Latitude: 33.28535Rings: 1, 3, 5 mile radii Longitude: -111.66933
1 mile 3 miles 5 milesPopulation Summary
2000 Total Population 116 2,828 13,7842010 Total Population 2,282 44,783 100,4662018 Total Population 2,631 57,149 152,168
2018 Group Quarters 39 400 4182023 Total Population 2,839 63,714 176,100
2018-2023 Annual Rate 1.53% 2.20% 2.96%2018 Total Daytime Population 2,697 44,687 118,388
Workers 1,239 13,874 37,961Residents 1,458 30,813 80,427
Household Summary2000 Households 36 914 4,116
2000 Average Household Size 3.03 3.02 3.332010 Households 618 14,243 32,205
2010 Average Household Size 3.64 3.12 3.112018 Households 686 17,977 48,484
2018 Average Household Size 3.78 3.16 3.132023 Households 734 20,038 55,868
2023 Average Household Size 3.81 3.16 3.142018-2023 Annual Rate 1.36% 2.19% 2.88%
2010 Families 553 11,513 25,4932010 Average Family Size 3.83 3.46 3.49
2018 Families 612 14,407 37,8952018 Average Family Size 4.00 3.53 3.55
2023 Families 654 15,991 43,5202023 Average Family Size 4.04 3.55 3.582018-2023 Annual Rate 1.34% 2.11% 2.81%
Housing Unit Summary2000 Housing Units 83 1,533 5,015
Owner Occupied Housing Units 3.6% 33.9% 67.7%Renter Occupied Housing Units 39.8% 25.7% 14.4%Vacant Housing Units 56.6% 40.4% 17.9%
2010 Housing Units 676 15,797 35,798Owner Occupied Housing Units 69.7% 67.8% 68.1%Renter Occupied Housing Units 21.7% 22.3% 21.9%Vacant Housing Units 8.6% 9.8% 10.0%
2018 Housing Units 741 19,129 51,464Owner Occupied Housing Units 71.9% 73.2% 74.4%Renter Occupied Housing Units 20.6% 20.8% 19.8%Vacant Housing Units 7.4% 6.0% 5.8%
2023 Housing Units 792 21,159 58,562Owner Occupied Housing Units 73.4% 75.8% 76.8%Renter Occupied Housing Units 19.2% 18.9% 18.6%Vacant Housing Units 7.3% 5.3% 4.6%
Median Household Income2018 $87,141 $87,513 $89,9302023 $104,471 $101,026 $101,730
Median Home Value2018 $277,397 $270,086 $278,1512023 $329,897 $311,300 $318,313
Per Capita Income2018 $28,082 $32,794 $34,2262023 $34,016 $38,997 $40,068
Median Age2010 25.4 30.2 30.02018 25.9 31.5 32.02023 27.1 31.0 31.8
Data Note: Household population includes persons not residing in group quarters. Average Household Size is the household population divided by total households. Persons in families include the householder and persons related to the householder by birth, marriage, or adoption. Per Capita Income represents the income received by all persons aged 15 years and over divided by the total population.Source: U.S. Census Bureau, Census 2010 Summary File 1. Esri forecasts for 2018 and 2023 Esri converted Census 2000 data into 2010 geography.
September 17, 2018
©2018 Esri Page 1 of 7

Market ProfilePecos Road and Sossaman Road Prepared by Nathan and Associates, Inc.7900-7998 E Pecos Rd, Mesa, Arizona, 85212 Latitude: 33.28535Rings: 1, 3, 5 mile radii Longitude: -111.66933
1 mile 3 miles 5 miles2018 Households by Income
Household Income Base 686 17,977 48,484<$15,000 6.1% 4.4% 4.3%$15,000 - $24,999 0.9% 3.2% 3.3%$25,000 - $34,999 5.2% 5.0% 4.5%$35,000 - $49,999 12.5% 9.2% 9.3%$50,000 - $74,999 16.0% 18.5% 17.3%$75,000 - $99,999 16.5% 16.8% 16.9%$100,000 - $149,999 17.3% 25.5% 25.8%$150,000 - $199,999 15.3% 9.4% 9.5%$200,000+ 10.2% 8.0% 9.1%
Average Household Income $110,449 $104,118 $107,2182023 Households by Income
Household Income Base 734 20,038 55,868<$15,000 4.8% 3.5% 3.7%$15,000 - $24,999 0.8% 2.5% 2.6%$25,000 - $34,999 4.1% 3.9% 3.5%$35,000 - $49,999 9.9% 7.5% 7.7%$50,000 - $74,999 13.2% 16.0% 15.2%$75,000 - $99,999 14.7% 15.6% 15.7%$100,000 - $149,999 18.8% 28.2% 27.8%$150,000 - $199,999 18.5% 11.4% 11.2%$200,000+ 15.1% 11.5% 12.6%
Average Household Income $135,264 $124,024 $126,0702018 Owner Occupied Housing Units by Value
Total 533 14,003 38,314<$50,000 0.0% 0.7% 0.8%$50,000 - $99,999 0.0% 0.5% 0.6%$100,000 - $149,999 1.3% 5.3% 5.6%$150,000 - $199,999 20.5% 17.7% 15.6%$200,000 - $249,999 20.6% 18.9% 18.2%$250,000 - $299,999 13.7% 17.1% 16.4%$300,000 - $399,999 26.6% 24.8% 21.9%$400,000 - $499,999 11.4% 9.3% 11.5%$500,000 - $749,999 5.4% 5.1% 7.1%$750,000 - $999,999 0.0% 0.4% 1.5%$1,000,000 - $1,499,999 0.2% 0.2% 0.7%$1,500,000 - $1,999,999 0.0% 0.0% 0.1%$2,000,000 + 0.0% 0.0% 0.0%
Average Home Value $303,195 $293,981 $317,1362023 Owner Occupied Housing Units by Value
Total 581 16,048 44,986<$50,000 0.0% 0.2% 0.3%$50,000 - $99,999 0.0% 0.2% 0.2%$100,000 - $149,999 0.3% 1.4% 1.5%$150,000 - $199,999 9.6% 9.9% 8.8%$200,000 - $249,999 16.2% 17.0% 16.4%$250,000 - $299,999 13.9% 17.8% 17.8%$300,000 - $399,999 33.4% 31.2% 27.1%$400,000 - $499,999 17.7% 13.7% 15.3%$500,000 - $749,999 8.8% 8.0% 10.0%$750,000 - $999,999 0.0% 0.5% 2.0%$1,000,000 - $1,499,999 0.2% 0.1% 0.5%$1,500,000 - $1,999,999 0.0% 0.0% 0.0%$2,000,000 + 0.0% 0.0% 0.0%
Average Home Value $345,103 $333,425 $354,461
Data Note: Income represents the preceding year, expressed in current dollars. Household income includes wage and salary earnings, interest dividends, net rents, pensions, SSI and welfare payments, child support, and alimony. Source: U.S. Census Bureau, Census 2010 Summary File 1. Esri forecasts for 2018 and 2023 Esri converted Census 2000 data into 2010 geography.
September 17, 2018
©2018 Esri Page 2 of 7

Market ProfilePecos Road and Sossaman Road Prepared by Nathan and Associates, Inc.7900-7998 E Pecos Rd, Mesa, Arizona, 85212 Latitude: 33.28535Rings: 1, 3, 5 mile radii Longitude: -111.66933
1 mile 3 miles 5 miles2010 Population by Age
Total 2,283 44,785 100,4680 - 4 12.4% 10.8% 10.5%5 - 9 14.3% 11.0% 10.7%10 - 14 10.8% 9.1% 9.1%15 - 24 11.9% 11.5% 11.8%25 - 34 15.9% 16.4% 17.1%35 - 44 18.4% 17.6% 17.7%45 - 54 8.1% 9.1% 10.2%55 - 64 5.0% 7.6% 7.2%65 - 74 2.2% 4.9% 4.0%75 - 84 0.7% 1.5% 1.2%85 + 0.3% 0.4% 0.3%
18 + 57.9% 64.9% 65.3%2018 Population by Age
Total 2,632 57,148 152,1680 - 4 11.2% 9.5% 9.2%5 - 9 12.0% 10.0% 9.8%10 - 14 11.8% 9.5% 9.3%15 - 24 14.0% 12.7% 12.2%25 - 34 13.4% 13.6% 14.2%35 - 44 18.0% 17.1% 17.4%45 - 54 9.5% 11.2% 11.8%55 - 64 5.2% 7.6% 8.0%65 - 74 3.6% 6.4% 5.8%75 - 84 0.9% 2.0% 1.9%85 + 0.4% 0.5% 0.4%
18 + 59.8% 66.6% 67.4%2023 Population by Age
Total 2,839 63,715 176,1000 - 4 11.1% 9.6% 9.3%5 - 9 11.7% 9.7% 9.6%10 - 14 11.6% 9.5% 9.2%15 - 24 13.5% 13.0% 12.3%25 - 34 13.5% 14.7% 15.2%35 - 44 18.8% 16.5% 17.3%45 - 54 8.8% 10.7% 11.3%55 - 64 5.2% 6.6% 7.2%65 - 74 4.3% 6.3% 5.7%75 - 84 1.2% 2.9% 2.5%85 + 0.5% 0.5% 0.5%
18 + 60.5% 66.5% 67.3%2010 Population by Sex
Males 1,145 22,182 49,749Females 1,137 22,601 50,717
2018 Population by SexMales 1,320 28,250 74,854Females 1,311 28,898 77,313
2023 Population by SexMales 1,428 31,405 86,348Females 1,411 32,309 89,752
Source: U.S. Census Bureau, Census 2010 Summary File 1. Esri forecasts for 2018 and 2023 Esri converted Census 2000 data into 2010 geography.
September 17, 2018
©2018 Esri Page 3 of 7

Market ProfilePecos Road and Sossaman Road Prepared by Nathan and Associates, Inc.7900-7998 E Pecos Rd, Mesa, Arizona, 85212 Latitude: 33.28535Rings: 1, 3, 5 mile radii Longitude: -111.66933
1 mile 3 miles 5 miles2010 Population by Race/Ethnicity
Total 2,282 44,783 100,467White Alone 81.9% 82.3% 81.8%Black Alone 3.7% 3.7% 3.8%American Indian Alone 1.4% 1.1% 0.9%Asian Alone 5.1% 4.5% 4.9%Pacific Islander Alone 0.3% 0.2% 0.2%Some Other Race Alone 3.7% 4.5% 4.8%Two or More Races 3.9% 3.7% 3.7%
Hispanic Origin 15.4% 15.5% 15.9%Diversity Index 50.1 49.8 50.8
2018 Population by Race/EthnicityTotal 2,630 57,149 152,168
White Alone 78.2% 78.8% 78.2%Black Alone 4.4% 4.2% 4.5%American Indian Alone 1.6% 1.2% 1.0%Asian Alone 6.2% 5.4% 5.7%Pacific Islander Alone 0.3% 0.2% 0.2%Some Other Race Alone 4.4% 5.7% 6.0%Two or More Races 4.8% 4.5% 4.4%
Hispanic Origin 17.7% 18.0% 18.5%Diversity Index 56.3 55.9 56.9
2023 Population by Race/EthnicityTotal 2,840 63,715 176,101
White Alone 75.2% 76.0% 75.4%Black Alone 5.1% 4.8% 5.2%American Indian Alone 1.8% 1.3% 1.1%Asian Alone 7.3% 6.2% 6.6%Pacific Islander Alone 0.4% 0.2% 0.2%Some Other Race Alone 4.8% 6.3% 6.5%Two or More Races 5.5% 5.1% 4.9%
Hispanic Origin 19.6% 19.8% 20.2%Diversity Index 60.7 60.2 61.0
2010 Population by Relationship and Household TypeTotal 2,282 44,783 100,466
In Households 98.5% 99.3% 99.7%In Family Households 94.5% 90.8% 90.4%
Householder 23.4% 25.7% 25.4%Spouse 19.9% 21.2% 20.8%Child 45.9% 38.9% 39.0%Other relative 3.7% 3.1% 3.4%Nonrelative 1.7% 1.9% 1.9%
In Nonfamily Households 4.0% 8.4% 9.2%In Group Quarters 1.5% 0.7% 0.3%
Institutionalized Population 0.0% 0.0% 0.0%Noninstitutionalized Population 1.5% 0.7% 0.3%
Data Note: Persons of Hispanic Origin may be of any race. The Diversity Index measures the probability that two people from the same area will be from different race/ethnic groups.Source: U.S. Census Bureau, Census 2010 Summary File 1. Esri forecasts for 2018 and 2023 Esri converted Census 2000 data into 2010 geography.
September 17, 2018
©2018 Esri Page 4 of 7
Market ProfilePecos Road and Sossaman Road Prepared by Nathan and Associates, Inc.7900-7998 E Pecos Rd, Mesa, Arizona, 85212 Latitude: 33.28535Rings: 1, 3, 5 mile radii Longitude: -111.66933
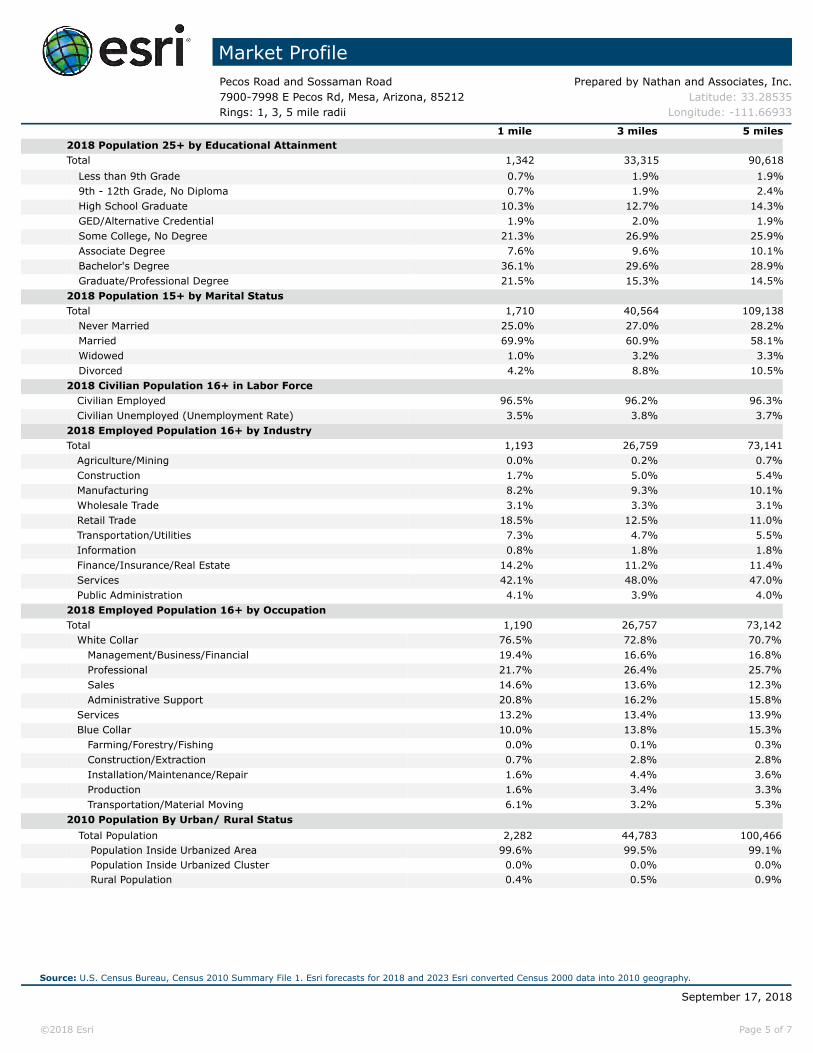
1 mile 3 miles 5 miles2018 Population 25+ by Educational AttainmentTotal 1,342 33,315 90,618
Less than 9th Grade 0.7% 1.9% 1.9%9th - 12th Grade, No Diploma 0.7% 1.9% 2.4%High School Graduate 10.3% 12.7% 14.3%GED/Alternative Credential 1.9% 2.0% 1.9%Some College, No Degree 21.3% 26.9% 25.9%Associate Degree 7.6% 9.6% 10.1%Bachelor's Degree 36.1% 29.6% 28.9%Graduate/Professional Degree 21.5% 15.3% 14.5%
2018 Population 15+ by Marital StatusTotal 1,710 40,564 109,138
Never Married 25.0% 27.0% 28.2%Married 69.9% 60.9% 58.1%Widowed 1.0% 3.2% 3.3%Divorced 4.2% 8.8% 10.5%
2018 Civilian Population 16+ in Labor Force Civilian Employed 96.5% 96.2% 96.3% Civilian Unemployed (Unemployment Rate) 3.5% 3.8% 3.7%2018 Employed Population 16+ by IndustryTotal 1,193 26,759 73,141 Agriculture/Mining 0.0% 0.2% 0.7% Construction 1.7% 5.0% 5.4% Manufacturing 8.2% 9.3% 10.1% Wholesale Trade 3.1% 3.3% 3.1% Retail Trade 18.5% 12.5% 11.0% Transportation/Utilities 7.3% 4.7% 5.5% Information 0.8% 1.8% 1.8% Finance/Insurance/Real Estate 14.2% 11.2% 11.4% Services 42.1% 48.0% 47.0% Public Administration 4.1% 3.9% 4.0%2018 Employed Population 16+ by OccupationTotal 1,190 26,757 73,142 White Collar 76.5% 72.8% 70.7% Management/Business/Financial 19.4% 16.6% 16.8% Professional 21.7% 26.4% 25.7% Sales 14.6% 13.6% 12.3% Administrative Support 20.8% 16.2% 15.8% Services 13.2% 13.4% 13.9% Blue Collar 10.0% 13.8% 15.3% Farming/Forestry/Fishing 0.0% 0.1% 0.3% Construction/Extraction 0.7% 2.8% 2.8% Installation/Maintenance/Repair 1.6% 4.4% 3.6% Production 1.6% 3.4% 3.3% Transportation/Material Moving 6.1% 3.2% 5.3%2010 Population By Urban/ Rural Status
Total Population 2,282 44,783 100,466Population Inside Urbanized Area 99.6% 99.5% 99.1%Population Inside Urbanized Cluster 0.0% 0.0% 0.0%Rural Population 0.4% 0.5% 0.9%
Source: U.S. Census Bureau, Census 2010 Summary File 1. Esri forecasts for 2018 and 2023 Esri converted Census 2000 data into 2010 geography.
September 17, 2018
©2018 Esri Page 5 of 7

Market ProfilePecos Road and Sossaman Road Prepared by Nathan and Associates, Inc.7900-7998 E Pecos Rd, Mesa, Arizona, 85212 Latitude: 33.28535Rings: 1, 3, 5 mile radii Longitude: -111.66933
1 mile 3 miles 5 miles2010 Households by Type
Total 619 14,244 32,206Households with 1 Person 6.9% 13.6% 14.6%Households with 2+ People 93.1% 86.4% 85.4%
Family Households 89.3% 80.8% 79.2%Husband-wife Families 75.8% 66.7% 64.8%
With Related Children 56.9% 40.5% 40.1%Other Family (No Spouse Present) 13.6% 14.2% 14.3%
Other Family with Male Householder 4.5% 4.3% 4.6%With Related Children 3.6% 3.2% 3.4%
Other Family with Female Householder 9.0% 9.9% 9.7%With Related Children 7.1% 7.7% 7.3%
Nonfamily Households 3.7% 5.6% 6.2%
All Households with Children 67.8% 51.9% 51.3%
Multigenerational Households 5.8% 3.9% 4.2%Unmarried Partner Households 4.4% 6.2% 6.6%
Male-female 3.7% 5.6% 5.9%Same-sex 0.6% 0.6% 0.7%
2010 Households by SizeTotal 619 14,242 32,205
1 Person Household 6.9% 13.6% 14.6%2 Person Household 20.7% 30.6% 29.6%3 Person Household 17.0% 17.3% 17.5%4 Person Household 23.6% 19.9% 19.8%5 Person Household 16.5% 10.8% 10.5%6 Person Household 10.0% 5.1% 5.0%7 + Person Household 5.3% 2.8% 3.0%
2010 Households by Tenure and Mortgage StatusTotal 618 14,243 32,205
Owner Occupied 76.2% 75.2% 75.7%Owned with a Mortgage/Loan 72.7% 67.8% 69.4%Owned Free and Clear 3.6% 7.4% 6.3%
Renter Occupied 23.8% 24.8% 24.3%2010 Housing Units By Urban/ Rural Status
Total Housing Units 676 15,797 35,798Housing Units Inside Urbanized Area 99.4% 99.5% 99.2%Housing Units Inside Urbanized Cluster 0.0% 0.0% 0.0%Rural Housing Units 0.6% 0.5% 0.8%
Data Note: Households with children include any households with people under age 18, related or not. Multigenerational households are families with 3 or more parent-child relationships. Unmarried partner households are usually classified as nonfamily households unless there is another member of the household related to the householder. Multigenerational and unmarried partner households are reported only to the tract level. Esri estimated block group data, which is used to estimate polygons or non-standard geography.Source: U.S. Census Bureau, Census 2010 Summary File 1. Esri forecasts for 2018 and 2023 Esri converted Census 2000 data into 2010 geography.
September 17, 2018
©2018 Esri Page 6 of 7

Market ProfilePecos Road and Sossaman Road Prepared by Nathan and Associates, Inc.7900-7998 E Pecos Rd, Mesa, Arizona, 85212 Latitude: 33.28535Rings: 1, 3, 5 mile radii Longitude: -111.66933
1 mile 3 miles 5 milesTop 3 Tapestry Segments
1. Up and Coming Families (7A)
Up and Coming Families (7A)
Up and Coming Families (7A)2. College Towns (14B) Boomburbs (1C) Boomburbs (1C)
3. Southern Satellites (10A) Silver & Gold (9A) Silver & Gold (9A)
2018 Consumer Spending Apparel & Services: Total $ $2,061,317 $50,173,847 $139,828,940
Average Spent $3,004.84 $2,791.00 $2,884.02Spending Potential Index 138 128 133
Education: Total $ $1,230,137 $30,043,541 $84,765,921Average Spent $1,793.20 $1,671.22 $1,748.33Spending Potential Index 124 115 121
Entertainment/Recreation: Total $ $2,886,803 $71,540,152 $197,988,957Average Spent $4,208.17 $3,979.54 $4,083.59Spending Potential Index 131 124 127
Food at Home: Total $ $4,483,212 $109,416,552 $301,682,778Average Spent $6,535.29 $6,086.47 $6,222.32Spending Potential Index 130 121 124
Food Away from Home: Total $ $3,337,709 $81,289,946 $225,390,875Average Spent $4,865.47 $4,521.89 $4,648.77Spending Potential Index 139 129 132
Health Care: Total $ $4,905,818 $123,447,136 $338,273,107Average Spent $7,151.34 $6,866.95 $6,977.00Spending Potential Index 125 120 122
HH Furnishings & Equipment: Total $ $1,957,649 $48,311,058 $133,634,096Average Spent $2,853.72 $2,687.38 $2,756.25Spending Potential Index 137 129 132
Personal Care Products & Services: Total $ $771,483 $19,120,462 $53,029,515Average Spent $1,124.61 $1,063.61 $1,093.75Spending Potential Index 136 128 132
Shelter: Total $ $15,159,588 $369,786,088 $1,020,940,958Average Spent $22,098.52 $20,569.96 $21,057.28Spending Potential Index 132 123 125
Support Payments/Cash Contributions/Gifts in Kind: Total $ $2,083,626 $53,268,720 $146,989,779Average Spent $3,037.36 $2,963.16 $3,031.72Spending Potential Index 122 119 122
Travel: Total $ $1,972,121 $49,624,498 $138,276,246Average Spent $2,874.81 $2,760.44 $2,852.00Spending Potential Index 133 128 132
Vehicle Maintenance & Repairs: Total $ $979,788 $24,048,298 $66,123,636Average Spent $1,428.26 $1,337.73 $1,363.82Spending Potential Index 133 124 127
Data Note: Consumer spending shows the amount spent on a variety of goods and services by households that reside in the area. Expenditures are shown by broad budget categories that are not mutually exclusive. Consumer spending does not equal business revenue. Total and Average Amount Spent Per Household represent annual figures. The Spending Potential Index represents the amount spent in the area relative to a national average of 100.Source: Consumer Spending data are derived from the 2015 and 2016 Consumer Expenditure Surveys, Bureau of Labor Statistics. Esri.Source: U.S. Census Bureau, Census 2010 Summary File 1. Esri forecasts for 2018 and 2023 Esri converted Census 2000 data into 2010 geography.
September 17, 2018
©2018 Esri Page 7 of 7