Embed Size (px)
Citation preview
Subsidies: An
All-India Perspective
An all-India perspective on the extent of subsidies can be provided by
putting together subsidy estimates for the Centre and the States. In the
ensuing discussion, estimates of budget-based subsidies for the Centre and the
States taken together are discussed first, in terms of their overall magnitudes,
relative shares of the Centre and the States, the recovery rates and the sectoral
shares. A comparison of the major findings for 1994-95 is then made with
the previous estimates of subsidies pertaining to 1987-88 and 1992-93. In this
chapter, some of the major subsidies in India, like those relating to power,
irrigation, health, education and petroleum products are also discussed
individually.
Centre and States: Aggregate Budget-Based Subsidies
An estimate of subsidies emanating from the Central government budget was
given in Chapter 2 for 1994-95, while that for the States, as projected on the
basis of estimates for 15 major States (1993-94), and four special category
States (1994-95) was provided in Chapter 3. An all-India estimate of
budget-based subsidies can be obtained by adding the Central and State
government subsidies.
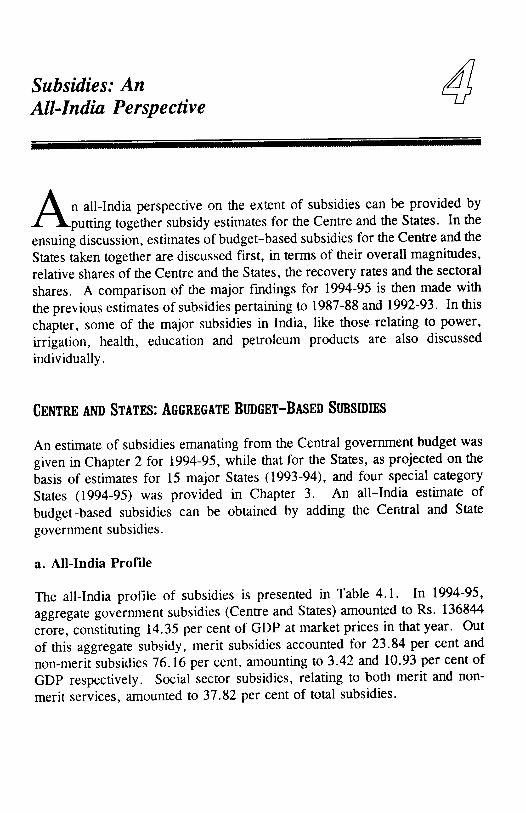
a. All-India Profile
The all-India profile of subsidies is presented in Table 4.1. In 1994-95,
aggregate government subsidies (Centre and States) amounted to Rs. 136844
crore, constituting 14.35 per cent of GDP at market prices in that year. Out
of this aggregate subsidy, merit subsidies accounted for 23.84 per cent and
non-merit subsidies 76.16 per cent, amounting to 3.42 and 10.93 per cent of
GDP respectively. Social sector subsidies, relating to both merit and non-
merit services, amounted to 37.82 per cent of total subsidies.
66 Chapter 4
Table 4.1
All-India Subsidies: 1994-95
Services Rs. Crore
Total Cost Total
Receipts
Subsidies/
Surplus (-)
Recovery
Rate (%)
Subsidies as
Percentage of
Total
Subsidies
1. Merit Goods/Services
(Subsidy Sectors)
a. Social Services
b. Economic Services
32991.35
20149.79
12841.56
362.84
149.39
213.45
32628.51
20000.40
12628.11
1.10
0.74
1.66
23.84
14.62
9.23
2. Non-Merit Goods/Services 114491.93 10276.95 104214.98
(Subsidy Sectors)
8.98
3. Surplus Sectors (Merit and 25984.85 35446.49 -9461.64 136.41
Non-Merit)
76.16
a.
b.
Social Services
Economic Services
32916
81575
.91
.02
1166
9110
.39
.06
31750
72464
.02
.96
3
11
.54
.17
23
52
.20
.95
Total Subsidies (1 + 2) 147483.28 10639.79 136843.49 7.21 100.00
Social Services (Merit atid
Noo-Mml)
Economic Service* (Merit and $44I<1
Non-Merit)
53066.70 1316.28 51750.42 2.48
$323JI 85093.07 9.87
37. &2
62. ia
Subsidies Net of Surplus
(1 + 2 + 3)
173468.13 46086.28 127381.85 26.57
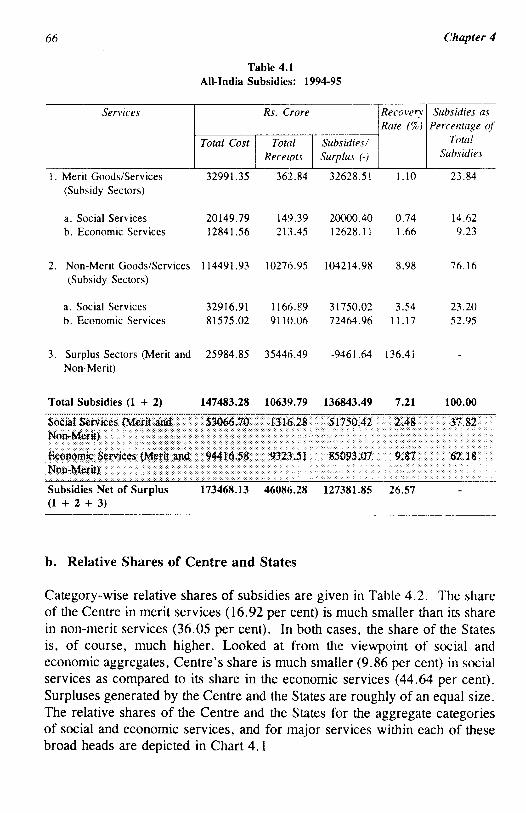
b. Relative Shares of Centre and States
Category-wise relative shares of subsidies are given in Table 4.2. The share
of the Centre in merit services (16.92 per cent) is much smaller than its share
in non-merit services (36.05 per cent). In both cases, the share of the States
is, of course, much higher. Looked at from the viewpoint of social and
economic aggregates, Centre's share is much smaller (9.86 per cent) in social
services as compared to its share in the economic services (44.64 per cent).
Surpluses generated by the Centre and the States are roughly of an equal size.
The relative shares of the Centre and the States for the aggregate categories
of social and economic services, and for major services within each of these
broad heads are depicted in Chart 4.1
GOVERNMENT SUBSIDIES IN INDIA 67
Table 4.2
Centre, States and All-India Subsidies: 1994-95
Services
1 Mprit Gnnrk/Services
Rs. Crore
Centre
5521.91
States
27106.60
All-India
32628.51
Per Cent
Share in All-India
Subsidies
Centre
16.92
States
83.08
(Subsidy Sectors)
a. Social Services
b. Economic Services
2. Non-Merit Goods/Services
(Subsidy Sectors)
a. Social Services
b. Economic Services
3. Surplus Sectors (Merit and
Non-Merit)
Total Subsidies (1 + 2)
1162.93 18837.47 20000.40 5.81
4358.98 8269.13 12628.11 34.52
37567.12 66647.86 104215.00 36.05
3939.53 27810.49 31750.02
33627.59 38837.37 72464.96
-4642.83 -4818.81 -9461.64
43089.03 93754.46 136843.50
Social Services {Merit and Nart-
Merit)
Economic Service* {Merit and
Non-Merit)
5102.46 4*-V47.96 5l7$0.07
379a6.5? 47106,50 85093.07
94.19
65.48
63.95
12.41
46.41
49.07
31.49
9.86
44.64
87.59
53.59
50.93
68.51
90.14
55.36
Subsidies Net of Surplus
(1 + 2 + 3)
38446.20 88935.65 127381.86 30.18 69.82
c. Recovery Rates
A profile of recovery rates are shown in Table 4.3.
Table 4.3
Profile of Recovery Rates: 1994-95
Centre
States
All-India
Merit
Social
2.93
0.60
0.74
Economic
1.72
1.63
1.66
Total
Non-Merit
Social
1.98 12.38
0.92 2.15
1.10 3.54
Economic
11.65
10.75
11.17
Total
11.73
7.35
8.98
All
10.59
5.58
7.21

68 Chapter 4
Chart 4.1
Relative Shares of Centre and States
SUB
Relative Shares: Social Services
100.00
0 00
Relative Shares: Economic Services
GOVERNMENT SUBSIDIES IN INDIA 69
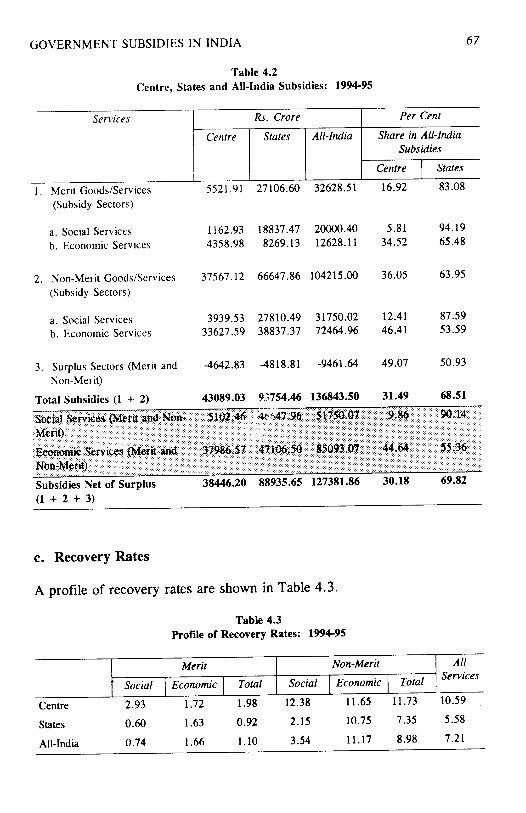
The average recovery rate, all services taken together, is substantially
lower in the case of States, being only 5.58 per cent (Table 4.3). The
corresponding figure for the Centre is 10.59 per cent, which also, by itself,
is quite low. The aggregate all-India recovery rate is just 7.21 per cent,
indicating that nearly 93 per cent of costs in the provision of social and
economic services remain unrecovered. As expected, the recovery rates in
the case of merit goods is very low, not rising beyond 2 per cent in most
cases. In the case of non-merit goods, the Centre performs better in all
categories, the difference being much larger for social services as compared
to that for economic services.
d. Sectoral Shares
Sector-wise shares _ have been worked out putting merit and non-merit
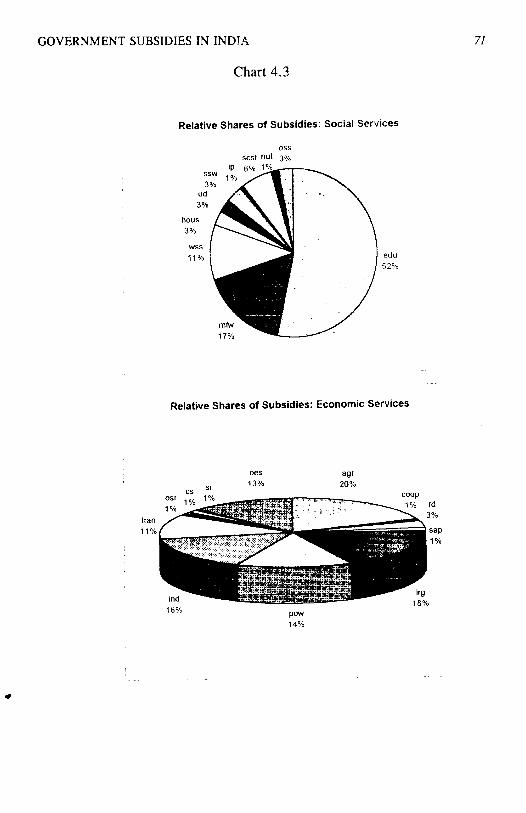
subsidies together. Relative shares of different sectors are indicated in Chart
4.2. Education as a sector claims the largest share of subsidies accounting for
21 per cent, followed by agriculture (12 per cent), irrigation (11 per cent),
industries (10 per cent), power (9 per cent) and transport (7 per cent).
Relative shares of different sectors within their sub-groups (social and
economic) are highlighted in Chart 4.3. Among the social services, education
has the largest share, followed by medical and family welfare. Among the
economic services agriculture, irrigation, industries and power have claimed
major shares.
Comparison With Previous Studies
While it is tempting to compare these results with those obtained in the two
previous exercises directed towards subsidy estimation, viz., Mundle and Rao
(1991) and Tiwari (1996), relating respectively to years 1987-88 and 1992-93,
with a view to obtaining some idea as to the pattern of change in subsidising
government services over time, such a comparison cannot be done in a
straightforward manner because of the differences in method and procedure
of estimating subsidies in this study vis-a-vis the two earlier studies. Some
of the important differences are noted below.
i. The interest-rate, reflecting the opportunity cost of capital employed
in the provision of services, has been estimated here as the average
rate of interest on internal (including small savings and provident
fund) and external debt incurred by the government. For the

70Chapter 4
estimation of State level subsidies, average effective interest rateswere calculated for each State separately. Thus, there is a vector ofinterest rates used in this study which gives individual rates for theCentre and each of the States.
Chart 4.2
Subsidies in Major Sectors: arranged in ascending
order
Relative Shares of Major Sectors in Total All india
Subsidies
all others 1
15%
mm
magr
12%
GOVERNMENT SUBSIDIES IN INDIA
Chart 4.3
71
Relative Shares of Subsidies: Social Services
Relative Shares of Subsidies: Economic Services
■J2 Chapter 4
In the Mundle and Rao exercise, the interest rate is calculated as the
ratio of domestic interest payments by government to the stock of domestic
public debt. Although not explicitly stated in their study, we understand that
this pertains to the combined accounts of Central and State governments. In
the Tiwari study, interest rate is calculated with reference to the domestic debt
of the Central government only. In both cases, it is only one uniform interest
rate which has been applied for the estimation of subsidies for the Centre as
well as for each individual State.
ii. The method of sector-wise aggregation of subsidies in this study
differs from that of its two predecessors in an important way. In
those cases, surpluses in some sectors were adjusted against subsidies
in others in the process of aggregating them. In the present exercise,
at the level of major budgetary heads, surplus sectors and subsidy
sectors are aggregated separately.
iii. Our all-India estimates relate to all States and the Centre, whereas the
coverage in the earlier studies were limited to only 14 States, without
any adjustment to take into account the remaining States.
iv. In our case, State level subsidies for 15 major States relate to the year
1993-94. Hence, for an all-India perspective for 1994-95, the States'
subsidies at an aggregate level are projected for 1994-95. In the
Tiwari study, data for two States were not available for 1992-93. As
such, in these cases, data for earlier years were used. It is not clear
whether the estimated subsidies were correspondingly projected
forward.
Fiscal Deficit and Aggregate Subsidy
Our estimates indicate that even when unrecovered costs for specified merit
goods are not included, the aggregate subsidy in India, Centre and States
taken together, amounted to 10.93 per cent of GDP in 1994-95. In the same
year, the fiscal deficit of the Centre and States taken together after netting out
intergovernmental transfers, was 7.3 per cent of GDP at market prices. Gross
primary deficit in this year was 2.45 per cent of GDP at market prices. Any
reduction in the quantum of subsidy would be a direct reduction of the
borrowing requirements of the government. It is clear that a substantial dent
on fiscal deficit can be made by raising the relevant user charges pertaining
to governmental provision of social and economic services. It is expected that
GOVERNMENT SUBSIDIES IN INDIA 73
the entire primary fiscal deficit would be wiped out by moderate increases in
user prices which will have direct as well as secondary effects on fiscal
deficit.
The direct effects towards reduction in the extent of unrecovered cost
would flow from several channels. First, as user prices go up, recoveries
would increase. Secondly, the quantity demanded of the concerned
governmental provision of the service would also fall, if the relevant demand
curve is elastic such that demand falls below present levels of
supply/consumption. The more elastic the demand curve, the larger would
be the positive impact on cost recovery. Thirdly, if the government
provision/production of the concerned good (service) is on the rising portion
of the average cost curve, there would be a reduction in average cost itself.
For these reasons, the impact on fiscal deficit would be immediate and
substantial, as user prices go up.
In addition, there would also be some secondary effects of an increase
in the user prices. These effects would emanate from the fact that once
scarce resources are released from oversubsidised sectors, the overall
productive efficiency of the system would also increase leading to an increase
in the tax-base, which will also reduce the fiscal deficit.
Major Subsidies in India: Some Observations
Some of the major and frequently discussed subsidies in India relate to: food,
fertilisers, exports, power, irrigation, health and education. In addition,
subsidies through the public sector enterprises affect those sectors/industries
in which these enterprises participate. A discussion of the explicit Central
subsidies relating to food, fertilisers and exports was undertaken in Chapter
2. Similarly, subsidies in respect of the Central and State public sector
enterprises were discussed in Chapters 2 and 3. Some of other major
subsidies, viz., power, irrigation and the social sector subsidies (health and
education) are briefly discussed here. In addition, some important off-budget
or regulatory subsidies like petroleum subsidies are also discussed.
a. Power (Electricity) Subsidies
Subsidies implicit in the supply of electricity through State Electricity Boards
are estimated and presented periodically in the annual report on the Working
of State Electricity Boards and Electricity Departments prepared by the Power
74 Chapter 4
and Energy Division of the Planning Commission. In this exercise, effective
subsidy is defined as the difference between the cost of supply and revenue
realisation.
Different categories of consumers of electricity are charged differential
rates. Six major categories of electricity consumers in this context are: (i)
domestic, (ii) agriculture (irrigation), (iii) outside-State, (iv) commercial, (v)
industrial and (vi) railway traction. The tariff-rates for the first three
categories are less than the average per unit cost of supplying electricity while
that for the last three categories are more than the average cost. Thus, the
first set of consumers are cross-subsidised by the second set. The subsidy
rates differ for the three subsidised categories of consumers. In 1994-95, the
average cost of electricity was 159.92 paise per kilowatt hour. The average
subsidy for domestic consumption was 66.94 paise, 138.10 paise for use in
agriculture/irrigation and 50.39 paise for use outside the State. Similarly, the
burden of cross-subsidisation was differentially distributed. For commercial
and industrial users, this cross-subsidy rate was 43.47 and 51.66 paise on
average. Since industrial consumption was nearly eight times the commercial
consumption, most of the cross-subsidisation in electricity comes from the
industrial consumers. The estimated subsidies are not fully recovered by the
State Electricity Boards through compensation from their respective State
governments. Some States provide partial support. Some State governments
also write off interest payable to them in lieu of subsidised sale of electricity
by the SEBs.
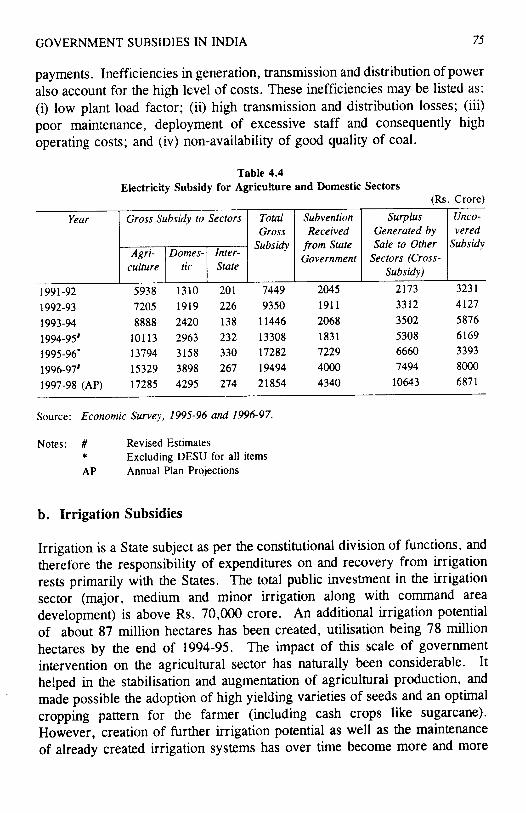
Estimates for gross electricity subsidy are given in Table 4.4. In
1994-95, this subsidy amounted to Rs. 10113 crore for the agricultural sector
and Rs. 2963 crore for the domestic sector, the former being 76 per cent of
the total electricity subsidy. There could be an element of overestimation in
the agricultural sector. Since in many cases agricultural use of power is
unmetered, the possibility of transmission and distribution losses being
classified as agricultural consumption cannot be ruled out. The subsidy rates
have been rising for both agriculture and domestic sectors because the unit
cost has been rising faster than the relevant tariff rate. Between 1992-93 and
1995-96, the unit cost rose from 137.44 paise to 170.11 paise per kilowatt
hour, implying a rise of 32.67 paise per unit. In the same period, the tariff
rate for the domestic consumers rose only by 13.52 paise, and that for the
agricultural sector, by 8.89 paise.
Escalation in the cost of production has been primarily due to
increased fuel costs, costs of establishment, purchase of power and interest
GOVERNMENT SUBSIDIES IN INDIA 75
payments. Inefficiencies in generation, transmission and distribution of power
also account for the high level of costs. These inefficiencies may be listed as:
(i) low plant load factor; (ii) high transmission and distribution losses; (iii)
poor maintenance, deployment of excessive staff and consequently high
operating costs; and (iv) non-availability of good quality of coal.
Table 4.4
Electricity Subsidy for Agriculture and Domestic Sectors
(Rs. Crore)
Year
1991-92
1992-93
1993-94
1994-95'
1995-96*
1996-97'
1997-98 (AP)
Gross Subsidy to
Agri
culture
5938
7205
8888
10113
13794
15329
17285
Domes
tic
1310
1919
2420
2963
3158
3898
4295
Sectors
Inter-
State
201
226
138
232
330
267
274
Total
Gross
Subsidy
7449
9350
11446
13308
17282
19494
21854
Subvention
Received
from State
Government
2045
1911
2068
1831
7229
4000
4340
Surplus
Generated by
Sale to Other
Sectors (Cross-
Subsidy)
2173
3312
3502
5308
6660
7494
10643
Unco
vered
Subsidy
3231
4127
5876
6169
3393
8000
6871
Source: Economic Survey, 1995-96 and 1996-97.
Notes: # Revised Estimates
* Excluding DESU for all items
AP Annual Plan Projections
b. Irrigation Subsidies
Irrigation is a State subject as per the constitutional division of functions, and
therefore the responsibility of expenditures on and recovery from irrigation
rests primarily with the States. The total public investment in the irrigation
sector (major, medium and minor irrigation along with command area
development) is above Rs. 70,000 crore. An additional irrigation potential
of about 87 million hectares has been created, utilisation being 78 million
hectares by the end of 1994-95. The impact of this scale of government
intervention on the agricultural sector has naturally been considerable. It
helped in the stabilisation and augmentation of agricultural production, and
made possible the adoption of high yielding varieties of seeds and an optimal
cropping pattern for the farmer (including cash crops like sugarcane).
However, creation of further irrigation potential as well as the maintenance
of already created irrigation systems has over time become more and more
76 Chapter 4
difficult due to the inadequate attention paid to financial viability of the entire
irrigation system by most of the States. The irrigation sector approximately
broke even upto the early fifties, but the financial scenario became
progressively worse after that. While the costs have risen continuously over
the years, their recovery has been tardy due to low water rates, infrequent
revision of the rates and large arrears even with respect to these low rates.
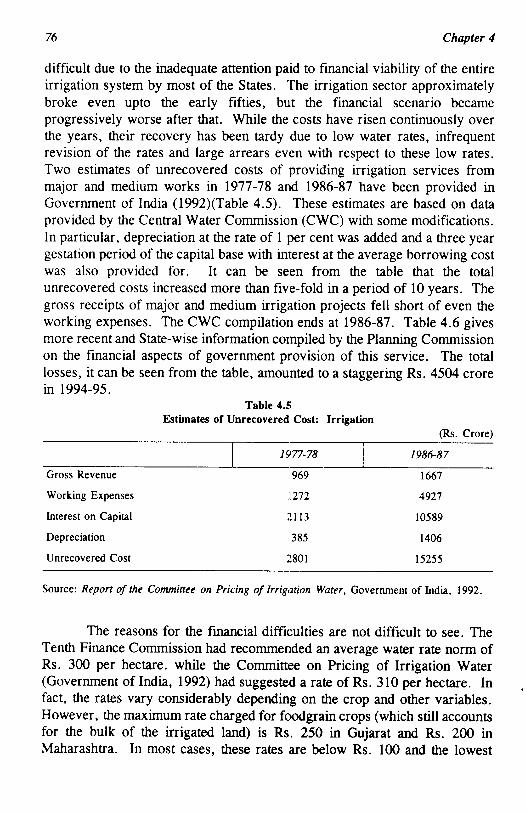
Two estimates of unrecovered costs of providing irrigation services from
major and medium works in 1977-78 and 1986-87 have been provided in
Government of India (1992)(Table 4.5). These estimates are based on data
provided by the Central Water Commission (CWC) with some modifications.
In particular, depreciation at the rate of 1 per cent was added and a three year
gestation period of the capital base with interest at the average borrowing cost
was also provided for. It can be seen from the table that the total
unrecovered costs increased more than five-fold in a period of 10 years. The
gross receipts of major and medium irrigation projects fell short of even the
working expenses. The CWC compilation ends at 1986-87. Table 4.6 gives
more recent and State-wise information compiled by the Planning Commission
on the financial aspects of government provision of this service. The total
losses, it can be seen from the table, amounted to a staggering Rs. 4504 crore
in 1994-95.
Table 4.5
Estimates of Unrecovered Cost: Irrigation
(Rs. Crore)
Gross Revenue
Working Expenses
Interest on Capital
Depreciation
Unrecovered Cost
1977-78
969
1272
2113
385
2801
1986-87
1667
4927
10589
1406
15255
Source: Report of the Committee on Pricing of Irrigation Water, Government of India, 1992.
The reasons for the financial difficulties are not difficult to see. The
Tenth Finance Commission had recommended an average water rate norm of
Rs. 300 per hectare, while the Committee on Pricing of Irrigation Water
(Government of India, 1992) had suggested a rate of Rs. 310 per hectare. In
fact, the rates vary considerably depending on the crop and other variables.
However, the maximum rate charged for foodgrain crops (which still accounts
for the bulk of the irrigated land) is Rs. 250 in Gujarat and Rs. 200 in
Maharashtra. In most cases, these rates are below Rs. 100 and the lowest

GOVERNMENT SUBSIDIES IN INDIA 77
rate is as low as Rs. 19.77 (Uttar Pradesh). In the case of cash crops like
sugarcane, the rates are higher, particularly in Maharashtra (Rs. 1750 per
hectare) and Gujarat (Rs. 830 per hectare). The average rates for irrigation
water in most of the States are thus very low. It has been estimated that the
average irrigation rates will have to be increased by 25 per cent every year
to meet the operation and maintenance costs alone in the next ten years.
Table 4.6
Operational
State
Andhra Pradesh
Bihar
Goa
Gujarat
Haryana
Karnataka
Kerala
Madhya Pradesh
Maharashtra
Orissa
Punjab
Rajasthan
Tamil Nadu
Uttar Pradesh
West Bengal
Total Non-Special
Category States
Special category States
Grand Total
Profit/Loss of Irrigation Projects: 1994-95
Gross
Receipts
11.95
20.31
1.05
53.87
19.19
14.09
1.42
49.06
88.00
5.52
31.46
35.61
2.83
93.40
7.56
435.32
3.29
438.61
Working
Expenses
131.31
110.96
0.00
569.88
330.59
329.23
13.83
103.17
164.54
47.57
119.40
98.73
71.03
735.12
35.65
2861.01
107.47
2968.48
Interest
498.38
0.00
0.00
0.00
81.44
0.00
0.00
0.00
753.81
0.00
0.00
195.38
72.08
342.44
25.45
1968.98
5.57
1974.55
(Pre-Actuals)
Total
Expenses
629.69
110.96
0.00
569.88
412.03
329.23
13.83
103.17
918.35
47.57
119.40
294.11
143.11
1077.56
61.10
4829.99
113.03
4943.02
(Rs. Crore)
Net Profit/
Loss (-)
-617.74
-90.65
1.05
-516.01
-392.84
-315.14
-12.41
-54.11
-830.35
^2.05
-87.94
-258.50
-140.28
-984.16
-53.54
-4394.67
-109.74
-4504.41
Source: Planning Commission.
The available information of revision of water rates also shows that
even normal cost increases resulting from inflation have not been recovered,
although there were other elements of cost increase like rising wages and
salaries and higher interest costs. There is hardly any case of an automatic
rise in rates, and the ad hoc revisions have been rather infrequent. Out of 20
States for which information is available, only four (Assam in 1993, Haryana
7# Chapter 4
and Maharashtra in 1994, and Bihar in 1995) have revised the water rates in
the nineties. Uttar Pradesh did so in 1994, but withdrew it next year.
Similarly Madhya Pradesh first revised and then withdrew the revision in
1992. As against this, in five States (Jammu and Kashmir since 1976, Kerala
since 1974, Punjab since 1974, Tamil Nadu since 1962 and West Bengal since
1977) the rates have not been revised for twenty years or more. In fact, there
is a move to abolish water rates in Kerala. These facts speak for themselves.
The accumulated arrears are also generally very large. For example,
in Uttar Pradesh the arrears of irrigation rates amounted to about Rs. 700
crore as against a collection of Rs. 84 crore only during 1994-95. In Gujarat,
the amounts were Rs. 61 crore and Rs. 13 crore respectively in the same
year. Other States with similar problems were Maharashtra and Bihar; the
problem of arrears is sufficiently general to cause concern and look for
remedies.
The Committee on Pricing of Irrigation Water (Government of India,
1992) therefore felt that both revision and restructuring of irrigation rates
were called for. They should be revised in such a way that the gross receipts
cover operation and maintenance costs, depreciation and interest on capital.
Evasion of water rates on the ground of non-use being rather common, as also
to promote optimal utilisation, a levy on unutilised capacity has also been
recommended (by the Ninth and Tenth Finance Commissions). Given the
present situation, it would be noteworthy if only the operational and
maintenance expenses were recovered through the rates, as the Group of
Officials constituted by the Planning Commission in 1992 to examine the
recommendations of the above Committee felt, but there are several problems
even for this limited measure. The problem is not with the willingness to pay
for the use of water. Various studies have shown that far higher rates are
paid by farmers for water from alternative sources other than canal irrigation.
To some extent, fJie user resistance to cost recovery can be attributed to poor
availability of water in terms of timeliness of supply, adequacy and extent of
private costs involved in utilising the available water.
It has been observed [Gulati, Svendsen and Roy Chowdhury, (1995)]
that the problems of poor performance of irrigation systems in India
(especially canal irrigation networks) are linked with poor cost recovery. On
the one hand, lack of sufficient funds lead to low performance levels, and on
the other, poor operational performance further reduces cost recovery. As
such, the system of irrigation is caught in a downwards spiral. Gulati, et.al.
(1995, p. 337) observe: "Experts fear that unless some urgent steps are taken
GOVERNMENT SUBSIDIES IN INDIA 79
to stem this steady downwards spiral, it will not be long before the entire
system, built up at enormous cost, becomes sub-optimal", and later "... the
return from the existing schemes, at the margin, is the highest when better
operation and maintenance is provided".
Thus, a vicious circle of inadequate finances, inadequate maintenance,
loss of water and inavailability to farmers is already in operation. Further,
poor monitoring has converted irrigation water into a public good with the
classic problem of free-riding. As it is, despite water being a precious natural
resource, there is hardly any attempt to encourage its efficient use through
consumption-linked pricing on the ground of non-enforceability. Solutions to
these problems need to be found urgently, before the irrigation rates become
acceptable to the farmers. And without such acceptability, it would be
difficult to implement rate revisions due to the electoral power of the farmers
as a group, which the elected representatives would find impossible to ignore.
c. Social Sector Subsidies
Being associated with strong externalities and scale economies, both education
and health qualify for large subsidies. Education improves sociability,
occupational mobility, voluntary responsibilities and law conformity. Better
health reduces morbidity and mortality levels and spread of communicable
diseases. Both education and health contribute to productive efficiency of the
system and a more equitable income-distribution.
Alternative ways of administering subsidies in these sectors may be
listed as:
Health: tax deducibility of medical expenses; subsidies toemployer/employee for medical insurance; direct transfers to
individuals; provision of medical services (consultation/
medicines) free or at highly subsidised rates; and,
subsidisation of inputs like medical instruments, medicines,
domestically produced or imported.
Education: low (less-than-cost) fees; scholarships; education loans;
subsidised supply of books, meals, uniforms; direct investment
in educational institutions, especially for higher and technical
education, where private investment is not forthcoming; and
government aid to private educational institutions.
80 Chapter 4
Education is a subject on the concurrent list, and subsidies to this
sector flow from both the Central and the State governments. In 1994-95,
according to our estimates, Central government subsidies on general education
amounted to Rs. 1,629.4 crore, constituting 3.8 per cent of the total Central
subsidies of Rs. 43,089.03 crore. The share of subsidies on education was
much higher in the case of States. For 1993-94, for the States covered under
this study, the subsidies on general education amounted to Rs. 18,620.2 crore,
in a total of Rs. 73,100 crore. Thus, roughly one-fourth of State subsidies
are on education.
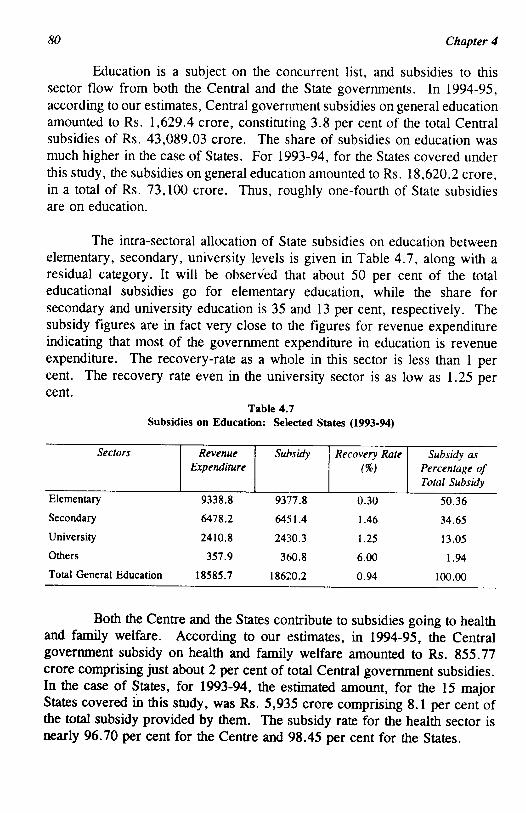
The intra-sectoral allocation of State subsidies on education between
elementary, secondary, university levels is given in Table 4.7, along with a
residual category. It will be observed that about 50 per cent of the total
educational subsidies go for elementary education, while the share for
secondary and university education is 35 and 13 per cent, respectively. The
subsidy figures are in fact very close to the figures for revenue expenditure
indicating that most of the government expenditure in education is revenue
expenditure. The recovery-rate as a whole in this sector is less than 1 per
cent. The recovery rate even in the university sector is as low as 1.25 per
cent.
Table 4.7
Subsidies on Education: Selected States (1993-94)
Sectors
Elementary
Secondary
University
Others
Total General Education
Revenue
Expenditure
9338.8
6478.2
2410.8
357.9
18585.7
Subsidy
9377.8
6451.4
2430.3
360.8
18620.2
Recovery Rate
(%)
0.30
1.46
1.25
6.00
0.94
Subsidy as
Percentage of
Total Subsidy
50.36
34.65
13.05
1.94
100.00
Both the Centre and the States contribute to subsidies going to health
and family welfare. According to our estimates, in 1994-95, the Central
government subsidy on health and family welfare amounted to Rs. 855.77
crore comprising just about 2 per cent of total Central government subsidies.
In the case of States, for 1993-94, the estimated amount, for the 15 major
States covered in this study, was Rs. 5,935 crore comprising 8.1 per cent of
the total subsidy provided by them. The subsidy rate for the health sector is
nearly 96.70 per cent for the Centre and 98.45 per cent for the States.
GOVERNMENT SUBSIDIES IN INDIA SI
Some noticeable empirical features in regard to social sector subsidies
may be listed as:
i. health expenditure is primarily on curative rather than preventive
health care; a reversal of these priorities may be more efficient and
economical in the long run, and it would also reduce the subsidy
burden on the government considerably;
ii. social services, even though highly subsidised, may still be out ofreach for the poor, because the component of private costs
(transportation, book, medicines, etc.) may be prohibitively high;
iii. a large part of the benefit of higher and technical education which are
highly subsidised is appropriated by the better off people, who are
more advantageously placed in getting admission into and pursuing
these courses;
iv. there is a substantial amount of interdependence between these two
sectors; for example, female literacy has been shown to reduce infant
mortality; and
v. it cannot always be assumed that the subsidies actually benefit the
target groups, even when such groups are defined in a general way.
For example, education subsidies may not reach the students or even
teachers; possibilities of leakages cannot be ruled out.
The issue of incidence of education and health subsidies is discussed
further in Chapter 5.
d. Petroleum Subsidies
Petroleum subsidies ensue from an administered price regime governing the
sale of petroleum products, and thus provide an important example of an offjbudget regulatory subsidy. The interface between the government and the oilindustry is managed by the Oil Coordination Committee (set up in July, 1975)which regulates and monitors the production of petroleum products in India,prepares long term demand estimates, formulates new oil industry projects,
assists in reviewing and implementing pricing policies concerning petroleumproducts, and manages the oil pool accounts. Expert committees appointed
by the Central government review the pricing structure from time to time.

82 Chapter 4
There are four major oil pool accounts, known respectively as Crude
Oil Price Equalisation Account (COPE), Cost & Freight Adjustment (C&F)
Account, Freight Surcharge Pool (FSP) Account, and Product Price
Adjustment (PPA) Account. There are also several sub-accounts. The main
objectives of the Oil Pool Accounts (OPAs) are (i) to maintain price equity
throughout the country notwithstanding whether the product is domestically
produced or imported; (ii) to provide retention margins to refineries and
marketing companies operating at various cost levels; and (iii) to even out
imbalances caused by State/local levies like purchase tax, octroi, etc.
The funds of the pool are kept in the Public Account. Oil
Coordinating Committee (OCC) withdraws from the pool account for
liquidating pool's liabilities to oil companies. A major exception occurred in
1990-91, when the Central government directly appropriated an amount of
Rs. 2,300 crore to the Consolidated Fund of India, which was later written
off by the OCC. The pool funds deposited in the Public Account were
earning 5 per cent interest on minimum monthly balance until 1987. Since
then, these deposits have been rendered as non-interest bearing by a decision
of the government. Payments are made from the pool account to the oil
companies as per their due under various arrangements. The pool has to pay
interest at 10.5 per cent on the amounts due to various oil companies.
Although currently running into huge deficit, the oil pool accounts
were originally intended as self-balancing. The deficits are the result of
increasing amounts of subsidies implicit in maintaining increasing differentials
between costs of crude oil, and those of refining and marketing it, and the
administered prices of petroleum products. The four major oil pool accountsare described below:
i. Crude Oil Price Equalisation Account. With the help of this account,
the price of crude oil received from various sources, imported as well as
indigenous are equalised. This uniform price is referred to as the pooled
f.o.b. cost of crude. If the actual price of crude is higher than the pooled
f.o.b. price, the difference between the actual price and the pooled price is
borne by the COPE account. On the other hand, refineries which obtain
crude oil at a price lower than the pool price, contribute the difference to thepool account.
ii. Cost and Freight Adjustment Account. This comprises a number ofsub-pool accounts pertaining to:
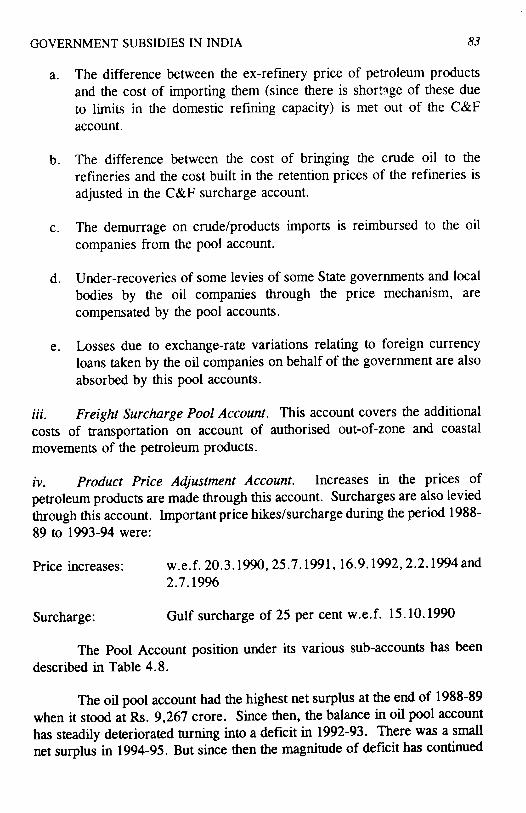
GOVERNMENT SUBSIDIES IN INDIA 83
a. The difference between the ex-refinery price of petroleum products
and the cost of importing them (since there is shortage of these due
to limits in the domestic refining capacity) is met out of the C&F
account.
b. The difference between the cost of bringing the crude oil to the
refineries and the cost built in the retention prices of the refineries is
adjusted in the C&F surcharge account.
c. The demurrage on crude/products imports is reimbursed to the oil
companies from the pool account.
d. Under-recoveries of some levies of some State governments and local
bodies by the oil companies through the price mechanism, are
compensated by the pool accounts.
e. Losses due to exchange-rate variations relating to foreign currency
loans taken by the oil companies on behalf of the government are also
absorbed by this pool accounts.
Hi. Freight Surcharge Pool Account. This account covers the additional
costs of transportation on account of authorised out-of-zone and coastal
movements of the petroleum products.
iv. Product Price Adjustment Account. Increases in the prices of
petroleum products are made through this account. Surcharges are also levied
through this account. Important price hikes/surcharge during the period 1988-
89 to 1993-94 were:
Price increases: w.e.f. 20.3.1990,25.7.1991,16.9.1992,2.2.1994 and
2.7.1996
Surcharge: Gulf surcharge of 25 per cent w.e.f. 15.10.1990
The Pool Account position under its various sub-accounts has been
described in Table 4.8.
The oil pool account had the highest net surplus at the end of 1988-89
when it stood at Rs. 9,267 crore. Since then, the balance in oil pool account
has steadily deteriorated turning into a deficit in 1992-93. There was a small
net surplus in 1994-95. But since then the magnitude of deficit has continued

84 Chapter 4
to grow. At the time of July 1996 price hikes it was estimated that the deficit
on the oil pool account could be contained at Rs. 2,000 crore at the end of
1996-97. With the announcement of a roll-back in the proposed increase in
diesel prices, this figure was revised upwards to Rs. 5,000 crore. However,
the November 7, 1996 presentation of the Ministry of Petroleum & Natural
Gas to the Parliamentary Consultative Committee has estimated (November
7, 1996) that the net deficit on the pool account at the end of 1996-97 will be
around Rs. 15,500 crore. By the first week of January, 1997, this estimate
was already revised upward to Rs. 16,900 crore.
Table 4.8
Position of Oil Pool Accounts: 1987-88 to 1994-95
(Rs. Crore)
Year
1987-88
1988-89
1989-90
1990-91
1991-92
1992-93
1993-94
1994-95
Opening
Balance
7,452
8,295
9,267
6,770
3,223
52
-456
-606
COPE
-295
-70
-2,167
-3,638
-6,441
-8,737
-9,056
-9,876
Net Inflow/-Outflow
C &F
1,346
943
-391
-2,382
-6,037
-5,775
-8,011
-6,936
FSP
-148
-158
-332
-428
^83
-664
-964
-1,280
PPA
12
225
431
5,391
10,169
15,114
18,728
19,886
Others
-93
32
-38
-2,490
-379
^46
-847
-511
Closing
Balance
8,295
9,267
6,770
3,223
52
^56
-606
677
Source: Centre for Monitoring Indian Economy, September, 1996, p. 129.
The structure of the oil pool account is such that deficit on all other
accounts are to be met out of surpluses in the PPA account. This surplus has
been proving to be inadequate due to the growing implicit subsidies in the
petroleum sector. If the COPE account could have been self-balanced, some
of the other deficits could be met out of the PPA account.
Under the 'retention price' scheme for oil refineries, oil marketing
companies and the pipelines, these units are compensated for operating costs
and ensured a return of 12 per cent post-tax on net worth subject to their
achieving laid down capacity norms.
With reference to pricing, petroleum products may be divided in two
categories, viz., administered products and free trade products. In the first
case, prices are uniform for each product at all primary pricing points. About
90 per cent of total petroleum products including MS, HSD, SKO, AVF,
LPG, Naphtha, FO, LSHS fall into this category. Products like LOBS,
GOVERNMENT SUBSIDIES IN INDIA 85
Benzene, Toluene, Hexane, RPC, CPC, MTO and CBFS fall into the
category of free trade products where oil companies are free to fix prices on
market considerations although refinery-to-marketing transfer prices of
specified products are fixed by government.
For refining activities, the retention price takes into account the
(pooled) cost of crude plus refining cost and ensures a fixed (12 per cent)
return on net worth. For marketing activities, the retention price takes into
account ex-refinery prices and marketing costs and then ensures a 12 per cent
return on net worth.
Major costs which have not been passed on to the consumers are on
account of: (i) LPG Price/Freight differential, (ii) dealers/distributors
commission differential, (iii) bitumen drum cost differential, (iv) coastal
freight under recovery, (v) railway freight incrementals, (vi) exchange rate
variations and (vii) differential due to change in custom/excise duty structure
from specific to ad-valorem (1.3.1994) and budget changes for 1996-97.
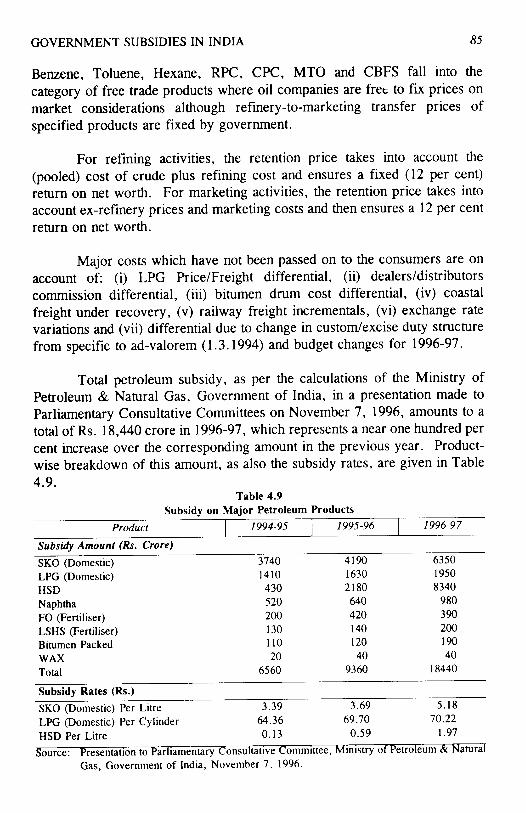
Total petroleum subsidy, as per the calculations of the Ministry of
Petroleum & Natural Gas, Government of India, in a presentation made to
Parliamentary Consultative Committees on November 7, 1996, amounts to a
total of Rs. 18,440 crore in 1996-97, which represents a near one hundred per
cent increase over the corresponding amount in the previous year. Product-
wise breakdown of this amount, as also the subsidy rates, are given in Table
4.9.
Table 4.9
Subsidy on Major Petroleum Products
Product 1994-95 1995-96 1996-97
Subsidy Amount (Rs. Crore)
SKO (Domestic)
LPG (Domestic)
HSD
Naphtha
FO (Fertiliser)
LSHS (Fertiliser)
Bitumen Packed
WAX
Total
3740
1410
430
520
200
130
110
20
6560
4190
1630
2180
640
420
140
120
40
9360
6350
1950
8340
980
390
200
190
40
18440
Subsidy Rates (Rs.)
SKO (Domestic) Per Litre 3.39 3.69 5.18
LPG (Domestic) Per Cylinder 64.36 69.70 70.22
HSD Per Litre 0.13 0.59 1.97
Source: Presentation to Parliamentary Consultative Committee, Ministry of Petroleum & Natural
Gas, Government of India, November 7, 1996.
86 Chapter 4
In terms of both the magnitude and the rates, the increase in subsidy
for HSD (diesel) is phenomenal. It increased from Rs. 430 crore in 1994-95
to Rs. 8340 crore in 1996-97. In terms of subsidy rates, the increase between
the two years is from Rs. 0.13 to Rs. 1.97 per litre. The 1996-97 per litre
subsidy rate on HSD is more than 97 times the corresponding figure in 1991-
92 (= Rs. 0.02). Diesel consumption has also increased by about 42 per cent
during 1991-92 to 1995-96. Together, these factors have contributed to a
massive increase in the magnitude of subsidy for HSD. Since diesel is used
in mass transport and agriculture, diesel prices could not be appropriately
revised upwards. It may be recalled that while announcing an across the
board increase in prices of petroleum products on July 2, 1996, the proposed
increase of 30 per cent in diesel prices was intended to bring the diesel
subsidies to zero. However, within a weak, a rollback on diesel prices had to
be announced cutting the proposed increase by 50 per cent, thus implying a
final increase of 15 per cent. As a result, the proportion of diesel subsidy in
total petroleum subsidy has increased from 6.55 per cent to 45.23 per cent
over just the two-year period from 1994-95 to 1996-97. With many car
manufacturers shifting to diesel driven engines, and rise in the number of
buses and goods vehicles, it is not clear as to how far the benefits of such
high level of subsidisation are accruing to the weaker sections of the society.
This situation is further complicated by private and captive diesel-based
generation of electricity. Also, the increase in consumption of diesel, based
on prices maintained by an extremely high subsidy rate cannot generate
efficiency-oriented substitutions in accordance with the appropriate market
signals, leading only to an overuse of the product.
SKO (kerosene) is another petroleum product that is heavily
subsidised. It is a deficit product and more than half of the requirements are
met by imports (54 per cent in 1995-96). A large proportion of total kerosene
consumption is distributed through the public distribution system. For
example, in 1994-95, 8.8 million tonnes of kerosene (total consumption in the
country was 8.96 million tonnes) was allocated to the States/Union territories
for the PDS by the Central government. The subsidy on kerosene is also
substantial. It was Rs. 3,740 crore in 1994-95, rising to Rs. 6,350 crore in
1996-97. Kerosene consumption through the PDS also shows a clear urban
bias. According to the 1991 Census, kerosene usage for cooking was 23.62
per cent in urban households and only 1.34 per cent in rural households.
Some of the burden of subsidy is met out of cross-subsidisation. The
overall logic of cross-subsidisation is to use petrol, and aviation turbine fuel
(used by the relatively rich) to subsidise the consumption of kerosene, cooking
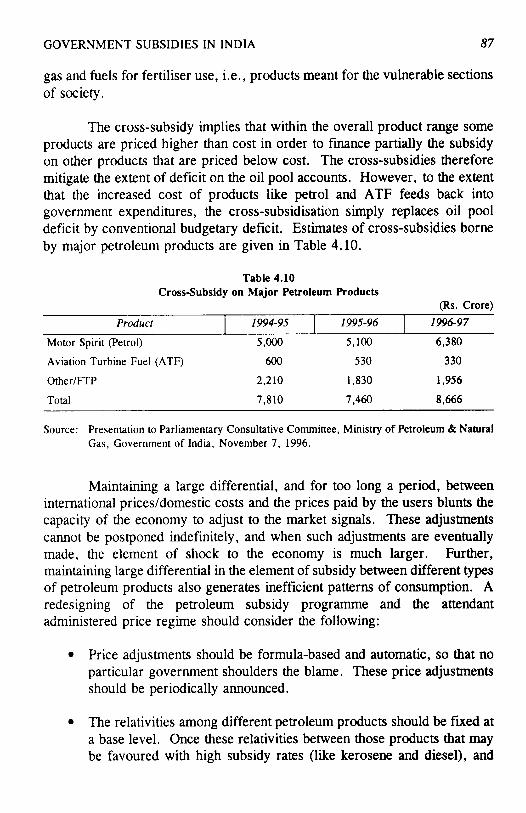
GOVERNMENT SUBSIDIES IN INDIA 87
gas and fuels for fertiliser use, i.e., products meant for the vulnerable sections
of society.
The cross-subsidy implies that within the overall product range some
products are priced higher than cost in order to finance partially the subsidy
on other products that are priced below cost. The cross-subsidies therefore
mitigate the extent of deficit on the oil pool accounts. However, to the extent
that the increased cost of products like petrol and ATF feeds back into
government expenditures, the cross-subsidisation simply replaces oil pool
deficit by conventional budgetary deficit. Estimates of cross-subsidies borne
by major petroleum products are given in Table 4.10.
Table 4.10
Cross-Subsidy on Major Petroleum Products
(Rs. Crore)
Product
Motor Spirit (Petrol)
Aviation Turbine Fuel (ATF)
Other/FTP
Total
1994-95
5,000
600
2,210
7,810
1995-96
5,100
530
1,830
7,460
1996-97
6,380
330
1,956
8,666
Source: Presentation to Parliamentary Consultative Committee, Ministry of Petroleum & Natural
Gas, Government of India, November 7, 1996.
Maintaining a large differential, and for too long a period, between
international prices/domestic costs and the prices paid by the users blunts the
capacity of the economy to adjust to the market signals. These adjustments
cannot be postponed indefinitely, and when such adjustments are eventually
made, the element of shock to the economy is much larger. Further,
maintaining large differential in the element of subsidy between different types
of petroleum products also generates inefficient patterns of consumption. A
redesigning of the petroleum subsidy programme and the attendant
administered price regime should consider the following:
• Price adjustments should be formula-based and automatic, so that no
particular government shoulders the blame. These price adjustments
should be periodically announced.
• The relativities among different petroleum products should be fixed at
a base level. Once these relativities between those products that may
be favoured with high subsidy rates (like kerosene and diesel), and
88 Chapter 4
those that are to be used for cross-subsidisation (like petrol, ATF,
etc.) are established, the adjustment in all prices should be automatic,
without the need for readjusting these relativities in each revision of
prices, which generates undesirable consumption patterns.
• The retention price scheme should only ensure a lower profit margin
(as against 12 per cent presently), and a significant portion of this
should be linked to explicit efficiency norms.