Embed Size (px)
Citation preview

7900 Callaghan Road San Antonio, TX 78229-23271-800-US-FUNDS (1-800-873-8637)[email protected]
Expense ratio as stated in the most recent prospectus. Performance data quoted above is historical. Past performance is no guarantee of future results. Results reflect the reinvestment of dividends and other earnings. For a portion of periods, the fund had expense limitations, without which returns would have been lower. Current performance may be higher or lower than the performance data quoted. The principal value and investment return of an investment will fluctuate so that your shares, when redeemed, may be worth more or less than their original cost. Performance does not include the effect of any direct fees described in the fund’s prospectus which, if applicable, would lower your total returns. Performance quoted for periods of one year or less is cumulative and not annualized. Obtain performance data current to the most recent month-end at www.usfunds.com or 1-800-US-FUNDS.
UG-FACT-GBTFX
All American Equity Fund (GBTFX)
Symbol: GBTFX CUSIP: 911476-60-4
Inception Date: 03/04/1981
Lipper Category: Multi-Cap Core
About the Fund
The All American Equity Fund invests in the growth of America by seeking “All American” companies with the best prospects for growth. Off ering the opportunity to invest right here at home, often in well-recognized names, the fund invests at least 80 percent of its assets in “All American” companies. The portfolio management team uses a variety of investment strategies to select companies identifi ed as having superior growth, profi tability and quality relative to companies in the same industry.
Fund Objective
The All American Equity Fund seeks long-term capital appreciation.
Fund Strategy
Under normal circumstances, the fund will invest at least 80 percent of its assets in securities defi ned as “All American.” These securities can include common stock, preferred stock, convertible securities, rights and warrants and depository receipts.
Portfolio Team
Frank Holmes, Chief Investment Officer Years of Experience: 30+Ralph Aldis, CFA Years of Experience: 30+
The chart illustrates the performance of a hypothetical $10,000 investment made in the fund during the depicted time frame. Figures include reinvestment of capital gains and dividends, but the performance does not include the effect of any direct fees described in the fund’s prospectus (e.g., short-term trading fees) which, ifapplicable, would lower your total returns.
$5,000
$10,000
$15,000
$20,000
All American Equity Fund (GBTFX)
$13,579
Growth of $10,000 from 6/30/2007 to 6/30/2017
Jun-07 Jun-09 Jun-11 Jun-13 Jun-15 Jun-17
Potential Risk/Reward
Low High
Risk Measures & Statistics (3-Year)
Sharpe Ratio -0.04
Alpha vs. Benchmark -8.58
Beta vs. Benchmark 0.87
R-squared vs. Benchmark 89.02
Standard Deviation 9.54
Benchmark Standard Deviation 10.35
June 2017 Fund Fact Sheet
ReturnsAverage Annual Expense Ratio
1 MonthYear to
Date 1-year 3-year 5-year 10-year
Since Inception (3/4/81) Gross
All American Equity Fund (as of 6/30/2017) 0.45% 3.27% 2.56% -0.52% 7.33% 3.11% 6.65% 1.76%
S&P 500 Stock Index (as of 6/30/2017) 0.62% 9.34% 17.90% 9.61% 14.63% 7.18% n/a n/a
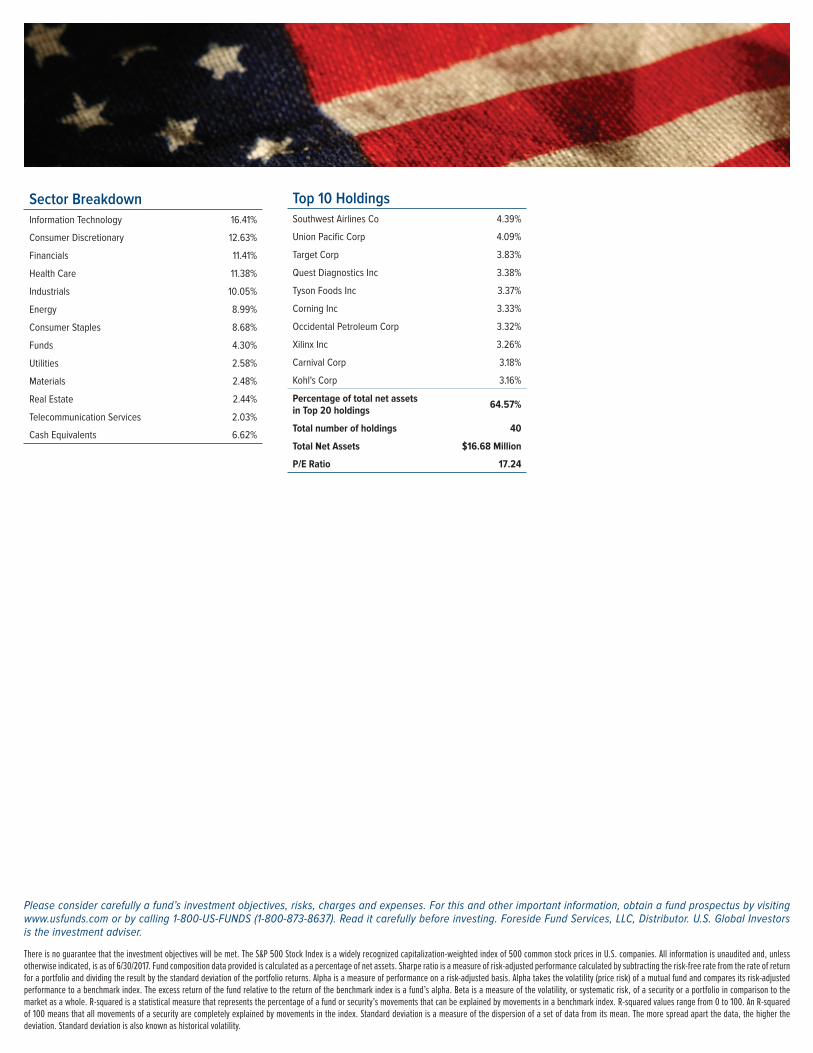
Sector Breakdown
Information Technology 16.41%
Consumer Discretionary 12.63%
Financials 11.41%
Health Care 11.38%
Industrials 10.05%
Energy 8.99%
Consumer Staples 8.68%
Funds 4.30%
Utilities 2.58%
Materials 2.48%
Real Estate 2.44%
Telecommunication Services 2.03%
Cash Equivalents 6.62%
Please consider carefully a fund’s investment objectives, risks, charges and expenses. For this and other important information, obtain a fund prospectus by visiting www.usfunds.com or by calling 1-800-US-FUNDS (1-800-873-8637). Read it carefully before investing. Foreside Fund Services, LLC, Distributor. U.S. Global Investors is the investment adviser.
There is no guarantee that the investment objectives will be met. The S&P 500 Stock Index is a widely recognized capitalization-weighted index of 500 common stock prices in U.S. companies. All information is unaudited and, unless otherwise indicated, is as of 6/30/2017. Fund composition data provided is calculated as a percentage of net assets. Sharpe ratio is a measure of risk-adjusted performance calculated by subtracting the risk-free rate from the rate of return for a portfolio and dividing the result by the standard deviation of the portfolio returns. Alpha is a measure of performance on a risk-adjusted basis. Alpha takes the volatility (price risk) of a mutual fund and compares its risk-adjusted performance to a benchmark index. The excess return of the fund relative to the return of the benchmark index is a fund’s alpha. Beta is a measure of the volatility, or systematic risk, of a security or a portfolio in comparison to the market as a whole. R-squared is a statistical measure that represents the percentage of a fund or security’s movements that can be explained by movements in a benchmark index. R-squared values range from 0 to 100. An R-squared of 100 means that all movements of a security are completely explained by movements in the index. Standard deviation is a measure of the dispersion of a set of data from its mean. The more spread apart the data, the higher the deviation. Standard deviation is also known as historical volatility.
Top 10 Holdings
Southwest Airlines Co 4.39%
Union Pacific Corp 4.09%
Target Corp 3.83%
Quest Diagnostics Inc 3.38%
Tyson Foods Inc 3.37%
Corning Inc 3.33%
Occidental Petroleum Corp 3.32%
Xilinx Inc 3.26%
Carnival Corp 3.18%
Kohl's Corp 3.16%
Percentage of total net assets
in Top 20 holdings64.57%
Total number of holdings 40
Total Net Assets $16.68 Million
P/E Ratio 17.24