Embed Size (px)
Citation preview
Alkali Leaching Properties of Waste Glass-Based Geopolymers
Corey Schlosser Dr. Mary Christiansen University of Minnesota Duluth Department of Civil Engineering
Overview
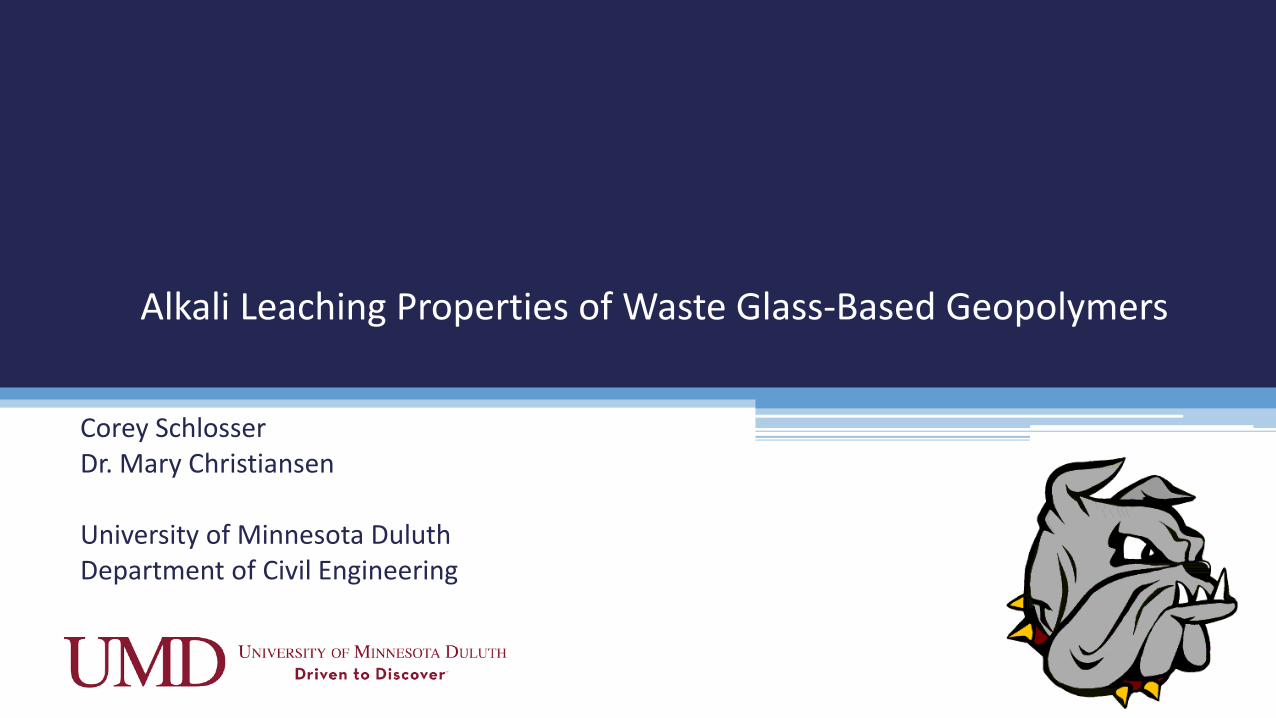
• Project Motivation • Goal and Research Questions • Geopolymer Background ▫ Glass Motivation
• Experimental Plan ▫ Materials ▫ Methods
• Results • Observations and Next Steps
Overview Slide 1

About Myself
• From Spring Valley, WI • Bachelor’s Degree from UMD in Civil
Engineering ▫ May 2016
• Master’s Degree from UMD in Civil Engineering ▫ December 2017?
• Presented research at American Concrete Institute (ACI) Convention in Detroit, MI
• Presenting at Transportation Research Board (TRB) Summer Workshop in Duluth, MN
• Will present research at ACI Convention in Anaheim, CA
Autobiography
[2]
Slide 2
Project Motivation
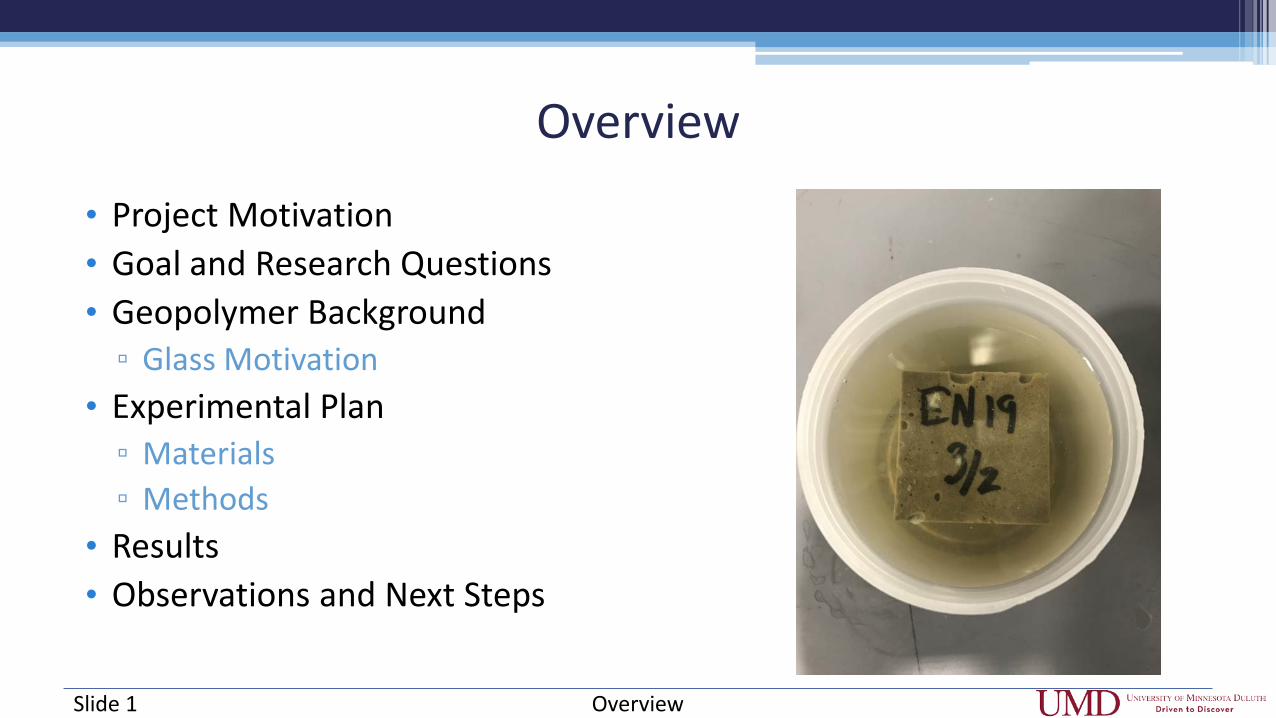
• Production of portland cement (PC) accounts for 6-7% of global anthropogenic carbon footprint
• Looks like and performs similar to PC concrete
• Aluminosilicate source is generally an industry by-product or waste material
• Can posses unique properties ▫ High heat resistance ▫ Sulfate resistance ▫ Chloride Resistance Project Motivation
[3]
Slide 3
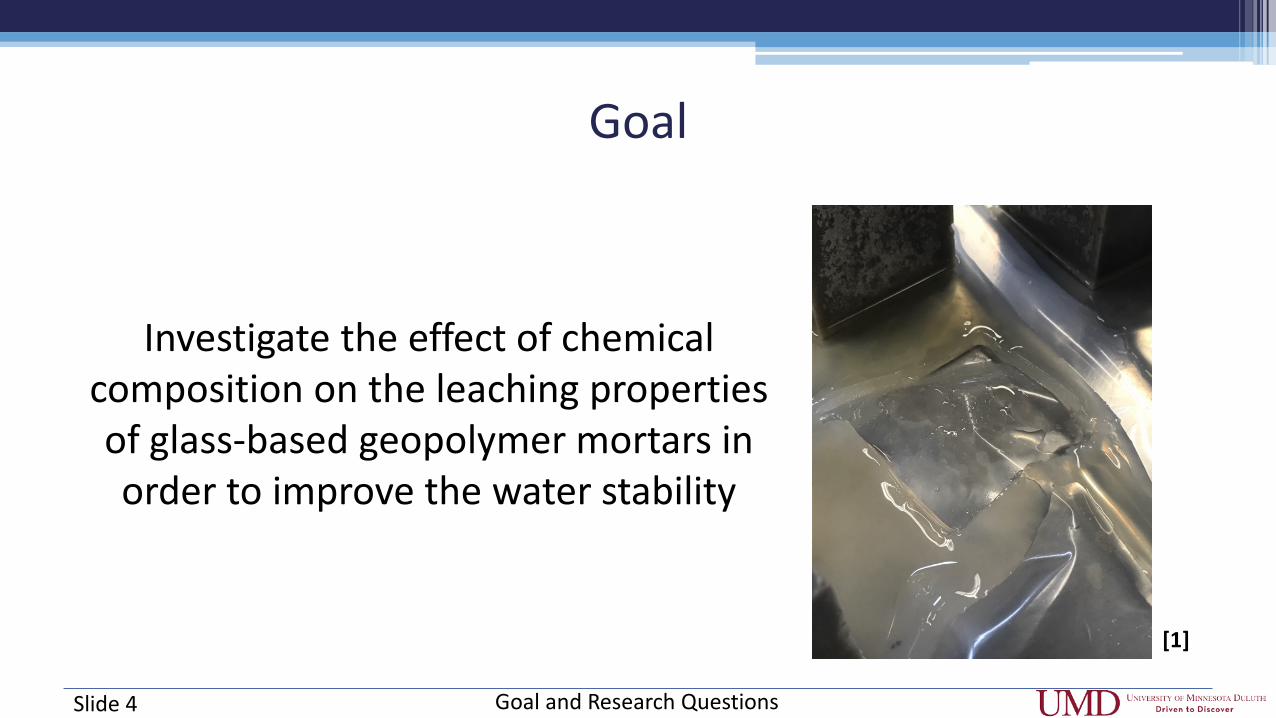
Goal
Investigate the effect of chemical composition on the leaching properties of glass-based geopolymer mortars in order to improve the water stability
Goal and Research Questions
[1]
Slide 4
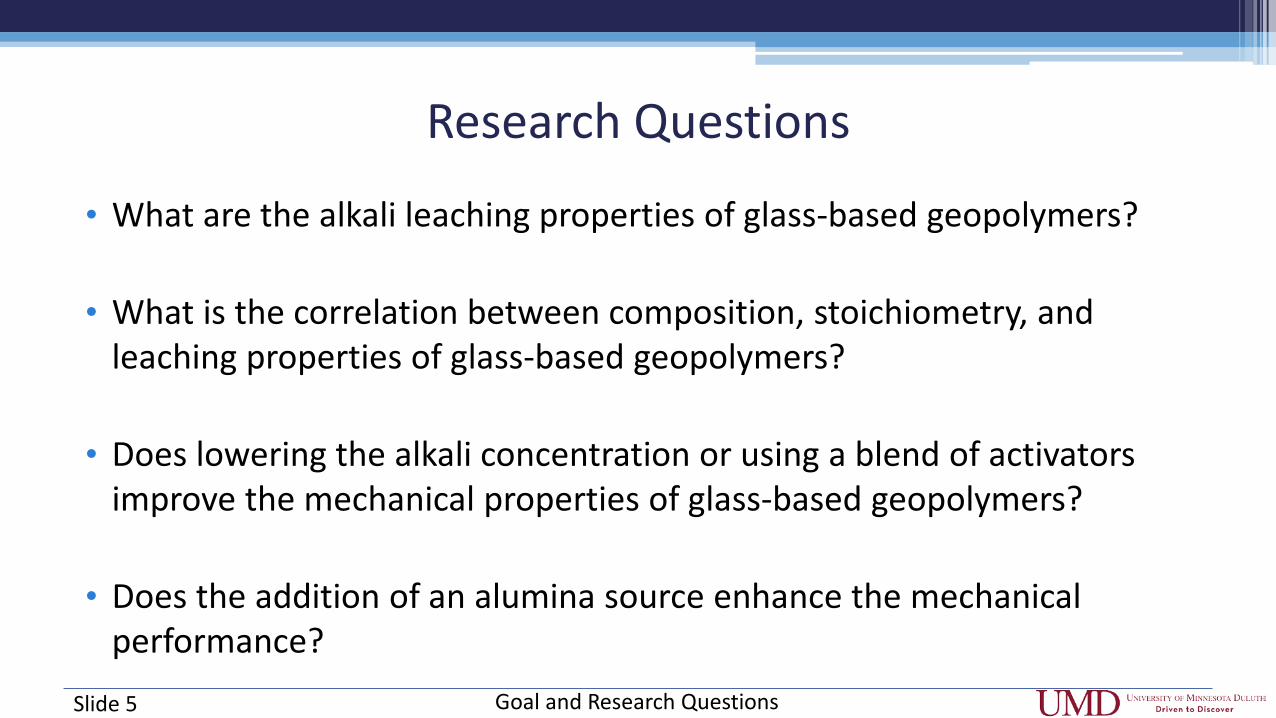
Research Questions
• What are the alkali leaching properties of glass-based geopolymers?
• What is the correlation between composition, stoichiometry, and leaching properties of glass-based geopolymers?
• Does lowering the alkali concentration or using a blend of activators improve the mechanical properties of glass-based geopolymers?
• Does the addition of an alumina source enhance the mechanical performance? Goal and Research Questions Slide 5
Geopolymers
An inorganic polymer binder created from the alkali activation of a finely divided aluminosilicate source
Geopolymer Background Slide 6
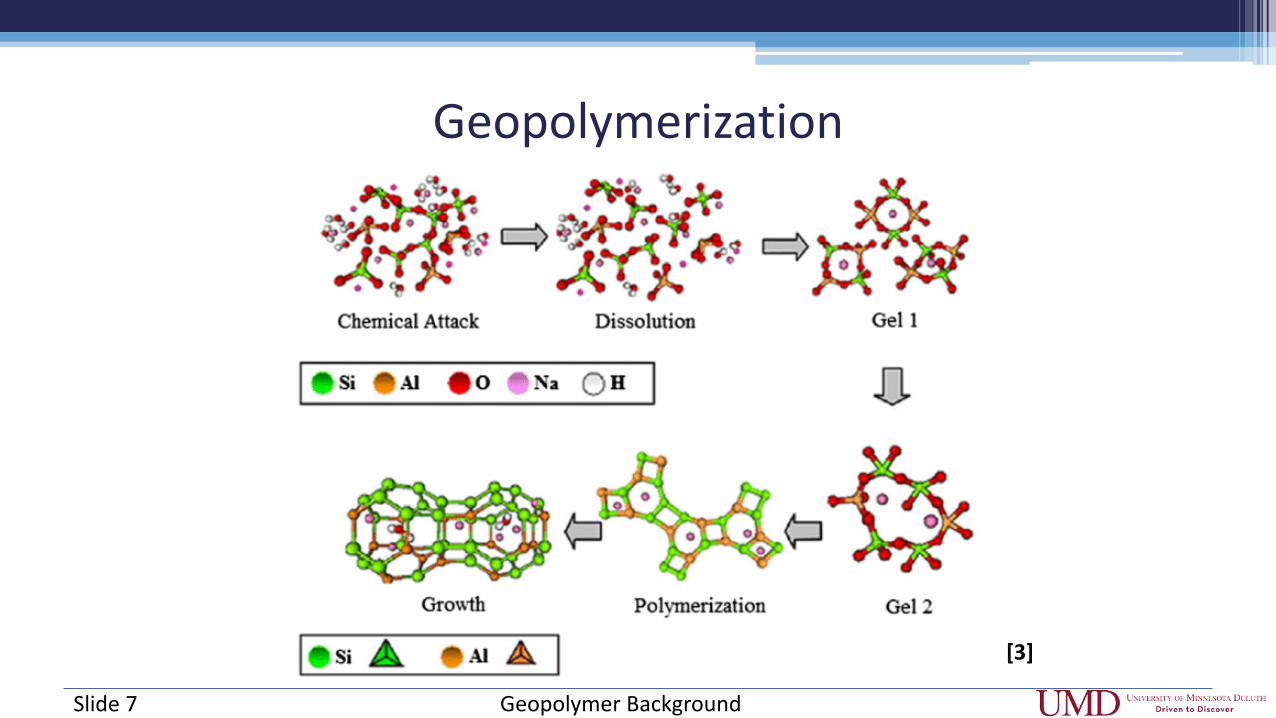
Geopolymerization
Geopolymer Background
[3]
Slide 7
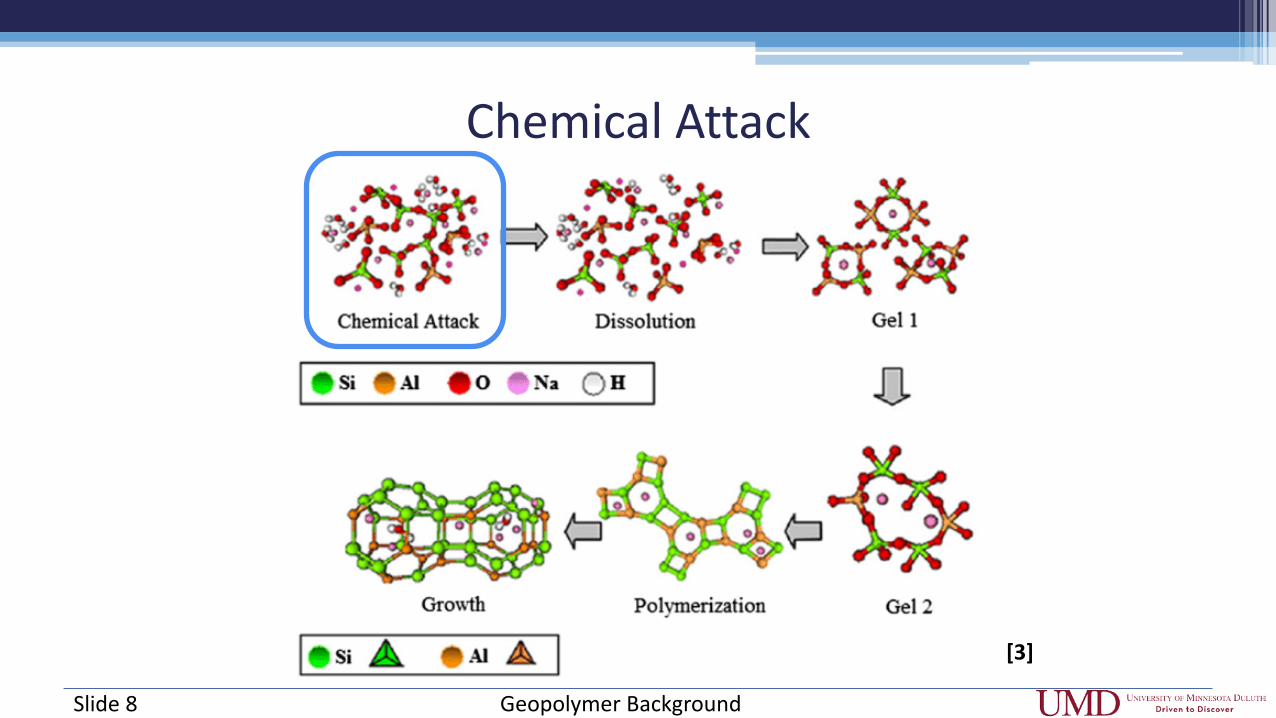
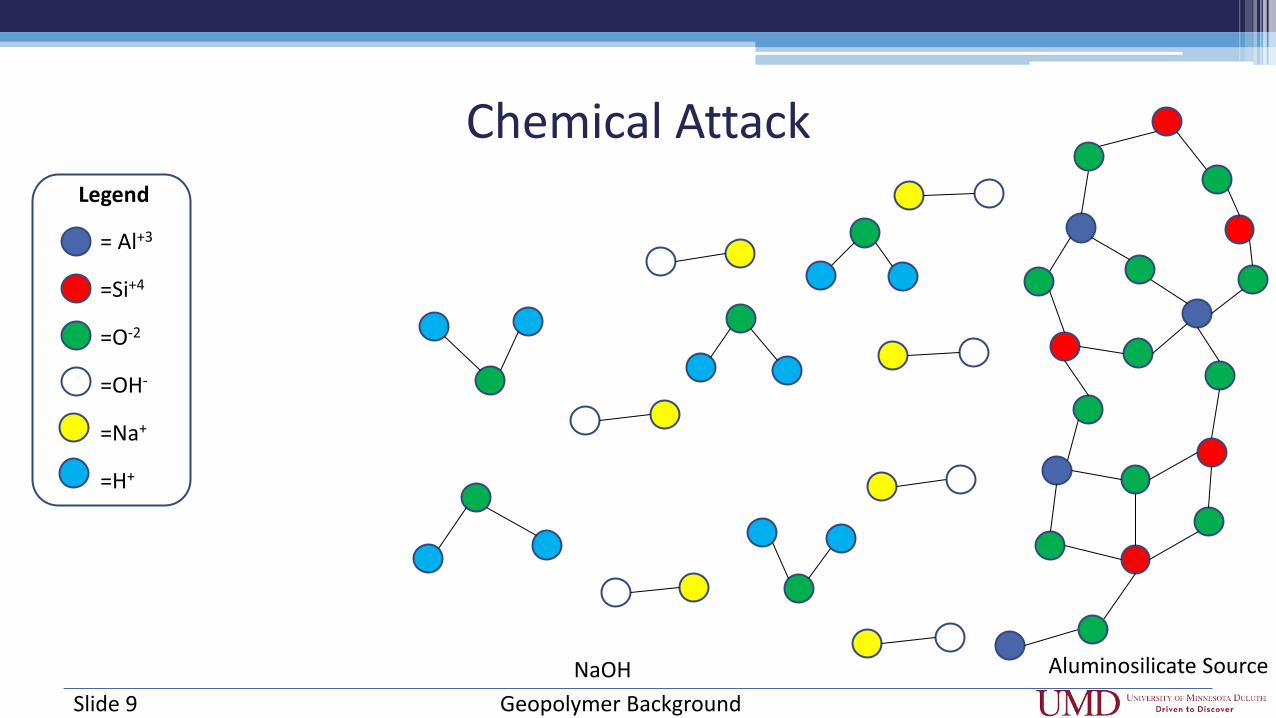
Chemical Attack
Geopolymer Background
[3]
Slide 8
Chemical Attack
Geopolymer Background
= Al+3
=Si+4
=O-2
=OH-
=Na+
=H+
Legend
Aluminosilicate Source NaOH Slide 9
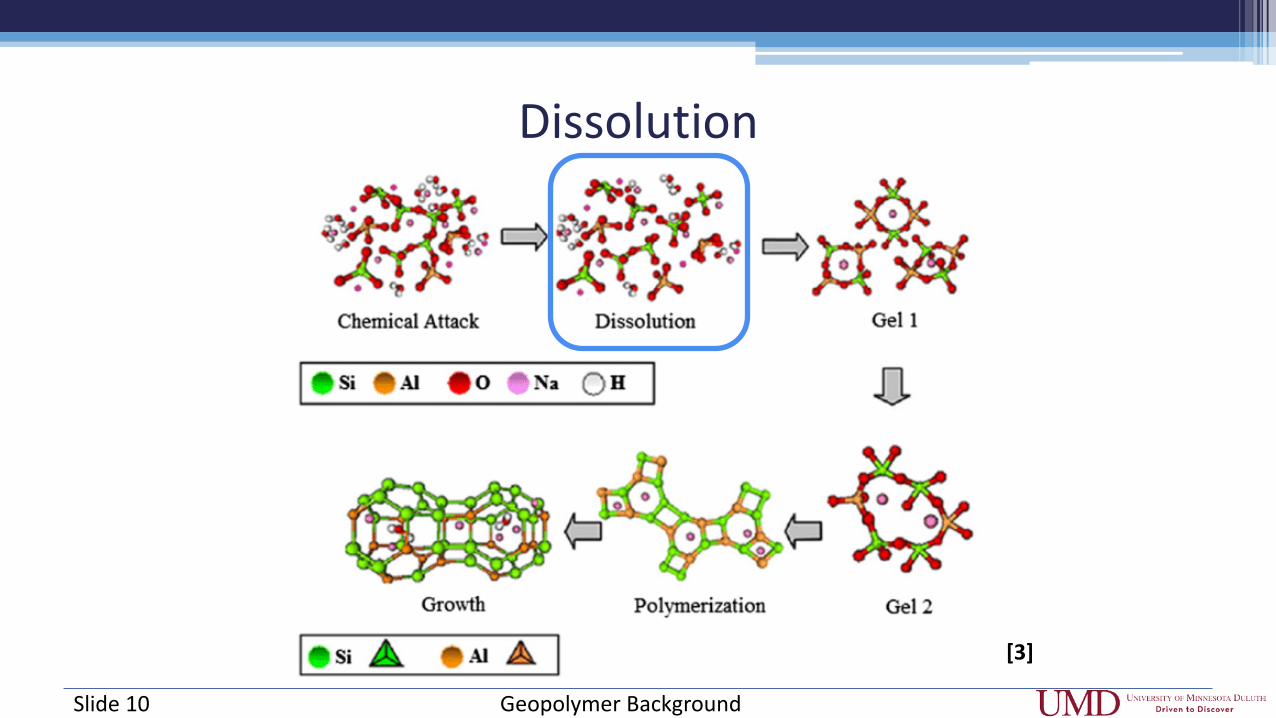
Dissolution
Geopolymer Background
[3]
Slide 10
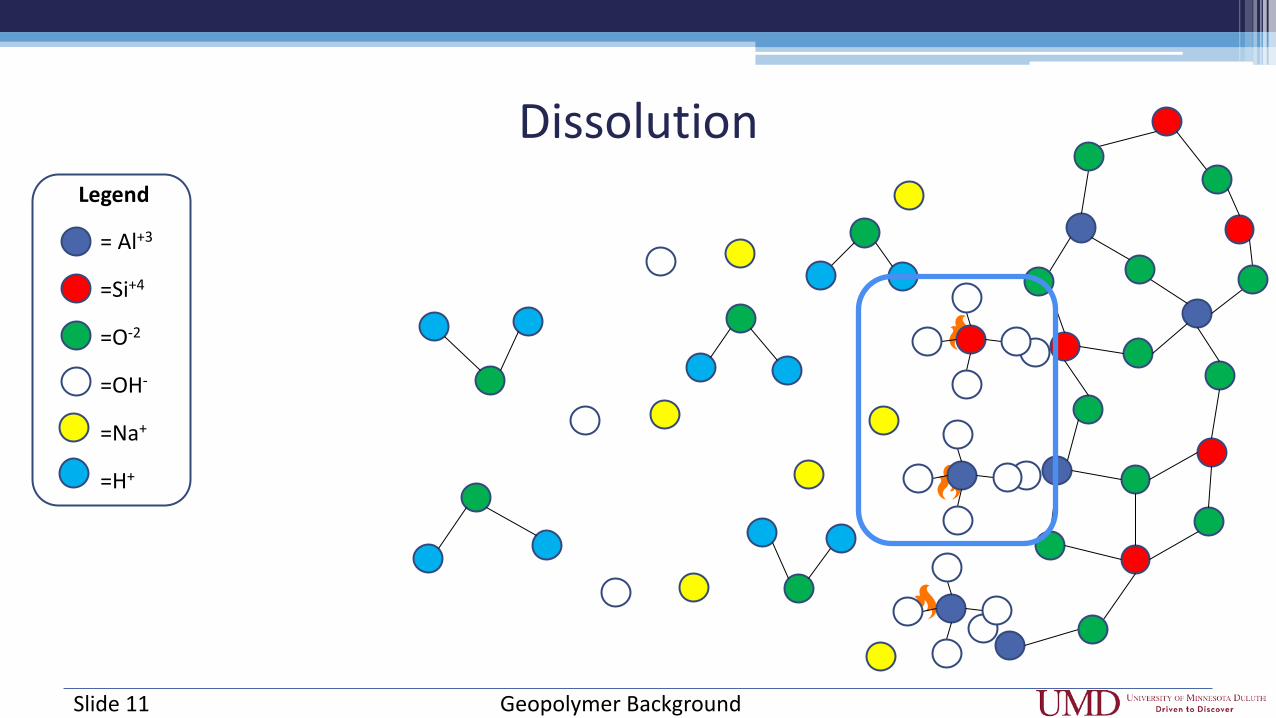
Dissolution
Geopolymer Background
= Al+3
=Si+4
=O-2
=OH-
=Na+
=H+
Legend
Slide 11
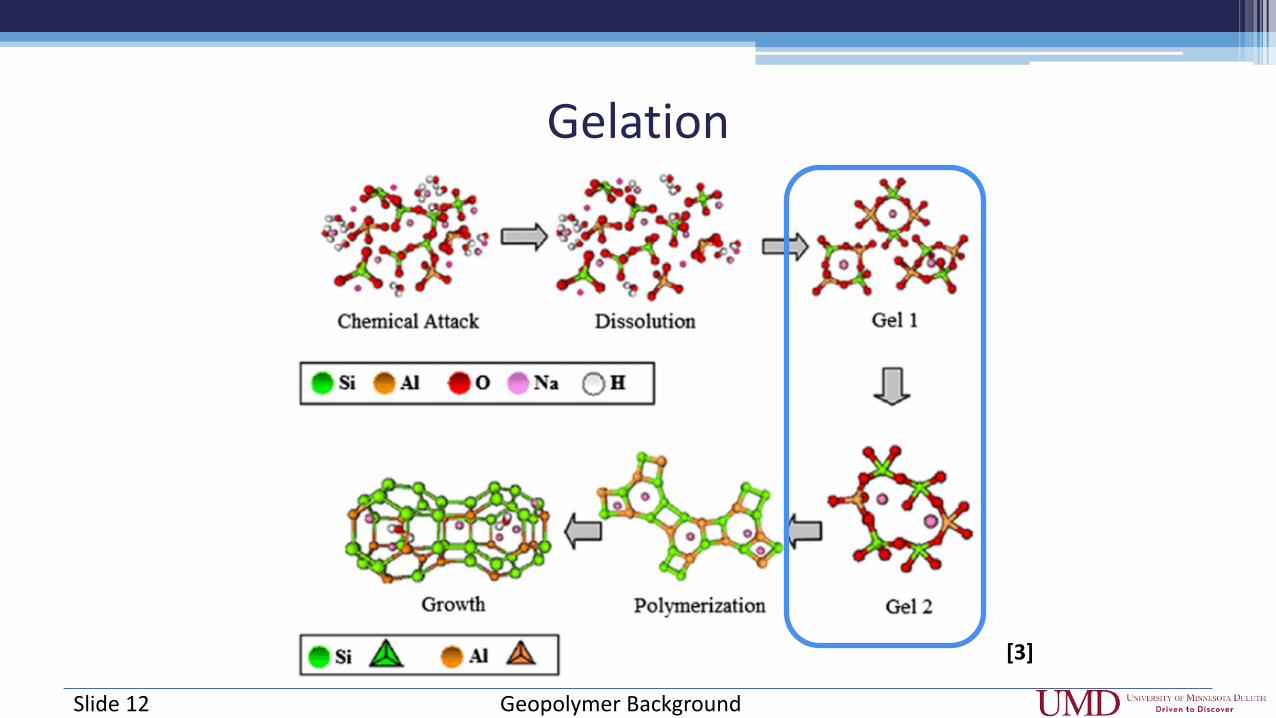
Gelation
Geopolymer Background
[3]
Slide 12
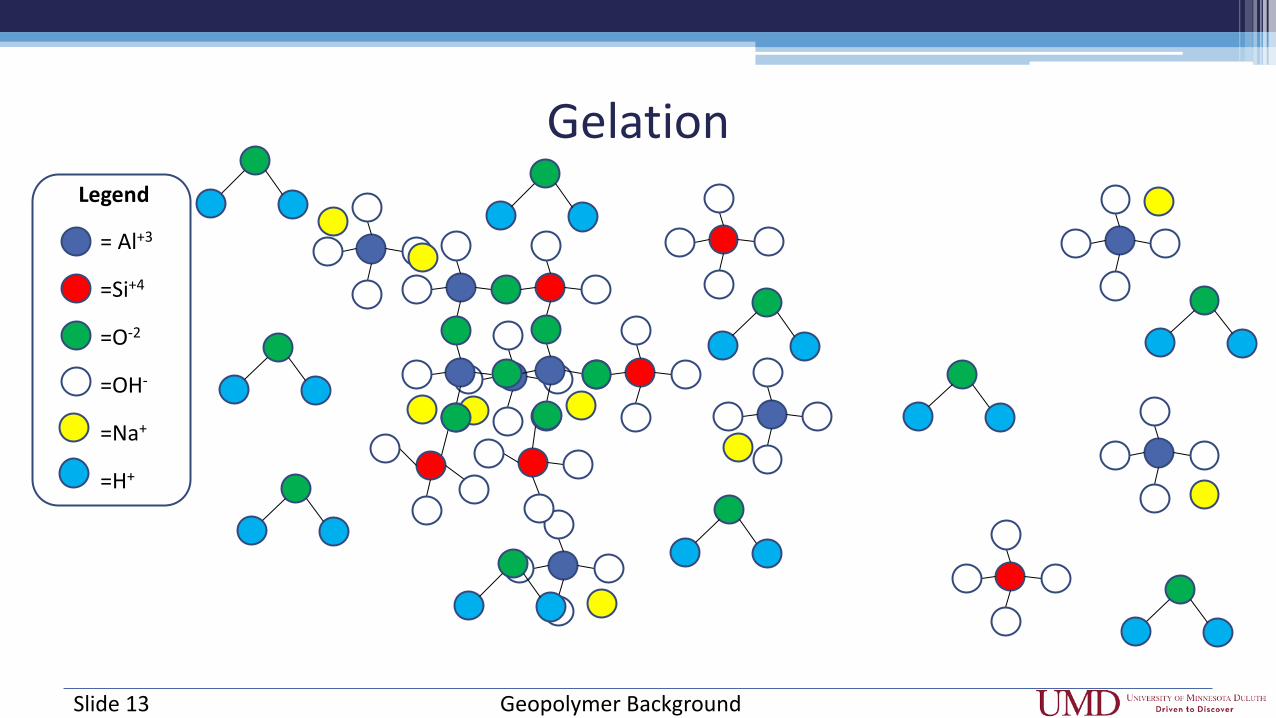
Gelation
Geopolymer Background
= Al+3
=Si+4
=O-2
=OH-
=Na+
=H+
Legend
Slide 13

Polymerization
Geopolymer Background
[3]
Slide 14
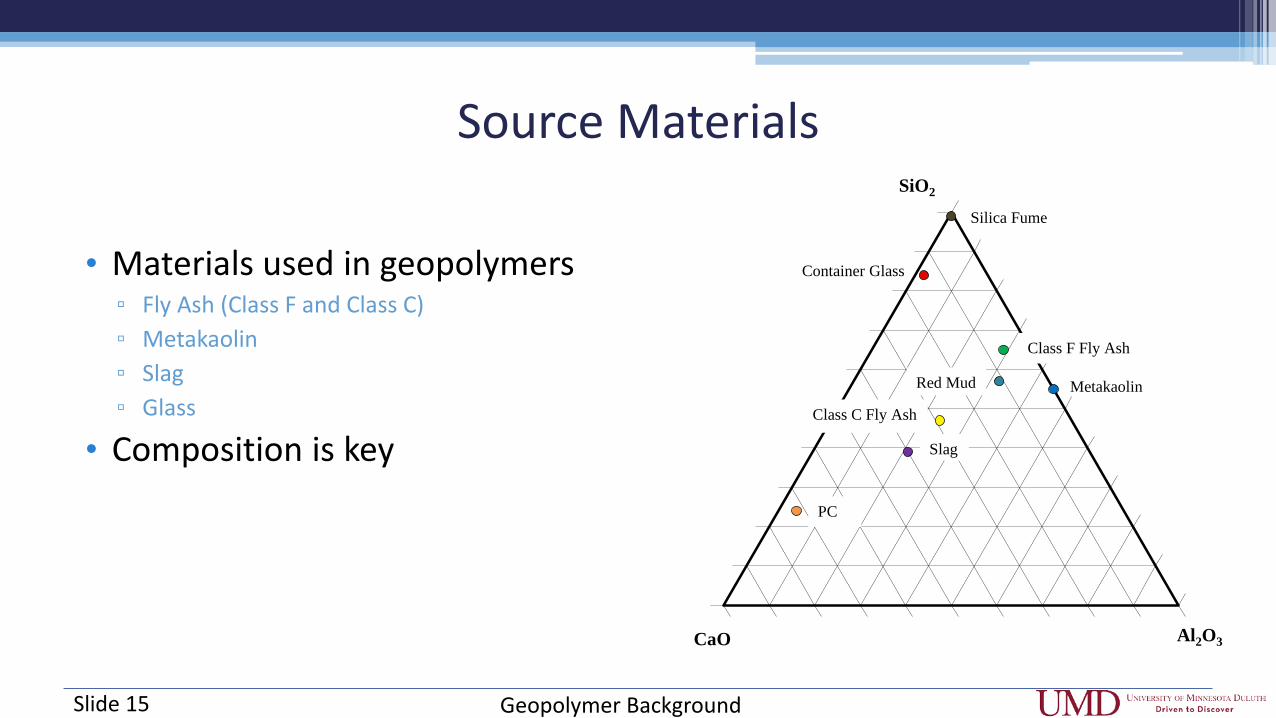
• Materials used in geopolymers ▫ Fly Ash (Class F and Class C) ▫ Metakaolin ▫ Slag ▫ Glass
• Composition is key
Source Materials
Geopolymer Background
SiO2
Al2O3 CaO
Silica Fume
Container Glass
PC
Slag
Class C Fly Ash
Red Mud Metakaolin
Class F Fly Ash
Slide 15

Activator
• Roles of activator: ▫ Provides a medium for reactions to occur ▫ High pH for rapid dissolution ▫ Alkali cation balances charge of Al monomer ▫ Silica in the solution can accelerate
geopolymerization
• Common Activators: ▫ Caustic alkalis (NaOH, Ca(OH)2, or KOH) ▫ Nonsilicate weak acid salts (Na2CO3) ▫ Silicates (Na2SiO3)
Geopolymer Background
[3]
[4]
Slide 16

Stoichiometry
Researcher(s) M+/Al Si/Al
Davidovits 1979 0.8-1.2 (~1.0) 3.5-4.5 (~4.0)
Rowles and O'Connor 2003 1.3 3.0
Duxson et al. 2005; Fernández-Jiménez et al. 2006 1.0 1.8-2.0
Duxson et al. 2007 1.0 1.0-5.0
Geopolymer Background
• M+ Either Na+ or K + • Al Al2O3
• Si SiO2
• M+/Al = 1 • Si/Al = 2-5
[5-9]
Slide 17
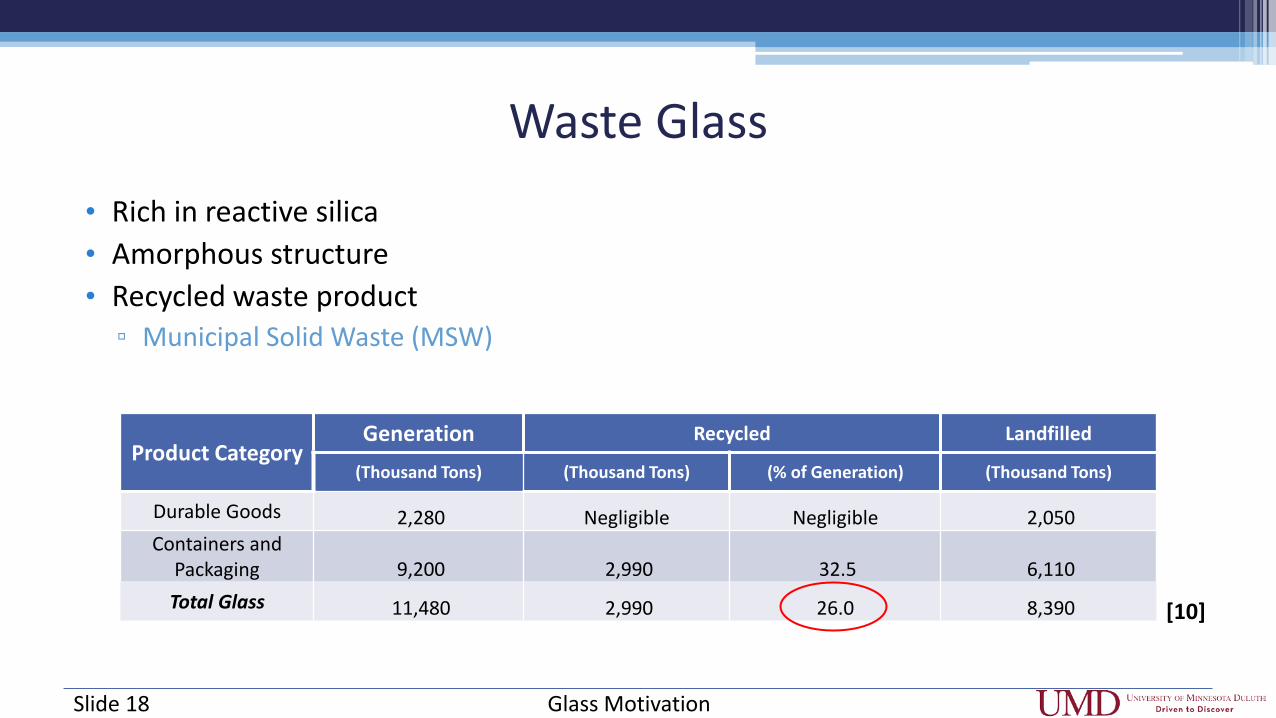
Waste Glass
Product Category Generation Recycled Landfilled
(Thousand Tons) (Thousand Tons) (% of Generation) (Thousand Tons)
Durable Goods 2,280 Negligible Negligible 2,050 Containers and
Packaging 9,200 2,990 32.5 6,110
Total Glass 11,480 2,990 26.0 8,390
Glass Motivation
• Rich in reactive silica • Amorphous structure • Recycled waste product ▫ Municipal Solid Waste (MSW)
[10]
Slide 18

Glass Types
• Soda-lime ▫ Container ▫ Plate
• Borosilicate • Glass Fibers • Television (Tube)
Glass Motivation
Container Plate Borosilicate Glass Fibers Television
SiO2 (% weight) 74.0 73.0 81.0 52.0-56.0 62.0
Al2O3 (% weight) 1.5 0.1 2.0 12.0-16.0 2.0
B2O3 (% weight) 0.0 0.0 13.0 5.0-10.0 0.0
CaO (% weight) 11.0 9.0 0.0 16.0-25.0 < 2.0
PbO (% weight) 0.0 0.0 0.0 0.0 0.0-2.0
Na2O (% weight) 13.0 14.0 4.0 0.0-2.0 7.0
K2O (% weight) 0.3 0.0 0.0 0.0 9.0
MgO (% weight) 0.2 4.0 0.0 0.0-5.0 < 1.0
Fe2O3 (% weight) 0.0 0.1 0.0 0.0-0.8 0.0 [11]
Slide 19

Experimental Plan
• Phase I – 16 mortar mixtures each using a different glass and activated with 10M NaOH were designed to investigate the effects of stoichiometry on the leaching and mechanical properties.
• Phase II – Stoichiometric design-based mixtures using glass in combination with other varying aluminosilicate sources to provide supplementary Al and various chemical activators were designed to apply the concepts learned in Phase I.
Experimental Plan Slide 20
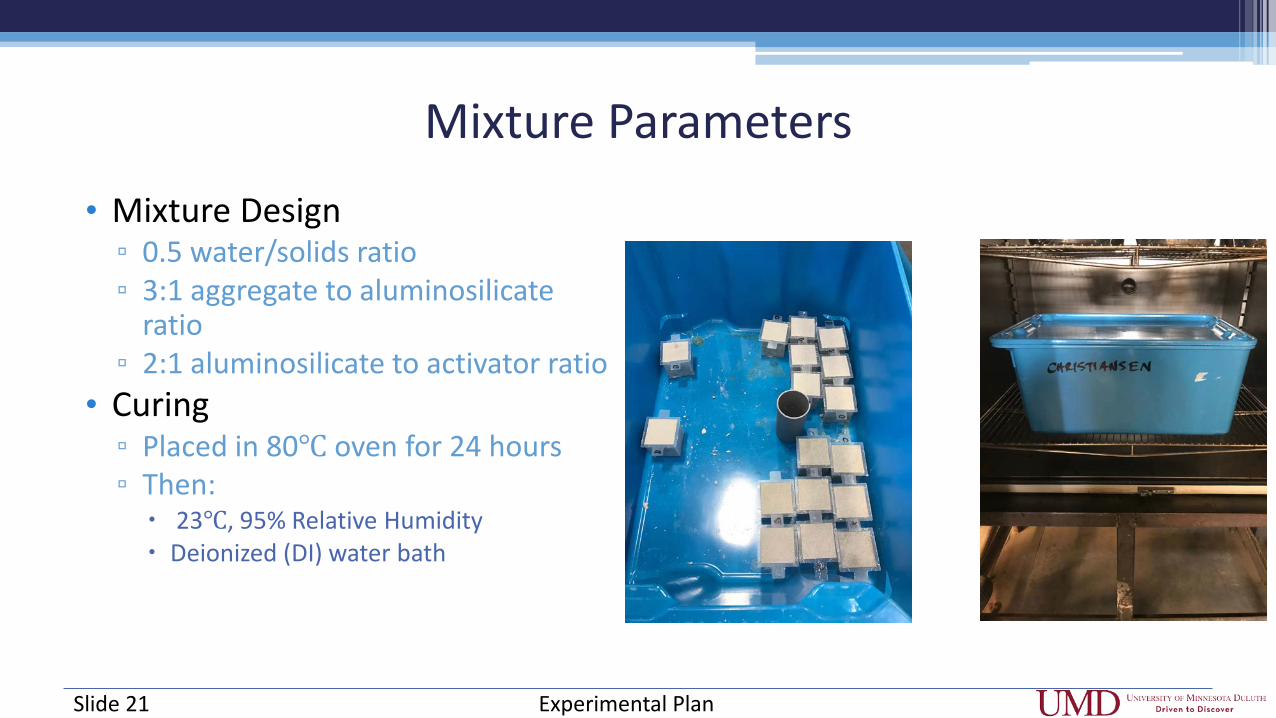
Mixture Parameters
• Mixture Design ▫ 0.5 water/solids ratio ▫ 3:1 aggregate to aluminosilicate
ratio ▫ 2:1 aluminosilicate to activator ratio
• Curing ▫ Placed in 80℃ oven for 24 hours ▫ Then: 23℃, 95% Relative Humidity Deionized (DI) water bath
Experimental Plan Slide 21
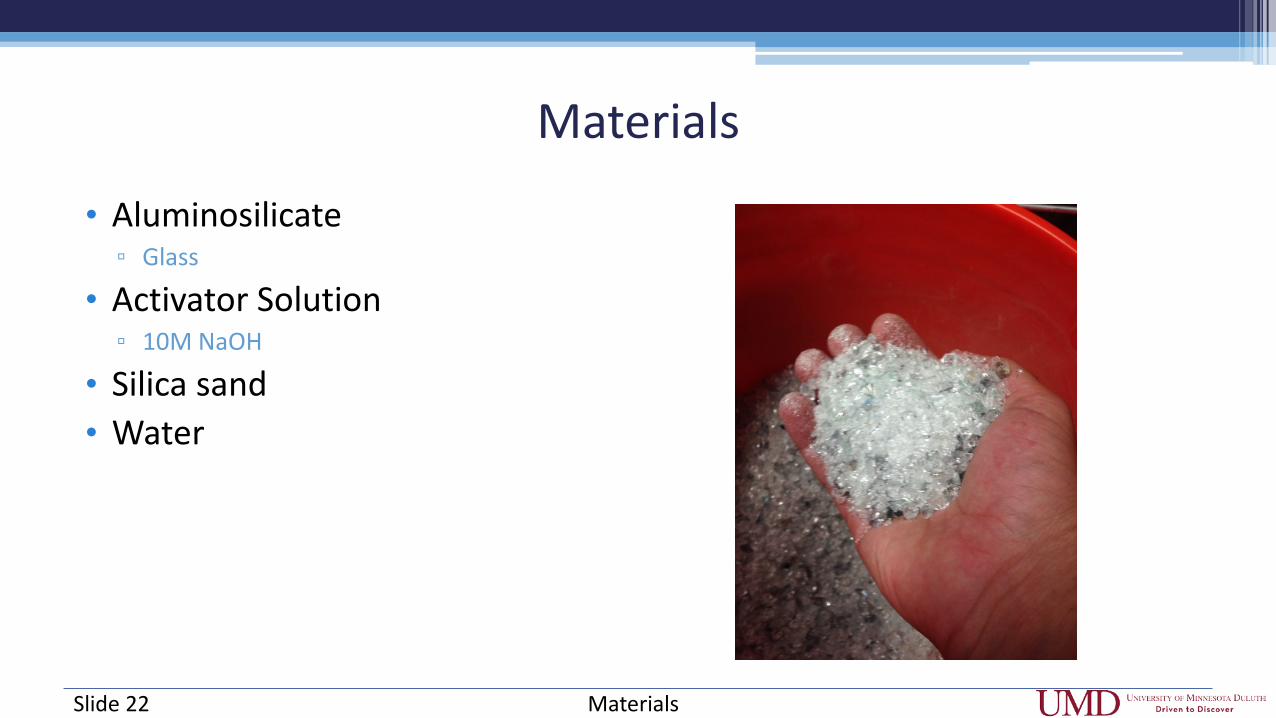
Materials
• Aluminosilicate ▫ Glass
• Activator Solution ▫ 10M NaOH
• Silica sand • Water
Materials Slide 22
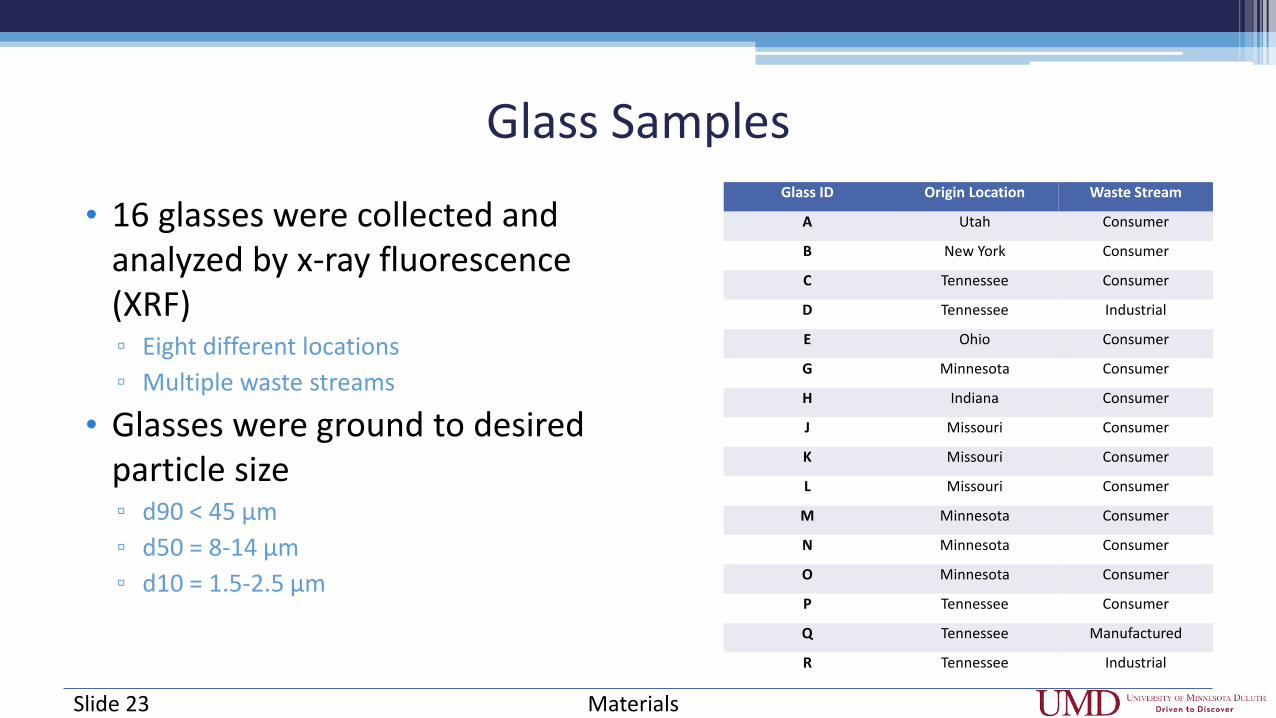
Glass Samples
• 16 glasses were collected and analyzed by x-ray fluorescence (XRF) ▫ Eight different locations ▫ Multiple waste streams
• Glasses were ground to desired particle size ▫ d90 < 45 μm ▫ d50 = 8-14 μm ▫ d10 = 1.5-2.5 μm
Materials
Glass ID Origin Location Waste Stream
A Utah Consumer
B New York Consumer
C Tennessee Consumer
D Tennessee Industrial
E Ohio Consumer
G Minnesota Consumer
H Indiana Consumer
J Missouri Consumer
K Missouri Consumer
L Missouri Consumer
M Minnesota Consumer
N Minnesota Consumer
O Minnesota Consumer
P Tennessee Consumer
Q Tennessee Manufactured
R Tennessee Industrial
Slide 23
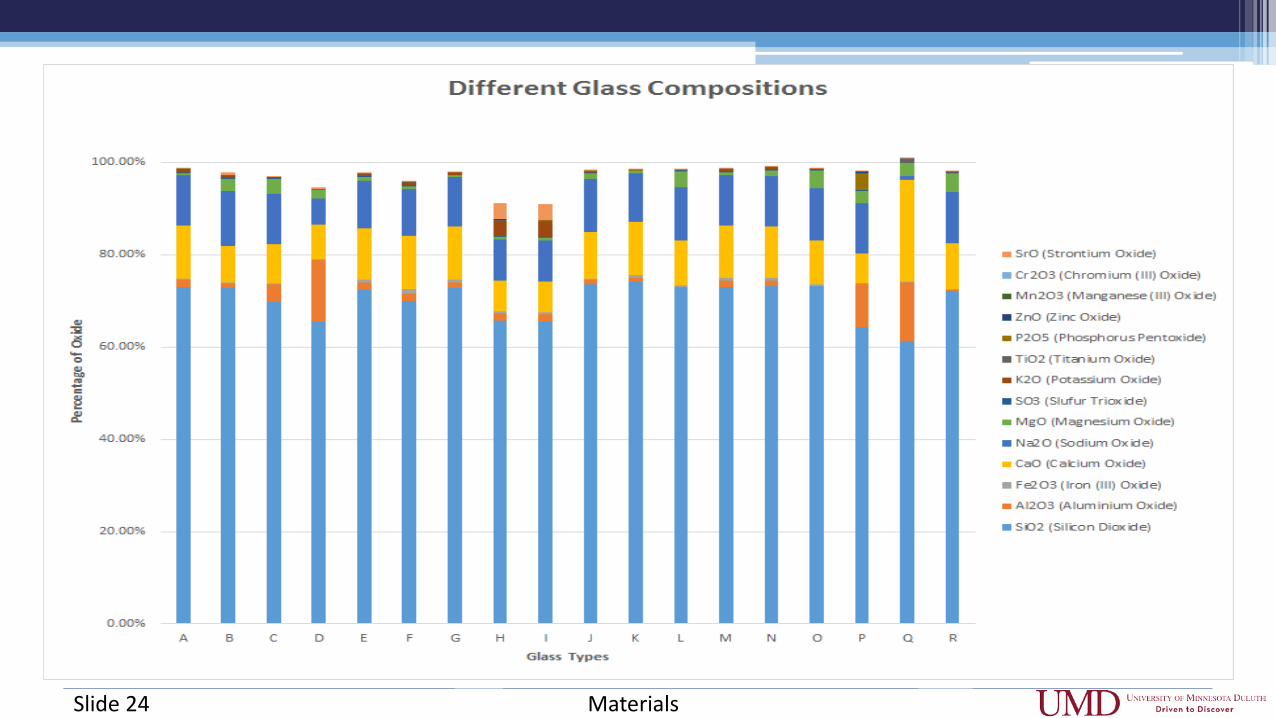
Glass Composition
Materials
0%
10%
20%
30%
40%
50%
60%
70%
80%
90%
100%
1 2 3 4 5 6 7 8 9 10 11 12 13 14 15 16
% W
eigh
t
Glass
LOI H20 SiO2 Al2O3 Fe2O3 CaO Na2O MgO SO3 K2O TiO2 P2O5 ZnO Mn2O3 Cr2O3 SrOH2O LOI SiO2 Al2O3 Fe2O3 CaO Na2O MgO SO3 K2O TiO2 P2O5 ZnO Mn2O3 Cr2O3 SrO
A B C D E G H J K L M N O P Q R
Slide 24
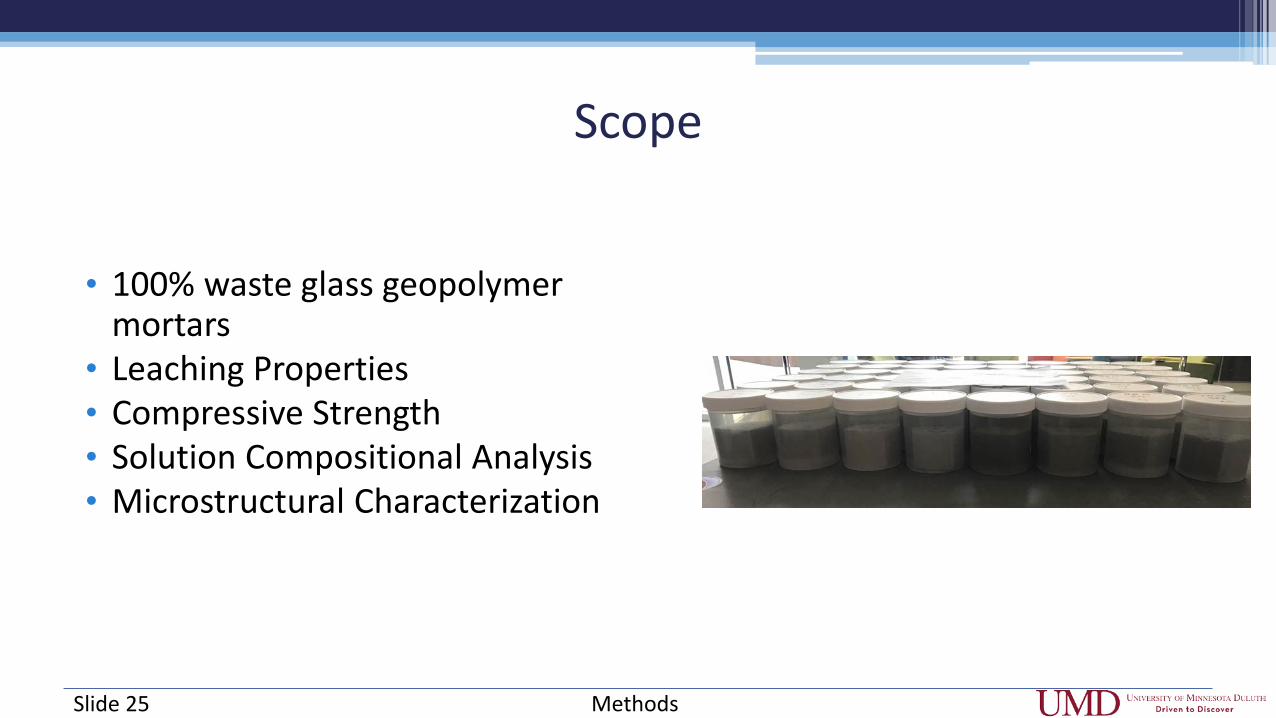
Scope
• 100% waste glass geopolymer mortars
• Leaching Properties • Compressive Strength • Solution Compositional Analysis • Microstructural Characterization
Slide 25 Methods

Leaching Properties
• Containers filled with 250 mL DI water
• pH • Conductivity • Early data was collected (1, 3,
and 7 days) and then every week until 56 days
• Solution samples collected (7, 28, and 56 days)
Methods Slide 26
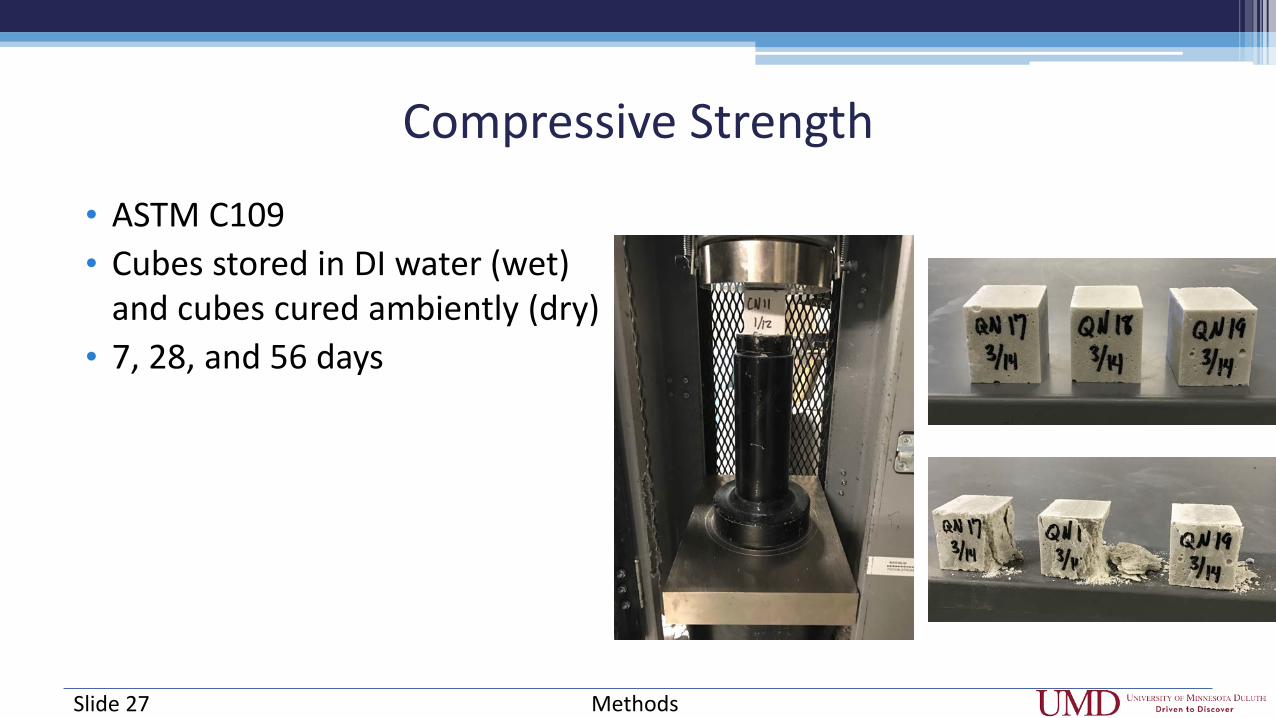
Compressive Strength
• ASTM C109 • Cubes stored in DI water (wet)
and cubes cured ambiently (dry) • 7, 28, and 56 days
Methods Slide 27
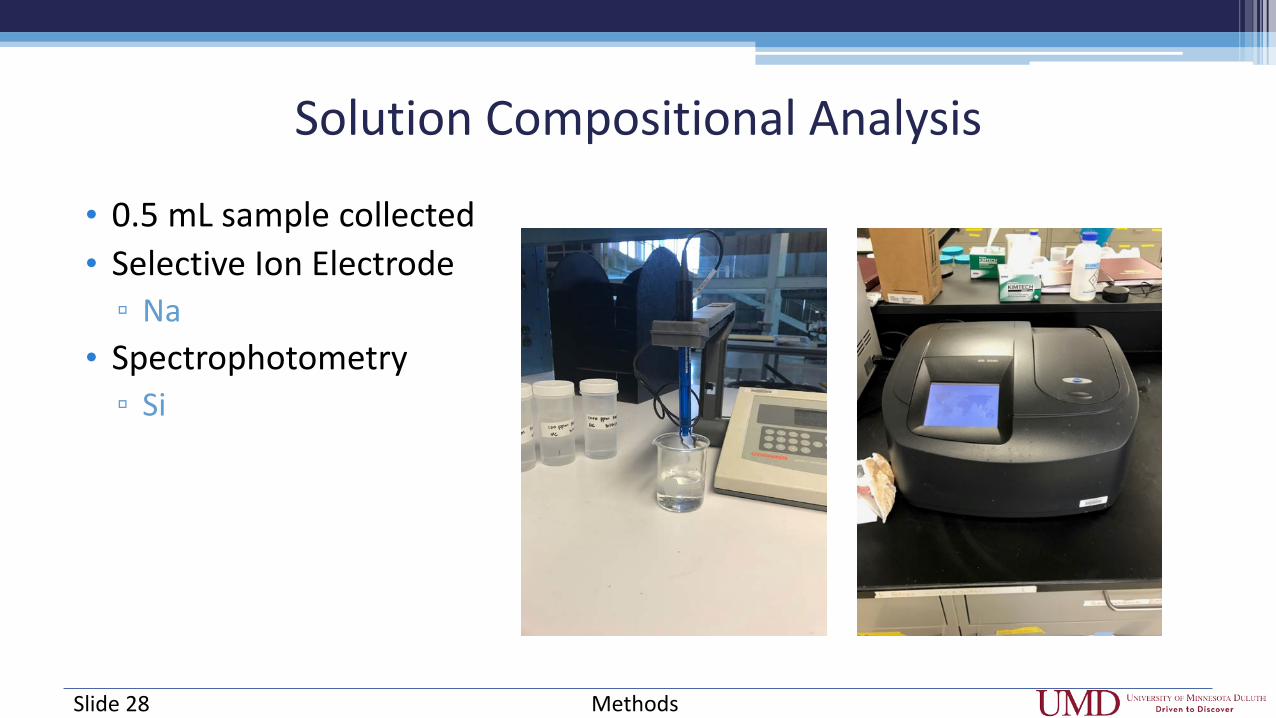
Solution Compositional Analysis
• 0.5 mL sample collected • Selective Ion Electrode ▫ Na
• Spectrophotometry ▫ Si
Methods Slide 28

Microstructural Characterization
Methods
• Scanning electron microscope (SEM) ▫ Secondary electron imaging (SEI) ▫ Energy dispersive X-ray
spectroscopy (EDS)
Slide 29
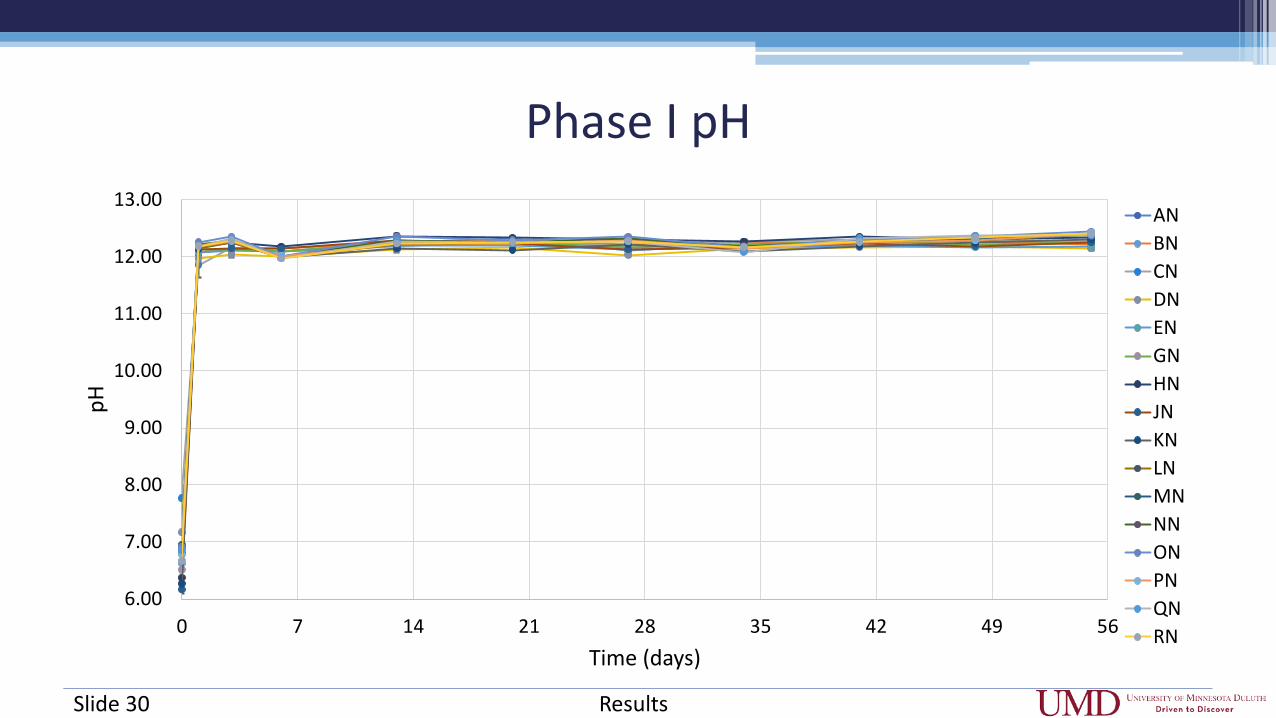
Phase I pH
Results
6.00
7.00
8.00
9.00
10.00
11.00
12.00
13.00
0 7 14 21 28 35 42 49 56
pH
Time (days)
ANBNCNDNENGNHNJNKNLNMNNNONPNQNRN
Slide 30

Phase I Conductivity
Results
0.0E+0
2.0E+4
4.0E+4
6.0E+4
8.0E+4
1.0E+5
1.2E+5
1.4E+5
1.6E+5
1.8E+5
0 7 14 21 28 35 42 49 56
Cond
uctiv
ity (µ
S)
Time (days)
ANBNCNDNENGNHNJNKNLNMNNNONPNQNRN
Slide 31

Phase I Compressive Strength
Results
0
500
1000
1500
2000
2500
3000
3500
4000
7 28 56
Com
pres
sive
Str
engt
h (p
si)
Time (days)
JN
Dry
Wet
Na/Al = 32.6
0
500
1000
1500
2000
2500
3000
3500
4000
7 28 56
Com
pres
sive
Str
engt
h (p
si)
Time (days)
PN
Dry
Wet
Na/Al = 3.8
Slide 32
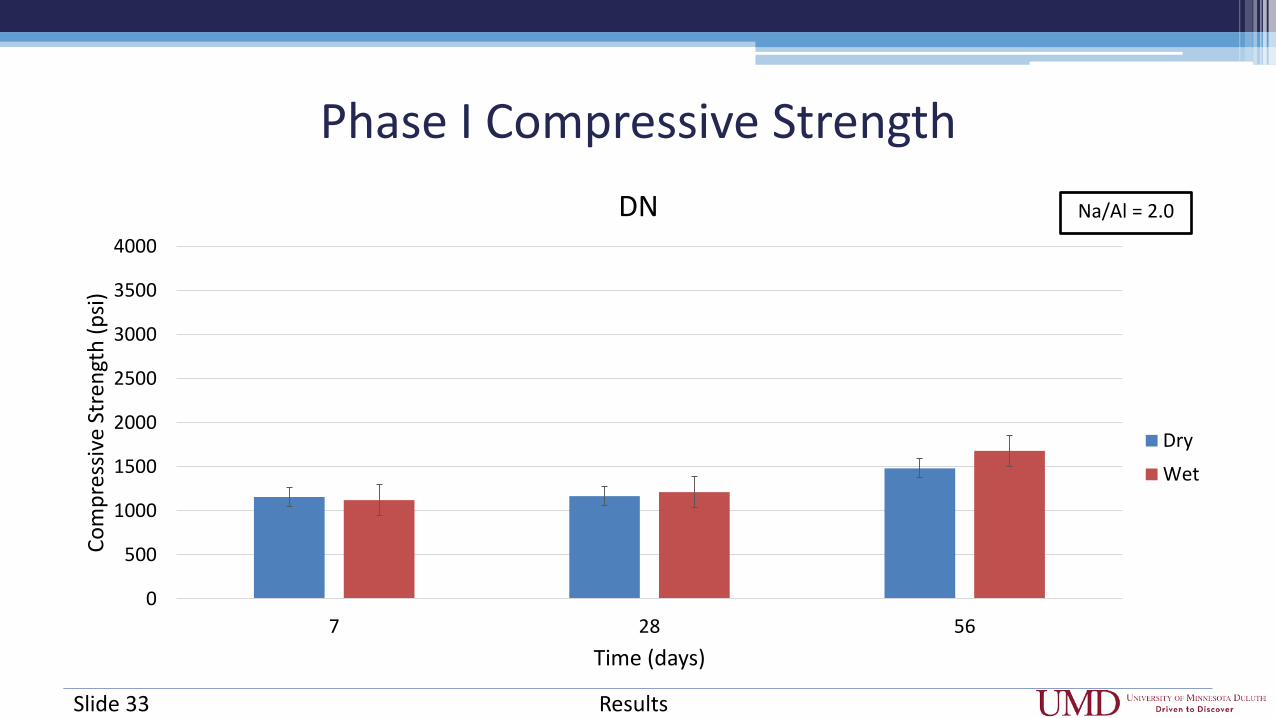
Phase I Compressive Strength
Results
0
500
1000
1500
2000
2500
3000
3500
4000
7 28 56
Com
pres
sive
Str
engt
h (p
si)
Time (days)
DN
Dry
Wet
Na/Al = 2.0
Slide 33
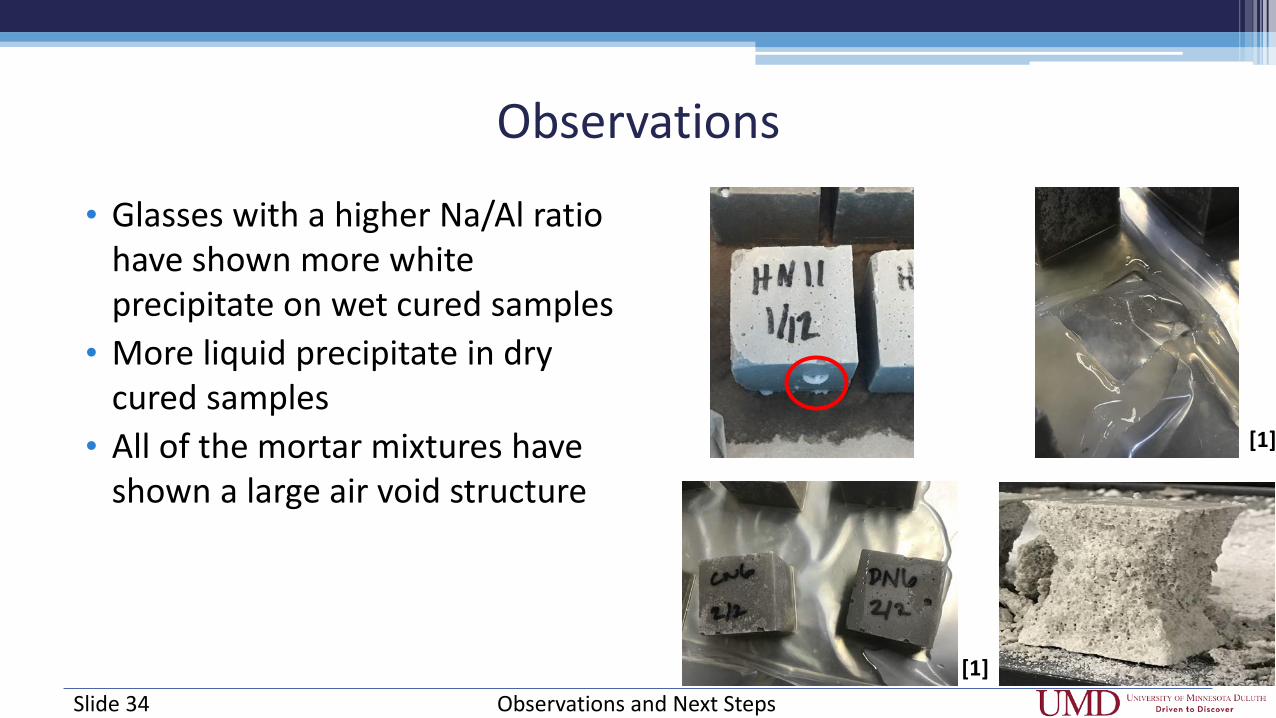
Observations
• Glasses with a higher Na/Al ratio have shown more white precipitate on wet cured samples
• More liquid precipitate in dry cured samples
• All of the mortar mixtures have shown a large air void structure
Observations and Next Steps
[1]
[1]
Slide 34
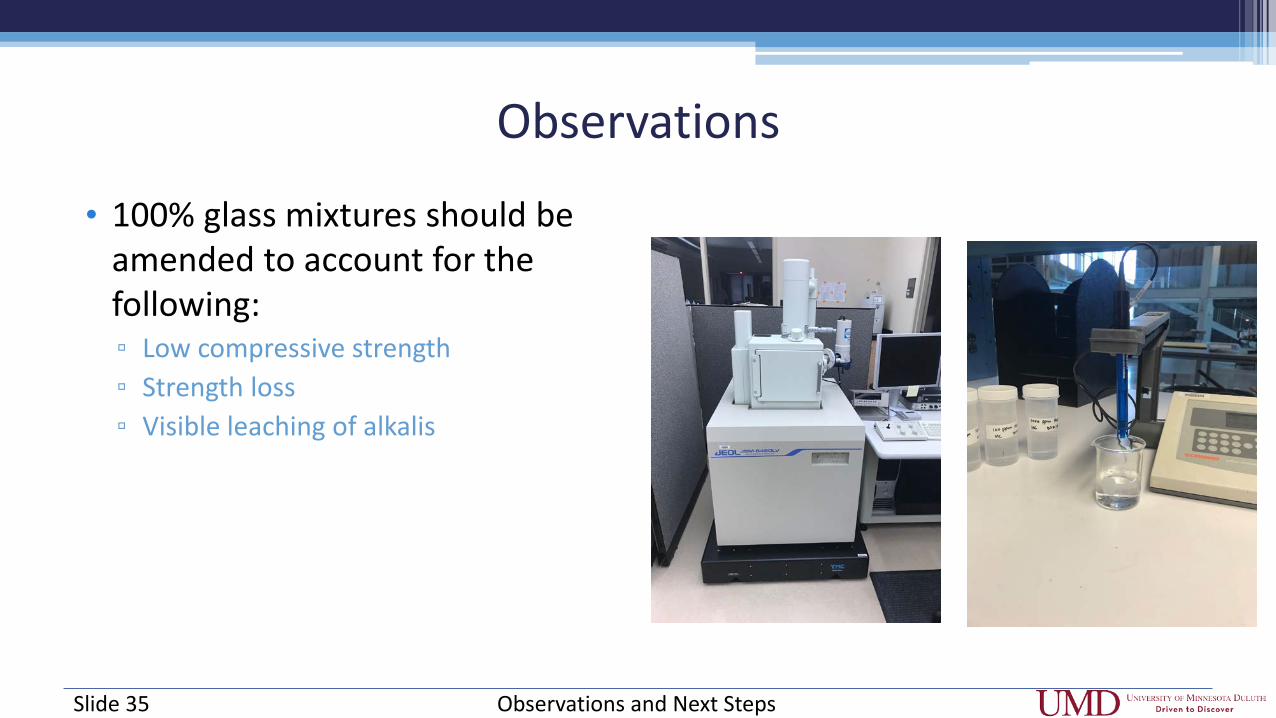
Observations
• 100% glass mixtures should be amended to account for the following: ▫ Low compressive strength ▫ Strength loss ▫ Visible leaching of alkalis
Slide 35 Observations and Next Steps
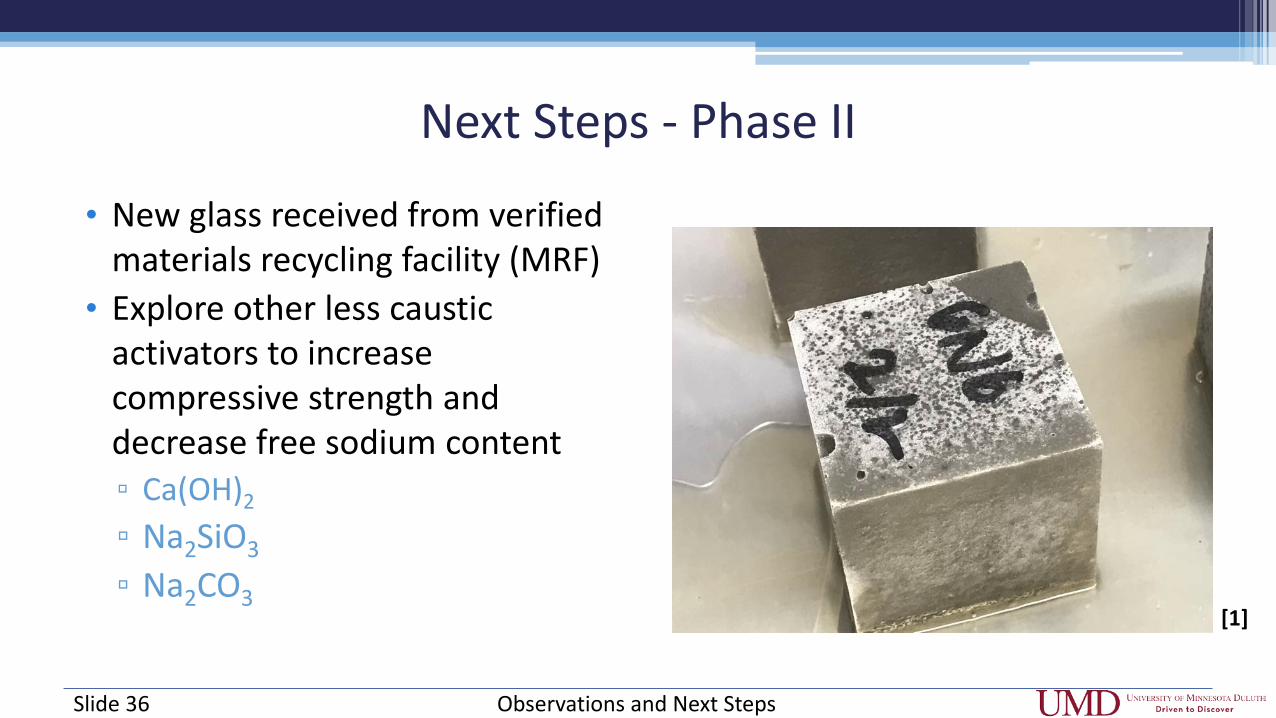
Next Steps - Phase II
• New glass received from verified materials recycling facility (MRF)
• Explore other less caustic activators to increase compressive strength and decrease free sodium content ▫ Ca(OH)2
▫ Na2SiO3
▫ Na2CO3
Slide 36
[1]
Observations and Next Steps

Next Steps - Phase II
• Mix in additional alumina or calcium sources to obtain a Na/Al ~ 1-2 ▫ Metakaolin ▫ Class F fly ash
Slide 37 Observations and Next Steps

Acknowledgments
• University of Minnesota Duluth • National Resource Research
Institute - Coleraine, MN • American Engineering Testing –
St. Paul, MN • UMD Concrete Research Group • Dr. Chanlan Chun • Dr. Andrea Schokker • Dr. Mary Christiansen
Thank You! Slide 38
[13]
[12]
Sources 1. Larson, Scot. (2017). The Effect of Ground Glass Compositional Variability on Geopolymer Strength Performance. University of Minnesota Duluth.
Master of Science in Civil Engineering. 2. [State of Wisconsin and Minnesota]. Retrieved July 11, 2017 from http://www.clubmotorseattle.com/map-of-wisconsin-and-minnesota.html 3. Shi, C., Jiménez, A. F., & Palomo, A. (2011). New cements for the 21st century: The pursuit of an alternative to portland cement. Cement and Concrete
Research, 41(7), 750-763. doi:2443/10.1016/j.cemconres.2011.03.016 4. [Sodium Hydroxide Flakes]. Retrieved July 9,2017 from http://www.powderpackchem.com/sodium-hydroxide-flakes-2205817.html 5. Davidovits, J. (1979). Polymere mineral. F. Patent. France. 6. Rowles, M., & O'Connor, B. (2003). Chemical optimization of the compressive strength of aluminosilicate geopolymers synthesized by sodium silicate
activation of metakaolinite. Journal of Materials Chemistry, 13(5), 1161-1165. doi:10.1039/b212629j 7. Duxson, P., Mallicoat, S. W., Lukey, G. C., Kriven, W. M., & van Deventer, Jannie S J. (2005). Microstructural characterisation of metakaolin-based
geopolymers. Paper presented at the 106th Annual Meeting of the American Ceramic Society, Retrieved from http://onlinelibrary.wiley.com/doi/10.1002/9781118408353.ch7/summary
8. Fernández-Jiménez, A., Palomo, A., Sobrados, I., & Sanz, J. (2006). The role played by the reactive alumina content in the alkaline activation of fly ashes. Microporous and Mesoporous Materials, 91(1–3), 111-119. doi://doi.org/10.1016/j.micromeso.2005.11.015
9. Duxson, P., Provis, J. L., Lukey, G. C., & van Deventer, Jannie S J. (2007). The role of inorganic polymer technology in the development of ‘green concrete’. Cement and Concrete Research, 37(12), 1590-1597. doi:2443/10.1016/j.cemconres.2007.08.018
10. US EPA. (2016). Advancing sustainable materials management: Facts and figures 2014. United States Environmental Protection Agency. 11. Shelby, J. E. (2005). Introduction to glass science and technology (2nd ed.). Cambridge, UK: The Royal Society of Chemistry.
doi:10.1039/9781847551160 12. [AET Symbol]. Retrieved July 9,2017 from https://www.astm.org/LABS/filtrexx40.cgi?+-P+ACCTNO+5200+template.frm 13. [University of Minnesota Duluth]. Retrieved July 9, 2017 from
https://www.google.com/search?q=umd&client=safari&rls=en&source=lnms&tbm=isch&sa=X&ved=0ahUKEwijxfXrg_7UAhVFMyYKHZ3qAOsQ_AUIDCgD&biw=1440&bih=716#tbm=isch&q=university+of+minnesota+duluth&imgrc=1N50SpTjKtMfpM: Sources Slide 39

Questions?