Embed Size (px)
Citation preview

2
INEQUALITY AND HUMAN DEVELOPMENT
“There are only two families in the world, as my grandmother used to say: the haves and the have-nots.”Sancho Panza in Don Quixote de la Mancha, Miguel de Cervantes
humande velopmentreport2005 51
2
Inequalityandhumandevelopm
ent
“What is it that impels the powerful and vocal lobby to press for greater equality?” asked Margaret Thatcher, then UK prime minister, in 1975. She offered her own answer: “Often the reason boils down to an undistinguished combination of envy and bourgeois guilt.”1 Plato took a different view. Writing in the fifth century BC he warned Athenian lawmakers of the threat posed by extreme inequality. “There should exist among the citizens neither extreme poverty nor again excessive wealth”, he wrote, “for both are productive of great evil.”2
ch
ap
Ter
2 Inequality and human development
Two contrasting views on a question that retains a powerful relevance today: does inequality matter? If so, why? In this chapter we argue that inequality matters because it is a funda-mental issue for human development. Extreme inequalities in opportunity and life chance have a direct bearing on what people can be and what they can do—that is, on human capabilities. Children facing a higher risk of death because they are born into a low-income or indigenous household or because they are female, for exam-ple, clearly have less opportunity to realize their potential. Inherited disadvantage in opportu-nity is wrong for intrinsic reasons: it violates basic precepts of social justice. There are also strong instrumental reasons for a concern with inequality. Deep disparities based on wealth, region, gender and ethnicity are bad for growth, bad for democracy and bad for social cohesion.
They are also bad for the Millennium De-velopment Goals (MDGs). The MDGs do not directly address inequality. In this sense they are distribution neutral. Progress is measured by aggregating and averaging change at a national level. In theory, the MDGs could be met even if, say, households with low incomes were fall-ing behind on the income poverty and health targets, or if the rate of reduction in child deaths among boys was sufficient to compensate for a slower rate of reduction among girls.
The distributional blind spot of the MDGs is a weakness on two counts. First, the MDGs themselves are rooted in ideas about global jus-tice and human rights. They are universal en-titlements, not optional or discretionary allow-ances. It follows that progress should be for all, regardless of economic status, gender, parents’ wealth or location in a country. Yet the MDGs do not remind governments that success in advancing towards the MDGs should be mea-sured for all of society, and not just in the ag-gregate. The opportunities that shape the distri-bution of income, education, health and wider life chances in any society are not randomly distributed. As we show in this chapter, the dis-parities hampering progress towards the MDGs are systemic. They reflect complex hierarchies of advantage and disadvantage that are transmit-ted across generations—and they reflect public policy choices.
The second reason for a focus on inequal-ity relates to progress within the MDG frame-work. Across many of the MDGs poor people are being left behind. As we show in this chap-ter, a recurring theme in data from a large group of countries is that progress among the poorest 20% of the population is far below the national average. Apart from being unjust, this is sub-optimal from the perspective of MDG attain-ment. People who are poor account for a far
Across many of the
MDGs poor people are
being left behind
52 humande velopmentreport2005
2
Ineq
ualit
yan
dhu
man
dev
elop
men
t
larger share of deprivation than people who are not. It follows that accelerated progress among poor people is one of the most effective routes to faster national progress. Put differently, current patterns of progress are slowing the overall ad-vance because the smallest gains are being reg-istered among the households that account for the biggest part of the problem.
These considerations have important impli-cations for the design of MDG strategies. For many of the MDGs the jury is now in, with the evidence that a “trickle down” approach to reduc-ing disparities and maintaining overall progress will not work. The MDGs set quantifiable targets that lend themselves to policy responses rooted in technical and financial terms. Ultimately, how-ever, the real barriers to progress are social and political. They are rooted in unequal access to resources and distribution of power within and
among countries. Unless these inequalities are corrected, the first principles of the Millennium Declaration—commitment to social justice, eq-uity and human rights—from which the MDGs are derived will not be translated into progress in human development at the required rate. The appropriate response is to ensure that inequality and the measures to overcome disparities in life chances figure more prominently in the design of poverty reduction strategies.
This chapter sets out the reasons why in-equality matters. It then looks at different dimensions of inequality and shows how in-terlocking inequalities in income, health and education disadvantage the poor. It concludes by showing how even modest moves towards greater distributional equity could advance human development and accelerate progress to-wards the MDGs.
Ideas about inequality, like ideas about fair-ness and social justice, are rooted in values. As Amartya Sen has argued, virtually everybody today believes in equality of something: equal rights before the law, equal civil liberties, equal-ity of opportunity and so on.3 Similarly, most people would accept that not all inequalities are unjust. Inequality in income is an inevitable product of any functioning market economy, though there are questions about the justifi-able extent of income inequality. At the same time, few people would accept in principle that inequalities in opportunity are tolerable when based on gender, inherited wealth, ethnicity or other accidents of birth over which individuals have no control. The idea that people should be consigned to an early death, illiteracy or second-class citizenship because of inherited attributes beyond their control violates most people’s sense of what is fair.4
From a human development perspec-tive there are a range of mutually reinforcing
intrinsic and instrumental reasons why inequal-ity matters. These can be broadly summarized under five headings.
Social justice and morality
The view that there are limits to tolerable deprivation is fundamental to most societies and value systems. Adam Smith powerfully expressed the basic concept: “No society can be flourishing and happy”, he wrote, “of which the far greater part of members are poor and mis-erable.”5 It was Smith who went on to elabo-rate the idea of relative poverty, arguing that all members of society should have an income sufficient to enable them to appear in public “without shame”. All major religions express concerns with equity and place obligations on their adherents to address extreme deprivation as a moral duty. Public ideas reflect wider nor-mative concerns. Opinion surveys show that more than 80% of the public in (very unequal)
Why inequality matters
The idea that people should
be consigned to an early
death, illiteracy or second-
class citizenship because of
inherited attributes beyond
their control violates most
people’s sense of what is fair
humande velopmentreport2005 53
2
Inequalityandhumandevelopm
ent
Latin America believe that the gap between rich and poor is too large, with only a slightly smaller share echoing this concern in the (less unequal) United Kingdom.6 While few of the respon-dents to these surveys might be able to indicate what an acceptable level of inequality would be, the surveys point clearly to an underlying per-ception of social justice.
Putting the poor first
Pareto efficiency or optimality—one of the core ideas of modern economics—declares that only a change that leaves nobody worse off can be declared “welfare enhancing”. Redistribution from rich to poor is not a “Pareto improvement”, because by definition it makes someone worse off. But, as Amartya Sen has said: “A society can be Pareto optimal and still be perfectly disgust-ing.”7 That sentiment powerfully captures the idea that there are limits to the acceptable level of inequality.
In fact, economics itself provides strong ar-guments for redistribution. Most people, and most democratically elected governments, ac-cept in principle that more weight should be given to improvements in the well-being of the poor and disadvantaged than to the rich and highly privileged.8 An economy’s income is not a sufficient statistic for evaluating welfare, precisely because it ignores the distribution of income generated by growth. The idea of di-minishing returns to increased wealth provides a framework for understanding a simple idea: an extra dollar in the hands of a landless agricul-tural labourer in South Asia or an urban slum dweller in Latin America generates greater wel-fare than an equivalent amount in the hands of a millionaire. In fact, a policy that increases the income of the poor by $1 can be worthwhile, even if it costs the rest of society more than $1. From this perspective it might make sense for governments choosing between alternative growth paths to choose the option that gener-ates the biggest return to the poor, even where overall growth effects are less certain.
Beyond income, many of the same argu-ments apply. For example, most people would accept in principle that an additional unit of
public spending directed towards reducing child deaths or extending access to primary school would be preferable on social grounds to a similar amount spent on transfers to services for high-income groups.
Growth and efficiency
If there were a trade-off between growth and distribution, governments would face tough choices: the welfare-enhancing gains of greater equity could be eliminated by the losses asso-ciated with lower growth. In fact, the evidence suggests that the trade-offs work in the other direction. Extreme inequality is not just bad for poverty reduction—it is also bad for growth. Long-run efficiency and greater equity can be complementary. Poor people remain poor partly because they cannot borrow against future earnings to invest in production, the educa-tion of their children and assets to reduce their vulnerability. Insecure land rights and limited access to justice can create further barriers to investment.
Deprived of public goods—such as infor-mation and legal rights—poor people are de-nied opportunities to contribute to growth. They enter markets on unequal terms and leave them with unequal rewards. Where extreme inequalities based on wealth, gender or region leave a large section of society with insufficient assets and endowments, society as a whole suf-fers from the resulting inefficiency. Denying half the population access to education oppor-tunities is not just a violation of human rights. It is also bad for growth. Gender-based education inequalities have held back Pakistan’s economic development, for example. Allowing unequal asset distribution to perpetuate mass poverty is clearly bad for poor people, but it also restricts the development of investment opportunities and markets for the rest of society.
Political legitimacy
Extreme inequalities also weaken political legit-imacy and corrode institutions. Inequalities in income and human capabilities often reflect inequalities in political power. Disadvantaged
Extreme inequality is not just
bad for poverty reduction—it
is also bad for growth
54 humande velopmentreport2005
2
Ineq
ualit
yan
dhu
man
dev
elop
men
t
groups—poor people, women, rural popula-tions, indigenous communities—are disadvan-taged partly because they have a weak politi-cal voice, and they have a weak political voice because they are disadvantaged.
Where political institutions are seen as ve-hicles for perpetuating unjust inequalities or advancing the interests of elites, that under-mines the development of democracy and cre-ates conditions for state breakdown. In coun-tries such as Bolivia and Ecuador conflicts over natural resources management have, at a more fundamental level, become a focal point for disadvantaged indigenous groups denied a political voice by institutions that are seen as unresponsive.
Public policy goals
Most societies see reducing poverty and remov-ing unjust inequalities as important goals for public policy. Extreme disparities undermine the pursuit of these goals. As we show in this chapter, extreme inequalities in income limit the rate at which growth can be converted into lower levels of poverty. Similarly, extreme dis-parities in health and education reduce the scope of disadvantaged groups to take advan-tage of opportunities for improving welfare.
Counter-arguments—countered
There are counter-arguments to the claim that inequality matters. Some libertarians deny the existence of “social justice”. The free mar-ket theorist F.A. Hayek famously argued that it was nonsense to talk about resources being fairly or unfairly distributed. On his account it was up to free markets, not human agency, to determine the appropriate allocation of wealth and assets. This perspective overlooks the role of human agency and unequal power relationships in structuring markets.
Another widely held view is that some in-equalities matter more than others and that equality before the law matters first and fore-most.9 However, rights and freedoms cannot stand alone. People are likely to be restricted in what they can do with their freedom and their
rights if they are poor, ill, denied an education or lack the capacity to influence what happens to them. To be meaningful, formal equalities have to be backed by what Amartya Sen has called the “substantive freedoms”—the capabilities—to choose a way of life and do the things that one values. Deep inequalities in life chances limit these substantive freedoms, rendering hol-low the idea of equality before the law.
Others have argued that the proper focus for social justice is absolute deprivation, not distribution. Where poor people stand in re-lation to others, so the argument runs, is less important than their command over income or access to health and education services. “We are against poverty,” runs the common refrain, “but inequality is a different matter, and noth-ing to do with social justice or the MDGs.” This argument too is flawed. Absolute poverty and inequality may be different concepts, but they are intimately related. Disparities in life chances define prospects for escaping poverty. For exam-ple, inequality in access to healthcare, education or political rights can diminish an individual’s prospects for escaping poverty. In this chapter we examine some of the basic disparities that interact with poverty. What links these diverse disparities is that they are rooted in inequali-ties in power that perpetuate deprivation and destitution. The “pathologies of power”, as one author has described them, are at the very core of the processes that are driving countries off track for the MDGs.10
As we show later, progress towards the re-duction of absolute poverty is heavily condi-tioned by inequality. This is true not just for income, but also for wider inequalities in areas such as health, education and politics. More-over, the idea that poverty and human welfare can be defined solely in absolute terms to the exclusion of relative considerations flies in the face not just of attitude survey evidence, but of basic ideas elaborated in 1776 by Adam Smith. Smith forcefully argued that relative distribu-tion is integral to any assessment of human wel-fare: “By necessities I understand not only the commodities necessary for the support of life, but whatever the custom of the country ren-ders it necessary for creditable people, even of
Absolute poverty and
inequality may be
different, but they are
intimately related
humande velopmentreport2005 55
2
Inequalityandhumandevelopm
ent
the lowest order, to be without. A linen shirt, for example, is strictly speaking not a necessity of life....But in present times, throughout the
greater part of Europe, a creditable day labourer would be ashamed to appear in public without a linen shirt.”11
Chapter 1 looked at inequalities between rich and poor countries. These inequalities are mir-rored within countries. Deep human develop-ment disparities persist between rich people and poor people, men and women, rural and urban areas and different regions and groups. These inequalities seldom exist in isolation. They cre-ate mutually reinforcing structures of disadvan-tage that follow people through life cycles and are transmitted across generations.
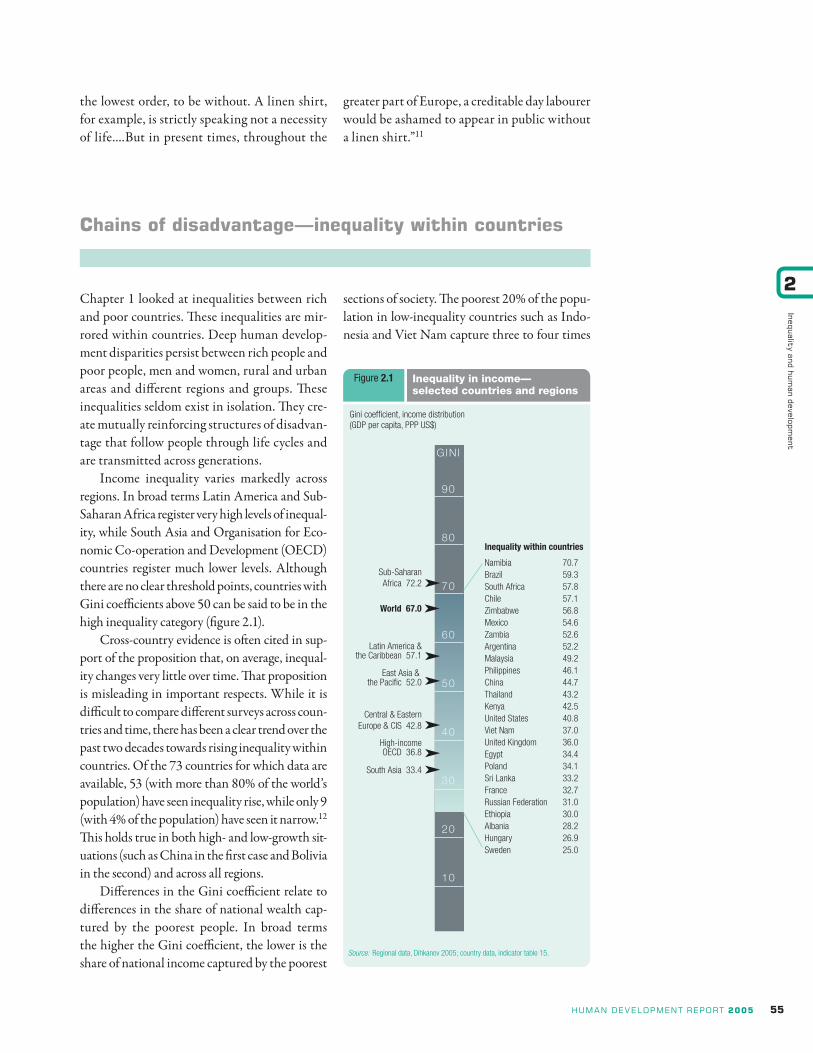
Income inequality varies markedly across regions. In broad terms Latin America and Sub-Saharan Africa register very high levels of inequal-ity, while South Asia and Organisation for Eco-nomic Co-operation and Development (OECD) countries register much lower levels. Although there are no clear threshold points, countries with Gini coefficients above 50 can be said to be in the high inequality category (figure 2.1).
Cross-country evidence is often cited in sup-port of the proposition that, on average, inequal-ity changes very little over time. That proposition is misleading in important respects. While it is difficult to compare different surveys across coun-tries and time, there has been a clear trend over the past two decades towards rising inequality within countries. Of the 73 countries for which data are available, 53 (with more than 80% of the world’s population) have seen inequality rise, while only 9 (with 4% of the population) have seen it narrow.12 This holds true in both high- and low-growth sit-uations (such as China in the first case and Bolivia in the second) and across all regions.
Differences in the Gini coefficient relate to differences in the share of national wealth cap-tured by the poorest people. In broad terms the higher the Gini coefficient, the lower is the share of national income captured by the poorest
sections of society. The poorest 20% of the popu-lation in low-inequality countries such as Indo-nesia and Viet Nam capture three to four times
chains of disadvantage—inequality within countries
GINI
90
80
70
60
50
40
30
20
10
56 humande velopmentreport2005
2
Ineq
ualit
yan
dhu
man
dev
elop
men
t
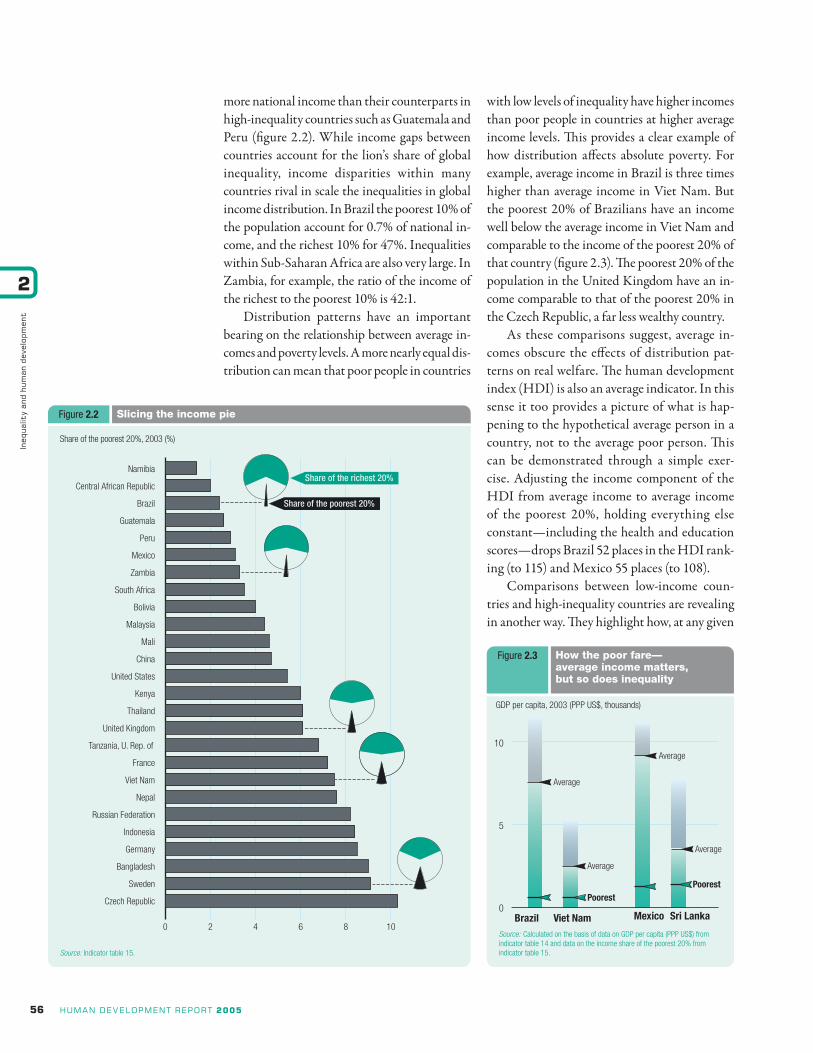
more national income than their counterparts in high-inequality countries such as Guatemala and Peru (figure 2.2). While income gaps between countries account for the lion’s share of global inequality, income disparities within many countries rival in scale the inequalities in global income distribution. In Brazil the poorest 10% of the population account for 0.7% of national in-come, and the richest 10% for 47%. Inequalities within Sub-Saharan Africa are also very large. In Zambia, for example, the ratio of the income of the richest to the poorest 10% is 42:1.
Distribution patterns have an important bearing on the relationship between average in-comes and poverty levels. A more nearly equal dis-tribution can mean that poor people in countries
with low levels of inequality have higher incomes than poor people in countries at higher average income levels. This provides a clear example of how distribution affects absolute poverty. For example, average income in Brazil is three times higher than average income in Viet Nam. But the poorest 20% of Brazilians have an income well below the average income in Viet Nam and comparable to the income of the poorest 20% of that country (figure 2.3). The poorest 20% of the population in the United Kingdom have an in-come comparable to that of the poorest 20% in the Czech Republic, a far less wealthy country.
As these comparisons suggest, average in-comes obscure the effects of distribution pat-terns on real welfare. The human development index (HDI) is also an average indicator. In this sense it too provides a picture of what is hap-pening to the hypothetical average person in a country, not to the average poor person. This can be demonstrated through a simple exer-cise. Adjusting the income component of the HDI from average income to average income of the poorest 20%, holding everything else constant—including the health and education scores—drops Brazil 52 places in the HDI rank-ing (to 115) and Mexico 55 places (to 108).
Comparisons between low-income coun-tries and high-inequality countries are revealing in another way. They highlight how, at any given
humande velopmentreport2005 57
2
Inequalityandhumandevelopm
ent
level of average income, more equitable distribu-tion can be associated with lower poverty levels. One way to illustrate this is to consider how the incomes of different parts of the overall distribu-tion in a country might change if the distribution patterns of a more equal country were imposed. Currently, the poorest 20% of the population in Guatemala have an average income of $550 a year, or 46% below the $2 a day international poverty line. Were this group to capture the same share of national income as the poorest 20% in Viet Nam, their average incomes would rise to $1,560, or 66% above the $2 a day line.13 Of course, it could be argued that this example ignores the potentially negative effects on growth and hence on the overall size of the economy of a transition to greater equity in Guatemala. But the example of Viet Nam, a dynamic, high-growth economy with lower inequality, suggests that there may be positive benefits for Guatemala, which has expe-rienced two decades of low growth.
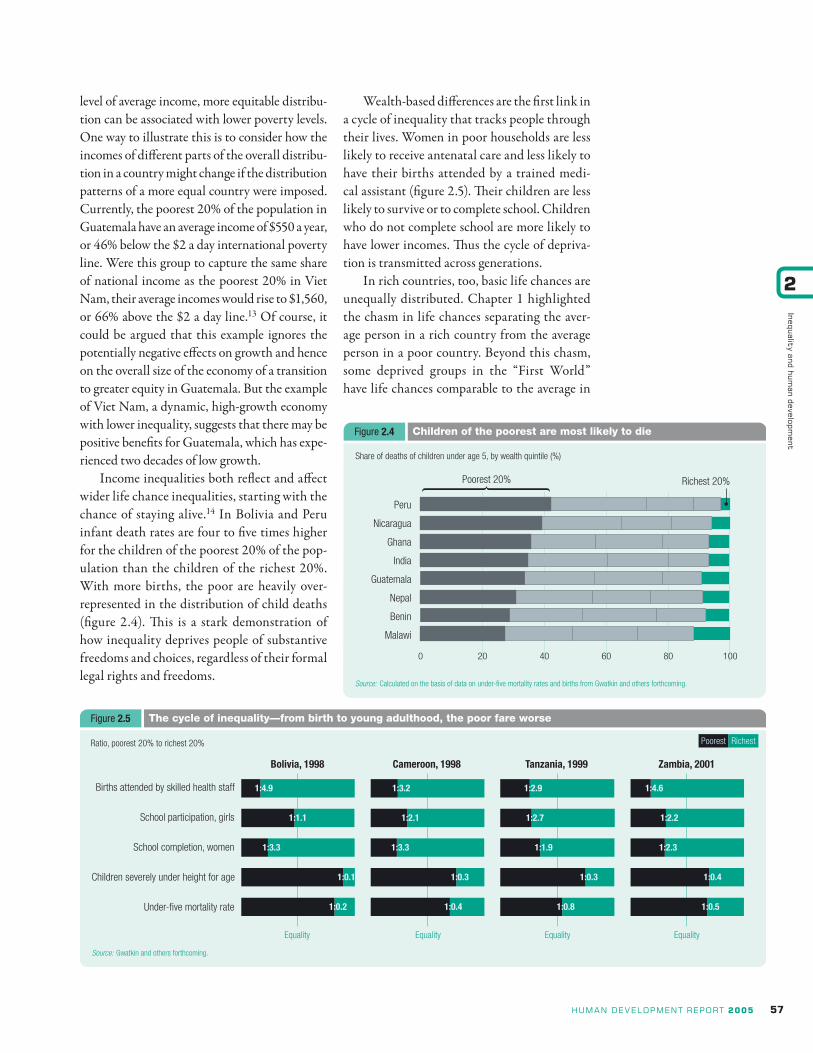
Income inequalities both reflect and affect wider life chance inequalities, starting with the chance of staying alive.14 In Bolivia and Peru infant death rates are four to five times higher for the children of the poorest 20% of the pop-ulation than the children of the richest 20%. With more births, the poor are heavily over-represented in the distribution of child deaths (figure 2.4). This is a stark demonstration of how inequality deprives people of substantive freedoms and choices, regardless of their formal legal rights and freedoms.
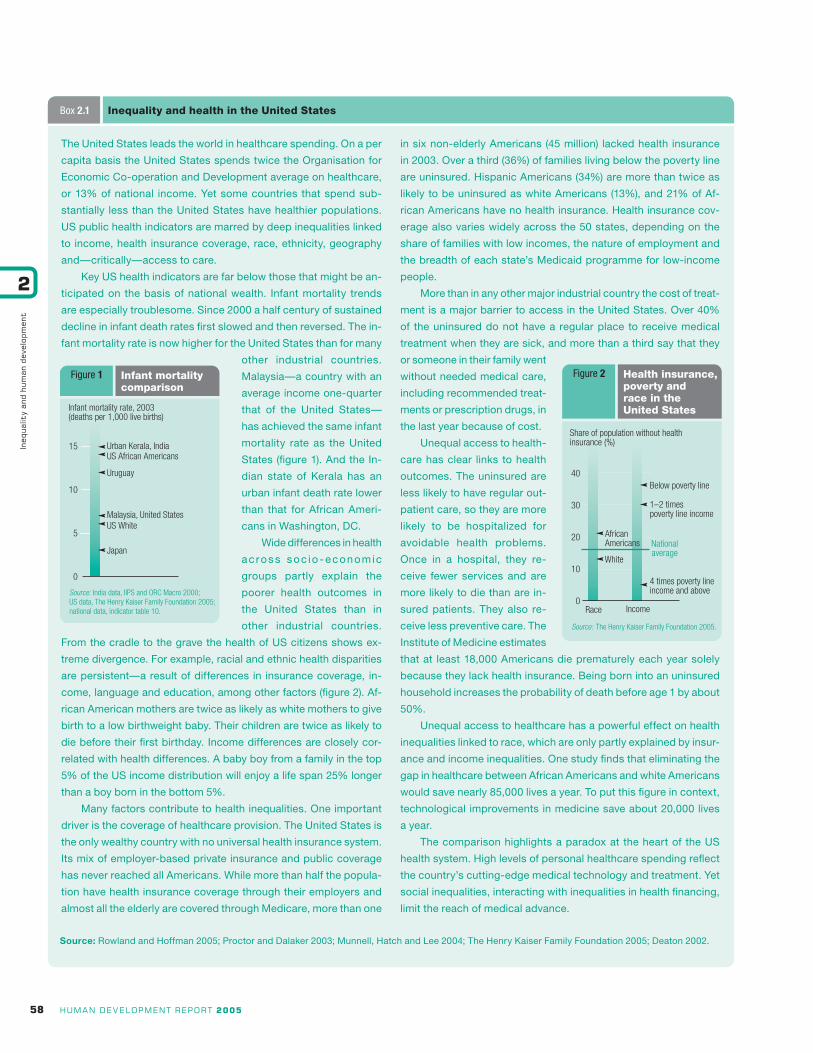
Wealth-based differences are the first link in a cycle of inequality that tracks people through their lives. Women in poor households are less likely to receive antenatal care and less likely to have their births attended by a trained medi-cal assistant (figure 2.5). Their children are less likely to survive or to complete school. Children who do not complete school are more likely to have lower incomes. Thus the cycle of depriva-tion is transmitted across generations.
In rich countries, too, basic life chances are unequally distributed. Chapter 1 highlighted the chasm in life chances separating the aver-age person in a rich country from the average person in a poor country. Beyond this chasm, some deprived groups in the “First World” have life chances comparable to the average in
58 humande velopmentreport2005
2
Ineq
ualit
yan
dhu
man
dev
elop
men
t
The United States leads the world in healthcare spending. On a per
capita basis the United States spends twice the Organisation for
Economic Co-operation and Development average on healthcare,
or 13% of national income. Yet some countries that spend sub-
stantially less than the United States have healthier populations.
US public health indicators are marred by deep inequalities linked
to income, health insurance coverage, race, ethnicity, geography
and—critically—access to care.
Key US health indicators are far below those that might be an-
ticipated on the basis of national wealth. Infant mortality trends
are especially troublesome. Since 2000 a half century of sustained
decline in infant death rates first slowed and then reversed. The in-
fant mortality rate is now higher for the United States than for many
other industrial countries.
Malaysia—a country with an
average income one-quarter
that of the United States—
has achieved the same infant
mortality rate as the United
States (figure 1). And the In-
dian state of Kerala has an
urban infant death rate lower
than that for African Ameri-
cans in Washington, DC.
Wide differences in health
ac ross soc io - economic
groups partly explain the
poorer health outcomes in
the United States than in
other industrial countries.
From the cradle to the grave the health of US citizens shows ex-
treme divergence. For example, racial and ethnic health disparities
are persistent—a result of differences in insurance coverage, in-
come, language and education, among other factors (figure 2). Af-
rican American mothers are twice as likely as white mothers to give
birth to a low birthweight baby. Their children are twice as likely to
die before their first birthday. Income differences are closely cor-
related with health differences. A baby boy from a family in the top
5% of the US income distribution will enjoy a life span 25% longer
than a boy born in the bottom 5%.
Many factors contribute to health inequalities. One important
driver is the coverage of healthcare provision. The United States is
the only wealthy country with no universal health insurance system.
Its mix of employer-based private insurance and public coverage
has never reached all Americans. While more than half the popula-
tion have health insurance coverage through their employers and
almost all the elderly are covered through Medicare, more than one
in six non-elderly Americans (45 million) lacked health insurance
in 2003. Over a third (36%) of families living below the poverty line
are uninsured. Hispanic Americans (34%) are more than twice as
likely to be uninsured as white Americans (13%), and 21% of Af-
rican Americans have no health insurance. Health insurance cov-
erage also varies widely across the 50 states, depending on the
share of families with low incomes, the nature of employment and
the breadth of each state’s Medicaid programme for low-income
people.
More than in any other major industrial country the cost of treat-
ment is a major barrier to access in the United States. Over 40%
of the uninsured do not have a regular place to receive medical
treatment when they are sick, and more than a third say that they
or someone in their family went
without needed medical care,
including recommended treat-
ments or prescription drugs, in
the last year because of cost.
Unequal access to health-
care has clear links to health
outcomes. The uninsured are
less likely to have regular out-
patient care, so they are more
likely to be hospitalized for
avoidable health problems.
Once in a hospital, they re-
ceive fewer services and are
more likely to die than are in-
sured patients. They also re-
ceive less preventive care. The
Institute of Medicine estimates
that at least 18,000 Americans die prematurely each year solely
because they lack health insurance. Being born into an uninsured
household increases the probability of death before age 1 by about
50%.
Unequal access to healthcare has a powerful effect on health
inequalities linked to race, which are only partly explained by insur-
ance and income inequalities. One study finds that eliminating the
gap in healthcare between African Americans and white Americans
would save nearly 85,000 lives a year. To put this figure in context,
technological improvements in medicine save about 20,000 lives
a year.
The comparison highlights a paradox at the heart of the US
health system. High levels of personal healthcare spending reflect
the country’s cutting-edge medical technology and treatment. Yet
social inequalities, interacting with inequalities in health financing,
limit the reach of medical advance.
Source: Rowland and Hoffman 2005; Proctor and Dalaker 2003; Munnell, Hatch and Lee 2004; The Henry Kaiser Family Foundation 2005; Deaton 2002.
Box 2.1 Inequality and health in the United States
humande velopmentreport2005 59
2
Inequalityandhumandevelopm
ent
countries at far lower levels of income. Poorer people die younger and are sick more often. Men in the top 5% of the income distribution in the United States live about 25% longer than men in the bottom 5%.15 Meanwhile, high levels of health spending have failed to eradicate large disparities in infant death rates based on race, wealth and state of residence. These disparities have limited progress in reducing infant mor-tality. The infant mortality rate in the United States compares with that in Malaysia—a coun-try with a quarter the income. Infant death rates are higher for African American children in Washington, DC, than for children in Kerala, India. While other socio-economic factors are involved, financial barriers to adequate health-care are an important contributor (box 2.1).
Layers of inequality constrain life choices
Life chances in any country are constrained by complex layers of inequality. Disparities in opportunities for health, education, income and political influence are to be found in every coun-try, in varying magnitudes. Inequalities linked to wealth, gender, location, race and ethnicity, along with other markers for disadvantage, do not operate in isolation. They interact to cre-ate dynamic and mutually reinforcing cycles of disadvantage that are transmitted across genera-tions. Breaking these cycles is one of the keys to accelerated progress towards the MDGs.
Regional inequalities In many countries regional disparities are a major source of inequality. In Brazil the infant mortality rate is 52 deaths per 1,000 live births in the north-east but drops to 20 deaths in the south-east. The 10 municipalities with the low-est infant mortality rates have an average of 8 deaths per 1,000 live births—a level compa-rable to that in some high-income countries. The 10 worst municipalities have a death rate of 117 deaths per 1,000 live births, which is higher than in Bihar, India. Per capita spend-ing on health is inversely related to the infant mortality rate: it is twice as high in the south-east as in the north-east.16
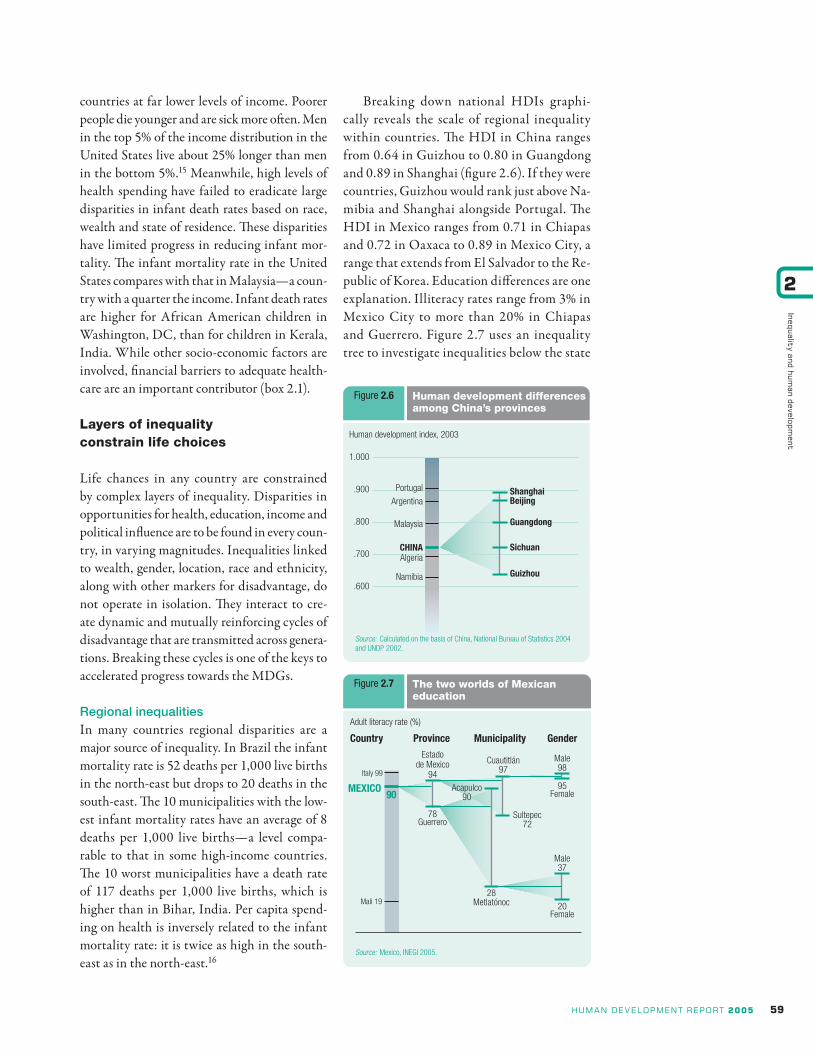
Breaking down national HDIs graphi-cally reveals the scale of regional inequality within countries. The HDI in China ranges from 0.64 in Guizhou to 0.80 in Guangdong and 0.89 in Shanghai (figure 2.6). If they were countries, Guizhou would rank just above Na-mibia and Shanghai alongside Portugal. The HDI in Mexico ranges from 0.71 in Chiapas and 0.72 in Oaxaca to 0.89 in Mexico City, a range that extends from El Salvador to the Re-public of Korea. Education differences are one explanation. Illiteracy rates range from 3% in Mexico City to more than 20% in Chiapas and Guerrero. Figure 2.7 uses an inequality tree to investigate inequalities below the state
60 humande velopmentreport2005
2
Ineq
ualit
yan
dhu
man
dev
elop
men
t
level in Mexico. The richest municipalities in Guerrero, such as the resort of Acapulco, have literacy levels comparable to those in high-income countries, and with limited gender gaps. Meanwhile, in the predominantly rural, indigenous and mountainous municipalities literacy levels fall to 28%—half the level in Sudan—and to 20% for women. Inequality trees provide a way of tracking the complex patterns of inequality that operate beneath the national average.
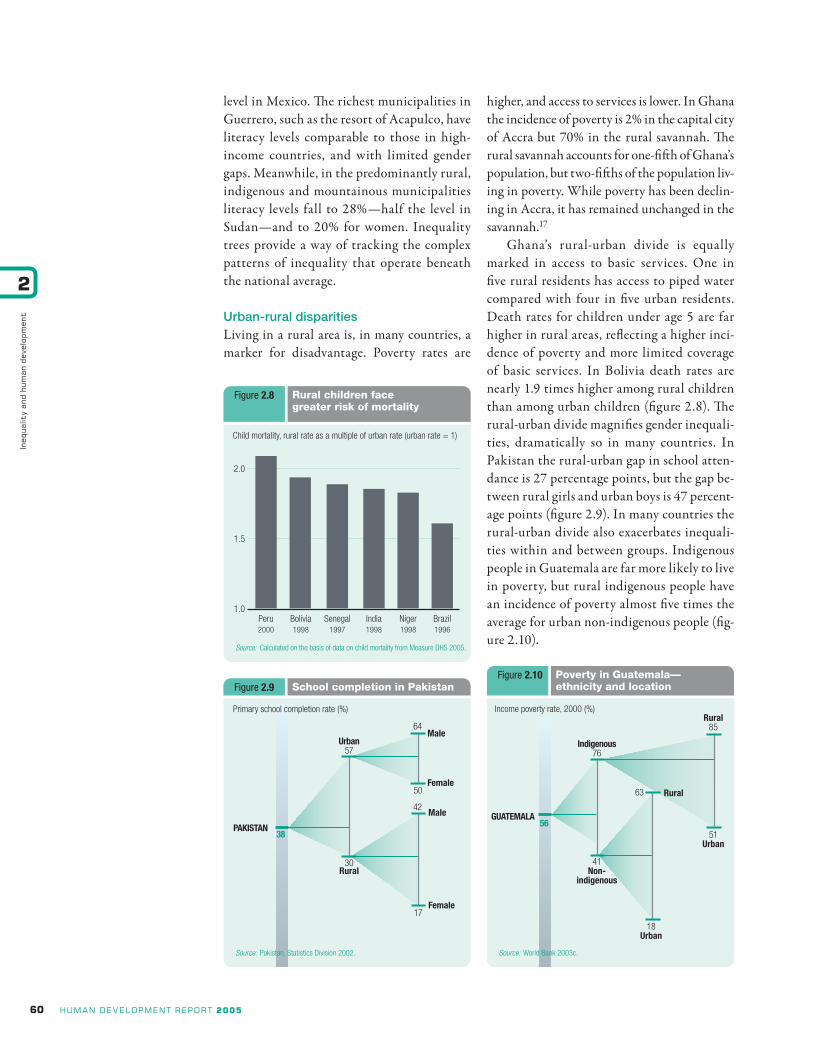
Urban-rural disparities Living in a rural area is, in many countries, a marker for disadvantage. Poverty rates are
higher, and access to services is lower. In Ghana the incidence of poverty is 2% in the capital city of Accra but 70% in the rural savannah. The rural savannah accounts for one-fifth of Ghana’s population, but two-fifths of the population liv-ing in poverty. While poverty has been declin-ing in Accra, it has remained unchanged in the savannah.17
Ghana’s rural-urban divide is equally marked in access to basic services. One in five rural residents has access to piped water compared with four in five urban residents. Death rates for children under age 5 are far higher in rural areas, reflecting a higher inci-dence of poverty and more limited coverage of basic services. In Bolivia death rates are nearly 1.9 times higher among rural children than among urban children (figure 2.8). The rural-urban divide magnifies gender inequali-ties, dramatically so in many countries. In Pakistan the rural-urban gap in school atten-dance is 27 percentage points, but the gap be-tween rural girls and urban boys is 47 percent-age points (figure 2.9). In many countries the rural-urban divide also exacerbates inequali-ties within and between groups. Indigenous people in Guatemala are far more likely to live in poverty, but rural indigenous people have an incidence of poverty almost five times the average for urban non-indigenous people (fig-ure 2.10).
humande velopmentreport2005 61
2
Inequalityandhumandevelopm
ent
Gender inequality Gender disparities are among the deepest and most pervasive of inequalities. They are revealed most brutally in parts of South Asia. In India the mortality rate among children ages 1–5 is 50% higher for girls than for boys. These girls, deprived of life because they were born with two X chromosomes, are among the 100 mil-lion “missing women” in South Asia. The higher mortality rates among girls and women from birth to about age 30 inverts the normal demo-graphic gender balance, pointing to structural inequalities in nutrition, healthcare and status.
Income inequality reinforces unequal health outcomes for women. In Indonesia maternal mortality ratios are four times higher among women in the poorest 20% of the population than among women in the richest 20%. Women who die during pregnancy are twice as likely to be unschooled and 50% less likely to have access to clean water.18 Across the developing world poor women are less likely than women in higher income groups to have their births attended by a trained assistant—a key indica-tor for maternal mortality. In Peru and Yemen women in the richest 20% of the population are six to seven times more likely to have births attended by trained assistants than are women in the poorest 20%. Gender-based inequalities, including infant mortality, link back to wider life chance inequalities. In Burkina Faso infant mortality rates are three times higher for chil-dren of uneducated mothers than for children of educated mothers.
The very visible disparities in human devel-opment described here are the product of deeper structural inequalities, including less visible in-equalities in power. Empowerment of the poor is both an instrument to reduce poverty and, because participation in society is a dimension of human development, an aspect of poverty re-duction. Poor people and disadvantaged groups often lack the capacity to influence institutions controlled by elite groups. More broadly, the disadvantage is perpetuated by inequalities in what can be thought of as the factors shaping the political capabilities of the poor: self-confi-dence, capacity to influence political processes and recognition by the rest of society.
Nowhere are power inequalities and their consequences more clearly displayed than for women. Women experience inequality in power relative to men from the household level to the national level, where they are universally under-represented in legislative bodies, organs of gov-ernment and local political structures. Women, especially those with low incomes, tend to have less control over household resources, less ac-cess to information and health services and less control over their time. These factors are closely linked to their nutritional status, the quality of care they receive and the nutritional status of their children (see box 1.3).
Unequal chances—health inequalities and the MDGs
Life chance inequalities on the scale described above are not just inherently unjust. They are also bad for the MDGs. Deep inequalities are holding back progress in many areas. To demon-strate how strategies to reduce inequality could accelerate progress, this section considers child mortality.
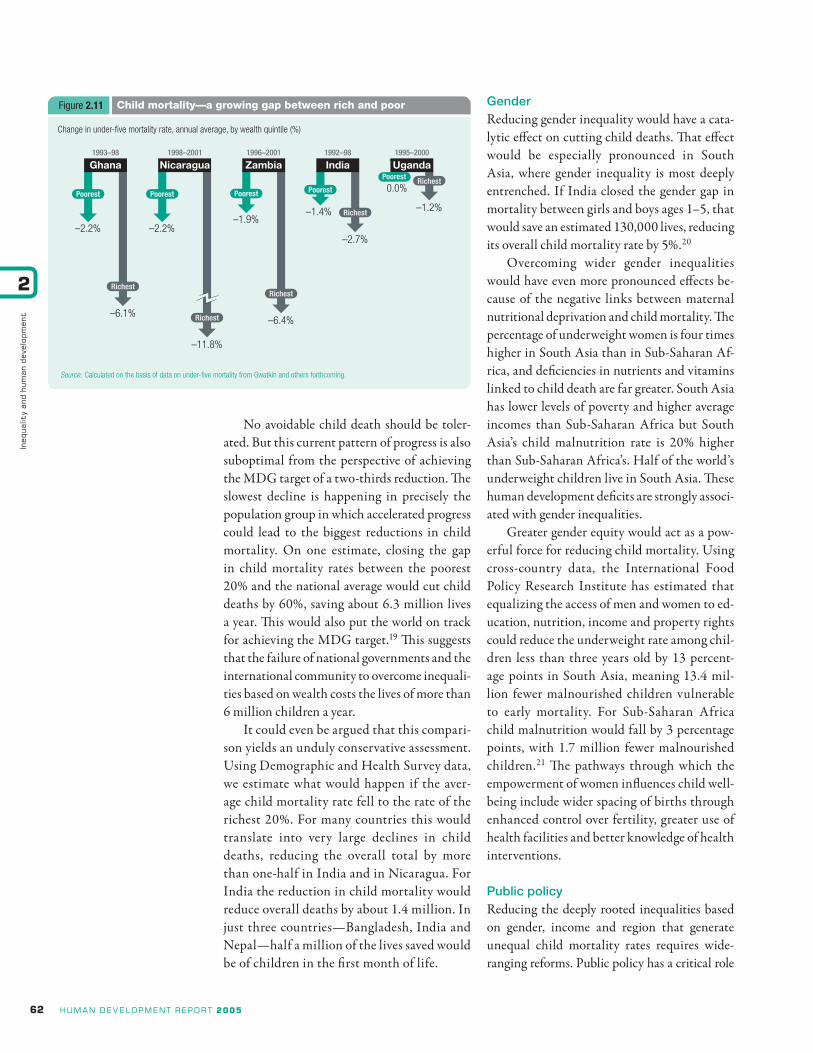
Income As chapter 1 shows, the MDG target of reduc-ing child deaths by two-thirds will be missed by a wide margin on current trends. Two interre-lated factors explain much of the deficit. First, in most countries the poor account for a far larger share of child deaths than is commensurate with their share of the population. Put differently, the children of the poor are overrepresented among the victims of child death—heavily so in many countries. In Ghana 36% of child deaths occur among the poorest 20% of the population, while 7% occur among the richest 20% (see figure 2.4). Second, the rate of child mortality is falling much more slowly among the poor than the average rate of decline in most countries. Cross-country data suggest that the child mortality rate among the poorest 20% is falling at half the average rate of decline, so that the mortality gap between rich and poor children is widening. In Zambia child mortality among the richest 20% fell by 6% a year in the second half of the 1990s—three times as fast as for the poorest 20% (figure 2.11).
In India the mortality rate
among children ages
1–5 is 50% higher for
girls than for boys
62 humande velopmentreport2005
2
Ineq
ualit
yan
dhu
man
dev
elop
men
t
No avoidable child death should be toler-ated. But this current pattern of progress is also suboptimal from the perspective of achieving the MDG target of a two-thirds reduction. The slowest decline is happening in precisely the population group in which accelerated progress could lead to the biggest reductions in child mortality. On one estimate, closing the gap in child mortality rates between the poorest 20% and the national average would cut child deaths by 60%, saving about 6.3 million lives a year. This would also put the world on track for achieving the MDG target.19 This suggests that the failure of national governments and the international community to overcome inequali-ties based on wealth costs the lives of more than 6 million children a year.
It could even be argued that this compari-son yields an unduly conservative assessment. Using Demographic and Health Survey data, we estimate what would happen if the aver-age child mortality rate fell to the rate of the richest 20%. For many countries this would translate into very large declines in child deaths, reducing the overall total by more than one-half in India and in Nicaragua. For India the reduction in child mortality would reduce overall deaths by about 1.4 million. In just three countries—Bangladesh, India and Nepal—half a million of the lives saved would be of children in the first month of life.
Gender Reducing gender inequality would have a cata-lytic effect on cutting child deaths. That effect would be especially pronounced in South Asia, where gender inequality is most deeply entrenched. If India closed the gender gap in mortality between girls and boys ages 1–5, that would save an estimated 130,000 lives, reducing its overall child mortality rate by 5%.20
Overcoming wider gender inequalities would have even more pronounced effects be-cause of the negative links between maternal nutritional deprivation and child mortality. The percentage of underweight women is four times higher in South Asia than in Sub-Saharan Af-rica, and deficiencies in nutrients and vitamins linked to child death are far greater. South Asia has lower levels of poverty and higher average incomes than Sub-Saharan Africa but South Asia’s child malnutrition rate is 20% higher than Sub-Saharan Africa’s. Half of the world’s underweight children live in South Asia. These human development deficits are strongly associ-ated with gender inequalities.
Greater gender equity would act as a pow-erful force for reducing child mortality. Using cross-country data, the International Food Policy Research Institute has estimated that equalizing the access of men and women to ed-ucation, nutrition, income and property rights could reduce the underweight rate among chil-dren less than three years old by 13 percent-age points in South Asia, meaning 13.4 mil-lion fewer malnourished children vulnerable to early mortality. For Sub-Saharan Africa child malnutrition would fall by 3 percentage points, with 1.7 million fewer malnourished children.21 The pathways through which the empowerment of women influences child well-being include wider spacing of births through enhanced control over fertility, greater use of health facilities and better knowledge of health interventions.
Public policy Reducing the deeply rooted inequalities based on gender, income and region that generate unequal child mortality rates requires wide-ranging reforms. Public policy has a critical role
humande velopmentreport2005 63
2
Inequalityandhumandevelopm
ent
to play in addressing the three “As” for reducing inequality:• Access. The poor often live in areas that are
sparsely covered by basic health services or covered by facilities that lack drugs and trained staff. Chronic underfinancing is part of the problem. Providing basic health-care coverage in a low-income country costs an estimated $30–$40 per capita. Across much of Africa spending is less than $6 per capita. Under these conditions, even where facilities exist, they are likely to lack essen-tial medicines.
• Affordability. Charging for basic health-care increases inequality. Payments for
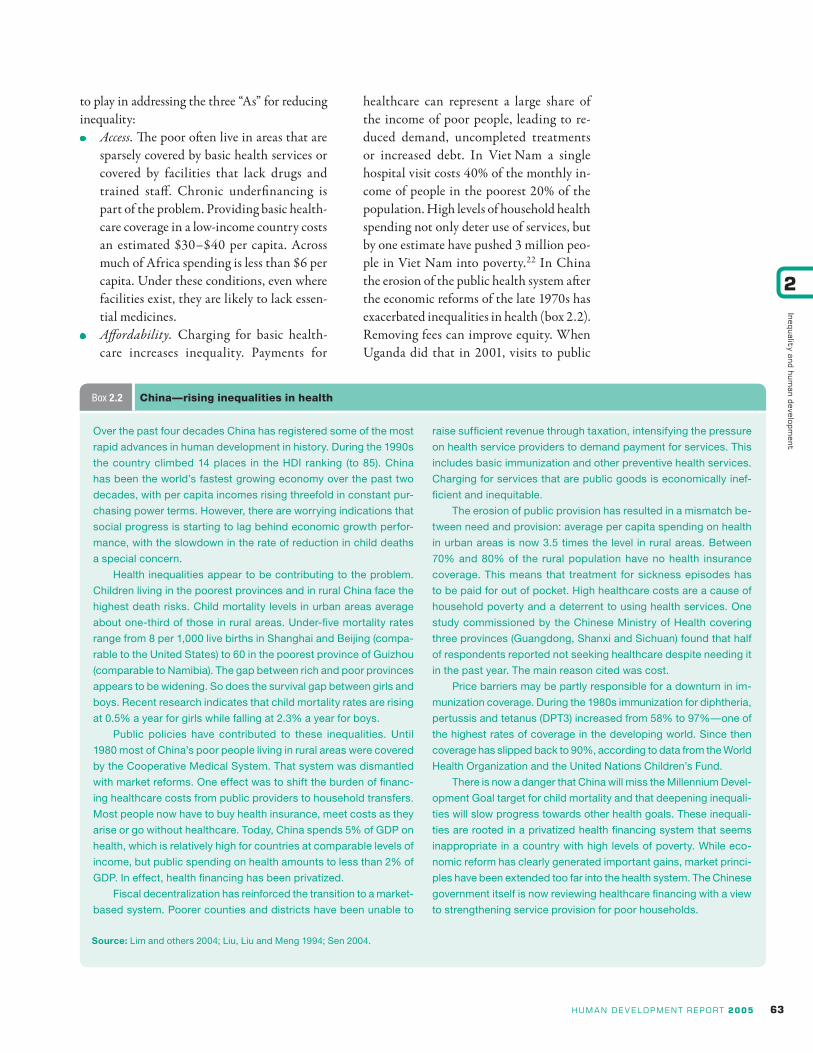
healthcare can represent a large share of the income of poor people, leading to re-duced demand, uncompleted treatments or increased debt. In Viet Nam a single hospital visit costs 40% of the monthly in-come of people in the poorest 20% of the population. High levels of household health spending not only deter use of services, but by one estimate have pushed 3 million peo-ple in Viet Nam into poverty.22 In China the erosion of the public health system after the economic reforms of the late 1970s has exacerbated inequalities in health (box 2.2). Removing fees can improve equity. When Uganda did that in 2001, visits to public
Over the past four decades China has registered some of the most
rapid advances in human development in history. During the 1990s
the country climbed 14 places in the HDI ranking (to 85). China
has been the world’s fastest growing economy over the past two
decades, with per capita incomes rising threefold in constant pur-
chasing power terms. However, there are worrying indications that
social progress is starting to lag behind economic growth perfor-
mance, with the slowdown in the rate of reduction in child deaths
a special concern.
Health inequalities appear to be contributing to the problem.
Children living in the poorest provinces and in rural China face the
highest death risks. Child mortality levels in urban areas average
about one-third of those in rural areas. Under-five mortality rates
range from 8 per 1,000 live births in Shanghai and Beijing (compa-
rable to the United States) to 60 in the poorest province of Guizhou
(comparable to Namibia). The gap between rich and poor provinces
appears to be widening. So does the survival gap between girls and
boys. Recent research indicates that child mortality rates are rising
at 0.5% a year for girls while falling at 2.3% a year for boys.
Public policies have contributed to these inequalities. Until
1980 most of China’s poor people living in rural areas were covered
by the Cooperative Medical System. That system was dismantled
with market reforms. One effect was to shift the burden of financ-
ing healthcare costs from public providers to household transfers.
Most people now have to buy health insurance, meet costs as they
arise or go without healthcare. Today, China spends 5% of GDP on
health, which is relatively high for countries at comparable levels of
income, but public spending on health amounts to less than 2% of
GDP. In effect, health financing has been privatized.
Fiscal decentralization has reinforced the transition to a market-
based system. Poorer counties and districts have been unable to
raise sufficient revenue through taxation, intensifying the pressure
on health service providers to demand payment for services. This
includes basic immunization and other preventive health services.
Charging for services that are public goods is economically inef-
ficient and inequitable.
The erosion of public provision has resulted in a mismatch be-
tween need and provision: average per capita spending on health
in urban areas is now 3.5 times the level in rural areas. Between
70% and 80% of the rural population have no health insurance
coverage. This means that treatment for sickness episodes has
to be paid for out of pocket. High healthcare costs are a cause of
household poverty and a deterrent to using health services. One
study commissioned by the Chinese Ministry of Health covering
three provinces (Guangdong, Shanxi and Sichuan) found that half
of respondents reported not seeking healthcare despite needing it
in the past year. The main reason cited was cost.
Price barriers may be partly responsible for a downturn in im-
munization coverage. During the 1980s immunization for diphtheria,
pertussis and tetanus (DPT3) increased from 58% to 97%—one of
the highest rates of coverage in the developing world. Since then
coverage has slipped back to 90%, according to data from the World
Health Organization and the United Nations Children’s Fund.
There is now a danger that China will miss the Millennium Devel-
opment Goal target for child mortality and that deepening inequali-
ties will slow progress towards other health goals. These inequali-
ties are rooted in a privatized health financing system that seems
inappropriate in a country with high levels of poverty. While eco-
nomic reform has clearly generated important gains, market princi-
ples have been extended too far into the health system. The Chinese
government itself is now reviewing healthcare financing with a view
to strengthening service provision for poor households.
Source: Lim and others 2004; Liu, Liu and Meng 1994; Sen 2004.
Box 2.2 China—rising inequalities in health
64 humande velopmentreport2005
2
Ineq
ualit
yan
dhu
man
dev
elop
men
t
health facilities rose by 80%, with half of the increase among the poorest 20% of the population. The share of households that reported not having used a health service because of high costs decreased from about 50% in 1999 to 35% in 2002—a reduction that was particularly pronounced in the country’s poorest region.23
• Accountability. Even where public health services are available, they are often not used by poor people. For example, in India a large share of demand is directed towards poorly qualified private providers. A survey in one of the poorest districts of Rajasthan found that poor households used private health providers even when nominally free public services were available. One reason: over half of health centres were closed during periods
when they were supposed to be open. When facilities are open they often lack a trained staff member on site. For India as a whole survey evidence based on unannounced vis-its to health clinics found that 40% of clin-ics lack a trained person on site at the time of the visit.24 Developing more accountable health systems can dramatically improve access and health indicators. For example, in 1987 the Brazilian state of Cereá, one of the poorest in the country, set up a decen-tralized, community-based healthcare sys-tem that now employs more than 170,000 health workers. The programme has been accompanied by strategies to support com-munity monitoring of health providers. In less than 15 years the infant death rate fell to one-third of its 1987 level.
Trends in income inequality have an important bearing on wider dimensions of human devel-opment as well as on income poverty. Moves towards greater distributional equity could sharply reduce the rate of income poverty, with attendant benefits for the MDGs and wider human development goals.
Improved distribution can enhance devel-opment through two pathways: one static and the other dynamic. At any given growth rate the larger the share of any increment in economic wealth that is captured by the poor, the higher the ratio of poverty reduction to growth—referred to as the poverty elasticity of growth. This is a static effect. Dynamic effects emerge when changes in distribution affect the growth rate. Extreme inequality can act as a brake on growth. This effect is especially strong for asset inequality. Limited access to productive assets, or limited capacity to enforce legal claims, can restrict poor people’s ability to borrow and in-vest, holding back growth.25 Cross-country evi-dence suggests that greater distributional equity
can accelerate growth and that there are no inherent trade-offs between growth and equity. Thus improved distributional equity can gener-ate a double benefit: it increases growth and the size of the economic pie and it enables the poor to capture a bigger slice of that pie.26
Improving the distribution of growth
In countries where inequality and poverty lev-els are high even small shifts in distribution can significantly reduce poverty.
Accelerating poverty reduction in individual countries Using national household income and expendi-ture data for several countries, we estimated the potential impact on income poverty of doubling the national income share of the poorest 20% of the population through a transfer from the top 20% (see Technicalnote2). For high-inequality countries with large populations in poverty, shifting even a small share of the income of
The human development potential of pro-poor growth
Even small shifts in
distribution can
significantly
reduce poverty
humande velopmentreport2005 65
2
Inequalityandhumandevelopm
ent
the top 20% could lift large numbers of people above the poverty line. For Brazil and Mexico the transfer of 5% of the income of the richest 20% would have the following effects:• In Brazil about 26 million people would be
lifted above the $2 a day poverty line, cut-ting the poverty rate from 22% to 7%.
• In Mexico about 12 million people would be taken out of poverty, as nationally defined, reducing the poverty rate from 16% to 4%.Of course, this is a static exercise. It illus-
trates the poverty impact of a hypothetical transfer from rich to poor. In a society that attaches greater weight to welfare gains for the poor than the rich the transfer might be consid-ered welfare enhancing for the whole of society even if some lose.
Another route to improved distribution is progressive growth—a growth pattern in which average incomes are growing, but the incomes of poor people are growing even faster. This is a positive-sum process in which nobody loses and
the poor gain proportionately more. Progressive growth can be thought of as a dynamic process in which poor people produce their way out of poverty, while increasing their contribution to national wealth (box 2.3).
Even modestly progressive growth can have a powerful impact on poverty. Once again, we use growth simulation models based on na-tional household income survey data to dem-onstrate the effects for Brazil and Mexico. We build two scenarios. The first, a distribution-neutral scenario, assumes a continuation of cur-rent growth trends with no change in distribu-tion. Increases to income are distributed in line with existing income shares: if the poorest 20% account for 1% of current income, they would receive 1 cent of every $1 generated by growth. The second, a progressive growth scenario, as-sumes that people living below the poverty line double their share of future growth. In the case mentioned above, if the poorest 20% repre-sented the population living in poverty, their
Like motherhood and apple pie, everybody is in favour of “pro-
poor growth”. The concept, like its increasingly popular and more
recent variant “shared growth”, captures the idea that the quality
of growth, as well as the quantity, matters for poverty reduction.
But the concept means very different things to different people.
The World Bank and international development agencies favour an
absolute definition of pro-poor growth. What matters in this defini-
tion is not whether the incomes of poor people are rising in relation
to average income, but how fast their incomes are rising. Pro-poor
growth on this definition can be consistent with rising inequality,
even in countries already marked by extreme inequalities.
The progressive definition of pro-poor growth adopted in this
Report focuses on the relative position of poor people. It highlights
the potential for small distributional shifts to produce major gains
for poverty reduction.
Are these just semantic differences? Or do they have a direct rel-
evance for human development? The differences can be overplayed:
all parties in the debate favour rapid poverty reduction. By extension,
nobody argues that low levels of inequality are inherently good for
poverty reduction. If they were, low-growth, low-inequality (a Gini
coefficient of about 36 throughout the 1990s) Benin would be outper-
forming China. However, two important issues are at stake, both con-
nected to the balance between economic growth and distribution.
The first issue is one of social justice. In the absolute definition
distribution-neutral growth is pro-poor: any growth that increases
the income of the poor can be deemed pro-poor. It is difficult to
square this with basic ideas of social justice. If everybody in Brazil
shared in increments to growth on the current distribution pattern,
the richest 20% would receive 85 cents of every $1. The poorest
20% would receive 3 cents. Everybody—including the poor—is bet-
ter off, so growth might be deemed pro-poor. But if more weight is
attached to the well-being of poor people, that distribution pattern is
not consistent with basic principles of fairness and social justice.
The second, related concern is about the conversion of growth
into poverty reduction. If maximizing the impact of growth on pov-
erty reduction is a central policy goal, then distribution matters.
Other things being equal, the bigger the share of any increment
to growth captured by poor people, the faster the rate of poverty
reduction. Increasing their share of additional growth can acceler-
ate the rate at which rising prosperity reduces poverty, while at the
same time raising the overall growth rate.
The progressive growth approach focuses attention on the
structural inequalities that deny poor people and marginalized
groups an opportunity to contribute to and participate in growth
on more equitable terms. It puts redistribution, alongside growth, at
the centre of the policy agenda for reducing extreme poverty.
Source: Kakwani, Khandker and Son 2004; Ravallion 2005; DFID 2004b.
Box 2.3 Pro-poor growth and progressive growth
66 humande velopmentreport2005
2
Ineq
ualit
yan
dhu
man
dev
elop
men
t
share of future growth would rise from 1 cent to 2 cents of every $1. Considering the high degree of inequality in both Brazil and Mexico, this is a modest scenario for pro-poor growth. Even so, the results are striking. For Brazil it shortens the time it takes the median household to cross the poverty line by 19 years. For Mexico it shortens the time by 15 years (see Technicalnote2).
It is sometimes argued that distribu-tion has more relevance for high-inequality middle-income countries than for the low-growth low-income countries that are farthest off track for meeting the MDGs. This is correct in the sense that, as the Brazil and Mexico simu-lations demonstrate, even modest redistribution can produce big results for poverty reduction in high-inequality middle-income countries. But the distribution of growth also matters a great deal for low-income countries.
Sub-Saharan Africa demonstrates the point. One consequence of economic stagnation for the region has been a rise in the growth rate re-quired to achieve the MDG target of halving poverty. Some countries—Ethiopia, Senegal, South Africa and Tanzania among them—need to grow at about 3% per capita a year to reach the target. However, analysis based on household surveys (in countries accounting for 78% of the region’s population) suggests that the weighted average annual growth rate required to achieve the MDG for the region is 5% per capita for 10 years.27 This is in a region where the average an-nual growth per capita for 2000–06 is 1.6%. Even if the current recovery in some countries is sustained, for a large group of countries the MDG growth requirements are implausible.
Does this mean that Sub-Saharan Africa is destined to fail on the MDGs? Not if the region combines a more modest increase in growth with an improved pattern of income distribution.
The point can be demonstrated by reference to Kenya—a country that is unequivocally off track for halving extreme poverty by 2015. If Kenya were to achieve a 1% per capita growth rate on current distribution patterns, it would not halve poverty until 2030. Doubling the share of the poor in future growth even at the 1% per capita growth rate would enable Kenya to halve poverty by 2013, meeting the MDG target. In
other words pro-poor growth would reduce the time horizon for halving poverty by 17 years. The broader point here is that extreme inequality can constrain poverty reduction in low- and middle-income countries for the same reason: the smaller the poor’s share of any increment to income the less efficient growth is as a mechanism for pov-erty reduction. In Viet Nam the ratio of average income growth to poverty reduction is approxi-mately 1:1. For high inequality countries such as Bolivia and Zambia the ratio is about 1:0.5.28 In other words, it takes twice as much growth to achieve the same level of poverty reduction.
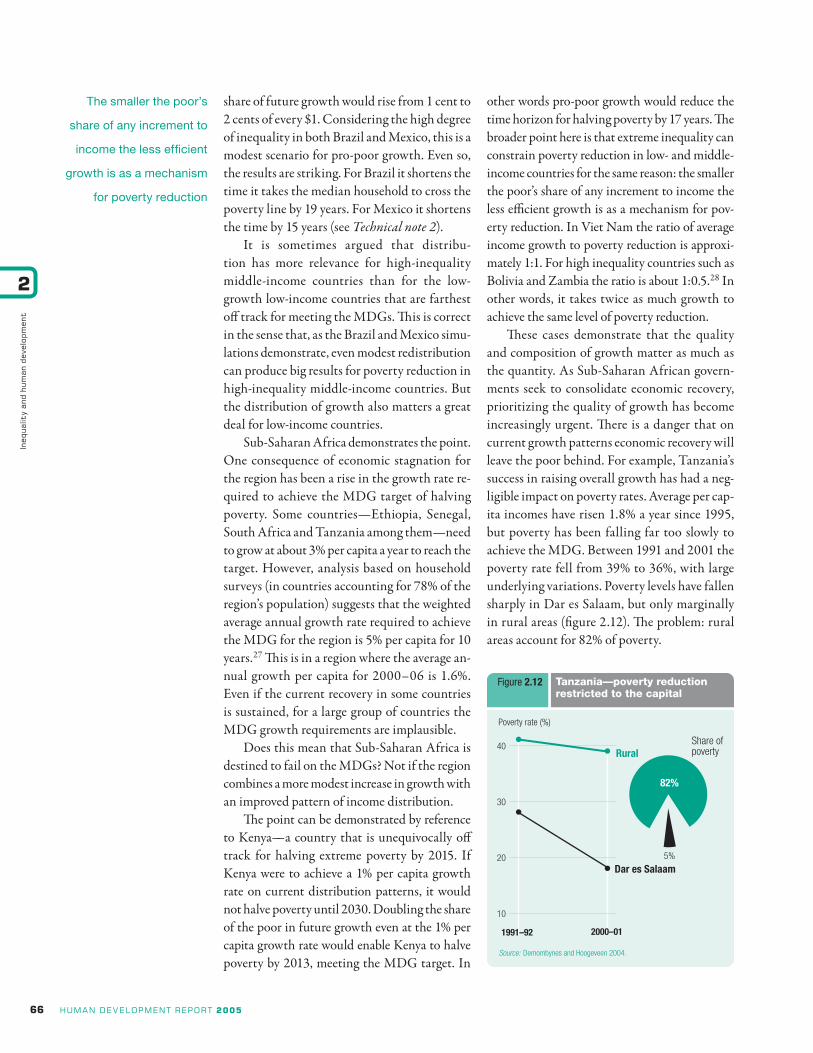
These cases demonstrate that the quality and composition of growth matter as much as the quantity. As Sub-Saharan African govern-ments seek to consolidate economic recovery, prioritizing the quality of growth has become increasingly urgent. There is a danger that on current growth patterns economic recovery will leave the poor behind. For example, Tanzania’s success in raising overall growth has had a neg-ligible impact on poverty rates. Average per cap-ita incomes have risen 1.8% a year since 1995, but poverty has been falling far too slowly to achieve the MDG. Between 1991 and 2001 the poverty rate fell from 39% to 36%, with large underlying variations. Poverty levels have fallen sharply in Dar es Salaam, but only marginally in rural areas (figure 2.12). The problem: rural areas account for 82% of poverty.
The smaller the poor’s
share of any increment to
income the less efficient
growth is as a mechanism
for poverty reduction
humande velopmentreport2005 67
2
Inequalityandhumandevelopm
ent
Across much of Africa the challenge then is not just to accelerate growth, but to ensure that poor people contribute to the growth pro-cess, through increased output and rising pro-ductivity, and capture a bigger share of incre-ments to growth than they do now. For public policy this means far more attention to small-holder farmers; to marginal, rain-fed agricul-tural areas; and to public investments to build the assets of the poor and the infrastructure serving them.
The role of the private sector is also critical for pro-poor growth. Small and medium-size enterprises in particular play a pivotal role—as employers, as suppliers of inputs and as a link to markets. Private firms can contribute to poverty reduction by empowering people, ex-tending choice and providing a broad range of goods and services. In Bangladesh, Grameen-Phone, the country’s largest cellular phone ser-vice provider, operates a rural programme that serves more than 50 million people, enabling microenterprises to operate more efficiently by improving access to market information. Else-where, the absence of microenterprises can re-duce competition, driving up costs of inputs and driving down prices for goods sold by commu-nities in poor or remote areas. The high costs of government regulation and limited access to credit are among the major constraints on small-scale private enterprises’ ability to operate as a more dynamic force for poverty reduction. On average, the cost of starting a company in Sub-Saharan Africa is 224% of average national income, compared with 45% in South Asia and 7% in high-income countries.
Accelerating poverty reduction globally So far, we have looked only at the potential ben-efits of pro-poor growth in accelerating poverty reduction in individual countries. Using the global income distribution model outlined in chapter 1, we scale up this exercise. The model provides an approximation of the global distri-bution of income adjusted for purchasing power parity to take into account price differences across countries. We use the model to simu-late what would happen to the global poverty trends set out in our projection to 2015 if people
living below the poverty line captured a share of future growth that is double their current share—in effect, extending the national pro-poor growth model to the global stage. As in the national exercises, for countries with positive growth trends, we assume that the trend will continue. For countries with negative growth trends we use a positive growth projection based on regional averages for 2000–06.
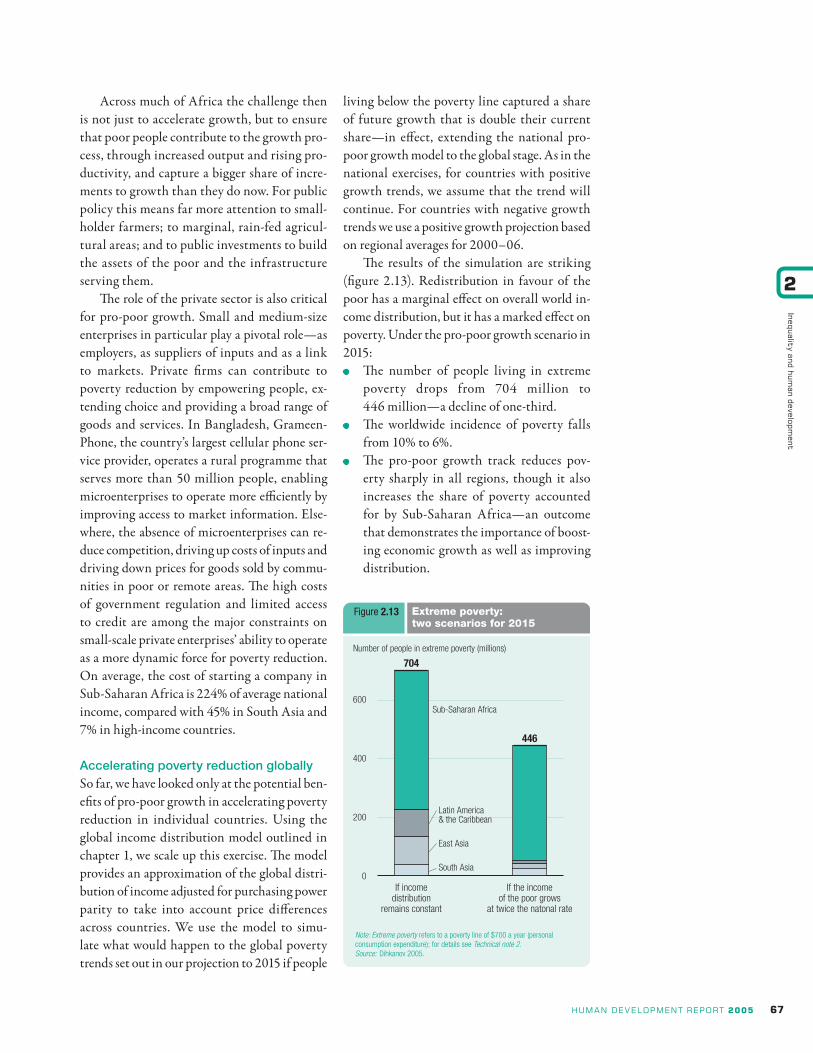
The results of the simulation are striking (figure 2.13). Redistribution in favour of the poor has a marginal effect on overall world in-come distribution, but it has a marked effect on poverty. Under the pro-poor growth scenario in 2015:• The number of people living in extreme
poverty drops from 704 million to 446 million—a decline of one-third.
• The worldwide incidence of poverty falls from 10% to 6%.
• The pro-poor growth track reduces pov-erty sharply in all regions, though it also increases the share of poverty accounted for by Sub-Saharan Africa—an outcome that demonstrates the importance of boost-ing economic growth as well as improving distribution.
68 humande velopmentreport2005
2
Ineq
ualit
yan
dhu
man
dev
elop
men
t
In most developed countries poverty is measured in relative terms
rather than absolute terms. This means that the benchmark for
measuring poverty—and poverty reduction—is usually defined in
relation to average or median income. It follows that when govern-
ments set targets for reducing poverty, they are targeting changes
in distribution that involve narrowing the gap between the poorest
end of the income distribution and the benchmark.
Experience in the United Kingdom highlights some of the prob-
lems associated with reducing relative poverty. At the end of the
1990s the UK government set ambitious targets for reducing the
incidence of child poverty, thus putting the issue of distribution
at the centre of government policy. Child poverty in this context
is defined as living in a household with income below 60% of the
median after housing costs. Fiscal policy and targeting transfers to
the poor have been central planks in measures aimed at achieving
the target. However, labour market developments, including rising
incomes at the top of the distribution, have pulled in the opposite
direction.
At the end of the 1990s the United Kingdom had one of the
highest rates of child poverty in Europe. In 1998 some 4.6 million
children—around one in three—were living below the poverty line.
These high poverty levels, double those at the end of the 1970s,
were a legacy of the 1980s—a decade characterized by a dis-
tinctly pro-rich growth pattern that left poor people behind. At
the end of the 1970s the richest 10% of the population received
21% of total disposable income. Twenty years later it received
28%, nearly as much as for the entire bottom half of the popula-
tion. Average annual incomes for the richest 20% increased at
about 10 times the rate for the poorest 20% (3.8% compared with
0.4%). The United Kingdom’s Gini coefficient climbed from 25 to
35 by the mid-1990s—one of the biggest increases in inequality
in the world.
Two main forces drove the rise in inequality: changes in the
underlying distribution of earnings, and the impact of government
policies that cut taxes for higher earners and lowered benefits for
the poor.
While the rise in inequality stabilized at high levels by the early
1990s, child poverty remained exceptionally high by historic stan-
dards. More than one in four children still lived below the poverty
line during the economic boom of the late 1990s, reflecting a further
rise in the Gini coefficient.
In 1999 ambitious targets were announced for eradicating child
poverty within a generation. The first stage was to reduce child
poverty by a quarter from the 1998 level by 2004–05 and then to
halve it by 2010.
Fiscal redistribution has played a central role in strategies for
meeting the target. Large increases in financial support for families
with children have been introduced. Most of the extra spending
was directed to in-work benefits and tax credits that boosted the
incomes of low-income working families with children. Out of work
income benefits were also increased for families with children.
The gains for the poorest families have been considerable.
The Institute for Fiscal Studies estimates that the incomes of the
poorest fifth have risen by over 20% as a result of the reforms
between 1997 and 2004. While government has played down the
redistributive effect, that effect has been pronounced. Labour
market effects have also had a bearing on progress towards the
targets. As the United Kingdom’s jobless rate fell to historic lows
from the end of the 1990s, wage gains at the lower end of the
spectrum contributed to substantial falls in relative child poverty.
By 2003–04, 600,000 fewer children were living in poverty than
in 1998.
Impressive as the decline has been, prospects for meeting
the target remain uncertain. Another 400,000 children will have to
be lifted out of poverty over the next year to achieve the 2004–05
target. The next target—halving child poverty by 2010—will prove
even more challenging. Why has it been so difficult to achieve the
target even with strong fiscal redistribution?
The answer is because fiscal policy has its limits. While fiscal
transfers have reduced inequality since 1997, labour markets and
other changes appear to be pulling in the other direction. Income
levels are rising at below the median rate among roughly the poor-
est 15%. Meanwhile, the overall level of inequality now remains
effectively unchanged from its 1997 level.
Beyond the labour market, analysis by the Institute for Fiscal
Studies shows that much of the rise in the United Kingdom’s child
poverty rate is accounted for by the changing relative position of
families in the income distribution. For example, the number of
single-parent families and families where both parents are jobless
has risen sharply. Both factors are strongly associated with poverty.
This suggests that meeting the 2010 target will require more redis-
tribution, a change in working and employment patterns among
parents and more fundamental changes to the underlying distribu-
tion of earnings and incomes.
The importance of changing the distribution of earnings can
be demonstrated by reference to a variant of the pro-poor growth
model used elsewhere in this chapter. As noted earlier, the 1980s
was a pro-rich decade, with incomes at the top end of the spectrum
rising far more rapidly than those at the bottom end. In an exercise
carried out for the Human Development Report the Institute for Fis-
cal Studies simulated what would happen to child poverty over the
next 10 years if the distribution pattern of the 1980s were reversed.
So, for example, the income of the poorest 10% was estimated to
grow at 3.7% a year, the average rate of growth experienced by the
richest 10% between 1979 and 1990, while the richest 10% was
estimated to grow at 0.4%, the average growth of the poorest 10%
between 1979 and 1990.
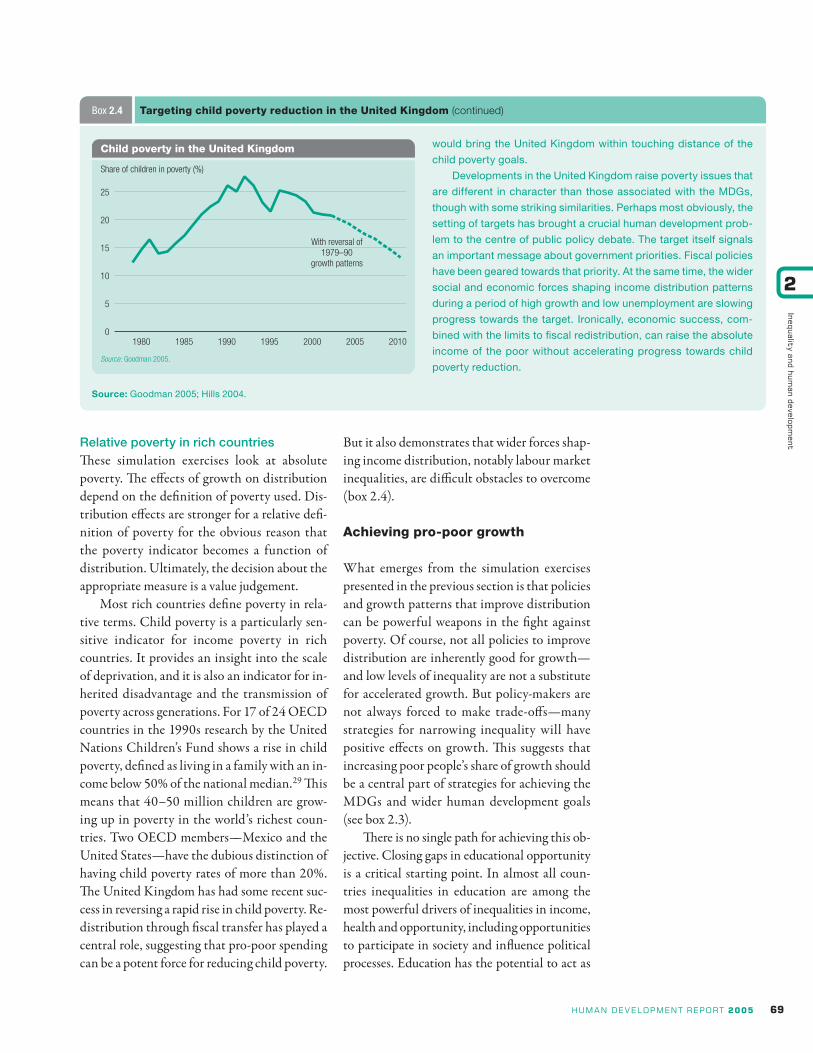
The distributional shift would have cut the incidence of child
poverty from 23% to 17% by 2010 (see figure). While this is still
above the 2010 target, the simulation does not take into account
the potential for fiscal policy to close the gap. In other words, if the
next 10 years did for the poor what the 1980s did for the rich, that
Box 2.4 Targeting child poverty reduction in the United Kingdom
humande velopmentreport2005 69
2
Inequalityandhumandevelopm
entRelative poverty in rich countriesThese simulation exercises look at absolute poverty. The effects of growth on distribution depend on the definition of poverty used. Dis-tribution effects are stronger for a relative defi-nition of poverty for the obvious reason that the poverty indicator becomes a function of distribution. Ultimately, the decision about the appropriate measure is a value judgement.
Most rich countries define poverty in rela-tive terms. Child poverty is a particularly sen-sitive indicator for income poverty in rich countries. It provides an insight into the scale of deprivation, and it is also an indicator for in-herited disadvantage and the transmission of poverty across generations. For 17 of 24 OECD countries in the 1990s research by the United Nations Children’s Fund shows a rise in child poverty, defined as living in a family with an in-come below 50% of the national median.29 This means that 40–50 million children are grow-ing up in poverty in the world’s richest coun-tries. Two OECD members—Mexico and the United States—have the dubious distinction of having child poverty rates of more than 20%. The United Kingdom has had some recent suc-cess in reversing a rapid rise in child poverty. Re-distribution through fiscal transfer has played a central role, suggesting that pro-poor spending can be a potent force for reducing child poverty.
But it also demonstrates that wider forces shap-ing income distribution, notably labour market inequalities, are difficult obstacles to overcome (box 2.4).
Achieving pro-poor growth
What emerges from the simulation exercises presented in the previous section is that policies and growth patterns that improve distribution can be powerful weapons in the fight against poverty. Of course, not all policies to improve distribution are inherently good for growth—and low levels of inequality are not a substitute for accelerated growth. But policy-makers are not always forced to make trade-offs—many strategies for narrowing inequality will have positive effects on growth. This suggests that increasing poor people’s share of growth should be a central part of strategies for achieving the MDGs and wider human development goals (see box 2.3).
There is no single path for achieving this ob-jective. Closing gaps in educational opportunity is a critical starting point. In almost all coun-tries inequalities in education are among the most powerful drivers of inequalities in income, health and opportunity, including opportunities to participate in society and influence political processes. Education has the potential to act as
would bring the United Kingdom within touching distance of the
child poverty goals.
Developments in the United Kingdom raise poverty issues that
are different in character than those associated with the MDGs,
though with some striking similarities. Perhaps most obviously, the
setting of targets has brought a crucial human development prob-
lem to the centre of public policy debate. The target itself signals
an important message about government priorities. Fiscal policies
have been geared towards that priority. At the same time, the wider
social and economic forces shaping income distribution patterns
during a period of high growth and low unemployment are slowing
progress towards the target. Ironically, economic success, com-
bined with the limits to fiscal redistribution, can raise the absolute
income of the poor without accelerating progress towards child
poverty reduction.
Box 2.4 Targeting child poverty reduction in the United Kingdom (continued)
Source: Goodman 2005; Hills 2004.
70 humande velopmentreport2005
2
Ineq
ualit
yan
dhu
man
dev
elop
men
t
an equalizer of opportunity, as well as a force for economic growth and efficiency. But that poten-tial can only be unlocked through public policies that systematically remove the social, economic and cultural barriers facing disadvantaged groups. Similarly, deep inequalities in health and the in-creased vulnerabilities associated with unequal access to healthcare are associated with deep differences in opportunities. Repeat episodes of ill-health undermine productivity, diminish the ability of children to benefit from education and lock households into cycles of poverty. As in the education sector, overcoming these inequalities in health requires public investment to increase the supply of good quality education, and mea-sures to reduce obstacles to demand.
Inequalities in income reflect the distribu-tion of assets and opportunity and the operation of markets. But they are influenced by govern-ment taxation and spending. In many countries fiscal transfers are already narrowing extreme inequalities. In Chile, for example, they nar-row the gap between the income ratios of the richest and the poorest 20% of the population from 20:1 to 10:1. From a human development perspective the fiscal transfers with the highest returns are investments that build capabilities and provide protection during periods of acute vulnerability (box 2.5).
An obvious requirement for meaning-ful fiscal transfers to alleviate poverty is the willingness—and capacity—of the state to
At the end of the eighteenth century the great thinkers of the Eu-
ropean Enlightenment advocated ambitious social programmes to
reduce inequality and poor people’s vulnerability and dependence
on welfare—with a central role for public policy in financing the
needed socially transformative investments. The ideas remain pro-
foundly relevant.
In France Antione-Nicola de Condorcet set out a bold plan for
eradicating all inequality “entailing either poverty, humiliation or de-
pendence”. The plan saw publicly financed education, protection
against sickness and old-age pensions as the key to social progress.
The practical application of this approach in England was set out in
Thomas Paine’s Rights of Man, which advocated a system of uni-
versal insurance financed through taxation. Underpinning these ap-
proaches was the idea that public policy needed to create a sustain-
able exit from poverty by equipping people with the assets, security
and opportunities needed to break out of the cycle of poverty.
Well designed fiscal transfers provide more than temporary relief.
They provide a redistributive mechanism through which investments
in poverty reduction can yield human development and economic
returns far greater than the initial investment. Among the strategies:
• Income transfers to vulnerable groups. Income transfers enable
policy-makers to raise the income of vulnerable groups. Take
South Africa’s old-age pension system, for example. Originally
intended to provide benefits for white people, it has been ex-
tended to elderly black people and to vulnerable families with
children. In 2001 the payment was over 80% of the welfare
budget. Transfers have been instrumental in lowering income
inequality (South Africa’s Gini coefficient fell from 67 in 1991
to 59 in 2000). The payments have enabled households to se-
cure credit and invest in productive activities (hire equipment,
buy improved agricultural inputs), refuting the idea that social
transfers crowd out private initiative. The transfers have also
resulted in tangible health gains. Among black children under
age 5 these transfers have led to an estimated 8 centimetre
increase in height—equivalent to six months’ growth.
• Employment-based transfers. Transfers linked to employment
can provide vulnerable households with security during periods
of extreme stress—in the aftermath of drought, for example.
The Maharashtra Employment Guarantee Scheme is one of
the best known examples. Since the mid-1970s it has provided
agricultural labourers and small farmers with up to 100 days in
paid employment on rural works programmes. Women account
for just under half the beneficiaries. Extending the programme
to the whole of India would cost an estimated 0.5%–1% of
national income in transfers to 40 million rural labourers and
smallholders. If effectively targeted, this would lift most of the
recipients above the poverty line.
• Incentive-based transfers. Governments can use fiscal trans-
fers to promote wider human development goals. In Mexico the
Oportunidades programme targets income transfers to house-
holds in vulnerable municipalities, with eligibility being condi-
tional on children attending school and visiting health clinics.
More than 5 million families are covered, and there is strong
evidence of improvements in school attendance, nutrition and
income status: recent evaluations suggest that more than 60%
of the transfers reach households in the poorest 20% of the
population. The programme currently costs 0.2% of GDP. Low
income is not a barrier to incentive-based transfer. Several very
poor countries have used such systems, for example to increase
girls’ participation in school (see box 1.7 on Bangladesh).
Source: Jones 2004; Lund 2002, 2004; ODI 2004; Case and Deaton 1998; Indiatogether.org 2004; Coady, Grosh and Hoddinott 2004; Coady and Parker 2005; Mexico, Secretaría de Desarrollo Social 2005.
Box 2.5 Public investment in social transformation
humande velopmentreport2005 71
2
Inequalityandhumandevelopm
ent
mobilize revenue. In much of Latin America aversion to taxation restricts this condition. Mexico raises only 13% of GDP in revenue—less than Senegal does. India’s capacity to redis-tribute the benefits of higher growth through the fiscal system is similarly constrained by a tax to revenue ratio of only 10%. After two decades of growth that ratio has not increased.
Fiscal transfer is one mechanism for rais-ing the income of the poor above the level dic-tated by current growth and distribution pat-terns. More broadly, pro-poor growth requires a public investment focus on the markets in which poor people operate. In many countries the challenge is to shift the policy focus to the smallholder producers and to the more marginal areas that account for the bulk of poverty. The problem is that the production of food staples and cash crops in poor areas is constrained by limited access to markets, high transport costs and restricted access to credit. Compounding this problem, poor people—especially poor women—lack the assets, legal entitlements and political power needed to raise productivity and income.
Control over assets is critical. It is some-times argued that there is a potential trade-off in agriculture between greater equity through land reform and greater growth. Here too the trade-offs are more apparent than real. Redis-tributive reforms in agriculture have proven results in reducing poverty, leading to major advances in countries such as China, the Re-public of Korea and Viet Nam. In West Ben-gal, India, agricultural output and incomes rose following tenancy reform and recognition of the land rights of the poor. The contrast with Pakistan is striking. The Pakistan NationalHuman Development Report found that the poorest tenant farmers pay 28% of the value
of their production to landlords, while other tenant farmers pay 8%.30 Cash and crop trans-fers from poor tenant farmers to landlords are a major source of income poverty. Many of the payments are disputed. Yet the poor do not use the legal system to pursue claims. The main rea-son: the median cost of a dispute is 20% higher than the annual average household income of the poorest tenant farmers.
* * *
The central message of this chapter is that dis-tribution should be put at the centre of strat-egies for human development. At a national level this implies that plans for achieving the MDGs, including the Poverty Reduction Strat-egy Papers that set out a framework for coop-eration between developing countries and aid donors, should include measures for redressing extreme inequalities. The MDG agenda needs to go beyond national averages to address the structural inequalities linked to wealth, gender, location and assets that are hampering progress in human development. Governments should expressly commit themselves to targets for reducing inequality and gaps in opportunity, in addition to aggregate MDG targets.
At a global level the international commu-nity needs to act on the commitments made in the Millennium Declaration to overcome ex-treme international inequalities. International action cannot compensate for poor governance and bad national policies. But it can create an enabling environment in which governments committed to human development can succeed. The rest of this Report focuses on three pillars of international cooperation that need reconstruc-tion for human development: international aid, trade and the prevention of violent conflict.
The MDG agenda needs
to go beyond national
averages to address
structural inequalities