Embed Size (px)
Citation preview
Alignment Study Final Report
Delaware Comprehensive Assessment System – Alternate Assessment (DCAS-Alt1)
January 2014
Elizabeth Towles-Reeves, Ph.D. Allison Kerbel, M.P.P.
Ellen Forte, Ph.D.
i
Table of Contents
Executive Summary ................................................................................................................................. 1
Introduction ............................................................................................................................................ 1
Alignment Study Findings and Recommendations by Criterion ................................................................ 2
Criterion 1 ........................................................................................................................................... 2
Criterion 2 ........................................................................................................................................... 2
Criterion 4 ........................................................................................................................................... 2
Criterion 5 ........................................................................................................................................... 3
Criterion 6 ........................................................................................................................................... 3
Criterion 7 ........................................................................................................................................... 4
Criterion 8 ........................................................................................................................................... 4
Alignment Study Final Report .................................................................................................................. 5
Introduction ............................................................................................................................................ 5
Description of the Delaware Comprehensive Assessment System – Alternate Assessment .................. 6
Delaware Content Standards Grade Band Extensions ....................................................................... 6
DCAS-Alt1 Items............................................................................................................................... 7
Administering and Scoring the DCAS-Alt1 ........................................................................................ 7
Participation Guidelines for the DCAS-Alt1 ....................................................................................... 8
Methodology ........................................................................................................................................... 9
The Links for Academic Learning Alignment Model .............................................................................. 9
Rationale for Links for Academic Learning Alignment Approach ....................................................... 9
Application of the LAL Model to the DCAS-Alt1 .................................................................................. 12
Expert Reviewers ........................................................................................................................... 13
Findings by Criterion and Content Area ................................................................................................. 14
Criterion 1 ......................................................................................................................................... 14
Criterion 1 Summary and Recommendations ................................................................................. 23
Criterion 2 ......................................................................................................................................... 23
Criterion 2 Summary and Recommendations ................................................................................. 24
Criterion 3 ......................................................................................................................................... 24
Content Centrality ......................................................................................................................... 24
Performance Centrality .................................................................................................................. 29
Criterion 3 Summary and Recommendations ................................................................................. 32
Criterion 4 ......................................................................................................................................... 33
Categorical Concurrence ................................................................................................................ 34
ii
Range of Knowledge Correspondence ............................................................................................ 34
Balance of Representation ............................................................................................................. 34
Depth of Knowledge ...................................................................................................................... 36
Depth of Knowledge (DOK) of the GBEs and Items in Mathematics ................................................ 44
Depth of Knowledge (DOK) of the GBEs and Items in ELA and Reading ........................................... 45
Depth of Knowledge (DOK) of the Items in Science ........................................................................ 46
Depth of Knowledge (DOK) of the Items in Social Studies ............................................................... 46
Criterion 4 Summary and Recommendations ................................................................................. 47
Criterion 5 ......................................................................................................................................... 48
Differentiation across Grade Levels ................................................................................................ 49
Age Appropriateness ..................................................................................................................... 51
Criterion 5 Summary and Recommendations ................................................................................. 52
Criterion 6 ......................................................................................................................................... 53
Student Independence and Accuracy ............................................................................................. 54
Evidence of New Learning .............................................................................................................. 54
Generalizability .............................................................................................................................. 54
Program Quality Indicators ............................................................................................................ 55
Degree of Inference Coding Form .................................................................................................. 55
Criterion 6 Summary and Recommendations ................................................................................. 57
Criterion 7 ......................................................................................................................................... 57
Criterion 7 Summary and Recommendations ................................................................................. 63
Criterion 8 ......................................................................................................................................... 63
Criterion 8 Summary and Recommendations ................................................................................. 66
Conclusions and Recommendations ...................................................................................................... 67
Criterion 1 ......................................................................................................................................... 67
Criterion 2 ......................................................................................................................................... 67
Criterion 4 ......................................................................................................................................... 68
Criterion 5 ......................................................................................................................................... 68
Criterion 6 ......................................................................................................................................... 68
Criterion 7 ......................................................................................................................................... 69
Criterion 8 ......................................................................................................................................... 69
References ............................................................................................................................................ 71
Glossary ................................................................................................................................................ 73
Appendix A: Training ............................................................................................................................. 74
Appendix B: Alignment Study Agenda .................................................................................................... 89
iii
Appendix C: GBEs and Items Rated “None” for Content Centrality ......................................................... 91
Appendix D: GBEs and Items Rated “None” for Performance Centrality ............................................... 109
Appendix E: Additional Coding Forms .................................................................................................. 125
Appendix F: GBEs and Items Identified as Covering Identical Content .................................................. 135
Appendix G: GBEs and Items Rated Not Age Appropriate ..................................................................... 137
iv
Table of Exhibits
Exhibit 1. Number of Items per Grade Band in Each Content Area ........................................................... 7 Exhibit 2. Crosswalk of Alignment Components and Alignment Methodologies ..................................... 10 Exhibit 3. Overview of LAL Criteria and Expectations for Instruction and Assessment Linked to Grade-Level Content ........................................................................................................................................ 11 Exhibit 4. Alignment Panel Composition ................................................................................................ 13 Exhibit 5. Content and Severe Disabilities Experts Demographic Variables ............................................. 14 Exhibit 6. NCTE Math Standards ............................................................................................................ 15 Exhibit 7. NCTE English Language Arts Standards ................................................................................... 16 Exhibit 8. NCTE Science Standards ......................................................................................................... 16 Exhibit 9. NCTE Social Studies Standards ................................................................................................ 17 Exhibit 10. Number and Percentage of Academic, Non-academic, and Foundational Mathematics GBEs and Items .............................................................................................................................................. 19 Exhibit 11. Distribution of Mathematics GBEs and Items across National Standards ............................... 19 Exhibit 12. Number and Percentage of Academic, Non-academic, and Foundational ELA GBEs and Reading Items ....................................................................................................................................... 20 Exhibit 13. Distribution of ELA GBEs and Reading Items across National Standards ................................ 20 Exhibit 14. Number and Percentage of Academic, Non-academic, and Foundational Science Items ....... 21 Exhibit 15. Distribution of Science Items across National Standards ....................................................... 21 Exhibit 16. Number and Percentage of Academic, Non-academic, and Foundational Social Studies Items.............................................................................................................................................................. 22 Exhibit 17. Distribution of Social Studies Items across National Standards ............................................. 22 Exhibit 18. Content Reference in Each Content Area .............................................................................. 24 Exhibit 19. Content Centrality Codes...................................................................................................... 25 Exhibit 20. Content Centrality of the Mathematics GBEs to the CCSS ..................................................... 26 Exhibit 21. Reasons for “None” for Mathematics GBEs .......................................................................... 26 Exhibit 22. Content Centrality of the Mathematics Items to the GBEs .................................................... 26 Exhibit 23. Reasons for “None” for Mathematics Items .......................................................................... 26 Exhibit 24. Content Centrality of the ELA GBEs to the CCSS .................................................................... 27 Exhibit 25. Reasons for “None” for ELA GBEs ......................................................................................... 27 Exhibit 26. Content Centrality of the Reading Items to the ELA GBEs ..................................................... 27 Exhibit 27. Reasons for “None” for Reading Items ................................................................................. 28 Exhibit 28. Content Centrality of the Science Items to the GBEs ............................................................. 28 Exhibit 29. Reasons for “None” for Science Items .................................................................................. 28 Exhibit 30. Content Centrality of the Social Studies Items to the GBEs ................................................... 29 Exhibit 31. Reasons for “None” for Social Studies Items ......................................................................... 29 Exhibit 32. Performance Centrality Codes .............................................................................................. 30 Exhibit 33. Performance Centrality of the Mathematics GBEs to the CCSS.............................................. 30 Exhibit 34. Performance Centrality of the Mathematics Items to the GBEs ............................................ 31 Exhibit 35. Performance Centrality of the ELA GBEs to the CCSS ............................................................ 31 Exhibit 36. Performance Centrality of the Reading Items to the ELA GBEs .............................................. 31 Exhibit 37. Performance Centrality of the Science Items to the GBEs ..................................................... 32 Exhibit 38. Performance Centrality of the Items to the GBEs: Social Studies ........................................... 32 Exhibit 39. GBE Strands ......................................................................................................................... 35 Exhibit 40. Depth of Knowledge Levels .................................................................................................. 36 Exhibit 41. Categorical Concurrence, Range of Knowledge, Balance of Representation in Mathematics . 36 Exhibit 42. Number of Items per Domain: Mathematics ......................................................................... 37
v
Exhibit 43. Number and Percentage of GBEs Represented per Domain in Mathematics ......................... 38 Exhibit 44. Balance of Representation in Mathematics .......................................................................... 39 Exhibit 45. Categorical Concurrence, Range of Knowledge, Balance of Representation in Reading ......... 39 Exhibit 46. Number of Items per Topic in Reading .................................................................................. 40 Exhibit 47. Number and Percentage of ELA GBEs Represented per Topic in Reading .............................. 40 Exhibit 48. Balance of Representation in Reading .................................................................................. 41 Exhibit 49. Categorical Concurrence, Range of Knowledge, Balance of Representation in Science .......... 41 Exhibit 50. Number of Items per Standard in Science ............................................................................. 41 Exhibit 51. Number and Percentage of GBEs Represented per Standard in Science ................................ 42 Exhibit 52. Balance of Representation in Science ................................................................................... 42 Exhibit 53. Categorical Concurrence, Range of Knowledge, Balance of Representation: Social Studies ... 43 Exhibit 54. Number of Items per Topic: Social Studies ............................................................................ 43 Exhibit 55. Number and Percentage of GBEs Represented per Standard: Social Studies ......................... 43 Exhibit 56. Balance of Representation: Social Studies ............................................................................ 44 Exhibit 57. Depth of Knowledge of GBEs in Mathematics ....................................................................... 44 Exhibit 58. Depth of Knowledge of Items in Mathematics ...................................................................... 44 Exhibit 59. Depth of Knowledge of Items Compared to GBEs in Mathematics ........................................ 45 Exhibit 60. Depth of Knowledge of ELA GBEs ......................................................................................... 45 Exhibit 61. Depth of Knowledge of Reading Items .................................................................................. 45 Exhibit 62: Depth of Knowledge of Reading Items Compared to ELA GBEs ............................................. 45 Exhibit 63. Depth of Knowledge of Science GBEs ................................................................................... 46 Exhibit 64. Depth of Knowledge of Science Items ................................................................................... 46 Exhibit 65. Depth of Knowledge of Items Compared to GBEs in Science ................................................. 46 Exhibit 66. Depth of Knowledge of Social Studies GBEs .......................................................................... 47 Exhibit 67. Depth of Knowledge of Social Studies Items ......................................................................... 47 Exhibit 68. Depth of Knowledge of Items Compared to GBEs in Social Studies ....................................... 47 Exhibit 69. Differentiation across Grade Bands in the Mathematics GBEs............................................... 49 Exhibit 70. Differentiation across Grade Bands in the Mathematics Items .............................................. 49 Exhibit 71. Differentiation across Grade Bands in the ELA GBEs ............................................................. 50 Exhibit 72. Differentiation across Grade Bands in the Reading Items ...................................................... 50 Exhibit 73. Differentiation across Grades in the Science Items ............................................................... 50 Exhibit 74. Differentiation across Grades in the Social Studies Items ...................................................... 51 Exhibit 75. Age Appropriateness of Mathematics Items ......................................................................... 51 Exhibit 76. Age Appropriateness of Reading Items ................................................................................. 51 Exhibit 77. Age Appropriateness of Science Items .................................................................................. 52 Exhibit 78. Age Appropriateness of Items: Social Studies ....................................................................... 52 Exhibit 79. Degree of Inference ............................................................................................................. 56 Exhibit 80. Minimizing Barriers Checklist................................................................................................ 58 Exhibit 81. Communication Levels ......................................................................................................... 59 Exhibit 82. Mathematics GBE Accessibility ............................................................................................. 60 Exhibit 83. Mathematics Item Accessibility ............................................................................................ 60 Exhibit 84. ELA GBE Accessibility ............................................................................................................ 60 Exhibit 85. Reading Item Accessibility .................................................................................................... 60 Exhibit 86. Science Item Accessibility ..................................................................................................... 61 Exhibit 87. Social Studies Item Accessibility ........................................................................................... 61 Exhibit 88. Comparison of Depth of Knowledge and Communication Level across All Grade Bands in Mathematics ......................................................................................................................................... 62

vi
Exhibit 89. Comparison of Depth of Knowledge and Communication Level across All Grade Bands in Reading ................................................................................................................................................. 62 Exhibit 90. Comparison of Depth of Knowledge and Communication Level across All Grades in Science 62 Exhibit 91. Comparison of Depth of Knowledge and Communication Level across All Grades in Social Studies .................................................................................................................................................. 62 Exhibit 92. Program Quality Indicators Checklist .................................................................................... 65 Exhibit 93. Grade Bands Taught by CIS Respondents .............................................................................. 66
1
Executive Summary
Introduction
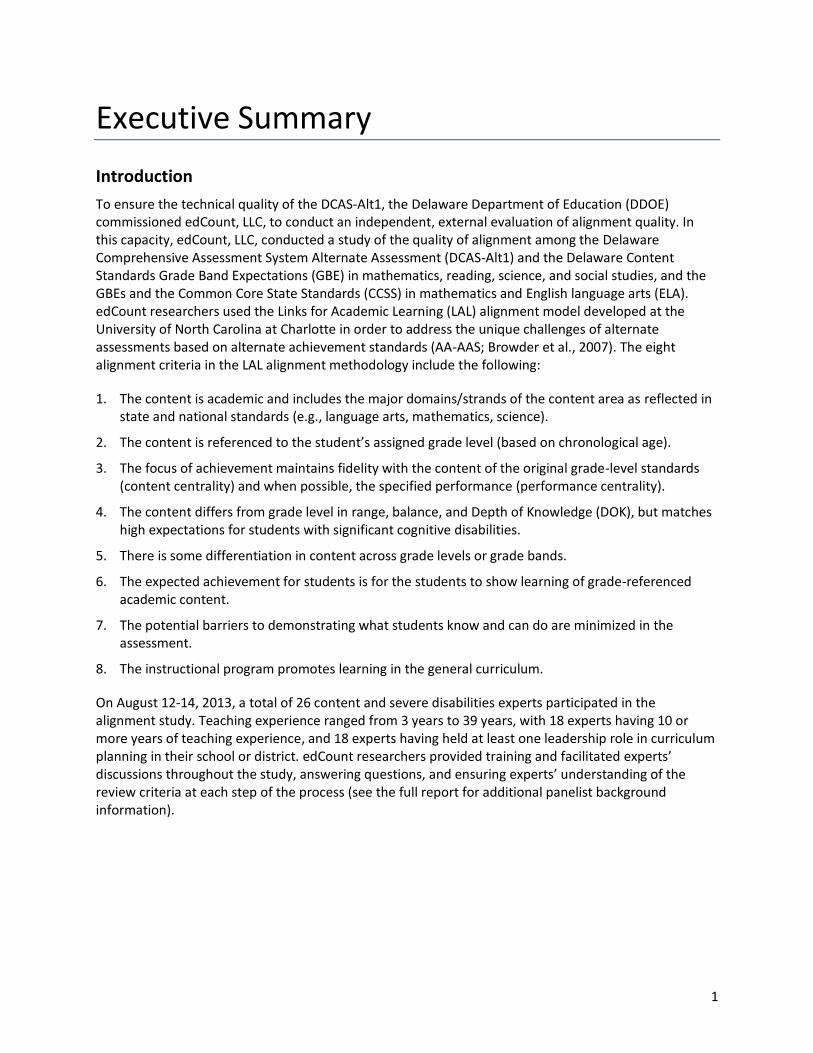
To ensure the technical quality of the DCAS-Alt1, the Delaware Department of Education (DDOE) commissioned edCount, LLC, to conduct an independent, external evaluation of alignment quality. In this capacity, edCount, LLC, conducted a study of the quality of alignment among the Delaware Comprehensive Assessment System Alternate Assessment (DCAS-Alt1) and the Delaware Content Standards Grade Band Expectations (GBE) in mathematics, reading, science, and social studies, and the GBEs and the Common Core State Standards (CCSS) in mathematics and English language arts (ELA). edCount researchers used the Links for Academic Learning (LAL) alignment model developed at the University of North Carolina at Charlotte in order to address the unique challenges of alternate assessments based on alternate achievement standards (AA-AAS; Browder et al., 2007). The eight alignment criteria in the LAL alignment methodology include the following:
1. The content is academic and includes the major domains/strands of the content area as reflected in state and national standards (e.g., language arts, mathematics, science).
2. The content is referenced to the student’s assigned grade level (based on chronological age).
3. The focus of achievement maintains fidelity with the content of the original grade-level standards (content centrality) and when possible, the specified performance (performance centrality).
4. The content differs from grade level in range, balance, and Depth of Knowledge (DOK), but matches high expectations for students with significant cognitive disabilities.
5. There is some differentiation in content across grade levels or grade bands.
6. The expected achievement for students is for the students to show learning of grade-referenced academic content.
7. The potential barriers to demonstrating what students know and can do are minimized in the assessment.
8. The instructional program promotes learning in the general curriculum.
On August 12-14, 2013, a total of 26 content and severe disabilities experts participated in the alignment study. Teaching experience ranged from 3 years to 39 years, with 18 experts having 10 or more years of teaching experience, and 18 experts having held at least one leadership role in curriculum planning in their school or district. edCount researchers provided training and facilitated experts’ discussions throughout the study, answering questions, and ensuring experts’ understanding of the review criteria at each step of the process (see the full report for additional panelist background information).
2
Alignment Study Findings and Recommendations by Criterion
Criterion 1
The content is academic and includes the major domains/strands of the content areas as reflected in the Common Core State Standards (CCSS) and the Grade Band Extensions.
For criterion 1, the expectation is that at least 90% of the content should be academic (p. 14, 73 in the report). The remaining content must be foundational (p. 14, 73), with no more than 10% of a content area reflecting foundational standards or items. Across all grade bands in mathematics, ELA/reading, and science, experts rated at least 90% of the GBEs and items as academic with no more than 10% of a content area reflecting foundational standards or items. The DDOE may want to review the two non-academic and non-foundational GBEs in grades 3-5 in mathematics and the non-academic items in social studies; although all non-academic social studies items were rated as foundational skills. Otherwise, per criterion 1 of the alignment methodology, the content for the DCAS-Alt1 assessment is academic and includes the major domains/strands of the content area as reflected in state and national standards (e.g., language arts, mathematics, science).
Criterion 2
The content is referenced to the student’s assigned grade level (based on chronological age).
The expectation for criterion 2 is met given that across all grade bands and content areas, 100% of the GBEs and items were referenced to grade-level content. No recommendations are presented for consideration.
Criterion 3
The focus of achievement maintains fidelity with the specified content (content centrality) and performance (performance centrality) of the original grade-level standards.
The expectation for content (p. 32, 73) and performance centrality (p. 33, 73) is that 90% or more of the GBEs and items are rated as “all” or “some” (i.e., 10% or fewer rated “none”). The expectations for criterion 3 were not met for many of the GBEs and the items; the most common reason provided for ratings of “none” was “overstretch” (p. 24, 73). The DDOE may wish to revisit the content and performance centrality of the GBEs and the items to more fully align the alternate assessment system and may consider addressing the content and performance centrality issues via multiple avenues: 1) revisit the GBEs with ratings of “none” for content and performance centrality, in coordination with external content experts, to strengthen the relationship between the GBEs and the CCSS; 2) revisit the DCAS-Alt1 items with ratings of “none” for content and performance centrality and replace those items in the assessment with others from the item bank (but alignment of replacement items should also be reviewed); and 3) collaborate with the assessment/item writing vendor to tweak current items to strengthen the content and performance centrality links to the GBEs.
Criterion 4
The content differs from grade level in range, balance, and depth of knowledge (DOK), but matches high expectations set for students with significant cognitive disabilities.
Criterion 4 involves the evaluation of four aspects of alignment: categorical concurrence (p. 34, 73), range of knowledge correspondence (ROK; p. 34, 73), balance of representation (p. 34, 73), and depth of knowledge (DOK; p. 36, 73). The expectation for categorical concurrence is a minimum of six items per
3
strand, with index values of 0.70 or greater indicating acceptable levels of categorical concurrence. The DCAS-Alt1 met this expectation for reading, science, and social studies; mathematics did not meet this expectation.
For range of knowledge, the expectation is that items should show alignment with at least 50% of the standards and GBEs within each strand; index values above 0.70 indicate acceptable range of knowledge correspondence. The index values for mathematics, reading, and social studies did not meet this expectation; the index value for science was 0.75.
For balance of representation, values above 0.60 indicate acceptable balance. The index values in all grade bands and content areas exceeded the 0.60 standard, indicating relatively even representation of the standards and GBEs within the strands assessed.
The expectation for DOK is that an AA-AAS should include a range of DOK levels, with at least 50% or more GBEs or items at or above the corresponding CCSS or GBE, respectively. Both GBEs and items in mathematics, ELA/reading, science, and social studies met the criterion for DOK consistency.
Together, the state’s articulated priorities play out within the range, balance, and depth of knowledge set forth by the assessment system and at a minimum meet the expectations set forth by criterion 4. No recommendations are included for this criterion.
Criterion 5
There is some differentiation in content across grade levels or grade bands.
The expectation for criterion 5 is that the content in the GBEs for mathematics and ELA and the content in the items in all four content areas of mathematics, reading, science, and social studies differ from grade level to grade level as evidenced by different expectations for each grade level. In all content areas, the content experts reported some differentiation of content, including increased breadth and depth, introduction of new content, and the presence of prerequisite skills in lower grades. However, they also reported more than 25% identical content for GBEs and items in all content areas across grades. DDOE may want to consider the percentage of identical content in both the GBEs and the items in all content areas to ensure students are being challenged with high expectations across the years.
Criterion 5 also provides an expectation that the items should be age-appropriate (p. 51, 73). In the content areas of mathematics and social studies, all items were rated as age-appropriate; while some items in reading and science were not rated as age-appropriate. DDOE may want to consider revisions to the reading and science items not rated as age-appropriate.
Criterion 6
The expected achievement for students is for the students to show learning of grade-referenced academic content.
The expectation for criterion 6 is that expected achievement is illustrated through a high degree of inference (i.e., being able to demonstrate student learning through the use of baseline data, requiring independent student work as evidenced by scoring rubrics and PLDs, and having students demonstrate learning across materials, activities, settings, and/or people). While the DCAS-Alt1 does not require evidence of student learning through baseline data or for students to demonstrate learning across materials, activities, settings, and/or people, the DCAS-Alt1 does require accurate and independent
4
responses in order to receive credit and to reach proficiency. In general, these requirements allow stakeholders to make inferences from the DCAS-Alt1 test scores about what students know and can do and satisfies the expectations set forth in criterion 6. The DDOE may wish to consider ways in which to require inclusion of evidence of generalization across people and settings and across materials and activities in the assessment as well as using a baseline/post-test type of model. However, this is not necessary to meet the requirements of criterion 6, especially given the format of the DCAS-Alt1 assessment.
Criterion 7
The potential barriers to demonstrating what students know and can do are minimized in the assessment.
The expectation for criterion 7 is that the assessment is accessible to students with a variety of disabilities, and the assessment includes items accessible to students with a range of communicative competence. The experts reported that students with a variety of disabilities would be able to access the DCAS-Alt1, either through flexibility built into the assessment, or through accommodations provided when necessary. Most GBEs and items were rated as accessible to students at the emerging symbolic or symbolic communication level, with a few at the pre-symbolic level; most items are concentrated at DOK 2 and DOK 3 and in the emerging symbolic and symbolic categories. While the expectation for criterion 7 is met, DDOE may want to consider expanding the accessibility of some GBEs and items in each content area to be more accessible for students at the pre-symbolic communication levels, and, in particular, focus on moving students out of pre-symbolic and into emerging symbolic communication levels through development of communicative competence for these students.
DDOE may also want to conduct a study on the communication levels of the students who participate in the DCAS-Alt1 over the years and monitor student progress. These data will help to ensure that students are making steady progress, and to determine if teachers have any particular professional development needs around the provision of communication strategies and academic language development for students who are pre- and emerging symbolic communicators. The DDOE may also wish to consider reviewing how students with different characteristics score on the DCAS-Alt1. If DDOE chooses to move forward with the National Center and State Collaborative (NCSC) project in which Delaware is a tier II state, the project suggests requesting submission of the Learner Characteristic Inventory for students in the alternate assessment each year. The data on this inventory can be used to track student characteristics and then analyze score results in relation to particular criteria such as communication level, sensory characteristics, etc.
Criterion 8
The instructional program promotes learning in the general curriculum.
The expectation for criterion 8 is that assessment materials and related professional development promote access to the general curriculum, and that the enacted academic curriculum exhibits broad topic coverage with a range of intensity and performance expectations. Overall, the experts reported that the materials and professional development opportunities for the DCAS-Alt1 promoted access to the general curriculum. While the 33% Curriculum Indicators Survey (CIS) participation rate provided a sample of data typical of survey research, the CIS results suggest that the enacted academic curriculum also supports access to the general curriculum. Teachers reported at least some coverage of all topics in all content areas, and a full range of performance expectations in mathematics and ELA. No recommendations are presented for consideration.
5
Alignment Study Final Report
Introduction
The Individuals with Disabilities Education Act of 1997 (IDEA 97) created a national mandate for states to implement alternate assessments as a mechanism to ensure that large-scale educational assessments include students who could not participate in regular state and district assessments, even with accommodations or modifications. The No Child Left Behind Act of 2001 (NCLB) and its ensuing regulations reinforced the requirement that states develop alternate assessments for students with the most significant cognitive disabilities and align these assessments with alternate academic achievement standards designed for those students. States must demonstrate that these alternate assessments based on alternate achievement standards (AA-AAS) are of high technical quality, comparable to expectations for the large-scale assessments used for other students (US Department of Education, 2004). The Alternate Achievement Standards for Students with the Most Significant Cognitive Disabilities Non-Regulatory Guidance (US Department of Education, 2005) notes that, “…alignment with the State's academic content standards means that a State has defined clearly the connection between the instructional content appropriate for non-disabled students and the related knowledge and skills that serve as the basis for a definition of proficient achievement for students with the most significant cognitive disabilities” (p. 27).
Additional direction is included in the “Standards and Assessments Peer Review Guidance: Information and Examples for Meeting Requirements of NCLB” (2007):
Alignment encompasses several dimensions; demonstrating that an assessment system is aligned with a State’s standards requires more than simply determining whether all the items on the assessment can be matched to one or more standards or whether each of the academic content standards can be matched to one or more items in the assessments. Alignment is more than this two-way process. To ensure that its standards and assessments are aligned, a State needs to consider whether the assessments--
Cover the full range of content specified in the State’s academic content standards, meaning that all of the standards are represented legitimately in the assessments; and
Measure both the content (what students know) and the process (what students can do) aspects of the academic content standards; and
Reflect the same degree and pattern of emphasis apparent in the academic content standards (e.g., if the academic content standards place a lot of emphasis on operations then so should the assessments); and
Reflect the full range of cognitive complexity and level of difficulty of the concepts and processes described, and depth represented, in the State’s academic content standards, meaning that the assessments are as demanding as the standards; and
Yield results that represent all achievement levels specified in the State’s academic achievement standards.
In addition to considering each of these aspects of alignment through a systematic development and review process, the State needs to also develop strategies for communicating to its
6
education stakeholders how its standards and assessment are aligned. Parents, educators, and other stakeholders need to know how assessment results are related to content-based expectations in order to understand and use test information effectively (p. 50).
The Delaware Department of Education (DDOE) is gathering and examining validity evidence for the Delaware Comprehensive Assessment System Alternate Assessment (DCAS-Alt1) to support the creation of a technically sound assessment. A critical step in generating evidence for technical quality involves an examination of the degree of alignment among the alternate assessment and the grade level academic content standards to which this assessment is aligned. To ensure the technical quality of the DCAS-Alt1, the DDOE commissioned edCount, LLC, to conduct an independent, external evaluation of alignment quality. In this capacity, edCount, LLC, conducted a study of the quality of alignment among the DCAS-Alt1 and the Grade Band Extensions (GBEs) in mathematics, reading, science, and social studies, and the GBEs and the Common Core State Standards (CCSS) in mathematics and English Language Arts (ELA).
Description of the Delaware Comprehensive Assessment System – Alternate Assessment
The purpose of the DCAS-Alt1 is to:
1) maximize access to the general education curriculum for students with the most significant cognitive disabilities;
2) ensure that all students with disabilities are included in the Delaware’s statewide assessment and accountability systems; and
3) direct instruction in the classroom by providing important data to guide classroom decisions.
The DCAS-Alt1 was designed to measure the performance of a small population of students with the most significant cognitive disabilities (approximately 1% of the total student population) against the Delaware GBEs, aligned to the CCSS. Delaware designed the test to assist parents and service providers with determining the level of academic skill these students have attained up to the point of assessment.
As described in NCLB non-regulatory guidance, “…Beginning with the 2005-2006 school year, States must assess all students in reading/language arts and mathematics in each of grades 3 through 8 and at least once in grades 10 through 12” (US Department of Education, 2005, p. 12). In addition, “Beginning with the 2007-2008 school year, States must assess all students in science… at least once in grades 3 through 5, once in grades 6 through 9, and once in grades 10 through 12” (US Department of Education, 2005, p. 12). The DCAS-Alt1 assesses students in reading and mathematics in grades 2-10, in science in grades 5, 8, and 10, and in social studies in grades 4, 7, and 9.
Delaware Content Standards Grade Band Extensions
The Delaware Content Standards GBEs are the academic, grade level content foundation for the development of the assessment tasks for the DCAS-Alt1. To ensure compliance with the Individuals with Disabilities Education Act (IDEA) of 1997 and the No Child Left Behind Act (NCLB) of 2001 that alternate assessments are linked to grade-level content standards, the DDOE staff and the University of Delaware Center for Disabilities Studies staff prioritized the content important for students with the most significant cognitive disabilities. Development of the GBEs took place in the fall of 2010 (mathematics and ELA) and spring of 2011 (science and social studies). The initial meetings of the development committees were followed by a stakeholder review period; stakeholders included content specialists, family and community members, and severe disabilities specialists, after which the development
7
committees undertook a final review. The GBEs are aligned to grade-level content standards, though at less complex skill levels. They give task writers and teachers the specificity necessary to translate the standards into meaningful assessment tasks and classroom instruction for students with the most significant cognitive disabilities. The GBEs are structured to facilitate navigation, although the terminology used for each content area varies slightly. In mathematics, the standards are grouped by domains, and followed by extensions. In ELA they are grouped by topics, and then by domains, standards, and extensions. In science they are organized by standards, followed by Enduring Understandings (EUs), followed by Grade Level Expectations (GLEs) and extensions. In social studies they are organized by topics, followed by standards and benchmarks, followed by GLEs and extensions.
DCAS-Alt1 Items
Collaborative teams at AIR (the DCAS-Alt1 assessment vendor) wrote the DCAS-Alt1 tasks and items. The teams included experienced assessment item writers with a background in education and content area expertise, and specialists in alternate assessment with experience teaching students with the most significant cognitive disabilities. Senior test development specialists monitored the tasks and item development work, and Delaware special and general education teachers, DDOE staff, editorial staff, bias sensitivity experts, psychometric experts, and specialists in alternate assessment and instruction for students with the most significant cognitive disabilities reviewed them at various stages. The items were field-tested with Delaware students in the 2010-2011 school year in reading and mathematics, and in the 2011-2012 school year in science and social studies.
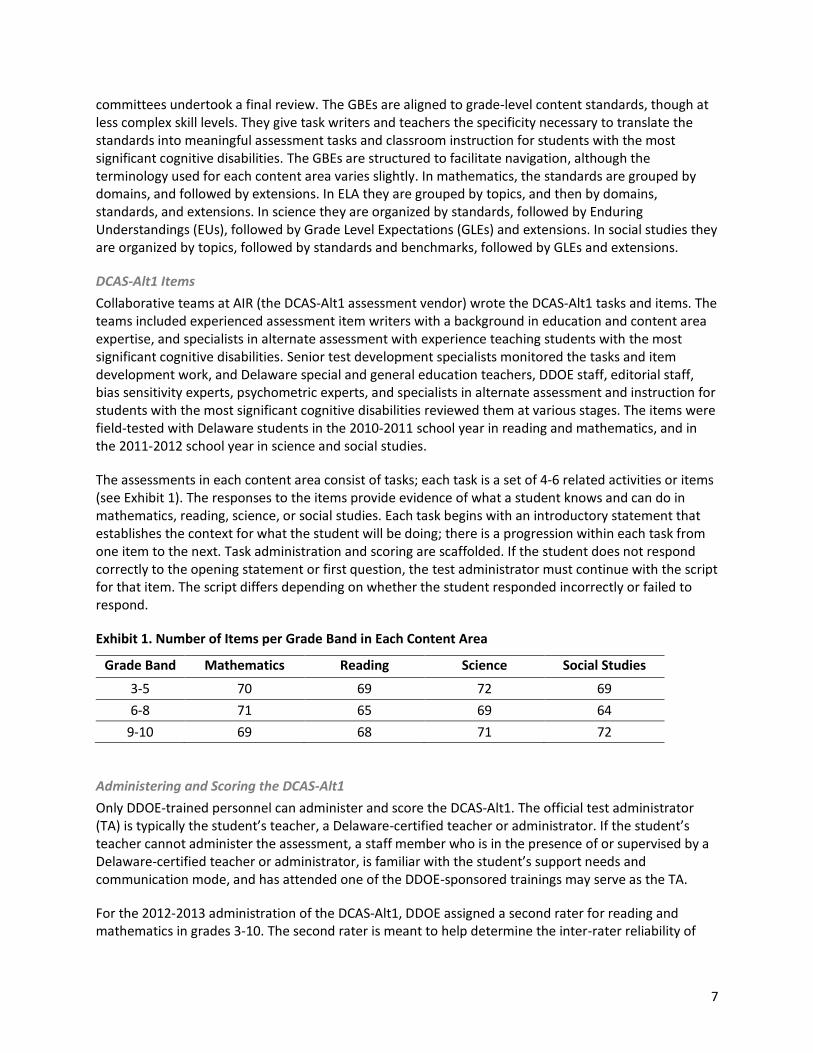
The assessments in each content area consist of tasks; each task is a set of 4-6 related activities or items (see Exhibit 1). The responses to the items provide evidence of what a student knows and can do in mathematics, reading, science, or social studies. Each task begins with an introductory statement that establishes the context for what the student will be doing; there is a progression within each task from one item to the next. Task administration and scoring are scaffolded. If the student does not respond correctly to the opening statement or first question, the test administrator must continue with the script for that item. The script differs depending on whether the student responded incorrectly or failed to respond.
Exhibit 1. Number of Items per Grade Band in Each Content Area
Grade Band Mathematics Reading Science Social Studies
3-5 70 69 72 69
6-8 71 65 69 64
9-10 69 68 71 72
Administering and Scoring the DCAS-Alt1
Only DDOE-trained personnel can administer and score the DCAS-Alt1. The official test administrator (TA) is typically the student’s teacher, a Delaware-certified teacher or administrator. If the student’s teacher cannot administer the assessment, a staff member who is in the presence of or supervised by a Delaware-certified teacher or administrator, is familiar with the student’s support needs and communication mode, and has attended one of the DDOE-sponsored trainings may serve as the TA.
For the 2012-2013 administration of the DCAS-Alt1, DDOE assigned a second rater for reading and mathematics in grades 3-10. The second rater is meant to help determine the inter-rater reliability of
8
the assessment. Second raters can be other TAs, administrators, or special education coordinators; they observe while the TA presents the assessment for a student for DCAS-Alt1. The second rater must complete a paper score form specifically designed for second raters, verify the accuracy of information entered, and under no circumstances should the second rater discuss the scores with the TA. Both score results are entered electronically in the Score Entry Interface (SEI). The TA’s score is used for reporting purposes, while the second rater’s score is used for internal information and verification.
Participation Guidelines for the DCAS-Alt1
In order to participate in the DCAS-Alt1, a student’s Individualized Education Program (IEP) team must determine whether that student is eligible on the basis of the criteria set by the Participation Guidelines:
Criterion #1 Evidence of Significant Cognitive Disabilities: student’s level of cognitive skills and adaptive behavior is such that extensive modifications are required in order to access the general curriculum.
Criterion #2 Intensity of Instruction: the student requires extensive direct instruction and/or extensive supports to accomplish the application and transfer of skills to school, home, work, and community environments.
Criterion #3 Curricular Outcomes: the student requires extensively modified instruction focusing on a less complex application of skills in order to address the Extensions to the Common Core Standards.
Criterion #4 Exclusions: the decision to include a student in the DCAS-Alt1 is not based on the following:
o Existence of an IEP
o Specific categorical label
o Educational placement
o English language learner status
o Socioeconomic status
o Excessive or extended absences
o Disruptive behavior
o Student’s reading level
o The expectation that the student will not perform well on the DCAS
If the IEP team determines that the student meets all the criteria for assessment with the DCAS-Alt1, the team must document this finding within the student’s IEP. According to the DCAS-Alt1 Test Administration Manual, “eligibility decisions should be made on an individual basis according to the eligibility criteria and should not be based on statistics related to the tested population of the school or district” (p. 10).
9
Methodology
The Links for Academic Learning Alignment Model
Non-regulatory guidance has specified that alternate assessments “should be clearly related to grade level content, although it may be restricted in scope or complexity or take the form of introductory or prerequisite skills” (US Department of Education, 2005, p. 26).
As stated in this regulation, there should be a clear link to the content standards for the grade in which the student is enrolled. While this gives states flexibility in determining the scope and breadth of content of alternate assessments, it does not exempt states from designing assessments that measure an academic domain with interpretable results and accurately reflecting what the student knows and can do within that academic domain. For this reason, the authors of the LAL model believe that the investigation of alignment between academic content, academic performance, alternate assessments, and instructional practices and resources should be as strenuous as those used for the assessment of students in the general population. In contrast, it is also expected there would be some differences in the depth, breadth or complexity of content addressed when the achievement target is an alternative to grade level achievement. Because of the unique characteristics and needs of students with significant cognitive disabilities (e.g., testing formats and instructional practices), additional alignment criteria also need to be considered for alternate assessments (Flowers, et al., 2007, p. 93).
Rationale for Links for Academic Learning Alignment Approach
To ensure a comprehensive review of alignment for the DCAS-Alt1, researchers used the Links for Academic Learning (LAL) alignment model. A collaboration of content experts, special educators, and measurement experts at the University of North Carolina at Charlotte (UNCC) developed the LAL model in order to address the unique challenges of AA-AAS (Browder et al., 2007). In developing the LAL model, the team of researchers at UNCC first considered the policy and practice requirements for evaluating alignment quality for AA-AAS (Flowers et al., 2007). Namely, these assessments must:
be aligned with the state’s academic content standards;
promote access to the general curriculum; and
reflect the highest achievement standards possible.
With these policy and practice requirements in mind, UNCC researchers analyzed the alignment methods most often used for evaluations involving general assessments (Flowers et al., 2007). Although there were many common themes among these methods, none of the methods used for evaluations for general assessments provided a comprehensive set of criteria that would allow evaluators to address all three of the policy and practice requirements noted above. Given the lack of comprehensive criteria for evaluation, UNCC researchers developed the LAL alignment methodology specifically for AA-AAS.
10
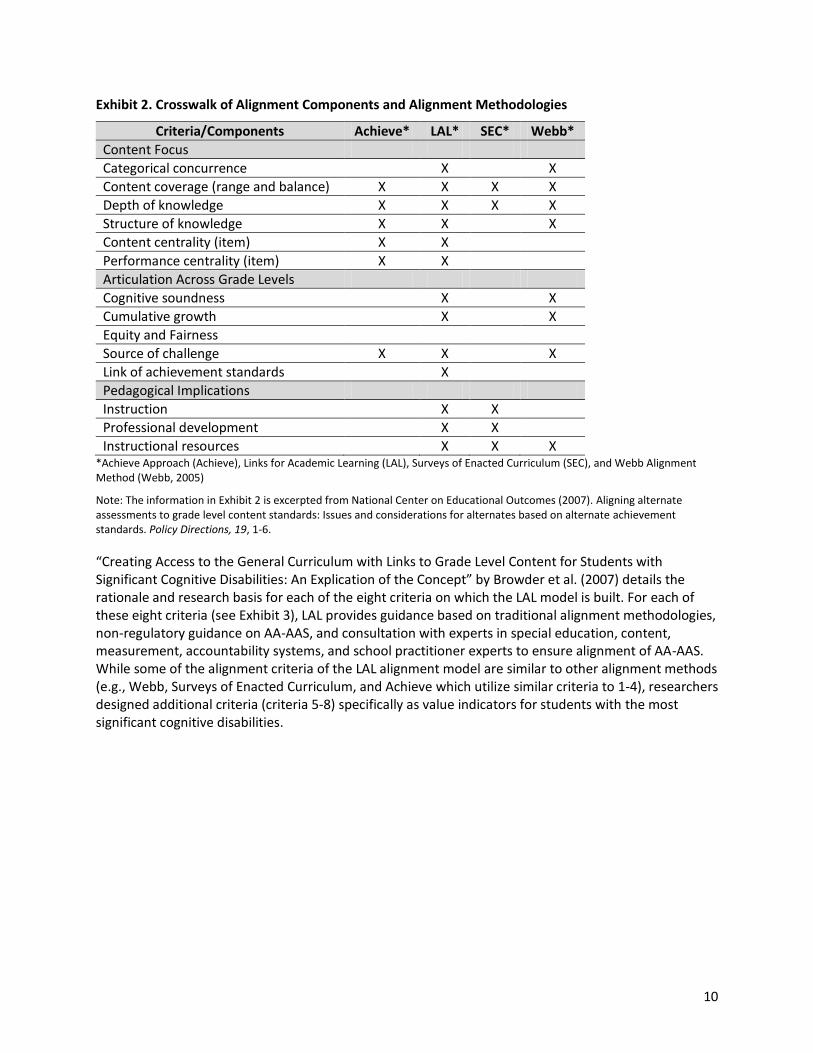
Exhibit 2. Crosswalk of Alignment Components and Alignment Methodologies
Criteria/Components Achieve* LAL* SEC* Webb*
Content Focus
Categorical concurrence X X
Content coverage (range and balance) X X X X
Depth of knowledge X X X X
Structure of knowledge X X X
Content centrality (item) X X
Performance centrality (item) X X
Articulation Across Grade Levels
Cognitive soundness X X
Cumulative growth X X
Equity and Fairness
Source of challenge X X X
Link of achievement standards X
Pedagogical Implications
Instruction X X
Professional development X X
Instructional resources X X X *Achieve Approach (Achieve), Links for Academic Learning (LAL), Surveys of Enacted Curriculum (SEC), and Webb Alignment Method (Webb, 2005)
Note: The information in Exhibit 2 is excerpted from National Center on Educational Outcomes (2007). Aligning alternate assessments to grade level content standards: Issues and considerations for alternates based on alternate achievement standards. Policy Directions, 19, 1-6.
“Creating Access to the General Curriculum with Links to Grade Level Content for Students with Significant Cognitive Disabilities: An Explication of the Concept” by Browder et al. (2007) details the rationale and research basis for each of the eight criteria on which the LAL model is built. For each of these eight criteria (see Exhibit 3), LAL provides guidance based on traditional alignment methodologies, non-regulatory guidance on AA-AAS, and consultation with experts in special education, content, measurement, accountability systems, and school practitioner experts to ensure alignment of AA-AAS. While some of the alignment criteria of the LAL alignment model are similar to other alignment methods (e.g., Webb, Surveys of Enacted Curriculum, and Achieve which utilize similar criteria to 1-4), researchers designed additional criteria (criteria 5-8) specifically as value indicators for students with the most significant cognitive disabilities.
11
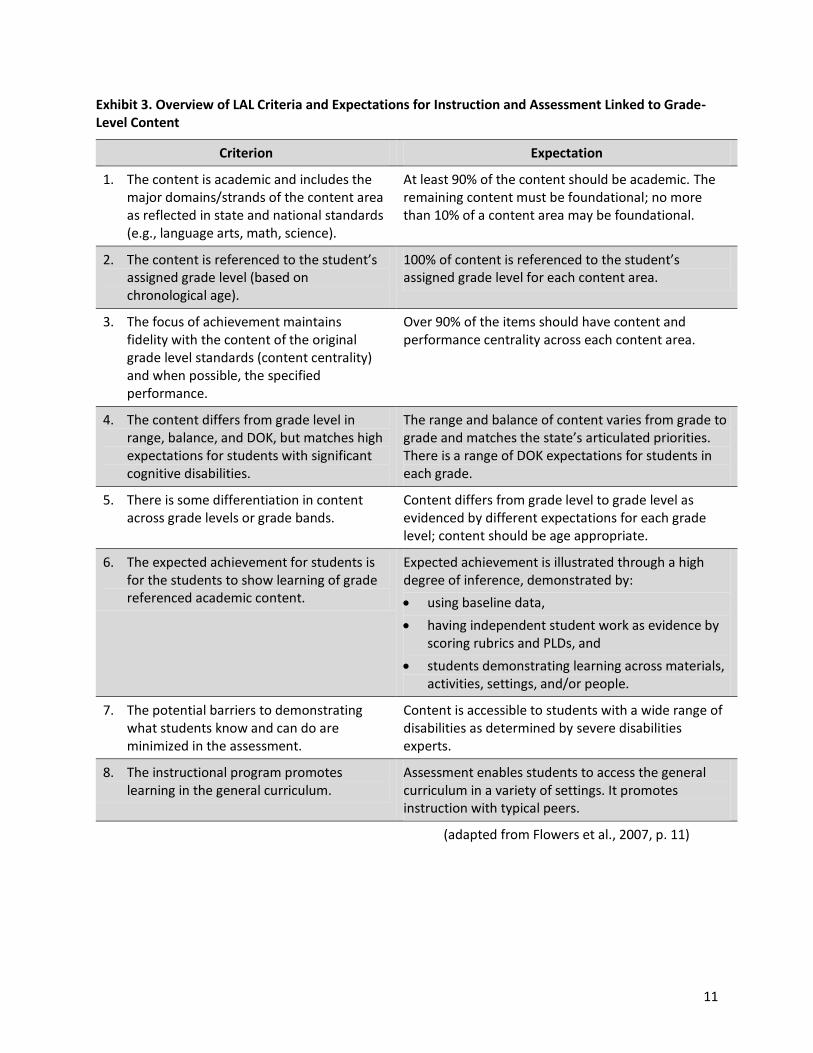
Exhibit 3. Overview of LAL Criteria and Expectations for Instruction and Assessment Linked to Grade-Level Content
Criterion Expectation
1. The content is academic and includes the major domains/strands of the content area as reflected in state and national standards (e.g., language arts, math, science).
At least 90% of the content should be academic. The remaining content must be foundational; no more than 10% of a content area may be foundational.
2. The content is referenced to the student’s assigned grade level (based on chronological age).
100% of content is referenced to the student’s assigned grade level for each content area.
3. The focus of achievement maintains fidelity with the content of the original grade level standards (content centrality) and when possible, the specified performance.
Over 90% of the items should have content and performance centrality across each content area.
4. The content differs from grade level in range, balance, and DOK, but matches high expectations for students with significant cognitive disabilities.
The range and balance of content varies from grade to grade and matches the state’s articulated priorities. There is a range of DOK expectations for students in each grade.
5. There is some differentiation in content across grade levels or grade bands.
Content differs from grade level to grade level as evidenced by different expectations for each grade level; content should be age appropriate.
6. The expected achievement for students is for the students to show learning of grade referenced academic content.
Expected achievement is illustrated through a high degree of inference, demonstrated by:
using baseline data,
having independent student work as evidence by scoring rubrics and PLDs, and
students demonstrating learning across materials, activities, settings, and/or people.
7. The potential barriers to demonstrating what students know and can do are minimized in the assessment.
Content is accessible to students with a wide range of disabilities as determined by severe disabilities experts.
8. The instructional program promotes learning in the general curriculum.
Assessment enables students to access the general curriculum in a variety of settings. It promotes instruction with typical peers.
(adapted from Flowers et al., 2007, p. 11)
12
The basic premises of the LAL method include the following expectations for AA-AAS (adapted from Flowers et al, 2007):
The assessments must be linked to grade-level content standards, perhaps via extended standards;
The target for achievement must be academic content (e.g., language arts, mathematics, science) that is referenced to the student’s assigned grade based on chronological age;
Functional activities and materials may be used to promote understanding, but the target skills for student achievement are academically focused;
Some prioritization of the content will occur in setting this academic expectation, but it should reflect the major domains of the curricular area (e.g., strands of mathematics) and have fidelity with this content and how it is typically taught in general education;
The alternate expectation for achievement may focus on foundational skills or some partial attainment of the grade level, but students should still have the opportunity to meet high expectations, to demonstrate a range of depth of knowledge, to achieve within their symbolic level, and to show growth across grade levels or grade spans.
LAL is a newer alignment method that has been developed to address the unique nature of AA-AAS and the particular issues inherent to teaching and assessing this student population that may affect alignment. Because these issues are not common in assessing other student populations, they have not been included in other alignment methods intended for general education assessments. For example, this population of students traditionally has not been routinely taught the state’s academic curriculum and their teachers may not have had preparation in teaching the content and progressing the students through the curriculum. In addition, the process of unpacking and making the standards accessible for students who do not have an established communication system may result in assessment tasks and activities that are not academic in nature. The LAL model includes practices to ensure that these issues, which could impact alignment, are systematically examined. Steps in the LAL also attend to whether the content standards and items are in fact academic, whether the standards are reflected in instruction as well as the assessment, and whether students participating in the DCAS-Alt1 are assessed by a variety of different tasks over the years, rather than the exact same tasks year after year. Thus, the Flowers team developed the LAL method specifically to address the unique nature of AA-AAS and the particular issues inherent to teaching and assessing this student population that are not common in assessing other student populations and may affect alignment. In addition, the LAL model is designed to be flexible enough to work with AA-AAS, which have different formats and may have expectations of linkage to content standards or extended content standards. The team from the UNCC has used the LAL methodology in over thirteen states and provided reports useful for states’ peer review evidence. Further, the edCount, LLC team has used the LAL methodology in five states providing similar reports useful for states’ peer review evidence.
Application of the LAL Model to the DCAS-Alt1
On August 12-14, 2013, a group of Delaware content experts and severe disabilities experts participated in the data collection portion of this alignment study. All experts received intensive training from edCount researchers and DDOE staff on: 1) the DCAS-Alt1 system; 2) the purpose of an alignment study; and 3) the specific criteria and codes they would be using to review the GBEs and items. In addition to providing the initial half-day training on the first day of the study, edCount researchers facilitated experts’ discussions throughout the study, answering questions and ensuring experts’ understanding of
13
the review criteria at each step of the process. The PowerPoint slides from the initial training are included in Appendix A: Training; the agenda is in Appendix B: Alignment Study Agenda.
As outlined in the LAL model, the content experts provided the ratings for some aspects of alignment, while the severe disabilities experts provided the ratings for other aspects of alignment. Experts worked in panels of between two and four content or severe disabilities experts, grouped by grade span. Experts completed each step independently, and at prescribed times throughout the study, the edCount researchers worked with each group to review independent answers and ensure that the group came to consensus before moving forward. edCount researchers collected both the independent coding forms and the master coding form with each group’s consensus ratings recorded on it, and used the consensus data for analysis, and the independent forms to calculate inter-rater reliability (expectation of above 90% in all four content areas; mathematics=95%, ELA/reading=93%, science=92%, social studies=92%). Inter-rater agreement ratings for each criterion are included in the results section for each criterion.
Expert Reviewers
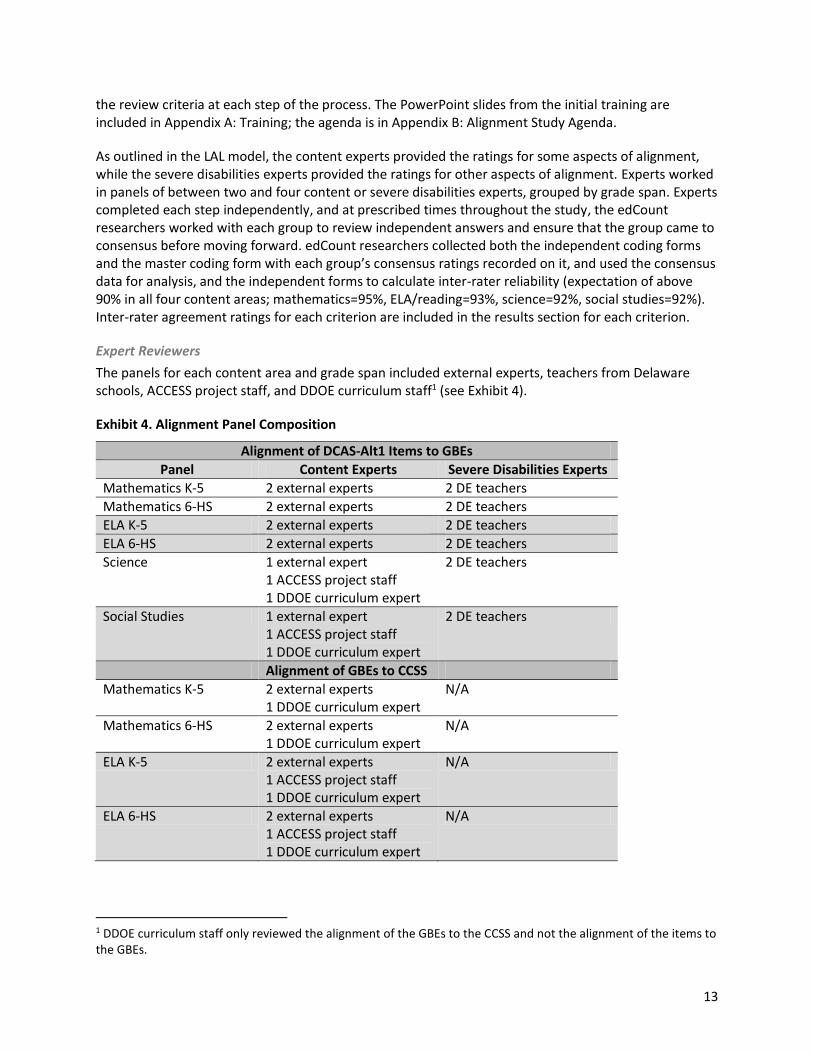
The panels for each content area and grade span included external experts, teachers from Delaware schools, ACCESS project staff, and DDOE curriculum staff1 (see Exhibit 4).
Exhibit 4. Alignment Panel Composition
Alignment of DCAS-Alt1 Items to GBEs
Panel Content Experts Severe Disabilities Experts
Mathematics K-5 2 external experts 2 DE teachers
Mathematics 6-HS 2 external experts 2 DE teachers
ELA K-5 2 external experts 2 DE teachers
ELA 6-HS 2 external experts 2 DE teachers
Science 1 external expert 1 ACCESS project staff 1 DDOE curriculum expert
2 DE teachers
Social Studies 1 external expert 1 ACCESS project staff 1 DDOE curriculum expert
2 DE teachers
Alignment of GBEs to CCSS
Mathematics K-5 2 external experts 1 DDOE curriculum expert
N/A
Mathematics 6-HS 2 external experts 1 DDOE curriculum expert
N/A
ELA K-5 2 external experts 1 ACCESS project staff 1 DDOE curriculum expert
N/A
ELA 6-HS 2 external experts 1 ACCESS project staff 1 DDOE curriculum expert
N/A
1 DDOE curriculum staff only reviewed the alignment of the GBEs to the CCSS and not the alignment of the items to the GBEs.
14
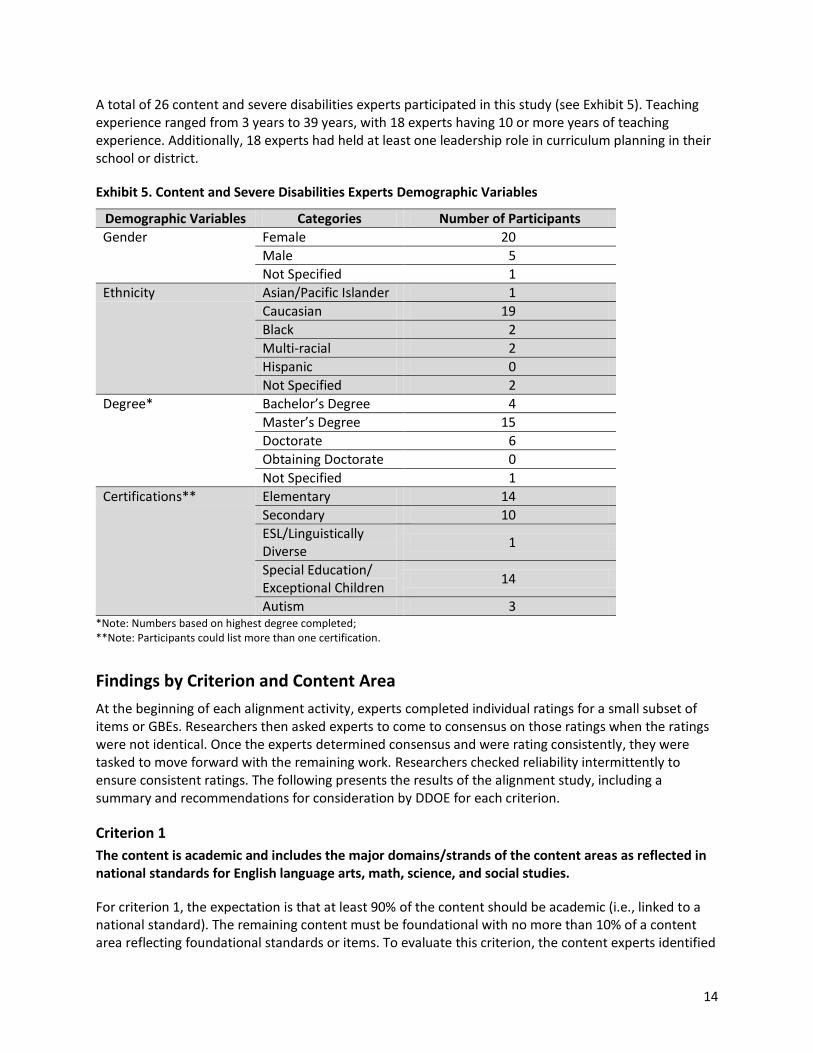
A total of 26 content and severe disabilities experts participated in this study (see Exhibit 5). Teaching experience ranged from 3 years to 39 years, with 18 experts having 10 or more years of teaching experience. Additionally, 18 experts had held at least one leadership role in curriculum planning in their school or district.
Exhibit 5. Content and Severe Disabilities Experts Demographic Variables
Demographic Variables Categories Number of Participants
Gender Female 20
Male 5
Not Specified 1
Ethnicity Asian/Pacific Islander 1
Caucasian 19
Black 2
Multi-racial 2
Hispanic 0
Not Specified 2
Degree* Bachelor’s Degree 4
Master’s Degree 15
Doctorate 6
Obtaining Doctorate 0
Not Specified 1
Certifications** Elementary 14
Secondary 10
ESL/Linguistically Diverse
1
Special Education/ Exceptional Children
14
Autism 3 *Note: Numbers based on highest degree completed; **Note: Participants could list more than one certification.
Findings by Criterion and Content Area
At the beginning of each alignment activity, experts completed individual ratings for a small subset of items or GBEs. Researchers then asked experts to come to consensus on those ratings when the ratings were not identical. Once the experts determined consensus and were rating consistently, they were tasked to move forward with the remaining work. Researchers checked reliability intermittently to ensure consistent ratings. The following presents the results of the alignment study, including a summary and recommendations for consideration by DDOE for each criterion.
Criterion 1
The content is academic and includes the major domains/strands of the content areas as reflected in national standards for English language arts, math, science, and social studies.
For criterion 1, the expectation is that at least 90% of the content should be academic (i.e., linked to a national standard). The remaining content must be foundational with no more than 10% of a content area reflecting foundational standards or items. To evaluate this criterion, the content experts identified
15
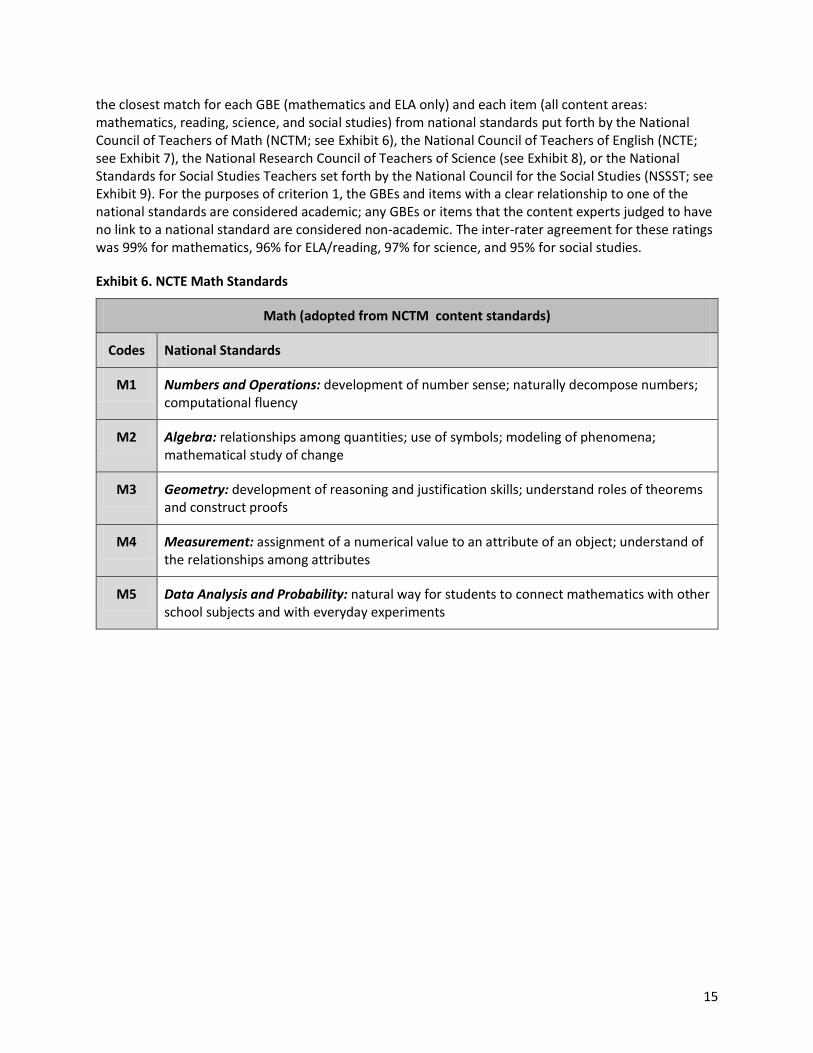
the closest match for each GBE (mathematics and ELA only) and each item (all content areas: mathematics, reading, science, and social studies) from national standards put forth by the National Council of Teachers of Math (NCTM; see Exhibit 6), the National Council of Teachers of English (NCTE; see Exhibit 7), the National Research Council of Teachers of Science (see Exhibit 8), or the National Standards for Social Studies Teachers set forth by the National Council for the Social Studies (NSSST; see Exhibit 9). For the purposes of criterion 1, the GBEs and items with a clear relationship to one of the national standards are considered academic; any GBEs or items that the content experts judged to have no link to a national standard are considered non-academic. The inter-rater agreement for these ratings was 99% for mathematics, 96% for ELA/reading, 97% for science, and 95% for social studies.
Exhibit 6. NCTE Math Standards
Math (adopted from NCTM content standards)
Codes National Standards
M1 Numbers and Operations: development of number sense; naturally decompose numbers; computational fluency
M2 Algebra: relationships among quantities; use of symbols; modeling of phenomena; mathematical study of change
M3 Geometry: development of reasoning and justification skills; understand roles of theorems and construct proofs
M4 Measurement: assignment of a numerical value to an attribute of an object; understand of the relationships among attributes
M5 Data Analysis and Probability: natural way for students to connect mathematics with other school subjects and with everyday experiments
16
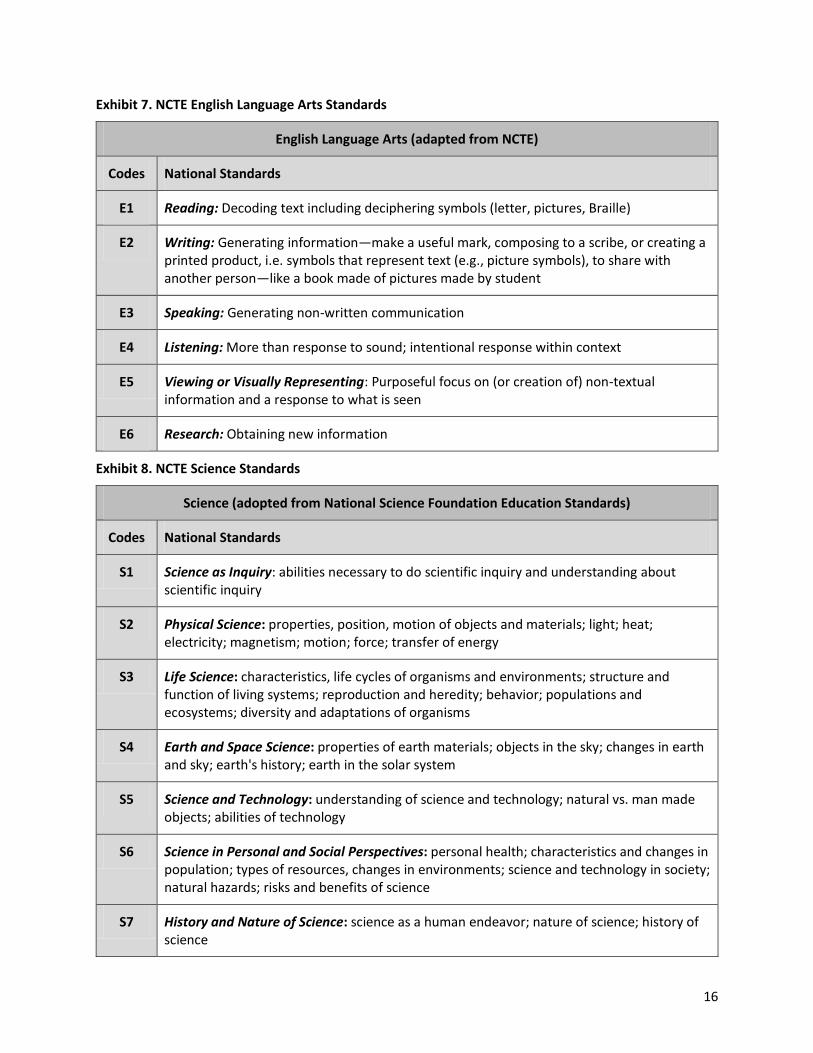
Exhibit 7. NCTE English Language Arts Standards
English Language Arts (adapted from NCTE)
Codes National Standards
E1 Reading: Decoding text including deciphering symbols (letter, pictures, Braille)
E2 Writing: Generating information—make a useful mark, composing to a scribe, or creating a printed product, i.e. symbols that represent text (e.g., picture symbols), to share with another person—like a book made of pictures made by student
E3 Speaking: Generating non-written communication
E4 Listening: More than response to sound; intentional response within context
E5 Viewing or Visually Representing: Purposeful focus on (or creation of) non-textual information and a response to what is seen
E6 Research: Obtaining new information
Exhibit 8. NCTE Science Standards
Science (adopted from National Science Foundation Education Standards)
Codes National Standards
S1 Science as Inquiry: abilities necessary to do scientific inquiry and understanding about scientific inquiry
S2 Physical Science: properties, position, motion of objects and materials; light; heat; electricity; magnetism; motion; force; transfer of energy
S3 Life Science: characteristics, life cycles of organisms and environments; structure and function of living systems; reproduction and heredity; behavior; populations and ecosystems; diversity and adaptations of organisms
S4 Earth and Space Science: properties of earth materials; objects in the sky; changes in earth and sky; earth's history; earth in the solar system
S5 Science and Technology: understanding of science and technology; natural vs. man made objects; abilities of technology
S6 Science in Personal and Social Perspectives: personal health; characteristics and changes in population; types of resources, changes in environments; science and technology in society; natural hazards; risks and benefits of science
S7 History and Nature of Science: science as a human endeavor; nature of science; history of science
17
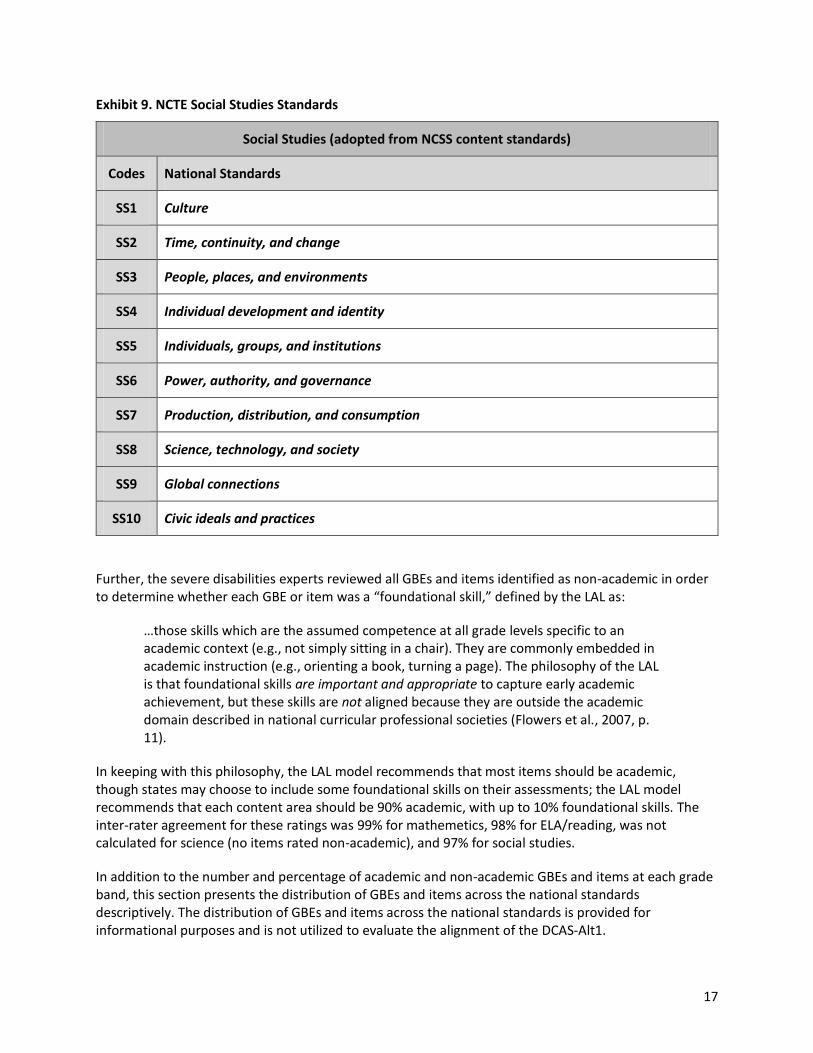
Exhibit 9. NCTE Social Studies Standards
Social Studies (adopted from NCSS content standards)
Codes National Standards
SS1 Culture
SS2 Time, continuity, and change
SS3 People, places, and environments
SS4 Individual development and identity
SS5 Individuals, groups, and institutions
SS6 Power, authority, and governance
SS7 Production, distribution, and consumption
SS8 Science, technology, and society
SS9 Global connections
SS10 Civic ideals and practices
Further, the severe disabilities experts reviewed all GBEs and items identified as non-academic in order to determine whether each GBE or item was a “foundational skill,” defined by the LAL as:
…those skills which are the assumed competence at all grade levels specific to an academic context (e.g., not simply sitting in a chair). They are commonly embedded in academic instruction (e.g., orienting a book, turning a page). The philosophy of the LAL is that foundational skills are important and appropriate to capture early academic achievement, but these skills are not aligned because they are outside the academic domain described in national curricular professional societies (Flowers et al., 2007, p. 11).
In keeping with this philosophy, the LAL model recommends that most items should be academic, though states may choose to include some foundational skills on their assessments; the LAL model recommends that each content area should be 90% academic, with up to 10% foundational skills. The inter-rater agreement for these ratings was 99% for mathemetics, 98% for ELA/reading, was not calculated for science (no items rated non-academic), and 97% for social studies.
In addition to the number and percentage of academic and non-academic GBEs and items at each grade band, this section presents the distribution of GBEs and items across the national standards descriptively. The distribution of GBEs and items across the national standards is provided for informational purposes and is not utilized to evaluate the alignment of the DCAS-Alt1.
18
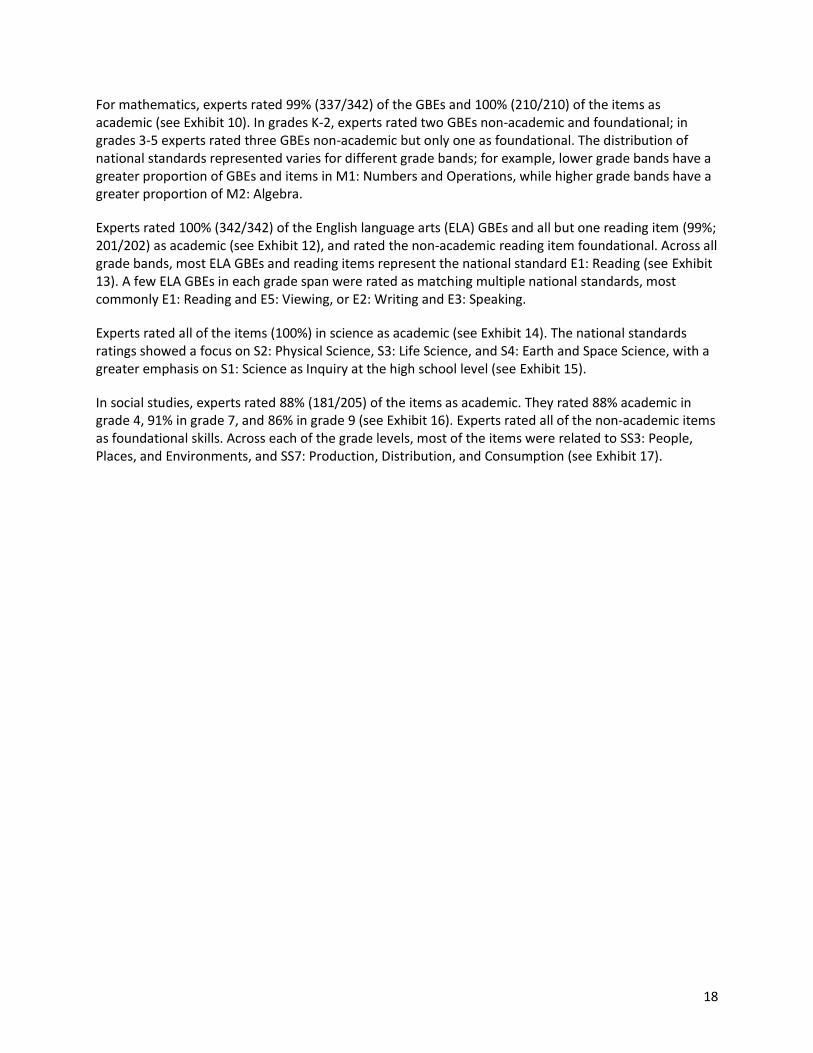
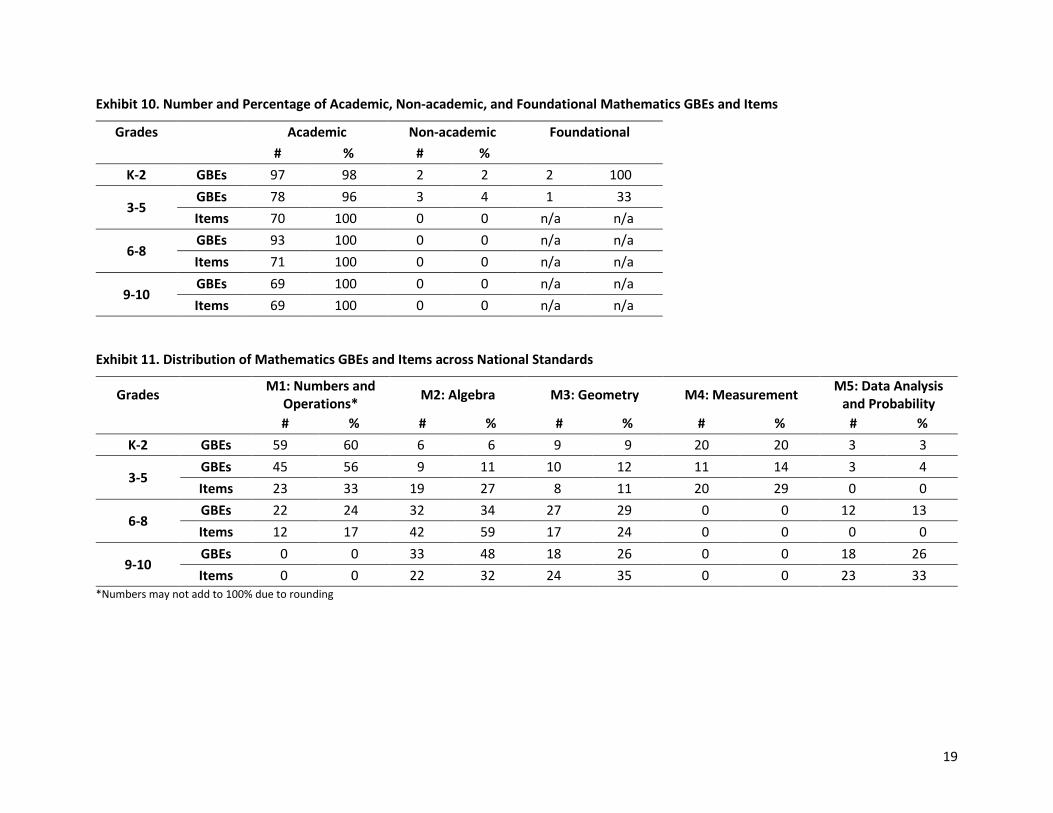
For mathematics, experts rated 99% (337/342) of the GBEs and 100% (210/210) of the items as academic (see Exhibit 10). In grades K-2, experts rated two GBEs non-academic and foundational; in grades 3-5 experts rated three GBEs non-academic but only one as foundational. The distribution of national standards represented varies for different grade bands; for example, lower grade bands have a greater proportion of GBEs and items in M1: Numbers and Operations, while higher grade bands have a greater proportion of M2: Algebra.
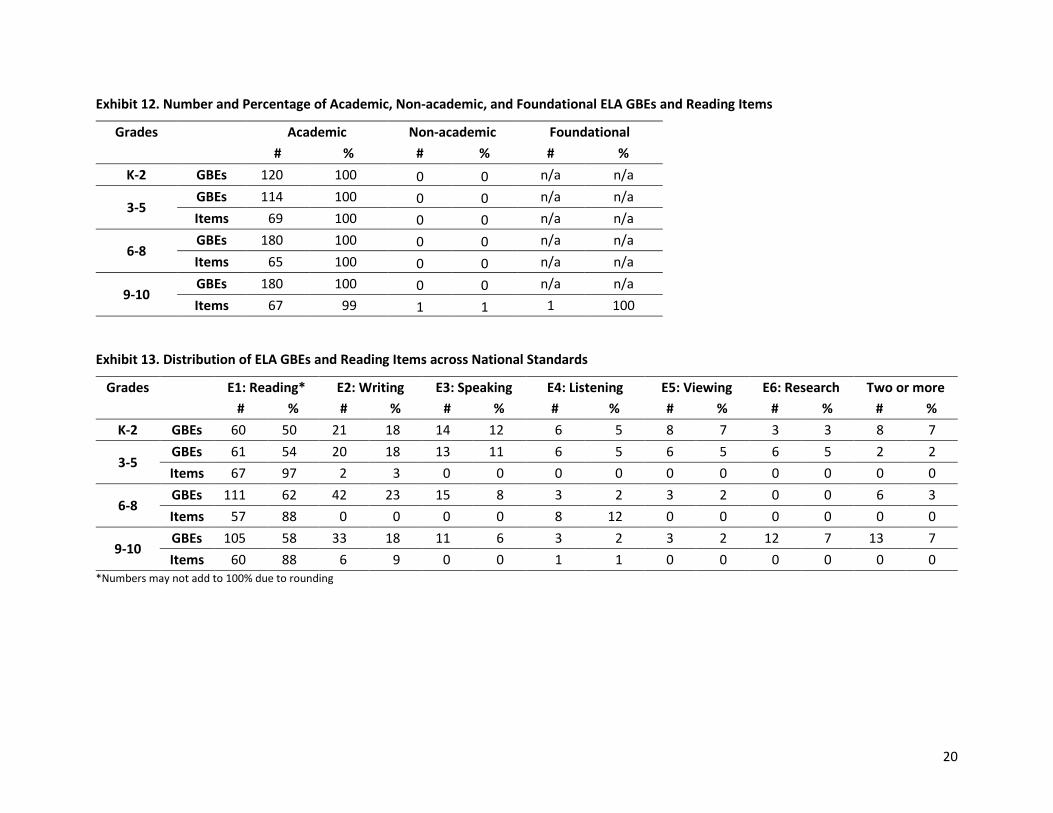
Experts rated 100% (342/342) of the English language arts (ELA) GBEs and all but one reading item (99%; 201/202) as academic (see Exhibit 12), and rated the non-academic reading item foundational. Across all grade bands, most ELA GBEs and reading items represent the national standard E1: Reading (see Exhibit 13). A few ELA GBEs in each grade span were rated as matching multiple national standards, most commonly E1: Reading and E5: Viewing, or E2: Writing and E3: Speaking.
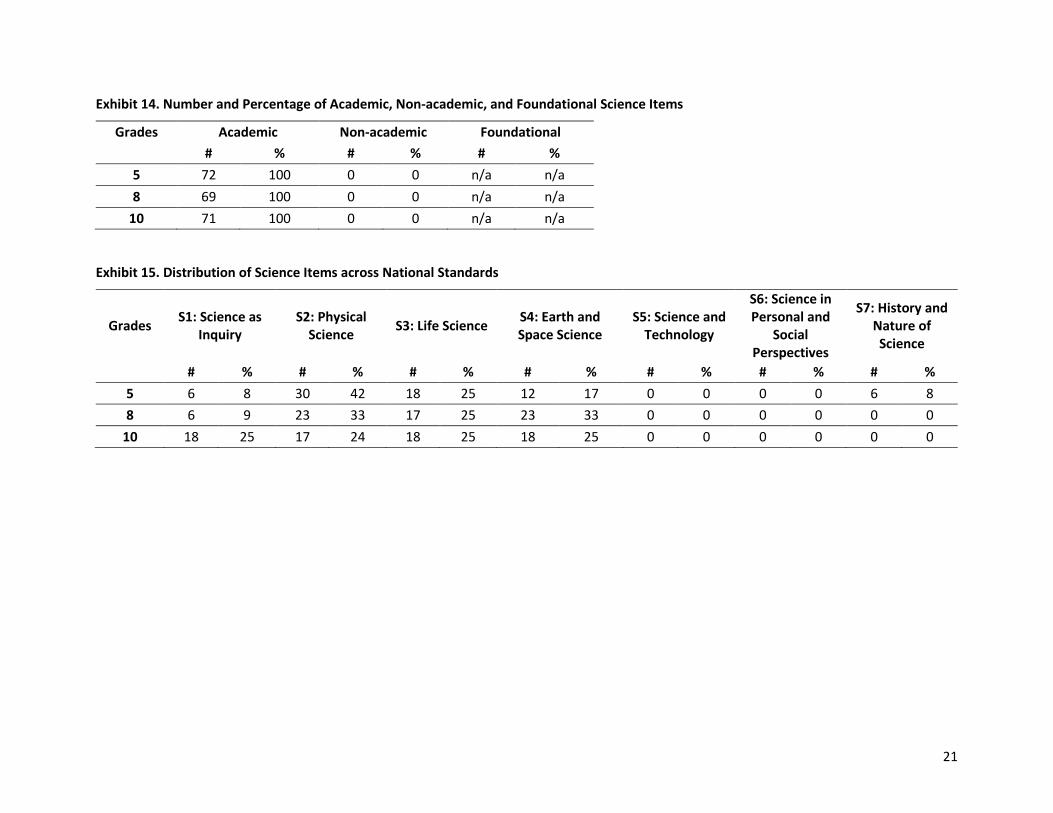
Experts rated all of the items (100%) in science as academic (see Exhibit 14). The national standards ratings showed a focus on S2: Physical Science, S3: Life Science, and S4: Earth and Space Science, with a greater emphasis on S1: Science as Inquiry at the high school level (see Exhibit 15).
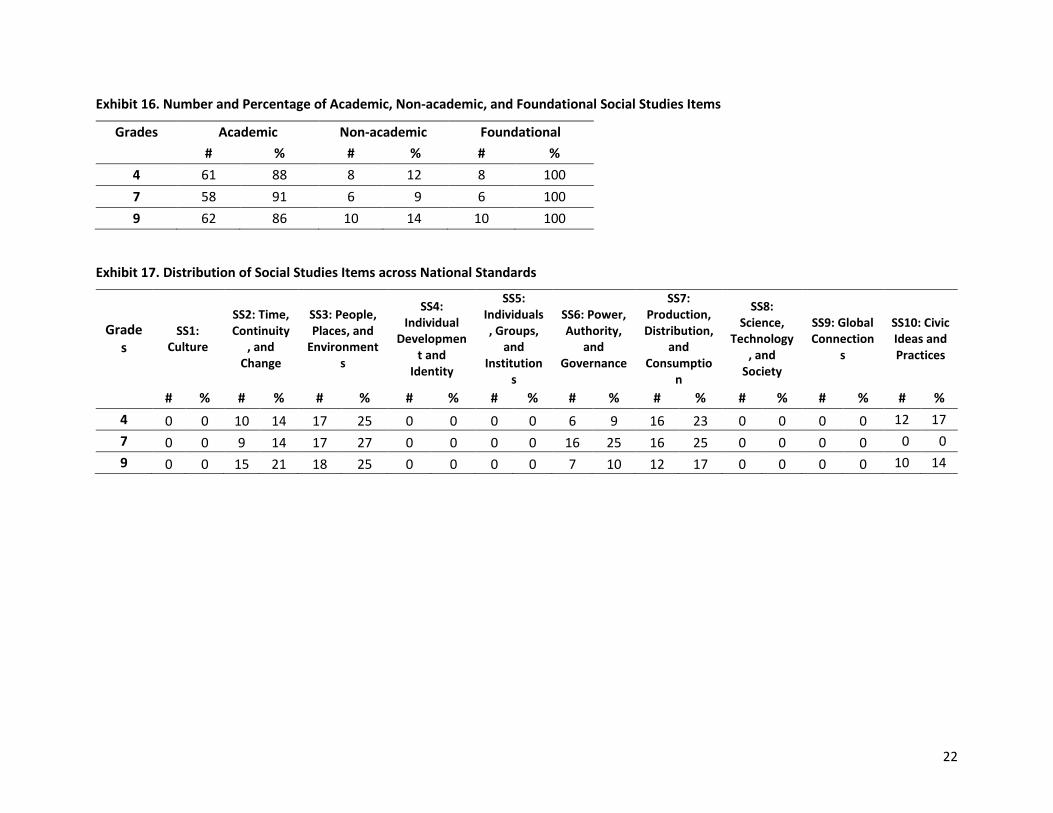
In social studies, experts rated 88% (181/205) of the items as academic. They rated 88% academic in grade 4, 91% in grade 7, and 86% in grade 9 (see Exhibit 16). Experts rated all of the non-academic items as foundational skills. Across each of the grade levels, most of the items were related to SS3: People, Places, and Environments, and SS7: Production, Distribution, and Consumption (see Exhibit 17).
19
Exhibit 10. Number and Percentage of Academic, Non-academic, and Foundational Mathematics GBEs and Items
Grades Academic Non-academic Foundational
# % # %
K-2 GBEs 97 98 2 2 2 100
3-5 GBEs 78 96 3 4 1 33
Items 70 100 0 0 n/a n/a
6-8 GBEs 93 100 0 0 n/a n/a
Items 71 100 0 0 n/a n/a
9-10 GBEs 69 100 0 0 n/a n/a
Items 69 100 0 0 n/a n/a
Exhibit 11. Distribution of Mathematics GBEs and Items across National Standards
Grades M1: Numbers and
Operations* M2: Algebra M3: Geometry M4: Measurement
M5: Data Analysis and Probability
# % # % # % # % # %
K-2 GBEs 59 60 6 6 9 9 20 20 3 3
3-5 GBEs 45 56 9 11 10 12 11 14 3 4
Items 23 33 19 27 8 11 20 29 0 0
6-8 GBEs 22 24 32 34 27 29 0 0 12 13
Items 12 17 42 59 17 24 0 0 0 0
9-10 GBEs 0 0 33 48 18 26 0 0 18 26
Items 0 0 22 32 24 35 0 0 23 33 *Numbers may not add to 100% due to rounding
20
Exhibit 12. Number and Percentage of Academic, Non-academic, and Foundational ELA GBEs and Reading Items
Grades Academic Non-academic Foundational
# % # % # %
K-2 GBEs 120 100 0 0 n/a n/a
3-5 GBEs 114 100 0 0 n/a n/a
Items 69 100 0 0 n/a n/a
6-8 GBEs 180 100 0 0 n/a n/a
Items 65 100 0 0 n/a n/a
9-10 GBEs 180 100 0 0 n/a n/a
Items 67 99 1 1 1 100
Exhibit 13. Distribution of ELA GBEs and Reading Items across National Standards
Grades E1: Reading* E2: Writing E3: Speaking E4: Listening E5: Viewing E6: Research Two or more
# % # % # % # % # % # % # %
K-2 GBEs 60 50 21 18 14 12 6 5 8 7 3 3 8 7
3-5 GBEs 61 54 20 18 13 11 6 5 6 5 6 5 2 2
Items 67 97 2 3 0 0 0 0 0 0 0 0 0 0
6-8 GBEs 111 62 42 23 15 8 3 2 3 2 0 0 6 3
Items 57 88 0 0 0 0 8 12 0 0 0 0 0 0
9-10 GBEs 105 58 33 18 11 6 3 2 3 2 12 7 13 7
Items 60 88 6 9 0 0 1 1 0 0 0 0 0 0 *Numbers may not add to 100% due to rounding
21
Exhibit 14. Number and Percentage of Academic, Non-academic, and Foundational Science Items
Grades Academic Non-academic Foundational
# % # % # %
5 72 100 0 0 n/a n/a
8 69 100 0 0 n/a n/a
10 71 100 0 0 n/a n/a
Exhibit 15. Distribution of Science Items across National Standards
Grades S1: Science as
Inquiry S2: Physical
Science S3: Life Science
S4: Earth and Space Science
S5: Science and Technology
S6: Science in Personal and
Social Perspectives
S7: History and Nature of Science
# % # % # % # % # % # % # %
5 6 8 30 42 18 25 12 17 0 0 0 0 6 8
8 6 9 23 33 17 25 23 33 0 0 0 0 0 0
10 18 25 17 24 18 25 18 25 0 0 0 0 0 0
22
Exhibit 16. Number and Percentage of Academic, Non-academic, and Foundational Social Studies Items
Grades Academic Non-academic Foundational
# % # % # %
4 61 88 8 12 8 100
7 58 91 6 9 6 100
9 62 86 10 14 10 100
Exhibit 17. Distribution of Social Studies Items across National Standards
Grades
SS1: Culture
SS2: Time, Continuity
, and Change
SS3: People, Places, and
Environments
SS4: Individual
Development and
Identity
SS5: Individuals, Groups,
and Institution
s
SS6: Power, Authority,
and Governance
SS7: Production, Distribution,
and Consumptio
n
SS8: Science,
Technology, and
Society
SS9: Global Connection
s
SS10: Civic Ideas and Practices
# % # % # % # % # % # % # % # % # % # %
4 0 0 10 14 17 25 0 0 0 0 6 9 16 23 0 0 0 0 12 17
7 0 0 9 14 17 27 0 0 0 0 16 25 16 25 0 0 0 0 0 0
9 0 0 15 21 18 25 0 0 0 0 7 10 12 17 0 0 0 0 10 14
23
Criterion 1 Summary and Recommendations
For criterion 1, the expectation is that at least 90% of the content should be academic. The remaining content must be foundational with no more than 10% of a content area reflecting foundational standards or items. Across all grade bands in mathematics, ELA/reading, and science, the GBEs and the DCAS-Alt1 items met the criterion of at least 90% academic, with all but two non-academic GBEs and items representing foundational skills. The items in the social studies content area did not meet the expectation of at least 90% academic (88%).
For mathematics, experts rated 99% of the GBEs and 100% of the items as academic. Experts rated 2 GBEs in grades K-2 non-academic, but also rated them as foundational skills. In grades 3-5, experts rated 3 GBEs non-academic, but rated only one of the three GBEs as a foundational skill. Experts rated 100% of the ELA GBEs and all but one reading item in grades 9-10 as academic (98%). They rated the non-academic item as a foundational skill.
Experts rated all of the science items (100%), and 88% of the social studies items across the three grades as academic. They considered all of the non-academic social studies items foundational (8 items in grade 4, 6 in grade 7, and 10 in grade 9).
In summary, the DDOE may want to review the two non-academic and non-foundational GBEs in grades 3-5 in mathematics and the non-academic items in social studies. Otherwise, across all grade bands in mathematics, ELA/reading, and science, experts rated at least 90% of the GBEs and items as academic with no more than 10% of a content area reflecting foundational standards or items. The non-academic items in social studies should be reviewed for academic content unless having a larger subset of foundational skills assessed in this content was a purposeful decision. Then, documentation of that decision should be clear. Per criterion 1 of the alignment methodology, the content for the DCAS-Alt1 assessment is academic and includes the major domains/strands of the content area as reflected in state and national standards (e.g., language arts, math, science).
Criterion 2
The content is referenced to the student’s assigned grade level (based on chronological age).
The expectation for criterion 2 is that 100% of the content is referenced to the student’s assigned grade level in all content areas and grade spans. The second criterion focuses on the intended alignment of the GBEs and the DCAS-Alt1 items to grade-level content. As explained in the LAL manual, “criterion 2 results reflect the state’s purposeful choices in defining the prioritization of … items. Identifying … items as ‘referenced’ to grade level means that the components are organized or labeled by grade level and the term is not intended to imply alignment” (Flowers et al., 2007, p. 22). This criterion does not involve ratings by the content experts or severe disabilities experts so there are no inter-rater agreement ratings.
Across all grades, 100% of the GBEs for mathematics and 100% of the ELA GBEs are referenced to grade-level content. All (100%) of the items in mathematics, reading, science, and social studies are referenced to grade-level content (see Exhibit 18).
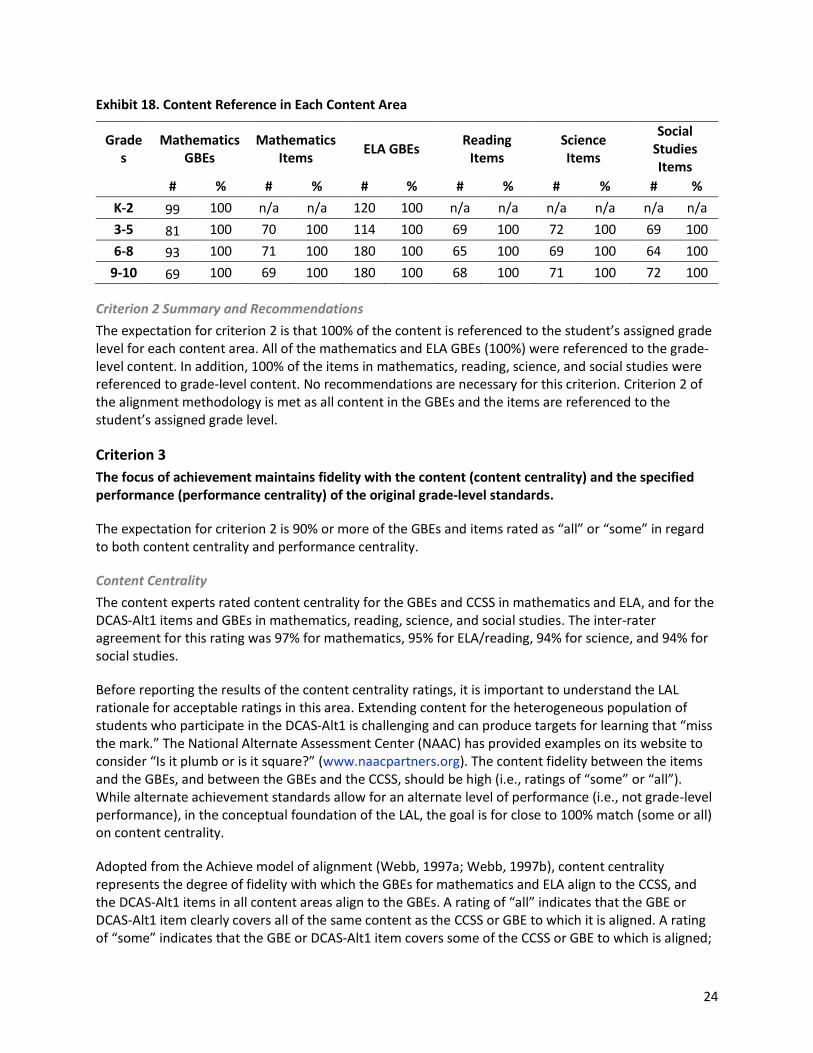
24
Exhibit 18. Content Reference in Each Content Area
Grades
Mathematics GBEs
Mathematics Items
ELA GBEs Reading
Items Science Items
Social Studies Items
# % # % # % # % # % # %
K-2 99 100 n/a n/a 120 100 n/a n/a n/a n/a n/a n/a
3-5 81 100 70 100 114 100 69 100 72 100 69 100
6-8 93 100 71 100 180 100 65 100 69 100 64 100
9-10 69 100 69 100 180 100 68 100 71 100 72 100
Criterion 2 Summary and Recommendations
The expectation for criterion 2 is that 100% of the content is referenced to the student’s assigned grade level for each content area. All of the mathematics and ELA GBEs (100%) were referenced to the grade-level content. In addition, 100% of the items in mathematics, reading, science, and social studies were referenced to grade-level content. No recommendations are necessary for this criterion. Criterion 2 of the alignment methodology is met as all content in the GBEs and the items are referenced to the student’s assigned grade level.
Criterion 3
The focus of achievement maintains fidelity with the content (content centrality) and the specified performance (performance centrality) of the original grade-level standards.
The expectation for criterion 2 is 90% or more of the GBEs and items rated as “all” or “some” in regard to both content centrality and performance centrality.
Content Centrality
The content experts rated content centrality for the GBEs and CCSS in mathematics and ELA, and for the DCAS-Alt1 items and GBEs in mathematics, reading, science, and social studies. The inter-rater agreement for this rating was 97% for mathematics, 95% for ELA/reading, 94% for science, and 94% for social studies.
Before reporting the results of the content centrality ratings, it is important to understand the LAL rationale for acceptable ratings in this area. Extending content for the heterogeneous population of students who participate in the DCAS-Alt1 is challenging and can produce targets for learning that “miss the mark.” The National Alternate Assessment Center (NAAC) has provided examples on its website to consider “Is it plumb or is it square?” (www.naacpartners.org). The content fidelity between the items and the GBEs, and between the GBEs and the CCSS, should be high (i.e., ratings of “some” or “all”). While alternate achievement standards allow for an alternate level of performance (i.e., not grade-level performance), in the conceptual foundation of the LAL, the goal is for close to 100% match (some or all) on content centrality.
Adopted from the Achieve model of alignment (Webb, 1997a; Webb, 1997b), content centrality represents the degree of fidelity with which the GBEs for mathematics and ELA align to the CCSS, and the DCAS-Alt1 items in all content areas align to the GBEs. A rating of “all” indicates that the GBE or DCAS-Alt1 item clearly covers all of the same content as the CCSS or GBE to which it is aligned. A rating of “some” indicates that the GBE or DCAS-Alt1 item covers some of the CCSS or GBE to which is aligned;
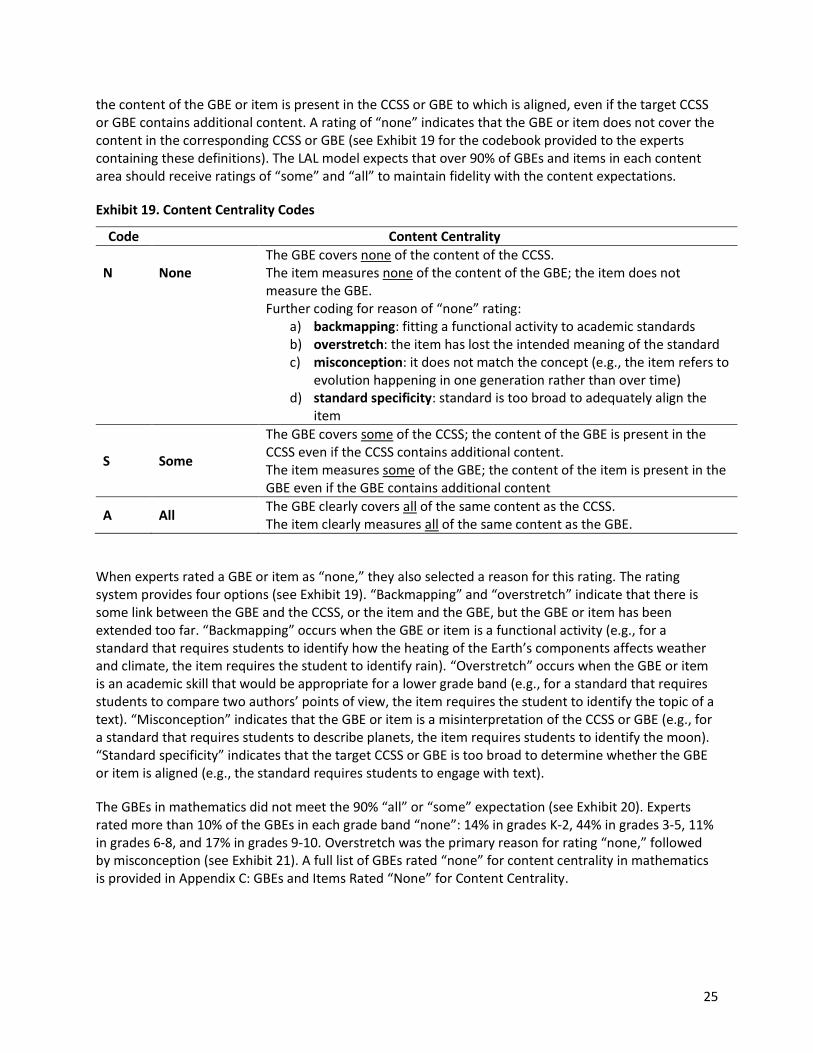
25
the content of the GBE or item is present in the CCSS or GBE to which is aligned, even if the target CCSS or GBE contains additional content. A rating of “none” indicates that the GBE or item does not cover the content in the corresponding CCSS or GBE (see Exhibit 19 for the codebook provided to the experts containing these definitions). The LAL model expects that over 90% of GBEs and items in each content area should receive ratings of “some” and “all” to maintain fidelity with the content expectations.
Exhibit 19. Content Centrality Codes
Code Content Centrality
N None The GBE covers none of the content of the CCSS. The item measures none of the content of the GBE; the item does not measure the GBE.
Further coding for reason of “none” rating: a) backmapping: fitting a functional activity to academic standards b) overstretch: the item has lost the intended meaning of the standard c) misconception: it does not match the concept (e.g., the item refers to
evolution happening in one generation rather than over time) d) standard specificity: standard is too broad to adequately align the
item
S Some
The GBE covers some of the CCSS; the content of the GBE is present in the CCSS even if the CCSS contains additional content. The item measures some of the GBE; the content of the item is present in the GBE even if the GBE contains additional content
A All The GBE clearly covers all of the same content as the CCSS. The item clearly measures all of the same content as the GBE.
When experts rated a GBE or item as “none,” they also selected a reason for this rating. The rating system provides four options (see Exhibit 19). “Backmapping” and “overstretch” indicate that there is some link between the GBE and the CCSS, or the item and the GBE, but the GBE or item has been extended too far. “Backmapping” occurs when the GBE or item is a functional activity (e.g., for a standard that requires students to identify how the heating of the Earth’s components affects weather and climate, the item requires the student to identify rain). “Overstretch” occurs when the GBE or item is an academic skill that would be appropriate for a lower grade band (e.g., for a standard that requires students to compare two authors’ points of view, the item requires the student to identify the topic of a text). “Misconception” indicates that the GBE or item is a misinterpretation of the CCSS or GBE (e.g., for a standard that requires students to describe planets, the item requires students to identify the moon). “Standard specificity” indicates that the target CCSS or GBE is too broad to determine whether the GBE or item is aligned (e.g., the standard requires students to engage with text).
The GBEs in mathematics did not meet the 90% “all” or “some” expectation (see Exhibit 20). Experts rated more than 10% of the GBEs in each grade band “none”: 14% in grades K-2, 44% in grades 3-5, 11% in grades 6-8, and 17% in grades 9-10. Overstretch was the primary reason for rating “none,” followed by misconception (see Exhibit 21). A full list of GBEs rated “none” for content centrality in mathematics is provided in Appendix C: GBEs and Items Rated “None” for Content Centrality.
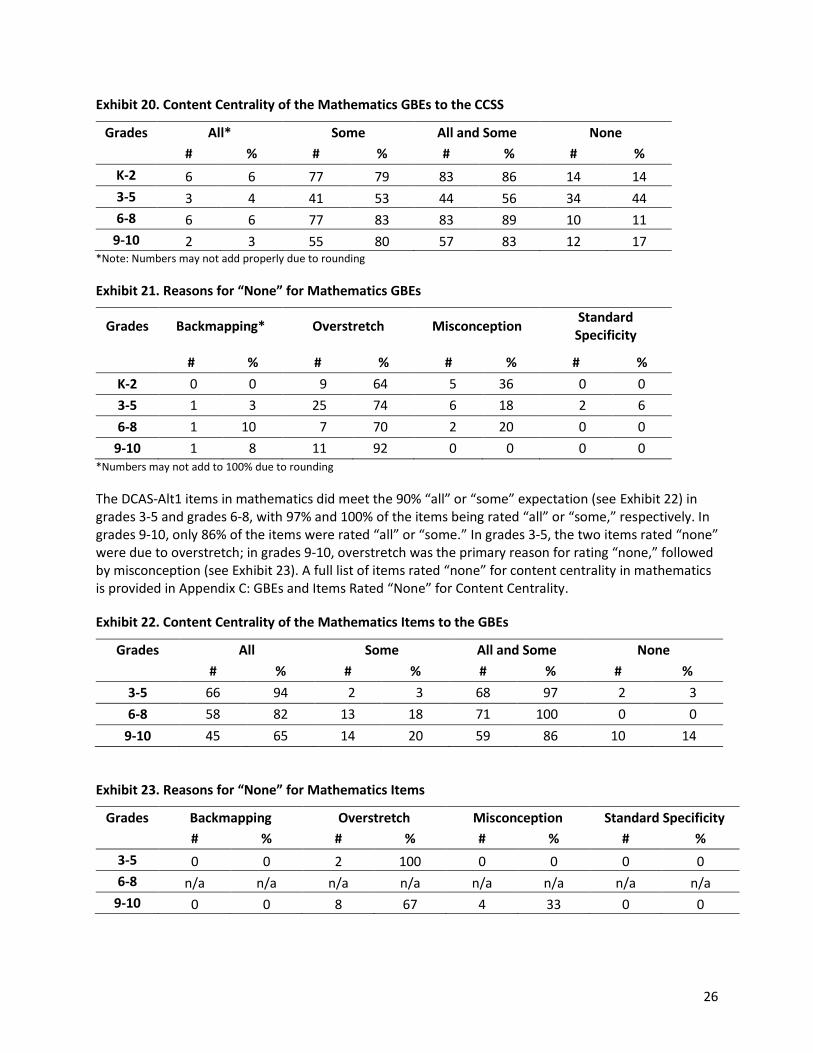
26
Exhibit 20. Content Centrality of the Mathematics GBEs to the CCSS
Grades All* Some All and Some None
# % # % # % # %
K-2 6 6 77 79 83 86 14 14
3-5 3 4 41 53 44 56 34 44
6-8 6 6 77 83 83 89 10 11
9-10 2 3 55 80 57 83 12 17 *Note: Numbers may not add properly due to rounding
Exhibit 21. Reasons for “None” for Mathematics GBEs
Grades Backmapping* Overstretch Misconception Standard
Specificity
# % # % # % # %
K-2 0 0 9 64 5 36 0 0
3-5 1 3 25 74 6 18 2 6
6-8 1 10 7 70 2 20 0 0
9-10 1 8 11 92 0 0 0 0 *Numbers may not add to 100% due to rounding
The DCAS-Alt1 items in mathematics did meet the 90% “all” or “some” expectation (see Exhibit 22) in grades 3-5 and grades 6-8, with 97% and 100% of the items being rated “all” or “some,” respectively. In grades 9-10, only 86% of the items were rated “all” or “some.” In grades 3-5, the two items rated “none” were due to overstretch; in grades 9-10, overstretch was the primary reason for rating “none,” followed by misconception (see Exhibit 23). A full list of items rated “none” for content centrality in mathematics is provided in Appendix C: GBEs and Items Rated “None” for Content Centrality.
Exhibit 22. Content Centrality of the Mathematics Items to the GBEs
Grades All Some All and Some None
# % # % # % # %
3-5 66 94 2 3 68 97 2 3
6-8 58 82 13 18 71 100 0 0
9-10 45 65 14 20 59 86 10 14
Exhibit 23. Reasons for “None” for Mathematics Items
Grades Backmapping Overstretch Misconception Standard Specificity
# % # % # % # %
3-5 0 0 2 100 0 0 0 0
6-8 n/a n/a n/a n/a n/a n/a n/a n/a
9-10 0 0 8 67 4 33 0 0
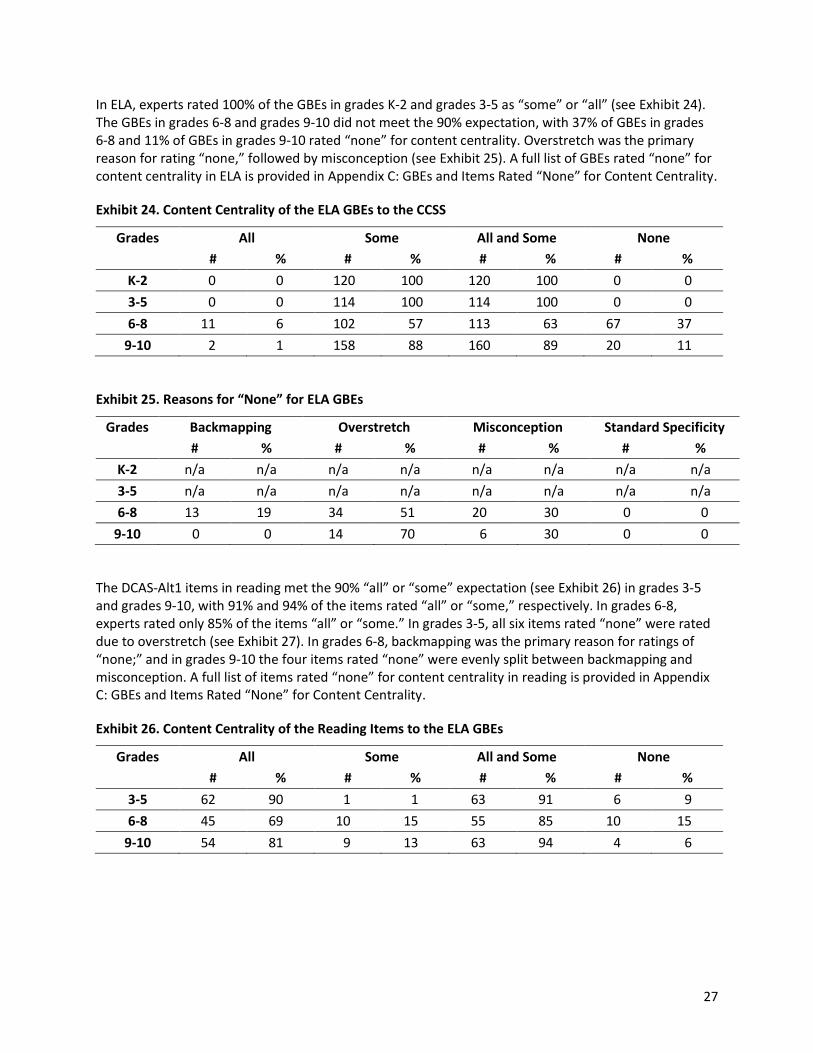
27
In ELA, experts rated 100% of the GBEs in grades K-2 and grades 3-5 as “some” or “all” (see Exhibit 24). The GBEs in grades 6-8 and grades 9-10 did not meet the 90% expectation, with 37% of GBEs in grades 6-8 and 11% of GBEs in grades 9-10 rated “none” for content centrality. Overstretch was the primary reason for rating “none,” followed by misconception (see Exhibit 25). A full list of GBEs rated “none” for content centrality in ELA is provided in Appendix C: GBEs and Items Rated “None” for Content Centrality.
Exhibit 24. Content Centrality of the ELA GBEs to the CCSS
Grades All Some All and Some None
# % # % # % # %
K-2 0 0 120 100 120 100 0 0
3-5 0 0 114 100 114 100 0 0
6-8 11 6 102 57 113 63 67 37
9-10 2 1 158 88 160 89 20 11
Exhibit 25. Reasons for “None” for ELA GBEs
Grades Backmapping Overstretch Misconception Standard Specificity
# % # % # % # %
K-2 n/a n/a n/a n/a n/a n/a n/a n/a
3-5 n/a n/a n/a n/a n/a n/a n/a n/a
6-8 13 19 34 51 20 30 0 0
9-10 0 0 14 70 6 30 0 0
The DCAS-Alt1 items in reading met the 90% “all” or “some” expectation (see Exhibit 26) in grades 3-5 and grades 9-10, with 91% and 94% of the items rated “all” or “some,” respectively. In grades 6-8, experts rated only 85% of the items “all” or “some.” In grades 3-5, all six items rated “none” were rated due to overstretch (see Exhibit 27). In grades 6-8, backmapping was the primary reason for ratings of “none;” and in grades 9-10 the four items rated “none” were evenly split between backmapping and misconception. A full list of items rated “none” for content centrality in reading is provided in Appendix C: GBEs and Items Rated “None” for Content Centrality.
Exhibit 26. Content Centrality of the Reading Items to the ELA GBEs
Grades All Some All and Some None
# % # % # % # %
3-5 62 90 1 1 63 91 6 9
6-8 45 69 10 15 55 85 10 15
9-10 54 81 9 13 63 94 4 6
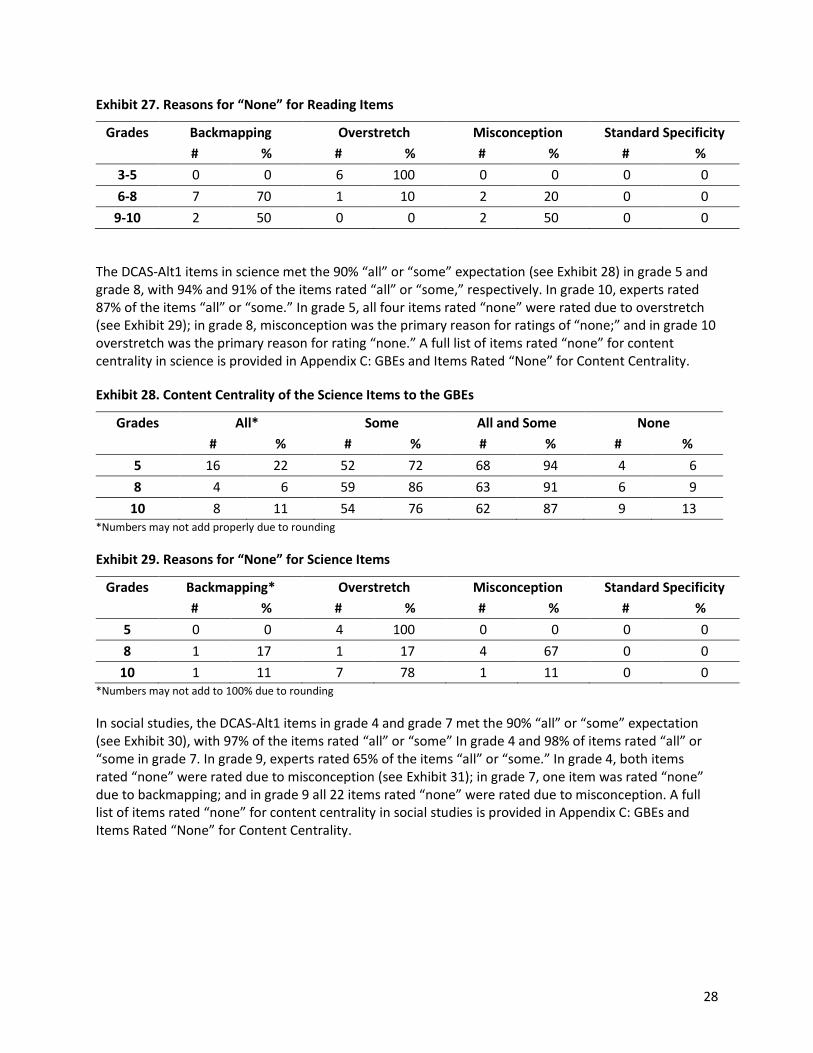
28
Exhibit 27. Reasons for “None” for Reading Items
Grades Backmapping Overstretch Misconception Standard Specificity
# % # % # % # %
3-5 0 0 6 100 0 0 0 0
6-8 7 70 1 10 2 20 0 0
9-10 2 50 0 0 2 50 0 0
The DCAS-Alt1 items in science met the 90% “all” or “some” expectation (see Exhibit 28) in grade 5 and grade 8, with 94% and 91% of the items rated “all” or “some,” respectively. In grade 10, experts rated 87% of the items “all” or “some.” In grade 5, all four items rated “none” were rated due to overstretch (see Exhibit 29); in grade 8, misconception was the primary reason for ratings of “none;” and in grade 10 overstretch was the primary reason for rating “none.” A full list of items rated “none” for content centrality in science is provided in Appendix C: GBEs and Items Rated “None” for Content Centrality.
Exhibit 28. Content Centrality of the Science Items to the GBEs
Grades All* Some All and Some None
# % # % # % # %
5 16 22 52 72 68 94 4 6
8 4 6 59 86 63 91 6 9
10 8 11 54 76 62 87 9 13 *Numbers may not add properly due to rounding
Exhibit 29. Reasons for “None” for Science Items
Grades Backmapping* Overstretch Misconception Standard Specificity
# % # % # % # %
5 0 0 4 100 0 0 0 0
8 1 17 1 17 4 67 0 0
10 1 11 7 78 1 11 0 0 *Numbers may not add to 100% due to rounding
In social studies, the DCAS-Alt1 items in grade 4 and grade 7 met the 90% “all” or “some” expectation (see Exhibit 30), with 97% of the items rated “all” or “some” In grade 4 and 98% of items rated “all” or “some in grade 7. In grade 9, experts rated 65% of the items “all” or “some.” In grade 4, both items rated “none” were rated due to misconception (see Exhibit 31); in grade 7, one item was rated “none” due to backmapping; and in grade 9 all 22 items rated “none” were rated due to misconception. A full list of items rated “none” for content centrality in social studies is provided in Appendix C: GBEs and Items Rated “None” for Content Centrality.
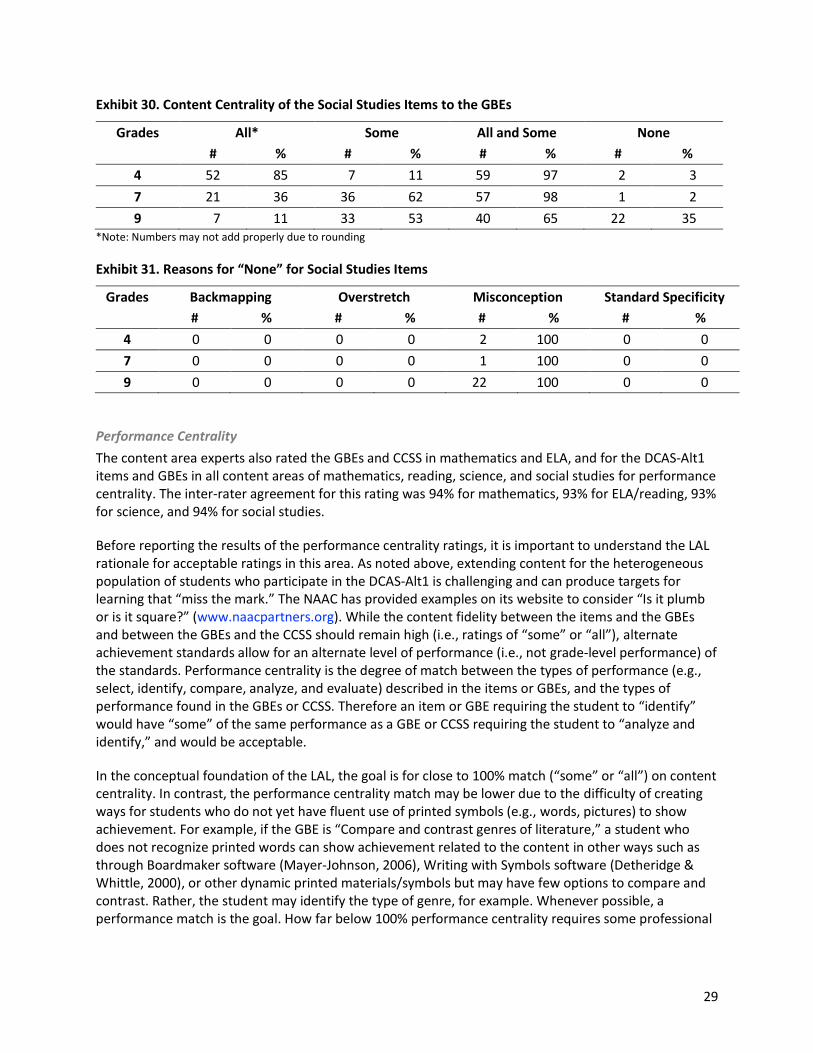
29
Exhibit 30. Content Centrality of the Social Studies Items to the GBEs
Grades All* Some All and Some None
# % # % # % # %
4 52 85 7 11 59 97 2 3
7 21 36 36 62 57 98 1 2
9 7 11 33 53 40 65 22 35 *Note: Numbers may not add properly due to rounding
Exhibit 31. Reasons for “None” for Social Studies Items
Grades Backmapping Overstretch Misconception Standard Specificity
# % # % # % # %
4 0 0 0 0 2 100 0 0
7 0 0 0 0 1 100 0 0
9 0 0 0 0 22 100 0 0
Performance Centrality
The content area experts also rated the GBEs and CCSS in mathematics and ELA, and for the DCAS-Alt1 items and GBEs in all content areas of mathematics, reading, science, and social studies for performance centrality. The inter-rater agreement for this rating was 94% for mathematics, 93% for ELA/reading, 93% for science, and 94% for social studies.
Before reporting the results of the performance centrality ratings, it is important to understand the LAL rationale for acceptable ratings in this area. As noted above, extending content for the heterogeneous population of students who participate in the DCAS-Alt1 is challenging and can produce targets for learning that “miss the mark.” The NAAC has provided examples on its website to consider “Is it plumb or is it square?” (www.naacpartners.org). While the content fidelity between the items and the GBEs and between the GBEs and the CCSS should remain high (i.e., ratings of “some” or “all”), alternate achievement standards allow for an alternate level of performance (i.e., not grade-level performance) of the standards. Performance centrality is the degree of match between the types of performance (e.g., select, identify, compare, analyze, and evaluate) described in the items or GBEs, and the types of performance found in the GBEs or CCSS. Therefore an item or GBE requiring the student to “identify” would have “some” of the same performance as a GBE or CCSS requiring the student to “analyze and identify,” and would be acceptable.
In the conceptual foundation of the LAL, the goal is for close to 100% match (“some” or “all”) on content centrality. In contrast, the performance centrality match may be lower due to the difficulty of creating ways for students who do not yet have fluent use of printed symbols (e.g., words, pictures) to show achievement. For example, if the GBE is “Compare and contrast genres of literature,” a student who does not recognize printed words can show achievement related to the content in other ways such as through Boardmaker software (Mayer-Johnson, 2006), Writing with Symbols software (Detheridge & Whittle, 2000), or other dynamic printed materials/symbols but may have few options to compare and contrast. Rather, the student may identify the type of genre, for example. Whenever possible, a performance match is the goal. How far below 100% performance centrality requires some professional
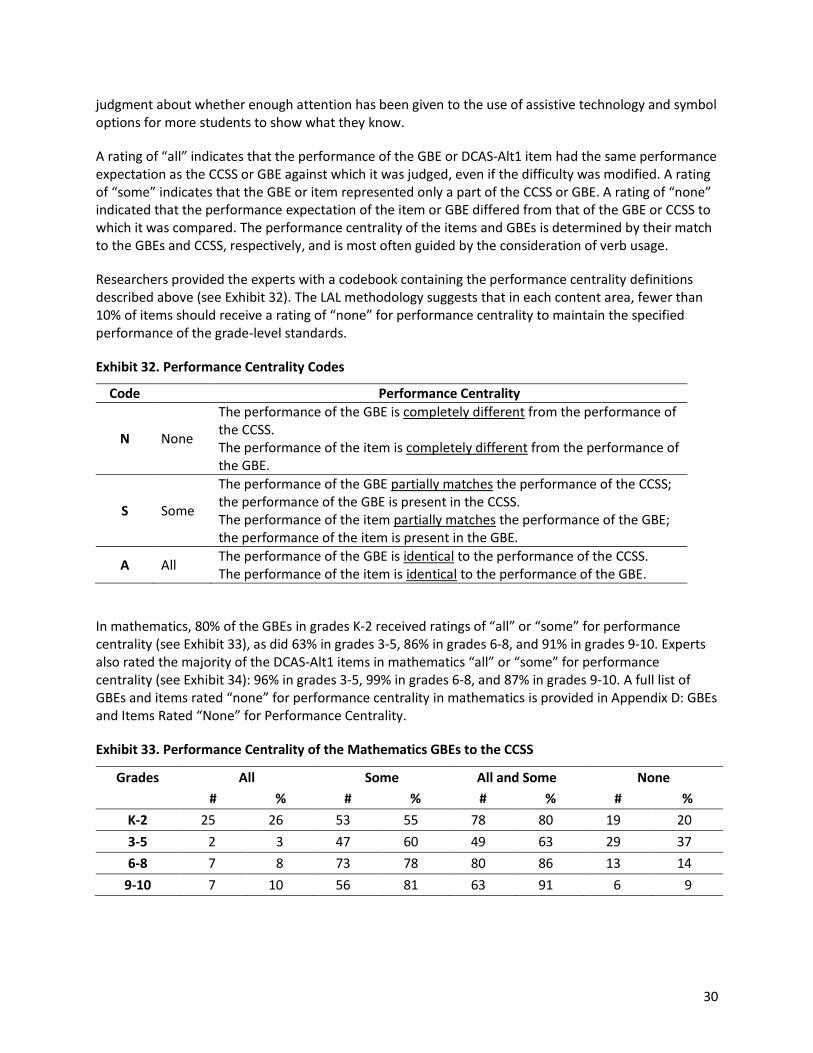
30
judgment about whether enough attention has been given to the use of assistive technology and symbol options for more students to show what they know.
A rating of “all” indicates that the performance of the GBE or DCAS-Alt1 item had the same performance expectation as the CCSS or GBE against which it was judged, even if the difficulty was modified. A rating of “some” indicates that the GBE or item represented only a part of the CCSS or GBE. A rating of “none” indicated that the performance expectation of the item or GBE differed from that of the GBE or CCSS to which it was compared. The performance centrality of the items and GBEs is determined by their match to the GBEs and CCSS, respectively, and is most often guided by the consideration of verb usage.
Researchers provided the experts with a codebook containing the performance centrality definitions described above (see Exhibit 32). The LAL methodology suggests that in each content area, fewer than 10% of items should receive a rating of “none” for performance centrality to maintain the specified performance of the grade-level standards.
Exhibit 32. Performance Centrality Codes
Code Performance Centrality
N None
The performance of the GBE is completely different from the performance of the CCSS. The performance of the item is completely different from the performance of the GBE.
S Some
The performance of the GBE partially matches the performance of the CCSS; the performance of the GBE is present in the CCSS. The performance of the item partially matches the performance of the GBE; the performance of the item is present in the GBE.
A All The performance of the GBE is identical to the performance of the CCSS. The performance of the item is identical to the performance of the GBE.
In mathematics, 80% of the GBEs in grades K-2 received ratings of “all” or “some” for performance centrality (see Exhibit 33), as did 63% in grades 3-5, 86% in grades 6-8, and 91% in grades 9-10. Experts also rated the majority of the DCAS-Alt1 items in mathematics “all” or “some” for performance centrality (see Exhibit 34): 96% in grades 3-5, 99% in grades 6-8, and 87% in grades 9-10. A full list of GBEs and items rated “none” for performance centrality in mathematics is provided in Appendix D: GBEs and Items Rated “None” for Performance Centrality.
Exhibit 33. Performance Centrality of the Mathematics GBEs to the CCSS
Grades All Some All and Some None
# % # % # % # %
K-2 25 26 53 55 78 80 19 20
3-5 2 3 47 60 49 63 29 37
6-8 7 8 73 78 80 86 13 14
9-10 7 10 56 81 63 91 6 9
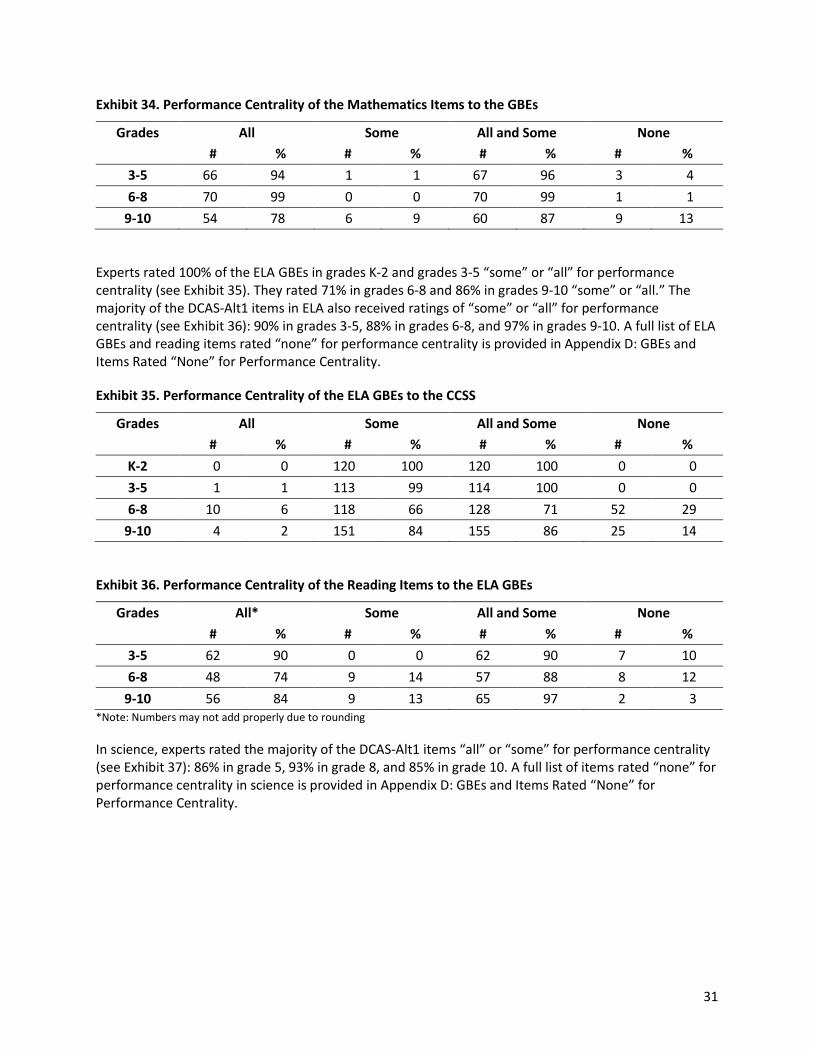
31
Exhibit 34. Performance Centrality of the Mathematics Items to the GBEs
Grades All Some All and Some None
# % # % # % # %
3-5 66 94 1 1 67 96 3 4
6-8 70 99 0 0 70 99 1 1
9-10 54 78 6 9 60 87 9 13
Experts rated 100% of the ELA GBEs in grades K-2 and grades 3-5 “some” or “all” for performance centrality (see Exhibit 35). They rated 71% in grades 6-8 and 86% in grades 9-10 “some” or “all.” The majority of the DCAS-Alt1 items in ELA also received ratings of “some” or “all” for performance centrality (see Exhibit 36): 90% in grades 3-5, 88% in grades 6-8, and 97% in grades 9-10. A full list of ELA GBEs and reading items rated “none” for performance centrality is provided in Appendix D: GBEs and Items Rated “None” for Performance Centrality.
Exhibit 35. Performance Centrality of the ELA GBEs to the CCSS
Grades All Some All and Some None
# % # % # % # %
K-2 0 0 120 100 120 100 0 0
3-5 1 1 113 99 114 100 0 0
6-8 10 6 118 66 128 71 52 29
9-10 4 2 151 84 155 86 25 14
Exhibit 36. Performance Centrality of the Reading Items to the ELA GBEs
Grades All* Some All and Some None
# % # % # % # %
3-5 62 90 0 0 62 90 7 10
6-8 48 74 9 14 57 88 8 12
9-10 56 84 9 13 65 97 2 3 *Note: Numbers may not add properly due to rounding
In science, experts rated the majority of the DCAS-Alt1 items “all” or “some” for performance centrality (see Exhibit 37): 86% in grade 5, 93% in grade 8, and 85% in grade 10. A full list of items rated “none” for performance centrality in science is provided in Appendix D: GBEs and Items Rated “None” for Performance Centrality.
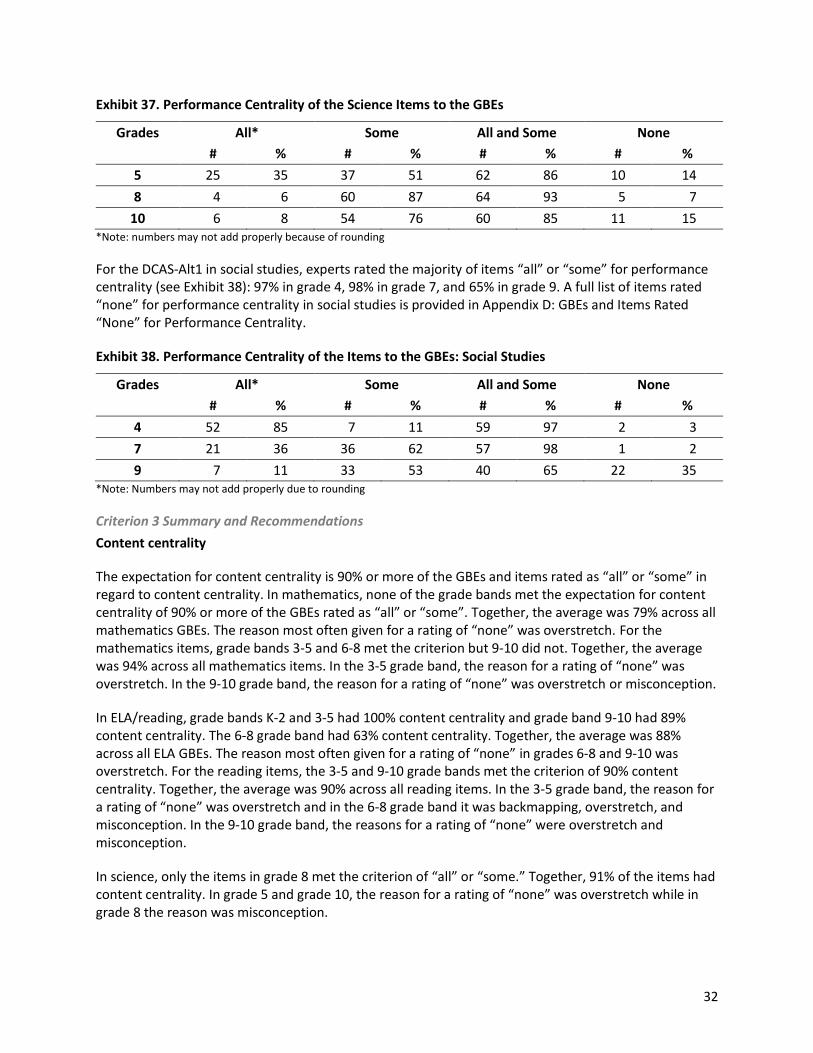
32
Exhibit 37. Performance Centrality of the Science Items to the GBEs
Grades All* Some All and Some None
# % # % # % # %
5 25 35 37 51 62 86 10 14
8 4 6 60 87 64 93 5 7
10 6 8 54 76 60 85 11 15 *Note: numbers may not add properly because of rounding
For the DCAS-Alt1 in social studies, experts rated the majority of items “all” or “some” for performance centrality (see Exhibit 38): 97% in grade 4, 98% in grade 7, and 65% in grade 9. A full list of items rated “none” for performance centrality in social studies is provided in Appendix D: GBEs and Items Rated “None” for Performance Centrality.
Exhibit 38. Performance Centrality of the Items to the GBEs: Social Studies
Grades All* Some All and Some None
# % # % # % # %
4 52 85 7 11 59 97 2 3
7 21 36 36 62 57 98 1 2
9 7 11 33 53 40 65 22 35 *Note: Numbers may not add properly due to rounding
Criterion 3 Summary and Recommendations
Content centrality
The expectation for content centrality is 90% or more of the GBEs and items rated as “all” or “some” in regard to content centrality. In mathematics, none of the grade bands met the expectation for content centrality of 90% or more of the GBEs rated as “all” or “some”. Together, the average was 79% across all mathematics GBEs. The reason most often given for a rating of “none” was overstretch. For the mathematics items, grade bands 3-5 and 6-8 met the criterion but 9-10 did not. Together, the average was 94% across all mathematics items. In the 3-5 grade band, the reason for a rating of “none” was overstretch. In the 9-10 grade band, the reason for a rating of “none” was overstretch or misconception.
In ELA/reading, grade bands K-2 and 3-5 had 100% content centrality and grade band 9-10 had 89% content centrality. The 6-8 grade band had 63% content centrality. Together, the average was 88% across all ELA GBEs. The reason most often given for a rating of “none” in grades 6-8 and 9-10 was overstretch. For the reading items, the 3-5 and 9-10 grade bands met the criterion of 90% content centrality. Together, the average was 90% across all reading items. In the 3-5 grade band, the reason for a rating of “none” was overstretch and in the 6-8 grade band it was backmapping, overstretch, and misconception. In the 9-10 grade band, the reasons for a rating of “none” were overstretch and misconception.
In science, only the items in grade 8 met the criterion of “all” or “some.” Together, 91% of the items had content centrality. In grade 5 and grade 10, the reason for a rating of “none” was overstretch while in grade 8 the reason was misconception.
33
Grade 4 and grade 7 items in social studies met the criterion of 90% while 65% of items in grade 9 were rated “all” or “some.” Together, 87% of the items had content centrality. In grades 4, 7, and 9, the reason for a rating of “none” was misconception.
Performance centrality
The expectation for performance centrality is 90% or more of the GBEs and items rated “all” or “some.” In mathematics, only the grade band of 9-10 met the expectation for performance centrality of 90% or more of the GBEs rated as “all” or “some”. Together, the average was 80% across all mathematics GBEs. For the mathematics items, grade bands 3-5 and 6-8 met the criterion but 9-10 did not. Together, the average was 94% across all mathematics items.
In ELA/reading, grade bands K-2 and 3-5 had 100% performance centrality and grade band 9-10 had 86% performance centrality. The 6-8 grade band had 71% performance centrality. Together, the average was 89% across all ELA GBEs. For the reading items, the 3-5 and 9-10 grade bands met the criterion of 90% performance centrality. Together, the average was 92% across all reading items.
In science, the items in grades 5 and 8 met the criterion, with 87% of the remaining grade (10) rated “all” or “some.” Together, 88% of the items had performance centrality.
Grade 4 and grade 7 items in social studies met the criterion of 90% while 65% of items in grade 9 were rated “all” or “some.”
The DDOE may wish to revisit some of the content and performance centrality of the items and the GBEs to more fully align the assessment system and may consider addressing the content and performance centrality issues via multiple avenues: 1) revisit the GBEs with ratings of “none” for content and performance centrality, in coordination with external content experts, to strengthen the relationship between the GBEs and the CCSS; 2) revisit the DCAS-Alt1 items with ratings of “none” for content and performance centrality and replace those items in the assessment with others from the item bank (but alignment of replacement items should also be reviewed); and 3) collaborate with the assessment/item writing vendor to tweak current items to strengthen the content and performance centrality links to the GBEs.
Criterion 4
The content differs from grade level in range, balance, and depth of knowledge (DOK), but matches high expectations set for students with significant cognitive disabilities.
The expectations for the criterion 4 indices are 0.70 or higher for categorical concurrence, 0.70 or higher for range of knowledge, and 0.60 or higher for balance of representation. For DOK, the expectation is that the assessment should include a range of levels, with some items having DOKs below, at, and above the DOK of the corresponding GBE and at least 50% or more items at or above the corresponding GBE.
As noted earlier in the description of the DCAS-Alt1, the Delaware general assessment assesses students in grades 3 through 8 and 10 in the CCSS in reading and in mathematics. In addition, students in grades 4, 8, and 10 are assessed in all of the science standards for those grade levels and students in grades 5, 7, and 11 are assessed in social studies.
For all assessments, including general assessments and alternate assessments based on alternate achievement standards, states may choose to emphasize some standards over others in various content
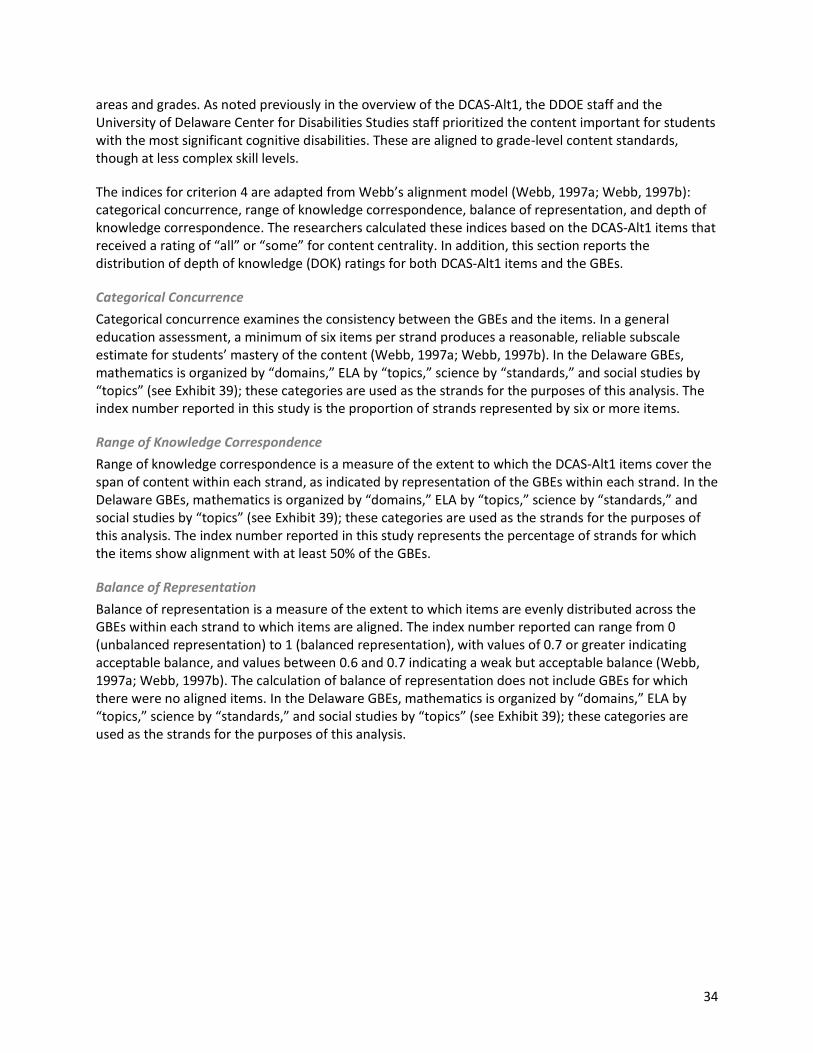
34
areas and grades. As noted previously in the overview of the DCAS-Alt1, the DDOE staff and the University of Delaware Center for Disabilities Studies staff prioritized the content important for students with the most significant cognitive disabilities. These are aligned to grade-level content standards, though at less complex skill levels.
The indices for criterion 4 are adapted from Webb’s alignment model (Webb, 1997a; Webb, 1997b): categorical concurrence, range of knowledge correspondence, balance of representation, and depth of knowledge correspondence. The researchers calculated these indices based on the DCAS-Alt1 items that received a rating of “all” or “some” for content centrality. In addition, this section reports the distribution of depth of knowledge (DOK) ratings for both DCAS-Alt1 items and the GBEs.
Categorical Concurrence
Categorical concurrence examines the consistency between the GBEs and the items. In a general education assessment, a minimum of six items per strand produces a reasonable, reliable subscale estimate for students’ mastery of the content (Webb, 1997a; Webb, 1997b). In the Delaware GBEs, mathematics is organized by “domains,” ELA by “topics,” science by “standards,” and social studies by “topics” (see Exhibit 39); these categories are used as the strands for the purposes of this analysis. The index number reported in this study is the proportion of strands represented by six or more items.
Range of Knowledge Correspondence
Range of knowledge correspondence is a measure of the extent to which the DCAS-Alt1 items cover the span of content within each strand, as indicated by representation of the GBEs within each strand. In the Delaware GBEs, mathematics is organized by “domains,” ELA by “topics,” science by “standards,” and social studies by “topics” (see Exhibit 39); these categories are used as the strands for the purposes of this analysis. The index number reported in this study represents the percentage of strands for which the items show alignment with at least 50% of the GBEs.
Balance of Representation
Balance of representation is a measure of the extent to which items are evenly distributed across the GBEs within each strand to which items are aligned. The index number reported can range from 0 (unbalanced representation) to 1 (balanced representation), with values of 0.7 or greater indicating acceptable balance, and values between 0.6 and 0.7 indicating a weak but acceptable balance (Webb, 1997a; Webb, 1997b). The calculation of balance of representation does not include GBEs for which there were no aligned items. In the Delaware GBEs, mathematics is organized by “domains,” ELA by “topics,” science by “standards,” and social studies by “topics” (see Exhibit 39); these categories are used as the strands for the purposes of this analysis.
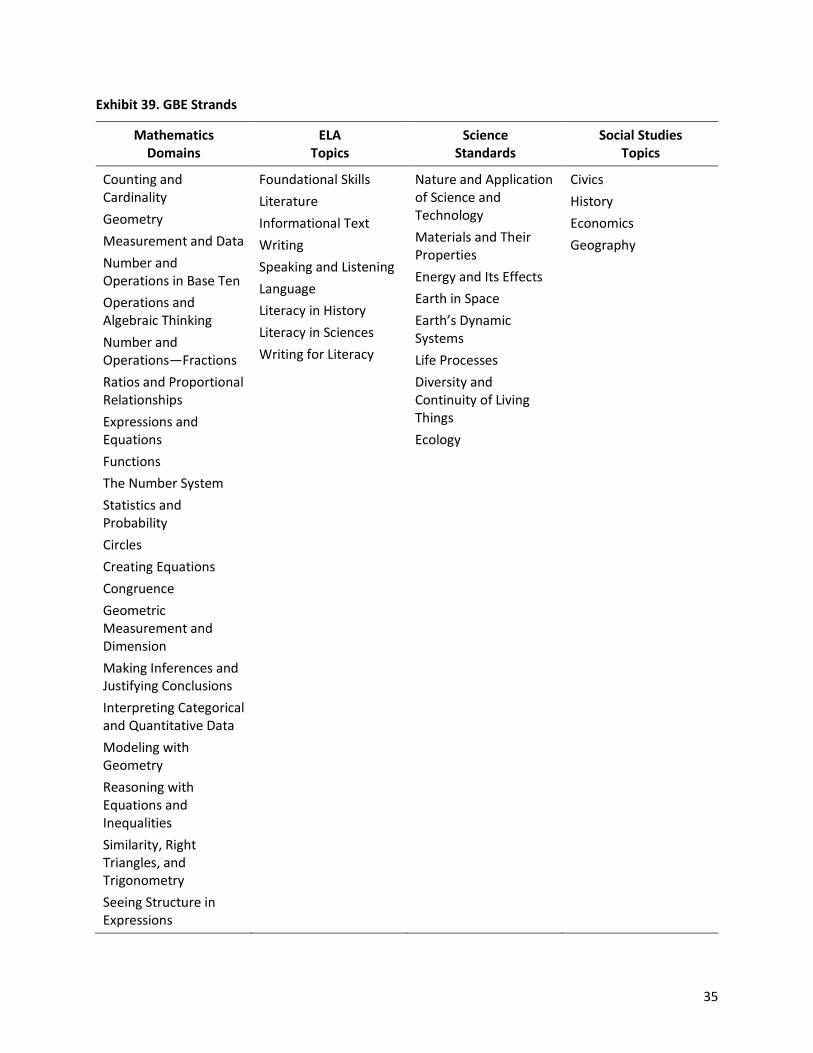
35
Exhibit 39. GBE Strands
Mathematics Domains
ELA Topics
Science Standards
Social Studies Topics
Counting and Cardinality
Geometry
Measurement and Data
Number and Operations in Base Ten
Operations and Algebraic Thinking
Number and Operations—Fractions
Ratios and Proportional Relationships
Expressions and Equations
Functions
The Number System
Statistics and Probability
Circles
Creating Equations
Congruence
Geometric Measurement and Dimension
Making Inferences and Justifying Conclusions
Interpreting Categorical and Quantitative Data
Modeling with Geometry
Reasoning with Equations and Inequalities
Similarity, Right Triangles, and Trigonometry
Seeing Structure in Expressions
Foundational Skills
Literature
Informational Text
Writing
Speaking and Listening
Language
Literacy in History
Literacy in Sciences
Writing for Literacy
Nature and Application of Science and Technology
Materials and Their Properties
Energy and Its Effects
Earth in Space
Earth’s Dynamic Systems
Life Processes
Diversity and Continuity of Living Things
Ecology
Civics
History
Economics
Geography
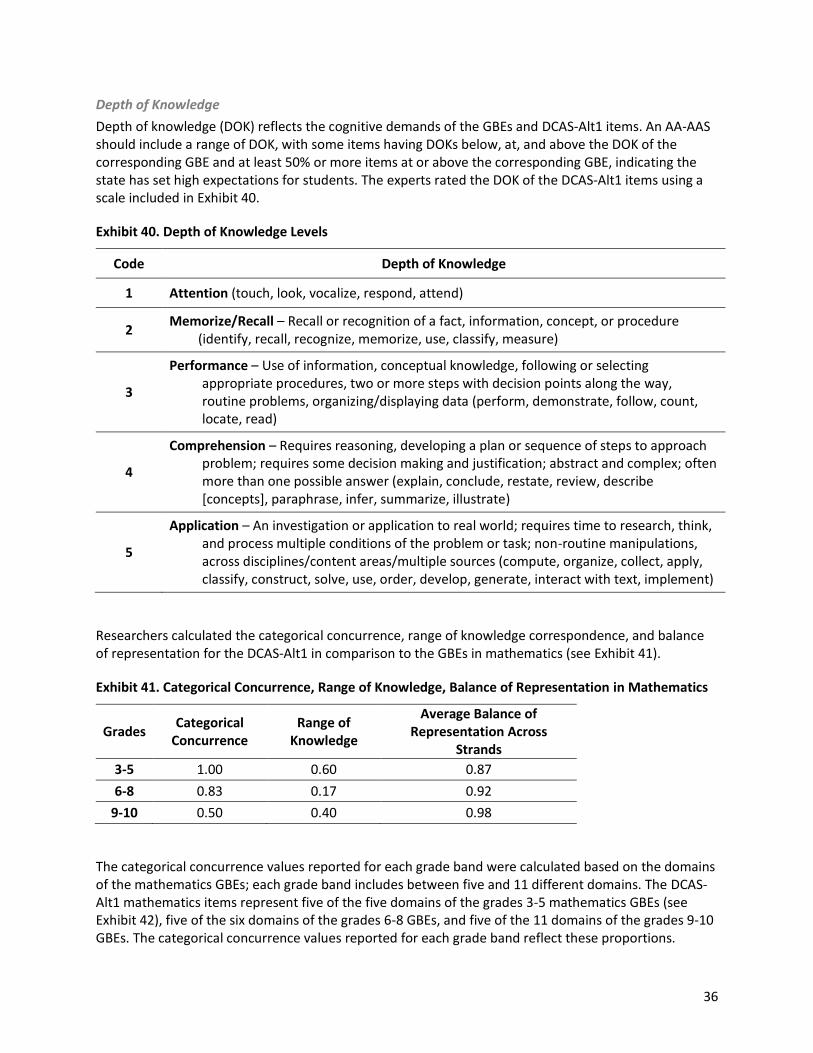
36
Depth of Knowledge
Depth of knowledge (DOK) reflects the cognitive demands of the GBEs and DCAS-Alt1 items. An AA-AAS should include a range of DOK, with some items having DOKs below, at, and above the DOK of the corresponding GBE and at least 50% or more items at or above the corresponding GBE, indicating the state has set high expectations for students. The experts rated the DOK of the DCAS-Alt1 items using a scale included in Exhibit 40.
Exhibit 40. Depth of Knowledge Levels
Code Depth of Knowledge
1 Attention (touch, look, vocalize, respond, attend)
2 Memorize/Recall – Recall or recognition of a fact, information, concept, or procedure
(identify, recall, recognize, memorize, use, classify, measure)
3
Performance – Use of information, conceptual knowledge, following or selecting appropriate procedures, two or more steps with decision points along the way, routine problems, organizing/displaying data (perform, demonstrate, follow, count, locate, read)
4
Comprehension – Requires reasoning, developing a plan or sequence of steps to approach problem; requires some decision making and justification; abstract and complex; often more than one possible answer (explain, conclude, restate, review, describe [concepts], paraphrase, infer, summarize, illustrate)
5
Application – An investigation or application to real world; requires time to research, think, and process multiple conditions of the problem or task; non-routine manipulations, across disciplines/content areas/multiple sources (compute, organize, collect, apply, classify, construct, solve, use, order, develop, generate, interact with text, implement)
Researchers calculated the categorical concurrence, range of knowledge correspondence, and balance of representation for the DCAS-Alt1 in comparison to the GBEs in mathematics (see Exhibit 41).
Exhibit 41. Categorical Concurrence, Range of Knowledge, Balance of Representation in Mathematics
Grades Categorical
Concurrence Range of
Knowledge
Average Balance of Representation Across
Strands
3-5 1.00 0.60 0.87
6-8 0.83 0.17 0.92
9-10 0.50 0.40 0.98
The categorical concurrence values reported for each grade band were calculated based on the domains of the mathematics GBEs; each grade band includes between five and 11 different domains. The DCAS-Alt1 mathematics items represent five of the five domains of the grades 3-5 mathematics GBEs (see Exhibit 42), five of the six domains of the grades 6-8 GBEs, and five of the 11 domains of the grades 9-10 GBEs. The categorical concurrence values reported for each grade band reflect these proportions.
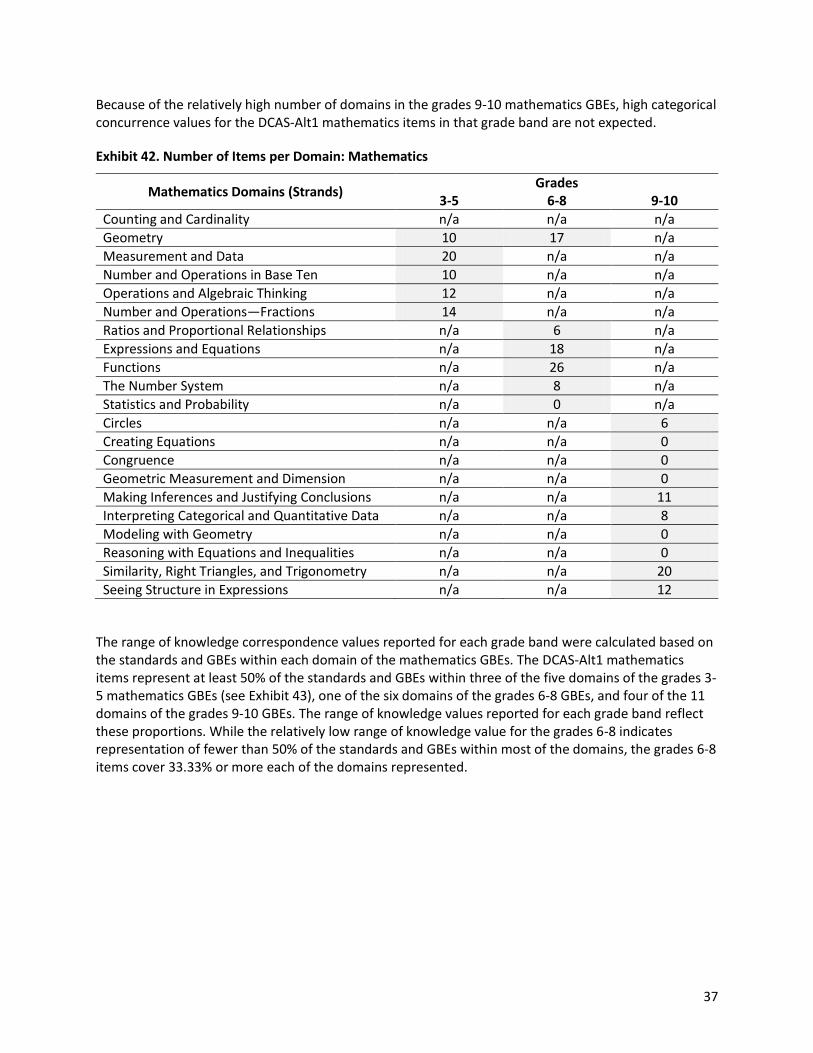
37
Because of the relatively high number of domains in the grades 9-10 mathematics GBEs, high categorical concurrence values for the DCAS-Alt1 mathematics items in that grade band are not expected.
Exhibit 42. Number of Items per Domain: Mathematics
Mathematics Domains (Strands) Grades
3-5 6-8 9-10
Counting and Cardinality n/a n/a n/a
Geometry 10 17 n/a
Measurement and Data 20 n/a n/a
Number and Operations in Base Ten 10 n/a n/a
Operations and Algebraic Thinking 12 n/a n/a
Number and Operations—Fractions 14 n/a n/a
Ratios and Proportional Relationships n/a 6 n/a
Expressions and Equations n/a 18 n/a
Functions n/a 26 n/a
The Number System n/a 8 n/a
Statistics and Probability n/a 0 n/a
Circles n/a n/a 6
Creating Equations n/a n/a 0
Congruence n/a n/a 0
Geometric Measurement and Dimension n/a n/a 0
Making Inferences and Justifying Conclusions n/a n/a 11
Interpreting Categorical and Quantitative Data n/a n/a 8
Modeling with Geometry n/a n/a 0
Reasoning with Equations and Inequalities n/a n/a 0
Similarity, Right Triangles, and Trigonometry n/a n/a 20
Seeing Structure in Expressions n/a n/a 12
The range of knowledge correspondence values reported for each grade band were calculated based on the standards and GBEs within each domain of the mathematics GBEs. The DCAS-Alt1 mathematics items represent at least 50% of the standards and GBEs within three of the five domains of the grades 3-5 mathematics GBEs (see Exhibit 43), one of the six domains of the grades 6-8 GBEs, and four of the 11 domains of the grades 9-10 GBEs. The range of knowledge values reported for each grade band reflect these proportions. While the relatively low range of knowledge value for the grades 6-8 indicates representation of fewer than 50% of the standards and GBEs within most of the domains, the grades 6-8 items cover 33.33% or more each of the domains represented.
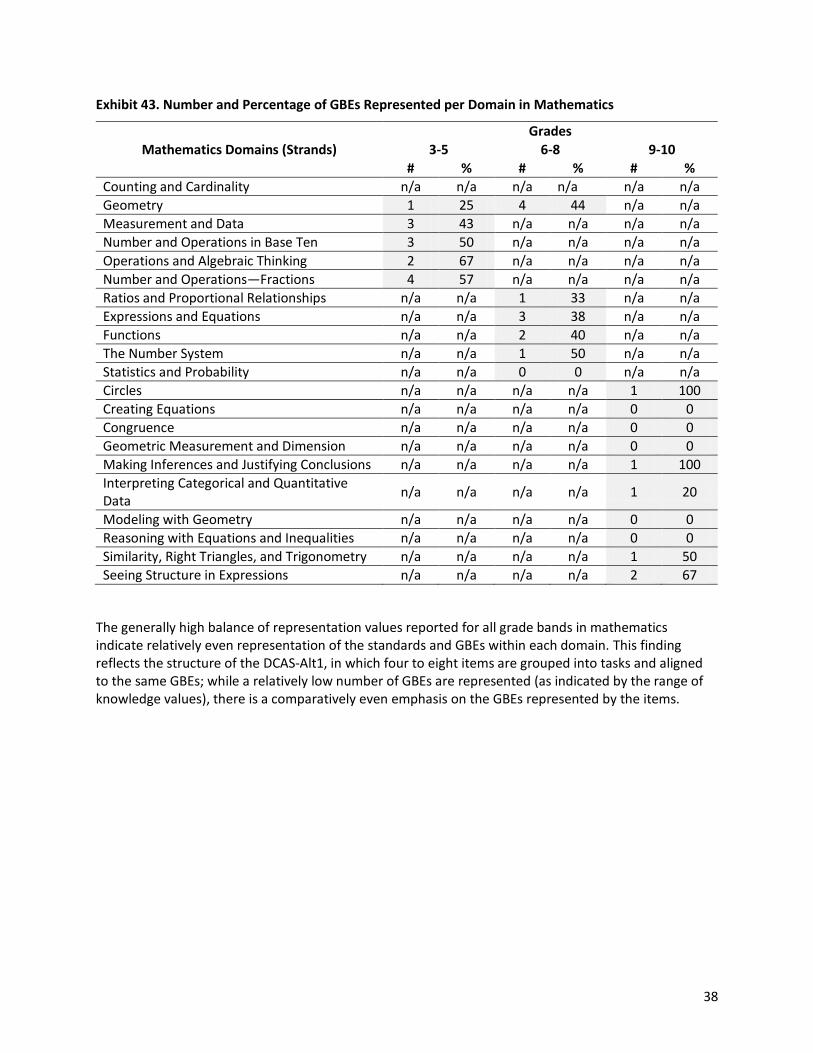
38
Exhibit 43. Number and Percentage of GBEs Represented per Domain in Mathematics
Mathematics Domains (Strands)
Grades
3-5 6-8 9-10
# % # % # %
Counting and Cardinality n/a n/a n/a n/a n/a n/a
Geometry 1 25 4 44 n/a n/a
Measurement and Data 3 43 n/a n/a n/a n/a
Number and Operations in Base Ten 3 50 n/a n/a n/a n/a
Operations and Algebraic Thinking 2 67 n/a n/a n/a n/a
Number and Operations—Fractions 4 57 n/a n/a n/a n/a
Ratios and Proportional Relationships n/a n/a 1 33 n/a n/a
Expressions and Equations n/a n/a 3 38 n/a n/a
Functions n/a n/a 2 40 n/a n/a
The Number System n/a n/a 1 50 n/a n/a
Statistics and Probability n/a n/a 0 0 n/a n/a
Circles n/a n/a n/a n/a 1 100
Creating Equations n/a n/a n/a n/a 0 0
Congruence n/a n/a n/a n/a 0 0
Geometric Measurement and Dimension n/a n/a n/a n/a 0 0
Making Inferences and Justifying Conclusions n/a n/a n/a n/a 1 100
Interpreting Categorical and Quantitative Data
n/a n/a n/a n/a 1 20
Modeling with Geometry n/a n/a n/a n/a 0 0
Reasoning with Equations and Inequalities n/a n/a n/a n/a 0 0
Similarity, Right Triangles, and Trigonometry n/a n/a n/a n/a 1 50
Seeing Structure in Expressions n/a n/a n/a n/a 2 67
The generally high balance of representation values reported for all grade bands in mathematics indicate relatively even representation of the standards and GBEs within each domain. This finding reflects the structure of the DCAS-Alt1, in which four to eight items are grouped into tasks and aligned to the same GBEs; while a relatively low number of GBEs are represented (as indicated by the range of knowledge values), there is a comparatively even emphasis on the GBEs represented by the items.
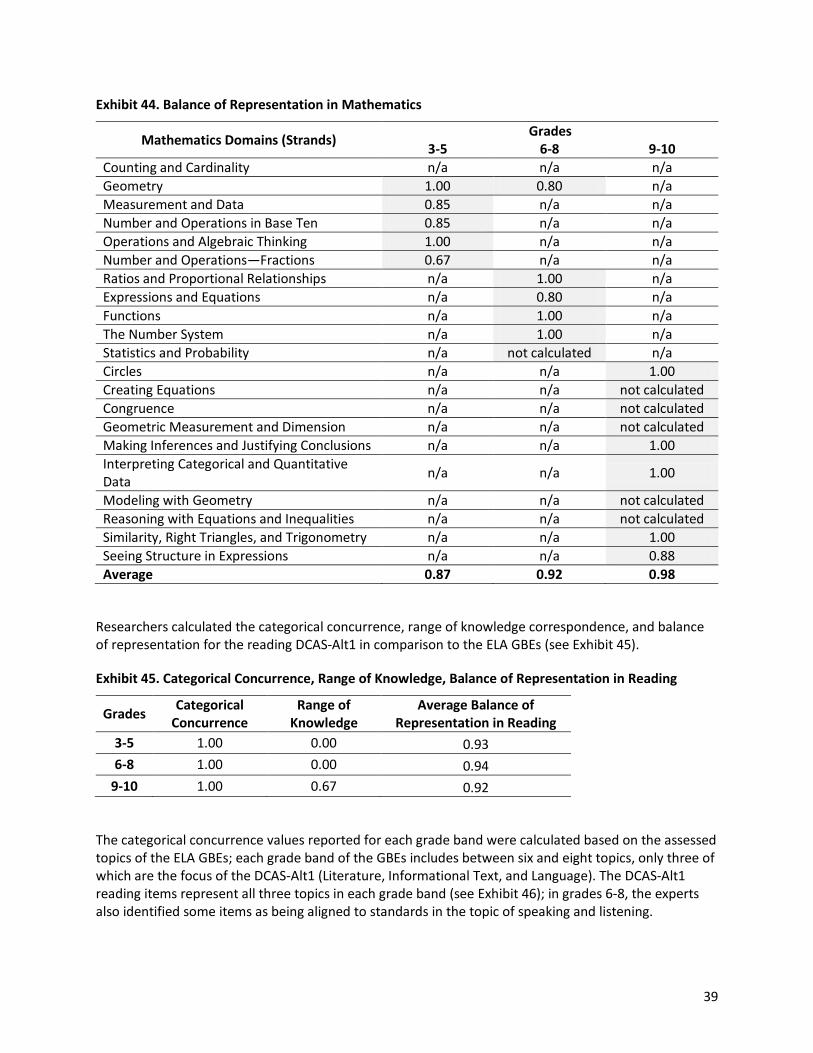
39
Exhibit 44. Balance of Representation in Mathematics
Mathematics Domains (Strands) Grades
3-5 6-8 9-10
Counting and Cardinality n/a n/a n/a
Geometry 1.00 0.80 n/a
Measurement and Data 0.85 n/a n/a
Number and Operations in Base Ten 0.85 n/a n/a
Operations and Algebraic Thinking 1.00 n/a n/a
Number and Operations—Fractions 0.67 n/a n/a
Ratios and Proportional Relationships n/a 1.00 n/a
Expressions and Equations n/a 0.80 n/a
Functions n/a 1.00 n/a
The Number System n/a 1.00 n/a
Statistics and Probability n/a not calculated n/a
Circles n/a n/a 1.00
Creating Equations n/a n/a not calculated
Congruence n/a n/a not calculated
Geometric Measurement and Dimension n/a n/a not calculated
Making Inferences and Justifying Conclusions n/a n/a 1.00
Interpreting Categorical and Quantitative Data
n/a n/a 1.00
Modeling with Geometry n/a n/a not calculated
Reasoning with Equations and Inequalities n/a n/a not calculated
Similarity, Right Triangles, and Trigonometry n/a n/a 1.00
Seeing Structure in Expressions n/a n/a 0.88
Average 0.87 0.92 0.98
Researchers calculated the categorical concurrence, range of knowledge correspondence, and balance of representation for the reading DCAS-Alt1 in comparison to the ELA GBEs (see Exhibit 45).
Exhibit 45. Categorical Concurrence, Range of Knowledge, Balance of Representation in Reading
Grades Categorical
Concurrence Range of
Knowledge Average Balance of
Representation in Reading
3-5 1.00 0.00 0.93
6-8 1.00 0.00 0.94
9-10 1.00 0.67 0.92
The categorical concurrence values reported for each grade band were calculated based on the assessed topics of the ELA GBEs; each grade band of the GBEs includes between six and eight topics, only three of which are the focus of the DCAS-Alt1 (Literature, Informational Text, and Language). The DCAS-Alt1 reading items represent all three topics in each grade band (see Exhibit 46); in grades 6-8, the experts also identified some items as being aligned to standards in the topic of speaking and listening.
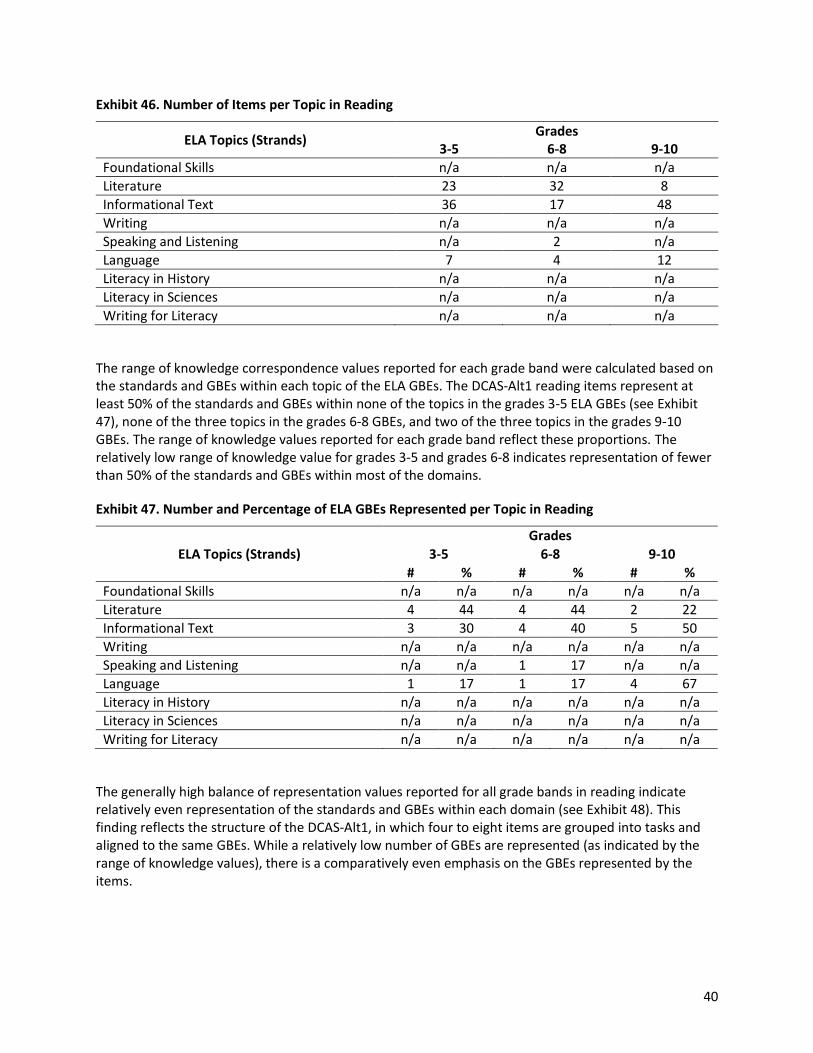
40
Exhibit 46. Number of Items per Topic in Reading
ELA Topics (Strands) Grades
3-5 6-8 9-10
Foundational Skills n/a n/a n/a
Literature 23 32 8
Informational Text 36 17 48
Writing n/a n/a n/a
Speaking and Listening n/a 2 n/a
Language 7 4 12
Literacy in History n/a n/a n/a
Literacy in Sciences n/a n/a n/a
Writing for Literacy n/a n/a n/a
The range of knowledge correspondence values reported for each grade band were calculated based on the standards and GBEs within each topic of the ELA GBEs. The DCAS-Alt1 reading items represent at least 50% of the standards and GBEs within none of the topics in the grades 3-5 ELA GBEs (see Exhibit 47), none of the three topics in the grades 6-8 GBEs, and two of the three topics in the grades 9-10 GBEs. The range of knowledge values reported for each grade band reflect these proportions. The relatively low range of knowledge value for grades 3-5 and grades 6-8 indicates representation of fewer than 50% of the standards and GBEs within most of the domains.
Exhibit 47. Number and Percentage of ELA GBEs Represented per Topic in Reading
ELA Topics (Strands)
Grades
3-5 6-8 9-10
# % # % # %
Foundational Skills n/a n/a n/a n/a n/a n/a
Literature 4 44 4 44 2 22
Informational Text 3 30 4 40 5 50
Writing n/a n/a n/a n/a n/a n/a
Speaking and Listening n/a n/a 1 17 n/a n/a
Language 1 17 1 17 4 67
Literacy in History n/a n/a n/a n/a n/a n/a
Literacy in Sciences n/a n/a n/a n/a n/a n/a
Writing for Literacy n/a n/a n/a n/a n/a n/a
The generally high balance of representation values reported for all grade bands in reading indicate relatively even representation of the standards and GBEs within each domain (see Exhibit 48). This finding reflects the structure of the DCAS-Alt1, in which four to eight items are grouped into tasks and aligned to the same GBEs. While a relatively low number of GBEs are represented (as indicated by the range of knowledge values), there is a comparatively even emphasis on the GBEs represented by the items.
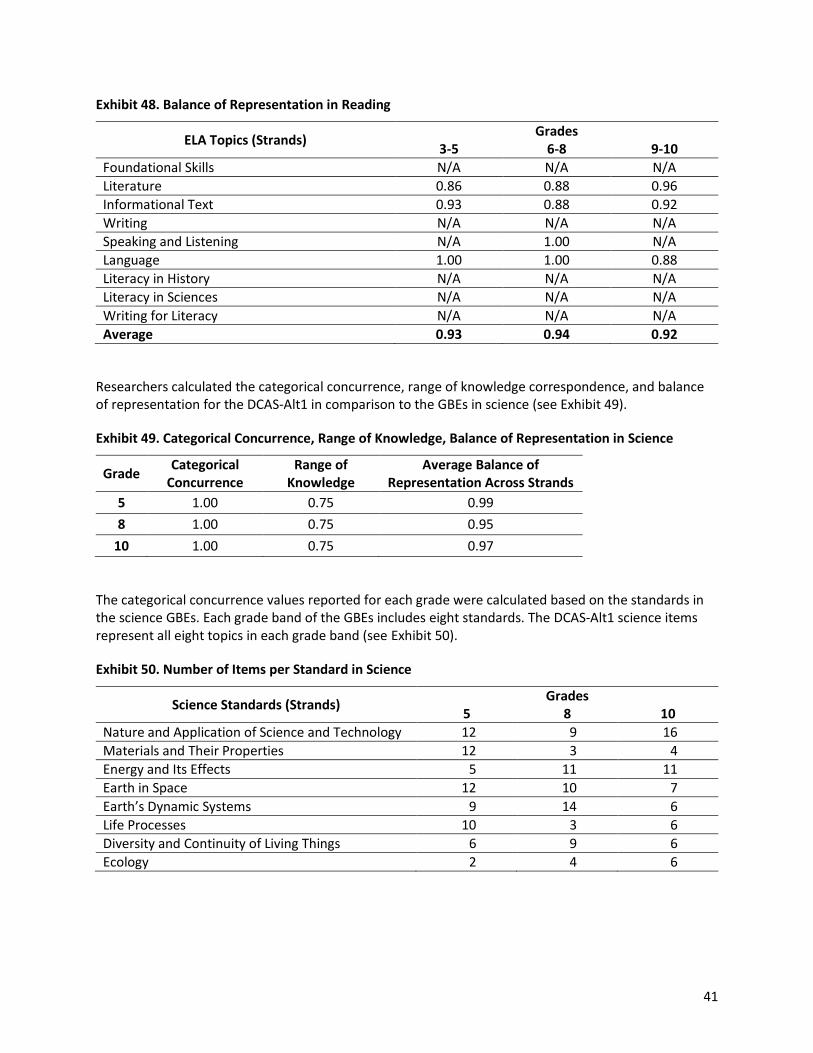
41
Exhibit 48. Balance of Representation in Reading
ELA Topics (Strands) Grades
3-5 6-8 9-10
Foundational Skills N/A N/A N/A
Literature 0.86 0.88 0.96
Informational Text 0.93 0.88 0.92
Writing N/A N/A N/A
Speaking and Listening N/A 1.00 N/A
Language 1.00 1.00 0.88
Literacy in History N/A N/A N/A
Literacy in Sciences N/A N/A N/A
Writing for Literacy N/A N/A N/A
Average 0.93 0.94 0.92
Researchers calculated the categorical concurrence, range of knowledge correspondence, and balance of representation for the DCAS-Alt1 in comparison to the GBEs in science (see Exhibit 49).
Exhibit 49. Categorical Concurrence, Range of Knowledge, Balance of Representation in Science
Grade Categorical
Concurrence Range of
Knowledge Average Balance of
Representation Across Strands
5 1.00 0.75 0.99
8 1.00 0.75 0.95
10 1.00 0.75 0.97
The categorical concurrence values reported for each grade were calculated based on the standards in the science GBEs. Each grade band of the GBEs includes eight standards. The DCAS-Alt1 science items represent all eight topics in each grade band (see Exhibit 50).
Exhibit 50. Number of Items per Standard in Science
Science Standards (Strands) Grades
5 8 10
Nature and Application of Science and Technology 12 9 16
Materials and Their Properties 12 3 4
Energy and Its Effects 5 11 11
Earth in Space 12 10 7
Earth’s Dynamic Systems 9 14 6
Life Processes 10 3 6
Diversity and Continuity of Living Things 6 9 6
Ecology 2 4 6
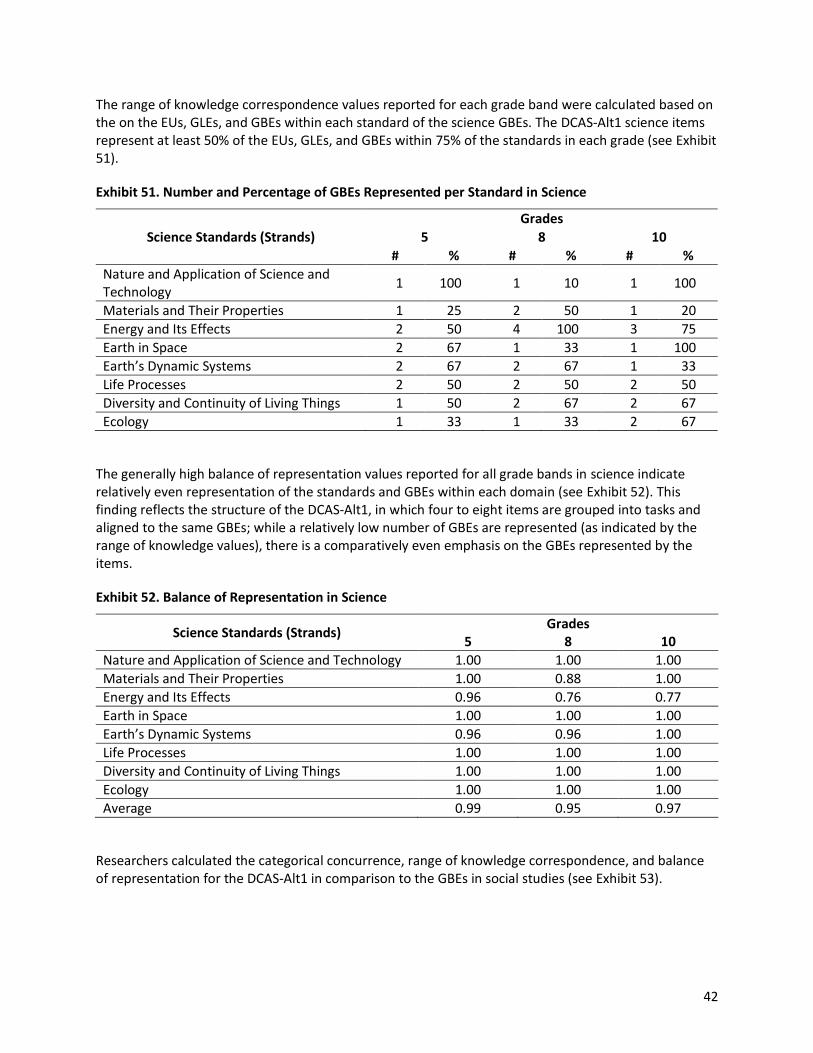
42
The range of knowledge correspondence values reported for each grade band were calculated based on the on the EUs, GLEs, and GBEs within each standard of the science GBEs. The DCAS-Alt1 science items represent at least 50% of the EUs, GLEs, and GBEs within 75% of the standards in each grade (see Exhibit 51).
Exhibit 51. Number and Percentage of GBEs Represented per Standard in Science
Science Standards (Strands)
Grades
5 8 10
# % # % # %
Nature and Application of Science and Technology
1 100 1 10 1 100
Materials and Their Properties 1 25 2 50 1 20
Energy and Its Effects 2 50 4 100 3 75
Earth in Space 2 67 1 33 1 100
Earth’s Dynamic Systems 2 67 2 67 1 33
Life Processes 2 50 2 50 2 50
Diversity and Continuity of Living Things 1 50 2 67 2 67
Ecology 1 33 1 33 2 67
The generally high balance of representation values reported for all grade bands in science indicate relatively even representation of the standards and GBEs within each domain (see Exhibit 52). This finding reflects the structure of the DCAS-Alt1, in which four to eight items are grouped into tasks and aligned to the same GBEs; while a relatively low number of GBEs are represented (as indicated by the range of knowledge values), there is a comparatively even emphasis on the GBEs represented by the items.
Exhibit 52. Balance of Representation in Science
Science Standards (Strands) Grades
5 8 10
Nature and Application of Science and Technology 1.00 1.00 1.00
Materials and Their Properties 1.00 0.88 1.00
Energy and Its Effects 0.96 0.76 0.77
Earth in Space 1.00 1.00 1.00
Earth’s Dynamic Systems 0.96 0.96 1.00
Life Processes 1.00 1.00 1.00
Diversity and Continuity of Living Things 1.00 1.00 1.00
Ecology 1.00 1.00 1.00
Average 0.99 0.95 0.97
Researchers calculated the categorical concurrence, range of knowledge correspondence, and balance of representation for the DCAS-Alt1 in comparison to the GBEs in social studies (see Exhibit 53).
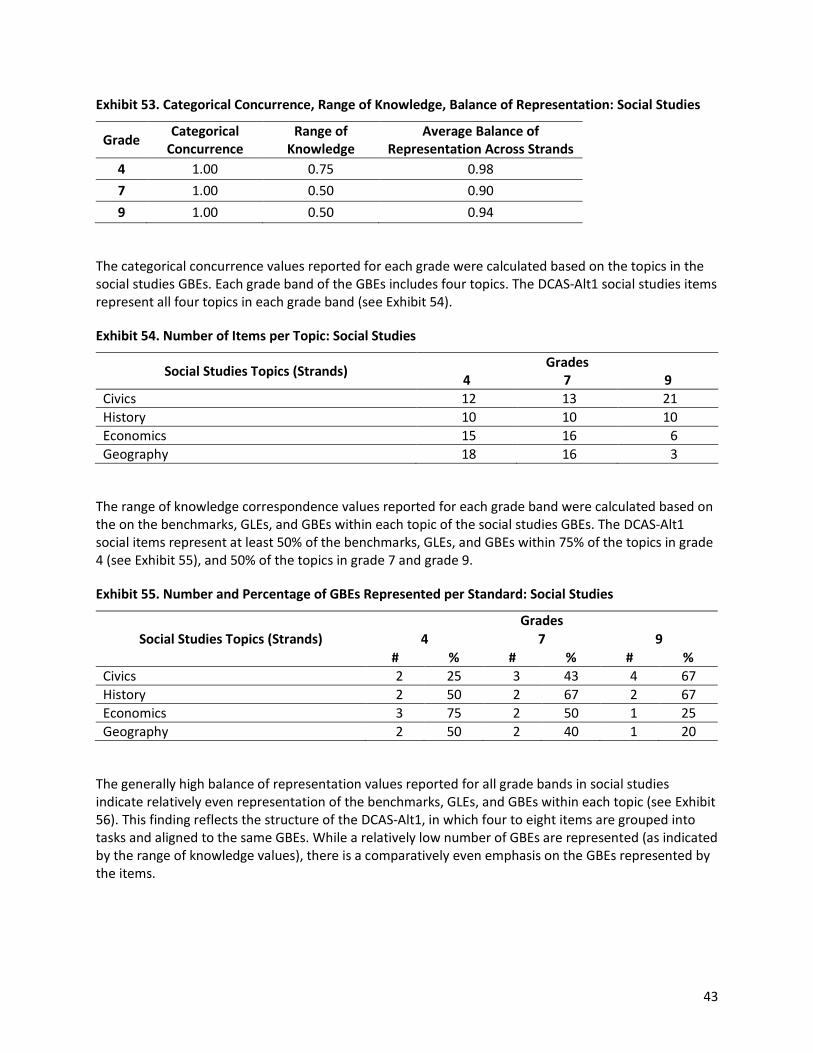
43
Exhibit 53. Categorical Concurrence, Range of Knowledge, Balance of Representation: Social Studies
Grade Categorical
Concurrence Range of
Knowledge Average Balance of
Representation Across Strands
4 1.00 0.75 0.98
7 1.00 0.50 0.90
9 1.00 0.50 0.94
The categorical concurrence values reported for each grade were calculated based on the topics in the social studies GBEs. Each grade band of the GBEs includes four topics. The DCAS-Alt1 social studies items represent all four topics in each grade band (see Exhibit 54).
Exhibit 54. Number of Items per Topic: Social Studies
Social Studies Topics (Strands) Grades
4 7 9
Civics 12 13 21
History 10 10 10
Economics 15 16 6
Geography 18 16 3
The range of knowledge correspondence values reported for each grade band were calculated based on the on the benchmarks, GLEs, and GBEs within each topic of the social studies GBEs. The DCAS-Alt1 social items represent at least 50% of the benchmarks, GLEs, and GBEs within 75% of the topics in grade 4 (see Exhibit 55), and 50% of the topics in grade 7 and grade 9.
Exhibit 55. Number and Percentage of GBEs Represented per Standard: Social Studies
Social Studies Topics (Strands)
Grades
4 7 9
# % # % # %
Civics 2 25 3 43 4 67
History 2 50 2 67 2 67
Economics 3 75 2 50 1 25
Geography 2 50 2 40 1 20
The generally high balance of representation values reported for all grade bands in social studies indicate relatively even representation of the benchmarks, GLEs, and GBEs within each topic (see Exhibit 56). This finding reflects the structure of the DCAS-Alt1, in which four to eight items are grouped into tasks and aligned to the same GBEs. While a relatively low number of GBEs are represented (as indicated by the range of knowledge values), there is a comparatively even emphasis on the GBEs represented by the items.
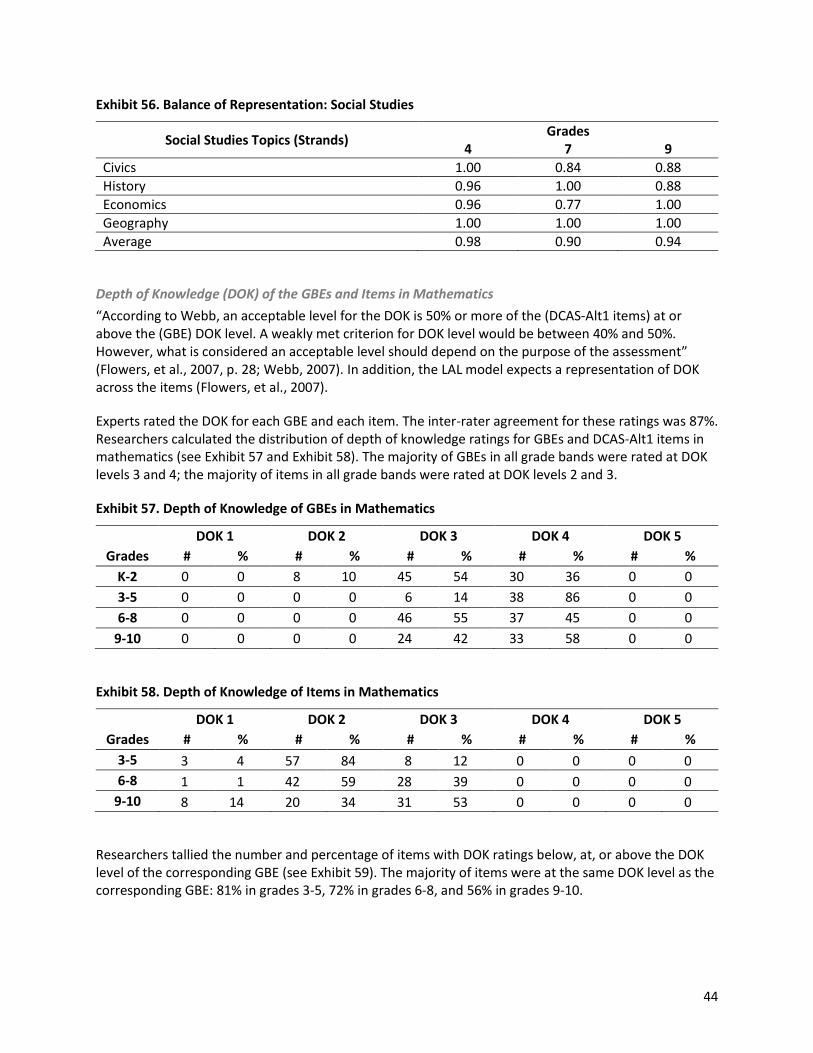
44
Exhibit 56. Balance of Representation: Social Studies
Social Studies Topics (Strands) Grades
4 7 9
Civics 1.00 0.84 0.88
History 0.96 1.00 0.88
Economics 0.96 0.77 1.00
Geography 1.00 1.00 1.00
Average 0.98 0.90 0.94
Depth of Knowledge (DOK) of the GBEs and Items in Mathematics
“According to Webb, an acceptable level for the DOK is 50% or more of the (DCAS-Alt1 items) at or above the (GBE) DOK level. A weakly met criterion for DOK level would be between 40% and 50%. However, what is considered an acceptable level should depend on the purpose of the assessment” (Flowers, et al., 2007, p. 28; Webb, 2007). In addition, the LAL model expects a representation of DOK across the items (Flowers, et al., 2007).
Experts rated the DOK for each GBE and each item. The inter-rater agreement for these ratings was 87%. Researchers calculated the distribution of depth of knowledge ratings for GBEs and DCAS-Alt1 items in mathematics (see Exhibit 57 and Exhibit 58). The majority of GBEs in all grade bands were rated at DOK levels 3 and 4; the majority of items in all grade bands were rated at DOK levels 2 and 3.
Exhibit 57. Depth of Knowledge of GBEs in Mathematics
DOK 1 DOK 2 DOK 3 DOK 4 DOK 5
Grades # % # % # % # % # %
K-2 0 0 8 10 45 54 30 36 0 0
3-5 0 0 0 0 6 14 38 86 0 0
6-8 0 0 0 0 46 55 37 45 0 0
9-10 0 0 0 0 24 42 33 58 0 0
Exhibit 58. Depth of Knowledge of Items in Mathematics
DOK 1 DOK 2 DOK 3 DOK 4 DOK 5
Grades # % # % # % # % # %
3-5 3 4 57 84 8 12 0 0 0 0
6-8 1 1 42 59 28 39 0 0 0 0
9-10 8 14 20 34 31 53 0 0 0 0
Researchers tallied the number and percentage of items with DOK ratings below, at, or above the DOK level of the corresponding GBE (see Exhibit 59). The majority of items were at the same DOK level as the corresponding GBE: 81% in grades 3-5, 72% in grades 6-8, and 56% in grades 9-10.
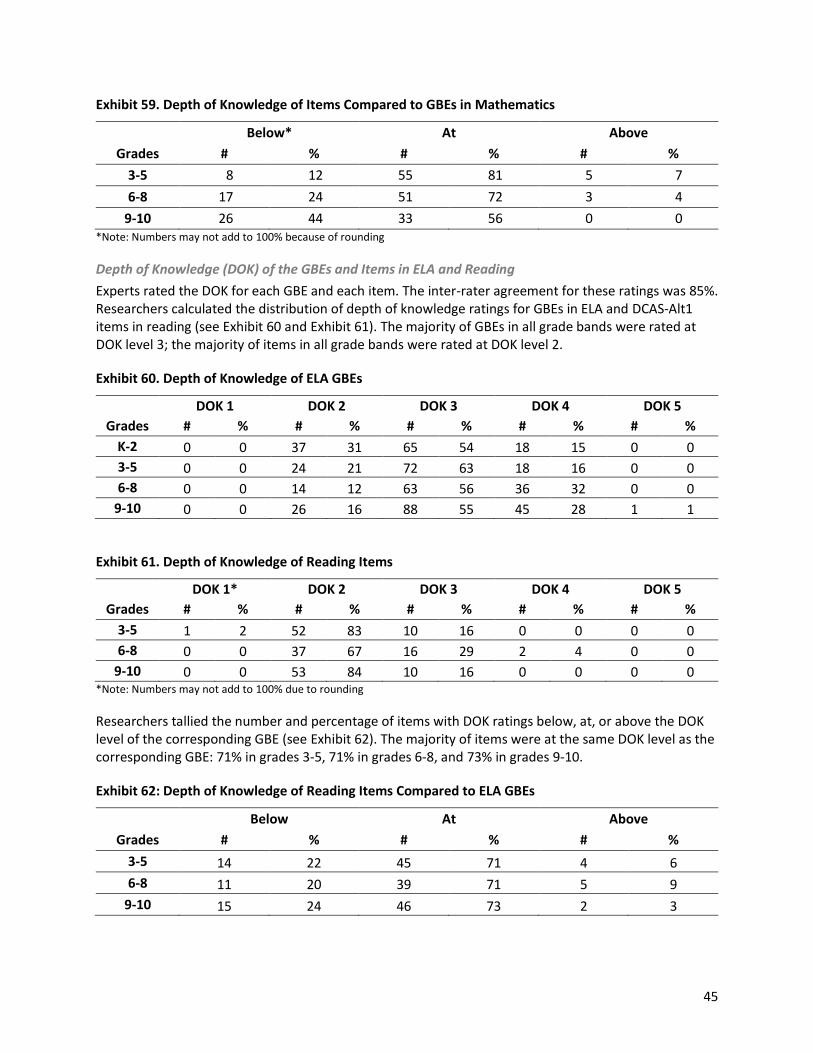
45
Exhibit 59. Depth of Knowledge of Items Compared to GBEs in Mathematics
Below* At Above
Grades # % # % # %
3-5 8 12 55 81 5 7
6-8 17 24 51 72 3 4
9-10 26 44 33 56 0 0 *Note: Numbers may not add to 100% because of rounding
Depth of Knowledge (DOK) of the GBEs and Items in ELA and Reading
Experts rated the DOK for each GBE and each item. The inter-rater agreement for these ratings was 85%. Researchers calculated the distribution of depth of knowledge ratings for GBEs in ELA and DCAS-Alt1 items in reading (see Exhibit 60 and Exhibit 61). The majority of GBEs in all grade bands were rated at DOK level 3; the majority of items in all grade bands were rated at DOK level 2.
Exhibit 60. Depth of Knowledge of ELA GBEs
DOK 1 DOK 2 DOK 3 DOK 4 DOK 5
Grades # % # % # % # % # %
K-2 0 0 37 31 65 54 18 15 0 0
3-5 0 0 24 21 72 63 18 16 0 0
6-8 0 0 14 12 63 56 36 32 0 0
9-10 0 0 26 16 88 55 45 28 1 1
Exhibit 61. Depth of Knowledge of Reading Items
DOK 1* DOK 2 DOK 3 DOK 4 DOK 5
Grades # % # % # % # % # %
3-5 1 2 52 83 10 16 0 0 0 0
6-8 0 0 37 67 16 29 2 4 0 0
9-10 0 0 53 84 10 16 0 0 0 0 *Note: Numbers may not add to 100% due to rounding
Researchers tallied the number and percentage of items with DOK ratings below, at, or above the DOK level of the corresponding GBE (see Exhibit 62). The majority of items were at the same DOK level as the corresponding GBE: 71% in grades 3-5, 71% in grades 6-8, and 73% in grades 9-10.
Exhibit 62: Depth of Knowledge of Reading Items Compared to ELA GBEs
Below At Above
Grades # % # % # %
3-5 14 22 45 71 4 6
6-8 11 20 39 71 5 9
9-10 15 24 46 73 2 3
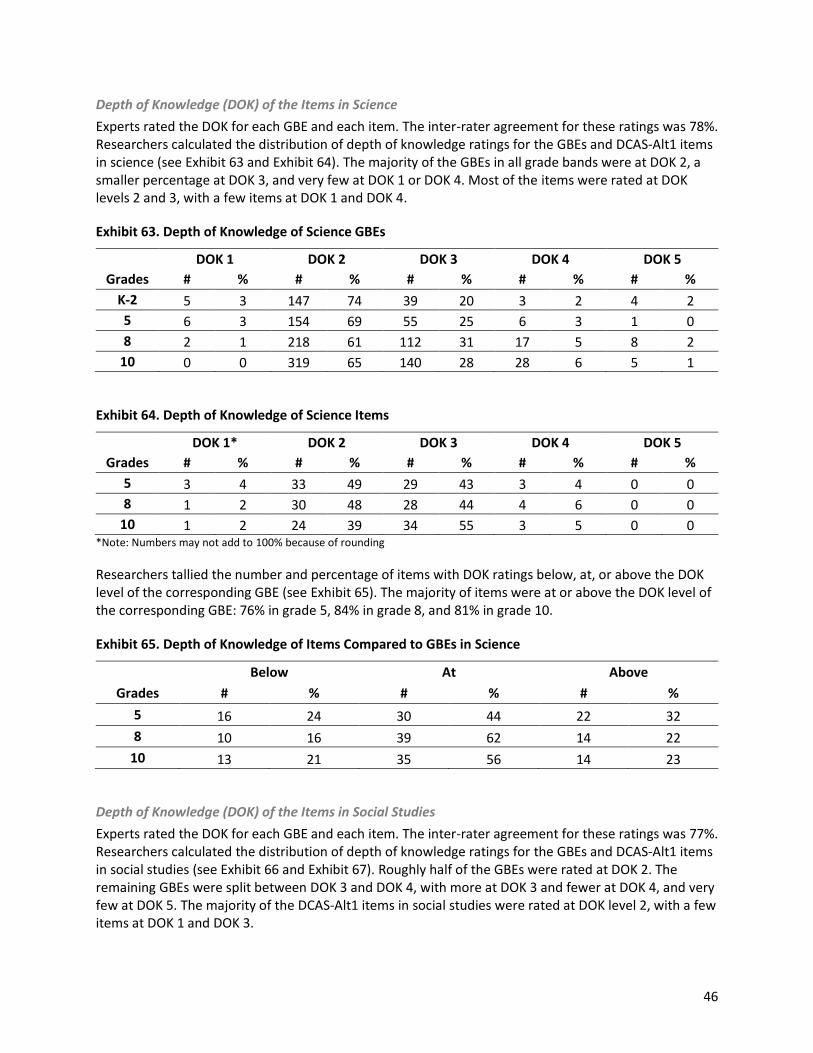
46
Depth of Knowledge (DOK) of the Items in Science
Experts rated the DOK for each GBE and each item. The inter-rater agreement for these ratings was 78%. Researchers calculated the distribution of depth of knowledge ratings for the GBEs and DCAS-Alt1 items in science (see Exhibit 63 and Exhibit 64). The majority of the GBEs in all grade bands were at DOK 2, a smaller percentage at DOK 3, and very few at DOK 1 or DOK 4. Most of the items were rated at DOK levels 2 and 3, with a few items at DOK 1 and DOK 4.
Exhibit 63. Depth of Knowledge of Science GBEs
DOK 1 DOK 2 DOK 3 DOK 4 DOK 5
Grades # % # % # % # % # %
K-2 5 3 147 74 39 20 3 2 4 2
5 6 3 154 69 55 25 6 3 1 0
8 2 1 218 61 112 31 17 5 8 2
10 0 0 319 65 140 28 28 6 5 1
Exhibit 64. Depth of Knowledge of Science Items
DOK 1* DOK 2 DOK 3 DOK 4 DOK 5
Grades # % # % # % # % # %
5 3 4 33 49 29 43 3 4 0 0
8 1 2 30 48 28 44 4 6 0 0
10 1 2 24 39 34 55 3 5 0 0 *Note: Numbers may not add to 100% because of rounding
Researchers tallied the number and percentage of items with DOK ratings below, at, or above the DOK level of the corresponding GBE (see Exhibit 65). The majority of items were at or above the DOK level of the corresponding GBE: 76% in grade 5, 84% in grade 8, and 81% in grade 10.
Exhibit 65. Depth of Knowledge of Items Compared to GBEs in Science
Below At Above
Grades # % # % # %
5 16 24 30 44 22 32
8 10 16 39 62 14 22
10 13 21 35 56 14 23
Depth of Knowledge (DOK) of the Items in Social Studies
Experts rated the DOK for each GBE and each item. The inter-rater agreement for these ratings was 77%. Researchers calculated the distribution of depth of knowledge ratings for the GBEs and DCAS-Alt1 items in social studies (see Exhibit 66 and Exhibit 67). Roughly half of the GBEs were rated at DOK 2. The remaining GBEs were split between DOK 3 and DOK 4, with more at DOK 3 and fewer at DOK 4, and very few at DOK 5. The majority of the DCAS-Alt1 items in social studies were rated at DOK level 2, with a few items at DOK 1 and DOK 3.
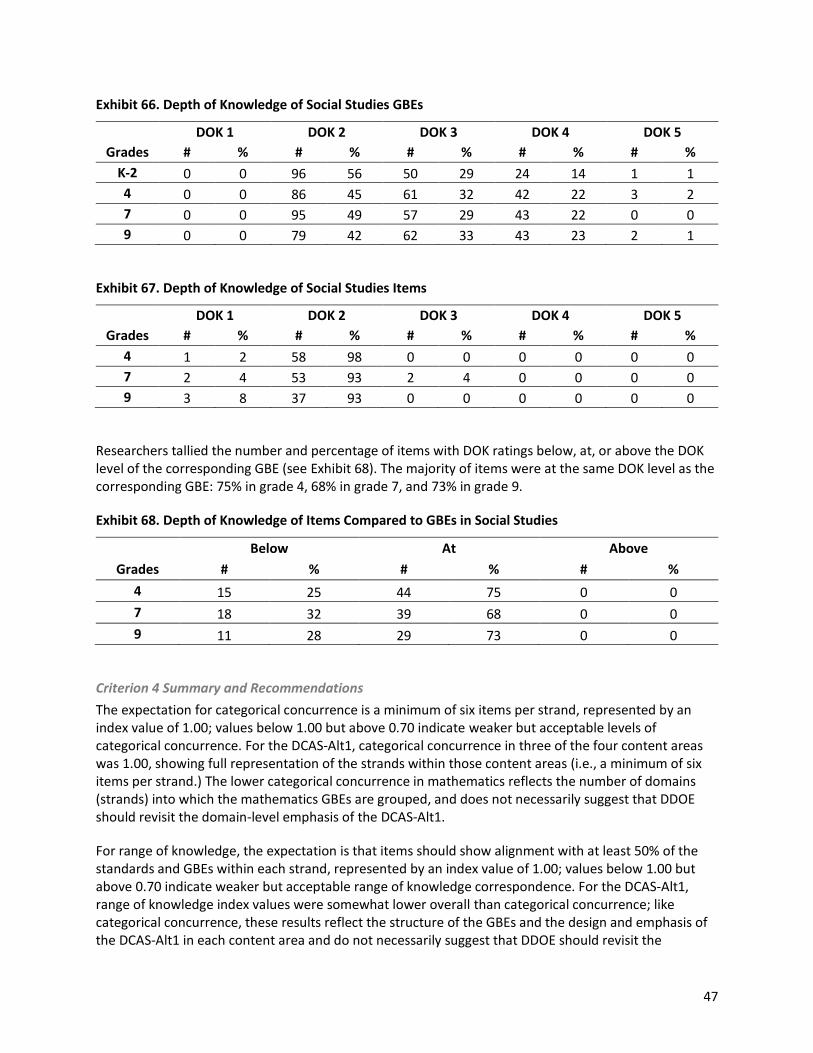
47
Exhibit 66. Depth of Knowledge of Social Studies GBEs
DOK 1 DOK 2 DOK 3 DOK 4 DOK 5
Grades # % # % # % # % # %
K-2 0 0 96 56 50 29 24 14 1 1
4 0 0 86 45 61 32 42 22 3 2
7 0 0 95 49 57 29 43 22 0 0
9 0 0 79 42 62 33 43 23 2 1
Exhibit 67. Depth of Knowledge of Social Studies Items
DOK 1 DOK 2 DOK 3 DOK 4 DOK 5
Grades # % # % # % # % # %
4 1 2 58 98 0 0 0 0 0 0
7 2 4 53 93 2 4 0 0 0 0
9 3 8 37 93 0 0 0 0 0 0
Researchers tallied the number and percentage of items with DOK ratings below, at, or above the DOK level of the corresponding GBE (see Exhibit 68). The majority of items were at the same DOK level as the corresponding GBE: 75% in grade 4, 68% in grade 7, and 73% in grade 9.
Exhibit 68. Depth of Knowledge of Items Compared to GBEs in Social Studies
Below At Above
Grades # % # % # %
4 15 25 44 75 0 0
7 18 32 39 68 0 0
9 11 28 29 73 0 0
Criterion 4 Summary and Recommendations
The expectation for categorical concurrence is a minimum of six items per strand, represented by an index value of 1.00; values below 1.00 but above 0.70 indicate weaker but acceptable levels of categorical concurrence. For the DCAS-Alt1, categorical concurrence in three of the four content areas was 1.00, showing full representation of the strands within those content areas (i.e., a minimum of six items per strand.) The lower categorical concurrence in mathematics reflects the number of domains (strands) into which the mathematics GBEs are grouped, and does not necessarily suggest that DDOE should revisit the domain-level emphasis of the DCAS-Alt1.
For range of knowledge, the expectation is that items should show alignment with at least 50% of the standards and GBEs within each strand, represented by an index value of 1.00; values below 1.00 but above 0.70 indicate weaker but acceptable range of knowledge correspondence. For the DCAS-Alt1, range of knowledge index values were somewhat lower overall than categorical concurrence; like categorical concurrence, these results reflect the structure of the GBEs and the design and emphasis of the DCAS-Alt1 in each content area and do not necessarily suggest that DDOE should revisit the
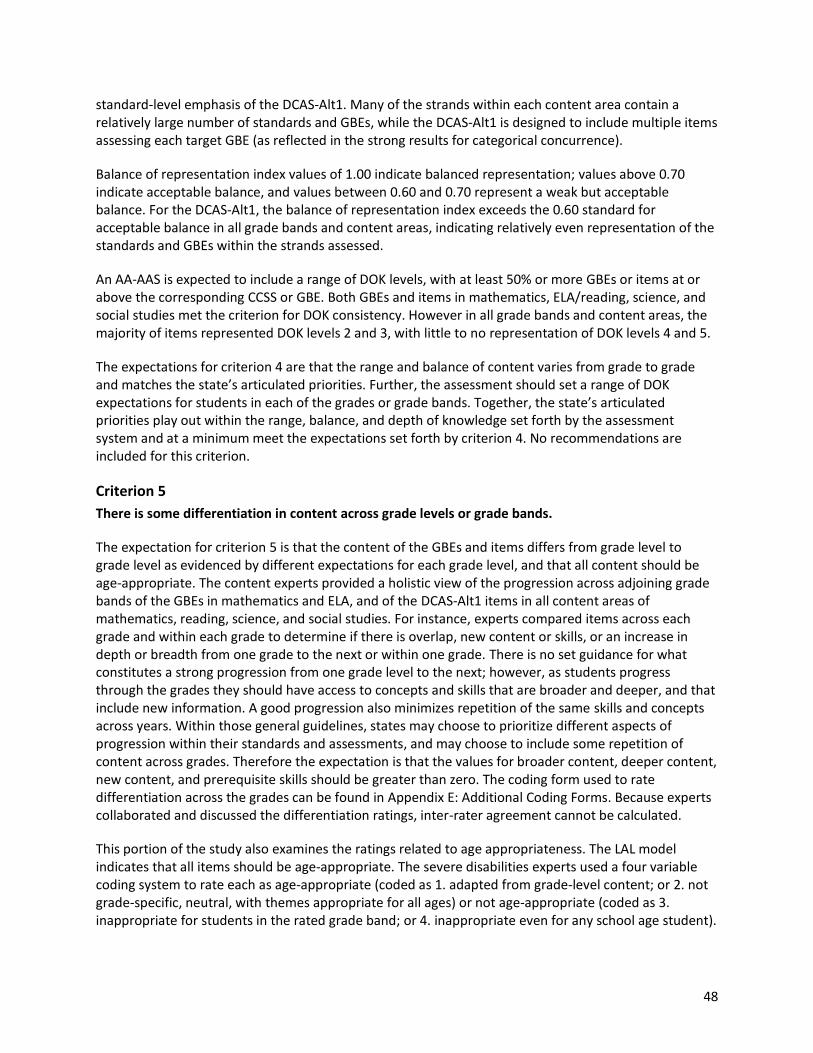
48
standard-level emphasis of the DCAS-Alt1. Many of the strands within each content area contain a relatively large number of standards and GBEs, while the DCAS-Alt1 is designed to include multiple items assessing each target GBE (as reflected in the strong results for categorical concurrence).
Balance of representation index values of 1.00 indicate balanced representation; values above 0.70 indicate acceptable balance, and values between 0.60 and 0.70 represent a weak but acceptable balance. For the DCAS-Alt1, the balance of representation index exceeds the 0.60 standard for acceptable balance in all grade bands and content areas, indicating relatively even representation of the standards and GBEs within the strands assessed.
An AA-AAS is expected to include a range of DOK levels, with at least 50% or more GBEs or items at or above the corresponding CCSS or GBE. Both GBEs and items in mathematics, ELA/reading, science, and social studies met the criterion for DOK consistency. However in all grade bands and content areas, the majority of items represented DOK levels 2 and 3, with little to no representation of DOK levels 4 and 5.
The expectations for criterion 4 are that the range and balance of content varies from grade to grade and matches the state’s articulated priorities. Further, the assessment should set a range of DOK expectations for students in each of the grades or grade bands. Together, the state’s articulated priorities play out within the range, balance, and depth of knowledge set forth by the assessment system and at a minimum meet the expectations set forth by criterion 4. No recommendations are included for this criterion.
Criterion 5
There is some differentiation in content across grade levels or grade bands.
The expectation for criterion 5 is that the content of the GBEs and items differs from grade level to grade level as evidenced by different expectations for each grade level, and that all content should be age-appropriate. The content experts provided a holistic view of the progression across adjoining grade bands of the GBEs in mathematics and ELA, and of the DCAS-Alt1 items in all content areas of mathematics, reading, science, and social studies. For instance, experts compared items across each grade and within each grade to determine if there is overlap, new content or skills, or an increase in depth or breadth from one grade to the next or within one grade. There is no set guidance for what constitutes a strong progression from one grade level to the next; however, as students progress through the grades they should have access to concepts and skills that are broader and deeper, and that include new information. A good progression also minimizes repetition of the same skills and concepts across years. Within those general guidelines, states may choose to prioritize different aspects of progression within their standards and assessments, and may choose to include some repetition of content across grades. Therefore the expectation is that the values for broader content, deeper content, new content, and prerequisite skills should be greater than zero. The coding form used to rate differentiation across the grades can be found in Appendix E: Additional Coding Forms. Because experts collaborated and discussed the differentiation ratings, inter-rater agreement cannot be calculated.
This portion of the study also examines the ratings related to age appropriateness. The LAL model indicates that all items should be age-appropriate. The severe disabilities experts used a four variable coding system to rate each as age-appropriate (coded as 1. adapted from grade-level content; or 2. not grade-specific, neutral, with themes appropriate for all ages) or not age-appropriate (coded as 3. inappropriate for students in the rated grade band; or 4. inappropriate even for any school age student).
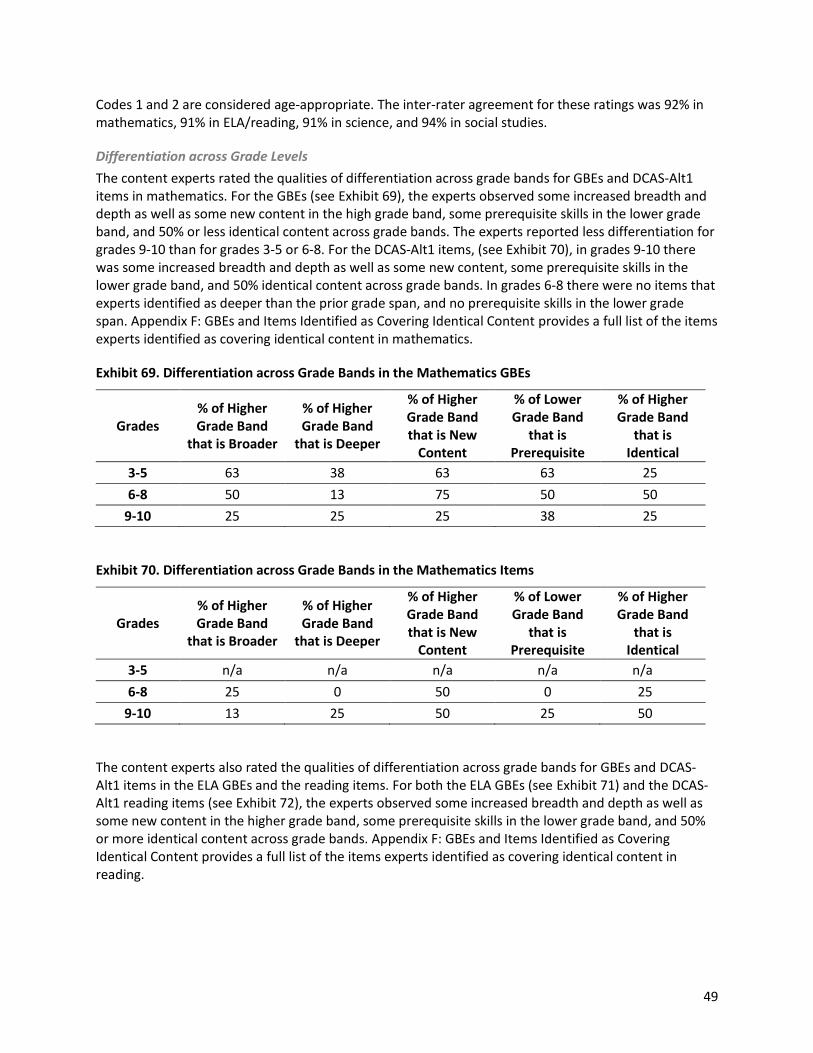
49
Codes 1 and 2 are considered age-appropriate. The inter-rater agreement for these ratings was 92% in mathematics, 91% in ELA/reading, 91% in science, and 94% in social studies.
Differentiation across Grade Levels
The content experts rated the qualities of differentiation across grade bands for GBEs and DCAS-Alt1 items in mathematics. For the GBEs (see Exhibit 69), the experts observed some increased breadth and depth as well as some new content in the high grade band, some prerequisite skills in the lower grade band, and 50% or less identical content across grade bands. The experts reported less differentiation for grades 9-10 than for grades 3-5 or 6-8. For the DCAS-Alt1 items, (see Exhibit 70), in grades 9-10 there was some increased breadth and depth as well as some new content, some prerequisite skills in the lower grade band, and 50% identical content across grade bands. In grades 6-8 there were no items that experts identified as deeper than the prior grade span, and no prerequisite skills in the lower grade span. Appendix F: GBEs and Items Identified as Covering Identical Content provides a full list of the items experts identified as covering identical content in mathematics.
Exhibit 69. Differentiation across Grade Bands in the Mathematics GBEs
Grades % of Higher Grade Band
that is Broader
% of Higher Grade Band
that is Deeper
% of Higher Grade Band that is New
Content
% of Lower Grade Band
that is Prerequisite
% of Higher Grade Band
that is Identical
3-5 63 38 63 63 25
6-8 50 13 75 50 50
9-10 25 25 25 38 25
Exhibit 70. Differentiation across Grade Bands in the Mathematics Items
Grades % of Higher Grade Band
that is Broader
% of Higher Grade Band
that is Deeper
% of Higher Grade Band that is New
Content
% of Lower Grade Band
that is Prerequisite
% of Higher Grade Band
that is Identical
3-5 n/a n/a n/a n/a n/a
6-8 25 0 50 0 25
9-10 13 25 50 25 50
The content experts also rated the qualities of differentiation across grade bands for GBEs and DCAS-Alt1 items in the ELA GBEs and the reading items. For both the ELA GBEs (see Exhibit 71) and the DCAS-Alt1 reading items (see Exhibit 72), the experts observed some increased breadth and depth as well as some new content in the higher grade band, some prerequisite skills in the lower grade band, and 50% or more identical content across grade bands. Appendix F: GBEs and Items Identified as Covering Identical Content provides a full list of the items experts identified as covering identical content in reading.
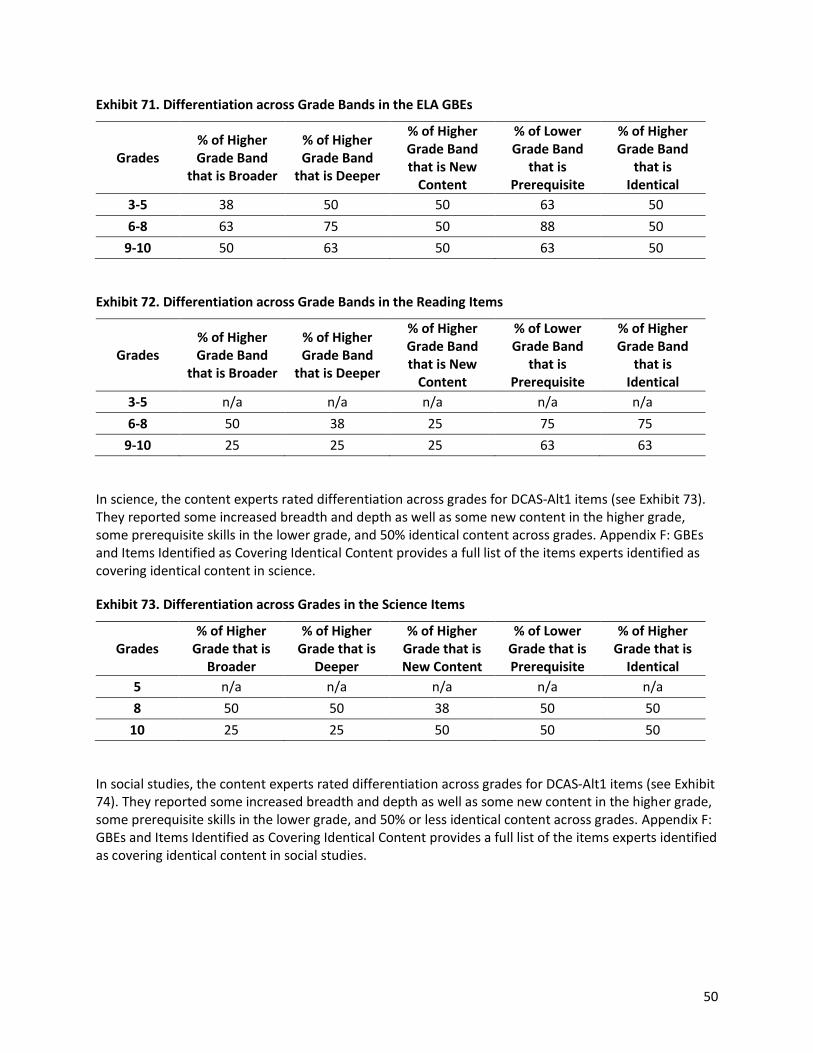
50
Exhibit 71. Differentiation across Grade Bands in the ELA GBEs
Grades % of Higher Grade Band
that is Broader
% of Higher Grade Band
that is Deeper
% of Higher Grade Band that is New
Content
% of Lower Grade Band
that is Prerequisite
% of Higher Grade Band
that is Identical
3-5 38 50 50 63 50
6-8 63 75 50 88 50
9-10 50 63 50 63 50
Exhibit 72. Differentiation across Grade Bands in the Reading Items
Grades % of Higher Grade Band
that is Broader
% of Higher Grade Band
that is Deeper
% of Higher Grade Band that is New
Content
% of Lower Grade Band
that is Prerequisite
% of Higher Grade Band
that is Identical
3-5 n/a n/a n/a n/a n/a
6-8 50 38 25 75 75
9-10 25 25 25 63 63
In science, the content experts rated differentiation across grades for DCAS-Alt1 items (see Exhibit 73). They reported some increased breadth and depth as well as some new content in the higher grade, some prerequisite skills in the lower grade, and 50% identical content across grades. Appendix F: GBEs and Items Identified as Covering Identical Content provides a full list of the items experts identified as covering identical content in science.
Exhibit 73. Differentiation across Grades in the Science Items
Grades % of Higher
Grade that is Broader
% of Higher Grade that is
Deeper
% of Higher Grade that is New Content
% of Lower Grade that is Prerequisite
% of Higher Grade that is
Identical
5 n/a n/a n/a n/a n/a
8 50 50 38 50 50
10 25 25 50 50 50
In social studies, the content experts rated differentiation across grades for DCAS-Alt1 items (see Exhibit 74). They reported some increased breadth and depth as well as some new content in the higher grade, some prerequisite skills in the lower grade, and 50% or less identical content across grades. Appendix F: GBEs and Items Identified as Covering Identical Content provides a full list of the items experts identified as covering identical content in social studies.
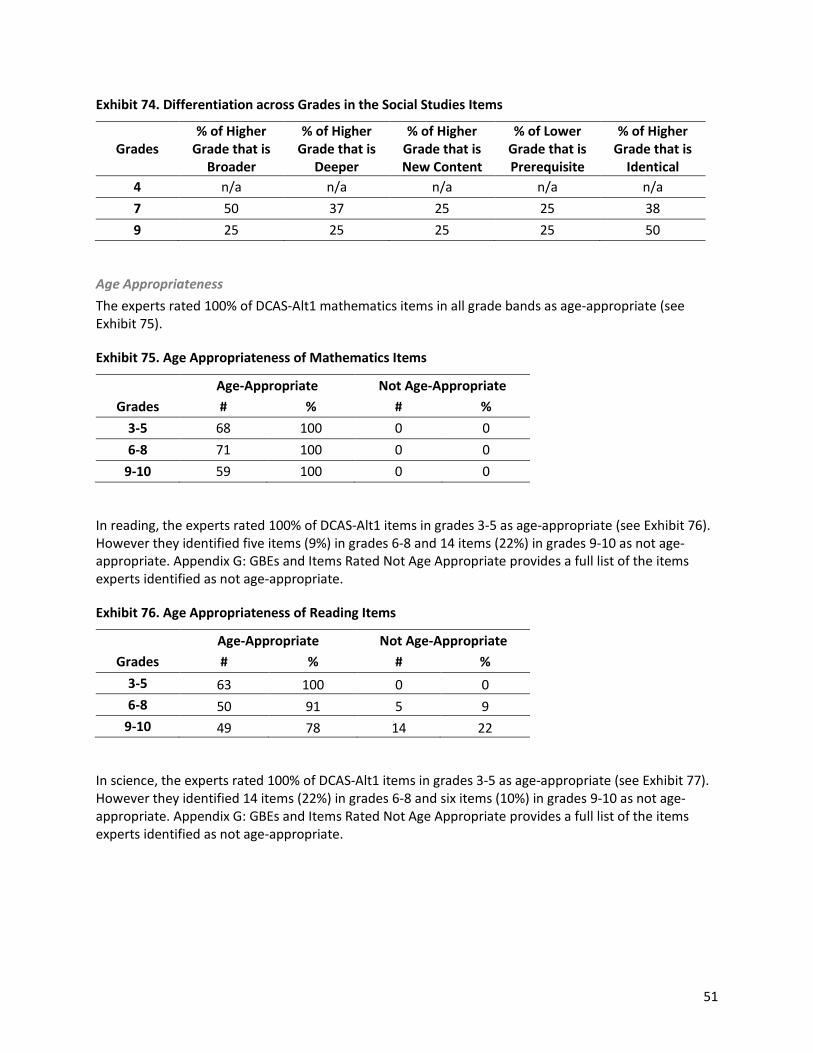
51
Exhibit 74. Differentiation across Grades in the Social Studies Items
Grades % of Higher
Grade that is Broader
% of Higher Grade that is
Deeper
% of Higher Grade that is New Content
% of Lower Grade that is Prerequisite
% of Higher Grade that is
Identical
4 n/a n/a n/a n/a n/a
7 50 37 25 25 38
9 25 25 25 25 50
Age Appropriateness
The experts rated 100% of DCAS-Alt1 mathematics items in all grade bands as age-appropriate (see Exhibit 75).
Exhibit 75. Age Appropriateness of Mathematics Items
Age-Appropriate Not Age-Appropriate
Grades # % # %
3-5 68 100 0 0
6-8 71 100 0 0
9-10 59 100 0 0
In reading, the experts rated 100% of DCAS-Alt1 items in grades 3-5 as age-appropriate (see Exhibit 76). However they identified five items (9%) in grades 6-8 and 14 items (22%) in grades 9-10 as not age-appropriate. Appendix G: GBEs and Items Rated Not Age Appropriate provides a full list of the items experts identified as not age-appropriate.
Exhibit 76. Age Appropriateness of Reading Items
Age-Appropriate Not Age-Appropriate
Grades # % # %
3-5 63 100 0 0
6-8 50 91 5 9
9-10 49 78 14 22
In science, the experts rated 100% of DCAS-Alt1 items in grades 3-5 as age-appropriate (see Exhibit 77). However they identified 14 items (22%) in grades 6-8 and six items (10%) in grades 9-10 as not age-appropriate. Appendix G: GBEs and Items Rated Not Age Appropriate provides a full list of the items experts identified as not age-appropriate.
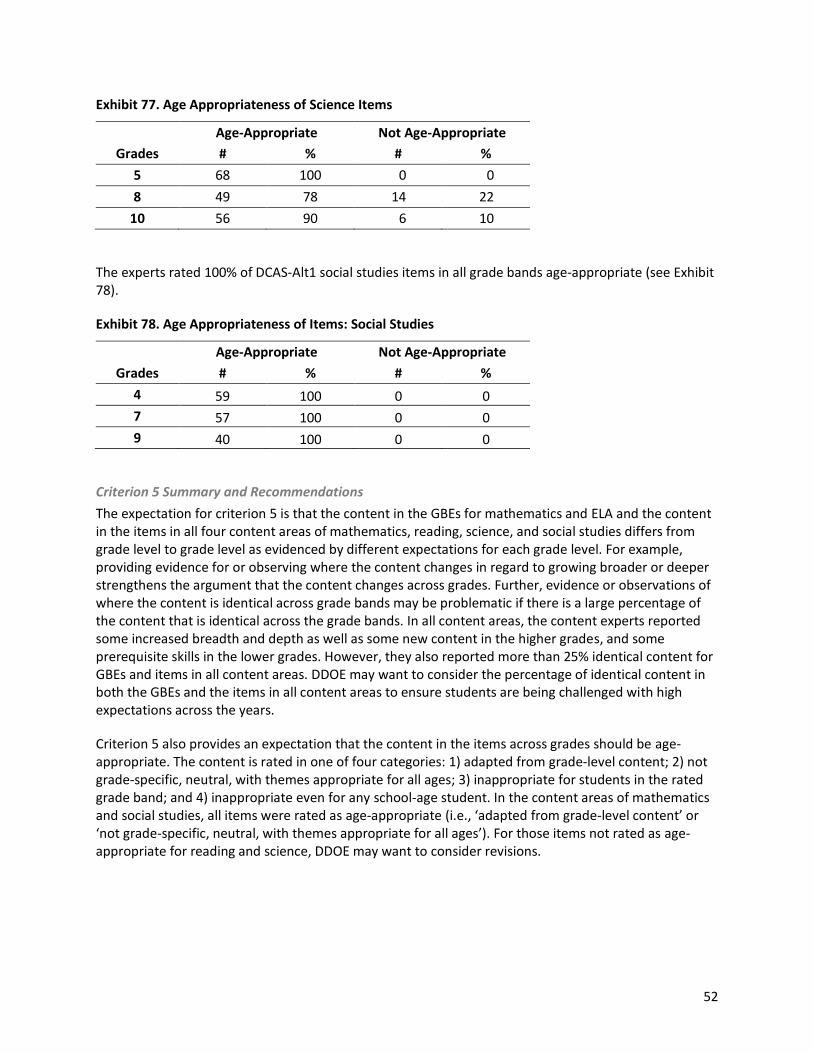
52
Exhibit 77. Age Appropriateness of Science Items
Age-Appropriate Not Age-Appropriate
Grades # % # %
5 68 100 0 0
8 49 78 14 22
10 56 90 6 10
The experts rated 100% of DCAS-Alt1 social studies items in all grade bands age-appropriate (see Exhibit 78).
Exhibit 78. Age Appropriateness of Items: Social Studies
Age-Appropriate Not Age-Appropriate
Grades # % # %
4 59 100 0 0
7 57 100 0 0
9 40 100 0 0
Criterion 5 Summary and Recommendations
The expectation for criterion 5 is that the content in the GBEs for mathematics and ELA and the content in the items in all four content areas of mathematics, reading, science, and social studies differs from grade level to grade level as evidenced by different expectations for each grade level. For example, providing evidence for or observing where the content changes in regard to growing broader or deeper strengthens the argument that the content changes across grades. Further, evidence or observations of where the content is identical across grade bands may be problematic if there is a large percentage of the content that is identical across the grade bands. In all content areas, the content experts reported some increased breadth and depth as well as some new content in the higher grades, and some prerequisite skills in the lower grades. However, they also reported more than 25% identical content for GBEs and items in all content areas. DDOE may want to consider the percentage of identical content in both the GBEs and the items in all content areas to ensure students are being challenged with high expectations across the years.
Criterion 5 also provides an expectation that the content in the items across grades should be age-appropriate. The content is rated in one of four categories: 1) adapted from grade-level content; 2) not grade-specific, neutral, with themes appropriate for all ages; 3) inappropriate for students in the rated grade band; and 4) inappropriate even for any school-age student. In the content areas of mathematics and social studies, all items were rated as age-appropriate (i.e., ‘adapted from grade-level content’ or ‘not grade-specific, neutral, with themes appropriate for all ages’). For those items not rated as age-appropriate for reading and science, DDOE may want to consider revisions.
53
Criterion 6
The expected achievement for students is for the students to show learning of grade-referenced academic content.
The expectation for criterion 6 is that achievement is illustrated through a high degree of inference, demonstrated by using baseline data, having independent student work, and students demonstrating learning across materials, activities, settings, and/or people. This criterion examines the degree of inference that can be made from the DCAS-Alt1 scores about what students know and can do. In other words, to what extent can teachers, parents, and administrators use DCAS-Alt1 results to infer whether student learning has occurred?
Because teachers, families, and administrators use student assessment scores to draw inferences about what students know and can do, alignment study experts and evaluation staff examined the DCAS-Alt1 system as a whole to determine what degree of inference it can appropriately support. The degree of inference indicates the extent to which stakeholders can infer from the results of this assessment that student learning has occurred. A high degree of inference indicates that stakeholders can clearly infer from assessment results that the student demonstrated learning. A low degree of inference indicates that stakeholders can infer assessment results are mixed with teacher performance (such as prompting or program related criteria). No degree of inference indicates that stakeholders cannot use this assessment to infer any student learning. A high degree of inference stems from being able to demonstrate student learning through several criteria:
1. New learning as evidenced by the use of baseline data and differentiation across grade levels;
2. Independent student work as evidence by scoring rubrics and Performance Level Descriptors (PLDs); and
3. Students demonstrating learning across materials, activities, settings, and/or people.
LAL based these categories for determining degree of inference on non-regulatory guidance and consultation with experts in the fields of measurement and special education. According to the LAL model:
“The strongest inference can be made… if: (a) there is evidence the student did not already have the skill (e.g., through use of pretest, baseline or previous year’s learning), (b) the skill is performed without teacher prompting, and (c) the skill is performed across materials/lessons to show mastery of the concept versus rote memory of one specific response. The inference is weakened if the student’s score is augmented by program level criteria (Flowers et al., 2007, p. 37).”
Based on these criteria, the LAL model provides a list of seven characteristics that the severe disabilities experts rated on the Degree of Inference coding form using a three-point scale (1: none, 2: low, and 3: high):
Accuracy and Independence 1) Level of accuracy required for credit;
2) Level of independence required for credit;
3) Accuracy and independence requirements of standards set for proficiency;
54
New Learning
4) Evidence of new learning;
Generalization
5) Evidence of generalization across people and settings;
6) Evidence of generalization across materials and activities; and
Program Quality Indicators
7) Inclusion of program quality indicators in score.
The information below outlines the findings of each of these categories of characteristics using the PLDs, scoring rubrics, and DCAS-Alt1 test administration guidance.
Student Independence and Accuracy
Two factors that affect the degree of inference of students’ scores include student independence and accuracy in performing the task/skill. A system has the highest degree of inference when student performance is 100% independent, and the lowest degree of inference when student performance involves full physical assistance. The experts rated the DCAS-Alt1 as high in student independence and accuracy in all content areas. Students must complete the DCAS-Alt1 independently; the assessment is scripted, and the DCAS-Alt1 Test Administration Manual states that test administrators may not provide answers, may not prompt students, and may not “coach any examinee during the assessment administration by giving the examinee answers to secure questions or otherwise directing or guiding a response or by altering or interfering with the examinee’s response in any way” (5). In addition, the structure of the DCAS-Alt1 increases the accuracy of student inference by assessing the same GBEs with multiple items.
Evidence of New Learning
Another factor that can affect the degree of inference of students’ scores is evidence of new learning. Evidence of new learning is typically illustrated through a pre-post test or baseline measure. In the case of the DCAS-Alt1, pre-post data or baseline data is not required. However, teachers indicated there was evidence of new learning in all content areas except social studies (where content experts also noted low differentiation between the items in the social studies assessment). In this area, experts took into account the differentiation of content (such as broader or deeper content) and in turn, students were evidencing new learning.
Generalizability
An additional factor for determining degree of inference is generalizability. Generalizability examines students’ ability to generalize learning across settings, people, activities, and materials; an area that students who traditionally participate in AA-AAS like the DCAS-Alt1 have difficulty doing. Overall the experts gave ratings of “low” or “none” for generalizability across people and settings, and “low” for generalizability across activities and materials. Given the fact that the DCAS-Alt1 is a performance based assessment, scores for the DCAS-Alt1 do not take multiple settings, people, or activities into account in making a score determination. Due to this factor, we are unable to determine if students are able to generalize across settings, people, activities, or materials and thus have no degree of inference based on this portion of the criterion.
55
Program Quality Indicators
In the past, the scores for AA-AAS included program quality indicators in order to promote best practices for students with disabilities, such as evidence the student receives instruction in multiple settings (which promotes inclusion), evidence the student has a part in choosing his/her student work submitted for the AA-AAS (which promotes self-determination), or evidence the student has the opportunity to develop friendships with students with and without disabilities (which promotes development of social relationships and interactions among a wide variety of peers). Currently, most states do not include program quality indicators in determination of scores used for proficiency, but some states do include these indicators for programmatic evaluation purposes. Currently, the DCAS-Alt1 does not include any program quality indicators to determine the score of the assessment (e.g., generalization, self-determination, settings).
Degree of Inference Coding Form
The severe disabilities experts used the Degree of Inference Coding Form to examine the possible degree of inference from the scores of the DCAS-Alt1. See Appendix E: Additional Coding Forms for the Degree of Inference coding form. The coding form uses a three-point scale (1: none, 2: low, and 3: high). For reporting purposes, values of 2.25 or greater are considered high; values between 1.50 and 2.24 are considered low; and values below 1.50 are considered no degree of inference.
Inter-rater agreement was not calculated for these ratings. Rather, researchers calculated the degree of inference ratings for each characteristic for each content area and across content areas, as well as the average rating for each content area and across content areas (see Exhibit 79). For accuracy and independence, the experts reported a high degree of inference in all content areas. For evidence of new learning, they reported a high degree of inference in all content areas except social studies. Experts reported low generalization across people and settings for reading, and none for mathematics, science, and social studies; however, they observed low generalization across materials and activities for all content areas. For standards for proficiency, the experts rated mathematics and science as having a high degree of inference, and reading and social studies as low. They rated inclusion of program quality indicators as none for mathematics and reading, and low for science and social studies.
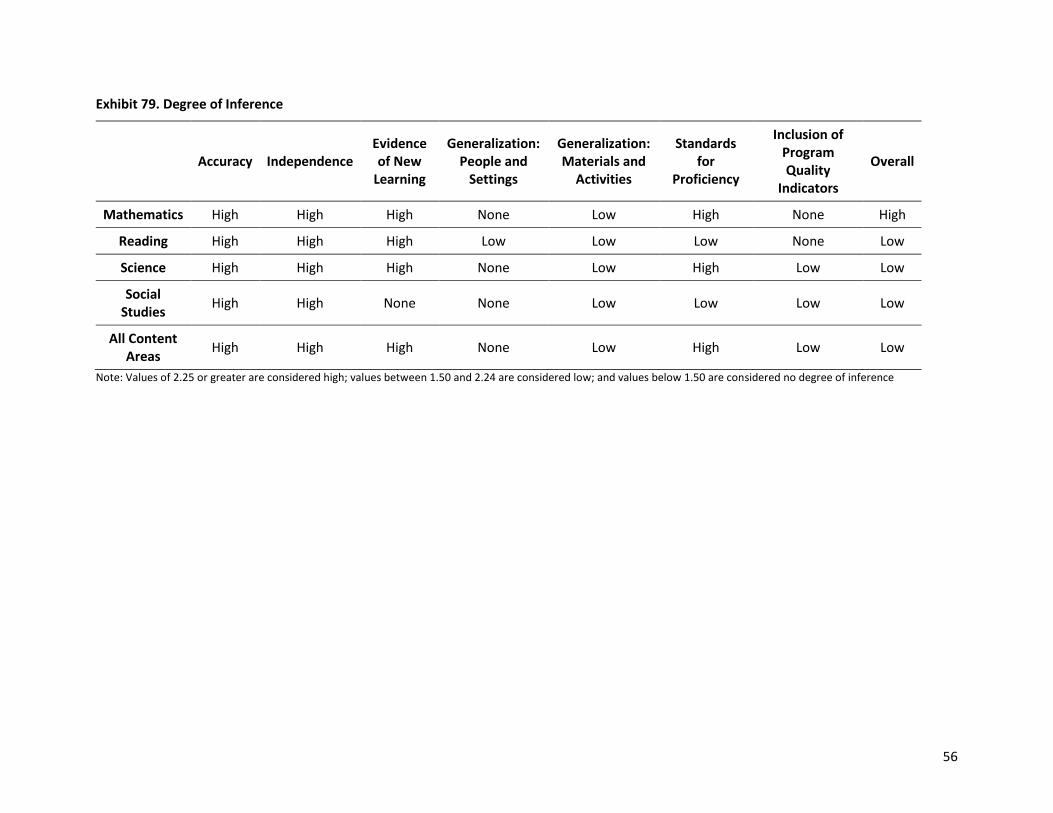
56
Exhibit 79. Degree of Inference
Accuracy Independence Evidence of New
Learning
Generalization: People and
Settings
Generalization: Materials and
Activities
Standards for
Proficiency
Inclusion of Program Quality
Indicators
Overall
Mathematics High High High None Low High None High
Reading High High High Low Low Low None Low
Science High High High None Low High Low Low
Social Studies
High High None None Low Low Low Low
All Content Areas
High High High None Low High Low Low
Note: Values of 2.25 or greater are considered high; values between 1.50 and 2.24 are considered low; and values below 1.50 are considered no degree of inference
57
Criterion 6 Summary and Recommendations
The expectation for criterion 6 is that expected achievement is illustrated through a high degree of inference, demonstrated by:
using baseline data,
having independent student work as evidenced by scoring rubrics and PLDs, and
students demonstrating learning across materials, activities, settings, and/or people.
For accuracy and independence, the experts reported a high degree of inference in all content areas. For evidence of new learning, they reported a high degree of inference in all content areas except social studies. They reported low generalization across people and settings for reading, and none for mathematics, science, and social studies; however, they observed low generalization across materials and activities for all content areas. For standards for proficiency, the experts rated mathematics and science as having a high degree of inference, and reading and social studies as low. They rated inclusion of program quality indicators as none for mathematics and reading, and low for science and social studies.
Because stakeholders use the DCAS-Alt1 assessment results to make a degree of inference about student learning, it is important for the assessment to support these inferences. A high degree of inference stems from being able to demonstrate student learning through the use of baseline data, having independent student work as evidenced by scoring rubrics, and PLDs, and students demonstrating learning across materials, activities, settings, and/or people. While the DCAS-Alt1 does not require evidence of student learning through baseline data or for students to demonstrate learning across materials, activities, settings, and/or people, the DCAS-Alt1 does require accurate and independent responses for credit and to reach proficiency. In general, these requirements allow stakeholders to make inferences from the DCAS-Alt1 test scores about what students know and can do.
The DDOE may wish to consider ways in which to require inclusion of evidence of generalization across people and settings and across materials and activities in the assessment as well as using a baseline/post-test type of model. However, this is not necessary to meet the requirements of criterion 6, especially given the format of the DCAS-Alt1 assessment.
Criterion 7
The potential barriers to demonstrating what students know and can do are minimized in the assessment.
The expectation for criterion 7 is the assessment is accessible to students with a variety of disabilities as indicated on the Minimizing Barriers Checklist, and the assessment includes items accessible to students with a range of communicative competence. Severe disabilities experts evaluated whether students with a variety of disabilities would be able to access the DCAS-Alt1 by completing the Minimizing Barriers Checklist (provided in Appendix E: Additional Coding Forms) developed for the LAL model. Experts indicated whether there was no provision for students with this characteristic in the assessment, whether there was flexibility built into the assessment that allowed these particular students to access the tasks with no changes, or whether changes to the tasks would be necessary for a student to access the assessment. The Minimizing Barriers Checklist also asks panelists to rate whether the assessment includes any way of capturing responses for students who do not yet have clear, intentional communication even at the pre-symbolic level, and whether the accommodations, modifications, and
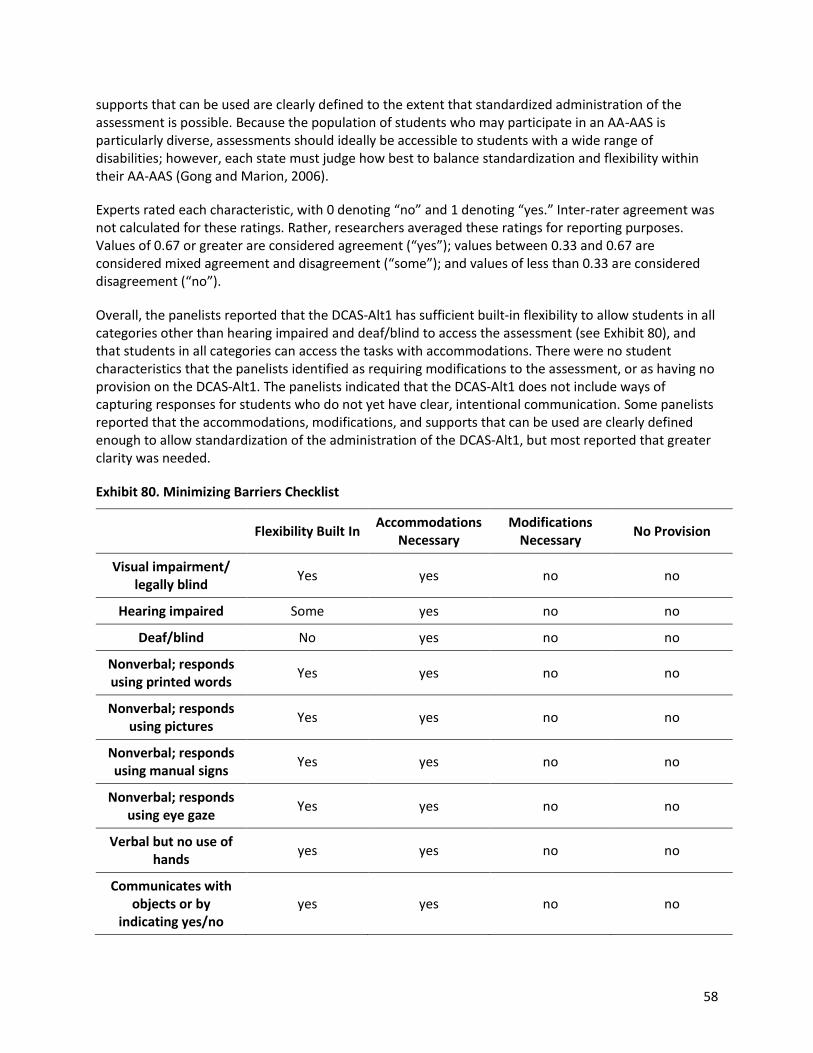
58
supports that can be used are clearly defined to the extent that standardized administration of the assessment is possible. Because the population of students who may participate in an AA-AAS is particularly diverse, assessments should ideally be accessible to students with a wide range of disabilities; however, each state must judge how best to balance standardization and flexibility within their AA-AAS (Gong and Marion, 2006).
Experts rated each characteristic, with 0 denoting “no” and 1 denoting “yes.” Inter-rater agreement was not calculated for these ratings. Rather, researchers averaged these ratings for reporting purposes. Values of 0.67 or greater are considered agreement (“yes”); values between 0.33 and 0.67 are considered mixed agreement and disagreement (“some”); and values of less than 0.33 are considered disagreement (“no”).
Overall, the panelists reported that the DCAS-Alt1 has sufficient built-in flexibility to allow students in all categories other than hearing impaired and deaf/blind to access the assessment (see Exhibit 80), and that students in all categories can access the tasks with accommodations. There were no student characteristics that the panelists identified as requiring modifications to the assessment, or as having no provision on the DCAS-Alt1. The panelists indicated that the DCAS-Alt1 does not include ways of capturing responses for students who do not yet have clear, intentional communication. Some panelists reported that the accommodations, modifications, and supports that can be used are clearly defined enough to allow standardization of the administration of the DCAS-Alt1, but most reported that greater clarity was needed.
Exhibit 80. Minimizing Barriers Checklist
Flexibility Built In Accommodations
Necessary Modifications
Necessary No Provision
Visual impairment/ legally blind
Yes yes no no
Hearing impaired Some yes no no
Deaf/blind No yes no no
Nonverbal; responds using printed words
Yes yes no no
Nonverbal; responds using pictures
Yes yes no no
Nonverbal; responds using manual signs
Yes yes no no
Nonverbal; responds using eye gaze
Yes yes no no
Verbal but no use of hands
yes yes no no
Communicates with objects or by
indicating yes/no yes yes no no
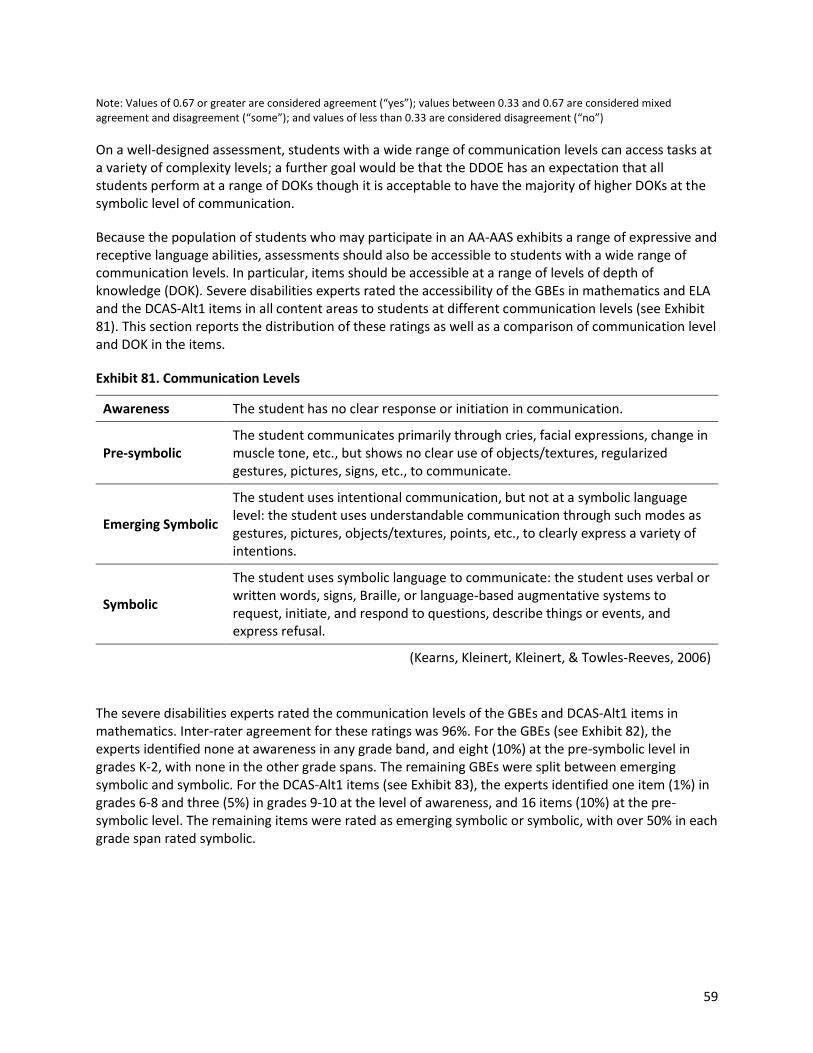
59
Note: Values of 0.67 or greater are considered agreement (“yes”); values between 0.33 and 0.67 are considered mixed agreement and disagreement (“some”); and values of less than 0.33 are considered disagreement (“no”)
On a well-designed assessment, students with a wide range of communication levels can access tasks at a variety of complexity levels; a further goal would be that the DDOE has an expectation that all students perform at a range of DOKs though it is acceptable to have the majority of higher DOKs at the symbolic level of communication.
Because the population of students who may participate in an AA-AAS exhibits a range of expressive and receptive language abilities, assessments should also be accessible to students with a wide range of communication levels. In particular, items should be accessible at a range of levels of depth of knowledge (DOK). Severe disabilities experts rated the accessibility of the GBEs in mathematics and ELA and the DCAS-Alt1 items in all content areas to students at different communication levels (see Exhibit 81). This section reports the distribution of these ratings as well as a comparison of communication level and DOK in the items.
Exhibit 81. Communication Levels
Awareness The student has no clear response or initiation in communication.
Pre-symbolic The student communicates primarily through cries, facial expressions, change in muscle tone, etc., but shows no clear use of objects/textures, regularized gestures, pictures, signs, etc., to communicate.
Emerging Symbolic
The student uses intentional communication, but not at a symbolic language level: the student uses understandable communication through such modes as gestures, pictures, objects/textures, points, etc., to clearly express a variety of intentions.
Symbolic
The student uses symbolic language to communicate: the student uses verbal or written words, signs, Braille, or language-based augmentative systems to request, initiate, and respond to questions, describe things or events, and express refusal.
(Kearns, Kleinert, Kleinert, & Towles-Reeves, 2006)
The severe disabilities experts rated the communication levels of the GBEs and DCAS-Alt1 items in mathematics. Inter-rater agreement for these ratings was 96%. For the GBEs (see Exhibit 82), the experts identified none at awareness in any grade band, and eight (10%) at the pre-symbolic level in grades K-2, with none in the other grade spans. The remaining GBEs were split between emerging symbolic and symbolic. For the DCAS-Alt1 items (see Exhibit 83), the experts identified one item (1%) in grades 6-8 and three (5%) in grades 9-10 at the level of awareness, and 16 items (10%) at the pre-symbolic level. The remaining items were rated as emerging symbolic or symbolic, with over 50% in each grade span rated symbolic.
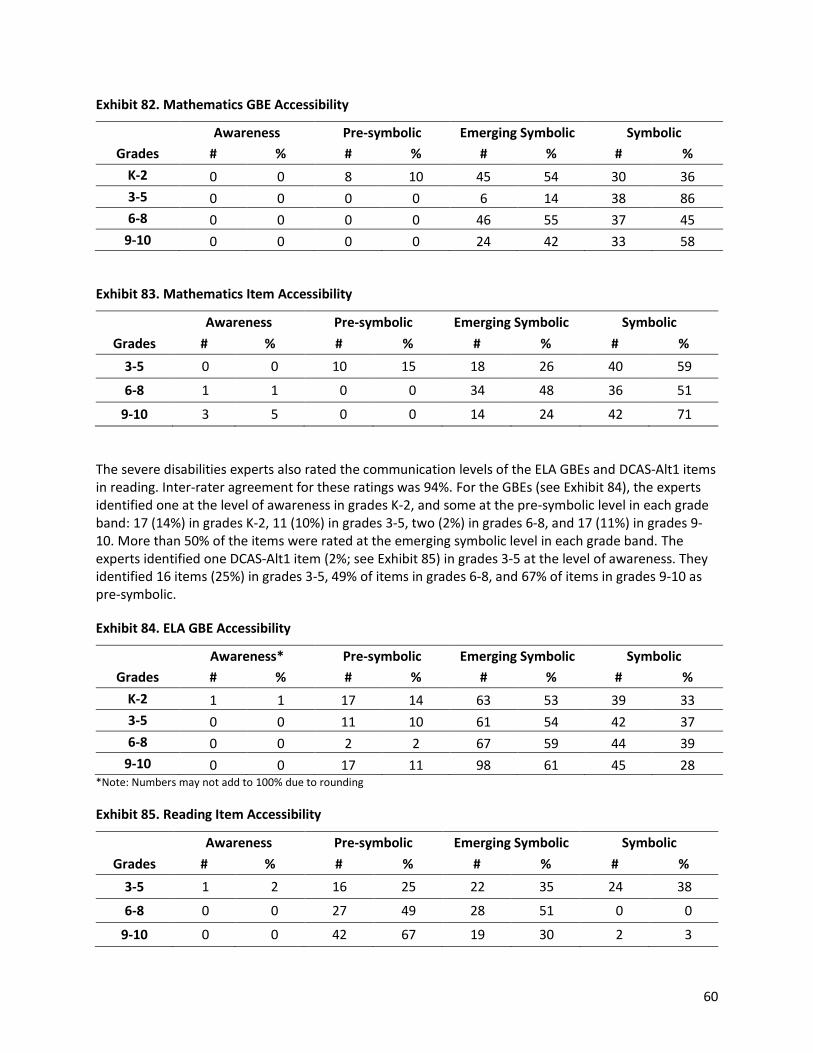
60
Exhibit 82. Mathematics GBE Accessibility
Awareness Pre-symbolic Emerging Symbolic Symbolic
Grades # % # % # % # %
K-2 0 0 8 10 45 54 30 36
3-5 0 0 0 0 6 14 38 86
6-8 0 0 0 0 46 55 37 45
9-10 0 0 0 0 24 42 33 58
Exhibit 83. Mathematics Item Accessibility
Awareness Pre-symbolic Emerging Symbolic Symbolic
Grades # % # % # % # %
3-5 0 0 10 15 18 26 40 59
6-8 1 1 0 0 34 48 36 51
9-10 3 5 0 0 14 24 42 71
The severe disabilities experts also rated the communication levels of the ELA GBEs and DCAS-Alt1 items in reading. Inter-rater agreement for these ratings was 94%. For the GBEs (see Exhibit 84), the experts identified one at the level of awareness in grades K-2, and some at the pre-symbolic level in each grade band: 17 (14%) in grades K-2, 11 (10%) in grades 3-5, two (2%) in grades 6-8, and 17 (11%) in grades 9-10. More than 50% of the items were rated at the emerging symbolic level in each grade band. The experts identified one DCAS-Alt1 item (2%; see Exhibit 85) in grades 3-5 at the level of awareness. They identified 16 items (25%) in grades 3-5, 49% of items in grades 6-8, and 67% of items in grades 9-10 as pre-symbolic.
Exhibit 84. ELA GBE Accessibility
Awareness* Pre-symbolic Emerging Symbolic Symbolic
Grades # % # % # % # %
K-2 1 1 17 14 63 53 39 33
3-5 0 0 11 10 61 54 42 37
6-8 0 0 2 2 67 59 44 39
9-10 0 0 17 11 98 61 45 28 *Note: Numbers may not add to 100% due to rounding
Exhibit 85. Reading Item Accessibility
Awareness Pre-symbolic Emerging Symbolic Symbolic
Grades # % # % # % # %
3-5 1 2 16 25 22 35 24 38
6-8 0 0 27 49 28 51 0 0
9-10 0 0 42 67 19 30 2 3
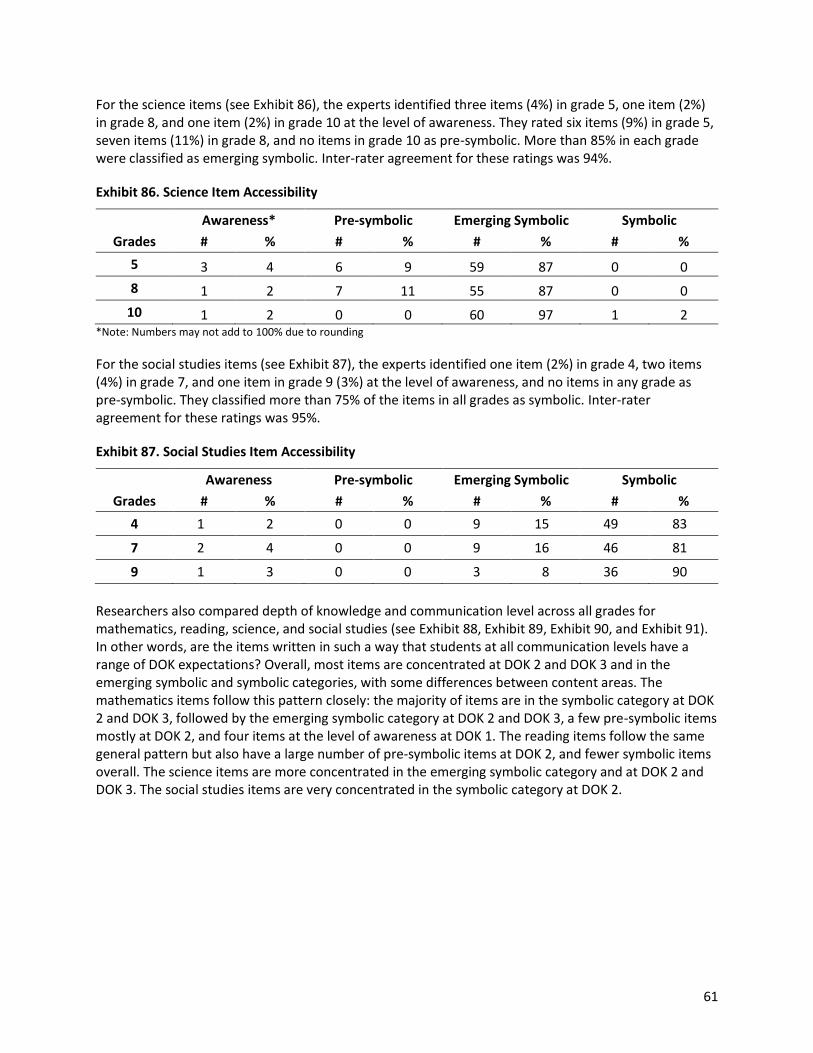
61
For the science items (see Exhibit 86), the experts identified three items (4%) in grade 5, one item (2%) in grade 8, and one item (2%) in grade 10 at the level of awareness. They rated six items (9%) in grade 5, seven items (11%) in grade 8, and no items in grade 10 as pre-symbolic. More than 85% in each grade were classified as emerging symbolic. Inter-rater agreement for these ratings was 94%.
Exhibit 86. Science Item Accessibility
Awareness* Pre-symbolic Emerging Symbolic Symbolic
Grades # % # % # % # %
5 3 4 6 9 59 87 0 0
8 1 2 7 11 55 87 0 0
10 1 2 0 0 60 97 1 2 *Note: Numbers may not add to 100% due to rounding
For the social studies items (see Exhibit 87), the experts identified one item (2%) in grade 4, two items (4%) in grade 7, and one item in grade 9 (3%) at the level of awareness, and no items in any grade as pre-symbolic. They classified more than 75% of the items in all grades as symbolic. Inter-rater agreement for these ratings was 95%.
Exhibit 87. Social Studies Item Accessibility
Awareness Pre-symbolic Emerging Symbolic Symbolic
Grades # % # % # % # %
4 1 2 0 0 9 15 49 83
7 2 4 0 0 9 16 46 81
9 1 3 0 0 3 8 36 90
Researchers also compared depth of knowledge and communication level across all grades for mathematics, reading, science, and social studies (see Exhibit 88, Exhibit 89, Exhibit 90, and Exhibit 91). In other words, are the items written in such a way that students at all communication levels have a range of DOK expectations? Overall, most items are concentrated at DOK 2 and DOK 3 and in the emerging symbolic and symbolic categories, with some differences between content areas. The mathematics items follow this pattern closely: the majority of items are in the symbolic category at DOK 2 and DOK 3, followed by the emerging symbolic category at DOK 2 and DOK 3, a few pre-symbolic items mostly at DOK 2, and four items at the level of awareness at DOK 1. The reading items follow the same general pattern but also have a large number of pre-symbolic items at DOK 2, and fewer symbolic items overall. The science items are more concentrated in the emerging symbolic category and at DOK 2 and DOK 3. The social studies items are very concentrated in the symbolic category at DOK 2.
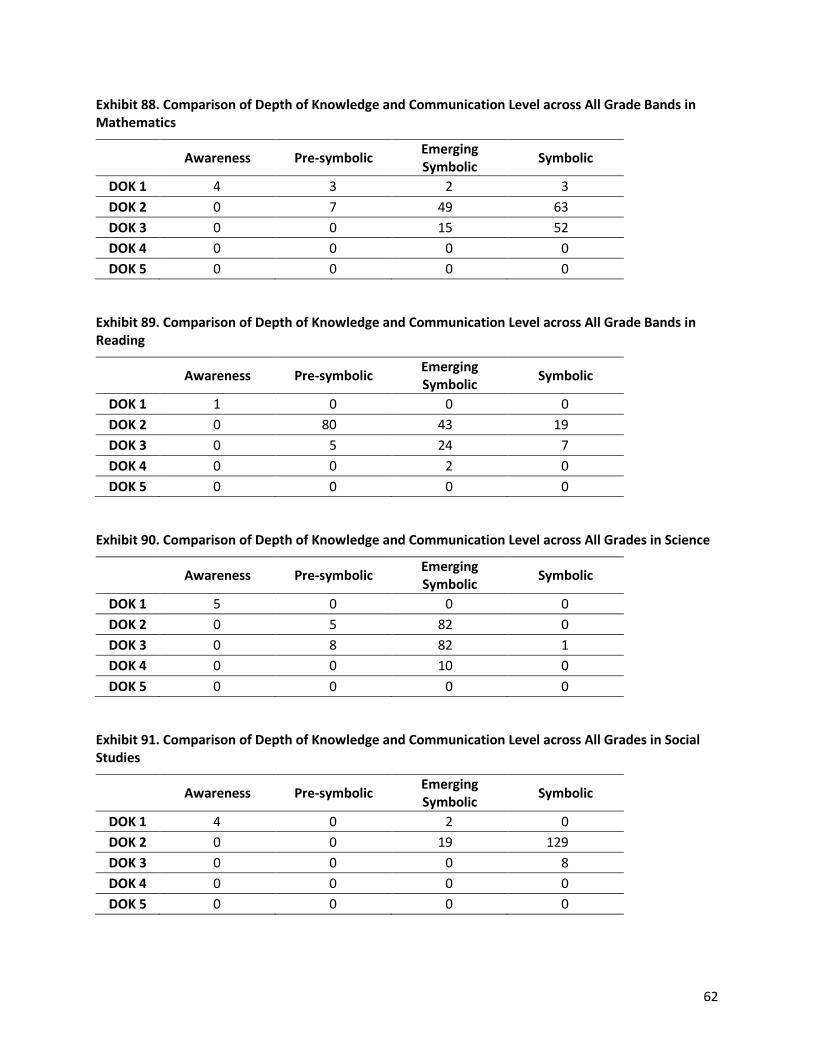
62
Exhibit 88. Comparison of Depth of Knowledge and Communication Level across All Grade Bands in Mathematics
Awareness Pre-symbolic Emerging Symbolic
Symbolic
DOK 1 4 3 2 3
DOK 2 0 7 49 63
DOK 3 0 0 15 52
DOK 4 0 0 0 0
DOK 5 0 0 0 0
Exhibit 89. Comparison of Depth of Knowledge and Communication Level across All Grade Bands in Reading
Awareness Pre-symbolic Emerging Symbolic
Symbolic
DOK 1 1 0 0 0
DOK 2 0 80 43 19
DOK 3 0 5 24 7
DOK 4 0 0 2 0
DOK 5 0 0 0 0
Exhibit 90. Comparison of Depth of Knowledge and Communication Level across All Grades in Science
Awareness Pre-symbolic Emerging Symbolic
Symbolic
DOK 1 5 0 0 0
DOK 2 0 5 82 0
DOK 3 0 8 82 1
DOK 4 0 0 10 0
DOK 5 0 0 0 0
Exhibit 91. Comparison of Depth of Knowledge and Communication Level across All Grades in Social Studies
Awareness Pre-symbolic Emerging Symbolic
Symbolic
DOK 1 4 0 2 0
DOK 2 0 0 19 129
DOK 3 0 0 0 8
DOK 4 0 0 0 0
DOK 5 0 0 0 0
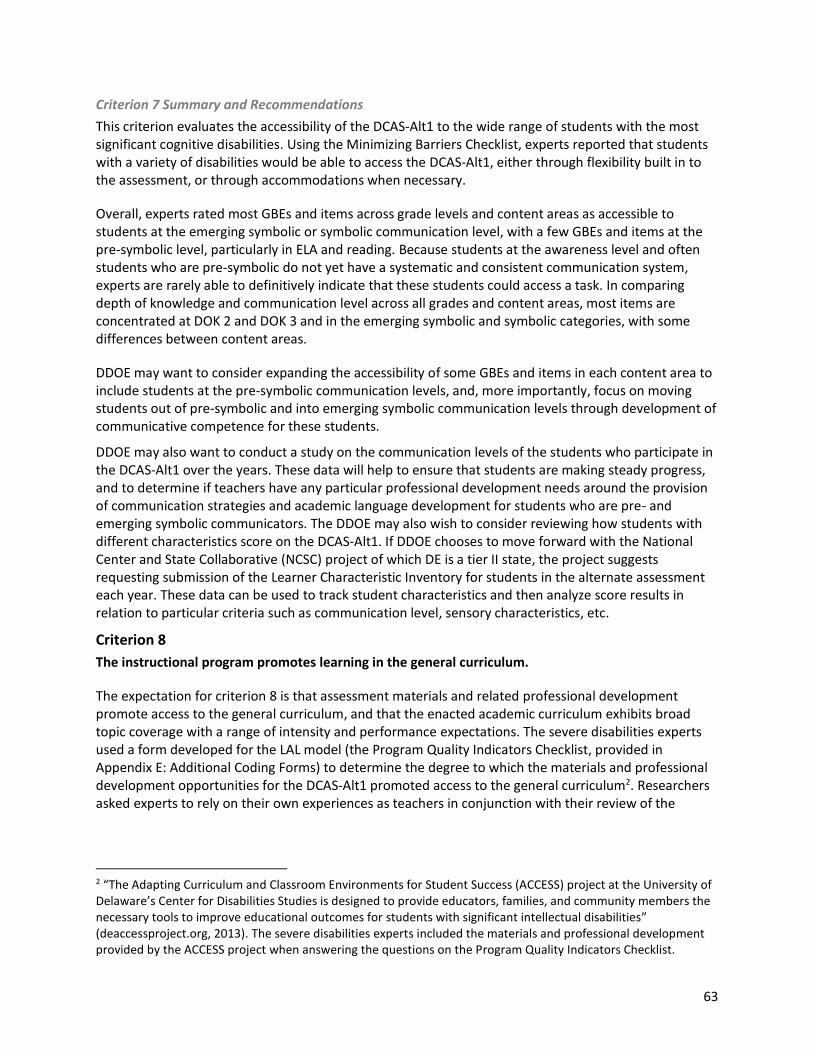
63
Criterion 7 Summary and Recommendations
This criterion evaluates the accessibility of the DCAS-Alt1 to the wide range of students with the most significant cognitive disabilities. Using the Minimizing Barriers Checklist, experts reported that students with a variety of disabilities would be able to access the DCAS-Alt1, either through flexibility built in to the assessment, or through accommodations when necessary.
Overall, experts rated most GBEs and items across grade levels and content areas as accessible to students at the emerging symbolic or symbolic communication level, with a few GBEs and items at the pre-symbolic level, particularly in ELA and reading. Because students at the awareness level and often students who are pre-symbolic do not yet have a systematic and consistent communication system, experts are rarely able to definitively indicate that these students could access a task. In comparing depth of knowledge and communication level across all grades and content areas, most items are concentrated at DOK 2 and DOK 3 and in the emerging symbolic and symbolic categories, with some differences between content areas.
DDOE may want to consider expanding the accessibility of some GBEs and items in each content area to include students at the pre-symbolic communication levels, and, more importantly, focus on moving students out of pre-symbolic and into emerging symbolic communication levels through development of communicative competence for these students.
DDOE may also want to conduct a study on the communication levels of the students who participate in the DCAS-Alt1 over the years. These data will help to ensure that students are making steady progress, and to determine if teachers have any particular professional development needs around the provision of communication strategies and academic language development for students who are pre- and emerging symbolic communicators. The DDOE may also wish to consider reviewing how students with different characteristics score on the DCAS-Alt1. If DDOE chooses to move forward with the National Center and State Collaborative (NCSC) project of which DE is a tier II state, the project suggests requesting submission of the Learner Characteristic Inventory for students in the alternate assessment each year. These data can be used to track student characteristics and then analyze score results in relation to particular criteria such as communication level, sensory characteristics, etc.
Criterion 8
The instructional program promotes learning in the general curriculum.
The expectation for criterion 8 is that assessment materials and related professional development promote access to the general curriculum, and that the enacted academic curriculum exhibits broad topic coverage with a range of intensity and performance expectations. The severe disabilities experts used a form developed for the LAL model (the Program Quality Indicators Checklist, provided in Appendix E: Additional Coding Forms) to determine the degree to which the materials and professional development opportunities for the DCAS-Alt1 promoted access to the general curriculum2. Researchers asked experts to rely on their own experiences as teachers in conjunction with their review of the
2 “The Adapting Curriculum and Classroom Environments for Student Success (ACCESS) project at the University of Delaware’s Center for Disabilities Studies is designed to provide educators, families, and community members the necessary tools to improve educational outcomes for students with significant intellectual disabilities” (deaccessproject.org, 2013). The severe disabilities experts included the materials and professional development provided by the ACCESS project when answering the questions on the Program Quality Indicators Checklist.
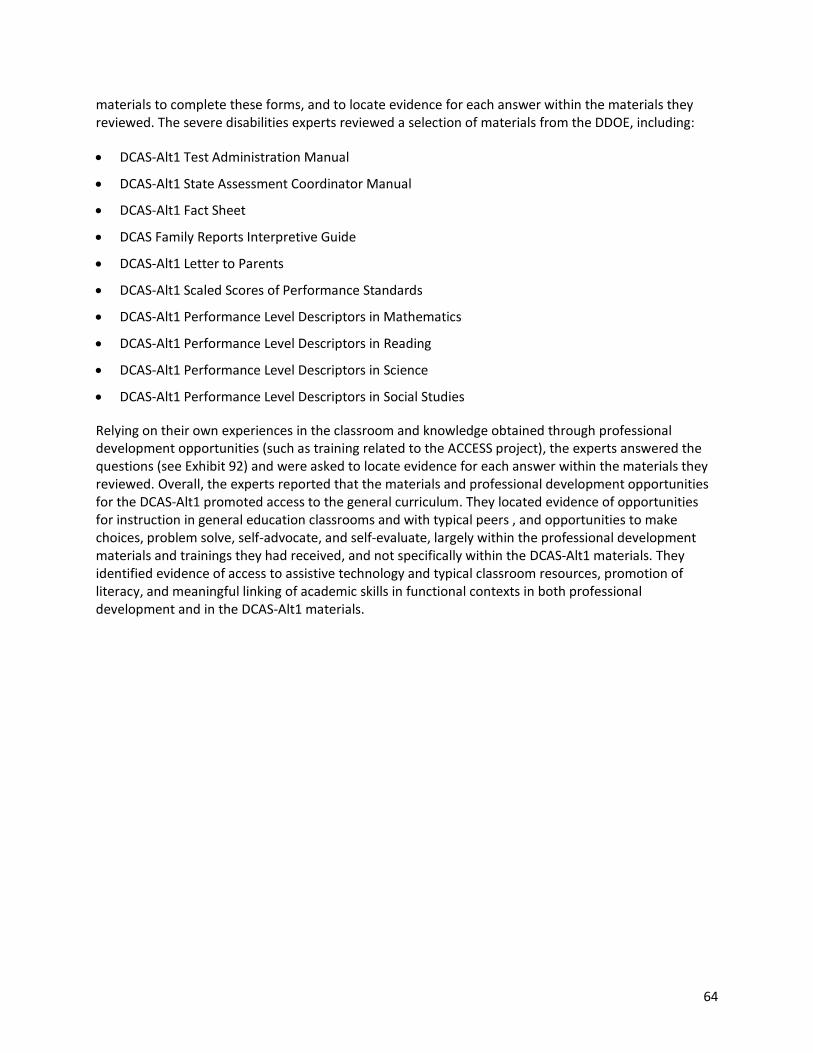
64
materials to complete these forms, and to locate evidence for each answer within the materials they reviewed. The severe disabilities experts reviewed a selection of materials from the DDOE, including:
DCAS-Alt1 Test Administration Manual
DCAS-Alt1 State Assessment Coordinator Manual
DCAS-Alt1 Fact Sheet
DCAS Family Reports Interpretive Guide
DCAS-Alt1 Letter to Parents
DCAS-Alt1 Scaled Scores of Performance Standards
DCAS-Alt1 Performance Level Descriptors in Mathematics
DCAS-Alt1 Performance Level Descriptors in Reading
DCAS-Alt1 Performance Level Descriptors in Science
DCAS-Alt1 Performance Level Descriptors in Social Studies
Relying on their own experiences in the classroom and knowledge obtained through professional development opportunities (such as training related to the ACCESS project), the experts answered the questions (see Exhibit 92) and were asked to locate evidence for each answer within the materials they reviewed. Overall, the experts reported that the materials and professional development opportunities for the DCAS-Alt1 promoted access to the general curriculum. They located evidence of opportunities for instruction in general education classrooms and with typical peers , and opportunities to make choices, problem solve, self-advocate, and self-evaluate, largely within the professional development materials and trainings they had received, and not specifically within the DCAS-Alt1 materials. They identified evidence of access to assistive technology and typical classroom resources, promotion of literacy, and meaningful linking of academic skills in functional contexts in both professional development and in the DCAS-Alt1 materials.
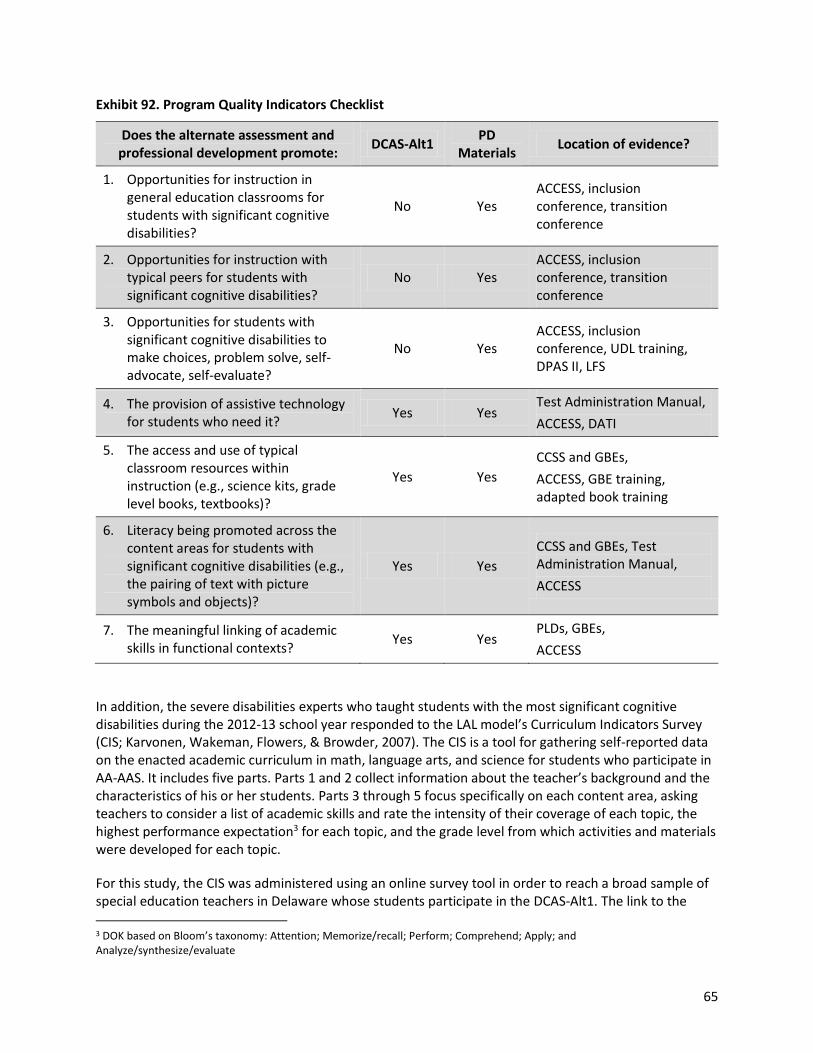
65
Exhibit 92. Program Quality Indicators Checklist
Does the alternate assessment and professional development promote:
DCAS-Alt1 PD
Materials Location of evidence?
1. Opportunities for instruction in general education classrooms for students with significant cognitive disabilities?
No Yes ACCESS, inclusion conference, transition conference
2. Opportunities for instruction with typical peers for students with significant cognitive disabilities?
No Yes ACCESS, inclusion conference, transition conference
3. Opportunities for students with significant cognitive disabilities to make choices, problem solve, self-advocate, self-evaluate?
No Yes ACCESS, inclusion conference, UDL training, DPAS II, LFS
4. The provision of assistive technology for students who need it?
Yes Yes Test Administration Manual,
ACCESS, DATI
5. The access and use of typical classroom resources within instruction (e.g., science kits, grade level books, textbooks)?
Yes Yes
CCSS and GBEs,
ACCESS, GBE training, adapted book training
6. Literacy being promoted across the content areas for students with significant cognitive disabilities (e.g., the pairing of text with picture symbols and objects)?
Yes Yes
CCSS and GBEs, Test Administration Manual,
ACCESS
7. The meaningful linking of academic skills in functional contexts?
Yes Yes PLDs, GBEs,
ACCESS
In addition, the severe disabilities experts who taught students with the most significant cognitive disabilities during the 2012-13 school year responded to the LAL model’s Curriculum Indicators Survey (CIS; Karvonen, Wakeman, Flowers, & Browder, 2007). The CIS is a tool for gathering self-reported data on the enacted academic curriculum in math, language arts, and science for students who participate in AA-AAS. It includes five parts. Parts 1 and 2 collect information about the teacher’s background and the characteristics of his or her students. Parts 3 through 5 focus specifically on each content area, asking teachers to consider a list of academic skills and rate the intensity of their coverage of each topic, the highest performance expectation3 for each topic, and the grade level from which activities and materials were developed for each topic.
For this study, the CIS was administered using an online survey tool in order to reach a broad sample of special education teachers in Delaware whose students participate in the DCAS-Alt1. The link to the 3 DOK based on Bloom’s taxonomy: Attention; Memorize/recall; Perform; Comprehend; Apply; and Analyze/synthesize/evaluate
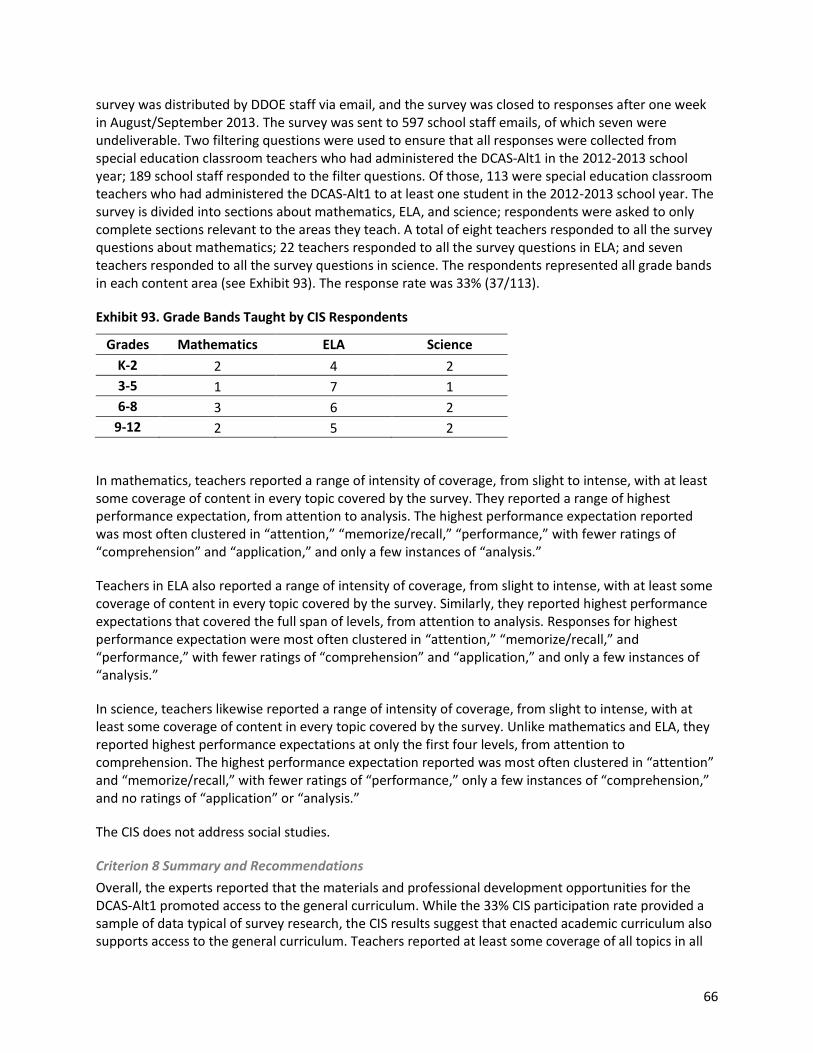
66
survey was distributed by DDOE staff via email, and the survey was closed to responses after one week in August/September 2013. The survey was sent to 597 school staff emails, of which seven were undeliverable. Two filtering questions were used to ensure that all responses were collected from special education classroom teachers who had administered the DCAS-Alt1 in the 2012-2013 school year; 189 school staff responded to the filter questions. Of those, 113 were special education classroom teachers who had administered the DCAS-Alt1 to at least one student in the 2012-2013 school year. The survey is divided into sections about mathematics, ELA, and science; respondents were asked to only complete sections relevant to the areas they teach. A total of eight teachers responded to all the survey questions about mathematics; 22 teachers responded to all the survey questions in ELA; and seven teachers responded to all the survey questions in science. The respondents represented all grade bands in each content area (see Exhibit 93). The response rate was 33% (37/113).
Exhibit 93. Grade Bands Taught by CIS Respondents
Grades Mathematics ELA Science
K-2 2 4 2
3-5 1 7 1
6-8 3 6 2
9-12 2 5 2
In mathematics, teachers reported a range of intensity of coverage, from slight to intense, with at least some coverage of content in every topic covered by the survey. They reported a range of highest performance expectation, from attention to analysis. The highest performance expectation reported was most often clustered in “attention,” “memorize/recall,” “performance,” with fewer ratings of “comprehension” and “application,” and only a few instances of “analysis.”
Teachers in ELA also reported a range of intensity of coverage, from slight to intense, with at least some coverage of content in every topic covered by the survey. Similarly, they reported highest performance expectations that covered the full span of levels, from attention to analysis. Responses for highest performance expectation were most often clustered in “attention,” “memorize/recall,” and “performance,” with fewer ratings of “comprehension” and “application,” and only a few instances of “analysis.”
In science, teachers likewise reported a range of intensity of coverage, from slight to intense, with at least some coverage of content in every topic covered by the survey. Unlike mathematics and ELA, they reported highest performance expectations at only the first four levels, from attention to comprehension. The highest performance expectation reported was most often clustered in “attention” and “memorize/recall,” with fewer ratings of “performance,” only a few instances of “comprehension,” and no ratings of “application” or “analysis.”
The CIS does not address social studies.
Criterion 8 Summary and Recommendations
Overall, the experts reported that the materials and professional development opportunities for the DCAS-Alt1 promoted access to the general curriculum. While the 33% CIS participation rate provided a sample of data typical of survey research, the CIS results suggest that enacted academic curriculum also supports access to the general curriculum. Teachers reported at least some coverage of all topics in all
67
content areas, and a full range of performance expectations in mathematics and ELA. No recommendations are presented for consideration. However, if DDOE has access to the full population of teachers via a face-to-face training, DDOE may wish to consider administration of the CIS for full representation of the enacted curriculum.
Conclusions and Recommendations
On August 12-14, 2013, content and severe disabilities experts rated the GBEs and items for the DCAS-Alt1 to determine alignment of the DCAS-Alt1 with the GBEs and the alignment of the GBEs with the CCSS, and to ensure the instructional alignment of the assessment was as strong as the assessment design. The DDOE placed their alternate assessment system under a microscope in order to learn what was already working well and to find ways to improve the overall system. Many lessons learned from the mathematics, reading, science, and social studies alignment study can be applied to improvements to the DCAS-Alt1 system in the future. The following highlights the major findings and recommendations for the DDOE to consider as you work to continuously improve your alternate assessment system for students with the most significant cognitive disabilities.
Criterion 1
The content is academic and includes the major domains/strands of the content areas as reflected in the Common Core State Standards (CCSS) and the Grade Band Extensions.
For criterion 1, the expectation is that at least 90% of the content should be academic. The remaining content must be foundational with no more than 10% of a content area reflecting foundational standards or items. The DDOE may want to review the two non-academic and non-foundational GBEs in grades 3-5 in mathematics and the non-academic items in social studies, although all non-academic social studies items were rated as foundational skills. Otherwise, across all grade bands in ELA/reading, mathematics, and science, experts rated at least 90% of the GBEs and items as academic with no more than 10% of a content area reflecting foundational standards or items. Per criterion 1 of the alignment methodology, the content for the DCAS-Alt1 assessment is academic and includes the major domains/strands of the content area as reflected in state and national standards (e.g., language arts, math, science).
Criterion 2
The content is referenced to the student’s assigned grade level (based on chronological age).
The expectation for criterion 2 is that 100% of the content is referenced to the student’s assigned grade level in all content areas and grade spans. The mathematics and ELA GBEs referenced 100% of the grade-level content. In addition, 100% of the items in mathematics, reading, science, and social studies were referenced to grade-level content. Criterion 2 of the alignment methodology is met as all content in the GBEs and the items are referenced to the student’s assigned grade level. No recommendations are presented for consideration.
Criterion 3
The focus of achievement maintains fidelity with the specified content (content centrality) and performance (performance centrality) of the original grade-level standards.
68
The expectation for content and performance centrality is that 90% or more of the GBEs and items are rated as “all” or “some.” The expectations for criterion 3 were not met for many of the GBEs and the items. The DDOE may wish to revisit the content and performance centrality of the GBEs and the items to more fully align the alternate assessment system and may consider addressing the content and performance centrality issues via multiple avenues: 1) revisit the GBEs with ratings of “some” and “none” for content and performance centrality, in coordination with external content experts, to strengthen the relationship between the GBEs and the CCSS; 2) revisit the DCAS-Alt1 items with ratings of “none” for content and performance centrality and replace those items in the assessment with others from the item bank (but alignment of replacement items should also be reviewed); and 3) collaborate with the assessment/item writing vendor to tweak current items to strengthen the content and performance centrality links to the GBEs.
Criterion 4
The content differs from grade level in range, balance, and depth of knowledge (DOK), but matches high expectations set for students with significant cognitive disabilities.
The expectations for criterion 4 are that the range and balance of content varies from grade to grade and matches the state’s articulated priorities. Further, there is a range of DOK expectations for students in each of the grades or grade bands. Together, the state’s articulated priorities play out within the range, balance, and depth of knowledge set forth by the assessment system and at a minimum meet the expectations set forth by criterion 4. No recommendations are include for this criterion.
Criterion 5
There is some differentiation in content across grade levels or grade bands.
The expectation for criterion 5 is that the content in the GBEs for mathematics and ELA and the content in the items in all four content areas of mathematics, reading, science, and social studies differ from grade level to grade level as evidenced by different expectations for each grade level. DDOE may want to consider the percentage of identical content in both the GBEs and the items in all content areas to ensure students are being challenged with high expectations across the years. Further, criterion 5 provides an expectation that the content in the items across grades should be age-appropriate. For those items not rated as age-appropriate for reading and science (all items in mathematics and social studies were rated as age-appropriate), DDOE may want to consider revisions.
Criterion 6
The expected achievement for students is for the students to show learning of grade-referenced academic content.
The expectation for criterion 6 is that expected achievement is illustrated through a high degree of inference, demonstrated by:
using baseline data,
having independent student work as evidenced by scoring rubrics and PLDs, and
students demonstrating learning across materials, activities, settings, and/or people.
While the DCAS-Alt1 does not require evidence of student learning through baseline data or for students to demonstrate learning across materials, activities, settings, and/or people, the DCAS-Alt1 does require
69
accurate and independent responses in order to receive credit and to reach proficiency. In general, these requirements allow stakeholders to make inferences from the DCAS-Alt1 test scores about what students know and can do and satisfies the expectations set forth in criterion 6. The DDOE may wish to consider ways in which to require inclusion of evidence of generalization across people and settings and across materials and activities in the assessment as well as using a baseline/post-test type of model. However, this is not necessary to meet the requirements of criterion 6, especially given the format of the DCAS-Alt1 assessment.
Criterion 7
The potential barriers to demonstrating what students know and can do are minimized in the assessment.
This criterion evaluates the accessibility of the DCAS-Alt1 to the wide range of students with the most significant cognitive disabilities. The expectation for criterion 7 is that the assessment is accessible to students with a variety of disabilities, and the assessment includes items accessible to students with a range of communicative competence. Overall, experts rated most GBEs and items across grade levels and content areas as accessible to students at the emerging symbolic or symbolic communication level, with a few GBEs and items at the pre-symbolic level, particularly in ELA and reading. While the expectation for criterion 7 is met, DDOE may want to consider expanding the accessibility of some GBEs and items in each content area to include students at the pre-symbolic communication levels, and, in particular, focus on moving students out of pre-symbolic and into emerging symbolic communication levels through development of communicative competence for these students.
DDOE may also want to conduct a study on the communication levels of the students who participate in the DCAS-Alt1 over the years and monitor student progress. These data will help to ensure that students are making steady progress, and to determine if teachers have any particular professional development needs around the provision of communication strategies and academic language development for students who are pre- and emerging symbolic communicators. The DDOE may also wish to consider reviewing how students with different characteristics score on the DCAS-Alt1. If DDOE chooses to move forward with the National Center and State Collaborative (NCSC) project in which Delaware is a tier II state, the project suggests requesting submission of the Learner Characteristic Inventory for students in the alternate assessment each year. The data on this inventory can be used to track student characteristics and then analyze score results in relation to particular criteria such as communication level, sensory characteristics, etc.
Criterion 8
The instructional program promotes learning in the general curriculum.
The expectation for criterion 8 is that assessment materials and related professional development promote access to the general curriculum, and that the enacted academic curriculum exhibits broad topic coverage with a range of intensity and performance expectations. Overall, the experts reported that the materials and professional development opportunities for the DCAS-Alt1 (and those provided by the ACCESS project) promoted access to the general curriculum. While the 33% CIS participation rate provided a sample of data typical of survey research, the CIS results suggest that the enacted academic curriculum also supports access to the general curriculum. Teachers reported at least some coverage of all topics in all content areas, and a full range of performance expectations in mathematics and ELA. No recommendations are presented for consideration. However, if DDOE has access to the full population

70
of teachers teaching students with the most significant cognitive disabilities via a face-to-face training, DDOE may wish to consider administration of the CIS for full representation of the enacted curriculum.
71
References
Browder, D. M., Wakeman, S.Y., Flowers, C., Rickelman, R., Pugalee, D., Karvonen, M. (2007). Creating access to the general curriculum with links to grade level content for students with significant cognitive disabilities: An explication of the concept. The Journal of Special Education, 41, 2-16.
Detheridge, T., & Whittle, H. (2000). Writing with Symbols 2000 [Computer software]. Cambridge, MA: Widgit Software Ltd.
Flowers, C., Wakeman, S., Browder, D., and Karvonen, M. (2007). Links for academic learning: An alignment protocol for alternate assessments based on alternate achievement standards. Charlotte, North Carolina: University of North Carolina at Charlotte.
Gong, B., & Marion, S. F. (2006). Dealing with flexibility in assessments for students with significant cognitive disabilities. Minneapolis, MN: University of Minnesota, National Center for Educational Outcomes. Retrieved from http://education.umn.edu/nceo/Online/Pubs/Synthesis60.html
Individuals with Disabilities Education Act (IDEA) Amendments of 1997, PL 105-17, 20 U.S.C. § 1400 et seq.
Karvonen, M., Wakeman, S. L., Flowers, C.P., & Browder, D. M. (2007). Measuring the enacted curriculum for students with significant cognitive disabilities: A preliminary investigation. Assessment for Effective Intervention, 33(1), 29-38.
Kearns, J., Kleinert, H.L., Kleinert, J.O., & Towles-Reeves, E. (2006). Learner characteristics inventory. Lexington: University of Kentucky, National Alternate Assessment Center.
Mayer-Johnson, R. (2006). Boardmaker (Version 6) [Computer software]. Solana Beach, CA: Mayer-Johnson Company.
National Center on Educational Outcomes (2007). Aligning alternate assessments to grade level content standards: Issues and considerations for alternates based on alternate achievement standards. Policy Directions, 19, 1-6.
No Child Left Behind Act of 2001, Pub. L. No.107-110, 115 Stat.1425 (2002).
United States Department of Education (2004). 26thAnnual report to congress on the implementation of the Individuals with Disabilities Education Act. Washington, DC.
United States Department of Education (2005). Alternate Achievement Standards for Students with the Most Significant Cognitive Disabilities Non-Regulatory Guidance. Retrieved from http://www2.ed.gov/policy/elsec/guid/altguidance.pdf
Univeristy of Delaware Adapting Curriculum and Classroom Environments for Student Success (ACCESS; 2013). Retrieved from http://www.deaccessproject.org/.
72
Webb, N. L. (1997a). Criteria for alignment of expectations and assessments in mathematics and science education (Research Monograph No. 6). Madison, WI: University of Wisconsin-Madison. See acstaff.wcer.wisc.edu/normw/WEBBMonograph6criteria.pdf
Webb, N. L. (1997b). Determining alignment of expectations and assessments in Mathematics and Science Education: NISE Brief 1(2). See www.wcer.wisc.edu/archive/nise/Publications/Briefs/Vol_1_No_2.
Webb, N. L. (2005). Web Alignment Tool (WAT) Training Manual. Draft version 1.1. Retrieved from wat.wcerw.org/Training%20Manual%202.1%20Draft%20091205.doc
Webb, N. L. (2007). Issues related to judging the alignment of curriculum standards and assessments. Applied Measurement in Education, 20, 7-25.
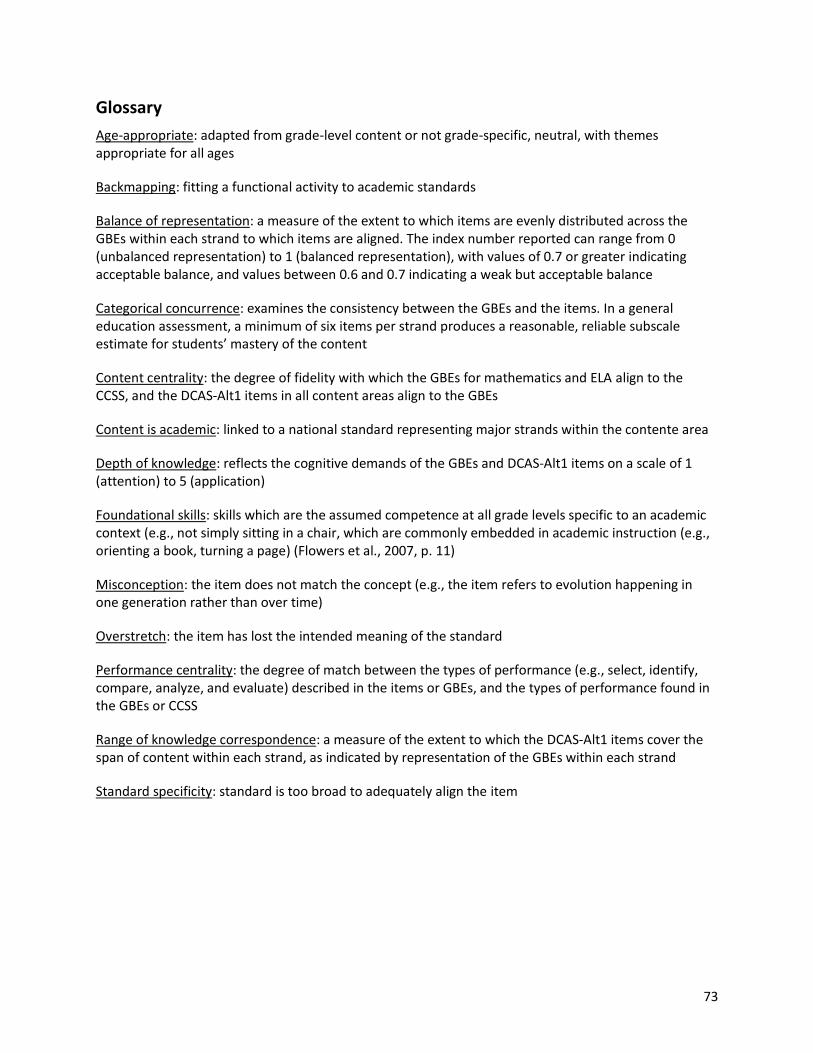
73
Glossary
Age-appropriate: adapted from grade-level content or not grade-specific, neutral, with themes appropriate for all ages
Backmapping: fitting a functional activity to academic standards
Balance of representation: a measure of the extent to which items are evenly distributed across the GBEs within each strand to which items are aligned. The index number reported can range from 0 (unbalanced representation) to 1 (balanced representation), with values of 0.7 or greater indicating acceptable balance, and values between 0.6 and 0.7 indicating a weak but acceptable balance
Categorical concurrence: examines the consistency between the GBEs and the items. In a general education assessment, a minimum of six items per strand produces a reasonable, reliable subscale estimate for students’ mastery of the content
Content centrality: the degree of fidelity with which the GBEs for mathematics and ELA align to the CCSS, and the DCAS-Alt1 items in all content areas align to the GBEs
Content is academic: linked to a national standard representing major strands within the contente area
Depth of knowledge: reflects the cognitive demands of the GBEs and DCAS-Alt1 items on a scale of 1 (attention) to 5 (application)
Foundational skills: skills which are the assumed competence at all grade levels specific to an academic context (e.g., not simply sitting in a chair, which are commonly embedded in academic instruction (e.g., orienting a book, turning a page) (Flowers et al., 2007, p. 11)
Misconception: the item does not match the concept (e.g., the item refers to evolution happening in one generation rather than over time)
Overstretch: the item has lost the intended meaning of the standard
Performance centrality: the degree of match between the types of performance (e.g., select, identify, compare, analyze, and evaluate) described in the items or GBEs, and the types of performance found in the GBEs or CCSS
Range of knowledge correspondence: a measure of the extent to which the DCAS-Alt1 items cover the span of content within each strand, as indicated by representation of the GBEs within each strand
Standard specificity: standard is too broad to adequately align the item
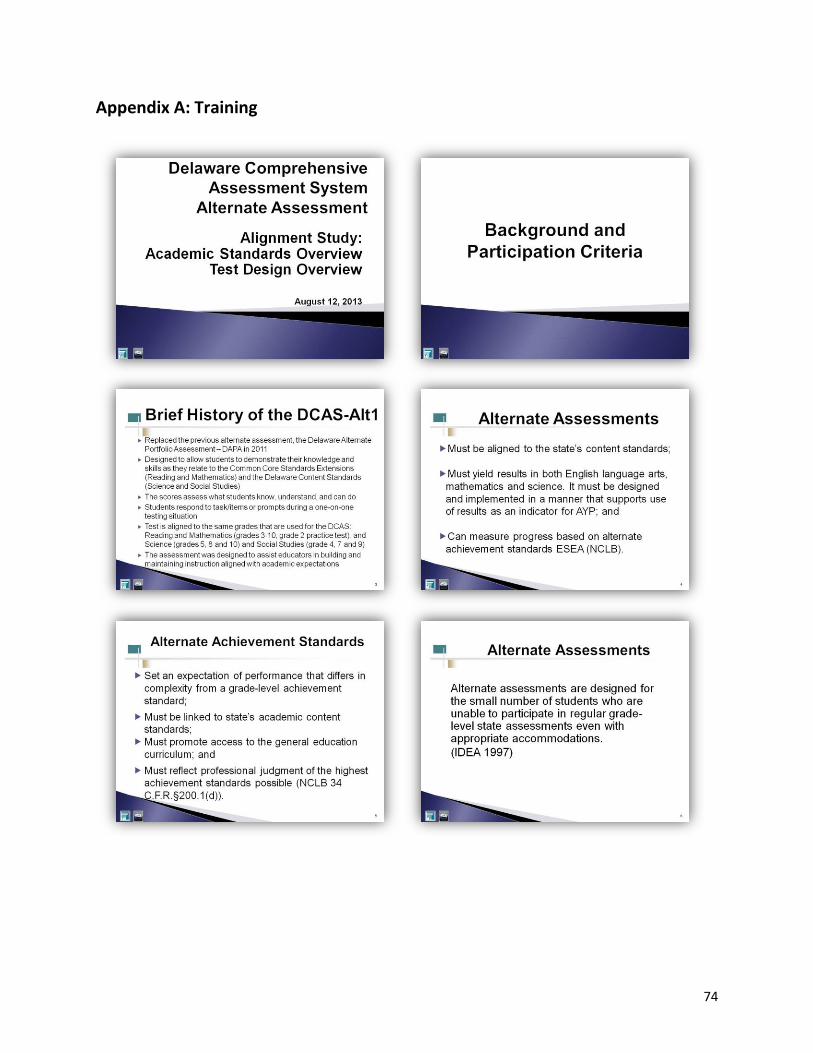
74
Appendix A: Training
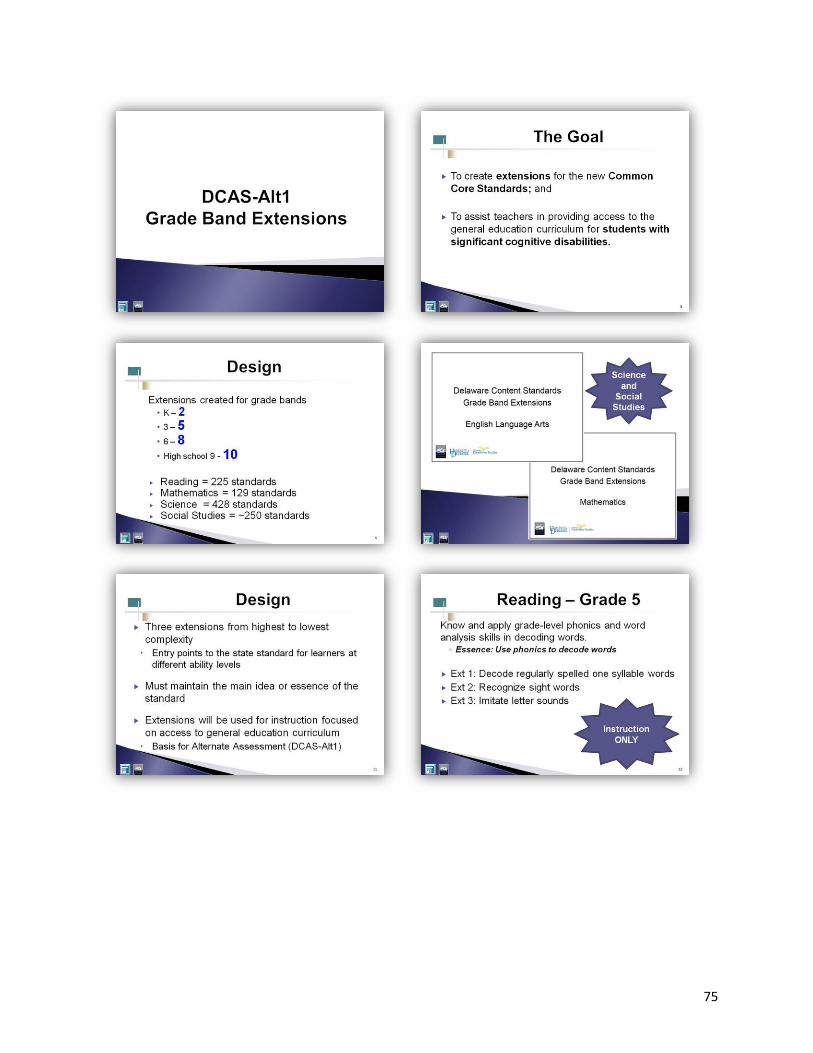
75
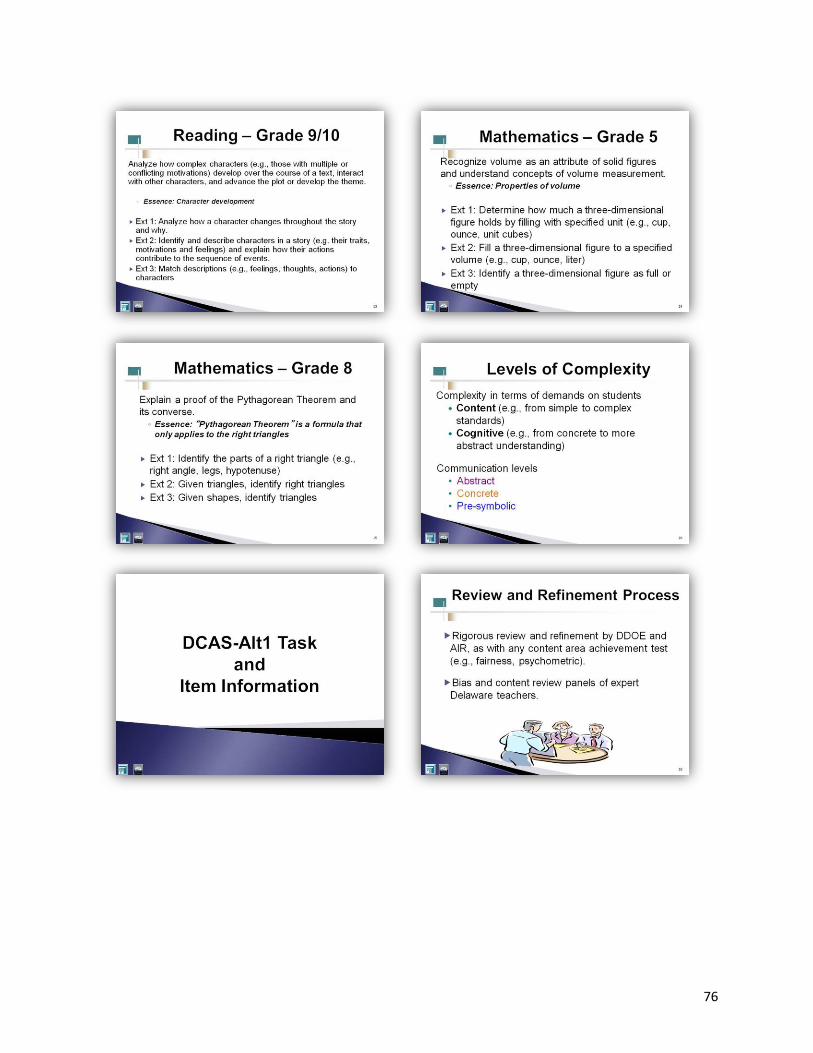
76
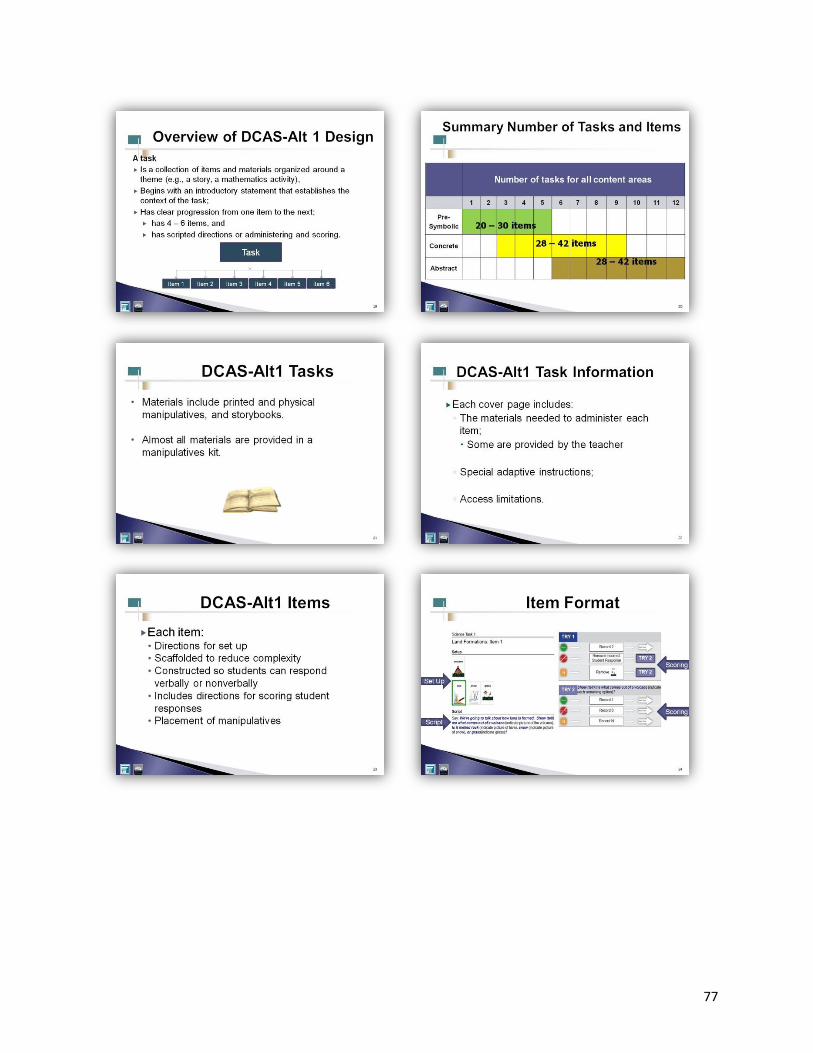
77
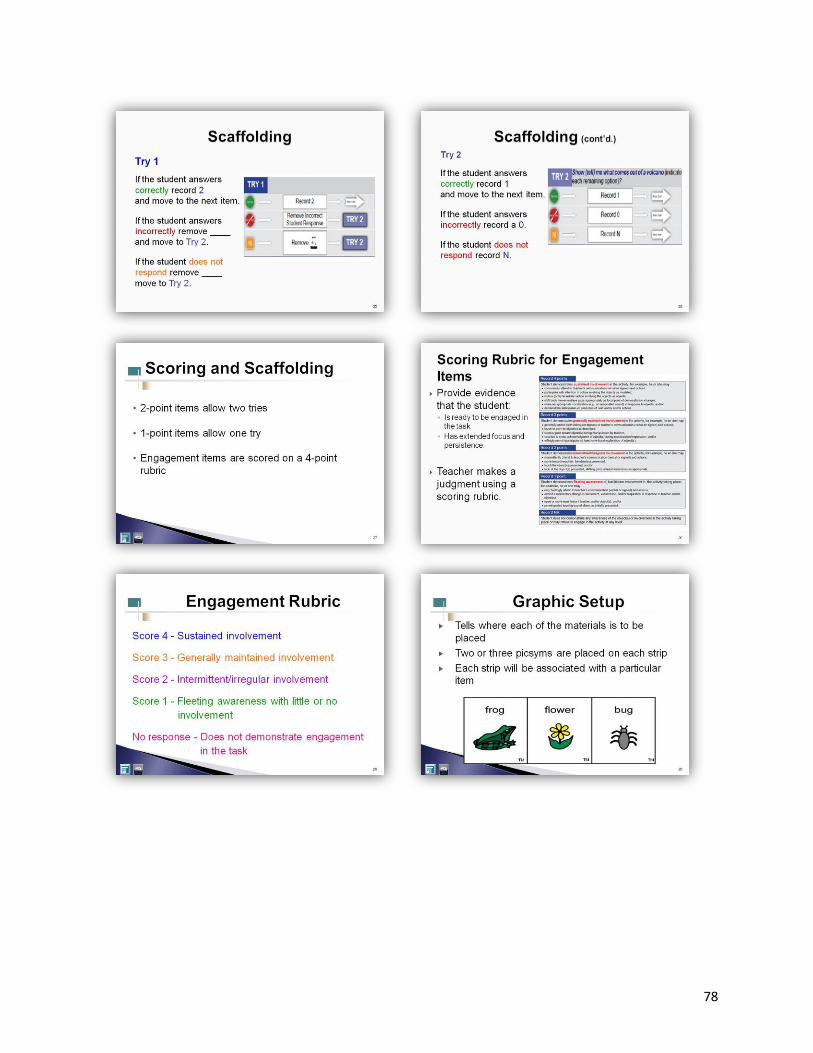
78
79
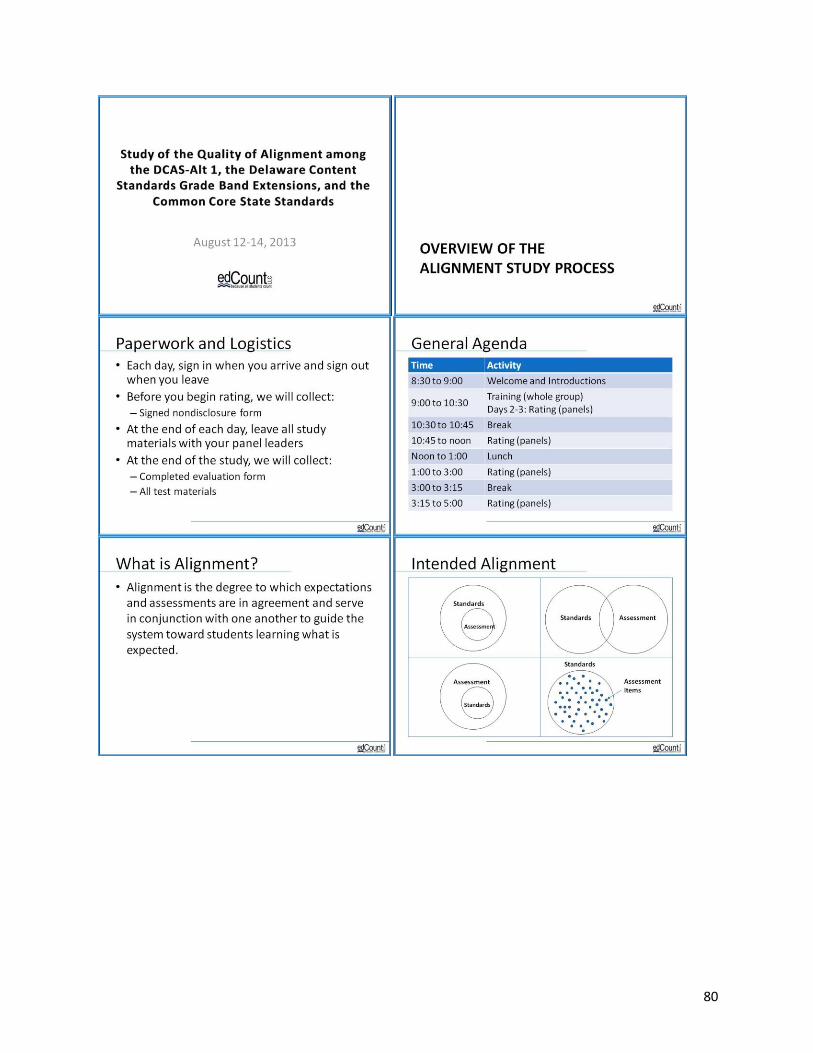
80
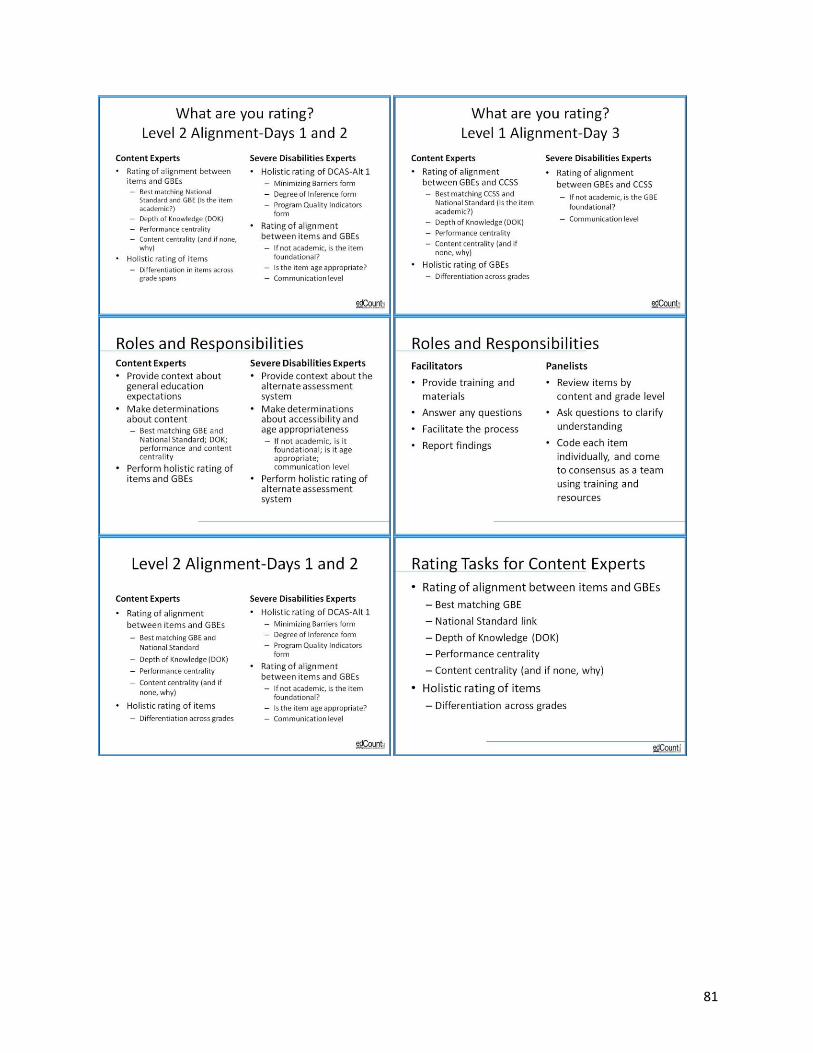
81
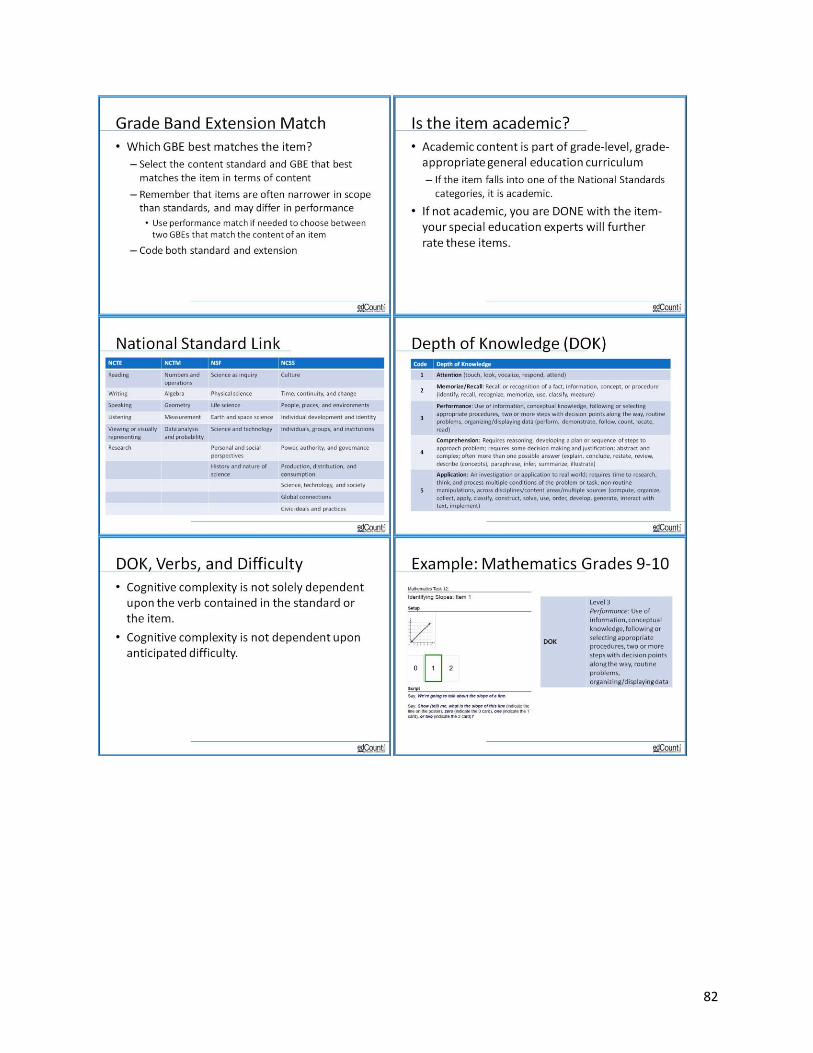
82
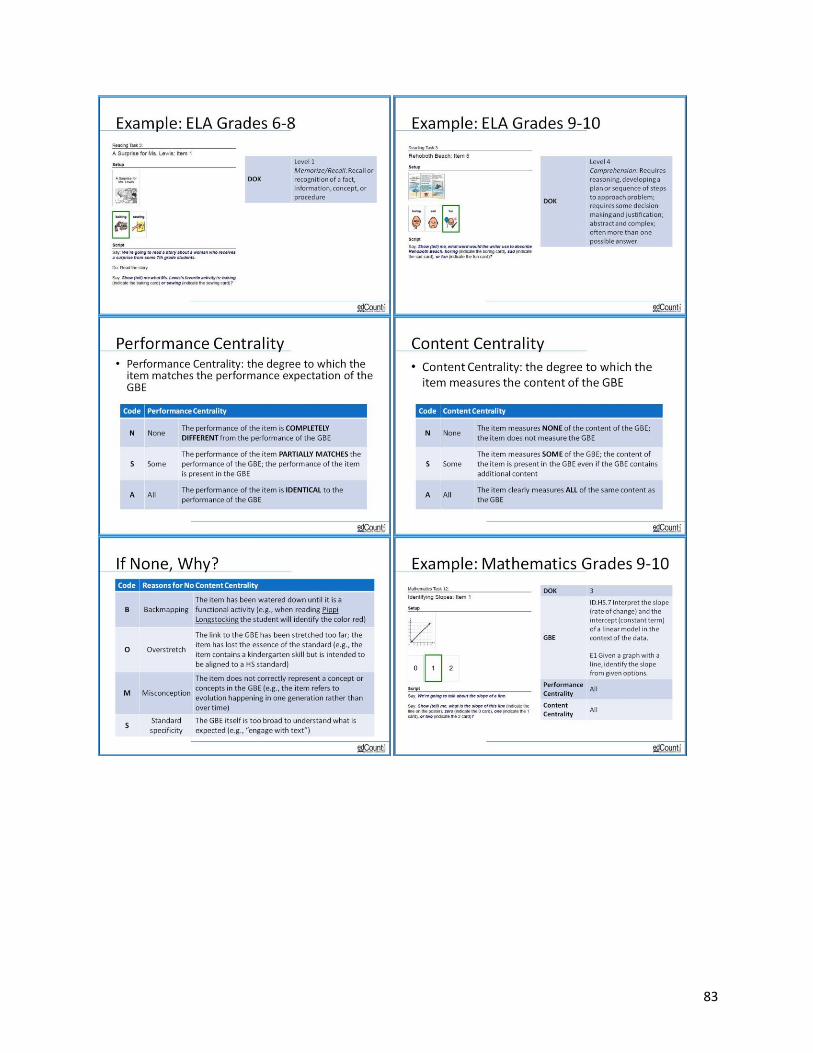
83
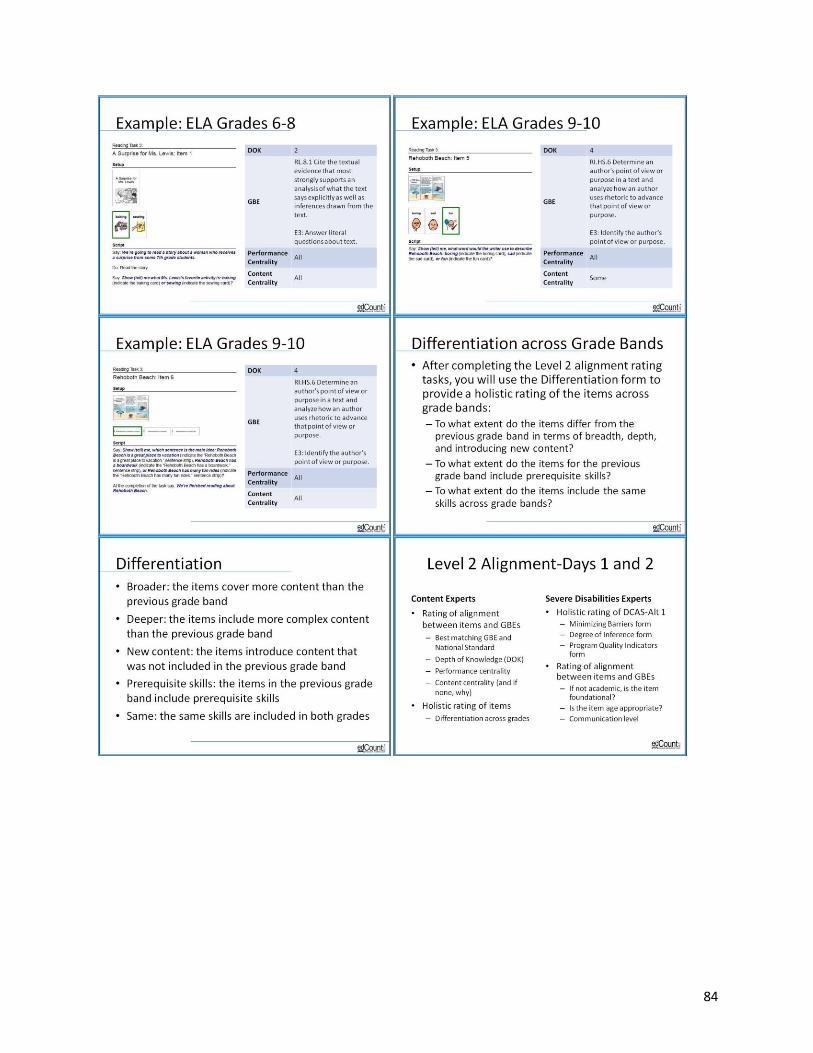
84
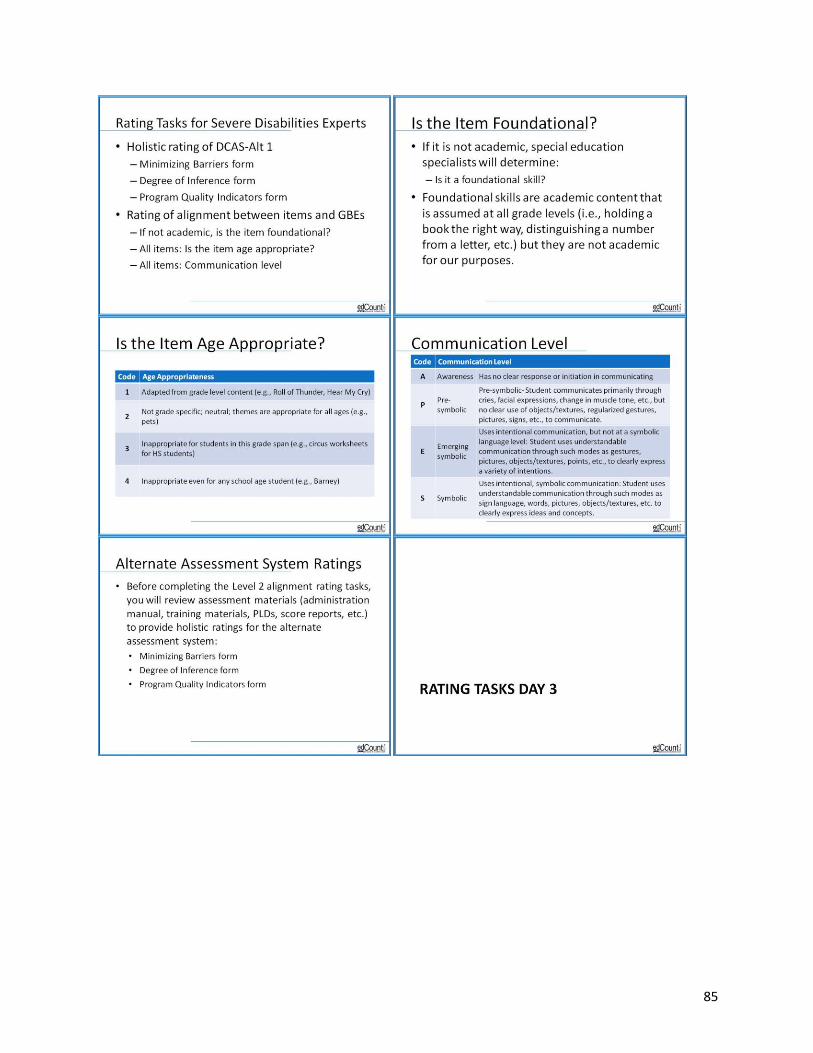
85
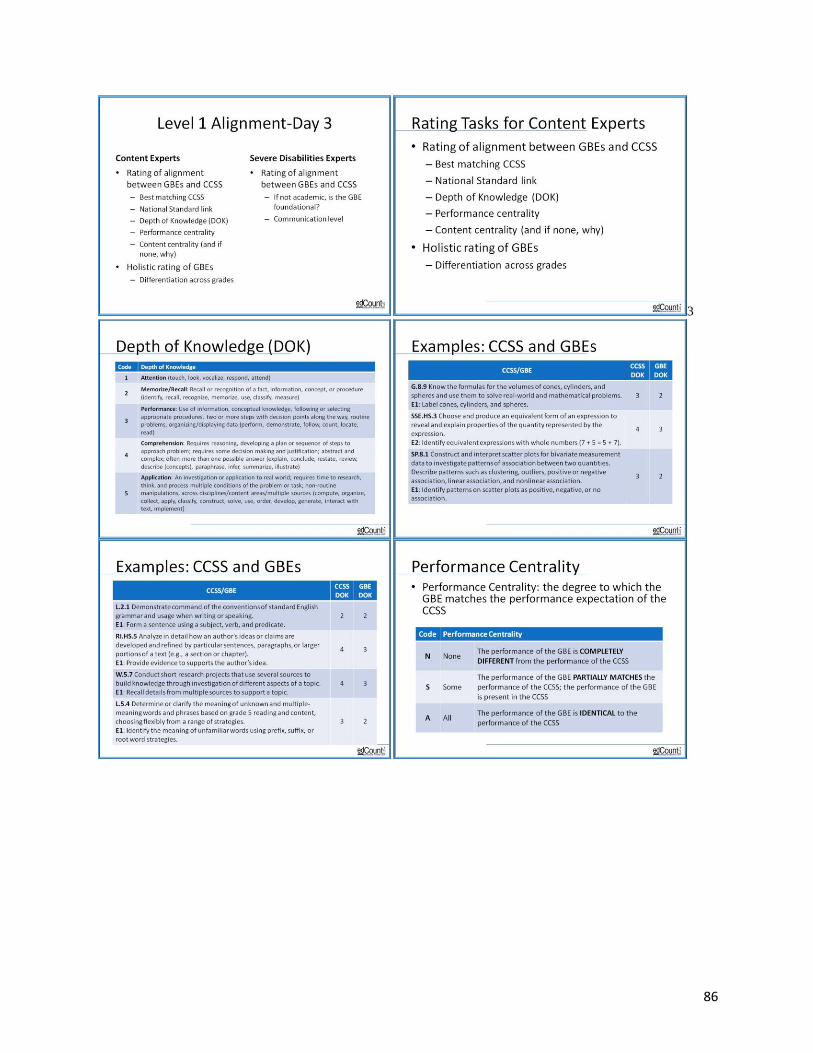
86
3
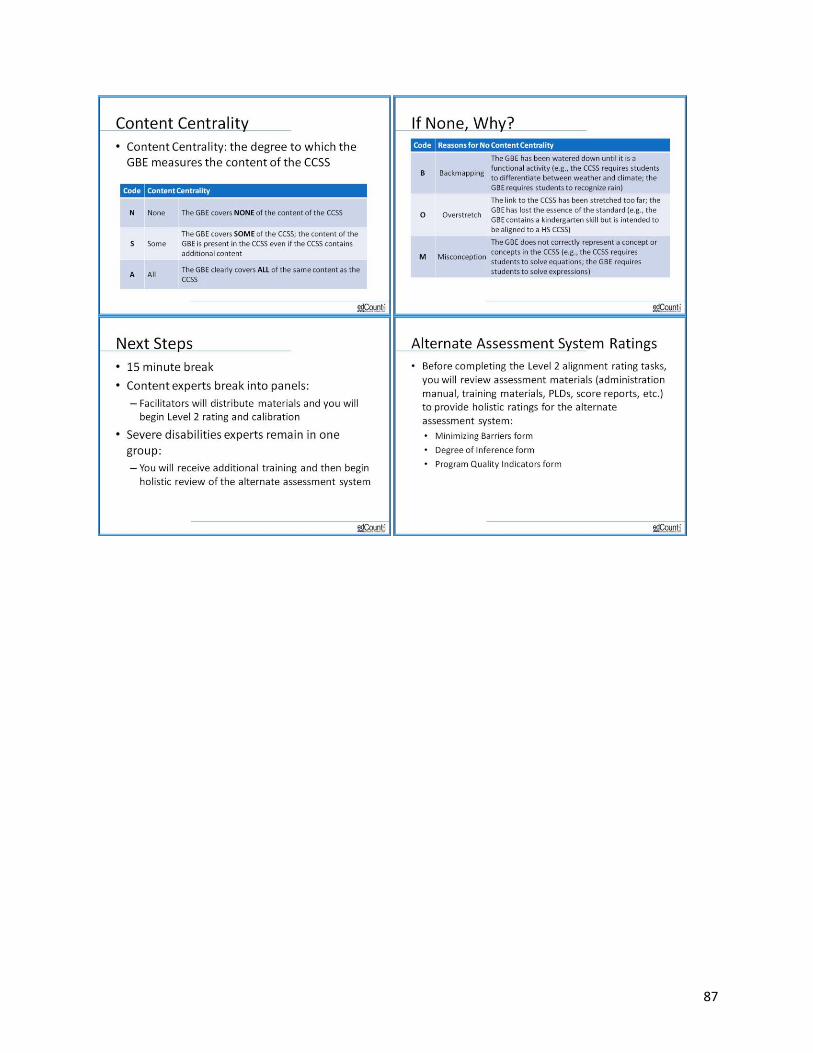
87
88
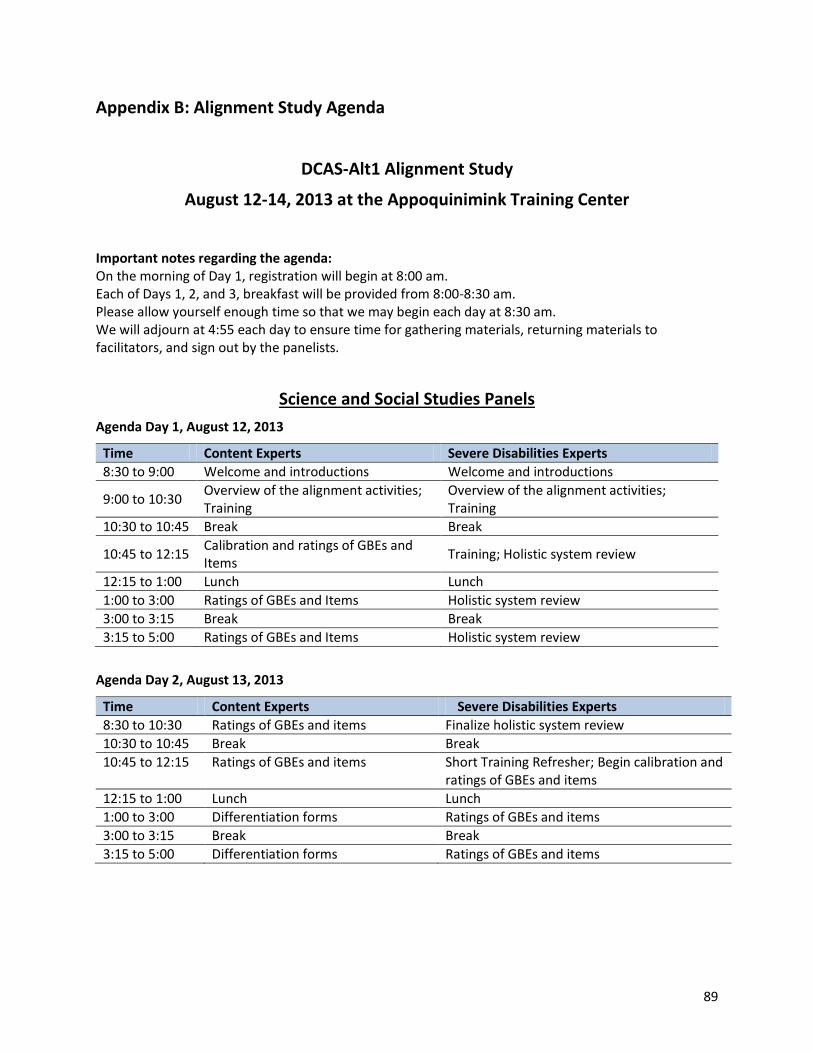
89
Appendix B: Alignment Study Agenda
DCAS-Alt1 Alignment Study
August 12-14, 2013 at the Appoquinimink Training Center
Important notes regarding the agenda: On the morning of Day 1, registration will begin at 8:00 am. Each of Days 1, 2, and 3, breakfast will be provided from 8:00-8:30 am. Please allow yourself enough time so that we may begin each day at 8:30 am. We will adjourn at 4:55 each day to ensure time for gathering materials, returning materials to facilitators, and sign out by the panelists.
Science and Social Studies Panels
Agenda Day 1, August 12, 2013
Time Content Experts Severe Disabilities Experts
8:30 to 9:00 Welcome and introductions Welcome and introductions
9:00 to 10:30 Overview of the alignment activities; Training
Overview of the alignment activities; Training
10:30 to 10:45 Break Break
10:45 to 12:15 Calibration and ratings of GBEs and Items
Training; Holistic system review
12:15 to 1:00 Lunch Lunch
1:00 to 3:00 Ratings of GBEs and Items Holistic system review
3:00 to 3:15 Break Break
3:15 to 5:00 Ratings of GBEs and Items Holistic system review
Agenda Day 2, August 13, 2013
Time Content Experts Severe Disabilities Experts
8:30 to 10:30 Ratings of GBEs and items Finalize holistic system review
10:30 to 10:45 Break Break
10:45 to 12:15 Ratings of GBEs and items Short Training Refresher; Begin calibration and ratings of GBEs and items
12:15 to 1:00 Lunch Lunch
1:00 to 3:00 Differentiation forms Ratings of GBEs and items
3:00 to 3:15 Break Break
3:15 to 5:00 Differentiation forms Ratings of GBEs and items
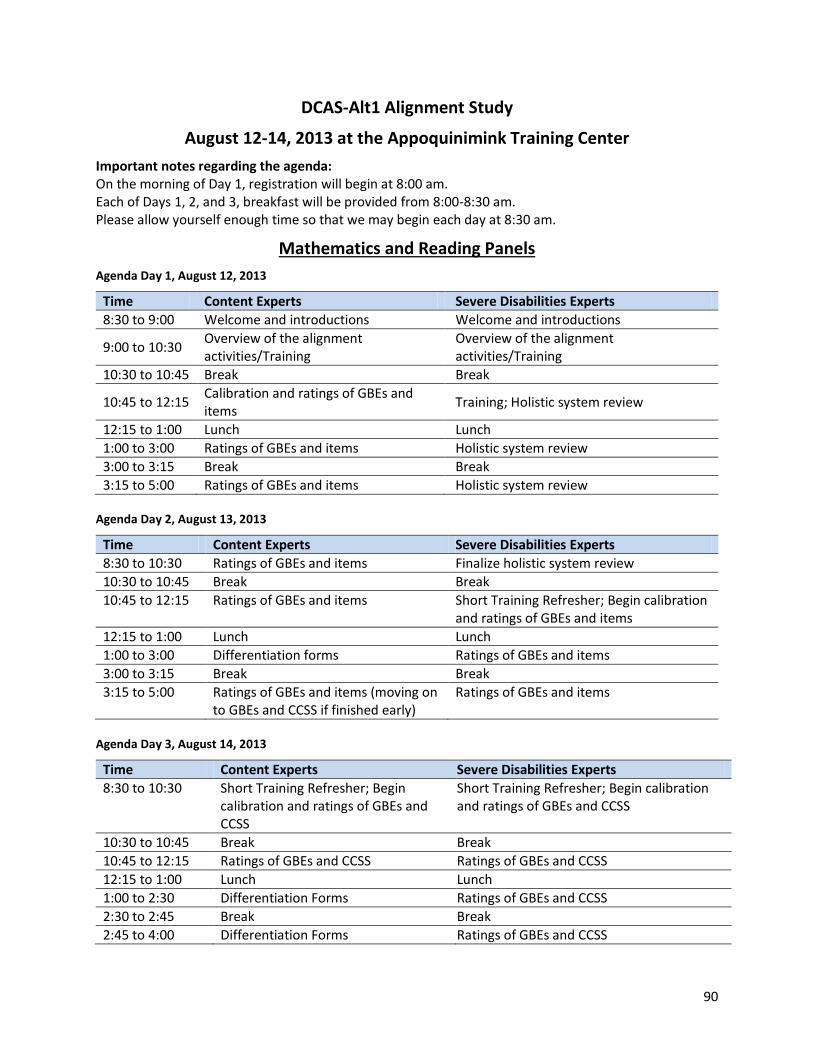
90
DCAS-Alt1 Alignment Study
August 12-14, 2013 at the Appoquinimink Training Center
Important notes regarding the agenda: On the morning of Day 1, registration will begin at 8:00 am. Each of Days 1, 2, and 3, breakfast will be provided from 8:00-8:30 am. Please allow yourself enough time so that we may begin each day at 8:30 am.
Mathematics and Reading Panels
Agenda Day 1, August 12, 2013
Time Content Experts Severe Disabilities Experts
8:30 to 9:00 Welcome and introductions Welcome and introductions
9:00 to 10:30 Overview of the alignment activities/Training
Overview of the alignment activities/Training
10:30 to 10:45 Break Break
10:45 to 12:15 Calibration and ratings of GBEs and items
Training; Holistic system review
12:15 to 1:00 Lunch Lunch
1:00 to 3:00 Ratings of GBEs and items Holistic system review
3:00 to 3:15 Break Break
3:15 to 5:00 Ratings of GBEs and items Holistic system review
Agenda Day 2, August 13, 2013
Time Content Experts Severe Disabilities Experts
8:30 to 10:30 Ratings of GBEs and items Finalize holistic system review
10:30 to 10:45 Break Break
10:45 to 12:15 Ratings of GBEs and items Short Training Refresher; Begin calibration and ratings of GBEs and items
12:15 to 1:00 Lunch Lunch
1:00 to 3:00 Differentiation forms Ratings of GBEs and items
3:00 to 3:15 Break Break
3:15 to 5:00 Ratings of GBEs and items (moving on to GBEs and CCSS if finished early)
Ratings of GBEs and items
Agenda Day 3, August 14, 2013
Time Content Experts Severe Disabilities Experts
8:30 to 10:30 Short Training Refresher; Begin calibration and ratings of GBEs and CCSS
Short Training Refresher; Begin calibration and ratings of GBEs and CCSS
10:30 to 10:45 Break Break
10:45 to 12:15 Ratings of GBEs and CCSS Ratings of GBEs and CCSS
12:15 to 1:00 Lunch Lunch
1:00 to 2:30 Differentiation Forms Ratings of GBEs and CCSS
2:30 to 2:45 Break Break
2:45 to 4:00 Differentiation Forms Ratings of GBEs and CCSS
91
Appendix C: GBEs and Items Rated “None” for Content Centrality
A1: Mathematics
GBEs
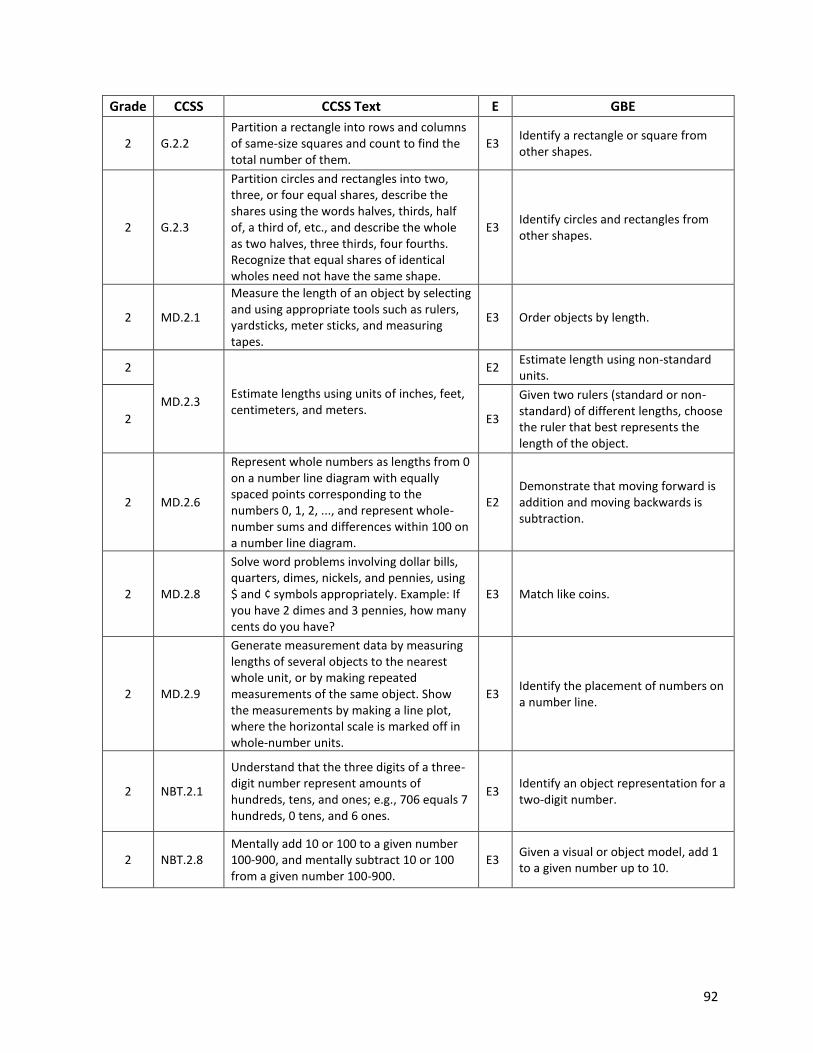
92
Grade CCSS CCSS Text E GBE
2 G.2.2 Partition a rectangle into rows and columns of same-size squares and count to find the total number of them.
E3 Identify a rectangle or square from other shapes.
2 G.2.3
Partition circles and rectangles into two, three, or four equal shares, describe the shares using the words halves, thirds, half of, a third of, etc., and describe the whole as two halves, three thirds, four fourths. Recognize that equal shares of identical wholes need not have the same shape.
E3 Identify circles and rectangles from other shapes.
2 MD.2.1
Measure the length of an object by selecting and using appropriate tools such as rulers, yardsticks, meter sticks, and measuring tapes.
E3 Order objects by length.
2
MD.2.3 Estimate lengths using units of inches, feet, centimeters, and meters.
E2 Estimate length using non-standard units.
2 E3
Given two rulers (standard or non-standard) of different lengths, choose the ruler that best represents the length of the object.
2 MD.2.6
Represent whole numbers as lengths from 0 on a number line diagram with equally spaced points corresponding to the numbers 0, 1, 2, ..., and represent whole-number sums and differences within 100 on a number line diagram.
E2 Demonstrate that moving forward is addition and moving backwards is subtraction.
2 MD.2.8
Solve word problems involving dollar bills, quarters, dimes, nickels, and pennies, using $ and ¢ symbols appropriately. Example: If you have 2 dimes and 3 pennies, how many cents do you have?
E3 Match like coins.
2 MD.2.9
Generate measurement data by measuring lengths of several objects to the nearest whole unit, or by making repeated measurements of the same object. Show the measurements by making a line plot, where the horizontal scale is marked off in whole-number units.
E3 Identify the placement of numbers on a number line.
2 NBT.2.1
Understand that the three digits of a three-digit number represent amounts of hundreds, tens, and ones; e.g., 706 equals 7 hundreds, 0 tens, and 6 ones.
E3 Identify an object representation for a two-digit number.
2 NBT.2.8 Mentally add 10 or 100 to a given number 100-900, and mentally subtract 10 or 100 from a given number 100-900.
E3 Given a visual or object model, add 1 to a given number up to 10.
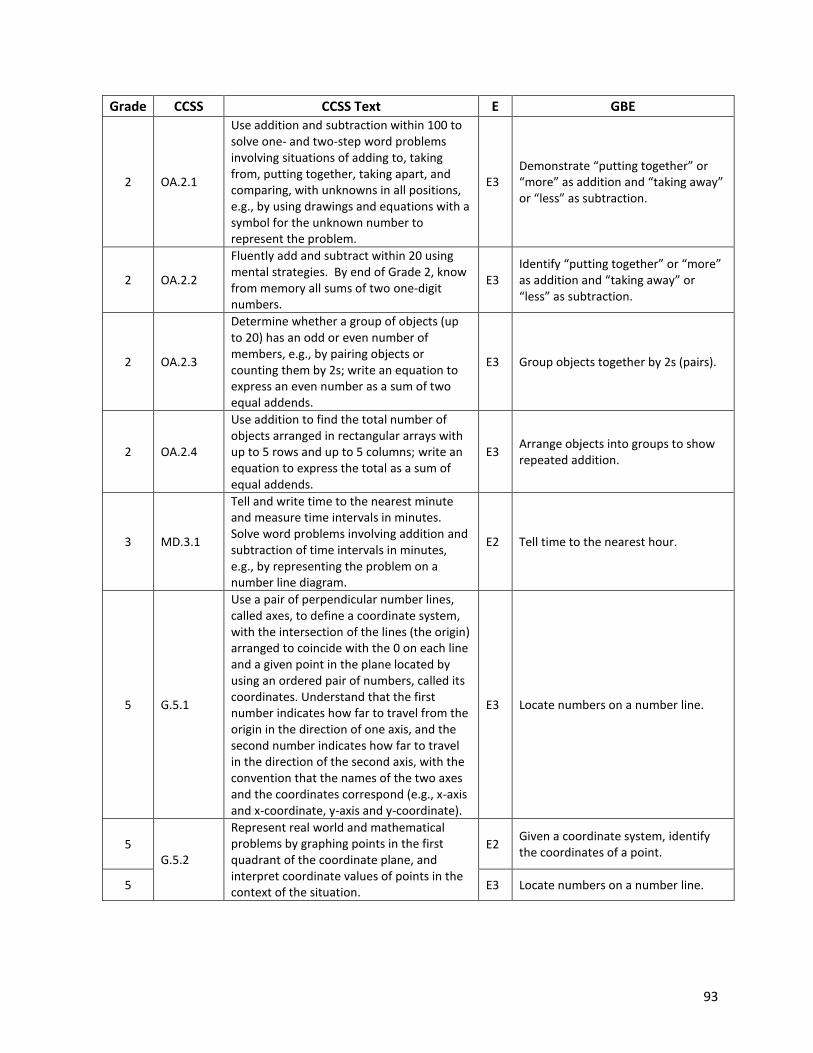
93
Grade CCSS CCSS Text E GBE
2 OA.2.1
Use addition and subtraction within 100 to solve one- and two-step word problems involving situations of adding to, taking from, putting together, taking apart, and comparing, with unknowns in all positions, e.g., by using drawings and equations with a symbol for the unknown number to represent the problem.
E3 Demonstrate “putting together” or “more” as addition and “taking away” or “less” as subtraction.
2 OA.2.2
Fluently add and subtract within 20 using mental strategies. By end of Grade 2, know from memory all sums of two one-digit numbers.
E3 Identify “putting together” or “more” as addition and “taking away” or “less” as subtraction.
2 OA.2.3
Determine whether a group of objects (up to 20) has an odd or even number of members, e.g., by pairing objects or counting them by 2s; write an equation to express an even number as a sum of two equal addends.
E3 Group objects together by 2s (pairs).
2 OA.2.4
Use addition to find the total number of objects arranged in rectangular arrays with up to 5 rows and up to 5 columns; write an equation to express the total as a sum of equal addends.
E3 Arrange objects into groups to show repeated addition.
3 MD.3.1
Tell and write time to the nearest minute and measure time intervals in minutes. Solve word problems involving addition and subtraction of time intervals in minutes, e.g., by representing the problem on a number line diagram.
E2 Tell time to the nearest hour.
5 G.5.1
Use a pair of perpendicular number lines, called axes, to define a coordinate system, with the intersection of the lines (the origin) arranged to coincide with the 0 on each line and a given point in the plane located by using an ordered pair of numbers, called its coordinates. Understand that the first number indicates how far to travel from the origin in the direction of one axis, and the second number indicates how far to travel in the direction of the second axis, with the convention that the names of the two axes and the coordinates correspond (e.g., x-axis and x-coordinate, y-axis and y-coordinate).
E3 Locate numbers on a number line.
5 G.5.2
Represent real world and mathematical problems by graphing points in the first quadrant of the coordinate plane, and interpret coordinate values of points in the context of the situation.
E2 Given a coordinate system, identify the coordinates of a point.
5 E3 Locate numbers on a number line.
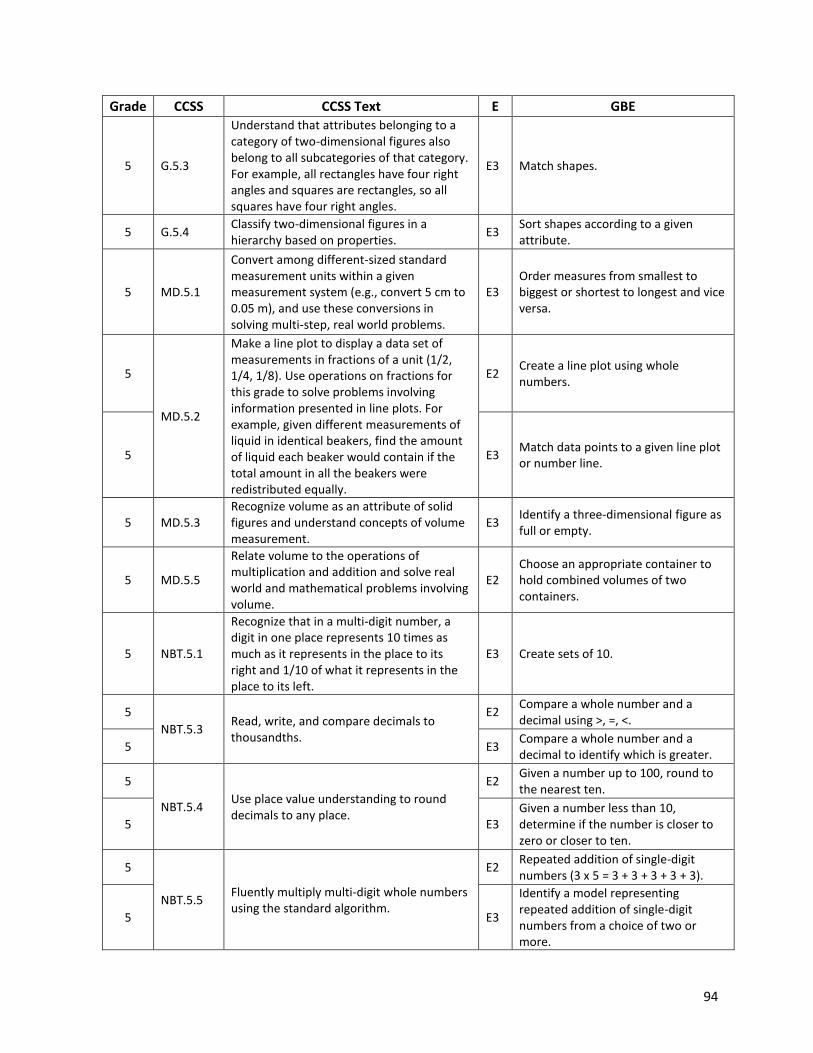
94
Grade CCSS CCSS Text E GBE
5 G.5.3
Understand that attributes belonging to a category of two-dimensional figures also belong to all subcategories of that category. For example, all rectangles have four right angles and squares are rectangles, so all squares have four right angles.
E3 Match shapes.
5 G.5.4 Classify two-dimensional figures in a hierarchy based on properties.
E3 Sort shapes according to a given attribute.
5 MD.5.1
Convert among different-sized standard measurement units within a given measurement system (e.g., convert 5 cm to 0.05 m), and use these conversions in solving multi-step, real world problems.
E3 Order measures from smallest to biggest or shortest to longest and vice versa.
5
MD.5.2
Make a line plot to display a data set of measurements in fractions of a unit (1/2, 1/4, 1/8). Use operations on fractions for this grade to solve problems involving information presented in line plots. For example, given different measurements of liquid in identical beakers, find the amount of liquid each beaker would contain if the total amount in all the beakers were redistributed equally.
E2 Create a line plot using whole numbers.
5 E3 Match data points to a given line plot or number line.
5 MD.5.3 Recognize volume as an attribute of solid figures and understand concepts of volume measurement.
E3 Identify a three-dimensional figure as full or empty.
5 MD.5.5
Relate volume to the operations of multiplication and addition and solve real world and mathematical problems involving volume.
E2 Choose an appropriate container to hold combined volumes of two containers.
5 NBT.5.1
Recognize that in a multi-digit number, a digit in one place represents 10 times as much as it represents in the place to its right and 1/10 of what it represents in the place to its left.
E3 Create sets of 10.
5
NBT.5.3 Read, write, and compare decimals to thousandths.
E2 Compare a whole number and a decimal using >, =, <.
5 E3 Compare a whole number and a decimal to identify which is greater.
5
NBT.5.4 Use place value understanding to round decimals to any place.
E2 Given a number up to 100, round to the nearest ten.
5 E3 Given a number less than 10, determine if the number is closer to zero or closer to ten.
5
NBT.5.5 Fluently multiply multi-digit whole numbers using the standard algorithm.
E2 Repeated addition of single-digit numbers (3 x 5 = 3 + 3 + 3 + 3 + 3).
5 E3
Identify a model representing repeated addition of single-digit numbers from a choice of two or more.
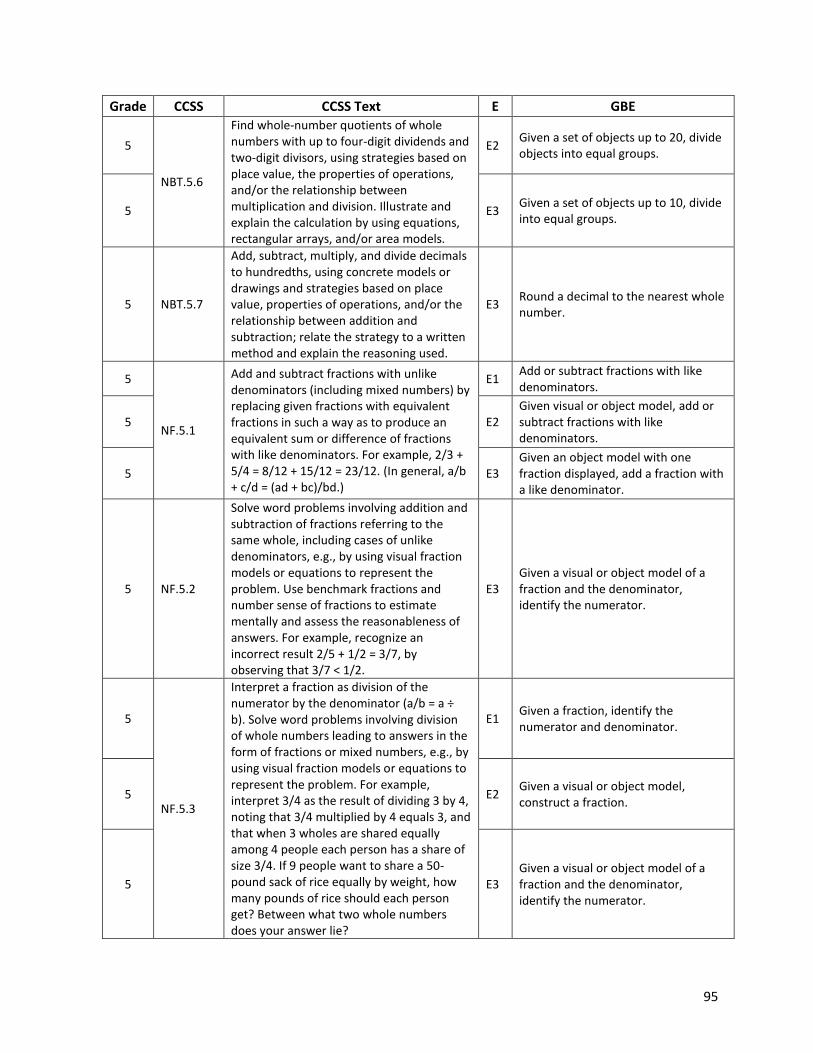
95
Grade CCSS CCSS Text E GBE
5
NBT.5.6
Find whole-number quotients of whole numbers with up to four-digit dividends and two-digit divisors, using strategies based on place value, the properties of operations, and/or the relationship between multiplication and division. Illustrate and explain the calculation by using equations, rectangular arrays, and/or area models.
E2 Given a set of objects up to 20, divide objects into equal groups.
5 E3 Given a set of objects up to 10, divide into equal groups.
5 NBT.5.7
Add, subtract, multiply, and divide decimals to hundredths, using concrete models or drawings and strategies based on place value, properties of operations, and/or the relationship between addition and subtraction; relate the strategy to a written method and explain the reasoning used.
E3 Round a decimal to the nearest whole number.
5
NF.5.1
Add and subtract fractions with unlike denominators (including mixed numbers) by replacing given fractions with equivalent fractions in such a way as to produce an equivalent sum or difference of fractions with like denominators. For example, 2/3 + 5/4 = 8/12 + 15/12 = 23/12. (In general, a/b + c/d = (ad + bc)/bd.)
E1 Add or subtract fractions with like denominators.
5 E2 Given visual or object model, add or subtract fractions with like denominators.
5 E3 Given an object model with one fraction displayed, add a fraction with a like denominator.
5 NF.5.2
Solve word problems involving addition and subtraction of fractions referring to the same whole, including cases of unlike denominators, e.g., by using visual fraction models or equations to represent the problem. Use benchmark fractions and number sense of fractions to estimate mentally and assess the reasonableness of answers. For example, recognize an incorrect result 2/5 + 1/2 = 3/7, by observing that 3/7 < 1/2.
E3 Given a visual or object model of a fraction and the denominator, identify the numerator.
5
NF.5.3
Interpret a fraction as division of the numerator by the denominator (a/b = a ÷ b). Solve word problems involving division of whole numbers leading to answers in the form of fractions or mixed numbers, e.g., by using visual fraction models or equations to represent the problem. For example, interpret 3/4 as the result of dividing 3 by 4, noting that 3/4 multiplied by 4 equals 3, and that when 3 wholes are shared equally among 4 people each person has a share of size 3/4. If 9 people want to share a 50-pound sack of rice equally by weight, how many pounds of rice should each person get? Between what two whole numbers does your answer lie?
E1 Given a fraction, identify the numerator and denominator.
5 E2 Given a visual or object model, construct a fraction.
5 E3 Given a visual or object model of a fraction and the denominator, identify the numerator.
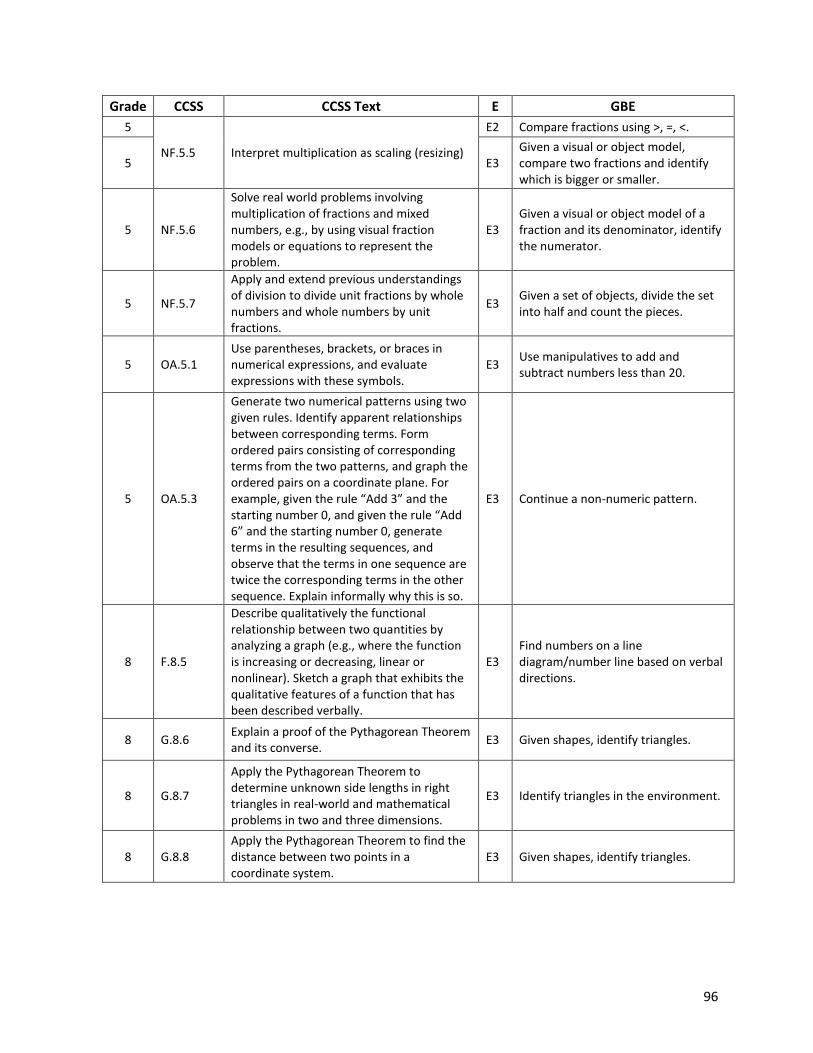
96
Grade CCSS CCSS Text E GBE
5
NF.5.5 Interpret multiplication as scaling (resizing)
E2 Compare fractions using >, =, <.
5 E3 Given a visual or object model, compare two fractions and identify which is bigger or smaller.
5 NF.5.6
Solve real world problems involving multiplication of fractions and mixed numbers, e.g., by using visual fraction models or equations to represent the problem.
E3 Given a visual or object model of a fraction and its denominator, identify the numerator.
5 NF.5.7
Apply and extend previous understandings of division to divide unit fractions by whole numbers and whole numbers by unit fractions.
E3 Given a set of objects, divide the set into half and count the pieces.
5 OA.5.1 Use parentheses, brackets, or braces in numerical expressions, and evaluate expressions with these symbols.
E3 Use manipulatives to add and subtract numbers less than 20.
5 OA.5.3
Generate two numerical patterns using two given rules. Identify apparent relationships between corresponding terms. Form ordered pairs consisting of corresponding terms from the two patterns, and graph the ordered pairs on a coordinate plane. For example, given the rule “Add 3” and the starting number 0, and given the rule “Add 6” and the starting number 0, generate terms in the resulting sequences, and observe that the terms in one sequence are twice the corresponding terms in the other sequence. Explain informally why this is so.
E3 Continue a non-numeric pattern.
8 F.8.5
Describe qualitatively the functional relationship between two quantities by analyzing a graph (e.g., where the function is increasing or decreasing, linear or nonlinear). Sketch a graph that exhibits the qualitative features of a function that has been described verbally.
E3 Find numbers on a line diagram/number line based on verbal directions.
8 G.8.6 Explain a proof of the Pythagorean Theorem and its converse.
E3 Given shapes, identify triangles.
8 G.8.7
Apply the Pythagorean Theorem to determine unknown side lengths in right triangles in real-world and mathematical problems in two and three dimensions.
E3 Identify triangles in the environment.
8 G.8.8 Apply the Pythagorean Theorem to find the distance between two points in a coordinate system.
E3 Given shapes, identify triangles.
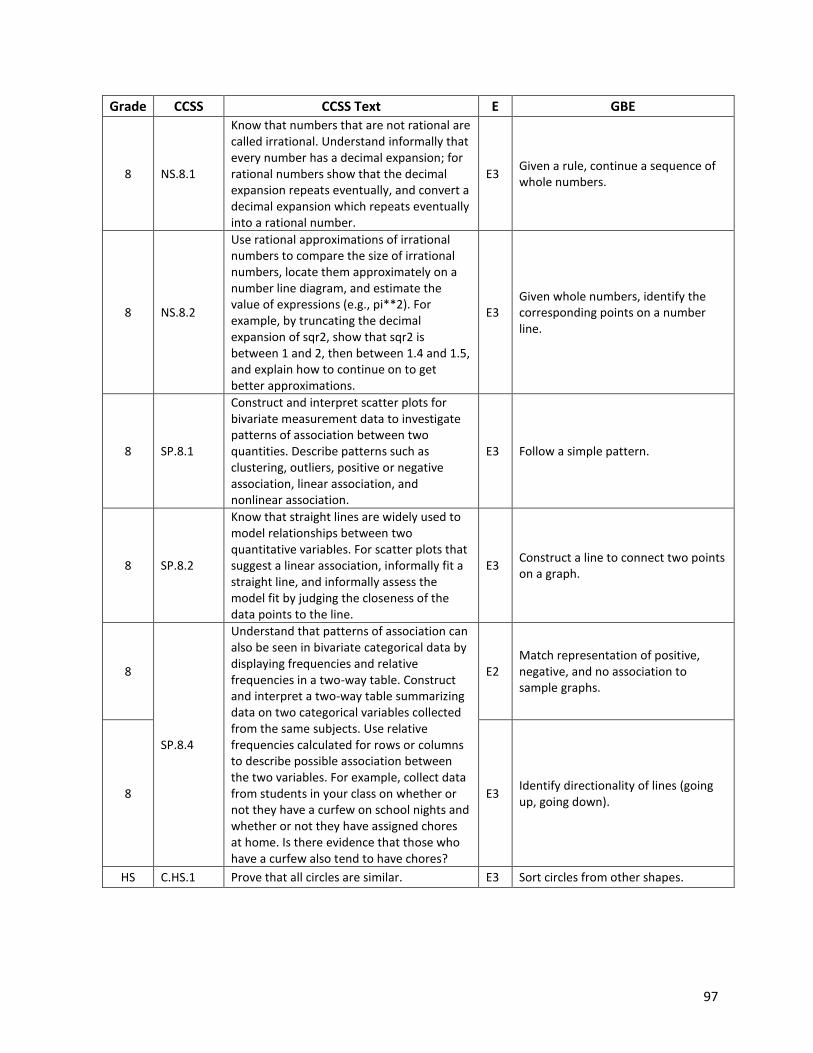
97
Grade CCSS CCSS Text E GBE
8 NS.8.1
Know that numbers that are not rational are called irrational. Understand informally that every number has a decimal expansion; for rational numbers show that the decimal expansion repeats eventually, and convert a decimal expansion which repeats eventually into a rational number.
E3 Given a rule, continue a sequence of whole numbers.
8 NS.8.2
Use rational approximations of irrational numbers to compare the size of irrational numbers, locate them approximately on a number line diagram, and estimate the value of expressions (e.g., pi**2). For example, by truncating the decimal expansion of sqr2, show that sqr2 is between 1 and 2, then between 1.4 and 1.5, and explain how to continue on to get better approximations.
E3 Given whole numbers, identify the corresponding points on a number line.
8 SP.8.1
Construct and interpret scatter plots for bivariate measurement data to investigate patterns of association between two quantities. Describe patterns such as clustering, outliers, positive or negative association, linear association, and nonlinear association.
E3 Follow a simple pattern.
8 SP.8.2
Know that straight lines are widely used to model relationships between two quantitative variables. For scatter plots that suggest a linear association, informally fit a straight line, and informally assess the model fit by judging the closeness of the data points to the line.
E3 Construct a line to connect two points on a graph.
8
SP.8.4
Understand that patterns of association can also be seen in bivariate categorical data by displaying frequencies and relative frequencies in a two-way table. Construct and interpret a two-way table summarizing data on two categorical variables collected from the same subjects. Use relative frequencies calculated for rows or columns to describe possible association between the two variables. For example, collect data from students in your class on whether or not they have a curfew on school nights and whether or not they have assigned chores at home. Is there evidence that those who have a curfew also tend to have chores?
E2 Match representation of positive, negative, and no association to sample graphs.
8 E3 Identify directionality of lines (going up, going down).
HS C.HS.1 Prove that all circles are similar. E3 Sort circles from other shapes.
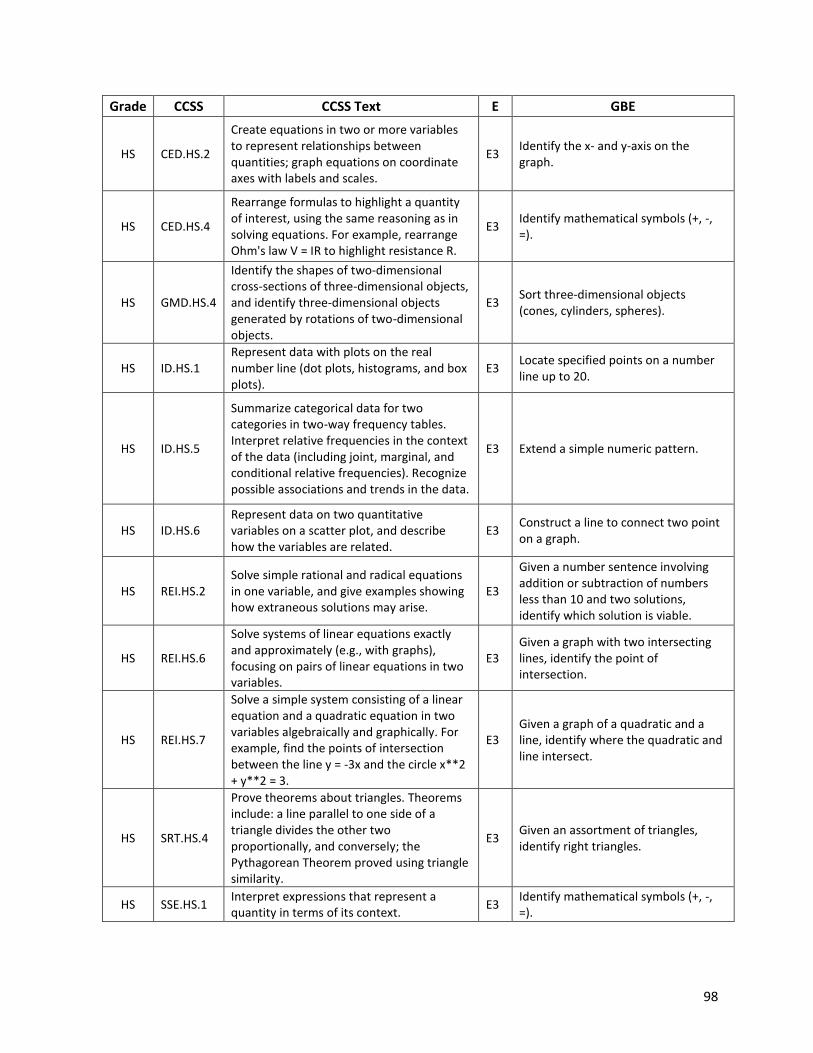
98
Grade CCSS CCSS Text E GBE
HS CED.HS.2
Create equations in two or more variables to represent relationships between quantities; graph equations on coordinate axes with labels and scales.
E3 Identify the x- and y-axis on the graph.
HS CED.HS.4
Rearrange formulas to highlight a quantity of interest, using the same reasoning as in solving equations. For example, rearrange Ohm's law V = IR to highlight resistance R.
E3 Identify mathematical symbols (+, -, =).
HS GMD.HS.4
Identify the shapes of two-dimensional cross-sections of three-dimensional objects, and identify three-dimensional objects generated by rotations of two-dimensional objects.
E3 Sort three-dimensional objects (cones, cylinders, spheres).
HS ID.HS.1 Represent data with plots on the real number line (dot plots, histograms, and box plots).
E3 Locate specified points on a number line up to 20.
HS ID.HS.5
Summarize categorical data for two categories in two-way frequency tables. Interpret relative frequencies in the context of the data (including joint, marginal, and conditional relative frequencies). Recognize possible associations and trends in the data.
E3 Extend a simple numeric pattern.
HS ID.HS.6 Represent data on two quantitative variables on a scatter plot, and describe how the variables are related.
E3 Construct a line to connect two point on a graph.
HS REI.HS.2 Solve simple rational and radical equations in one variable, and give examples showing how extraneous solutions may arise.
E3
Given a number sentence involving addition or subtraction of numbers less than 10 and two solutions, identify which solution is viable.
HS REI.HS.6
Solve systems of linear equations exactly and approximately (e.g., with graphs), focusing on pairs of linear equations in two variables.
E3 Given a graph with two intersecting lines, identify the point of intersection.
HS REI.HS.7
Solve a simple system consisting of a linear equation and a quadratic equation in two variables algebraically and graphically. For example, find the points of intersection between the line y = -3x and the circle x**2 + y**2 = 3.
E3 Given a graph of a quadratic and a line, identify where the quadratic and line intersect.
HS SRT.HS.4
Prove theorems about triangles. Theorems include: a line parallel to one side of a triangle divides the other two proportionally, and conversely; the Pythagorean Theorem proved using triangle similarity.
E3 Given an assortment of triangles, identify right triangles.
HS SSE.HS.1 Interpret expressions that represent a quantity in terms of its context.
E3 Identify mathematical symbols (+, -, =).
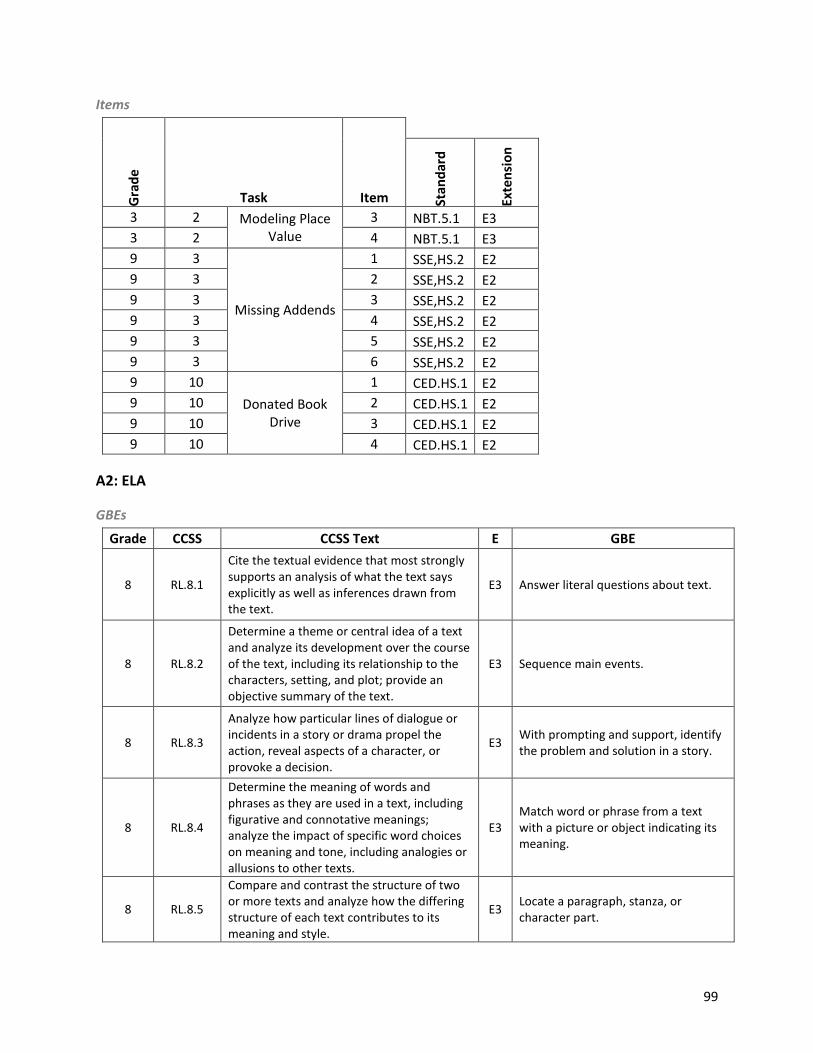
99
Items
Gra
de
Task Item
Stan
dar
d
Exte
nsi
on
3 2 Modeling Place Value
3 NBT.5.1 E3
3 2 4 NBT.5.1 E3
9 3
Missing Addends
1 SSE,HS.2 E2
9 3 2 SSE,HS.2 E2
9 3 3 SSE,HS.2 E2
9 3 4 SSE,HS.2 E2
9 3 5 SSE,HS.2 E2
9 3 6 SSE,HS.2 E2
9 10
Donated Book Drive
1 CED.HS.1 E2
9 10 2 CED.HS.1 E2
9 10 3 CED.HS.1 E2
9 10 4 CED.HS.1 E2
A2: ELA
GBEs
Grade CCSS CCSS Text E GBE
8 RL.8.1
Cite the textual evidence that most strongly supports an analysis of what the text says explicitly as well as inferences drawn from the text.
E3 Answer literal questions about text.
8 RL.8.2
Determine a theme or central idea of a text and analyze its development over the course of the text, including its relationship to the characters, setting, and plot; provide an objective summary of the text.
E3 Sequence main events.
8 RL.8.3
Analyze how particular lines of dialogue or incidents in a story or drama propel the action, reveal aspects of a character, or provoke a decision.
E3 With prompting and support, identify the problem and solution in a story.
8 RL.8.4
Determine the meaning of words and phrases as they are used in a text, including figurative and connotative meanings; analyze the impact of specific word choices on meaning and tone, including analogies or allusions to other texts.
E3 Match word or phrase from a text with a picture or object indicating its meaning.
8 RL.8.5
Compare and contrast the structure of two or more texts and analyze how the differing structure of each text contributes to its meaning and style.
E3 Locate a paragraph, stanza, or character part.
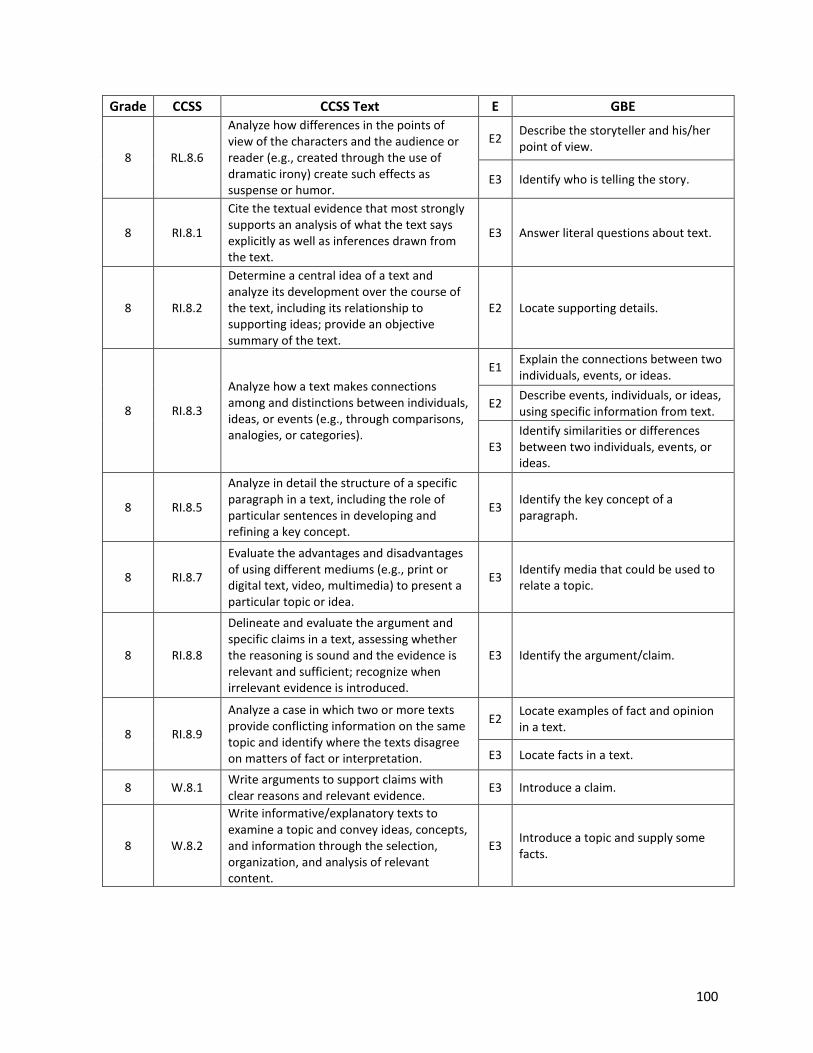
100
Grade CCSS CCSS Text E GBE
8 RL.8.6
Analyze how differences in the points of view of the characters and the audience or reader (e.g., created through the use of dramatic irony) create such effects as suspense or humor.
E2 Describe the storyteller and his/her point of view.
E3 Identify who is telling the story.
8 RI.8.1
Cite the textual evidence that most strongly supports an analysis of what the text says explicitly as well as inferences drawn from the text.
E3 Answer literal questions about text.
8 RI.8.2
Determine a central idea of a text and analyze its development over the course of the text, including its relationship to supporting ideas; provide an objective summary of the text.
E2 Locate supporting details.
8 RI.8.3
Analyze how a text makes connections among and distinctions between individuals, ideas, or events (e.g., through comparisons, analogies, or categories).
E1 Explain the connections between two individuals, events, or ideas.
E2 Describe events, individuals, or ideas, using specific information from text.
E3 Identify similarities or differences between two individuals, events, or ideas.
8 RI.8.5
Analyze in detail the structure of a specific paragraph in a text, including the role of particular sentences in developing and refining a key concept.
E3 Identify the key concept of a paragraph.
8 RI.8.7
Evaluate the advantages and disadvantages of using different mediums (e.g., print or digital text, video, multimedia) to present a particular topic or idea.
E3 Identify media that could be used to relate a topic.
8 RI.8.8
Delineate and evaluate the argument and specific claims in a text, assessing whether the reasoning is sound and the evidence is relevant and sufficient; recognize when irrelevant evidence is introduced.
E3 Identify the argument/claim.
8 RI.8.9
Analyze a case in which two or more texts provide conflicting information on the same topic and identify where the texts disagree on matters of fact or interpretation.
E2 Locate examples of fact and opinion in a text.
E3 Locate facts in a text.
8 W.8.1 Write arguments to support claims with clear reasons and relevant evidence.
E3 Introduce a claim.
8 W.8.2
Write informative/explanatory texts to examine a topic and convey ideas, concepts, and information through the selection, organization, and analysis of relevant content.
E3 Introduce a topic and supply some facts.
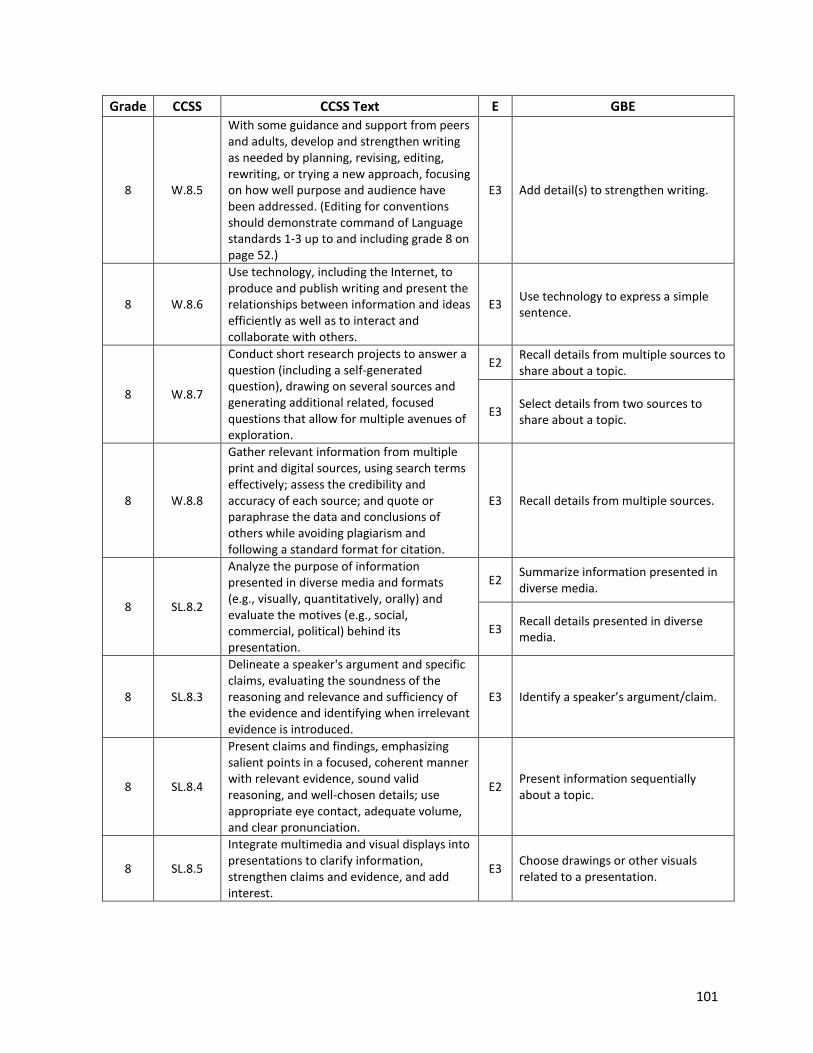
101
Grade CCSS CCSS Text E GBE
8 W.8.5
With some guidance and support from peers and adults, develop and strengthen writing as needed by planning, revising, editing, rewriting, or trying a new approach, focusing on how well purpose and audience have been addressed. (Editing for conventions should demonstrate command of Language standards 1-3 up to and including grade 8 on page 52.)
E3 Add detail(s) to strengthen writing.
8 W.8.6
Use technology, including the Internet, to produce and publish writing and present the relationships between information and ideas efficiently as well as to interact and collaborate with others.
E3 Use technology to express a simple sentence.
8 W.8.7
Conduct short research projects to answer a question (including a self-generated question), drawing on several sources and generating additional related, focused questions that allow for multiple avenues of exploration.
E2 Recall details from multiple sources to share about a topic.
E3 Select details from two sources to share about a topic.
8 W.8.8
Gather relevant information from multiple print and digital sources, using search terms effectively; assess the credibility and accuracy of each source; and quote or paraphrase the data and conclusions of others while avoiding plagiarism and following a standard format for citation.
E3 Recall details from multiple sources.
8 SL.8.2
Analyze the purpose of information presented in diverse media and formats (e.g., visually, quantitatively, orally) and evaluate the motives (e.g., social, commercial, political) behind its presentation.
E2 Summarize information presented in diverse media.
E3 Recall details presented in diverse media.
8 SL.8.3
Delineate a speaker's argument and specific claims, evaluating the soundness of the reasoning and relevance and sufficiency of the evidence and identifying when irrelevant evidence is introduced.
E3 Identify a speaker’s argument/claim.
8 SL.8.4
Present claims and findings, emphasizing salient points in a focused, coherent manner with relevant evidence, sound valid reasoning, and well-chosen details; use appropriate eye contact, adequate volume, and clear pronunciation.
E2 Present information sequentially about a topic.
8 SL.8.5
Integrate multimedia and visual displays into presentations to clarify information, strengthen claims and evidence, and add interest.
E3 Choose drawings or other visuals related to a presentation.
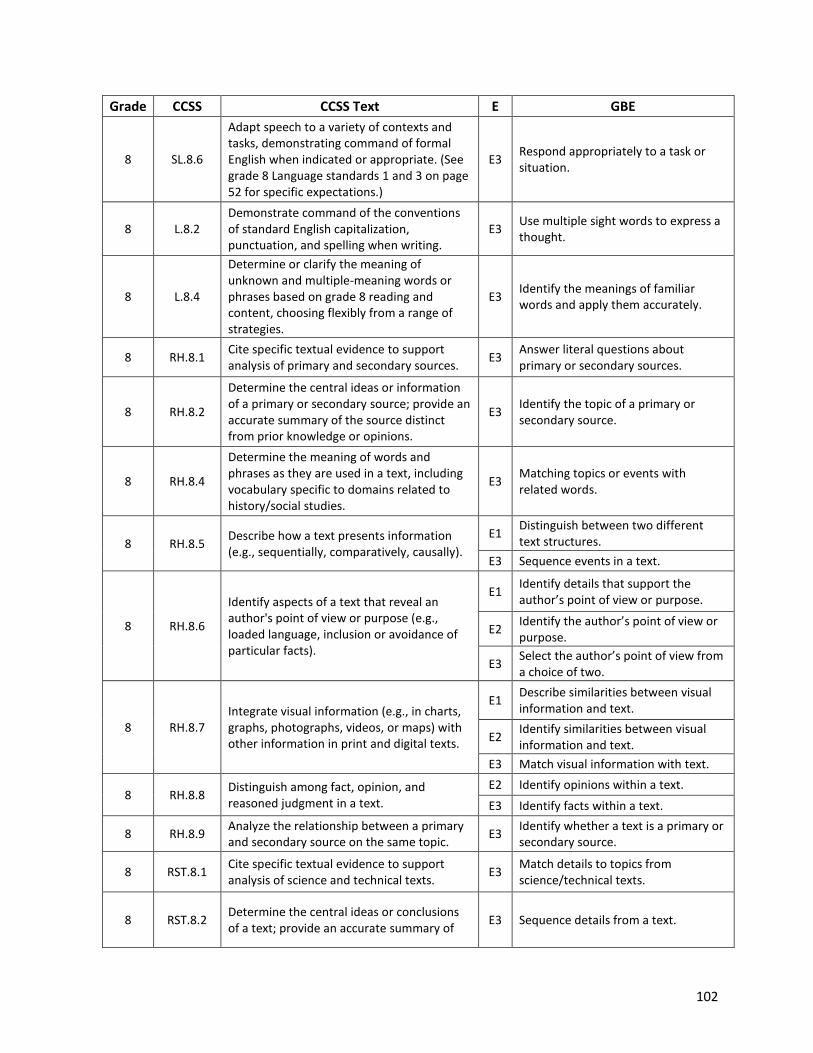
102
Grade CCSS CCSS Text E GBE
8 SL.8.6
Adapt speech to a variety of contexts and tasks, demonstrating command of formal English when indicated or appropriate. (See grade 8 Language standards 1 and 3 on page 52 for specific expectations.)
E3 Respond appropriately to a task or situation.
8 L.8.2 Demonstrate command of the conventions of standard English capitalization, punctuation, and spelling when writing.
E3 Use multiple sight words to express a thought.
8 L.8.4
Determine or clarify the meaning of unknown and multiple-meaning words or phrases based on grade 8 reading and content, choosing flexibly from a range of strategies.
E3 Identify the meanings of familiar words and apply them accurately.
8 RH.8.1 Cite specific textual evidence to support analysis of primary and secondary sources.
E3 Answer literal questions about primary or secondary sources.
8 RH.8.2
Determine the central ideas or information of a primary or secondary source; provide an accurate summary of the source distinct from prior knowledge or opinions.
E3 Identify the topic of a primary or secondary source.
8 RH.8.4
Determine the meaning of words and phrases as they are used in a text, including vocabulary specific to domains related to history/social studies.
E3 Matching topics or events with related words.
8 RH.8.5 Describe how a text presents information (e.g., sequentially, comparatively, causally).
E1 Distinguish between two different text structures.
E3 Sequence events in a text.
8 RH.8.6
Identify aspects of a text that reveal an author's point of view or purpose (e.g., loaded language, inclusion or avoidance of particular facts).
E1 Identify details that support the author’s point of view or purpose.
E2 Identify the author’s point of view or purpose.
E3 Select the author’s point of view from a choice of two.
8 RH.8.7 Integrate visual information (e.g., in charts, graphs, photographs, videos, or maps) with other information in print and digital texts.
E1 Describe similarities between visual information and text.
E2 Identify similarities between visual information and text.
E3 Match visual information with text.
8 RH.8.8 Distinguish among fact, opinion, and reasoned judgment in a text.
E2 Identify opinions within a text.
E3 Identify facts within a text.
8 RH.8.9 Analyze the relationship between a primary and secondary source on the same topic.
E3 Identify whether a text is a primary or secondary source.
8 RST.8.1 Cite specific textual evidence to support analysis of science and technical texts.
E3 Match details to topics from science/technical texts.
8 RST.8.2 Determine the central ideas or conclusions of a text; provide an accurate summary of
E3 Sequence details from a text.
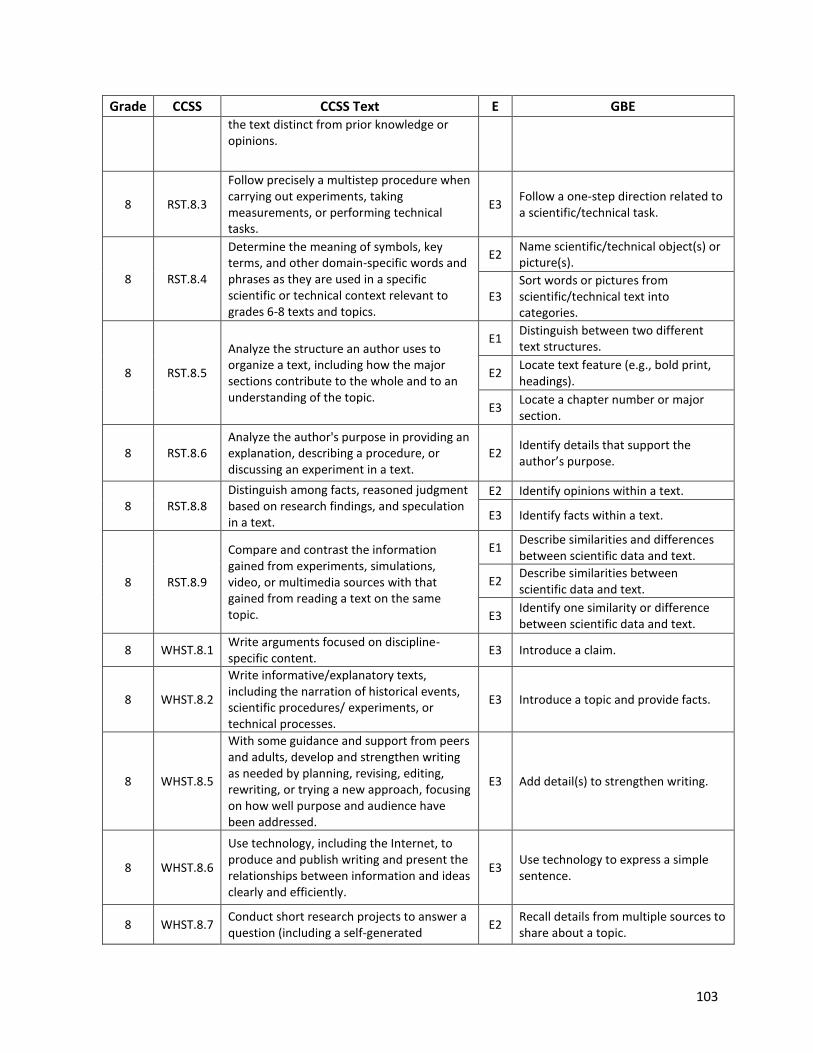
103
Grade CCSS CCSS Text E GBE the text distinct from prior knowledge or opinions.
8 RST.8.3
Follow precisely a multistep procedure when carrying out experiments, taking measurements, or performing technical tasks.
E3 Follow a one-step direction related to a scientific/technical task.
8 RST.8.4
Determine the meaning of symbols, key terms, and other domain-specific words and phrases as they are used in a specific scientific or technical context relevant to grades 6-8 texts and topics.
E2 Name scientific/technical object(s) or picture(s).
E3 Sort words or pictures from scientific/technical text into categories.
8 RST.8.5
Analyze the structure an author uses to organize a text, including how the major sections contribute to the whole and to an understanding of the topic.
E1 Distinguish between two different text structures.
E2 Locate text feature (e.g., bold print, headings).
E3 Locate a chapter number or major section.
8 RST.8.6 Analyze the author's purpose in providing an explanation, describing a procedure, or discussing an experiment in a text.
E2 Identify details that support the author’s purpose.
8 RST.8.8 Distinguish among facts, reasoned judgment based on research findings, and speculation in a text.
E2 Identify opinions within a text.
E3 Identify facts within a text.
8 RST.8.9
Compare and contrast the information gained from experiments, simulations, video, or multimedia sources with that gained from reading a text on the same topic.
E1 Describe similarities and differences between scientific data and text.
E2 Describe similarities between scientific data and text.
E3 Identify one similarity or difference between scientific data and text.
8 WHST.8.1 Write arguments focused on discipline-specific content.
E3 Introduce a claim.
8 WHST.8.2
Write informative/explanatory texts, including the narration of historical events, scientific procedures/ experiments, or technical processes.
E3 Introduce a topic and provide facts.
8 WHST.8.5
With some guidance and support from peers and adults, develop and strengthen writing as needed by planning, revising, editing, rewriting, or trying a new approach, focusing on how well purpose and audience have been addressed.
E3 Add detail(s) to strengthen writing.
8 WHST.8.6
Use technology, including the Internet, to produce and publish writing and present the relationships between information and ideas clearly and efficiently.
E3 Use technology to express a simple sentence.
8 WHST.8.7 Conduct short research projects to answer a question (including a self-generated
E2 Recall details from multiple sources to share about a topic.
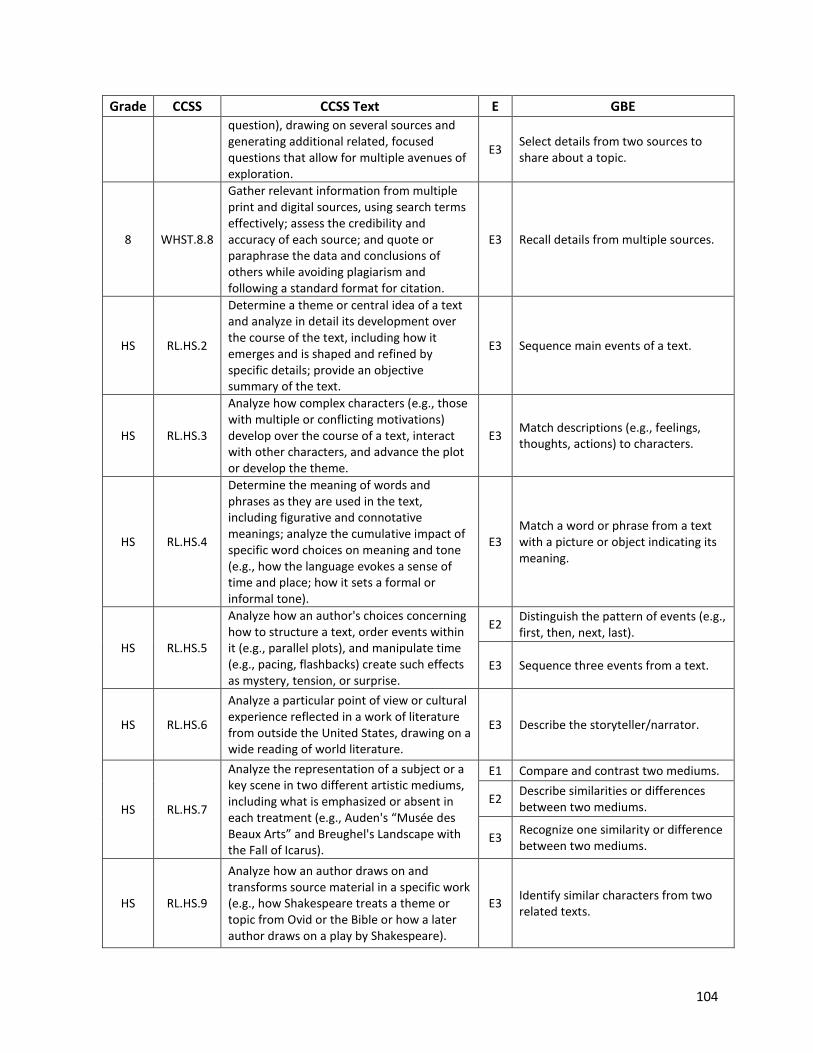
104
Grade CCSS CCSS Text E GBE
question), drawing on several sources and generating additional related, focused questions that allow for multiple avenues of exploration.
E3 Select details from two sources to share about a topic.
8 WHST.8.8
Gather relevant information from multiple print and digital sources, using search terms effectively; assess the credibility and accuracy of each source; and quote or paraphrase the data and conclusions of others while avoiding plagiarism and following a standard format for citation.
E3 Recall details from multiple sources.
HS RL.HS.2
Determine a theme or central idea of a text and analyze in detail its development over the course of the text, including how it emerges and is shaped and refined by specific details; provide an objective summary of the text.
E3 Sequence main events of a text.
HS RL.HS.3
Analyze how complex characters (e.g., those with multiple or conflicting motivations) develop over the course of a text, interact with other characters, and advance the plot or develop the theme.
E3 Match descriptions (e.g., feelings, thoughts, actions) to characters.
HS RL.HS.4
Determine the meaning of words and phrases as they are used in the text, including figurative and connotative meanings; analyze the cumulative impact of specific word choices on meaning and tone (e.g., how the language evokes a sense of time and place; how it sets a formal or informal tone).
E3 Match a word or phrase from a text with a picture or object indicating its meaning.
HS RL.HS.5
Analyze how an author's choices concerning how to structure a text, order events within it (e.g., parallel plots), and manipulate time (e.g., pacing, flashbacks) create such effects as mystery, tension, or surprise.
E2 Distinguish the pattern of events (e.g., first, then, next, last).
E3 Sequence three events from a text.
HS RL.HS.6
Analyze a particular point of view or cultural experience reflected in a work of literature from outside the United States, drawing on a wide reading of world literature.
E3 Describe the storyteller/narrator.
HS RL.HS.7
Analyze the representation of a subject or a key scene in two different artistic mediums, including what is emphasized or absent in each treatment (e.g., Auden's “Musée des Beaux Arts” and Breughel's Landscape with the Fall of Icarus).
E1 Compare and contrast two mediums.
E2 Describe similarities or differences between two mediums.
E3 Recognize one similarity or difference between two mediums.
HS RL.HS.9
Analyze how an author draws on and transforms source material in a specific work (e.g., how Shakespeare treats a theme or topic from Ovid or the Bible or how a later author draws on a play by Shakespeare).
E3 Identify similar characters from two related texts.
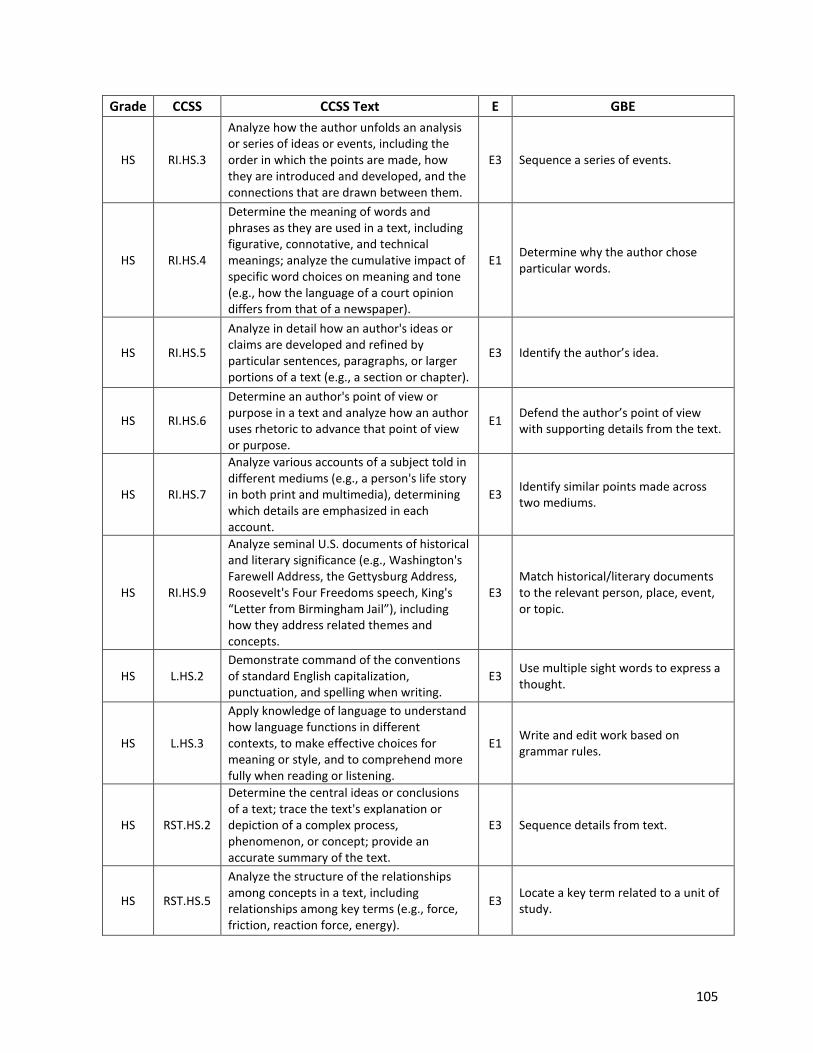
105
Grade CCSS CCSS Text E GBE
HS RI.HS.3
Analyze how the author unfolds an analysis or series of ideas or events, including the order in which the points are made, how they are introduced and developed, and the connections that are drawn between them.
E3 Sequence a series of events.
HS RI.HS.4
Determine the meaning of words and phrases as they are used in a text, including figurative, connotative, and technical meanings; analyze the cumulative impact of specific word choices on meaning and tone (e.g., how the language of a court opinion differs from that of a newspaper).
E1 Determine why the author chose particular words.
HS RI.HS.5
Analyze in detail how an author's ideas or claims are developed and refined by particular sentences, paragraphs, or larger portions of a text (e.g., a section or chapter).
E3 Identify the author’s idea.
HS RI.HS.6
Determine an author's point of view or purpose in a text and analyze how an author uses rhetoric to advance that point of view or purpose.
E1 Defend the author’s point of view with supporting details from the text.
HS RI.HS.7
Analyze various accounts of a subject told in different mediums (e.g., a person's life story in both print and multimedia), determining which details are emphasized in each account.
E3 Identify similar points made across two mediums.
HS RI.HS.9
Analyze seminal U.S. documents of historical and literary significance (e.g., Washington's Farewell Address, the Gettysburg Address, Roosevelt's Four Freedoms speech, King's “Letter from Birmingham Jail”), including how they address related themes and concepts.
E3 Match historical/literary documents to the relevant person, place, event, or topic.
HS L.HS.2 Demonstrate command of the conventions of standard English capitalization, punctuation, and spelling when writing.
E3 Use multiple sight words to express a thought.
HS L.HS.3
Apply knowledge of language to understand how language functions in different contexts, to make effective choices for meaning or style, and to comprehend more fully when reading or listening.
E1 Write and edit work based on grammar rules.
HS RST.HS.2
Determine the central ideas or conclusions of a text; trace the text's explanation or depiction of a complex process, phenomenon, or concept; provide an accurate summary of the text.
E3 Sequence details from text.
HS RST.HS.5
Analyze the structure of the relationships among concepts in a text, including relationships among key terms (e.g., force, friction, reaction force, energy).
E3 Locate a key term related to a unit of study.
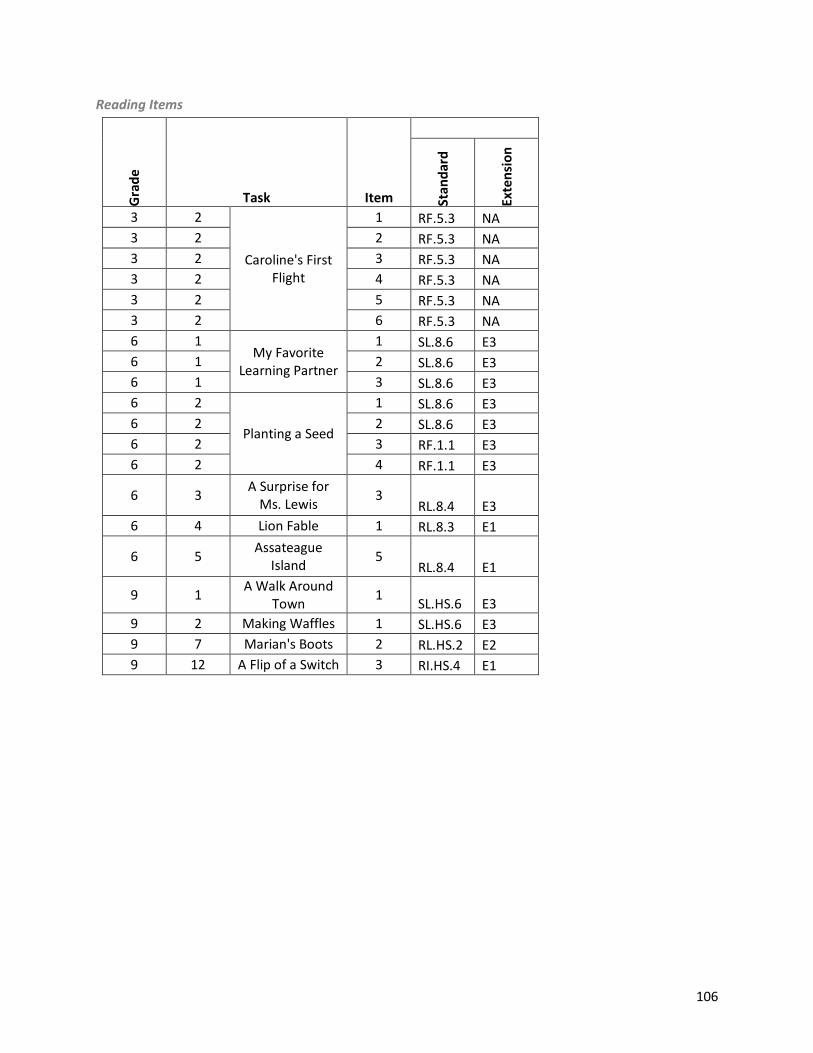
106
Reading Items
Gra
de
Task Item
Stan
dar
d
Exte
nsi
on
3 2
Caroline's First Flight
1 RF.5.3 NA
3 2 2 RF.5.3 NA
3 2 3 RF.5.3 NA
3 2 4 RF.5.3 NA
3 2 5 RF.5.3 NA
3 2 6 RF.5.3 NA
6 1 My Favorite
Learning Partner
1 SL.8.6 E3
6 1 2 SL.8.6 E3
6 1 3 SL.8.6 E3
6 2
Planting a Seed
1 SL.8.6 E3
6 2 2 SL.8.6 E3
6 2 3 RF.1.1 E3
6 2 4 RF.1.1 E3
6 3 A Surprise for
Ms. Lewis 3
RL.8.4 E3
6 4 Lion Fable 1 RL.8.3 E1
6 5 Assateague
Island 5
RL.8.4 E1
9 1 A Walk Around
Town 1
SL.HS.6 E3
9 2 Making Waffles 1 SL.HS.6 E3
9 7 Marian's Boots 2 RL.HS.2 E2
9 12 A Flip of a Switch 3 RI.HS.4 E1
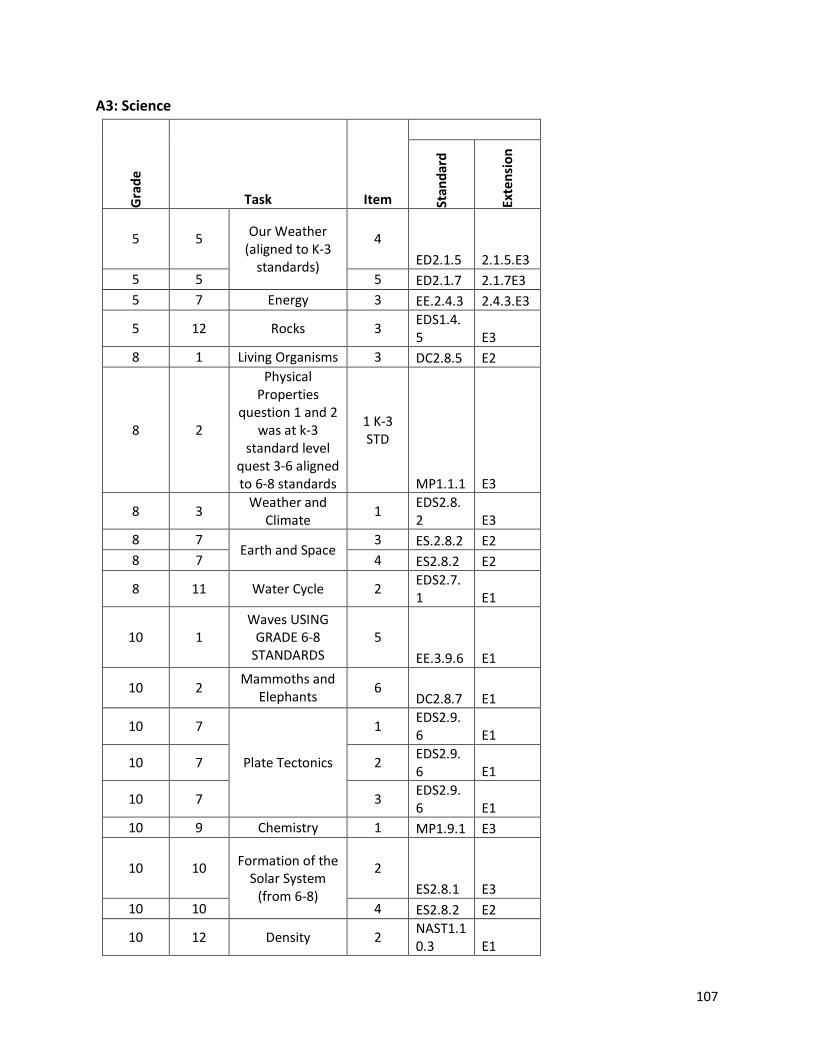
107
A3: Science
Gra
de
Task Item
Stan
dar
d
Exte
nsi
on
5 5 Our Weather
(aligned to K-3 standards)
4
ED2.1.5 2.1.5.E3
5 5 5 ED2.1.7 2.1.7E3
5 7 Energy 3 EE.2.4.3 2.4.3.E3
5 12 Rocks 3 EDS1.4.5 E3
8 1 Living Organisms 3 DC2.8.5 E2
8 2
Physical Properties
question 1 and 2 was at k-3
standard level quest 3-6 aligned to 6-8 standards
1 K-3 STD
MP1.1.1 E3
8 3 Weather and
Climate 1
EDS2.8.2 E3
8 7 Earth and Space
3 ES.2.8.2 E2
8 7 4 ES2.8.2 E2
8 11 Water Cycle 2 EDS2.7.1 E1
10 1 Waves USING
GRADE 6-8 STANDARDS
5
EE.3.9.6 E1
10 2 Mammoths and
Elephants 6
DC2.8.7 E1
10 7
Plate Tectonics
1 EDS2.9.6 E1
10 7 2 EDS2.9.6 E1
10 7 3 EDS2.9.6 E1
10 9 Chemistry 1 MP1.9.1 E3
10 10 Formation of the
Solar System (from 6-8)
2
ES2.8.1 E3
10 10 4 ES2.8.2 E2
10 12 Density 2 NAST1.10.3 E1
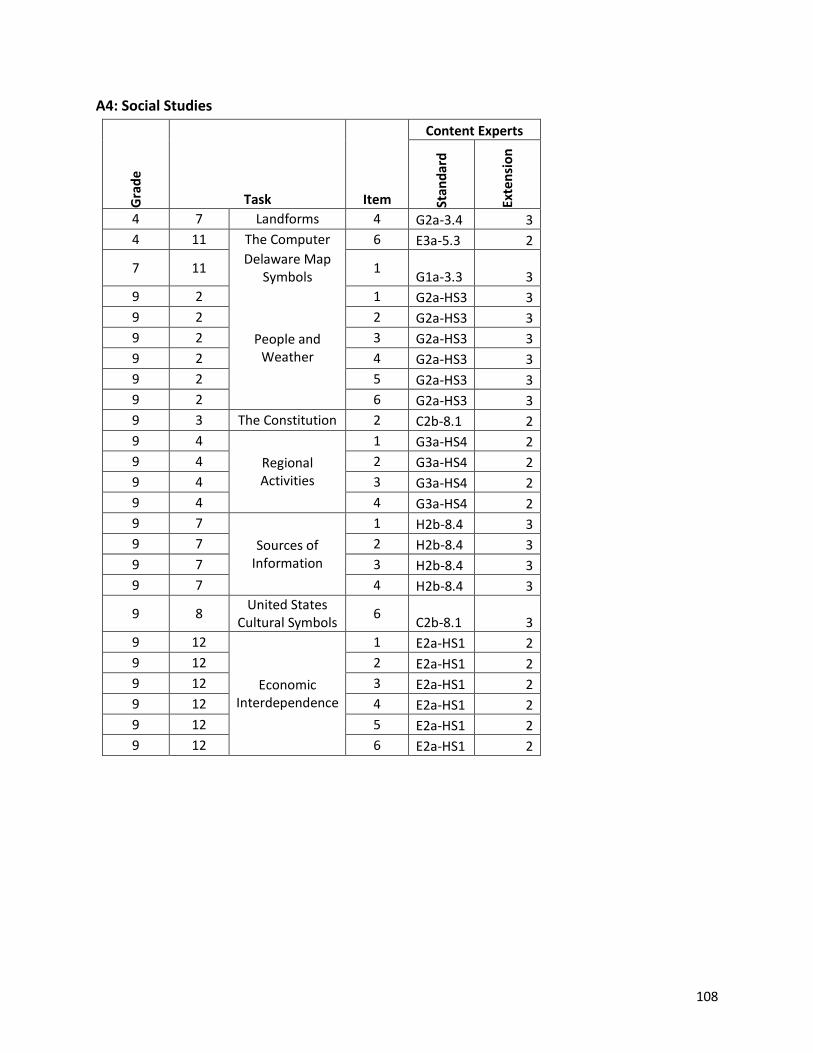
108
A4: Social Studies
Gra
de
Task Item
Content Experts
Stan
dar
d
Exte
nsi
on
4 7 Landforms 4 G2a-3.4 3
4 11 The Computer 6 E3a-5.3 2
7 11 Delaware Map
Symbols 1
G1a-3.3 3
9 2
People and Weather
1 G2a-HS3 3
9 2 2 G2a-HS3 3
9 2 3 G2a-HS3 3
9 2 4 G2a-HS3 3
9 2 5 G2a-HS3 3
9 2 6 G2a-HS3 3
9 3 The Constitution 2 C2b-8.1 2
9 4
Regional Activities
1 G3a-HS4 2
9 4 2 G3a-HS4 2
9 4 3 G3a-HS4 2
9 4 4 G3a-HS4 2
9 7
Sources of Information
1 H2b-8.4 3
9 7 2 H2b-8.4 3
9 7 3 H2b-8.4 3
9 7 4 H2b-8.4 3
9 8 United States
Cultural Symbols 6
C2b-8.1 3
9 12
Economic Interdependence
1 E2a-HS1 2
9 12 2 E2a-HS1 2
9 12 3 E2a-HS1 2
9 12 4 E2a-HS1 2
9 12 5 E2a-HS1 2
9 12 6 E2a-HS1 2
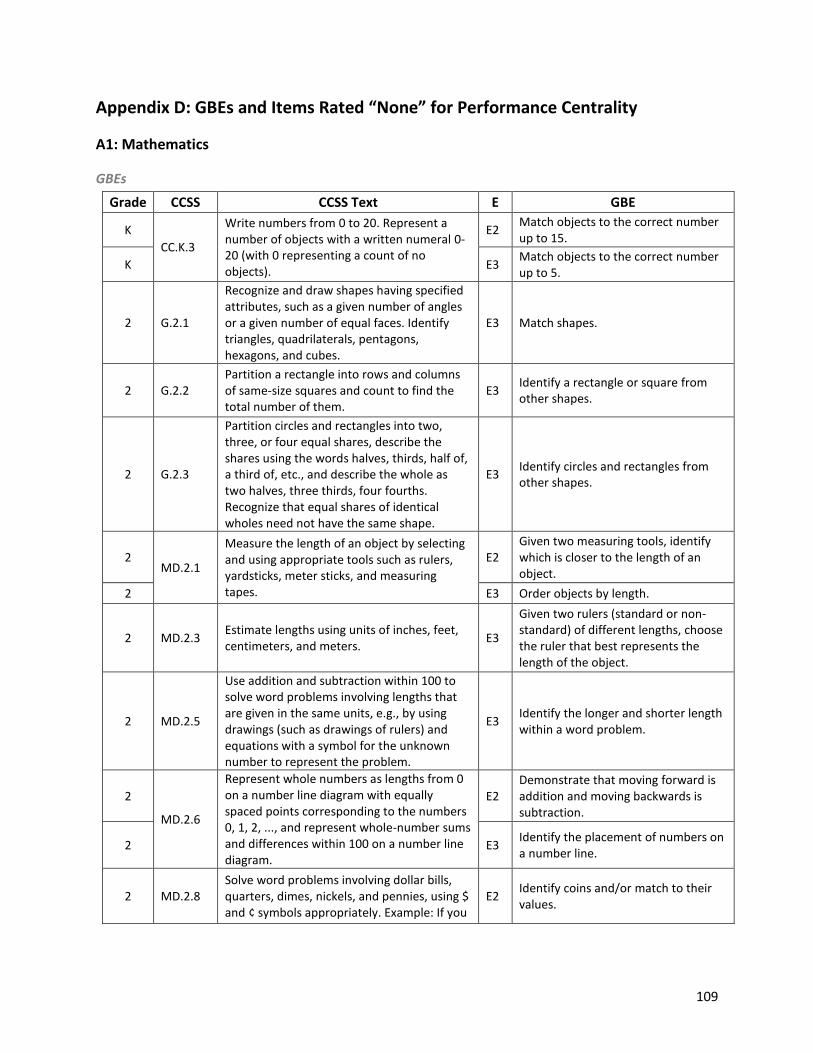
109
Appendix D: GBEs and Items Rated “None” for Performance Centrality
A1: Mathematics
GBEs
Grade CCSS CCSS Text E GBE
K
CC.K.3
Write numbers from 0 to 20. Represent a number of objects with a written numeral 0-20 (with 0 representing a count of no objects).
E2 Match objects to the correct number up to 15.
K E3 Match objects to the correct number up to 5.
2 G.2.1
Recognize and draw shapes having specified attributes, such as a given number of angles or a given number of equal faces. Identify triangles, quadrilaterals, pentagons, hexagons, and cubes.
E3 Match shapes.
2 G.2.2 Partition a rectangle into rows and columns of same-size squares and count to find the total number of them.
E3 Identify a rectangle or square from other shapes.
2 G.2.3
Partition circles and rectangles into two, three, or four equal shares, describe the shares using the words halves, thirds, half of, a third of, etc., and describe the whole as two halves, three thirds, four fourths. Recognize that equal shares of identical wholes need not have the same shape.
E3 Identify circles and rectangles from other shapes.
2 MD.2.1
Measure the length of an object by selecting and using appropriate tools such as rulers, yardsticks, meter sticks, and measuring tapes.
E2 Given two measuring tools, identify which is closer to the length of an object.
2 E3 Order objects by length.
2 MD.2.3 Estimate lengths using units of inches, feet, centimeters, and meters.
E3
Given two rulers (standard or non-standard) of different lengths, choose the ruler that best represents the length of the object.
2 MD.2.5
Use addition and subtraction within 100 to solve word problems involving lengths that are given in the same units, e.g., by using drawings (such as drawings of rulers) and equations with a symbol for the unknown number to represent the problem.
E3 Identify the longer and shorter length within a word problem.
2
MD.2.6
Represent whole numbers as lengths from 0 on a number line diagram with equally spaced points corresponding to the numbers 0, 1, 2, ..., and represent whole-number sums and differences within 100 on a number line diagram.
E2 Demonstrate that moving forward is addition and moving backwards is subtraction.
2 E3 Identify the placement of numbers on a number line.
2 MD.2.8 Solve word problems involving dollar bills, quarters, dimes, nickels, and pennies, using $ and ¢ symbols appropriately. Example: If you
E2 Identify coins and/or match to their values.
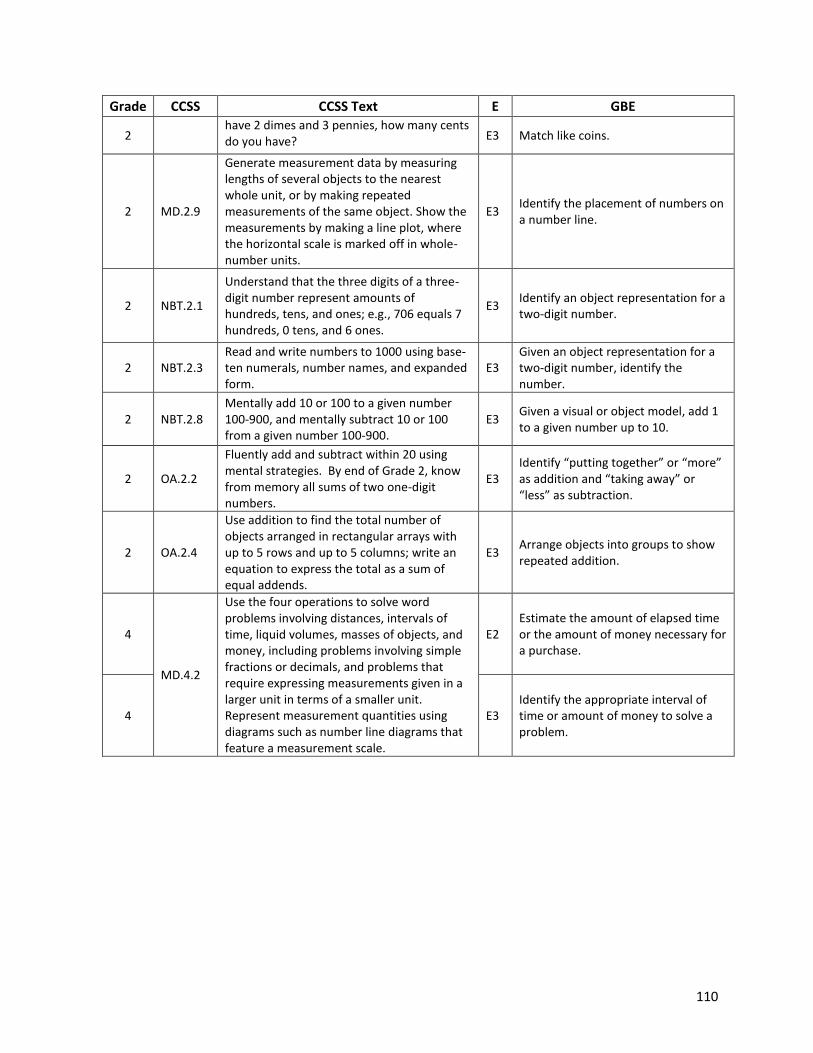
110
Grade CCSS CCSS Text E GBE
2 have 2 dimes and 3 pennies, how many cents do you have? E3 Match like coins.
2 MD.2.9
Generate measurement data by measuring lengths of several objects to the nearest whole unit, or by making repeated measurements of the same object. Show the measurements by making a line plot, where the horizontal scale is marked off in whole-number units.
E3 Identify the placement of numbers on a number line.
2 NBT.2.1
Understand that the three digits of a three-digit number represent amounts of hundreds, tens, and ones; e.g., 706 equals 7 hundreds, 0 tens, and 6 ones.
E3 Identify an object representation for a two-digit number.
2 NBT.2.3 Read and write numbers to 1000 using base-ten numerals, number names, and expanded form.
E3 Given an object representation for a two-digit number, identify the number.
2 NBT.2.8 Mentally add 10 or 100 to a given number 100-900, and mentally subtract 10 or 100 from a given number 100-900.
E3 Given a visual or object model, add 1 to a given number up to 10.
2 OA.2.2
Fluently add and subtract within 20 using mental strategies. By end of Grade 2, know from memory all sums of two one-digit numbers.
E3 Identify “putting together” or “more” as addition and “taking away” or “less” as subtraction.
2 OA.2.4
Use addition to find the total number of objects arranged in rectangular arrays with up to 5 rows and up to 5 columns; write an equation to express the total as a sum of equal addends.
E3 Arrange objects into groups to show repeated addition.
4
MD.4.2
Use the four operations to solve word problems involving distances, intervals of time, liquid volumes, masses of objects, and money, including problems involving simple fractions or decimals, and problems that require expressing measurements given in a larger unit in terms of a smaller unit. Represent measurement quantities using diagrams such as number line diagrams that feature a measurement scale.
E2 Estimate the amount of elapsed time or the amount of money necessary for a purchase.
4 E3 Identify the appropriate interval of time or amount of money to solve a problem.
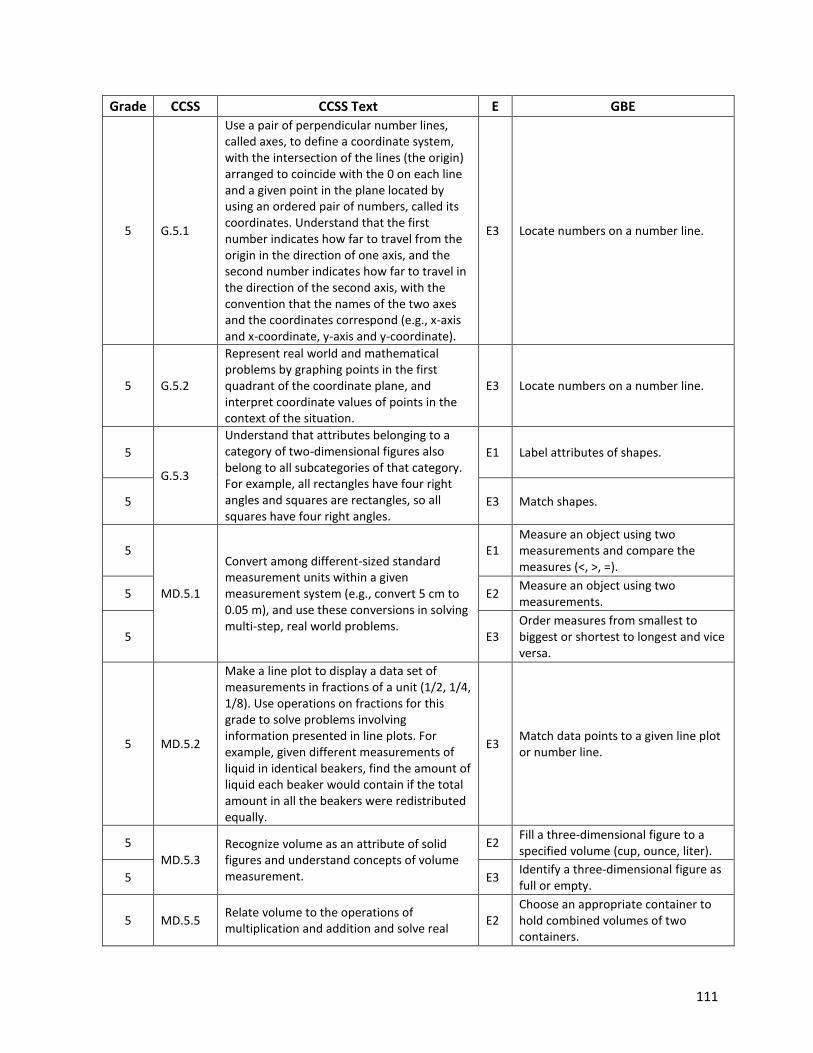
111
Grade CCSS CCSS Text E GBE
5 G.5.1
Use a pair of perpendicular number lines, called axes, to define a coordinate system, with the intersection of the lines (the origin) arranged to coincide with the 0 on each line and a given point in the plane located by using an ordered pair of numbers, called its coordinates. Understand that the first number indicates how far to travel from the origin in the direction of one axis, and the second number indicates how far to travel in the direction of the second axis, with the convention that the names of the two axes and the coordinates correspond (e.g., x-axis and x-coordinate, y-axis and y-coordinate).
E3 Locate numbers on a number line.
5 G.5.2
Represent real world and mathematical problems by graphing points in the first quadrant of the coordinate plane, and interpret coordinate values of points in the context of the situation.
E3 Locate numbers on a number line.
5
G.5.3
Understand that attributes belonging to a category of two-dimensional figures also belong to all subcategories of that category. For example, all rectangles have four right angles and squares are rectangles, so all squares have four right angles.
E1 Label attributes of shapes.
5 E3 Match shapes.
5
MD.5.1
Convert among different-sized standard measurement units within a given measurement system (e.g., convert 5 cm to 0.05 m), and use these conversions in solving multi-step, real world problems.
E1 Measure an object using two measurements and compare the measures (<, >, =).
5 E2 Measure an object using two measurements.
5 E3 Order measures from smallest to biggest or shortest to longest and vice versa.
5 MD.5.2
Make a line plot to display a data set of measurements in fractions of a unit (1/2, 1/4, 1/8). Use operations on fractions for this grade to solve problems involving information presented in line plots. For example, given different measurements of liquid in identical beakers, find the amount of liquid each beaker would contain if the total amount in all the beakers were redistributed equally.
E3 Match data points to a given line plot or number line.
5
MD.5.3 Recognize volume as an attribute of solid figures and understand concepts of volume measurement.
E2 Fill a three-dimensional figure to a specified volume (cup, ounce, liter).
5 E3 Identify a three-dimensional figure as full or empty.
5 MD.5.5 Relate volume to the operations of multiplication and addition and solve real
E2 Choose an appropriate container to hold combined volumes of two containers.
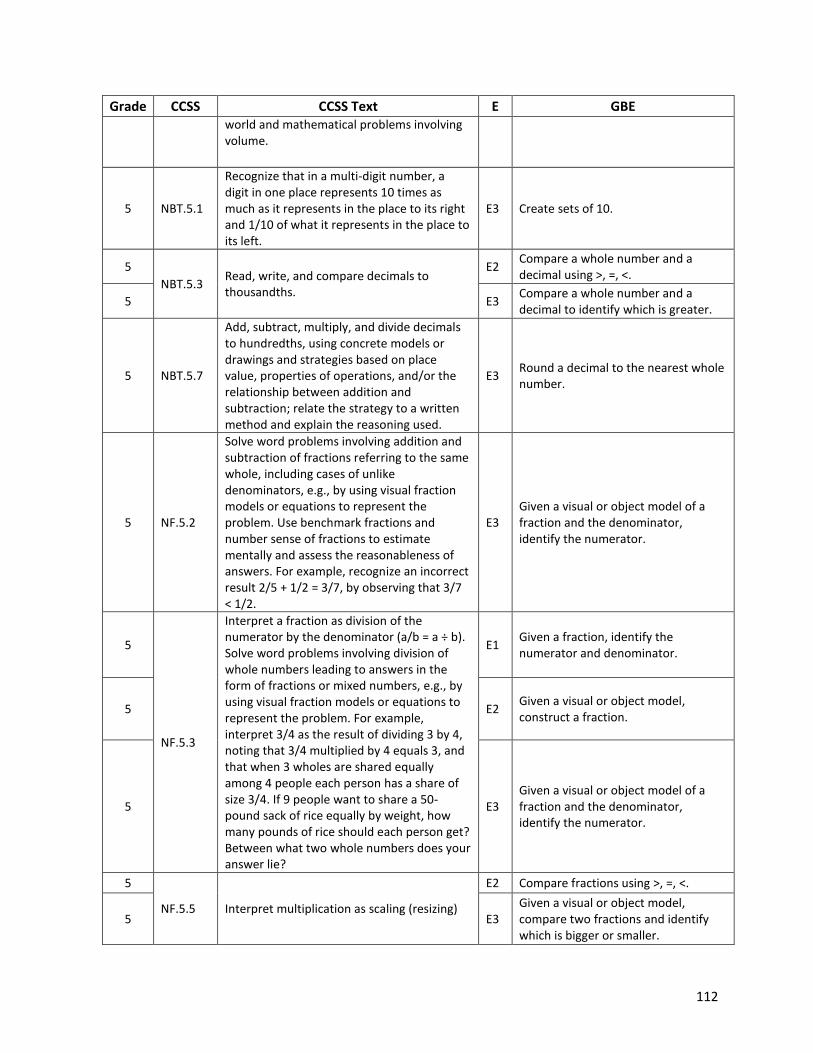
112
Grade CCSS CCSS Text E GBE world and mathematical problems involving volume.
5 NBT.5.1
Recognize that in a multi-digit number, a digit in one place represents 10 times as much as it represents in the place to its right and 1/10 of what it represents in the place to its left.
E3 Create sets of 10.
5
NBT.5.3 Read, write, and compare decimals to thousandths.
E2 Compare a whole number and a decimal using >, =, <.
5 E3 Compare a whole number and a decimal to identify which is greater.
5 NBT.5.7
Add, subtract, multiply, and divide decimals to hundredths, using concrete models or drawings and strategies based on place value, properties of operations, and/or the relationship between addition and subtraction; relate the strategy to a written method and explain the reasoning used.
E3 Round a decimal to the nearest whole number.
5 NF.5.2
Solve word problems involving addition and subtraction of fractions referring to the same whole, including cases of unlike denominators, e.g., by using visual fraction models or equations to represent the problem. Use benchmark fractions and number sense of fractions to estimate mentally and assess the reasonableness of answers. For example, recognize an incorrect result 2/5 + 1/2 = 3/7, by observing that 3/7 < 1/2.
E3 Given a visual or object model of a fraction and the denominator, identify the numerator.
5
NF.5.3
Interpret a fraction as division of the numerator by the denominator (a/b = a ÷ b). Solve word problems involving division of whole numbers leading to answers in the form of fractions or mixed numbers, e.g., by using visual fraction models or equations to represent the problem. For example, interpret 3/4 as the result of dividing 3 by 4, noting that 3/4 multiplied by 4 equals 3, and that when 3 wholes are shared equally among 4 people each person has a share of size 3/4. If 9 people want to share a 50-pound sack of rice equally by weight, how many pounds of rice should each person get? Between what two whole numbers does your answer lie?
E1 Given a fraction, identify the numerator and denominator.
5 E2 Given a visual or object model, construct a fraction.
5 E3 Given a visual or object model of a fraction and the denominator, identify the numerator.
5
NF.5.5 Interpret multiplication as scaling (resizing)
E2 Compare fractions using >, =, <.
5 E3 Given a visual or object model, compare two fractions and identify which is bigger or smaller.
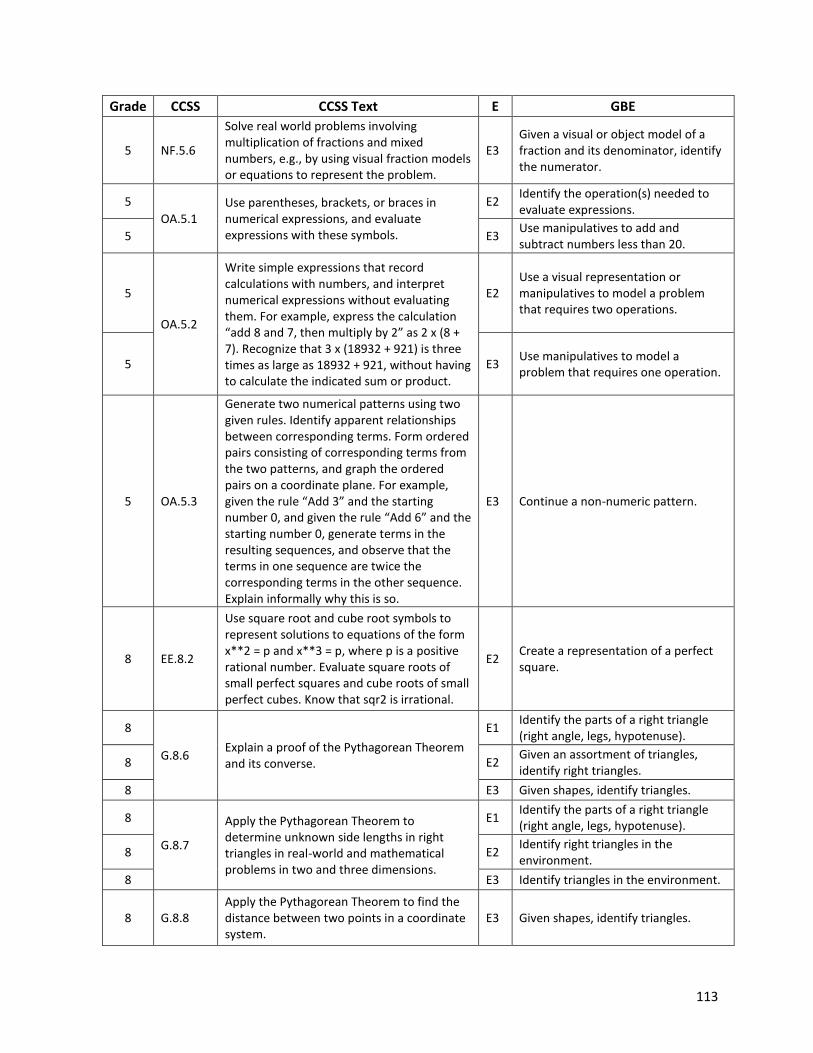
113
Grade CCSS CCSS Text E GBE
5 NF.5.6
Solve real world problems involving multiplication of fractions and mixed numbers, e.g., by using visual fraction models or equations to represent the problem.
E3 Given a visual or object model of a fraction and its denominator, identify the numerator.
5
OA.5.1 Use parentheses, brackets, or braces in numerical expressions, and evaluate expressions with these symbols.
E2 Identify the operation(s) needed to evaluate expressions.
5 E3 Use manipulatives to add and subtract numbers less than 20.
5
OA.5.2
Write simple expressions that record calculations with numbers, and interpret numerical expressions without evaluating them. For example, express the calculation “add 8 and 7, then multiply by 2” as 2 x (8 + 7). Recognize that 3 x (18932 + 921) is three times as large as 18932 + 921, without having to calculate the indicated sum or product.
E2 Use a visual representation or manipulatives to model a problem that requires two operations.
5 E3 Use manipulatives to model a problem that requires one operation.
5 OA.5.3
Generate two numerical patterns using two given rules. Identify apparent relationships between corresponding terms. Form ordered pairs consisting of corresponding terms from the two patterns, and graph the ordered pairs on a coordinate plane. For example, given the rule “Add 3” and the starting number 0, and given the rule “Add 6” and the starting number 0, generate terms in the resulting sequences, and observe that the terms in one sequence are twice the corresponding terms in the other sequence. Explain informally why this is so.
E3 Continue a non-numeric pattern.
8 EE.8.2
Use square root and cube root symbols to represent solutions to equations of the form x**2 = p and x**3 = p, where p is a positive rational number. Evaluate square roots of small perfect squares and cube roots of small perfect cubes. Know that sqr2 is irrational.
E2 Create a representation of a perfect square.
8
G.8.6 Explain a proof of the Pythagorean Theorem and its converse.
E1 Identify the parts of a right triangle (right angle, legs, hypotenuse).
8 E2 Given an assortment of triangles, identify right triangles.
8 E3 Given shapes, identify triangles.
8
G.8.7
Apply the Pythagorean Theorem to determine unknown side lengths in right triangles in real-world and mathematical problems in two and three dimensions.
E1 Identify the parts of a right triangle (right angle, legs, hypotenuse).
8 E2 Identify right triangles in the environment.
8 E3 Identify triangles in the environment.
8 G.8.8 Apply the Pythagorean Theorem to find the distance between two points in a coordinate system.
E3 Given shapes, identify triangles.
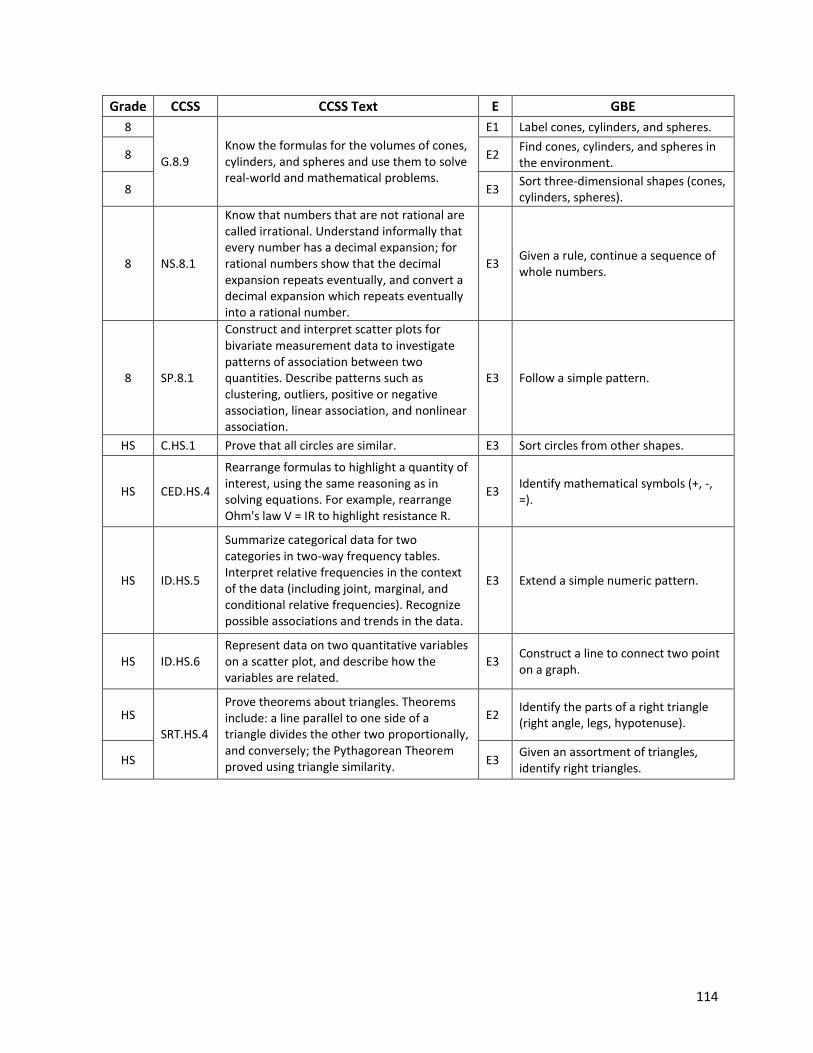
114
Grade CCSS CCSS Text E GBE
8
G.8.9 Know the formulas for the volumes of cones, cylinders, and spheres and use them to solve real-world and mathematical problems.
E1 Label cones, cylinders, and spheres.
8 E2 Find cones, cylinders, and spheres in the environment.
8 E3 Sort three-dimensional shapes (cones, cylinders, spheres).
8 NS.8.1
Know that numbers that are not rational are called irrational. Understand informally that every number has a decimal expansion; for rational numbers show that the decimal expansion repeats eventually, and convert a decimal expansion which repeats eventually into a rational number.
E3 Given a rule, continue a sequence of whole numbers.
8 SP.8.1
Construct and interpret scatter plots for bivariate measurement data to investigate patterns of association between two quantities. Describe patterns such as clustering, outliers, positive or negative association, linear association, and nonlinear association.
E3 Follow a simple pattern.
HS C.HS.1 Prove that all circles are similar. E3 Sort circles from other shapes.
HS CED.HS.4
Rearrange formulas to highlight a quantity of interest, using the same reasoning as in solving equations. For example, rearrange Ohm's law V = IR to highlight resistance R.
E3 Identify mathematical symbols (+, -, =).
HS ID.HS.5
Summarize categorical data for two categories in two-way frequency tables. Interpret relative frequencies in the context of the data (including joint, marginal, and conditional relative frequencies). Recognize possible associations and trends in the data.
E3 Extend a simple numeric pattern.
HS ID.HS.6 Represent data on two quantitative variables on a scatter plot, and describe how the variables are related.
E3 Construct a line to connect two point on a graph.
HS
SRT.HS.4
Prove theorems about triangles. Theorems include: a line parallel to one side of a triangle divides the other two proportionally, and conversely; the Pythagorean Theorem proved using triangle similarity.
E2 Identify the parts of a right triangle (right angle, legs, hypotenuse).
HS E3 Given an assortment of triangles, identify right triangles.
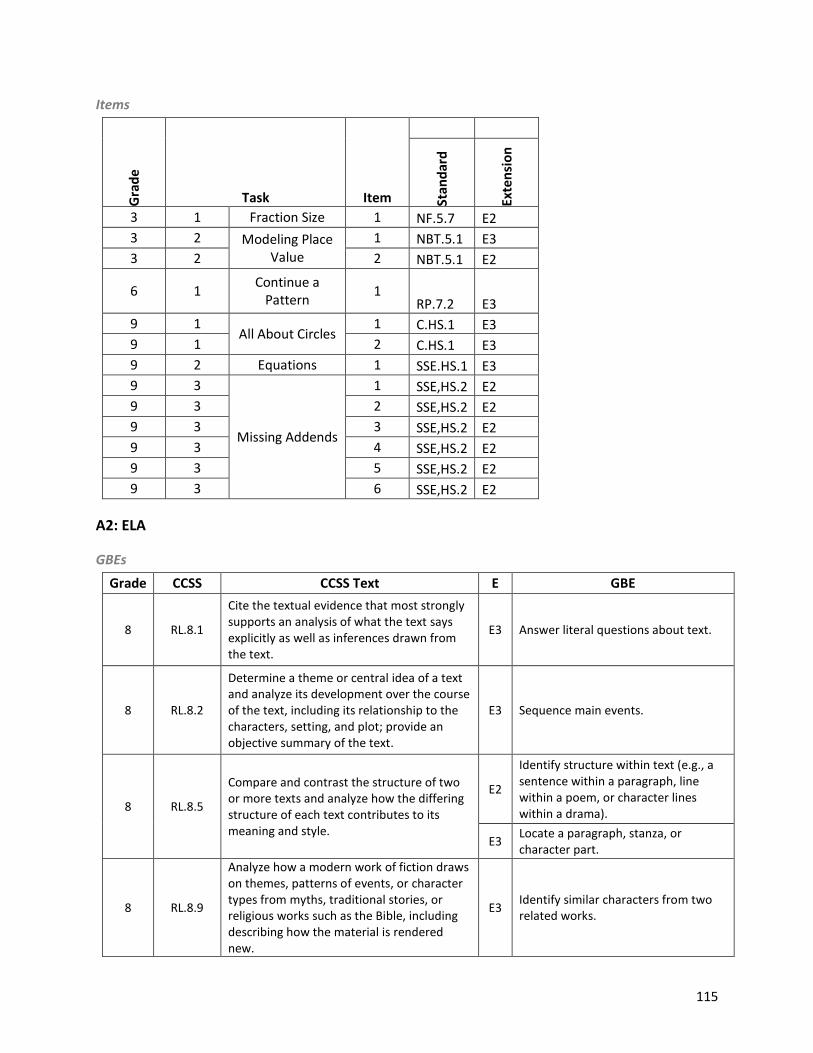
115
Items
Gra
de
Task Item
Stan
dar
d
Exte
nsi
on
3 1 Fraction Size 1 NF.5.7 E2
3 2 Modeling Place Value
1 NBT.5.1 E3
3 2 2 NBT.5.1 E2
6 1 Continue a
Pattern 1
RP.7.2 E3
9 1 All About Circles
1 C.HS.1 E3
9 1 2 C.HS.1 E3
9 2 Equations 1 SSE.HS.1 E3
9 3
Missing Addends
1 SSE,HS.2 E2
9 3 2 SSE,HS.2 E2
9 3 3 SSE,HS.2 E2
9 3 4 SSE,HS.2 E2
9 3 5 SSE,HS.2 E2
9 3 6 SSE,HS.2 E2
A2: ELA
GBEs
Grade CCSS CCSS Text E GBE
8 RL.8.1
Cite the textual evidence that most strongly supports an analysis of what the text says explicitly as well as inferences drawn from the text.
E3 Answer literal questions about text.
8 RL.8.2
Determine a theme or central idea of a text and analyze its development over the course of the text, including its relationship to the characters, setting, and plot; provide an objective summary of the text.
E3 Sequence main events.
8 RL.8.5
Compare and contrast the structure of two or more texts and analyze how the differing structure of each text contributes to its meaning and style.
E2
Identify structure within text (e.g., a sentence within a paragraph, line within a poem, or character lines within a drama).
E3 Locate a paragraph, stanza, or character part.
8 RL.8.9
Analyze how a modern work of fiction draws on themes, patterns of events, or character types from myths, traditional stories, or religious works such as the Bible, including describing how the material is rendered new.
E3 Identify similar characters from two related works.
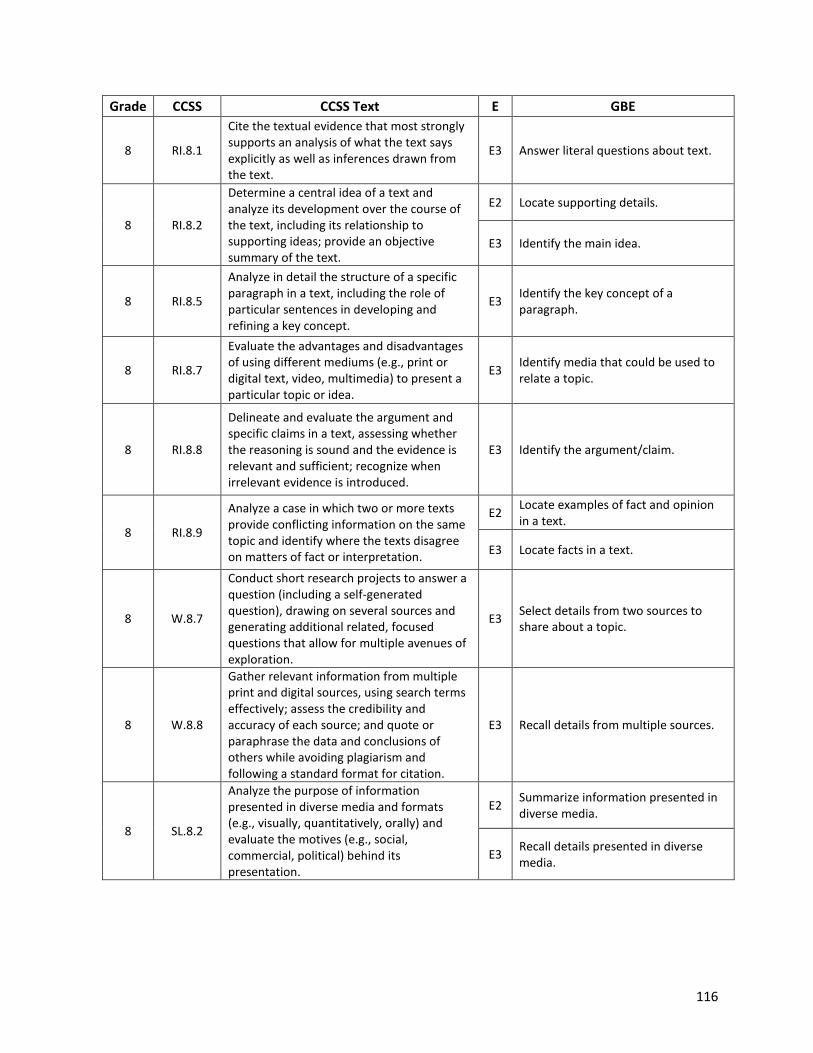
116
Grade CCSS CCSS Text E GBE
8 RI.8.1
Cite the textual evidence that most strongly supports an analysis of what the text says explicitly as well as inferences drawn from the text.
E3 Answer literal questions about text.
8 RI.8.2
Determine a central idea of a text and analyze its development over the course of the text, including its relationship to supporting ideas; provide an objective summary of the text.
E2 Locate supporting details.
E3 Identify the main idea.
8 RI.8.5
Analyze in detail the structure of a specific paragraph in a text, including the role of particular sentences in developing and refining a key concept.
E3 Identify the key concept of a paragraph.
8 RI.8.7
Evaluate the advantages and disadvantages of using different mediums (e.g., print or digital text, video, multimedia) to present a particular topic or idea.
E3 Identify media that could be used to relate a topic.
8 RI.8.8
Delineate and evaluate the argument and specific claims in a text, assessing whether the reasoning is sound and the evidence is relevant and sufficient; recognize when irrelevant evidence is introduced.
E3 Identify the argument/claim.
8 RI.8.9
Analyze a case in which two or more texts provide conflicting information on the same topic and identify where the texts disagree on matters of fact or interpretation.
E2 Locate examples of fact and opinion in a text.
E3 Locate facts in a text.
8 W.8.7
Conduct short research projects to answer a question (including a self-generated question), drawing on several sources and generating additional related, focused questions that allow for multiple avenues of exploration.
E3 Select details from two sources to share about a topic.
8 W.8.8
Gather relevant information from multiple print and digital sources, using search terms effectively; assess the credibility and accuracy of each source; and quote or paraphrase the data and conclusions of others while avoiding plagiarism and following a standard format for citation.
E3 Recall details from multiple sources.
8 SL.8.2
Analyze the purpose of information presented in diverse media and formats (e.g., visually, quantitatively, orally) and evaluate the motives (e.g., social, commercial, political) behind its presentation.
E2 Summarize information presented in diverse media.
E3 Recall details presented in diverse media.
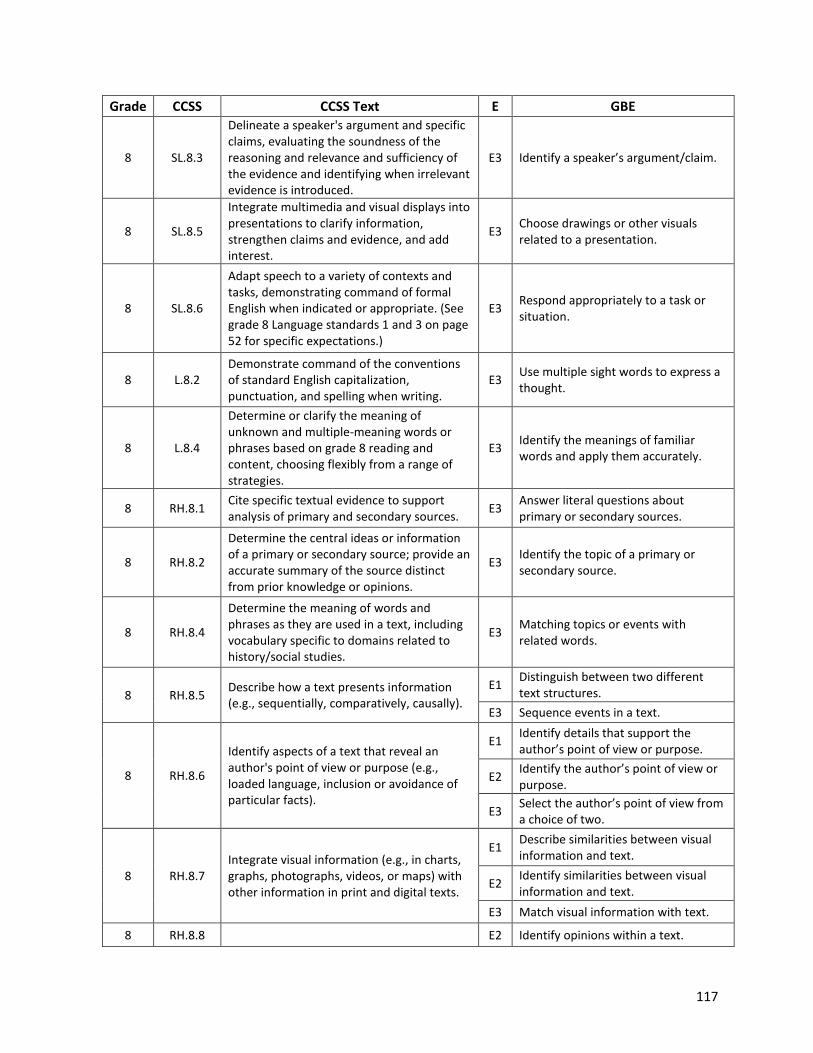
117
Grade CCSS CCSS Text E GBE
8 SL.8.3
Delineate a speaker's argument and specific claims, evaluating the soundness of the reasoning and relevance and sufficiency of the evidence and identifying when irrelevant evidence is introduced.
E3 Identify a speaker’s argument/claim.
8 SL.8.5
Integrate multimedia and visual displays into presentations to clarify information, strengthen claims and evidence, and add interest.
E3 Choose drawings or other visuals related to a presentation.
8 SL.8.6
Adapt speech to a variety of contexts and tasks, demonstrating command of formal English when indicated or appropriate. (See grade 8 Language standards 1 and 3 on page 52 for specific expectations.)
E3 Respond appropriately to a task or situation.
8 L.8.2 Demonstrate command of the conventions of standard English capitalization, punctuation, and spelling when writing.
E3 Use multiple sight words to express a thought.
8 L.8.4
Determine or clarify the meaning of unknown and multiple-meaning words or phrases based on grade 8 reading and content, choosing flexibly from a range of strategies.
E3 Identify the meanings of familiar words and apply them accurately.
8 RH.8.1 Cite specific textual evidence to support analysis of primary and secondary sources.
E3 Answer literal questions about primary or secondary sources.
8 RH.8.2
Determine the central ideas or information of a primary or secondary source; provide an accurate summary of the source distinct from prior knowledge or opinions.
E3 Identify the topic of a primary or secondary source.
8 RH.8.4
Determine the meaning of words and phrases as they are used in a text, including vocabulary specific to domains related to history/social studies.
E3 Matching topics or events with related words.
8 RH.8.5 Describe how a text presents information (e.g., sequentially, comparatively, causally).
E1 Distinguish between two different text structures.
E3 Sequence events in a text.
8 RH.8.6
Identify aspects of a text that reveal an author's point of view or purpose (e.g., loaded language, inclusion or avoidance of particular facts).
E1 Identify details that support the author’s point of view or purpose.
E2 Identify the author’s point of view or purpose.
E3 Select the author’s point of view from a choice of two.
8 RH.8.7 Integrate visual information (e.g., in charts, graphs, photographs, videos, or maps) with other information in print and digital texts.
E1 Describe similarities between visual information and text.
E2 Identify similarities between visual information and text.
E3 Match visual information with text.
8 RH.8.8 E2 Identify opinions within a text.
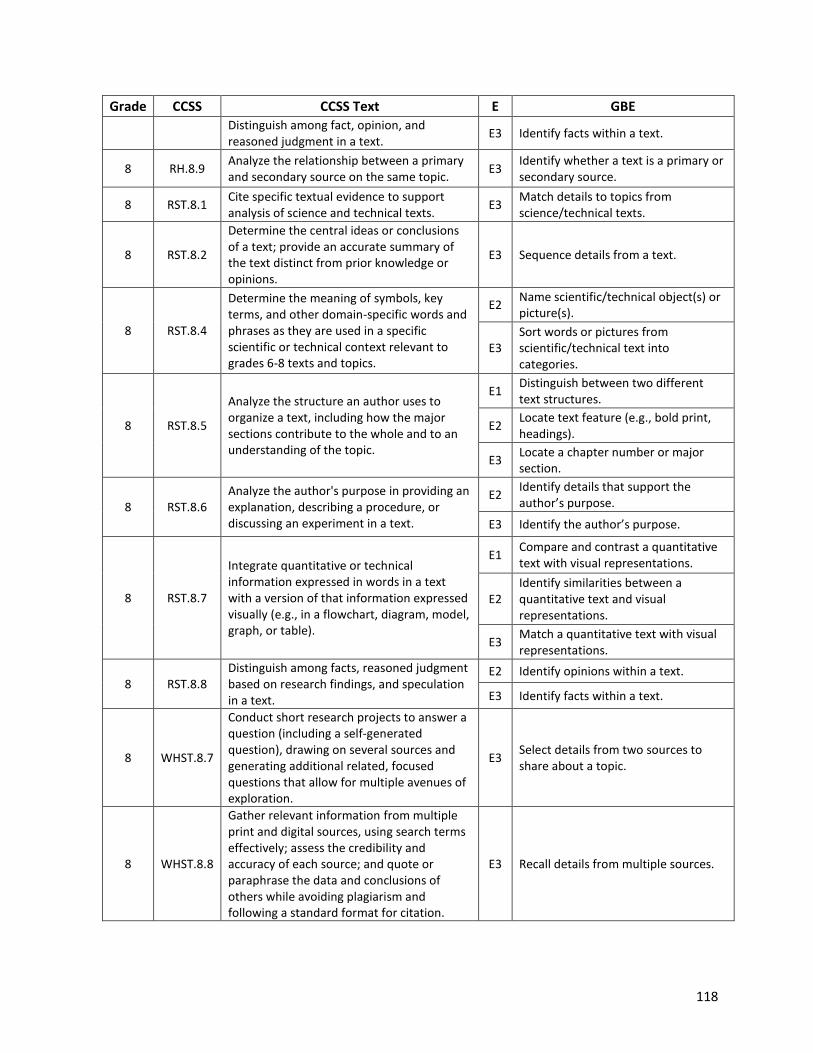
118
Grade CCSS CCSS Text E GBE
Distinguish among fact, opinion, and reasoned judgment in a text.
E3 Identify facts within a text.
8 RH.8.9 Analyze the relationship between a primary and secondary source on the same topic.
E3 Identify whether a text is a primary or secondary source.
8 RST.8.1 Cite specific textual evidence to support analysis of science and technical texts.
E3 Match details to topics from science/technical texts.
8 RST.8.2
Determine the central ideas or conclusions of a text; provide an accurate summary of the text distinct from prior knowledge or opinions.
E3 Sequence details from a text.
8 RST.8.4
Determine the meaning of symbols, key terms, and other domain-specific words and phrases as they are used in a specific scientific or technical context relevant to grades 6-8 texts and topics.
E2 Name scientific/technical object(s) or picture(s).
E3 Sort words or pictures from scientific/technical text into categories.
8 RST.8.5
Analyze the structure an author uses to organize a text, including how the major sections contribute to the whole and to an understanding of the topic.
E1 Distinguish between two different text structures.
E2 Locate text feature (e.g., bold print, headings).
E3 Locate a chapter number or major section.
8 RST.8.6 Analyze the author's purpose in providing an explanation, describing a procedure, or discussing an experiment in a text.
E2 Identify details that support the author’s purpose.
E3 Identify the author’s purpose.
8 RST.8.7
Integrate quantitative or technical information expressed in words in a text with a version of that information expressed visually (e.g., in a flowchart, diagram, model, graph, or table).
E1 Compare and contrast a quantitative text with visual representations.
E2 Identify similarities between a quantitative text and visual representations.
E3 Match a quantitative text with visual representations.
8 RST.8.8 Distinguish among facts, reasoned judgment based on research findings, and speculation in a text.
E2 Identify opinions within a text.
E3 Identify facts within a text.
8 WHST.8.7
Conduct short research projects to answer a question (including a self-generated question), drawing on several sources and generating additional related, focused questions that allow for multiple avenues of exploration.
E3 Select details from two sources to share about a topic.
8 WHST.8.8
Gather relevant information from multiple print and digital sources, using search terms effectively; assess the credibility and accuracy of each source; and quote or paraphrase the data and conclusions of others while avoiding plagiarism and following a standard format for citation.
E3 Recall details from multiple sources.
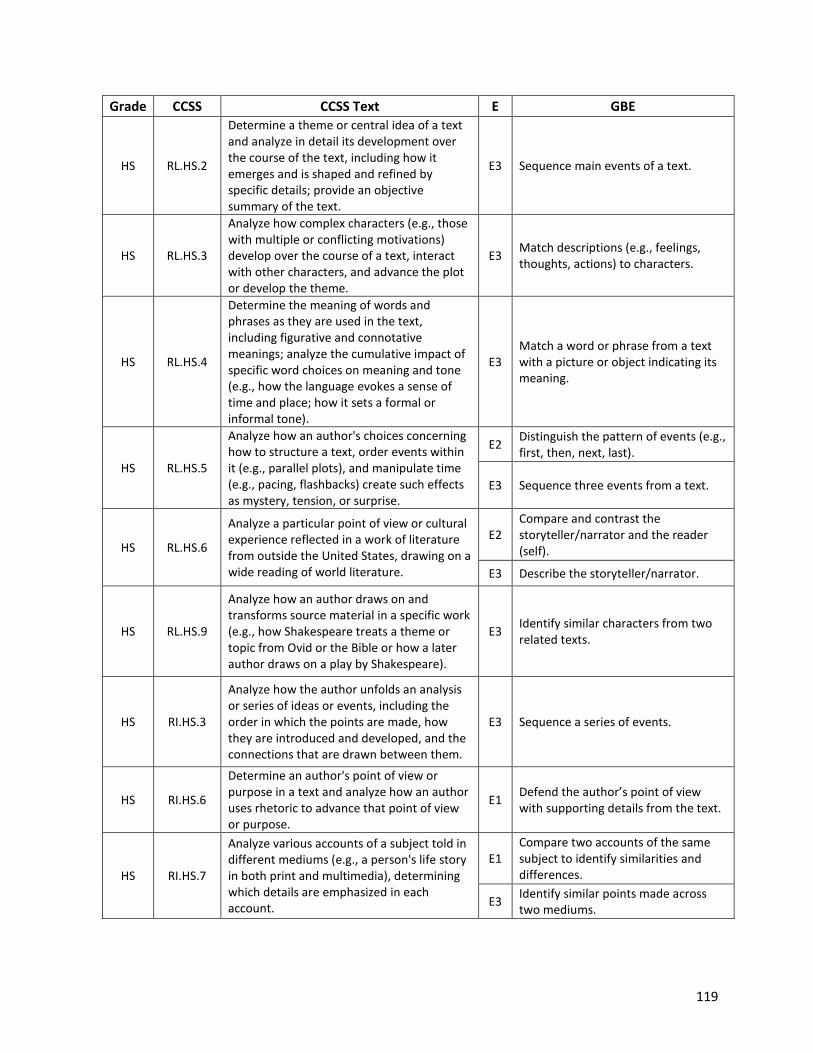
119
Grade CCSS CCSS Text E GBE
HS RL.HS.2
Determine a theme or central idea of a text and analyze in detail its development over the course of the text, including how it emerges and is shaped and refined by specific details; provide an objective summary of the text.
E3 Sequence main events of a text.
HS RL.HS.3
Analyze how complex characters (e.g., those with multiple or conflicting motivations) develop over the course of a text, interact with other characters, and advance the plot or develop the theme.
E3 Match descriptions (e.g., feelings, thoughts, actions) to characters.
HS RL.HS.4
Determine the meaning of words and phrases as they are used in the text, including figurative and connotative meanings; analyze the cumulative impact of specific word choices on meaning and tone (e.g., how the language evokes a sense of time and place; how it sets a formal or informal tone).
E3 Match a word or phrase from a text with a picture or object indicating its meaning.
HS RL.HS.5
Analyze how an author's choices concerning how to structure a text, order events within it (e.g., parallel plots), and manipulate time (e.g., pacing, flashbacks) create such effects as mystery, tension, or surprise.
E2 Distinguish the pattern of events (e.g., first, then, next, last).
E3 Sequence three events from a text.
HS RL.HS.6
Analyze a particular point of view or cultural experience reflected in a work of literature from outside the United States, drawing on a wide reading of world literature.
E2 Compare and contrast the storyteller/narrator and the reader (self).
E3 Describe the storyteller/narrator.
HS RL.HS.9
Analyze how an author draws on and transforms source material in a specific work (e.g., how Shakespeare treats a theme or topic from Ovid or the Bible or how a later author draws on a play by Shakespeare).
E3 Identify similar characters from two related texts.
HS RI.HS.3
Analyze how the author unfolds an analysis or series of ideas or events, including the order in which the points are made, how they are introduced and developed, and the connections that are drawn between them.
E3 Sequence a series of events.
HS RI.HS.6
Determine an author's point of view or purpose in a text and analyze how an author uses rhetoric to advance that point of view or purpose.
E1 Defend the author’s point of view with supporting details from the text.
HS RI.HS.7
Analyze various accounts of a subject told in different mediums (e.g., a person's life story in both print and multimedia), determining which details are emphasized in each account.
E1 Compare two accounts of the same subject to identify similarities and differences.
E3 Identify similar points made across two mediums.
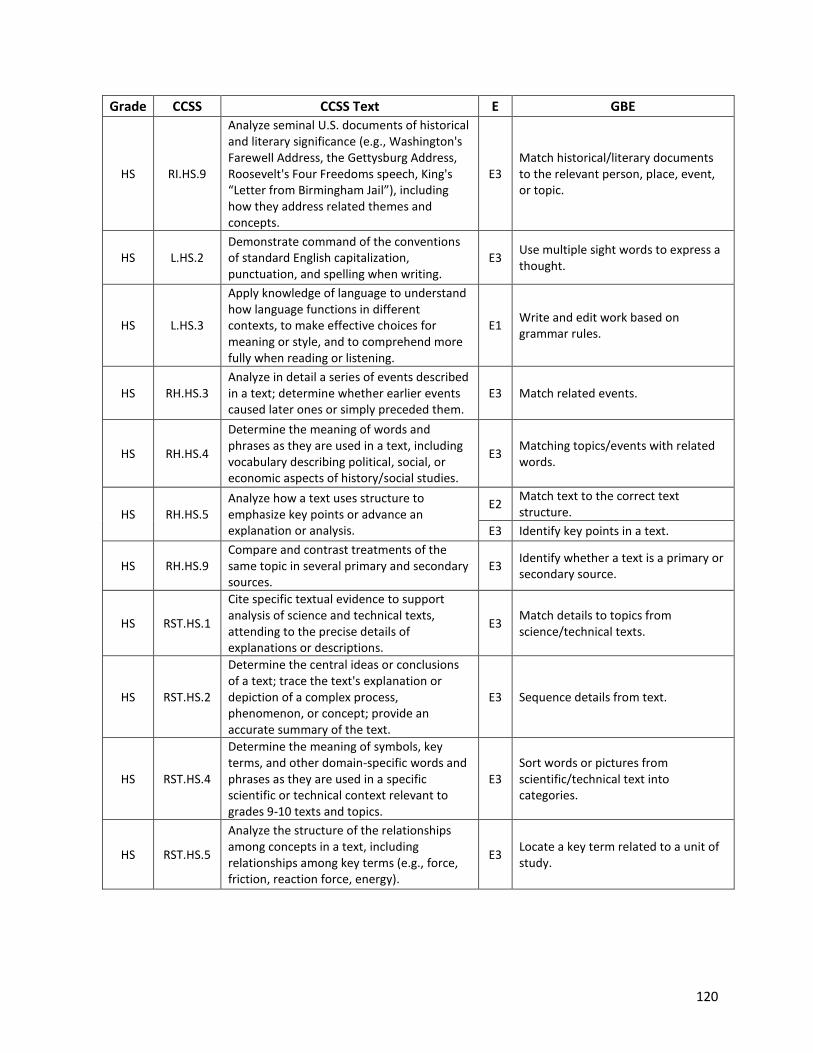
120
Grade CCSS CCSS Text E GBE
HS RI.HS.9
Analyze seminal U.S. documents of historical and literary significance (e.g., Washington's Farewell Address, the Gettysburg Address, Roosevelt's Four Freedoms speech, King's “Letter from Birmingham Jail”), including how they address related themes and concepts.
E3 Match historical/literary documents to the relevant person, place, event, or topic.
HS L.HS.2 Demonstrate command of the conventions of standard English capitalization, punctuation, and spelling when writing.
E3 Use multiple sight words to express a thought.
HS L.HS.3
Apply knowledge of language to understand how language functions in different contexts, to make effective choices for meaning or style, and to comprehend more fully when reading or listening.
E1 Write and edit work based on grammar rules.
HS RH.HS.3 Analyze in detail a series of events described in a text; determine whether earlier events caused later ones or simply preceded them.
E3 Match related events.
HS RH.HS.4
Determine the meaning of words and phrases as they are used in a text, including vocabulary describing political, social, or economic aspects of history/social studies.
E3 Matching topics/events with related words.
HS RH.HS.5 Analyze how a text uses structure to emphasize key points or advance an explanation or analysis.
E2 Match text to the correct text structure.
E3 Identify key points in a text.
HS RH.HS.9 Compare and contrast treatments of the same topic in several primary and secondary sources.
E3 Identify whether a text is a primary or secondary source.
HS RST.HS.1
Cite specific textual evidence to support analysis of science and technical texts, attending to the precise details of explanations or descriptions.
E3 Match details to topics from science/technical texts.
HS RST.HS.2
Determine the central ideas or conclusions of a text; trace the text's explanation or depiction of a complex process, phenomenon, or concept; provide an accurate summary of the text.
E3 Sequence details from text.
HS RST.HS.4
Determine the meaning of symbols, key terms, and other domain-specific words and phrases as they are used in a specific scientific or technical context relevant to grades 9-10 texts and topics.
E3 Sort words or pictures from scientific/technical text into categories.
HS RST.HS.5
Analyze the structure of the relationships among concepts in a text, including relationships among key terms (e.g., force, friction, reaction force, energy).
E3 Locate a key term related to a unit of study.
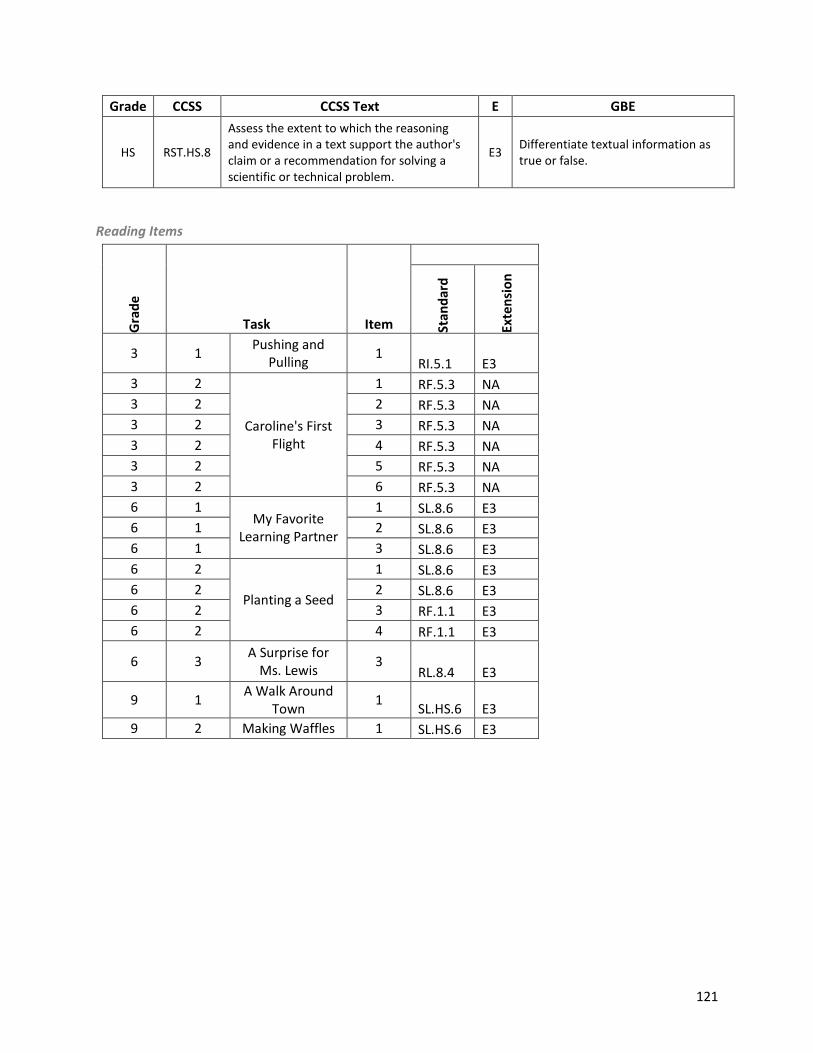
121
Grade CCSS CCSS Text E GBE
HS RST.HS.8
Assess the extent to which the reasoning and evidence in a text support the author's claim or a recommendation for solving a scientific or technical problem.
E3 Differentiate textual information as true or false.
Reading Items
Gra
de
Task Item
Stan
dar
d
Exte
nsi
on
3 1 Pushing and
Pulling 1
RI.5.1 E3
3 2
Caroline's First Flight
1 RF.5.3 NA
3 2 2 RF.5.3 NA
3 2 3 RF.5.3 NA
3 2 4 RF.5.3 NA
3 2 5 RF.5.3 NA
3 2 6 RF.5.3 NA
6 1 My Favorite
Learning Partner
1 SL.8.6 E3
6 1 2 SL.8.6 E3
6 1 3 SL.8.6 E3
6 2
Planting a Seed
1 SL.8.6 E3
6 2 2 SL.8.6 E3
6 2 3 RF.1.1 E3
6 2 4 RF.1.1 E3
6 3 A Surprise for
Ms. Lewis 3
RL.8.4 E3
9 1 A Walk Around
Town 1
SL.HS.6 E3
9 2 Making Waffles 1 SL.HS.6 E3
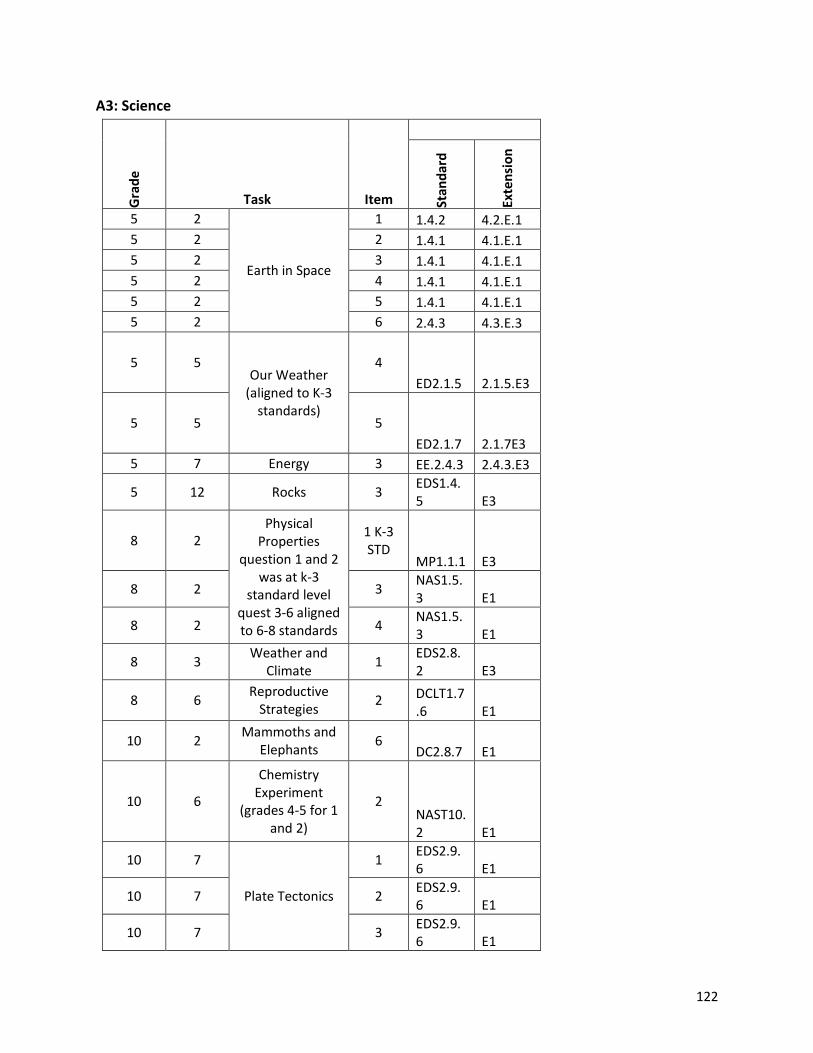
122
A3: Science
Gra
de
Task Item
Stan
dar
d
Exte
nsi
on
5 2
Earth in Space
1 1.4.2 4.2.E.1
5 2 2 1.4.1 4.1.E.1
5 2 3 1.4.1 4.1.E.1
5 2 4 1.4.1 4.1.E.1
5 2 5 1.4.1 4.1.E.1
5 2 6 2.4.3 4.3.E.3
5 5 Our Weather
(aligned to K-3 standards)
4
ED2.1.5 2.1.5.E3
5 5 5
ED2.1.7 2.1.7E3
5 7 Energy 3 EE.2.4.3 2.4.3.E3
5 12 Rocks 3 EDS1.4.5 E3
8 2 Physical
Properties question 1 and 2
was at k-3 standard level
quest 3-6 aligned to 6-8 standards
1 K-3 STD
MP1.1.1 E3
8 2 3 NAS1.5.3 E1
8 2 4 NAS1.5.3 E1
8 3 Weather and
Climate 1
EDS2.8.2 E3
8 6 Reproductive
Strategies 2 DCLT1.7
.6 E1
10 2 Mammoths and
Elephants 6
DC2.8.7 E1
10 6
Chemistry Experiment
(grades 4-5 for 1 and 2)
2 NAST10.2 E1
10 7
Plate Tectonics
1 EDS2.9.6 E1
10 7 2 EDS2.9.6 E1
10 7 3 EDS2.9.6 E1
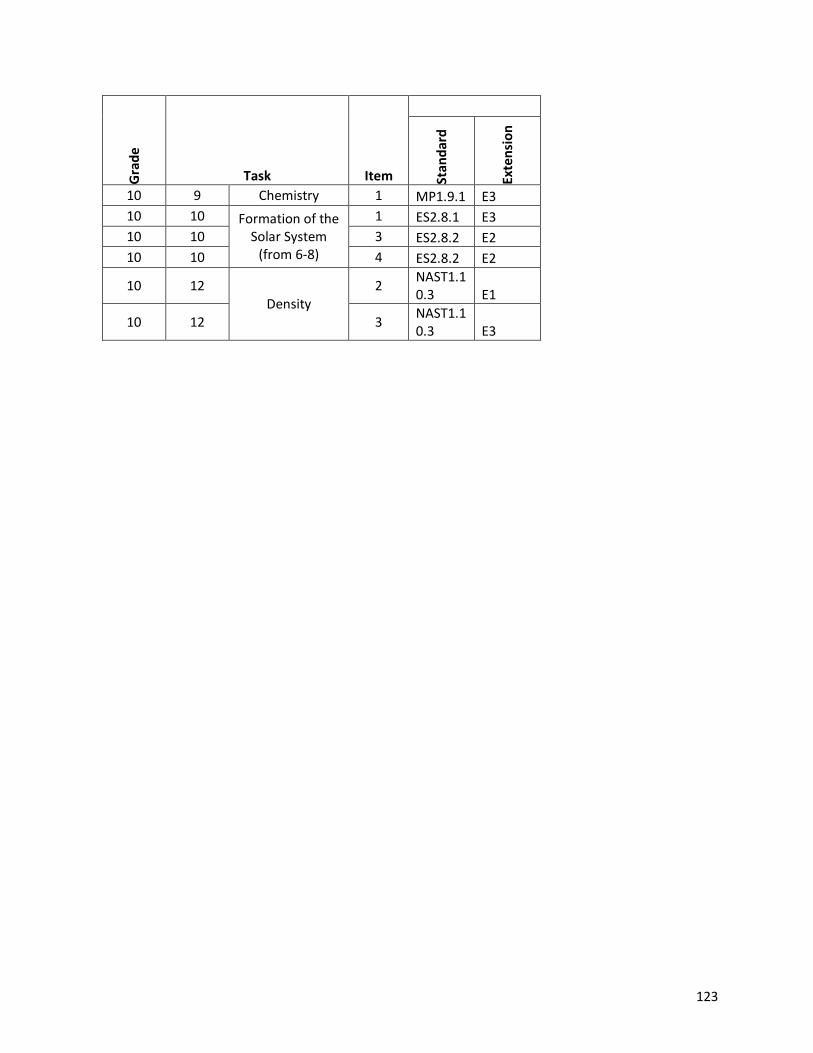
123
Gra
de
Task Item
Stan
dar
d
Exte
nsi
on
10 9 Chemistry 1 MP1.9.1 E3
10 10 Formation of the Solar System
(from 6-8)
1 ES2.8.1 E3
10 10 3 ES2.8.2 E2
10 10 4 ES2.8.2 E2
10 12 Density
2 NAST1.10.3 E1
10 12 3 NAST1.10.3 E3
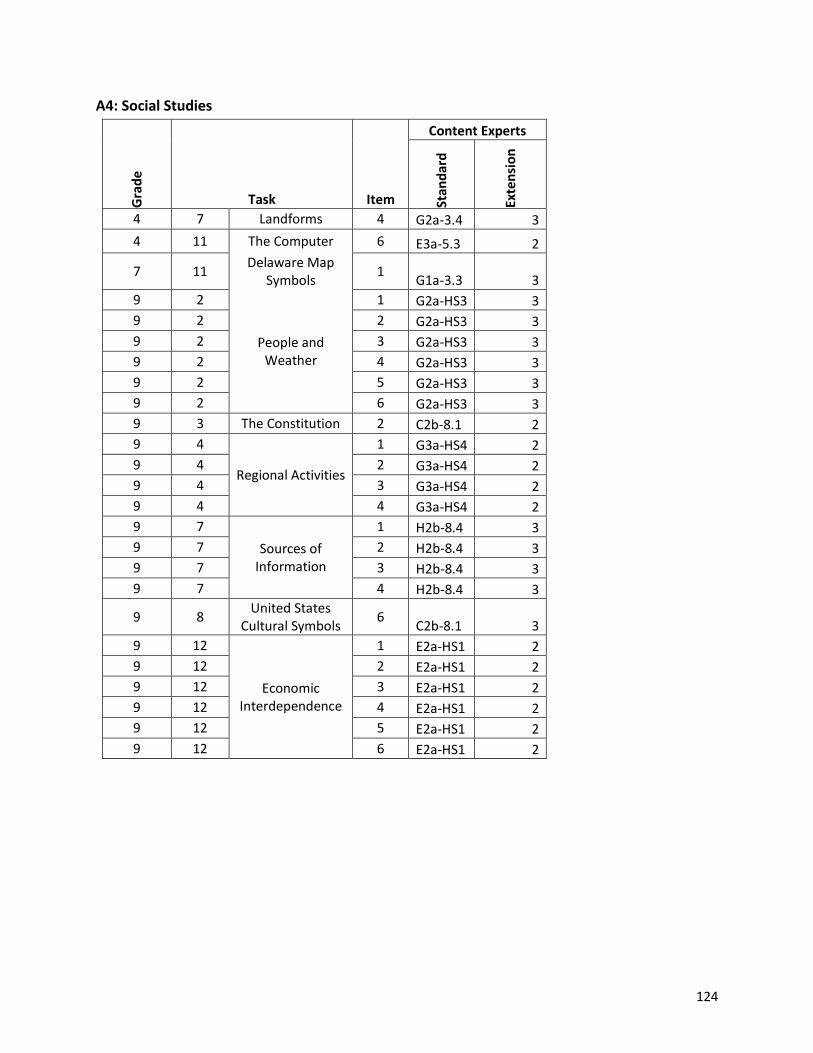
124
A4: Social Studies
Gra
de
Task Item
Content Experts
Stan
dar
d
Exte
nsi
on
4 7 Landforms 4 G2a-3.4 3
4 11 The Computer 6 E3a-5.3 2
7 11 Delaware Map
Symbols 1
G1a-3.3 3
9 2
People and Weather
1 G2a-HS3 3
9 2 2 G2a-HS3 3
9 2 3 G2a-HS3 3
9 2 4 G2a-HS3 3
9 2 5 G2a-HS3 3
9 2 6 G2a-HS3 3
9 3 The Constitution 2 C2b-8.1 2
9 4
Regional Activities
1 G3a-HS4 2
9 4 2 G3a-HS4 2
9 4 3 G3a-HS4 2
9 4 4 G3a-HS4 2
9 7
Sources of Information
1 H2b-8.4 3
9 7 2 H2b-8.4 3
9 7 3 H2b-8.4 3
9 7 4 H2b-8.4 3
9 8 United States
Cultural Symbols 6
C2b-8.1 3
9 12
Economic Interdependence
1 E2a-HS1 2
9 12 2 E2a-HS1 2
9 12 3 E2a-HS1 2
9 12 4 E2a-HS1 2
9 12 5 E2a-HS1 2
9 12 6 E2a-HS1 2

125
Appendix E: Additional Coding Forms
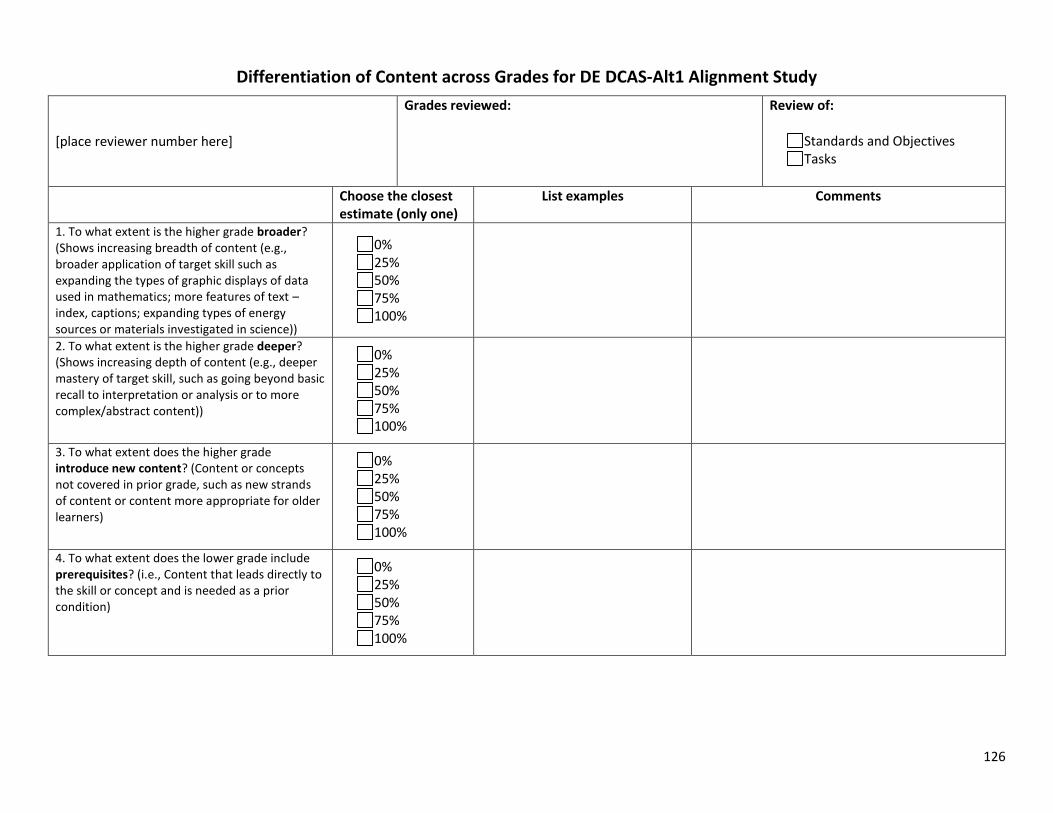
126
Differentiation of Content across Grades for DE DCAS-Alt1 Alignment Study
[place reviewer number here]
Grades reviewed:
Review of:
Standards and Objectives Tasks
Choose the closest estimate (only one)
List examples Comments
1. To what extent is the higher grade broader? (Shows increasing breadth of content (e.g., broader application of target skill such as expanding the types of graphic displays of data used in mathematics; more features of text – index, captions; expanding types of energy sources or materials investigated in science))
0% 25% 50% 75% 100%
2. To what extent is the higher grade deeper? (Shows increasing depth of content (e.g., deeper mastery of target skill, such as going beyond basic recall to interpretation or analysis or to more complex/abstract content))
0% 25% 50% 75% 100%
3. To what extent does the higher grade introduce new content? (Content or concepts not covered in prior grade, such as new strands of content or content more appropriate for older learners)
0% 25% 50% 75% 100%
4. To what extent does the lower grade include prerequisites? (i.e., Content that leads directly to the skill or concept and is needed as a prior condition)
0% 25% 50% 75% 100%
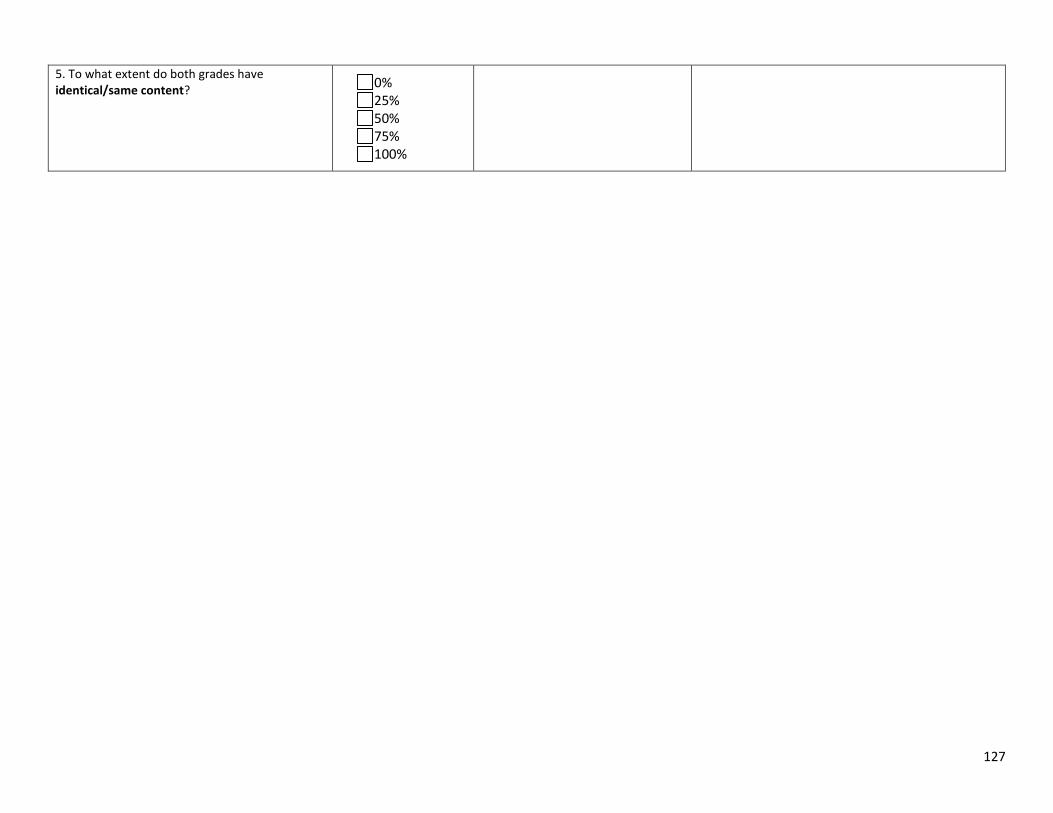
127
5. To what extent do both grades have identical/same content?
0% 25% 50% 75% 100%
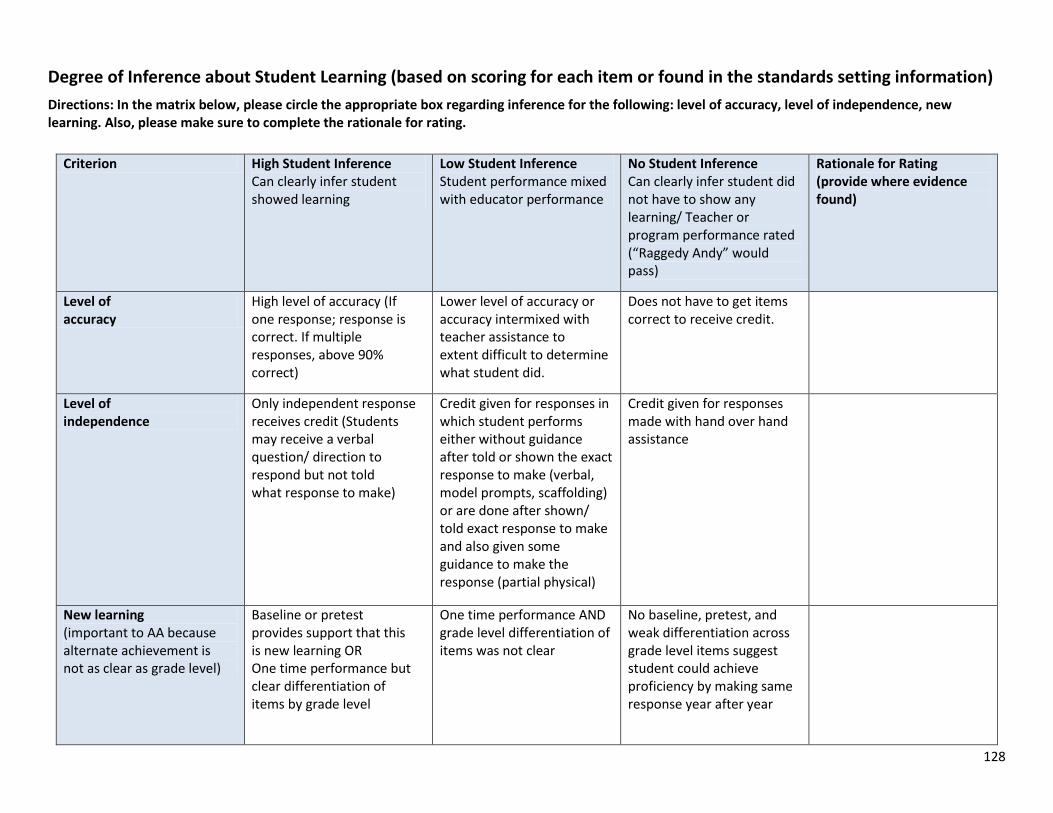
128
Degree of Inference about Student Learning (based on scoring for each item or found in the standards setting information)
Directions: In the matrix below, please circle the appropriate box regarding inference for the following: level of accuracy, level of independence, new learning. Also, please make sure to complete the rationale for rating.
Criterion High Student Inference Can clearly infer student showed learning
Low Student Inference Student performance mixed with educator performance
No Student Inference Can clearly infer student did not have to show any learning/ Teacher or program performance rated (“Raggedy Andy” would pass)
Rationale for Rating (provide where evidence found)
Level of accuracy
High level of accuracy (If one response; response is correct. If multiple responses, above 90% correct)
Lower level of accuracy or accuracy intermixed with teacher assistance to extent difficult to determine what student did.
Does not have to get items correct to receive credit.
Level of independence
Only independent response receives credit (Students may receive a verbal question/ direction to respond but not told what response to make)
Credit given for responses in which student performs either without guidance after told or shown the exact response to make (verbal, model prompts, scaffolding) or are done after shown/ told exact response to make and also given some guidance to make the response (partial physical)
Credit given for responses made with hand over hand assistance
New learning (important to AA because alternate achievement is not as clear as grade level)
Baseline or pretest provides support that this is new learning OR One time performance but clear differentiation of items by grade level
One time performance AND grade level differentiation of items was not clear
No baseline, pretest, and weak differentiation across grade level items suggest student could achieve proficiency by making same response year after year
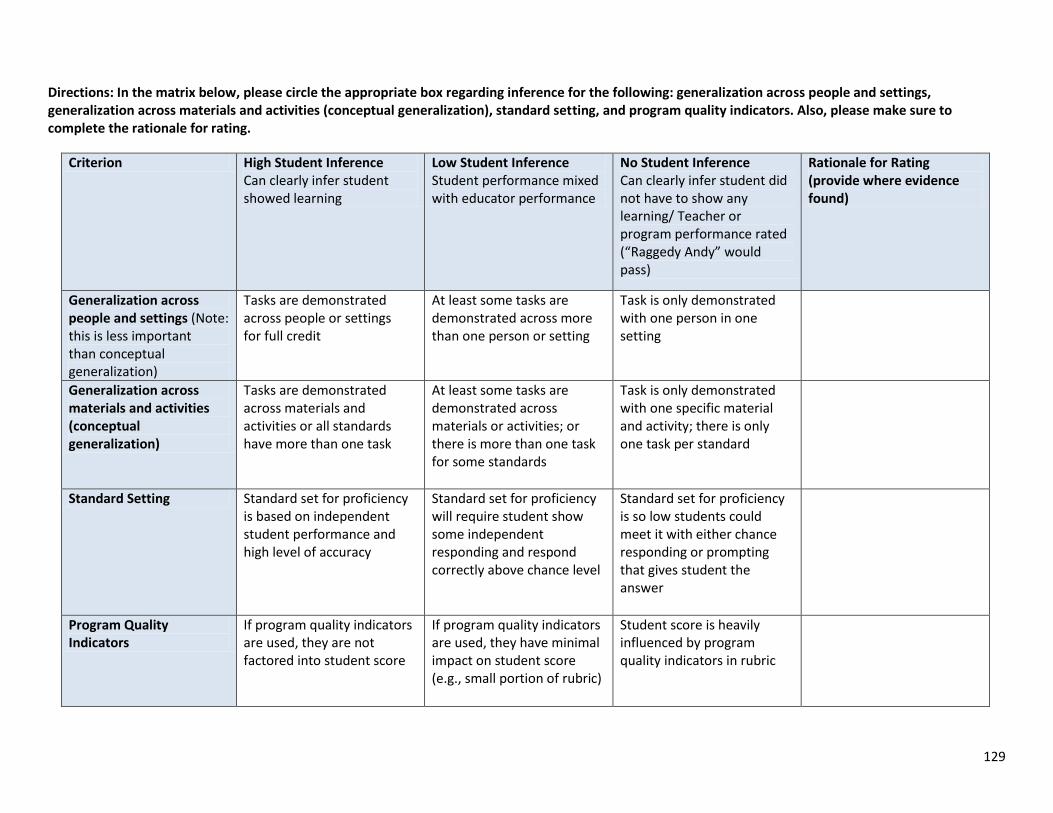
129
Directions: In the matrix below, please circle the appropriate box regarding inference for the following: generalization across people and settings, generalization across materials and activities (conceptual generalization), standard setting, and program quality indicators. Also, please make sure to complete the rationale for rating.
Criterion High Student Inference Can clearly infer student showed learning
Low Student Inference Student performance mixed with educator performance
No Student Inference Can clearly infer student did not have to show any learning/ Teacher or program performance rated (“Raggedy Andy” would pass)
Rationale for Rating (provide where evidence found)
Generalization across people and settings (Note: this is less important than conceptual generalization)
Tasks are demonstrated across people or settings for full credit
At least some tasks are demonstrated across more than one person or setting
Task is only demonstrated with one person in one setting
Generalization across materials and activities (conceptual generalization)
Tasks are demonstrated across materials and activities or all standards have more than one task
At least some tasks are demonstrated across materials or activities; or there is more than one task for some standards
Task is only demonstrated with one specific material and activity; there is only one task per standard
Standard Setting Standard set for proficiency is based on independent student performance and high level of accuracy
Standard set for proficiency will require student show some independent responding and respond correctly above chance level
Standard set for proficiency is so low students could meet it with either chance responding or prompting that gives student the answer
Program Quality Indicators
If program quality indicators are used, they are not factored into student score
If program quality indicators are used, they have minimal impact on student score (e.g., small portion of rubric)
Student score is heavily influenced by program quality indicators in rubric
130
Source: Flowers, C., Wakeman, S., Browder, D. & Karvonen, M. (2007). Links for academic learning: An alignment protocol for alternate assessments based on alternate achievement standards. Charlotte, North Carolina: University of North Carolina at Charlotte.
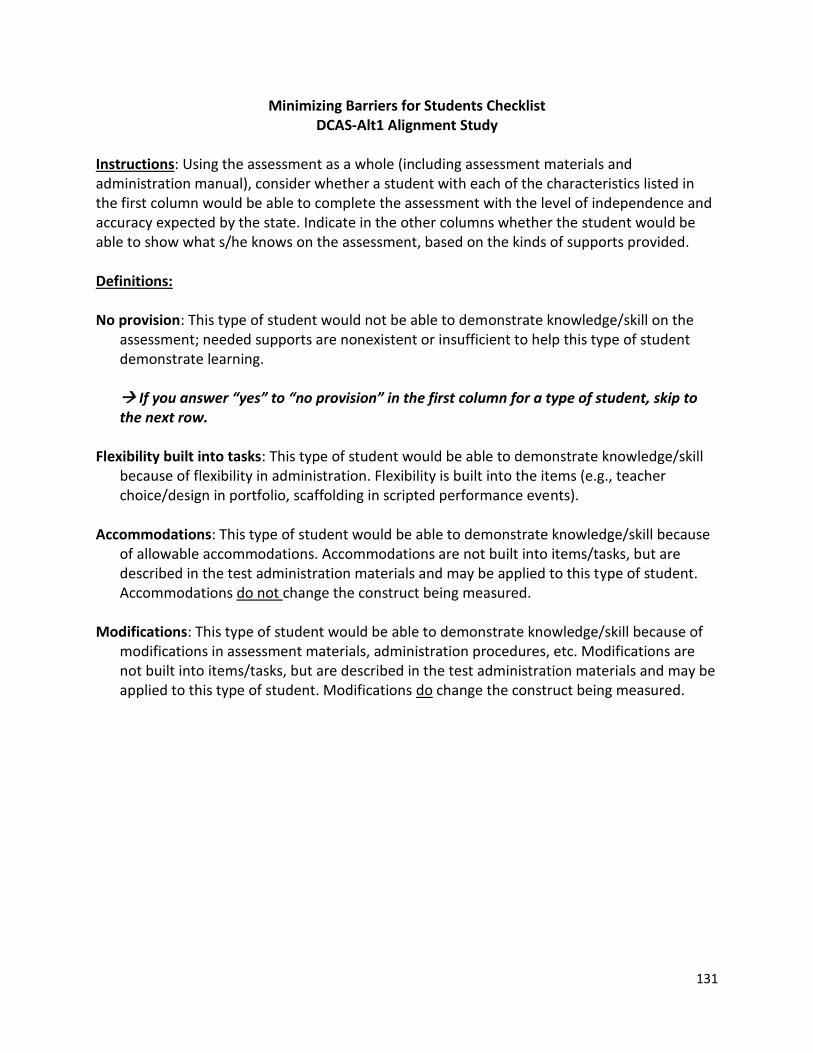
131
Minimizing Barriers for Students Checklist DCAS-Alt1 Alignment Study
Instructions: Using the assessment as a whole (including assessment materials and administration manual), consider whether a student with each of the characteristics listed in the first column would be able to complete the assessment with the level of independence and accuracy expected by the state. Indicate in the other columns whether the student would be able to show what s/he knows on the assessment, based on the kinds of supports provided. Definitions: No provision: This type of student would not be able to demonstrate knowledge/skill on the
assessment; needed supports are nonexistent or insufficient to help this type of student demonstrate learning.
If you answer “yes” to “no provision” in the first column for a type of student, skip to
the next row. Flexibility built into tasks: This type of student would be able to demonstrate knowledge/skill
because of flexibility in administration. Flexibility is built into the items (e.g., teacher choice/design in portfolio, scaffolding in scripted performance events).
Accommodations: This type of student would be able to demonstrate knowledge/skill because
of allowable accommodations. Accommodations are not built into items/tasks, but are described in the test administration materials and may be applied to this type of student. Accommodations do not change the construct being measured.
Modifications: This type of student would be able to demonstrate knowledge/skill because of
modifications in assessment materials, administration procedures, etc. Modifications are not built into items/tasks, but are described in the test administration materials and may be applied to this type of student. Modifications do change the construct being measured.
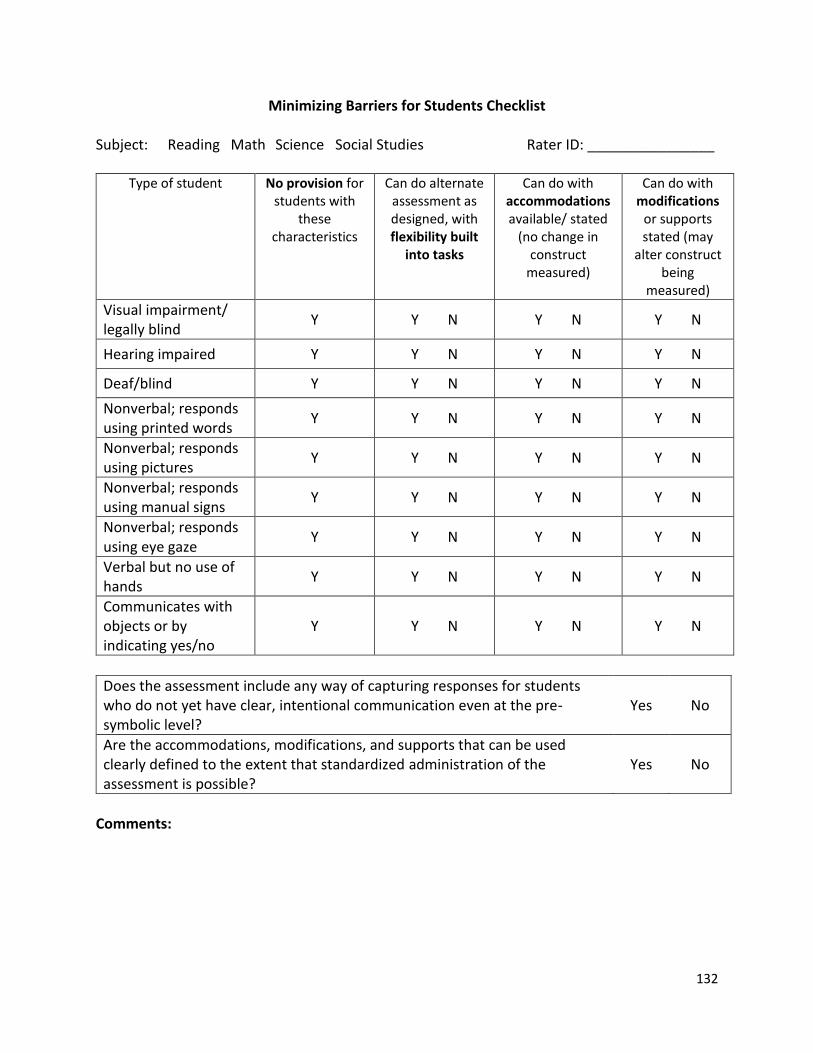
132
Minimizing Barriers for Students Checklist Subject: Reading Math Science Social Studies Rater ID: ________________
Type of student No provision for students with
these characteristics
Can do alternate assessment as designed, with flexibility built
into tasks
Can do with accommodations available/ stated
(no change in construct
measured)
Can do with modifications
or supports stated (may
alter construct being
measured)
Visual impairment/ legally blind
Y Y N Y N Y N
Hearing impaired Y Y N Y N Y N
Deaf/blind Y Y N Y N Y N
Nonverbal; responds using printed words
Y Y N Y N Y N
Nonverbal; responds using pictures
Y Y N Y N Y N
Nonverbal; responds using manual signs
Y Y N Y N Y N
Nonverbal; responds using eye gaze
Y Y N Y N Y N
Verbal but no use of hands
Y Y N Y N Y N
Communicates with objects or by indicating yes/no
Y Y N Y N Y N
Does the assessment include any way of capturing responses for students who do not yet have clear, intentional communication even at the pre-symbolic level?
Yes No
Are the accommodations, modifications, and supports that can be used clearly defined to the extent that standardized administration of the assessment is possible?
Yes No
Comments:
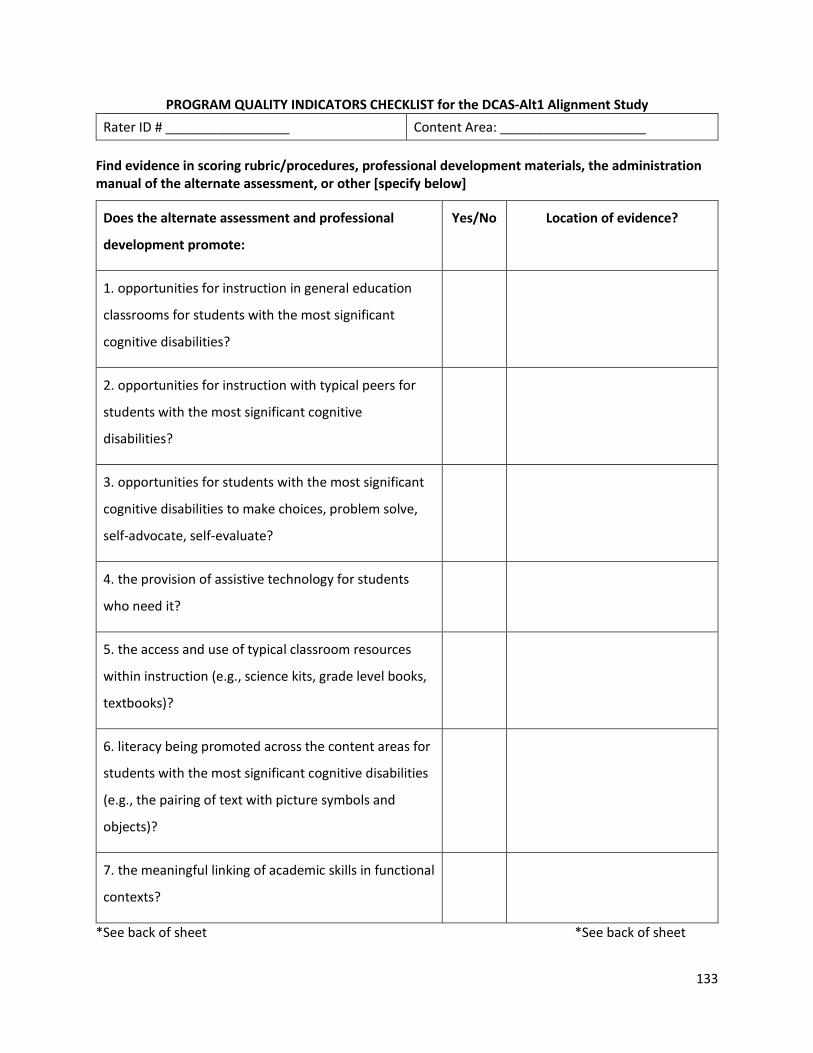
133
PROGRAM QUALITY INDICATORS CHECKLIST for the DCAS-Alt1 Alignment Study
Rater ID # _________________ Content Area: ____________________
Find evidence in scoring rubric/procedures, professional development materials, the administration manual of the alternate assessment, or other [specify below]
Does the alternate assessment and professional
development promote:
Yes/No Location of evidence?
1. opportunities for instruction in general education
classrooms for students with the most significant
cognitive disabilities?
2. opportunities for instruction with typical peers for
students with the most significant cognitive
disabilities?
3. opportunities for students with the most significant
cognitive disabilities to make choices, problem solve,
self-advocate, self-evaluate?
4. the provision of assistive technology for students
who need it?
5. the access and use of typical classroom resources
within instruction (e.g., science kits, grade level books,
textbooks)?
6. literacy being promoted across the content areas for
students with the most significant cognitive disabilities
(e.g., the pairing of text with picture symbols and
objects)?
7. the meaningful linking of academic skills in functional
contexts?
*See back of sheet *See back of sheet
134
Indicate all other materials used or reviewed:
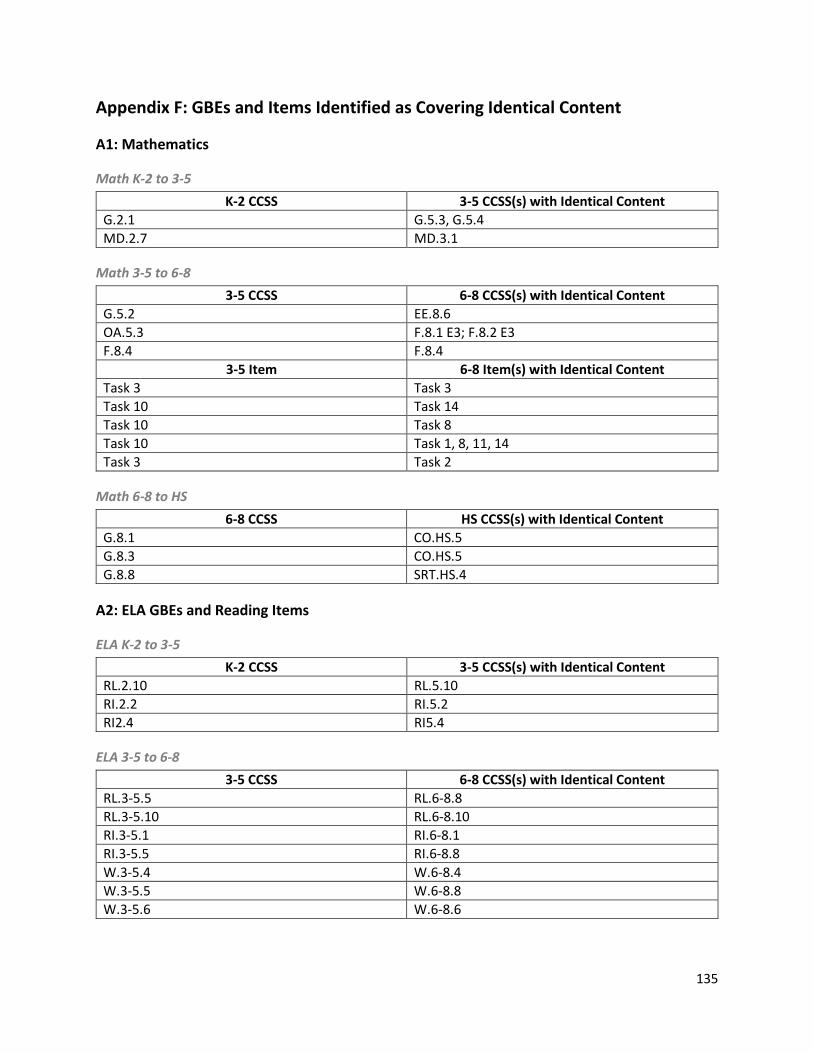
135
Appendix F: GBEs and Items Identified as Covering Identical Content
A1: Mathematics
Math K-2 to 3-5
K-2 CCSS 3-5 CCSS(s) with Identical Content
G.2.1 G.5.3, G.5.4
MD.2.7 MD.3.1
Math 3-5 to 6-8
3-5 CCSS 6-8 CCSS(s) with Identical Content
G.5.2 EE.8.6
OA.5.3 F.8.1 E3; F.8.2 E3
F.8.4 F.8.4
3-5 Item 6-8 Item(s) with Identical Content
Task 3 Task 3
Task 10 Task 14
Task 10 Task 8
Task 10 Task 1, 8, 11, 14
Task 3 Task 2
Math 6-8 to HS
6-8 CCSS HS CCSS(s) with Identical Content
G.8.1 CO.HS.5
G.8.3 CO.HS.5
G.8.8 SRT.HS.4
A2: ELA GBEs and Reading Items
ELA K-2 to 3-5
K-2 CCSS 3-5 CCSS(s) with Identical Content
RL.2.10 RL.5.10
RI.2.2 RI.5.2
RI2.4 RI5.4
ELA 3-5 to 6-8
3-5 CCSS 6-8 CCSS(s) with Identical Content
RL.3-5.5 RL.6-8.8
RL.3-5.10 RL.6-8.10
RI.3-5.1 RI.6-8.1
RI.3-5.5 RI.6-8.8
W.3-5.4 W.6-8.4
W.3-5.5 W.6-8.8
W.3-5.6 W.6-8.6
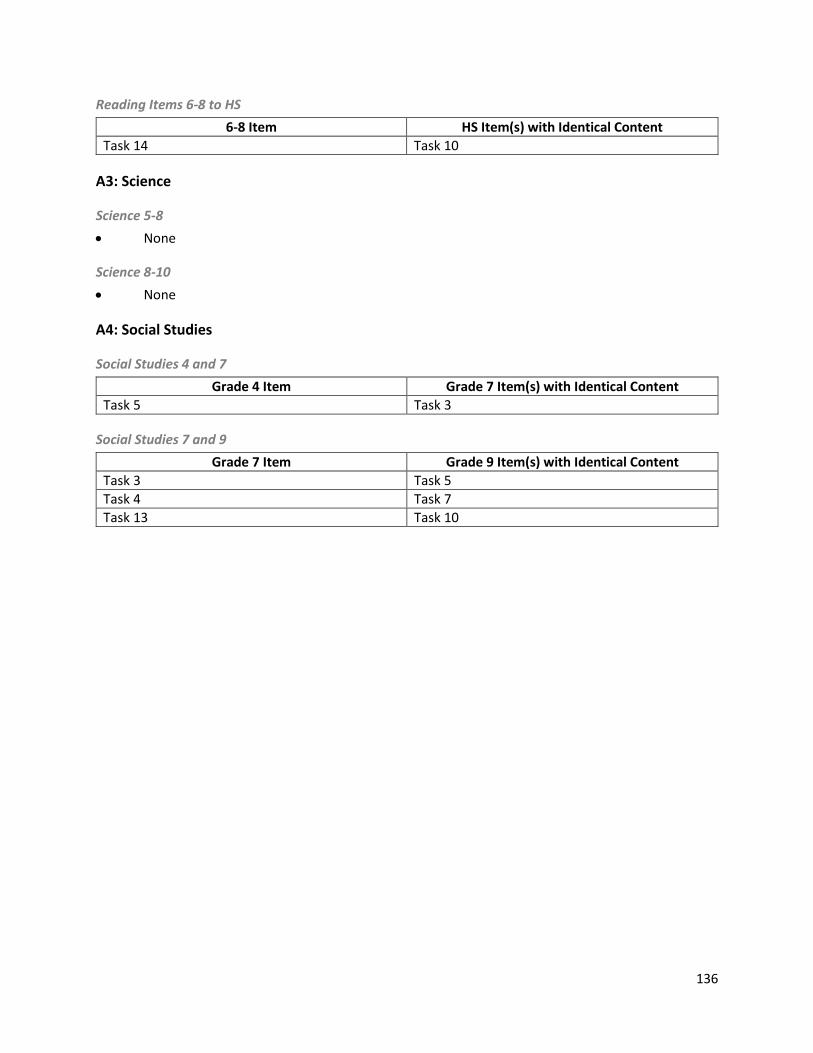
136
Reading Items 6-8 to HS
6-8 Item HS Item(s) with Identical Content
Task 14 Task 10
A3: Science
Science 5-8
None
Science 8-10
None
A4: Social Studies
Social Studies 4 and 7
Grade 4 Item Grade 7 Item(s) with Identical Content
Task 5 Task 3
Social Studies 7 and 9
Grade 7 Item Grade 9 Item(s) with Identical Content
Task 3 Task 5
Task 4 Task 7
Task 13 Task 10
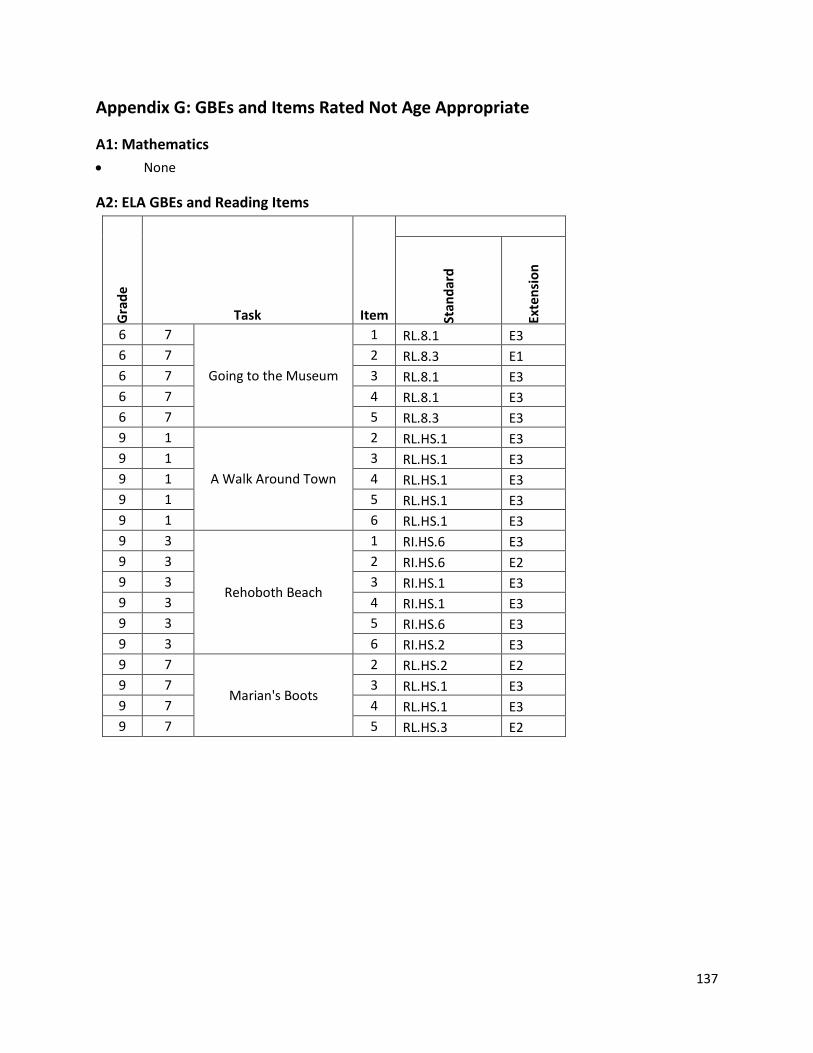
137
Appendix G: GBEs and Items Rated Not Age Appropriate
A1: Mathematics
None
A2: ELA GBEs and Reading Items
Gra
de
Task Item
Stan
dar
d
Exte
nsi
on
6 7
Going to the Museum
1 RL.8.1 E3
6 7 2 RL.8.3 E1
6 7 3 RL.8.1 E3
6 7 4 RL.8.1 E3
6 7 5 RL.8.3 E3
9 1
A Walk Around Town
2 RL.HS.1 E3
9 1 3 RL.HS.1 E3
9 1 4 RL.HS.1 E3
9 1 5 RL.HS.1 E3
9 1 6 RL.HS.1 E3
9 3
Rehoboth Beach
1 RI.HS.6 E3
9 3 2 RI.HS.6 E2
9 3 3 RI.HS.1 E3
9 3 4 RI.HS.1 E3
9 3 5 RI.HS.6 E3
9 3 6 RI.HS.2 E3
9 7
Marian's Boots
2 RL.HS.2 E2
9 7 3 RL.HS.1 E3
9 7 4 RL.HS.1 E3
9 7 5 RL.HS.3 E2
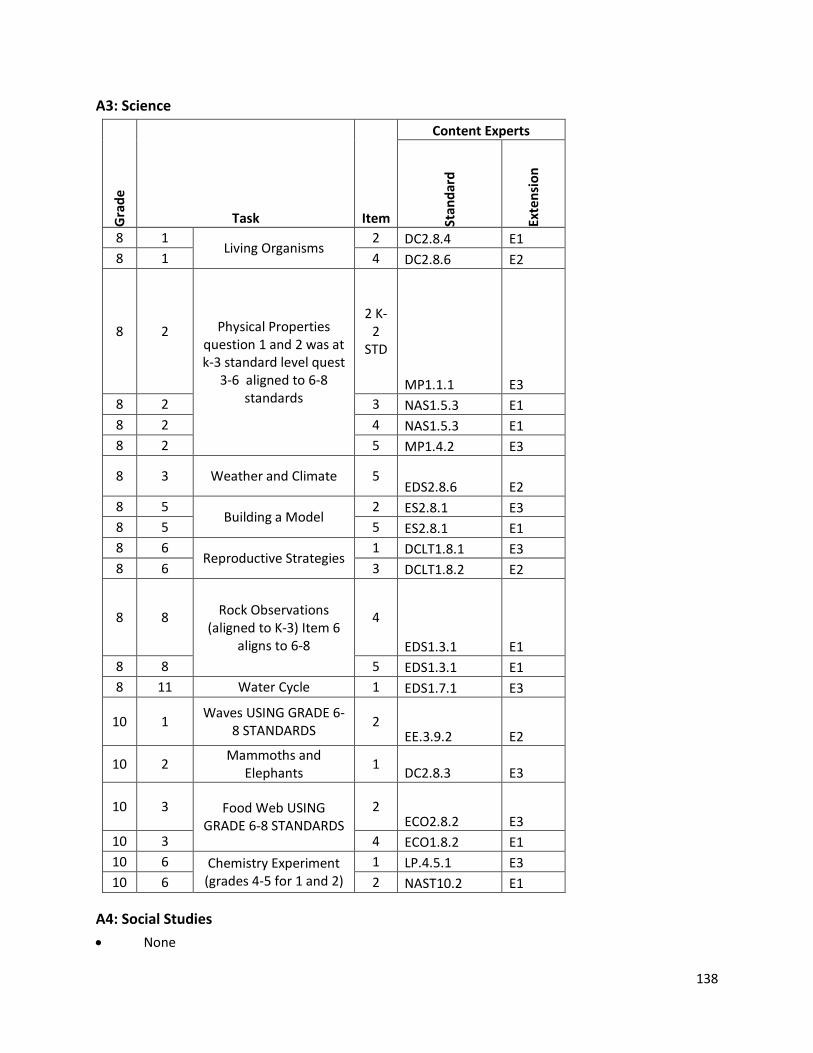
138
A3: Science G
rad
e
Task Item
Content Experts
Stan
dar
d
Exte
nsi
on
8 1 Living Organisms
2 DC2.8.4 E1
8 1 4 DC2.8.6 E2
8 2 Physical Properties question 1 and 2 was at k-3 standard level quest
3-6 aligned to 6-8 standards
2 K-2
STD
MP1.1.1 E3
8 2 3 NAS1.5.3 E1
8 2 4 NAS1.5.3 E1
8 2 5 MP1.4.2 E3
8 3 Weather and Climate 5 EDS2.8.6 E2
8 5 Building a Model
2 ES2.8.1 E3
8 5 5 ES2.8.1 E1
8 6 Reproductive Strategies
1 DCLT1.8.1 E3
8 6 3 DCLT1.8.2 E2
8 8 Rock Observations
(aligned to K-3) Item 6 aligns to 6-8
4
EDS1.3.1 E1
8 8 5 EDS1.3.1 E1
8 11 Water Cycle 1 EDS1.7.1 E3
10 1 Waves USING GRADE 6-
8 STANDARDS 2
EE.3.9.2 E2
10 2 Mammoths and
Elephants 1
DC2.8.3 E3
10 3 Food Web USING GRADE 6-8 STANDARDS
2 ECO2.8.2 E3
10 3 4 ECO1.8.2 E1
10 6 Chemistry Experiment (grades 4-5 for 1 and 2)
1 LP.4.5.1 E3
10 6 2 NAST10.2 E1
A4: Social Studies
None